Embed Size (px)
Citation preview
NCEE Working Paper
The Impacts of Environmental Regulation on the U.S. Economy
Ann Ferris, Richard Garbaccio, Alex Marten and Ann Wolverton
Working Paper 17-01 July, 2017
U.S. Environmental Protection Agency National Center for Environmental Economics https://www.epa.gov/environmental-economics
1
The Impacts of Environmental Regulation on the U.S. Economy
Ann Ferris, Richard Garbaccio, Alex Marten, and Ann Wolverton
Abstract: Concern regarding the economic impacts of environmental regulations has been part of the
public dialogue since the beginning of the U.S. EPA. Even as large improvements in environmental
quality occurred, government and academia began to examine the potential consequences of regulation
for economic growth and productivity. In general, early studies found measurable but not severe effects
on the overall national economy. While price increases due to regulatory requirements outweighed the
stimulative effect of investments in pollution abatement, they nearly offset one another. However,
these studies also highlighted potentially substantial effects on local labor markets due to the regional
and industry concentration of plant closures.
More recently, a substantial body of work examined industry-specific effects of environmental regulation
on the productivity of pollution-intensive firms most likely to face pollution control costs, as well as on
plant location and employment decisions within firms. Most econometric-based studies found relatively
small or no effect on sector-specific productivity and employment, though firms were less likely to open
plants in locations subject to more stringent regulation compared to other U.S. locations. In contrast,
studies that used economy-wide models to explicitly account for sectoral linkages and intertemporal
effects found substantial sector-specific effects due to environmental regulation, including in sectors that
were not directly regulated.
It is also possible to think about the overall impacts of environmental regulation on the economy through
the lens of benefit-cost analysis. While this type of approach does not speak to how the costs of regulation
are distributed across sectors, it has the advantage of explicitly weighing the benefits of environmental
improvements against their costs. If benefits are greater than costs, then overall social welfare is
improved. When conducting such exercises, it is important to anticipate the ways in which improvements
in environmental quality may either directly improve the productivity of economic factors – such as
through the increased productivity of outdoor workers – or change the composition of the economy as
firms and households change their behavior. If individuals are healthier, for example, they may choose to
reallocate their time between work and leisure. While introducing a role for pollution in production and
household behavior can be challenging, studies that have partially accounted for this interconnection have
found substantial impacts of improvements in environmental quality on the overall economy.
JEL Classifications: Q52, Q53, Q58
Key Words: Economic impacts, environmental regulation, economic productivity, employment, plant
location, social welfare, health benefits
DISCLAIMER
The views expressed in this paper are those of the author(s) and do not necessarily represent those of the U.S. Environmental
Protection Agency (EPA). In addition, although the research described in this paper may have been funded entirely or in part by
the U.S. EPA, it has not been subjected to the Agency's required peer and policy review. No official Agency endorsement should
be inferred.
2
In the 1960s, increased awareness and concern about the negative consequences of
environmental pollution on human health and ecosystems spurred a national approach to
environmental policy and regulation in the United States (Griswald, 2012). The U.S. Council on
Environmental Quality (U.S. CEQ) was formed in 1970 to advise the President on the
environment, and the first Earth Day took place in April of that same year, with over 20 million
Americans participating. Both the National Environmental Policy Act and the Clean Air Act were
also signed into law in 1970, significantly expanding the federal government’s role in controlling
air pollution. The U.S. Environmental Protection Agency (U.S. EPA) was established on December
2, 1970 to implement the requirements of these two major pieces of legislation (Lewis, 1985).
The Clean Water Act followed in 1972.1
While environmental regulations reduce emissions of harmful pollutants, thus generating health
and other benefits for the American public, they also raise a plant’s production costs because
they require installation and operation of pollution controls or changes in production processes
that would otherwise not be undertaken. Almost immediately, the ability to balance
environmental protection and the costs of pollution control requirements was tested. In 1971,
the U.S. EPA Administrator, William D. Ruckelshaus, rejected the timetable submitted for bringing
Union Carbide’s Marietta, Ohio plant into compliance with Clean Air Act requirements. Union
Carbide responded by threatening to lay off a large number of workers. The U.S. EPA negotiated
with the company on its emissions reduction schedule while preserving workers' jobs. This was
done without compromising the environmental goal of reducing sulfur dioxide emissions at the
plant, which declined 70 percent by April 1972 (Lewis, 1985).
From the beginning it also has been recognized that the potential negative effects on overall
economic growth, productivity, and employment, as well as on specific industries should be
considered alongside the positive consequences of improving environmental quality. In part, this
balanced approach was likely motivated by the significant slowdown in U.S. productivity growth,
uptick in inflation, and, by the mid-1970s, doubling of the unemployment rate that coincided
with the expansion of federal oversight into areas such as environmental quality.2 To better
understand the potential effects of environmental regulation on the economy several
government reports were commissioned to investigate the potential impacts on a wide array of
measures, including national economic growth, industries and firms, employment, and
1 For instance, Silent Spring by Rachel Carson, which documented the use and potentially detrimental effects of pesticide use and is credited with the eventual ban of DDT, was published in 1962. In Ohio, the Cuyahoga River had become so polluted that it caught fire in 1969. 2 Growth in labor productivity (i.e. output per worker hour) fell from an average annual rate of 3.4 percent from 1947 through 1966 to about 2.2 percent from 1966 through 1973 and further to about 1.5 percent from 1973 through 1977 (Mark, 1978). The Nixon Administration also issued an “inflation alert” in 1970 due to increases in wages and other prices but did not identify a particular cause (Dale, 1970). The national unemployment rate also climbed from 3.6 percent in 1968 to 7.7 percent in 1976.
3
consumers (e.g., U.S. CEQ, 1971). As data became available to study the impact of regulations
retrospectively, the academic community also weighed in with studies of its own.
In the United States, current practice in Federal government economic analyses of environmental
regulation is to explicitly weigh the gains to society from environmental protection against the
costs, measured in terms of changes in net social welfare. At the same time, economic analyses
continue to examine how those welfare changes are distributed throughout the economy. While
a particular environmental regulation may result in an overall net gain to society, this may not be
true for particular subsets of the economy. Understanding who is positively and negatively
impacted by a particular policy is important when contemplating policy options.
This article is organized as follows. Section I summarizes research on the part of the Federal
government into the economic impacts of U.S. environmental regulation. Building on this early
work, Section II discusses the academic literature on the impacts of environmental regulation on
overall productivity and growth, and Section III reviews the literature on impacts to particular
sectors of the economy, with specific emphasis on industry productivity, labor markets, and plant
entry and exit decisions. Section IV discusses expanding the notion of overall economic impacts
to think about welfare effects of environmental regulation. Section V describes efforts to
explicitly consider benefits when modeling the economy-wide welfare effects of environmental
regulation. Section VI concludes by discussing several areas ripe for additional research.
I. Early government studies on the economic impacts of environmental regulation
In the early 1970s, as the U.S. began to implement the Clean Air and Clean Water Acts, there was
limited information available on how environmental regulation might impact the economy
(Haveman and Smith, 1978). To help fill this gap, President Nixon directed the U.S. CEQ, U.S. EPA,
and the U.S. Department of Commerce, with guidance from the Council of Economic Advisers, to
study the macroeconomic and microeconomic impacts of air and water pollution control costs.
The first report, released in 1972, summarized a macroeconomic study and several
microeconomic studies, commissioned from multiple economic consulting groups, with the goal
of developing a better understanding of the nature and magnitude of the potential impacts of
environmental regulations on the economy as a whole and on individual industries and regions
(U.S. CEQ et al., 1972). The underlying studies summarized by the report have been described as
initial analytic efforts that helped shed light on the paucity of available data on pollution
abatement at that time (Haveman and Smith, 1978; Portney, 1981). Though given their
groundbreaking nature the underlying studies were subsequently published in an academic
journal (see Evans, 1973; Russell, 1973; Dorfman, 1973). The general conclusion from the report
was that pollution control costs “would not seriously threaten the long-run economic viability of
the industrial activities examined,” though it also noted that since such impacts can be measured
they are not “inconsequential” (U.S. CEQ et al., 1972).
4
The results of the macroeconomic study indicated that the national economy would be
significantly, though not “severely” impacted by pollution abatement costs to implement the
Clean Air Act. Pollution abatement costs were assumed to affect the economy through higher
product prices and new demand for pollution abatement equipment and services. In the absence
of adjustments in macroeconomic monetary or fiscal policy, price increases outweighed the
stimulative effect of investments in pollution abatement, reducing the growth rate of U.S. Gross
National Product (GNP) by 0.3 percentage points and increasing the unemployment rate by 0.1
to 0.2 percentage points over the 1972 to 1976 period. However, the study also showed that
employment declines were nearly offset by increased employment created by pollution control
investments. When monetary and fiscal policy adjustments were incorporated, they offset the
slowdown in GNP and increase in unemployment but at the cost of more rapid inflation and a
further decline in the balance of international trade (U.S. CEQ et al., 1972).3
The microeconomic studies summarized in the report were based on analyses of the economic
impacts of environmental regulations on eleven specific industries (e.g., auto manufacturing,
pulp and paper, petroleum refining). Consistent with the macroeconomic study, the authors
characterized the results as indicating that none of the industries studied would be “severely
impacted” (i.e., the long term viability of these industries was not seriously threatened). The
report estimated that, for some industries, prices will increase (by an annual average of between
zero and 2 percent over the 1972 to 1976 period, depending on the industry), indicating some
pass-through of costs. However, it also concluded that “profits will decline for some firms in most
of the industries because firms will not be able to pass on the full cost of pollution abatement to
consumers in the form of higher prices” (U.S. CEQ et al., 1972).
The early interaction between the newly created U.S. EPA and Union Carbide also highlighted a
concern that environmental regulations could result in the layoff of workers at particular plants
or even plant closures. However, as with other economic impacts, there was no empirical
literature available that could provide a basis for estimates of national employment impacts
associated with newly promulgated environmental regulations. The 1972 report summarized
results from the microeconomic studies related to plant closures and employment effects. Of the
approximately 12,000 plants in the industries studied, approximately 200 – 300 plants would be
likely to close between 1972 and 1976 due to environmental regulations. However, the report
noted that many of these plants were likely to have closed anyway because they were
economically vulnerable for other reasons (U.S. CEQ et al., 1972). The employment impact from
the projected plant closures was estimated to be approximately 50,000 to 125,000 jobs lost
between 1972 and 1976 or about 1 to 4 percent of total employment in those industries. This
3 While the analysis only explicitly considered costs, the report qualitatively discussed the benefits of improved environmental quality such as increased agricultural output, increased productivity and work hours, and health improvements.
5
would amount to an increase in national unemployment of approximately 0.05 percent (U.S. CEQ
et al., 1972). The report warned, however, that the impact could be substantially higher if the
economy was not at full employment. It is important to note that these estimates were not a net
impact, since they did not include the number of people who found work in these industries over
the same time period.
While the microeconomic studies in the 1972 report focused only on regulated industries, the
macroeconomic study aimed to include all sectors of the economy, including pollution abatement
activities. Macroeconomic impact modeling conducted as part of subsequent government
reports found that growth in pollution abatement activities had a stimulative impact on the U.S.
economy - creating additional jobs and decreasing the unemployment rate - relative to what
would have occurred absent regulation (U.S. CEQ, 1979; DRI, 1981). Another U.S. CEQ report
suggested that more efficient plants may have expanded production to make up for plants that
closed (U.S. CEQ, 1978).
Initial concern about widespread job loss in the economy was, to a large degree, alleviated by
empirical evidence. Based on self-reports from affected industries, the U.S. EPA found 118 plant
closures between 1971 and 1977, affecting over 21,900 employees, were reportedly due to
environmental regulations.4 This estimate is about half the size of the minimum estimate
projected in the 1972 report (U.S. CEQ, 1978; Haveman and Smith, 1978). The Department of
Commerce also surveyed plant closings due to pollution control requirements and found 131 of
them between 1974 and 1977, noting that 75 percent of permanent closings were not solely due
to environmental regulation. As the economy improved over this time period, the number of
plant closings reported each year also declined (Rutledge, Drieling, and Dunlap, 1978). Another
Department of Commerce survey indicated that in over 60 percent of plant closures, plant age
or facility obsolescence was a contributing factor (Segal and Dunlap, 1977). The 1978 U.S. CEQ
report observed that closures were more likely to occur at plants that were older, smaller, less-
efficient, and marginally profitable absent pollution control requirements (U.S. CEQ, 1978).
While effects of environmental regulation on the overall U.S. labor market were not as large as
anticipated, these reports acknowledged that individual plant “closures and the unemployment
that they cause may be significant for the communities that they affect” (CEQ, 1978). IN
particular, substantial industry- and/or location-specific effects may occur due to the geographic
concentration of plant closures in “older industrial towns already suffering from relatively high
unemployment rates” (CEQ, 1978). Data collected by the U.S. EPA demonstrate that layoffs
between 1971 and 1982 that were due, at least partially, to environmental regulation were
concentrated in the primary metals, chemical, pulp and paper, and food processing industries.
4 Between 1978 and 1982, 37 additional plants were identified as being shut down due in part to environmental regulatory requirements, affecting another 11,000 jobs (U.S. EPA, 1982).
6
About 40 percent of the layoffs occurred in the upper Midwest, and another 28 percent occurred
in the Northeast (U.S. EPA, 1982).
II. Academic Literature on Impact of Environmental Regulation on Overall Productivity and
Growth
A key concern that motivated research into the impacts of environmental regulation on the
economy was the significant slowdown in productivity growth that occurred at the same time as
expansion of federal oversight into the environmental arena (Gray, 2015).5 Initial interest by
academic economists built on government-sponsored studies conducted in the early 1970s (e.g.,
U.S. CEQ et al., 1972). Using data on the costs of air and water pollution abatement and Solow
growth accounting, Denison (1978, 1979) – a founder of growth accounting and an economist at
the Brooking Institution at the time - was one of the first to empirically assess the impact of
environmental regulations on productivity growth (i.e., the rate at which output per unit of input
increases over time).6 Denison estimated that, compared to the long-run growth rate of output
per unit of input from 1948 to 1973 of just under 2 percent, environmental regulations resulted
in an annual decline of between - 0.10 and -0.20 percentage points between 1969 and 1978.
Christainsen and Haveman (1981a, 1981b) questioned several aspects of the data, methodology,
and interpretation in Denison’s growth accounting studies. They constructed indices for
“regulatory intensity,” based on the cumulative number of major pieces of public regulatory
legislation, including, but not limited to environment (Christainsen and Haveman, 1981a). They
used these indices to econometrically estimate the contribution of federal regulatory
requirements to the slowdown in the growth of labor productivity. They concluded that
regulations were responsible for between 12 and 21 percent of the 1.3 percentage point
slowdown in productivity for manufacturing during 1973-77, relative to the 1958-65 period.
Separately, based on their own work and a survey of other studies, Christainsen and Haveman
(1981b) estimated that between 8 and 12 percent of the productivity slowdown could be
attributed specifically to the cost of meeting environmental regulations.
About a decade later, Jorgenson and Wilcoxen (1990) used a computable general equilibrium
(CGE) model to examine the impact of environmental regulations on the long-run growth of the
U.S. economy. CGE models simulate the workings of a market economy and can be used to
capture how the imposition of a regulation ripples through the entire economy, affecting both
5 Other hypotheses included shifts in industrial composition, changes in labor force composition, a slowdown in capital-labor ratio improvements, and a leveling off of research and development expenditures. 6 These studies were part of a larger research project by Edward Denison investigating the wide range of reasons for the productivity slowdown, published by Brookings Institution in 1979 as a book, Accounting for Slower Economic Growth: The United States in the 1970s. For more information on Denison’s contributions to national growth accounting, see Kendrick (1993).
7
individual sectors and economy-wide aggregates. Jorgenson and Wilcoxen’s dynamic CGE model
divided the U.S. economy into 35 sectors, with behavioral parameters estimated from a time-
series data set. Comparing steady states with and without environmental regulation, they
estimated that regulation had reduced the level of real GNP by 2.6 percent. During the period
1973-1985, they estimated that the growth rate of GNP had been reduced by 0.2 percent. By
sector, they found that pollution controls had the largest effects on chemicals, coal mining, motor
vehicles, petroleum refining, primary metals, and pulp and paper. Using the same model,
Jorgenson and Wilcoxen (1993) estimated that the Clean Air Act Amendments of 1990 would
reduce the level of GNP by an additional 0.6 percent.
III. Academic Literature on Economic Impacts of Environmental Regulation on Specific
Sectors
While the overall effect of environmental regulation on productivity and economic growth
continue to be metrics of interest, effects on different subsets of the economy are also highly
relevant when gauging the impacts of regulation. For instance, one might wish to understand
how prices and quantities of goods in affected sectors respond to regulation, or whether the
costs of meeting the requirements of a regulation results in plant closures, additional barriers of
entry for new firms, or particularly large impacts on small businesses. Likewise, it might be
important to understand how a regulation affects energy production and prices, employment in
particular sectors, and the ability of consumers to switch to available substitutes or absorb
increased prices for certain products.
Federal agencies promulgating new regulations are required by statute or Executive Order to
estimate some of these impacts. For instance, Executive Order 13563 states: “Our regulatory
system must protect public health, welfare, safety, and our environment while promoting
economic growth, innovation, competitiveness, and job creation. It must be based on the best
available science.” Executive Order 13211 requires, to the extent permitted by law, that Agencies
prepare a statement of energy effects when a regulatory action is expected to significantly affect
energy supply, distribution, or use. The Regulatory Flexibility Act directs agencies to pay
particularly close attention to the economic impacts of regulation on small businesses.
While there is a wide range of economic impacts of potential interest to policymakers and the
public when evaluating the effects of an environmental regulation, we focus our discussion on
only a subset of these. Specifically, we summarize the empirical literature on productivity impacts
in pollution-intensive industries, the potential effect of environmental regulation on plant
location and the U.S. labor market.
8
Productivity Studies
With little to suggest environmental regulations were a large drag on overall productivity growth,
researchers began to investigate whether pollution-intensive industries newly subject to
regulation experienced more significant productivity impacts. One early study by Gollop and
Roberts (1983) estimated the effect of sulfur dioxide emissions regulation on productivity growth
in the electric power industry from 1973 to 1979.7 They estimated that the overall impact of the
regulations on constrained utilities, which incurred both increased fuel and capital costs, to be
an average decline in annual productivity growth of almost 0.6 percentage points per year. As
the period of analysis also corresponded with a sharp rise in fuel costs, a key empirical challenge
was to separate fuel switching induced by the regulation – from high- to low-sulfur coal - from
the general rise in fuel prices.
Gray (1987) represents another important early study of the effect of environmental regulation
on the productivity growth of pollution-intensive industries. He econometrically estimated the
impact of federal environmental and occupational safety and health regulations on total factor
productivity (TFP) growth for a wide array of manufacturing industries for the years 1958 to
1978.8 (Total factor productivity is the amount of output produced as a function of all plant
inputs, including labor, capital, materials, and energy.) He found that 30 percent of the slowdown
in TFP growth could be attributed to the imposition of government regulations. However, only
about one third of the 30 percent was specifically attributable to environmental regulations.
Similarly, Barbera and McConnell (1990) estimated the impact of environmental regulations on
TFP for five of the most polluting industries. For the paper industry, they found that pollution
abatement accounted for 30 percent of the decline in TFP in 1970-80 compared to 1960-70. For
the chemical, iron and steel, and stone, clay, and glass industries estimates ranged from a 10 to
12 percent decline, while TFP actually increased for non-ferrous metals over this time period.
Unlike previous work, the authors were able to differentiate between direct effects (i.e., the need
to increase total inputs for the same level of output when increasing abatement) and indirect
effects (i.e., potential changes in the production function, which may be positive or negative).
Economists have continued to use detailed industry- and plant-specific data to investigate the
effects of environmental regulations on pollution-intensive industries, while improving on the
empirical techniques of early studies. In general, they continued to find relatively small or no
effect of environmental regulation on firm- or plant-level productivity. For instance, Repetto,
7 They constructed an index of regulatory intensity as a function of the severity of the emission standard, the extent of enforcement, and the unconstrained emission rate relevant to each utility. 8 Gray (1987) used annual pollution control operating costs as a measure of environmental regulation and level of enforcement effort directed toward each industry as a measure of occupational safety and health regulation.
9
Rothman, Faeth, and Austin (1997) asserted that there is a bias in traditional measures of
productivity because a reduction in bad outputs (pollution) is not accounted for in those
measures. When Domazlicky and Weber (2004) accounted for polluting outputs they found that,
while there were costs associated with environmental regulations for the six chemical sectors
investigated, they were not correlated with a reduction in productivity.
Berman and Bui (2001b) also point out a number of potential problems with earlier studies. First,
heterogeneity bias may exist as dirtier plants may also be less productive, making abatement
appear to be productivity reducing. (The opposite effect may exist for cleaner plants.) Second,
abatement expenditures may be difficult to classify and may overstate the true economic costs
of environmental regulation. To avoid these problems, the authors construct a TFP measure for
U.S. refineries in the Los Angeles air basin using physical quantities. Although abatement costs
were high due to strict air quality regulations, they found that refinery productivity actually rose
during the 1987 to 1992 time period in the Los Angeles air basin, in contrast to declining
productivity for refineries in other parts of the country that were not subject to the regulations.
Several studies are notable because of their use of sophisticated empirical techniques and
detailed U.S. plant-level data from the U.S. Census of Manufactures and the Pollution Abatement
and Cost Expenditure (PACE) survey.9 Gray and Shadbegian (2003) examined how the impact of
pollution abatement costs on productivity varies by type of pulp and paper mill over the 1979-90
period. They found significant impacts on productivity for integrated mills, though not for non-
integrated mills. They found no significant differences between older and newer plants. For the
same time period, Shadbegian and Gray (2005) considered effects on paper mills, refineries, and
steel mills and found that abatement expenditures generally had no significant effect on the
productivity of non-abatement inputs. As in their previous paper, they examined subgroups of
plants, those with dirtier production technologies and with more end-of-line abatement, but did
not find significant differences. Becker (2011) and Greenstone, List, and Syverson (2012) relied
on differences in environmental stringency across counties in and out of attainment with the
National Ambient Air Quality Standards to identify the impact of environmental regulation on the
productivity of manufacturing plants. Becker (2011) found no statistically significant effect on
productivity for plants in counties with higher environmental costs. Greenstone et al. (2012)
estimated that for plants in heavily polluting industries, the nonattainment designation was
associated with a 2.4 percent decline in TFP among plants that emitted the targeted pollutants.
Estimated separately, ozone and carbon monoxide-emitting plants in nonattainment counties
9 The PACE survey collected plant-level data on the capital and operating costs of meeting major environmental regulations annually between 1973 and 1994, and then again in 1999 and 2005. Many researchers have called for its resumption to assist in the conduct of plant-level analysis to inform policy debates (e.g., Gray, 2015). No other comparable data source on compliance costs exists.
10
had productivity losses of about 2 percent. Sulfur dioxide emitters saw no significant change in
TFP. TSP emitting plants experienced a productivity increase of about 1.0 percent.
Plant Entry and Exit Decisions
Another key question that has arisen in the literature is whether compliance costs due to
environmental regulations affect plant location decisions. As already noted, some U.S. counties -
geographic and governmental jurisdictions within each state - face more stringent regulations
when they are out of attainment with the National Ambient Air Quality Standards (NAAQS) for
criteria air pollutants (e.g., particulate matter, ozone). In addition, because states frequently are
responsible for implementing and enforcing Federal regulations it is possible that differences in
monitoring and enforcement may cause the costs of compliance to vary across states.
Bartik (1985) is an important early paper in the plant location literature because it sets out the
analytic framework for how differences in costs across locations influence siting decisions.
Levinson (1996) extends this framework to explicitly consider the role of environmental
regulatory costs. If compliance costs differ across locations or by type of plant, this can influence
firm-level decisions about where to locate new plants and how to shift production among existing
plants. Relying mainly on cross-sectional data, early empirical studies did not find evidence that
environmental regulations affected U.S. plant location decisions (e.g., Carlton, 1983; McConnell
and Schwab, 1990; Levinson 1996). However, later studies that had access to panel data and
more refined empirical techniques to better account for spatial correlation across locations,
omitted variable bias, and plant- and location-specific effects found that higher compliance costs
had a significant, negative effect on plant location, particularly in the most pollution-intensive
industries (Shadbegian and Wolverton, 2010).10
Among the panel studies, it is relatively common to use attainment status with one or more
NAAQS regulations as a proxy for environmental regulatory stringency. Henderson (1996) found
evidence that manufacturing plants that were relatively high emitters of volatile organic
compounds and nitrogen oxides were less likely to locate in counties out of attainment with the
ozone NAAQS, and that a county that came into attainment with the ozone NAAQS (and therefore
was no longer subject to additional regulatory scrutiny) attracted about 8 percent more plants
than a county that did not change status. Kahn (1997) found that manufacturing plants were less
likely to close in counties out of attainment for particulate matter. However, conditional on
remaining open, these plants grew more slowly over the 1982 to 1988 period.
10 For a detailed review of the literature on U.S. environmental regulation and plant location decisions, see Shadbegian and Wolverton (2010), which includes topics not discussed here such as the potential effects of environmental regulation on international competitiveness and whether location decisions are influenced by environmental justice considerations. Also see Gray (2015).
11
Examining four polluting manufacturing industries, Becker and Henderson (2000) estimated that
counties out of attainment with the ozone NAAQS attracted 26–45 percent fewer plants than
counties in attainment between 1967 and 1992. In addition, they found that the further out of
attainment a county, the larger the estimated loss in new plants. In a similar study, Millimet and
List (2004) examined how ozone attainment status affected plant entry and exit in pollution-
intensive industries in New York from 1980 to 1990. They found that factors such as a higher
proportion employed in manufacturing, smaller populations, and higher wages help mitigate the
effects of non-attainment on plant entry and exit. Condliffe and Morgan (2009) found that non-
attainment with the ozone NAAQS had, on average, a statistically negative effect on plant entry
in U.S. counties between 1996 and 1998, but that this effect was mainly concentrated in the more
pollution-intensive manufacturing industries.
List, McHone, and Millimet (2003) is one of the few studies to examine the impact of attainment
status on the relocation of existing plants. Using data from New York, they found that a county
that changed ozone attainment status between 1980 and 1990 experienced over a 50 percent
change in the flow of newly relocating plants. In particular, counties out of attainment and
therefore subject to more stringent environmental standards attracted significantly fewer
relocating plants than counties in attainment.
Labor Market Impacts
The potential employment impacts of environmental policy has been an area of concern since
the Clean Air Act first was implemented, and interest continues today. Analytically, the impacts
of environmental regulation on employment are quite difficult to disentangle from other
economic changes and conditions that affect employment. Because environmental regulation
shifts economic activity away from more- towards less-polluting activities, employment impacts
are a mix of potential declines and gains over time, across regions, and across industries of the
economy. In addition to impacts on the directly regulated sectors, environmental regulations
often increase demand for pollution control equipment and services needed for compliance.
Moreover, a regulation that increases the costs of a primary input such as electricity may cause
a decrease in the demand for labor in energy-intensive industries.
Microeconomic theory of production and factor demand describes how firms adjust their
demand for inputs, such as labor, in response to changes in economic conditions. Researchers
have used this framework to represent pollution abatement requirements as changes in quasi-
fixed factors of production (Berman and Bui, 2001a), an increase in the price of pollution
(Greenstone, 2002), an increase in pollution abatement costs (Morgenstern, Pizer, and Shih,
2002), an emissions tax (Holland, 2012), an increase in the price of capital (Deschênes, 2014), or
an increase in energy prices (Deschênes, 2012). Impacts on firm-level labor demand can be
12
decomposed into substitution and output effects. The substitution effect measures a change in
employment as the firm responds to a change in input price, holding output constant. For
example, with only capital and labor inputs, if the price of capital increases, the firm will
substitute towards increased use of labor, to produce the same level of output. With three or
more productive factors, the substitution effect depends on the cross-elasticities of labor
demand. The change in input price may also change the firm’s marginal cost of production, which
then may affect the firm’s profit-maximizing level of output. The output effect measures how
employment changes as the firm adjusts output to maximize profits, while holding relative input
shares constant. As the output and substitution effects may be both positive, negative, or some
combination, theory alone cannot predict the sign of the total impact of regulation on labor
demand at regulated firms.
Overall, the economics literature finds little evidence that environmental regulations have had a
large impact on employment in regulated sectors, and generally does not speak to the sign or
magnitude of the overall effect of regulation on national employment.11 Berman and Bui (2001a)
examined the impact of local air quality regulations on employment in manufacturing plants
relative to similar plants that did not face the same regulations. They found that even though
regulations impose large costs on plants, they had a statistically insignificant effect on
employment. Ferris, Shadbegian, and Wolverton (2014) also used a quasi-experimental empirical
approach, and found that, relative to similar but unregulated plants, employment impacts from
Phase I of the sulfur dioxide cap-and-trade program were close to zero for regulated utilities.
Gray, Shadbegian, Wang, and Meral (2014) found that pulp mills subject to certain air and water
regulations experienced relatively small, and not always statistically significant, decreases in
employment. Curtis (2014) found a small negative impact of the nitrogen oxides cap-and-trade
program on manufacturing employment, with impacts primarily occurring through decreased
hiring rates, rather than increased separation rates. Sheriff, Ferris, and Shadbegian (2015) found
negative impacts of ozone regulations on employment at electric utilities, with no accompanying
changes in electricity generation, possibly indicating labor-saving technical change.
Other research on employment effects in regulated sectors, such as Greenstone (2002) and
Walker (2011, 2013), suggest that counties subject to stricter air quality regulation may generate
fewer manufacturing jobs than less regulated ones. However, because they identified
employment impacts by comparing non-attainment to similar attainment areas, employment
impacts are likely overstated; they are “double counted” to the extent that regulation caused
plants to locate in one area of the country rather than another (Greenstone, 2002). List, Millimet,
Fredriksson, and McHone (2003) found some evidence that this type of geographic relocation
may be occurring. Kahn and Mansur (2013) examined manufacturing employment impacts of air
11 See Coglianese, Finkel, and Carrigan (2013) for a more in-depth summary of recent literature, which supports the conclusion that environmental regulations have resulted in no or relatively modest effects on employment.
13
regulations by pairing a regulated county with a neighboring, less regulated county, while
controlling for differences in electricity price and labor regulation. They found limited evidence
that air regulations caused employment to be lower on net within a county-border-pair. While
regulation may cause labor to relocate across a border, since one county’s loss is another’s gain,
such shifts cannot be transformed into an estimate of a national impact on employment.
If employment impacts are anticipated in related but not directly regulated sectors, then a
general equilibrium approach would likely better capture those impacts. However, existing CGE
models used to analyze the overall impacts of environmental regulation almost always assume
full employment. One way to incorporate involuntary unemployment into CGE models as an
equilibrium condition has been to use a reduced form approach consistent with the notion that
frictions in the marketplace prevent wages from adjusting to their market-clearing level.
Modelers often specify a wage curve, based on the empirical observation of Blanchflower and
Oswald (1994), that real wages are a decreasing function of the unemployment rate. This
approach amounts to an exogenous assumption regarding the amount of unemployment within
the labor market.
Dissou and Sun (2013) specified a wage curve to examine the welfare and employment
implications of different ways of recycling revenues from a carbon cap-and-trade system. They
found relatively small effects on employment for low and high skilled workers across scenarios,
noting that this is unsurprising given that carbon-intensive industries tend to use relatively more
capital than labor (i.e., as such, one would expect them to shed more capital than labor in
response to the policy). Likewise, Rivers (2013) incorporated a wage curve into a highly stylized
three sector static CGE model to examine the employment implications of renewable energy
policies, and found that subsidies increase equilibrium unemployment. Bohringer, Rivers,
Rutherford, and Wigle (2012) used a CGE model to assess the labor market impacts of a feed-in-
tariff policy in the electricity market in Ontario. They found that while increasing employment in
“green” manufacturing, the policy had the opposite effect on employment in the rest of the
economy and increased the unemployment rate overall. The authors acknowledged that external
effects and technical change are ignored in the static model, and in certain cases their inclusion
might produce a different outcome. Bohringer, Keller, and van der Werf (2013) used a CGE model
of Germany to investigate the impacts of renewable energy promotion. They found that the
possibilities for enhancing welfare and employment are quite limited, hinging crucially on the
subsidy rate and financing mechanism.
CGE models that explicitly model wage-setting mechanisms often adopt labor market models
from the labor economics literature. There are a number of wage-setting mechanisms, including
efficiency wages, collective wage-bargaining, job search and matching models, as well as explicit
14
incorporation of other types of wage rigidities. The efficiency wage model is predicated on the
idea that employers can increase worker productivity by paying above-market wages. In the
collective wage-bargaining model above-market wages result from negotiations between firms
and trade unions with some degree of market power. Job search-and-matching models assume
that finding a job requires time and effort and is inherently stochastic. The higher the ratio of
unemployed to vacancies, the lower the probability of finding a job.12
Balistreri (2002) laid out a methodology for incorporating two salient features of the job search
and matching model into a CGE framework: “(1) supplying labor for production is costly in terms
of the foregone reservation wage and an individual’s chance of not being matched to a job (i.e.,
becoming unemployed); and (2) there is an externality by which the risk of an individual not being
matched is affected by the aggregate behavior of other agents.” He then demonstrated how this
formulation of the job search and matching model operates within a dynamic CGE model of the
United States when simulating a cap-and-trade policy to reduce carbon emissions.13 Babiker and
Eckaus (2007) introduced wage rigidities by limiting sectoral labor mobility and sectoral wage
adjustment in a multi-region global CGE model. Dixon, Johnson, and Rimmer (2011) allowed for
potential disequilibrium in the U.S. labor market by specifying three states: employed,
unemployed, and not in the labor force where employed labor is differentiated by industry,
occupation, and region. The model also assumed a cost associated with changing employment
states (Dixon and Rimmer, 2002).
IV. Expanding the Notion of Overall Economic Impacts to Think about Social Welfare
While changes in gross domestic or gross national product (GDP or GNP) and productivity have
often been reported by government and academics as a metric for understanding the overall
impact of an environmental regulation on the U.S. economy, they also have long recognized its
shortcomings as a way to capture the full effects of policy on social well-being or welfare.
Executive Orders signed under Presidents Nixon and Ford, directed Federal agencies to evaluate
the potential effects of new regulation on the economy through the conduct of “Quality of Life
Reviews” and “Inflation Impact Statements,” (Morgenstern, 1997; OMB, 1997). The stated
objective of a Quality of Life Review was to minimize the burden of environmental regulations on
12 See Boeters and Savard (2013) for a detailed discussion of different models of unemployment and calibration issues encountered when incorporating them into a CGE model. 13 Balistreri (2002) showed that a higher elasticity of substitution between labor and leisure led to larger and more persistent impacts on unemployment. Likewise, the higher the share of leisure relative to labor, the larger the impact on unemployment. A lower share of workers that were already matched to a job and a higher turnover rate reduced the impacts on unemployment. In addition, higher elasticities of scale on employment resulted in larger changes in unemployment, while higher elasticities of scale on the unemployment rate reduced the response.
15
businesses. Inflation Impact Statements were broader; their purpose was to monitor agency
activity for potentially inflationary actions and to conduct an inflation impact analysis (OMB,
1997). Economists hired to oversee these analyses concluded, however, that a regulation could
not be inflationary unless its costs to society exceeded its benefits. As a result, they began
conducting benefit-cost analyses (BCAs) of new, major regulations as a way to meet Executive
Order requirements.14
A BCA that quantifies the social benefits and costs associated with a regulation seeks to answer
the question, is it theoretically possible for the “gainers” from the policy to fully compensate the
“losers” and still remain better off (U.S. EPA, 2010).15 In this context, the measure used to gauge
a regulation’s effect on the economy is the net change in social welfare that households
experience. The net change in welfare is derived “by summing all of the benefits that accrue as a
result of a policy change (including spillover effects) less costs imposed by the policy on society
(including externalities)” (U.S. EPA, 2010). Since spillovers and externalities are non-market
transactions, quantifying private costs and benefits is not a sufficient proxy for estimating the
costs and benefits of a new regulation to society. Social cost represents the total burden that a
regulation will impose on the economy. It is defined as the sum of all opportunity costs incurred
as a result of a regulation, where an opportunity cost is the value lost to society of all goods and
services that will not be produced and consumed in the presence of regulation as resources are
reallocated away from consumption and production activities towards pollution abatement (U.S.
EPA, 2010). Social benefits are also measured in terms of opportunity cost (OMB, 1997).16
Why move beyond impacts on productivity and GDP to consider effects on economic welfare?
GNP or GDP has been recognized as “a flawed measure of economic welfare” because a number
of factors that affect one’s quality of life are not included, such as leisure, health status, crime,
and the environmental quality, among others (Jones and Klenow, 2016).17 In addition, these
14 The notion that one should attempt to quantify the societal costs and benefits of a Federal regulation has much older origins. As early as 1902, the Bureau of Land Reclamation and U.S. Army Corp of Engineers used benefit-cost analysis (Hanley and Spash, 1993). 15 Agencies conducts BCAs for all rules deemed economically significant or particularly novel. Economically significant rules are defined by E.O. 12866 as those with costs and/or benefits of at least $100 million (nominal) in a single year. The E.O. directs agencies to “select those approaches that maximize net benefits (including potential economic, environmental, public health and safety, and other advantages; distributive impacts; and equity), unless a statute requires another regulatory approach” (The White House, 1993). This objective, that a policy’s net benefits be positive, is referred to as the Potential Pareto criterion (U.S. EPA, 2010). 16 Beginning in the 1960s, environmental economics began to develop techniques for measuring what individuals are willing to pay for a particular non-market environmental or health benefit (Hanley and Spash, 1993). See EPA (2010) for more information on specific techniques commonly used for this purpose. 17 GDP is defined as the sum of the value (price times quantity) of all market goods and services produced in the economy and is equal to Consumption + Investment + Government + (Exports - Imports).Because GDP is viewed as
16
measures may be misleading due to double counting. For example, a regulation that requires
firms to invest in new capital in a given year will result in a large increase in the investment
component of GDP. However, capital also affects the availability of goods and services that can
be consumed over a much longer time period, which is also captured in the consumption
component of GDP (Paltsev and Capros, 2013). To avoid double counting, studies sometimes
report changes in household consumption as an indicator of social welfare. However, as with
GDP, this measure excludes consideration of how a new policy affects leisure and other quality
of life factors such as environmental quality.18 Another previously discussed alternative,
economic productivity, is narrowly focused on the degree to which a policy affects the amount
of output that can be produced using a given amount of inputs.
Economists use the concepts of equivalent variation (EV) and compensating variation (CV) to
explore how a policy affects social well-being. Both of these are monetary measures of the
change in utility brought about by changes in prices and incomes. The difference between them
depends on whether one assumes the policy change has already occurred (EV), or is not yet in
place (CV). For instance, EV measures what a consumer would be willing to pay to avoid an
increase in prices (and thus, a decline in real income) resulting from a regulation going into effect.
In contrast, CV measures how much a consumer would need to be compensated to accept
changes in prices and income such that the consumer achieves the same level of utility
experienced prior to the policy shock. In addition, changes in welfare encompass more than just
market activities – for instance, there is a monetary value to leisure.
Literature on the Social Cost of U.S. Environmental Regulation
Hazilla and Kopp (1990) is an early example of a study that examined the welfare impact of
environmental regulations on the economy. Relying on a 36 sector dynamic CGE model, they
estimated the social cost of the U.S. Clean Air and Clean Water Acts for 1981 to 1990 expressed
in terms of compensating variation.19 They found that all sectors of the economy were affected,
with the greatest impacts of the regulation falling on electric utilities, motor vehicles, crude oil
and natural gas, primary metals, and chemicals. Sectors that were not directly regulated but
supplied key intermediate goods also experienced significant negative impacts on output and
labor productivity. Their estimate of the social cost of the regulations (about $980 billion) was
a relatively poor indicator of social welfare, there is an active discussion of ways to move national account metrics closer to a measure of well-being (e.g., Stiglitz, Sen, and Fitoussi, 2009; Fleurbaey, 2009). 18 Paltsev and Capros (2013) note that the direction of the difference between effects of a policy as measured by GDP versus consumption varies with time period and scenario in some models. They also note that the extent to which welfare and consumption measures differ depends on what is assumed about the responsiveness of labor supply to changes in wage rates. 19 CGE models are recognized as being “best suited for estimating the cost of policies that have large economy-wide impacts, especially when indirect and interaction effects are expected to be significant” (U.S. EPA, 2010).
17
more than 50 percent greater than the U.S. EPA’s equivalent engineering cost estimate. Hazilla
and Kopp (1990) noted the importance of this result since “very few policymakers have
recognized that social costs can exceed private expenditures.” They state that the difference
between the two measures is “a direct result of household behavior in which leisure is
substituted for consumption.”
Two studies by the U.S. EPA on the benefits and costs of the Clean Air Act demonstrate how
impacts on the economy differ when expressed in terms of economic welfare relative to GNP.
The U.S. EPA (1997) relied on the CGE model used in Jorgenson and Wilcoxen (1990) to
retrospectively examine the sectoral impacts and aggregate effects of the Clean Air Act from 1970
to 1990. As measured by changes in prices and output, the sectors most impacted were motor
vehicles, petroleum refining, and electricity generation. The aggregate effect on GNP was
estimated as a reduction in the long-run rate of GNP growth of 0.2 percent, with the 1990 level
of GNP one percent lower than in the no-control scenario. The impact on social welfare,
measured in terms of equivalent variation, was considerably smaller than the change in GNP,
even though benefits of the Clean Air Act were not included in the CGE model.20
The U.S. EPA (2011) study of the prospective effects of the Clean Air Act Amendments from 1990
to 2020 used a dynamic, forward looking 35-sector CGE model. It found substantial secondary
effects of compliance costs on the overall economy, a large portion of which likely result from
energy price increases and the diversion of capital from activities that enhance long-term
productivity to investment in pollution control equipment in the industrial sector. Once again, it
found that GDP is not a particularly good measure of the welfare impact of a policy. In a cost-only
scenario (i.e., no benefits included), GDP in 2020 was $108 billion lower than in the no-control
case, while social welfare, measured as equivalent variation, was 25 percent smaller than the
effect on GDP (about $82 billion lower than in the no control case) due to the reallocation of
some of the household’s time to leisure instead of labor. Unlike the U.S. EPA’s retrospective
analysis, an additional scenario included some of the health benefits of the Clean Air Act. We
discuss these in the next section.
V. Incorporating Benefits into Economy-Wide Modeling of Welfare Effects from
Environmental Regulation
Due to the many ways in which economic activity is linked to environmental quality it is not
possible to provide a full accounting of the effect of environmental policy on economic
productivity and social well-being without also taking into account the beneficial effects and their
impact on the economy. As policies change the environment they may either directly improve
18
the productivity of economic factors (e.g., reduced depreciation from acidic deposition,
increased productivity of outdoor workers) or change the composition of the economy as firms
and households change their behavior (e.g., labor-leisure choices).
There has been growing awareness that these interconnections between the environment and
the economy are important for understanding the net effect of a policy on the economy and
overall social well-being (Carbone and Smith, 2013). However, introducing a role for the
environment into production and household behavior at an economy-wide scale is an area of
applied analysis that is still developing. The suite of studies that have partially incorporated
pollution into these types of frameworks have found substantial impacts on the overall economy
of improvements in environmental quality. This section discusses the ways in which
improvements in environmental quality can have a significant effect on economic activity and
literature that explicitly accounts for the relationship between pollution and productivity when
estimating the social welfare of air regulations.
Relationship between pollution and productivity
While much of the initial literature focused on the connection between economic activity and
compliance with environmental regulations, recent work has shown that understanding the way
benefits from improving environmental quality interact with economic activity is also important
for understanding the overall impacts of regulation. In fact, many estimates of the benefits
associated with environmental policies leverage changes in market activity that complement
household consumption of non-market goods and services as environmental quality varies. For
example, households’ willingness to pay for environmental improvements are commonly
estimated based on the way spatial and/or temporal variation in environmental quality affects
housing prices due to its influence on housing demand (Palmquist, 2005). Similarly, studies
leveraging observed housing market behavior in response to variation in environmental
amenities, have estimated households’ willingness to pay for improvements in health (Gayer,
Hamilton, and Viscusi, 2002). Benefits from improvements in environmental quality are also
routinely estimated from consumers’ willingness to trade-off other consumption for improved
environmental quality in their recreation decisions (Phaneuf and Smith, 2005).
Human health has an important and direct connections with both economic activity and
environmental quality. Degredation of environmental quality, such as air pollution, can increase
the incidence of premature mortality (Levy, Baxter, and Schwartz, 2009; Fann et al., 2012; and
Tagaris et al., 2009). While vulnerable populations such as children and the elderly are
particularly susceptible to the effects of pollution, environmental degradation also impacts the
mortality rate of working age individuals, thereby having a direct effect on labor force
participation (U.S. EPA, 2011). Similarly the morbidity effects of pollution can impact labor supply
due to effect on sick days taken (i.e., the extensive margin) as well as worker productivity while
19
on the job (i.e., the intensive margin) (e.g., Vennemo, 1997).21 Restrictions on an individual’s
time endowment also affects the proportion allocated to work versus leisure activities. Pollution-
related morbidity effects also increase demand for medical goods and services, which means
those resources are not available for other productive uses in the economy (Matus, Yang, Paltsev,
Reilly, and Nam, 2008). While the size of these resource shifts may be relatively small,
consideration of their effect on economic activity may still be warranted, particularly given the
highly distorted state of healthcare markets.
In addition, environmental degradation affects the health of children in ways that are potentially
different than for adults. First, children can be more vulnerable to pollution due to normal
childhood activities and behavior patterns. According to U.S. EPA (2013a), “children generally eat
more food, drink more water, and breathe more air relative to their size than adults do, and
consequently may be exposed to relatively higher amounts of environmental contaminants.”
Second, children may be more vulnerable to pollution because they are still developing physically
and may, therefore, be more easily harmed. The effects of environmental quality on children’s
health impacts economic activity through multiple channels. In a dynamic setting, changes in the
health risks faced by children, in the form of mortality and development, can have long-term
implications for the economy through impacts on future labor supply and worker productivity.
Furthermore, pollution-related illnesses in children can affect labor supply when parents and
guardians have to take time off from work to provide care (Salkever, 1982).
Changes in environmental quality also impact the availability and productivity of other inputs to
production. For example, atmospheric and deposition effects of air pollution can lead to
materials damages, thereby increasing the depreciation rate of physical capital (U.S. EPA, 1999;
Saha and Eckelman, 2014) and causing damages to buildings and structures of cultural and
historical significance (Grosclaude and Soguel, 1994), which may impact regional tourism (Kling ,
Revier, and Sable, 2004). Similarly, air pollution has the potential to affect agriculture and forestry
through its direct effect on vegetation via induced foliar injury, reduced annual growth rates, and
induced root loss (U.S. EPA, 2007). Visible foliar injury can reduce the desirability of leafy crops,
(e.g., spinach, lettuce) and ornamentals (e.g., petunias, geraniums, poinsettias). Discoloration
and early shedding of leaves from air pollution, can also have notable welfare effects in areas
where foliage is highly valued (e.g., scenic vistas, fall foliage).
21 Outdoor workers may be particularly vulnerable to health impacts associated with air pollution due to increased exposure (U.S. EPA 2013b, Brauer, Blair, and Vedal, 1996, Hoppe et al. 1995). In addition, studies have found empirical evidence that air quality is a significant determinant of productivity for a subset of workers (Crocker and Horst, 1981; Graff Zivin and Neidell, 2012).
20
Literature Incorporating Benefits into Economy-Wide Analysis of Environmental Regulation
It has been estimated that environmental regulations prevent substantial numbers of premature
deaths ever year and have a significant effect on rates of morbidity (U.S. EPA, 2011). A number
of researchers have modeled the way these improvements in human health may interact with
the economy using CGE models. Several of the initial studies were conducted in Europe.
Vennemo (1997) was one of the first to incorporate environmental externalities into an applied
CGE model of the Norwegian economy. Morbidity associated with air pollution was assumed to
impact labor supply at both the extensive and intensive margins and was modeled as pollutant
specific labor shocks. While the early work of Vennemo was limited in its ability to capture some
of the complex connections between the economy and the environment, it provided insights into
their potential importance. Environmental feedbacks significantly reduced consumption of goods
and services as well as overall social welfare.
A decade later, Mayeres and van Regemorter (2008) studied the effect of health impacts from
air pollution on the European economy. Their study pushed the science forward by incorporating
some aspects of mortality, morbidity, and non-health impacts of air pollution from the energy
sector as non-separable elements of households’ utility functions in a general equilibrium
framework. In other words, the study allowed for the behavior of households to be affected by
changes in health status and environmental quality. Morbidity was modeled as both reducing
households’ time endowment directly and as a labor productivity shock. By modeling a portion
of the labor morbidity effect as a shock to labor productivity, Mayeres and van Regemorter
attempted to capture the role of paid sick leave, whereby some households will remain financially
whole in the face of changes in morbidity, while firms see a change in the productivity of their
labor force. The study also incorporated the medical costs of pollution-induced mortality and
morbidity more fully into the model by considering the effect of air pollution on private and public
spending for medical services and household’s time endowments within a bi-directional coupling
of the economy and the environment.
Researchers in the United States also began to incorporate health impacts from air pollution into
a prominent multi-region, global CGE model (i.e., the Emission Prediction and Policy Analysis
(EPPA) model). To date, the health effects version of the model has been used to study the impact
of historical ozone and particulate matter air pollution in the U.S. (Matus et al., 2008), Europe
(Nam, Selin, Reilly, and Paltsev, 2010), and China (Matus, et al., 2012), and future ozone pollution
globally (Selin et al., 2009). To incorporate premature mortality, the model accounted for the
damages to households in terms of total factor consumption, including leisure, while also
accounting for the cumulative economic effect of reduced labor, consumption, and investment
associated with premature mortality. To incorporate pollution-induced morbidity, the model
21
accounted for the reduced time available for labor and/or leisure, the increased demand for
medical services, and cumulative economic effects from those changes.
Two studies have estimated how including the benefits of air pollution regulation affects social
welfare. Matus et al. (2008) estimated that by 2000 air pollution regulations in the United States
provided a welfare improvement (measured in terms of equivalent variation) of nearly $400
billion [1997$], with households being willing to pay another $250 billon [1997$] to avoid the
remaining damages from air pollution.22 They also estimated that consumption of final goods was
5.4 percent higher in 2000 due to improvements in air quality than in a world without those
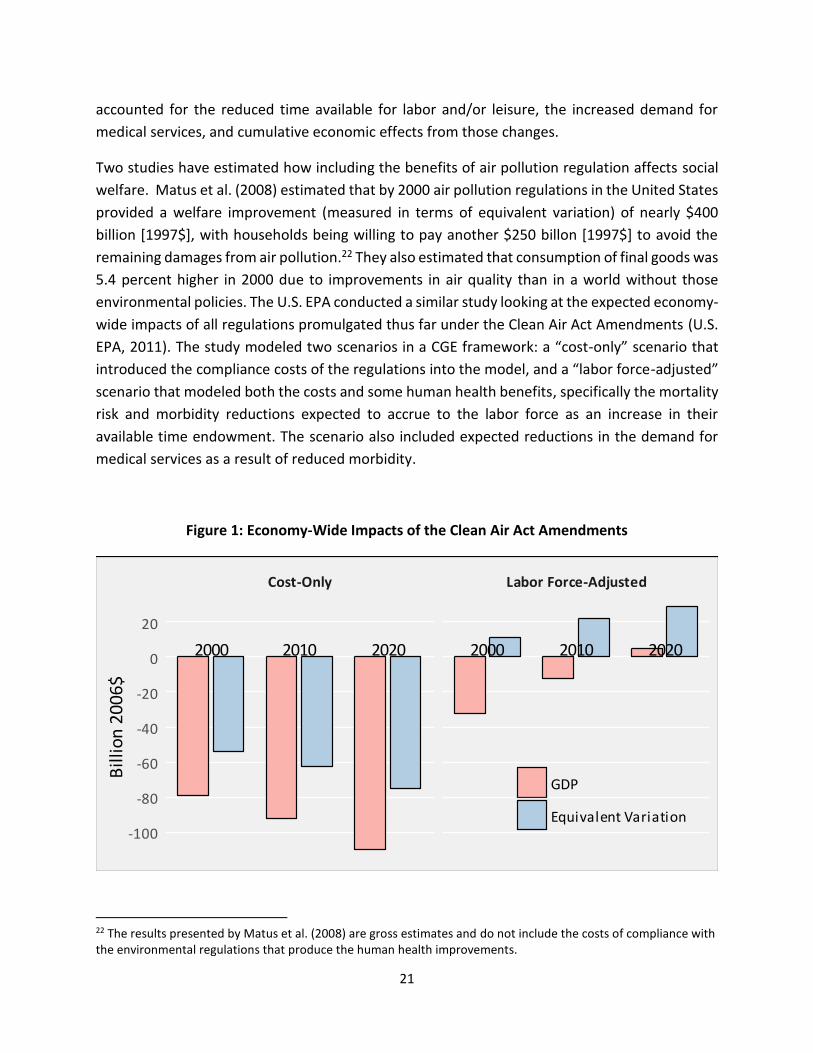
environmental policies. The U.S. EPA conducted a similar study looking at the expected economy-
wide impacts of all regulations promulgated thus far under the Clean Air Act Amendments (U.S.
EPA, 2011). The study modeled two scenarios in a CGE framework: a “cost-only” scenario that
introduced the compliance costs of the regulations into the model, and a “labor force-adjusted”
scenario that modeled both the costs and some human health benefits, specifically the mortality
risk and morbidity reductions expected to accrue to the labor force as an increase in their
available time endowment. The scenario also included expected reductions in the demand for
medical services as a result of reduced morbidity.
Figure 1: Economy-Wide Impacts of the Clean Air Act Amendments
22 The results presented by Matus et al. (2008) are gross estimates and do not include the costs of compliance with the environmental regulations that produce the human health improvements.
Cost-Only Labor Force-Adjusted
2000 2010 2020 2000 2010 2020
-100
-80
-60
-40
-20
0
20
Bill
ion
20
06
$
GDP
Equivalent Variation
22
Source: U.S. EPA, 2011
The U.S. EPA’s analysis highlights a number of important insights. First, it showed how important
accounting for the beneficial impacts of environmental policies are when trying to assess their
economic impacts. When accounting for the human health impacts of the policy the expected
effect on GDP was less than half of what it was when only compliance costs were considered.
Inclusion of health benefits in the control case also reduced negative impacts on sectors such as
electricity, mining, and minerals and increased the positive impacts on sectors such as computer
equipment manufacturing. Second, as previously discussed, it demonstrated that GDP is not a
particularly good measure of the welfare impact of a policy. Recall that, even when only
considering the costs of the policy, the change in GDP was significantly different than the change
in welfare. Figure 1 shows that this issue is exacerbated once the human health impacts of the
policy are included. In the initial years the impact of the policy on GDP was negative while the
policy was immediately welfare improving (with this effect growing over time). This is primarily
driven by changes in the time endowment, which allows households to engage in more leisure
while also supplying more labor, increasing both consumption and welfare.
As already mentioned, other non-market impacts of environmental policies may also be
important for determining effects on social welfare. For example, Finnoff and Tschirhart (2008)
coupled ecological and economic general equilibrium models of the Alaskan economy with a food
web model of Alaska’s marine ecosystem to study the economic impacts of regulating
commercial fishing. They found potentially notable general equilibrium effects due to the direct
effects in the regulated sector and indirect effects on the tourism sector. In addition, while most
of the primary factors (capital and labor) utilized in the directly regulated industry resided outside
of Alaska, they found that the domestic labor market was affected due to reductions in real
income as well as changes in the tourism sector.23
Carbone and Smith (2013) tested the quantitative importance of general equilibrium welfare
effects when there are changes in human health, non-market ecosystem services, and non-use
existence services that result from improving environmental quality. Specifically, they added
sector-specific sulfur and nitrogen oxide emissions factors that have effects on lakes and forests
through acidic deposition, along with negative human health impacts to a CGE model. They also
23 While Antoine, Gurgel, and Reilly (2008) did not consider benefits, they examined the importance of including non-market goods and services provided by the environment when analyzing the cost of biofuel policies. They directly introduced non-market recreation services into a CGE model and found that the inclusion of a competing demand for unmanaged forests (for outdoor recreation) lowered the amount of land converted to biofuel production. The authors found this tradeoff associated with non-market services to be a potentially important component for characterizing the social cost of mitigation policy, increasing the welfare costs by around 20 percent in years where biofuels were considered a relatively cost-effective mitigation strategy by the model.
23
included two non-market services associated with recreational fisheries and tree cover and a
non-use existence value associated with general habitat services. The authors conducted a series
of experiments to compare the welfare change with and without the general equilibrium effects
from changes in air quality improvements. For a policy resulting in a 40 percent emissions
reduction, roughly the magnitude of reductions from the Clean Air Act Amendments, and
focusing only on improvements to recreational fisheries, they found that including general
equilibrium effects increases the estimate of the welfare improvement by 12 to 55 percent.24
These results led the authors to conclude that even when the value of non-market services is a
small fraction of the aggregate value of the economy, the general equilibrium effects stemming
from how changes in environmental quality affect household behavior may be notable.
VI. Significant Outstanding Research Questions
There are a number of important questions regarding the impacts of environmental regulation
on the U.S. economy that remain unresolved. We briefly discuss several, emphasizing their
saliency to ongoing public debate and the need for renewed attention in the research arena.
Unifying Structural Framework for Understanding Economic Impacts of Environmental Regulation
Analyses of major regulation traditionally focus on estimating the overall costs and benefits of a
policy to society. The distribution of those costs and benefits is also of great interest but such
analyses face a number of methodological and empirical challenges. Identifying the particular
sectors or subsectors affected, how costs are passed through to households and firms, and the
ways in which households and firms respond can be quite difficult to analyze, and sometimes
results in unexpected effects (Kolstad, 1999, 2014). Decisions regarding whether to expand or
reduce production at existing facilities or whether to open new facilities have implications for
when and how many workers are hired. Likewise, labor input decisions may manifest as changes
in how many workers are hired or laid off, the types of workers hired or laid off, the wages and
benefits offered, or the number of hours worked. These decisions, in turn, are linked to the
productivity of firms, sectors, and ultimately the overall economy.
Based on the existing literature and the relative magnitude of environmental regulations
compared to the size of the U.S. economy, one would anticipate that for most environmental
regulations, economic impacts likely have limited or no macroeconomic implications (Arrow, et
24 Carbone and Smith (2013) recalibrated the model depending on whether the welfare measure includes general equilibrium effects and for different sets of substitution elasticities so that the marginal WTP implicit in the model remained in line with empirical estimates. The lower end of the range assumed greater substitutability relative to the reference case; the higher end of the range assumed stronger complementarity than in the reference case.
24
al., 1996; Ferris et al., 2014).25 However, lack of an overarching structural framework that
coherently links individual decisions to their macroeconomic implications also hinders the ability
to analyze potential economy-wide impacts of environmental regulation.
Separating out the effects of environmental regulation from the myriad of other phenomena
affecting consumption and production decisions also is an ongoing challenge. In terms of
employment impacts, it has long been observed that even a large-scale air regulation is unlikely
to have a noticeable impact on aggregate net U.S. employment. Instead, labor in affected sectors
would primarily be reallocated from one productive use to another, and national employment
effects from regulation would be small and transitory (e.g., as workers move from one job to
another) (Arrow et al. 1996). Given the literature to-date, this is also likely to be true when
evaluating the effects of environmental regulation on productivity or plant entry and exit
decisions.
If the economy is operating at less than full employment, economic theory does not clearly
indicate either magnitude or direction of the total impact (Schmalansee and Stavins, 2011). For
example, an early government sponsored macroeconomic study (U.S. CEQ et al., 1972) estimated
that pollution abatement spending was stimulative to employment in the U.S. at a time of less
than full employment. Likewise, the Congressional Budget Office identified U.S. EPA regulations
that reduce mercury from power plants and hazardous air pollutants from industrial boilers and
process heaters as potentially leading to short-run net increases in economic growth and
employment, driven by capital investments to comply with the regulations (CBO, 2011). An
important fundamental research question is how to accommodate slackness in the economy –
when labor and other resources are not fully and efficiently employed - as a structural feature in
economic models. This feature may be important in evaluating the impact of large-scale
environmental regulation on employment (Smith, 2012, 2015).26
Incorporating Benefits into Welfare and Economic Impact Analyses
To describe the complete incidence of a regulation, one should consider not only the distribution
of costs but also benefits. However, folding benefits into the evaluation of economic impacts is
complicated. An analyst would need to understand to what extent certain types of households
differentially benefit from reductions in emissions. Another important consideration would be
whether workers enjoy health improvements that enhance their productivity, thus reducing the
25 Ferris et al. (2014) observed that “Spending on pollution abatement capital [in the electricity sector] represented about 0.5 percent of revenues from total retail sales of electricity in 1999. This is roughly consistent with other heavily regulated industries: pollution abatement capital costs for US manufacturing plants were roughly 0.4 percent of total shipments, while they were about 1 percent for pulp and paper, steel, and oil refining in 2005.” 26 EPA sponsored a workshop in 2012, “Advancing the Theory and Methods for Understanding Employment Effects of Environmental Regulation.” Several papers were subsequently published in the peer-reviewed literature, including Smith (2015), Rogerson (2015), and Kuminoff et al., (2015).
25
long-term impact of the regulation on producers and labor. In practice, the evaluation of how
costs and benefits are distributed across economic sectors are usually evaluated separately.
Note that absent a credible way to represent environmental externalities in a general equilibrium
model - or the benefits that accrue to society from mitigating them – an assessment of the
welfare and economic impacts derived from this approach are incomplete. The research studying
the importance of incorporating the environment in analyses of the economic effects of
environmental policies is still developing, though the results have thus far been robust in the
conclusion that estimates of the overall economic impacts of a policy will be significantly biased
if only the costs of compliance are included.
While it is clear that the beneficial impacts of environmental policies need to be incorporated in
an assessment of their economy-wide effects to achieve unbiased results, there are numerous
technical challenges to developing robust linkages between the economy and the environment.
For example, to date the primary approach to including mortality risk reductions in CGE models
has been to increase the time endowment based on the expected change in the population.
Based on the typical assumption of homothetic preferences in these models and the relatively
small size of such shocks compared to the size of the labor force, this approach values the change
in the mortality risk reduction at approximately the wage rate. While analytically convenient this
time endowment approach undervalues households’ willingness to pay for mortality risk
reductions by an order of magnitude (Smith, 2012). The discrepancy in how households’
preference regarding mortality risk are captured raises questions about how this difference
affects forecasts of behavioral changes in response to changes in mortality risk. This is an area of
future research that will be important for improving our understanding of how human health
impacts of environmental policies feedback into the economy.
In addition, as noted by Antoine et al. (2008) and Carbon and Smith (2013), there are a number
of data challenges with linking the environment and the economy in applied general equilibrium
models. The CGE model requires benchmark estimates of the value for each of the inputs to
activities, including the non-market inputs supplied by the environment. However, these inputs
are often not observed, or at least not recorded, in national economic account statistics. Even in
the U.S., national or regional data for the time spent engaged in these activities is not complete.
Also, the literature has yet to provide readily available estimates for elasticities that relate the
ability for households to substitute between land and other market goods when providing
activities involving the environment, such as recreation services, and their ability to substitute
between these and other activities in their utility function. The fine spatial resolution at which
policies impact the environment also presents unique data and methodological challenges as
applied general equilibrium models are often resolved at a fairly aggregate level.
26
Understanding Labor Productivity Effects
Environmental regulation may also affect labor supply and productivity or employees’ ability to
work. While the theoretical framework for analyzing labor supply and productivity effects is
analogous to that for labor demand (decomposing a wage change from a consumer’s perspective
into income and substitution effects), it is more difficult to study empirically. Although this
literature faces empirical challenges, particularly in terms of requiring detailed individual-level
labor data for the separation of impacts of reduced exposure to pollution from other factors
influencing labor productivity, early work supported by the U.S. EPA found that air quality
improvements led to reductions in lost work days (e.g., Ostro, 1987) and increased labor
productivity for outdoor workers (Crocker and Horst, 1981). More recently, there has been some
limited evidence that worker productivity may improve with better ambient air quality and
worsen on days with higher pollution (Graff Zivin and Neidell, 2012; Chang, Graff Zivin, Gross,
and Neidell, 2016).
Valuing Employment Impacts in Benefit-Cost Analysis
The standard approach in regulatory analysis has been to analyze employment as an economic
impact. However, the great recession in the 2000s spurred new interest in considering the
question of whether employment impacts also should be considered as a social cost of regulation
(Ferris and McGartland, 2013). Rogerson (2015) notes that an economy-wide model that
explicitly accounts for the labor market already incorporates employment effects into its welfare
calculation through changes in how the household values consumption and leisure in the utility
function. For instance, in the case where a policy lowers employment, it also likely lowers output
and consumption but increases leisure. The only way to weigh the cost of lower consumption
against the benefit of higher leisure is through a utility function that explicitly values both.
Rogerson goes on to observe that this need not apply only to a model with full employment and
no price rigidities.
With less than full employment due to a pre-existing wage rigidity, the model will reflect that
leisure is valued less than employment by households. When Rogerson (2015) examined whether
welfare calculations in a highly stylized model are affected by assumptions about how quickly the
labor market responds to a policy shock, he finds that the size of the labor response has little
effect. This is because of the offsetting effects on leisure already noted above.
Even at full employment affected sectors may experience transitory effects as workers change
jobs (Arrow et al., 1996; Smith, 2015; Kuminoff, Schoellman, and Timmins, 2015). For example,
some workers may need to retrain or relocate in anticipation of the new requirements or require
time to search for new jobs, while shortages in some sectors or regions could bid up wages to
27
attract workers. It is important to recognize that these adjustments can entail local labor
disruptions, and although the aggregate impact on the national workforce is expected to be
small, localized changes in employment can still have negative impacts on some individuals and
communities and positive impacts on others. If these types of adjustment costs are substantial,
excluding them may underestimate the social cost of regulation.27
Empirical Evidence of the Porter Hypothesis Based mainly on case studies, Porter (1991) and Porter and van der Linde (1995) argued that well
designed environmental regulations could “trigger innovation that may partially or more than
fully offset the costs of complying with them.” While agreeing with some of Porter and van der
Linde’s (1995) arguments, such as the desirability of market-based regulation, Palmer, Oates, and
Portney (1995) criticized the “Porter hypothesis” as not being broadly generalizable and argued
that most regulations have costs to society and should be subject to a benefit-cost test.
Jaffe and Palmer (1997) distinguished “narrow,” “weak,” and “strong” versions of the Porter
hypothesis. The narrow version is simply the argument, frequently made by economists, that
flexible regulatory policies give firms greater incentives to innovate and thus are better than
prescriptive regulations. The weak version is the argument that properly designed environmental
regulations may stimulate innovations that might not have existed otherwise. In the strong
version, it is argued that well designed regulations can spur firms into innovating to such an
extent that they can both comply with the regulation and increase profits, creating a win-win.
Ambec, Cohen, Elgie, and Lanoie (2013) reviewed empirical evidence for and against the validity
of the Porter hypothesis. For the weak version, they conclude that on balance evidence exists
that “there is a positive link between environmental regulation and innovation, although the
strength of the link varies.” For the strong version of the Porter hypothesis, they found that the
majority of studies were not supportive.
In spite of their conclusions, Ambec et al. (2013) noted that “we continue to find conflicting
evidence concerning the Porter Hypothesis, alternative theories that might explain it, and
oftentimes a misunderstanding of what the Porter Hypothesis does and does not say.” They point
to the need for additional research that relies on longitudinal data, the value of improved data
and methodologies that better pinpoint the mechanisms by which regulation can lead to
innovation, which in turn may increase or decrease costs, and the need for a better
understanding of the role of non-regulatory approaches such as reporting or voluntary programs
in spurring innovation in abatement technologies.
27 Several empirical studies have indicated that transition costs for displaced workers may be larger than previously thought (Davis and von Wachter, 2011; Smith, 2015).
28
VII. References
Ambec, S., Cohen, M. A., Elgie, S., & Lanoie, P. (2013). The Porter hypothesis at 20: Can
environmental regulation enhance innovation and competitiveness? Review of Environmental
Economics and Policy, 7(1), 2-22.
Antoine, B., Gurgel, A., & Reilly, J. M. (2008). Will recreation demand for land limit biofuels
production? Journal of Agricultural & Food Industrial Organization, 6(2), 1-29.
Arrow, K. J., & et al. (1996). Benefit-cost analysis in environmental, health, and safety regulation:
A statement of principles. American Enterprise Institute, the Annapolis Center, and Resources for
the Future. Retrieved from: https://www.aei.org/wp-content/uploads/2014/04/-benefitcost-
analysis-in-environmental-health-and-safety-regulation_161535983778.pdf.
Babiker, M., & Eckaus, R. S. (2007). Unemployment effects of climate policy. Environmental
Science and Policy 10, 600-609.
Balistreri, E. J. (2002). Operationalizing equilibrium unemployment: A general equilibrium
external economies approach. Journal of Economic Dynamics and Control 26, 347-374.
Barbera, A. J., & McConnell, V. D. (1990). The impact of environmental regulations on industry
productivity: Direct and indirect effects. Journal of Environmental Economics and Management,
18, 50-65.
Bartik, T. J. (1985). Business location decisions in the United States: Estimates of the effects of
unionization, taxes, and other characteristics of states. Journal of Business and Economic
Statistics, 3(1), 14-22.
Becker, R. A. (2011). Local environmental regulation and plant-level productivity. Ecological
Economics, 70, 2513-2522.
Becker, R. A., & Henderson, J. V. (2000). Effects of air quality regulations on polluting industries.
Journal of Political Economy, 108(2), 379-421.
Berman, E., & Bui, L. T. (2001a). Environmental regulation and labor demand: Evidence from the
South Coast air basin. Journal of Public Economics 79(2), 265-295.
Berman, E., & Bui, L. T. (2001b). Environmental regulation and productivity: Evidence from oil
refineries. Review of Economics and Statistics, 83(3), 498-510.
Blanchflower, D., & Oswald, A. (1994). The wage curve. Cambridge, MA: MIT Press.
29
Boeters, S. & Savard, L. (2013). The labor market in computable general equilibrium models. In
P. B. Dixon and D. W. Jorgenson (Eds.), Handbook of computable general equilibrium modeling.
Elsevier.
Böhringer, C., Keller, A., & van der Werf, E. (2013). Are green hopes too rosy? Employment and
welfare impacts of renewable energy promotion. Energy Economics, 36(C), 277-285.
Böhringer, C., Rivers, N. J., Rutherford, T. F., & Wigle, R. (2012). Green jobs and renewable
electricity policies: Employment impacts of Ontario’s feed-in tariff. B.E. Journal of Economic
Analysis and Policy, 12(1).
Brauer, M., Blair, J., & Vedal, S. (1996). Effect of ambient ozone exposure on lung function in
farm workers. American Journal of Respiratory and Critical Care Medicine, 154, 981-987.
Carbone, J. C., & Smith, V. K. (2013). Valuing nature in a general equilibrium. Journal of
Environmental Economics and Management, 66(1), 72-89.
Carlton, D. W. (1983). The location and employment choices of new firms: An econometric
model with discrete and continuous endogenous variables. Review of Economics and Statistics,
65(3), 440-449.
Chang, T., Graff Zivin, J. S., Gross, T., & Neidell, M. J. (2016). Particulate pollution and the
productivity of pear packers. American Economic Journal: Economic Policy, 8(3), 141-169.
Christainsen, G. B., & Haveman, R. H. (1981a). Public regulations and the slowdown in
productivity growth. American Economic Review, 71(2), 320-325.
Christainsen, G. B., & Haveman, R. H. (1981b). The contribution of environmental regulations to
the slowdown in productivity growth. Journal of Environmental Economics and Management, 8,
381-390.
Coglianese, C., Finkel, A. M., & Carrigan, C. (Eds.). (2013). Does Regulation Kill Jobs? University of
Pennsylvania Press.
Condliffe, S., & Morgan, O. A. (2009). The effects of air quality regulations on the location
decisions of pollution-intensive manufacturing plants. Journal of Regulatory Economics, 36, 83–
93.
Congressional Budget Office (CBO) (2011). Policies for increasing economic growth and
employment in 2012 and 2013. Statement of D. W. Elmendorf, Director, before the Senate
Budget Committee, Retrieved from http://www.cbo.gov/sites/default/files/11-15-
Outlook_Stimulus_Testimony.pdf.
30
Crocker, T. D., & Horst, Jr, R. L. (1981). Hours of work, labor productivity, and environmental
conditions: A case study. The Review of Economics and Statistics, 63(3), 361-368.
Curtis, M. (2014). Who loses under power plant cap and trade programs? Estimating the impact
of the NOx budget trading program on manufacturing employment. NBER Working Paper, No.
20808. National Bureau of Economics Research. (Revise and resubmit at Review of Economics
and Statistics.)
Dale, L. (1970, August 12). Nixon’s inflation alert. The New York Times. Retrieved from
www.nytimes.com.
Davis, S. J. & von Wachter, T. (2011). Recessions and the Costs of Job Loss. Brookings Papers on
Economic Activity, 43(2), 1-55.
Deschênes, O. (2012). Climate policy and labor markets. In D. Fullerton and C. Wolfram (Eds.),
The design and implementation of U.S. climate policy. Chicago, IL: University of Chicago Press.
Deschênes, O. (2014). Environmental regulations and labor markets. IZA World of Labor, 22, 1-
10.
Denison, E. F. (1978). Effects of selected changes in the institutional and human environment
upon output per unit of input. Survey of Current Business, 58(1), 21-43.
Denison, E. F. (1979). Pollution abatement programs: Estimates of their effect upon output per
unit of input, 1975-78. Survey of Current Business, 59(8), Part 1, 58-59.
Dissou, Y., & Sun, Q. (2013). “GHG mitigation policies and employment: A CGE analysis with
wage rigidity and application to Canada.” Canadian Public Policy 39, S53-S65.
Dixon, P. B., Johnson, M., & Rimmer, M. T. (2011). Economy-wide effects of reducing illegal
immigrants in U.S. employment. Contemporary Economic Policy, 29(1): 14-30.
Dixon, P. B., & Rimmer, M. T. (2002). USAGE-ITC: Theoretical structure. Retrieved from
https://www.gtap.agecon.purdue.edu/resources/download/958.pdf.
Domazlicky, B. R., & Weber, W. L. (2004). Does environmental protection lead to slower
productivity growth in the chemical industry? Environmental and Resource Economics, 28, 301-
324.
Dorfman, R. (1973). Discussion. American Economic Review, 63(2), 253-256.
DRI. (1981). The macroeconomic impact of federal pollution control programs: 1981
assessment. Report for the U.S. EPA.
31
Evans, M. K. (1973). A forecasting model applied to pollution control costs. American Economic
Review, 63(2), 244-252.
Fann, N., et al. (2012). Estimating the national public health burden associated with exposure to
ambient PM2.5 and ozone. Risk Analysis, 32(1), 81-95.
Ferris, A. E., & McGartland, A. (2013). A research agenda for improving the treatment of
employment impacts in regulatory impact analysis. In C. Coglianese, A. M. Finkel, and C. Carrigan
(Eds.) Does Regulation Kill Jobs? (pp. 170-189). Philadelphia, PA: University of Pennsylvania Press.
Ferris, A. E., Shadbegian, R. J., & Wolverton, A. (2014). The effect of environmental regulation on
power sector employment: Phase I of the Title IV SO2 trading program. Journal of the Association
of Environmental and Resource Economists, 1(4), 521-553.
Finnoff, D. C., & Tschirhart, J. (2008). Linking dynamic economic and ecological general
equilibrium models. Resource and Energy Economics, 30(2), 91-114.
Fluerbaey, M. (2009). Beyond GDP: The quest for a measure of social welfare. Journal of
Economic Literature, 47(4), 1029-1075.
Gayer, T., Hamilton, J. T., & Viscusi, W. K. (2002). The market value of reducing cancer risk:
Hedonic housing prices with changing information. Southern Economic Journal, 69(2), 266-289.
Gollop, F. M., & Roberts, M. J. (1983). Environmental regulations and productivity growth: The
case of fossil-fueled electric power generation. Journal of Political Economy, 91(4), 654-674.
Graff Zivin, J. S., & Neidell, M. J. (2012). The impact of pollution on worker productivity.
American Economic Review, 102(7), 3652-3673.
Gray, W. B. (1987). The cost of regulation: OSHA, EPA and the productivity slowdown. American
Economic Review, 77(5), 998-1006.
Gray, W. B. (2015). Environmental regulations and business decisions. IZA World of Labor, 187,
1-10.
Gray, W. B., & Shadbegian, R. J. (2003). Plant vintage, technology, and environmental
regulation. Journal of Environmental Economics and Management, 46, 384-402.
Gray, W. B., Shadbegian, R. J., Wang, C., & Meral, M. (2014). Do EPA regulations affect labor
demand? Evidence from the pulp and paper industry. Journal of Environmental Economics and
Management, 68(1), 188-202.
32
Greenstone, M. (2002). The impacts of environmental regulations on industrial activity:
Evidence from the 1970 and 1977 Clean Air Act Amendments and the Census of Manufactures.
Journal of Political Economy, 110(6), 1175-1219.
Greenstone, M., List, J. A., & Syverson, C. (2012). The effects of environmental regulation on the
competitiveness of U.S. manufacturing. NBER Working Paper Series 18392, National Bureau of
Economic Research. (Revise and resubmit at Quarterly Journal of Economics).
Griswald, E. (2012, September 21). How 'silent spring' ignited the environmental movement.
The New York Times. Retrieved from www.nytimes.com.
Grosclaude, P., & Soguel, N. C. (1994). Valuing damage to historic buildings using a contingent
market: A case study of road traffic externalities. Journal of Environmental Planning and
Management, 37, 279-287.
Hanley, N., & Spash, C. L. (1993). Cost-benefit analysis and the environment. Vermont: Elgar.
Haveman, R. H., & Smith, V. K. (1978). Investment, inflation, unemployment, and the
environment. In P. Portney (Ed.), Current issues in U.S. environmental policy. Washington, DC:
Resources for the Future.
Hazilla, M., & Kopp, R. J. (1990). Social costs of environmental quality regulations: A general
equilibrium analysis. Journal of Political Economy, 98(4), 853-873.
Henderson, J. V. (1996). Effects of air quality regulation. American Economic Review, 86(4), 789-
813.
Holland, S. P. (2012). Spillovers from climate policy to other pollutants. In D. Fullerton & C.
Wolfram (Eds.), The design and implementation of U.S. climate policy. Chicago, IL: University of
Chicago Press.
Hoppe, P., et al. (1995). Environmental ozone field study on pulmonary and subjective
responses of assumed risk groups. Environmental Research, 71(2), 109-121.
Jaffe, A. B., & Palmer, K. (1997). Environmental regulation and innovation: A panel data study.
Review of Economics and Statistics, 79(4), 610-619.
Jones, C. I., & Klenow, P. J. (2016). Beyond GDP? Welfare across countries and time. American
Economic Review, 106(9), 2426-2457.
Jorgenson, D. W., & Wilcoxen, P. J. (1990). Environmental regulation and U.S. economic growth.
Rand Journal of Economics, 21(2), 314-340.
33
Jorgenson, D. W., & Wilcoxen, P. J. (1993). The economic impact of the Clean Air Act Amendments
of 1990. Energy Journal, 141, 159-182.
Kahn, M. E. (1997). Particulate pollution trends. Regional Science and Urban Economics, 1, 87-
107.
Kahn, M. E., & Mansur, E. T. (2013). Do local energy prices and regulation affect the geographic
concentration of employment? Journal of Public Economics, 101,105-114.
Kendrick, D. A. (1993). In memoriam: Edward F. Denison. Review of Income and Wealth, 39(1),
117-119.
Kling, R. W., Revier, C. F., & Sable, K. (2004). Estimating the public good value of preserving a local
historic landmark: The role of non-substitutability and citizen information. Urban Studies, 41(10),
2025-2041.
Kolstad, C. D. (1999). Environmental economics. Oxford University Press.
Kolstad, C. D. (2014). Who pays for climate regulation? SIEPR Policy Brief. Stanford Institute for
Economic Policy Research. Stanford University.
Kuminoff, N. V., Schoellman, T. & Timmins, C. D. (2015). Environmental regulations and the
welfare effects of job layoffs in the United States: A spatial approach. Review of Environmental
Economics and Policy, 9(2), 198-218.
Levinson, A. (1996). Environmental regulations and manufacturers’ location choices: Evidence
from the Census of Manufactures. Journal of Public Economics, 62, 5-29.
Levy, J. I., Baxter, L. K., & Schwartz, J. (2009). Uncertainty and variability in health-related
damages from coal-fired power plants in the United States. Risk Analysis, 29(7), 1000-1014.
Lewis, J. (1985). The birth of EPA. EPA Journal, 11(9), 6-11.
List, J. A., McHone, W. W., & Millimet, D. L. (2003). Effect of air quality regulation on the
destination choice of relocating plants. Oxford Economic Papers, 55, 657-678.
List, J. A., Millimet, D. L., Fredriksson, P. G., & McHone, W. W. (2003). Effects of environmental
regulations on manufacturing plant births: Evidence from a propensity score matching estimator.
The Review of Economics and Statistics, 85(4), 944-952.
Mark, J. (1978). Testimony before the Congressional Joint Economic Committee, in Special
Study on Economic Change: Hearings before the Joint Economic Committee, Congress of the
United States, Part 2, (pp. 476-486). Washington, DC: U.S. Government Printing Office.
34
Matus, K., Yang, T., Paltsev, S., Reilly, J. M., & Nam, K. M. (2008). Toward integrated assessment
of environmental change: Air pollution health Eefects in the USA. Climatic Change, 88(1), 59-92.
Matus, K., et al. (2012). Health damages from air pollution in China. Global Environmental
Change, 22(1), 55-66.
Mayeres, I., & van Regemorter, D. (2008). Modeling the health related benefits of
environmental policies and their feedback effects: A CGE analysis for the EU countries with
GEM-E3. Energy Journal, 29(1), 135-150.
McConnell, V. D., & Schwab, R. M. (1990). The impact of environmental regulation on industry
location decisions: The motor vehicle industry. Land Economics, 66(1), 67-81.
Millimet, D. L., & List, J. A. (2004). The case of the missing pollution haven hypothesis. Journal of
Regulatory Economics, 26(3), 239-262.
Morgenstern, R. D. (1997). The legal and institutional setting for economic analysis at EPA. In
R.D. Morgenstern (Ed.), Economic analyses at EPA: Assessing regulatory impact (pp. 5- 23).
Washington, DC: Resources for the Future.
Morgenstern, R. D., Pizer, W. A., & Shih, J. S. (2002). Jobs versus the environment: An industry
level perspective. Journal of Environmental Economics and Management, 43, 412-436.
Nam, K. M., Selin, N. E., Reilly, J. M., & Paltsev, S. (2010). Measuring welfare loss caused by air
pollution in Europe: A CGE analysis. Energy Policy, 38, 5059-5071.
Office of Management and Budget (OMB). (1997). Report to Congress on the Costs and Benefits
of Federal Regulations. Executive Office of the President. Retrieved from
https://www.whitehouse.gov/omb/inforeg_chap1.
Ostro, B. D. (1987). Air pollution and morbidity revisited: A specification test. Journal of
Environmental Economics and Management, 14, 87-98.
Palmer, K., Oates, W. E., & Portney, P. R. (1995). Tightening environmental standards: The
benefit-cost or the no-cost paradigm? Journal of Economic Perspectives, 9(4), 119-132.
Palmquist, R. B. (2005). Property value models. In K.G. Mӓler and J. R. Vincent (Eds.), Handbook
of Environmental Economics, Volume 2 (pp. 763-819). Elsevier.
Paltsev, S., & Capros, P. (2013). Cost concepts for climate change mitigation. Climate Change
Economics, 4(S1), 1340003-1-1340003-26.
35
Phaneuf, D. J., & Smith, V. K. (2005). Recreation demand models. In K.G. Mӓler and J. R. Vincent
(Eds.), Handbook of Environmental Economics, Volume 2 (pp. 671-761). Elsevier.
Porter, M. E. (1991). America’s green strategy. Scientific American, 264(4), 168.
Porter, M. E., & van der Linde, C. (1995). Toward a new conception of the environment
competitiveness relationship. Journal of Economic Perspectives, 9(4), 97-118.
Portney, P. R. (1981). The macroeconomic impacts of federal environmental regulation. Natural
Resources Journal, 21, 459- 488.
Repetto, R. D., Rothman, D., Faeth, P., & Austin, D. (1997). Has environmental protection really
reduced productivity? Challenge, 40(1), 46-57.
Rivers, N. (2013). Renewable energy and unemployment: A general equilibrium analysis.
Resource and Energy Economics 35, 467-485.
Rogerson, R. (2015). A macroeconomic perspective on evaluating environmental regulations.
Review of Environmental Economics and Policy, 9(2), 219-238.
Russell, C. S. (1973). Application of microeconomic models to regional environmental quality
management. American Economic Review, 63(2), 236-243.
Rutledge, G. L., Drieling, F. J., & and Dunlap, B. C. (1978). Capital Expenditures by Business for
Pollution Abatement, 1973-77 and Planned 1978. Survey of Current Business, 58(6), 33-38.
Saha, M., & Eckelman, M. J. (2014). Urban scale mapping of concrete degradation from
projected climate change. Urban Climate, 9, 101-114.
Salkever, D. S. (1982). Children’s health problems: Implications for parental labor supply and
earnings. In V. Fuchs (Ed.), Economic Aspects of Health (pp. 221-252). Chicago: University of
Chicago Press.
Schmalansee, R. L., & Stavins, R. N. (2011, March). A guide to economic and policy analysis for the
transport rule. White Paper. Commissioned by Exelon Corporation. Retrieved from
http://www.analysisgroup.com/uploadedfiles/content/insights/publishing/2011_stavinsschmal
ansee_transportrulereport.pdf.
Segal, F. W., & Dunlap, B. C. (1977). Capital expenditures by business for pollution abatement,
1976 and planned 1977,” Survey of Current Business, 57(6), 13-15.
Selin, N. E., et al. (2009). Global health and economic impacts of future ozone pollution.
Environmental Research Letters, 4, 1-9.
36
Shadbegian, R. J., & Gray, W. B. (2005). Pollution abatement expenditures and plant-level
productivity: A production function approach. Ecological Economics, 54, 196-208.
Shadbegian, R. J., & Wolverton, A. (2010). Location decisions of U.S. polluting plants: Theory,
empirical evidence, and consequences. International Review of Environmental and Resource
Economics, 4, 1-49.
Sheriff, G., Ferris, A. E., & Shadbegian, R. J. (2016). How did air quality standards affect
employment and generation at U.S. power plants? The importance of stringency,
implementation, and timing. NCEE Working Paper, #15-01. National Center for Environmental
Economics, U.S. EPA. (Revise and resubmit at Journal of the Association of Environmental and
Resource Economists.)
Smith, V. K. (2012). Reflections: In search of crosswalks between macroeconomics and
environmental economics. Review of Environmental Economics and Policy, 6(2), 298-317.
Smith, V. K. (2015). Should benefit–cost methods take account of high unemployment?
Symposium introduction. Review of Environmental Economics and Policy, 9 (2), 165-178.
Stiglitz, J. E., Sen, A. K., & Fitoussi, J. P. (2009, September). Report by the Commission on the
Measurement of Economic Performance and Social Progress. Commission of inquiry, France.
Tagaris, E., et al. (2009). Potential impact of climate change on air-pollution related human
health effects. Environmental Science and Technology, 43(3), 4979-4988.
The White House. (1993). Executive Order 12866: Regulatory Planning and Review, 58 Fed. Reg.
51735.
U.S. Council on Environmental Quality (U.S. CEQ). (1971). Environmental quality – 1971.
Washington, DC: U.S. Government Printing Office.
U.S. CEQ. (1978). Environmental quality – 1978. Washington DC: U.S. Government Printing
Office.
U.S. CEQ. (1979). Environmental quality – 1979. Washington, DC: U.S. Government Printing
Office.
U.S. CEQ, U.S. Environmental Protection Agency (U.S. EPA), U.S. Department of Commerce.
(1972). The economic impact of pollution control: A summary of recent studies. Retrieved from
https://nepis.epa.gov/Exe/ZyPURL.cgi?Dockey=2000T77Y.txt.
U.S. EPA. (1982). Economic dislocation early warning system: 1980- 1982 quarterly report.
Washington D.C.: U.S. EPA.
37
U.S. EPA. (1997). The benefits and costs of the Clean Air Act, 1970 to 1990. Prepared for U.S.
Congress. Retrieved from https://www.epa.gov/sites/production/files/2015-
06/documents/contsetc.pdf.
U.S. EPA. (1999). The benefits and costs of the Clean Air Act 1990 to 2010. EPA Report to
Congress. Retrieved from http://www.epa.gov/cleanairactbenefits/1990-2010/chap1130.pdf.
U.S. EPA. (2007). Review of the national ambient air quality standards for ozone: Policy
assessment of scientific and technical information. EPA-452/R-07-007. Retrieved from
http://www.epa.gov/ttn/naaqs/standards/ozone/data/2007_07_ozone_staff_paper.pdf.
U.S. EPA. (2010). Guidelines for preparing economic analyses. EPA 240-R-10-001. Retrieved
from https://www.epa.gov/environmental-economics/guidelines-preparing-economic-analyses.
U.S. EPA. (2011). The benefits and costs of the Clean Air Act 1990 to 2020. EPA Report to
Congress. Available at .https://www.epa.gov/clean-air-act-overview/benefits-and-costs-clean-
air-act-1990-2020-second-prospective-study.
U.S. EPA. (2013a). America’s children and the environment, Third edition. EPA 240-R-13-001.
Retrieved from http://www.epa.gov/envirohealth/children/pdfs/ACE3_2013.pdf.
U.S. EPA. (2013b). Integrated science assessment for ozone and related photochemical oxidants.
EPA 600/R-10/076F. Retrieved from
http://ofmpub.epa.gov/eims/eimscomm.getfile?p_download_id=511347.
Vennemo, H. (1997). A Dynamic applied general equilibrium model with environmental
feedbacks. Economic Modeling, 14(1), 99-154.
Walker, W. R. (2011). Environmental regulation and labor reallocation. American Economic
Review, 101(2), 442-47.
Walker, W. R. (2013). The transitional costs of sectoral reallocation: Evidence from the Clean Air
Act and the workforce. Quarterly Journal of Economics, 128(4), 1787-1835.