Embed Size (px)
Citation preview
NCDMV Optimal Location Analysis
Burcu Adivar, PhD
Majed Al-Ghandour, PhD
Daniel Rundell
Tyler Adams
Broadwell College of Business and Economics
Fayetteville State University
1200 Murchison Road
Fayetteville, NC 28301
NCDOT Project 2020-48
FHWA/NC/2020-48
June 2020
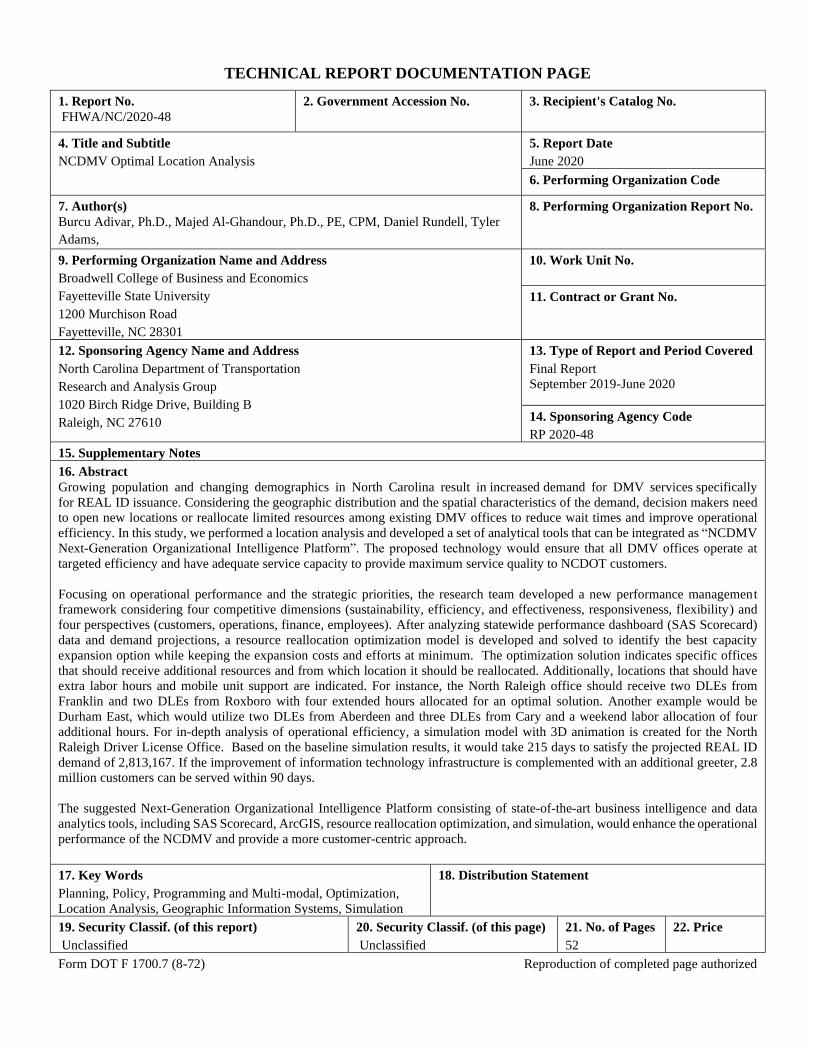
TECHNICAL REPORT DOCUMENTATION PAGE
1. Report No.
FHWA/NC/2020-48
2. Government Accession No. 3. Recipient's Catalog No.
4. Title and Subtitle
NCDMV Optimal Location Analysis
5. Report Date
June 2020
6. Performing Organization Code
7. Author(s)
Burcu Adivar, Ph.D., Majed Al-Ghandour, Ph.D., PE, CPM, Daniel Rundell, Tyler
Adams,
8. Performing Organization Report No.
9. Performing Organization Name and Address
Broadwell College of Business and Economics
Fayetteville State University
1200 Murchison Road
Fayetteville, NC 28301
10. Work Unit No.
11. Contract or Grant No.
12. Sponsoring Agency Name and Address
North Carolina Department of Transportation
Research and Analysis Group
1020 Birch Ridge Drive, Building B
Raleigh, NC 27610
13. Type of Report and Period Covered
Final Report
September 2019-June 2020
14. Sponsoring Agency Code
RP 2020-48
15. Supplementary Notes
16. Abstract
Growing population and changing demographics in North Carolina result in increased demand for DMV services specifically
for REAL ID issuance. Considering the geographic distribution and the spatial characteristics of the demand, decision makers need
to open new locations or reallocate limited resources among existing DMV offices to reduce wait times and improve operational
efficiency. In this study, we performed a location analysis and developed a set of analytical tools that can be integrated as “NCDMV
Next-Generation Organizational Intelligence Platform”. The proposed technology would ensure that all DMV offices operate at
targeted efficiency and have adequate service capacity to provide maximum service quality to NCDOT customers.
Focusing on operational performance and the strategic priorities, the research team developed a new performance management
framework considering four competitive dimensions (sustainability, efficiency, and effectiveness, responsiveness, flexibility) and
four perspectives (customers, operations, finance, employees). After analyzing statewide performance dashboard (SAS Scorecard)
data and demand projections, a resource reallocation optimization model is developed and solved to identify the best capacity
expansion option while keeping the expansion costs and efforts at minimum. The optimization solution indicates specific offices
that should receive additional resources and from which location it should be reallocated. Additionally, locations that should have
extra labor hours and mobile unit support are indicated. For instance, the North Raleigh office should receive two DLEs from
Franklin and two DLEs from Roxboro with four extended hours allocated for an optimal solution. Another example would be
Durham East, which would utilize two DLEs from Aberdeen and three DLEs from Cary and a weekend labor allocation of four
additional hours. For in-depth analysis of operational efficiency, a simulation model with 3D animation is created for the North
Raleigh Driver License Office. Based on the baseline simulation results, it would take 215 days to satisfy the projected REAL ID
demand of 2,813,167. If the improvement of information technology infrastructure is complemented with an additional greeter, 2.8
million customers can be served within 90 days.
The suggested Next-Generation Organizational Intelligence Platform consisting of state-of-the-art business intelligence and data
analytics tools, including SAS Scorecard, ArcGIS, resource reallocation optimization, and simulation, would enhance the operational
performance of the NCDMV and provide a more customer-centric approach.
17. Key Words
Planning, Policy, Programming and Multi-modal, Optimization,
Location Analysis, Geographic Information Systems, Simulation
18. Distribution Statement
19. Security Classif. (of this report)
Unclassified
20. Security Classif. (of this page)
Unclassified
21. No. of Pages
52
22. Price
Form DOT F 1700.7 (8-72) Reproduction of completed page authorized
DISCLAIMER
The contents of this report reflect the views of the author(s) and not necessarily the views of
the University. The author(s) are responsible for the facts and the accuracy of the data
presented herein. The contents do not necessarily reflect the official views or policies of either
the North Carolina Department of Transportation or the Federal Highway Administration at
the time of publication. This report does not constitute a standard, specification, or regulation.
NCDMV OPTIMAL
LOCATION
ANALYSIS
2020
June 27
Prepared by:
Burcu Adivar, Ph.D.
Daniel Rundell
Tyler Adams
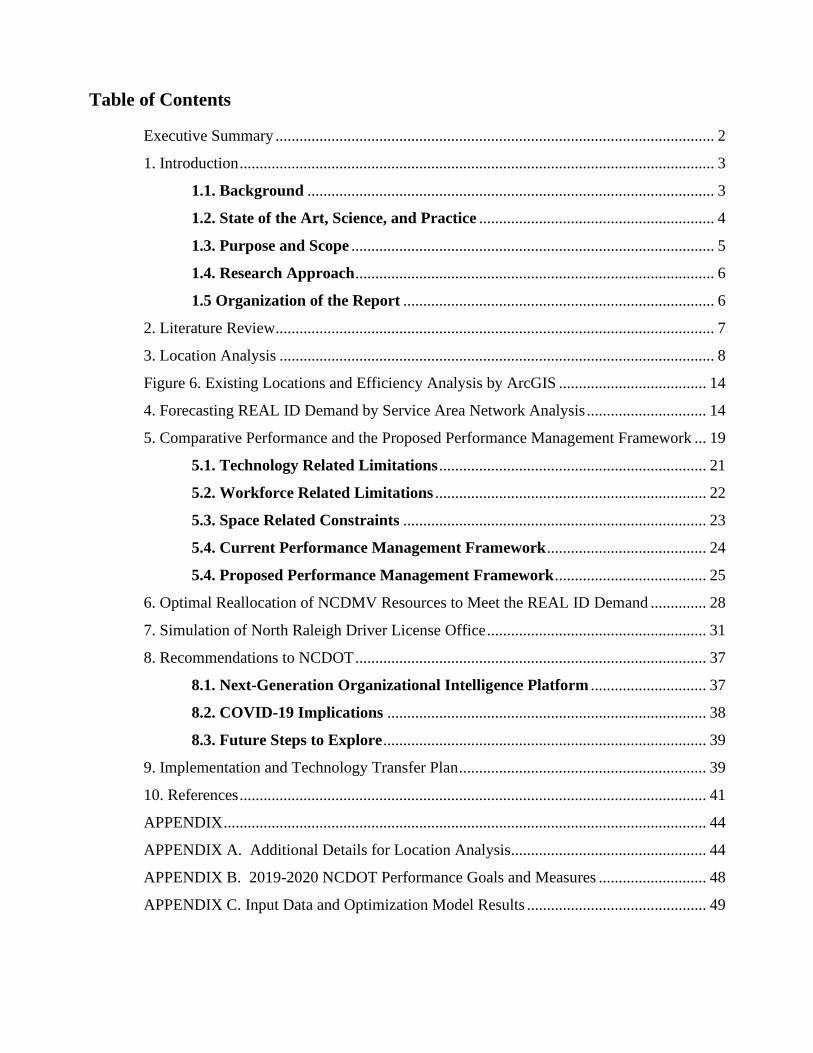
Table of Contents
Executive Summary .............................................................................................................. 2
1. Introduction ....................................................................................................................... 3
1.1. Background ...................................................................................................... 3
1.2. State of the Art, Science, and Practice ........................................................... 4
1.3. Purpose and Scope ........................................................................................... 5
1.4. Research Approach .......................................................................................... 6
1.5 Organization of the Report .............................................................................. 6
2. Literature Review.............................................................................................................. 7
3. Location Analysis ............................................................................................................. 8
Figure 6. Existing Locations and Efficiency Analysis by ArcGIS ..................................... 14
4. Forecasting REAL ID Demand by Service Area Network Analysis .............................. 14
5. Comparative Performance and the Proposed Performance Management Framework ... 19
5.1. Technology Related Limitations ................................................................... 21
5.2. Workforce Related Limitations .................................................................... 22
5.3. Space Related Constraints ............................................................................ 23
5.4. Current Performance Management Framework ........................................ 24
5.4. Proposed Performance Management Framework ...................................... 25
6. Optimal Reallocation of NCDMV Resources to Meet the REAL ID Demand .............. 28
7. Simulation of North Raleigh Driver License Office ....................................................... 31
8. Recommendations to NCDOT ........................................................................................ 37
8.1. Next-Generation Organizational Intelligence Platform ............................. 37
8.2. COVID-19 Implications ................................................................................ 38
8.3. Future Steps to Explore ................................................................................. 39
9. Implementation and Technology Transfer Plan .............................................................. 39
10. References ..................................................................................................................... 41
APPENDIX ......................................................................................................................... 44
APPENDIX A. Additional Details for Location Analysis................................................. 44
APPENDIX B. 2019-2020 NCDOT Performance Goals and Measures ........................... 48
APPENDIX C. Input Data and Optimization Model Results ............................................. 49
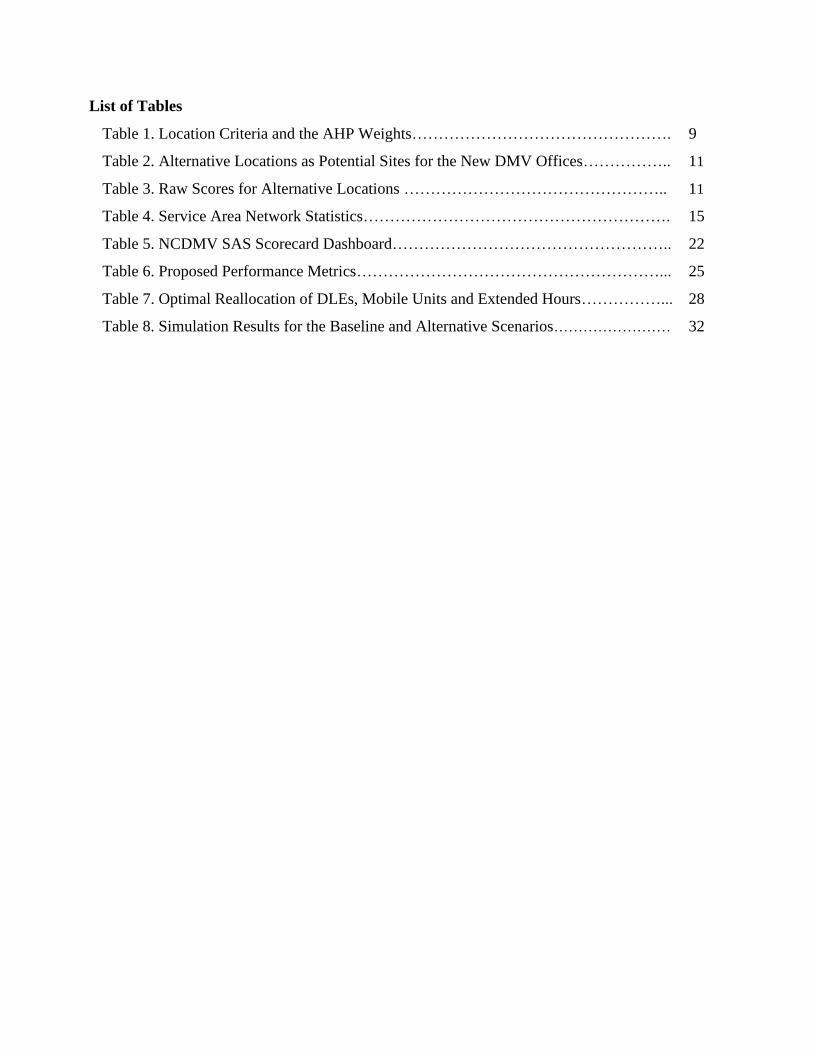
List of Tables
Table 1. Location Criteria and the AHP Weights…………………………………………. 9
Table 2. Alternative Locations as Potential Sites for the New DMV Offices…………….. 11
Table 3. Raw Scores for Alternative Locations ………………………………………….. 11
Table 4. Service Area Network Statistics…………………………………………………. 15
Table 5. NCDMV SAS Scorecard Dashboard…………………………………………….. 22
Table 6. Proposed Performance Metrics…………………………………………………... 25
Table 7. Optimal Reallocation of DLEs, Mobile Units and Extended Hours……………... 28
Table 8. Simulation Results for the Baseline and Alternative Scenarios……………………
32
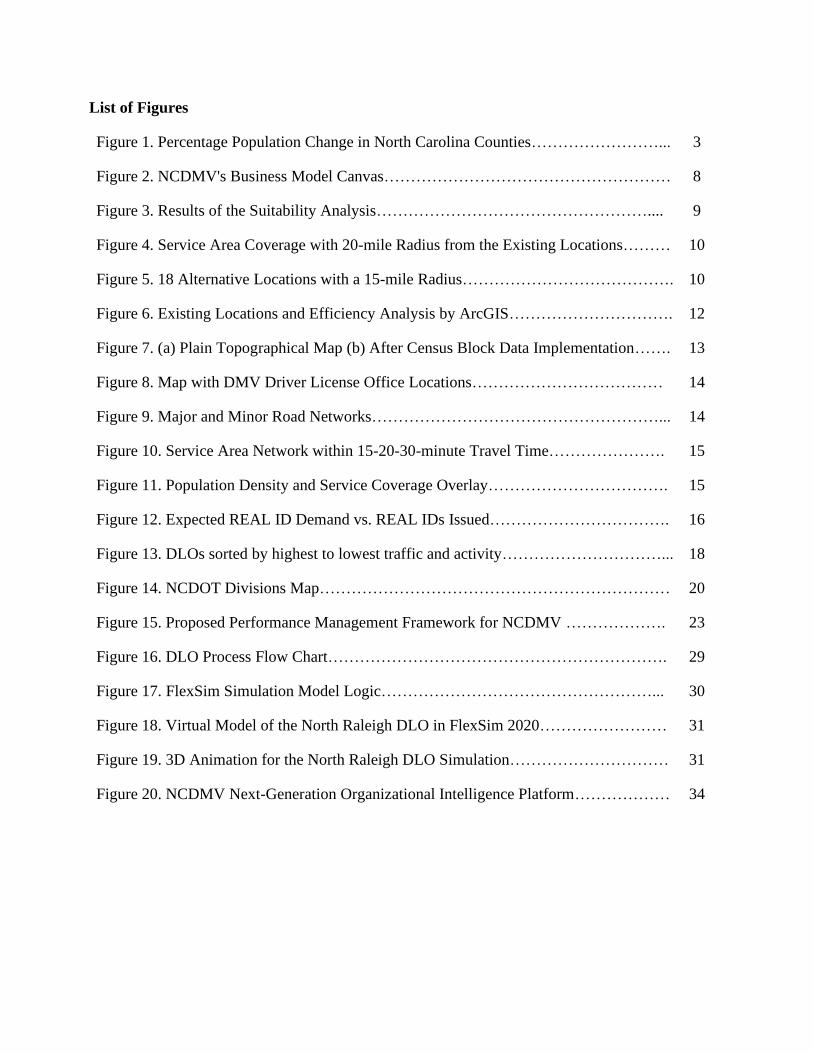
List of Figures
Figure 1. Percentage Population Change in North Carolina Counties……………………... 3
Figure 2. NCDMV's Business Model Canvas……………………………………………… 8
Figure 3. Results of the Suitability Analysis…………………………………………….... 9
Figure 4. Service Area Coverage with 20-mile Radius from the Existing Locations……… 10
Figure 5. 18 Alternative Locations with a 15-mile Radius…………………………………. 10
Figure 6. Existing Locations and Efficiency Analysis by ArcGIS…………………………. 12
Figure 7. (a) Plain Topographical Map (b) After Census Block Data Implementation……. 13
Figure 8. Map with DMV Driver License Office Locations……………………………… 14
Figure 9. Major and Minor Road Networks………………………………………………... 14
Figure 10. Service Area Network within 15-20-30-minute Travel Time…………………. 15
Figure 11. Population Density and Service Coverage Overlay……………………………. 15
Figure 12. Expected REAL ID Demand vs. REAL IDs Issued……………………………. 16
Figure 13. DLOs sorted by highest to lowest traffic and activity…………………………... 18
Figure 14. NCDOT Divisions Map………………………………………………………… 20
Figure 15. Proposed Performance Management Framework for NCDMV ………………. 23
Figure 16. DLO Process Flow Chart………………………………………………………. 29
Figure 17. FlexSim Simulation Model Logic……………………………………………... 30
Figure 18. Virtual Model of the North Raleigh DLO in FlexSim 2020…………………… 31
Figure 19. 3D Animation for the North Raleigh DLO Simulation………………………… 31
Figure 20. NCDMV Next-Generation Organizational Intelligence Platform……………… 34
1
List of Acronyms
AHP: Analytical Hierarchy Process
DLE: Driver License Examiner
DLO: Driver License Office
DMV: Division of Motor Vehicles
NCDMV: North Carolina Division of Motor Vehicles
NCDOT: North Carolina Department of Transportation
PII: Personally Identifiable Information
MCDM: Multi Criteria Decision Making
2
Executive Summary
Growing population and changing demographics in North Carolina result in increased demand for
DMV services specifically for REAL ID issuance. Considering the geographic distribution and the
spatial characteristics of the demand, decision makers need to open new locations or reallocate
limited resources among existing DMV offices to reduce wait times and improve operational
efficiency. In this study, we performed a location analysis and developed a set of analytical tools that
can be integrated as “NCDMV Next-Generation Organizational Intelligence Platform”. The
proposed technology would ensure that all DMV offices operate at targeted efficiency and have
adequate service capacity to provide maximum service quality to NCDOT customers.
Overall, the results suggested Bahama in Durham County as the best location to open a new DMV
office, followed by Gibsonville in Guilford County and Black Mountain in Buncombe County. Prior
to opening new DMV facilities, which would incur very high cost on the State budget, we
recommend NCDMV consider other capacity expansion options such as overtime and overstaffing
at the existing locations until the Federal REAL ID deadline, and increasing DMVs’ operational
performance. The preliminary results of efficiency analysis indicated that 50 facilities have extra
capacity to cover the excess demand faced by an overflowing 29 facilities. Focusing on operational
performance and the strategic priorities, the research team developed a new performance
management framework considering four competitive dimensions (sustainability, efficiency, and
effectiveness, responsiveness, flexibility) and four perspectives (customers, operations, finance,
employees).
After analyzing statewide performance dashboard (SAS Scorecard) data and demand projections, a
resource reallocation optimization model is developed and solved to identify the best capacity
expansion option while keeping the expansion costs and efforts at minimum. The optimization
solution indicates specific offices that should receive additional resources and from which location
it should be reallocated. Additionally, locations that should have extra labor hours and mobile unit
support are indicated. For instance, the North Raleigh office should receive two DLEs from Franklin
and two DLEs from Roxboro with four extended hours allocated for an optimal solution. Another
example would be Durham East, which would utilize two DLEs from Aberdeen and three DLEs from
Cary and a weekend labor allocation of four additional hours. For in-depth analysis of operational
efficiency, a simulation model with 3D animation is created for the North Raleigh Driver License
Office. Based on the baseline simulation results, it would take 215 days to satisfy the projected
REAL ID demand of 2,813,167. If the improvement of information technology infrastructure is
complemented with an additional greeter, 2.8 million customers can be served within 90 days.
The suggested Next-Generation Organizational Intelligence Platform consisting of state-of-the-art
business intelligence and data analytics tools, including SAS Scorecard, ArcGIS, resource
reallocation optimization, and simulation, would enhance the operational performance of the
NCDMV and provide a more customer-centric approach.
3
1. Introduction
Growing population and changing demographics in North Carolina have resulted in increased
demand for transportation services. Improving tax-payers' ability to utilize the transportation network
of the state through the creative application of powerful technologies has been the focus of the North
Carolina Department of Transportation (NCDOT). The NC Transportation Innovation Council (NC-
TIC) is concerned with fostering an organizational culture of collaboration that identifies and
implements meaningful innovations to deliver efficient solutions to the public with modern and high-
quality deliverables. Rapid implementation of technology, tactics, and techniques regarding
transportation programs and all levels of state government is a primary goal of NC-TIC (NC-TIC,
2020).
The North Carolina Division of Motor Vehicles (NCDMV) administers and enforces laws regulating
the operation of vehicles or the use of highways; and issues commercial and personal drivers' licenses,
registers vehicles, and suspends or revokes drivers' licenses. The NCDMV's mission is “to deliver
quality customer support through professional driver and motor vehicle services while promoting
highway safety and protecting accurate and secure information.1” The reinforcement of the Federal
REAL ID Act, which requires a REAL ID, US passport or another federally approved identification
to board commercial flights and enter secure federal buildings, is posing a challenge to NCDMV to
adhere to the federal requirements by satisfying the demand for NC REAL ID in all parts of the state
including urban and rural areas. In 2018, NCDMV initiated a collaboration with Fayetteville State
University to locate enough site locations to handle the increased workload by October 2020. This
project provides analysis tools for decision-makers to assess the need to open new locations, or to
reallocate the existing resources among existing DMV locations for improved operational efficiency
and customer experience.
Measuring and evaluating the operational efficiency of existing DMV facilities requires analytic
techniques that rely on mathematical programming and simulation. In this project, an integrated
framework is developed to ensure that all DMV offices operate at targeted performance levels and
have adequate service capacity to provide maximum service quality to NCDOT
customers. Specifically, GIS-based data mining and optimization model to allocate available excess
capacity to locations with insufficient capacity have been developed. The project outcome provides
an implementable solution that will balance the workload between high-volume and low-volume
driver license offices.
1.1. Background
The NCDMV has 114 driver license offices and 130 privately operated license plate agencies and
registration offices to serve the state's 10.5 million residents (2019 Census Data). As of 2019, the
state of North Carolina is among the top eight states with 7.6 million licensed drivers that own or
operate 9.3 million registered vehicles. With the third-highest migration rate of 7.9% (the difference
of in-migration and outmigration per 1,000 residents), the North Carolina population is increasing by
334 every day or 2,342 people every week, which increases the demand for DMV services. However,
geographic distribution and the spatial characteristics of the population poses additional challenges
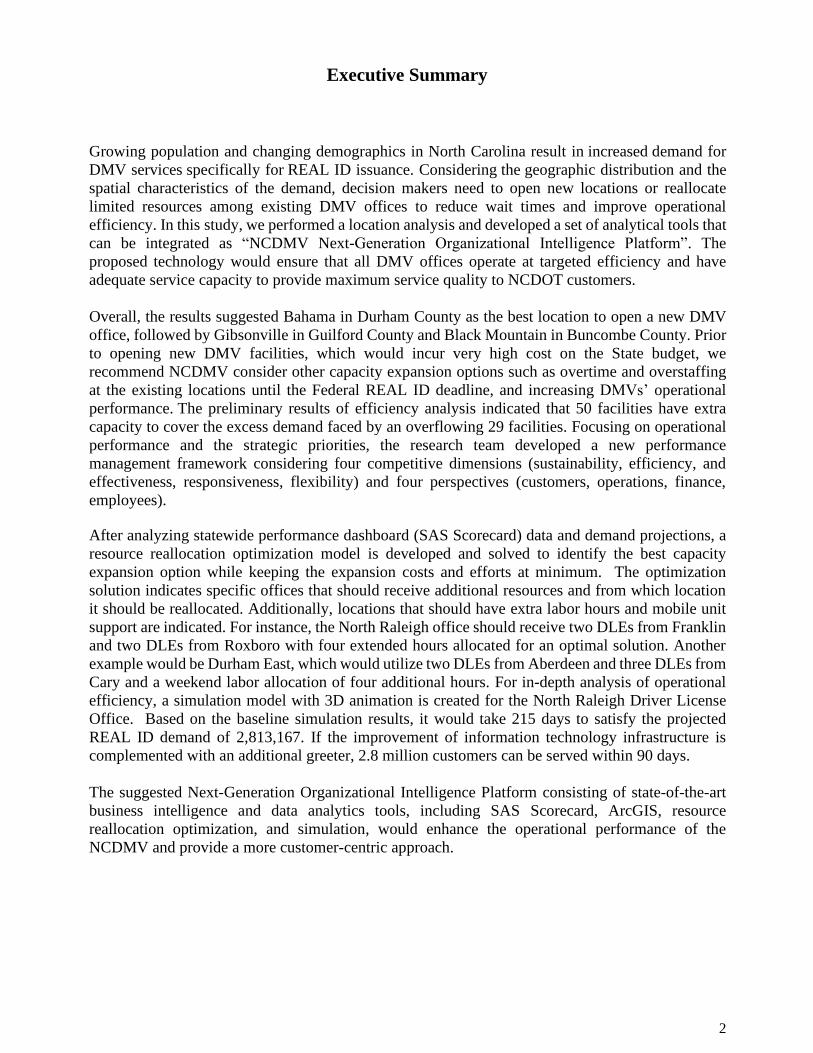
for efficient allocation of resources. Figure 1 presents the population changes between 2010 and 2017.
1 https://www.nc.gov/agency/motor-vehicles-division
4
Figure 1. Percentage Population Change in North Carolina Counties, April 1, 2010-July 1, 2017
The North Carolina Department of Transportation (NCDOT) is concerned about a very steep demand
regarding REAL ID issuance in relation to the rapidly approaching Federally mandated deadline of
October 2020. REAL ID is a form of identification that is validated by specially trained Driver
License Examiners after the presentation of supporting documentation such as birth certification,
Social Security card, marriage certificate, etc. in person at the DMV offices during normal business
hours. The REAL ID (Gold Star) may be applied to any of the NC credentials below if requested by
the applicant with the appropriate REAL ID qualifying documents, i.e., birth certificate, U.S.
Passport, Social Security Card, marriage certificate (if applicable) and two forms of proof of
residency (physical address); as well as any other document requirements relative to the specific NC
credential of interest, i.e., proof of insurance for a driver license. Due to the surge in REAL ID
demand, NCDMV constantly evaluates demand for its services and may offer extended hours (7-5
pm), and/or Saturday hours (8-12 pm) as needed. Note that the first REAL ID issuance is not an
online transaction and requires an in-person application.
1.2. State of the Art, Science, and Practice
In our current study, we developed an integrated approach for selecting the optimal NCDMV driver
license locations using expert knowledge, data mining, Analytic Hierarchy Process (AHP),
Geographical Information System (GIS), and Maximal Covering Location Problem (MCLP). The
previous approach (Figure 5) identifies the two-level location criteria through experts' input as part
of the AHP process, yielding demographic attributes, flexibility, efficiency, cost, and access to public
facilities. Following the weight assessment for all criteria and sub-criteria, normalized weights are
used for location suitability analysis in ArcGIS. Based on our projections for the demand and related
geospatial data, alternative DMV locations are determined and visualized through ArcGIS. Finally,
the alternative locations are evaluated by AHP weights, and the multicriteria location selection
problem is optimized to maximize the coverage across the state.
In alignment with NCDOT's mission and goals, the broad impact of this project will be greater
customer service and effective and efficient use of DMV facilities. Short term impacts of the project will be:
• improving customer service by alleviating the long-waiting lines and insufficient
capacity to meet the demand for REAL ID.
• optimizing capacity expansion decisions
5
• allocating mobile capacity to high-demand locations
• ensuring efficient use of limited resources and accountability
Long term-impacts (after REAL ID issue is over)
• provision of necessary service capacity in anticipation of positive or negative population
growth in different areas
• adoption of potential future changes in the service characteristics such as offering online
driver license services, issuing drone licenses, or other future services
The main output of the project is the "NCDMV Next-Generation Organizational Intelligence
Platform," which is an integrated, real-time business analytics module with four components: A new
SAS Scorecard System with web and ArcGIS connectivity to share real-time wait time statistics with
the public; an optimization and simulation component; a SAS-based optimization model that
maximizes the efficiency and minimizes the total effort to optimally allocate the operational capacity
of the existing DMV facilities; and an ArcGIS map with SAS-link displaying live metrics from an
organizational intelligence perspective. Each component provides an implementable solution that will
balance the workload among all DLOs. The proposed methodology would optionally be integrated
with NCDOT's analytics system for periodic use.
1.3. Purpose and Scope
The overall objective of this study is to conduct location analysis for potential new DMV facilities
and analyze the resource reallocation potential to improve the efficiency of the existing Driver
License Offices (DLOs). The specific objectives are as follows:
1. Forecast demand for REAL ID and assess the true service capacity of the selected DLOs
2. Determine capacity gaps and thresholds to achieve the target efficiency level
3. Develop a GIS and simulation-based optimization model to allocate available excess capacity
to locations with insufficient capacity
4. Make recommendations regarding the opening of new DMV offices
The motivation of this research effort is the reduction of increased costs associated with new facility
creation by utilizing existing resources and personnel to address a steep demand by the October 2020
date that was rapidly approaching. NC DMV had no accurate measure of the quantity of people that
would potentially require REAL ID, which tied into not being able to accurately forecast daily
demand levels, but also posed a real problem when it came to measuring their performance-to-date.
In order to accurately measure these core and critical metrics, an accurate analysis had to be
performed to assess the real demand that existed in the state.
This approach was critical because it not only reduced the amount of tax-payer money spent, but it
was also a more rapid response than the creation of new facilities. Preliminary location analysis
revealed that suggested alternative locations for new DMV offices were already within proximity to
existing REAL ID issuance service areas. Small adjustments, such as adding an additional employee
to assist with the documentation verification, were shown to vastly improve the speed of service for
customers throughout an entire day of operations. This led to the conclusion that a deeper evaluation
of the existing format of license offices could potentially yield greater gains. Furthermore, there was
already a system in place for requesting additional personnel from other facilities. What NC DMV
lacked was a way to strategically assess where personnel should be shifted in anticipation of demand,
to be more proactive and less reactive, and a cost-effective method for analyzing various office
layouts and strategies.
6
The over-arching goal was to create a variety of useful assessment and analysis tools for NCDMV so
that they may address forecasted fluctuations in demand with agility. These tools would include a
GIS model of service areas combined with population densities that could be linked with SAS via
NCDMV's IT department, an algebraic optimization model for aggregate planning, and a 3D
simulation that would allow for low-cost evaluation of various operational designs in a license issuing
office.
One of the initial challenges was to obtain relevant data for exploration that could potentially yield
meaningful insights to address the problem of severely high demand. This goal transformed into
how to obtain data without the assistance of NC DMV. There simply was not a proper system in
place for the reasonable delivery of data in a timely manner. This challenge was overcome by using
publicly available census data to analyze demand. This was performed with ArcGIS software with
datasets that included major and minor road networks and current office locations' latitude and
longitude.
1.4. Research Approach
The first step of this project includes location analysis to locate potential new locations for Driver
License Offices (DLOs) to be opened. For location analysis, expert knowledge, and a multicriteria
decision-making approach is utilized. The next step was demand forecasting using spatial network
analysis in ArcGIS. Given the demand projections, the following step is the analysis of the operational
characteristics (working hours, number of customers served, number of workstations, number of
driver license examiners, process rates, etc.) and performance metrics of the NC DMV Driver License
Offices. The project team developed a streamlined performance management framework for
NCDMV in line with the DOT REPORT program. Analysis of the current capacity and productivity
measures for each existing facility and capacity gap is assessed, and DLOs are classified as high
volume or low volume. Based on the capacity cap assessment, a mixed-integer network optimization
model was constructed to select the best capacity expansion option(s) for facilities with insufficient
capacity while keeping the expansion and reallocation costs and efforts to a minimum. Note that
capacity expansion options may include technology investments, personnel reallocation, transfer of
mobile units, adding new physical locations, or overtime. Finally, a discrete-event simulation model
with 3D animation is developed to assess the impact of the potential changes not limited to suggested
optimal reallocations solutions.
Specific research tasks include:
• Determine data requirements and data availability • Data collection and processing • Demand forecasting and analysis of service area coverage • Mathematical programming to optimize resource reallocation • Simulation modeling
1.5 Organization of the Report
This report is organized as follows. The next section reviews the literature followed by location
analysis to determine alternative locations for the new DMV facilities, specifically, Driver License
Offices. Section 4 covers demand forecasting by service area network analysis. Section 5 discusses
technology, workforce, and space-related limitations while comparing the operational performance
of DLOs and presents a new performance management framework for NCDMV. Section 6 covers
the optimal resource reallocation model, followed by the simulation model presented in Section 7.
7
The project team's recommendations, including the "NCDMV Next-Gen Organizational Intelligence
Platform," COVID-19 implications, and future work, are presented in Section 8. The Implementation
and Technology Transfer Plan presented in section 9 concludes the report.
2. Literature Review
One of the oldest problems facing organizations in marketing and operations management is where
to locate organizations (Stevenson, Hojati, and Cao 2007). The location decision is strategic with long
term impact on an organization's capacity to serve its market and maximize benefits to the
organization. Although globalization and emerging technologies, such as online transactions, change
the way location decisions are made by many organizations, these factors have made location
decisions even more important for service organizations, including NCDOT. A typical location
decision involves identifying the market to be served by the facility, searching for potential locations,
and then selecting the best site.
From the earliest research (Hoover 1937; Czamanski 1981), location relative to customers has been
identified as the central decision for many industries, including retailing (Reynolds and Wood 2010).
Methods and technologies for doing so have become increasingly sophisticated and are essential to
today's largest retailers as they select locations (Hernández and Bennison 2000). While most studies
on location decisions are theoretical with a major focus on cost factors, Karakaya and Canel (1998)
provide empirical evidence to determine the importance of various location-related variables for
different industries (manufacturing, retail, banking, insurance, and consulting) and for different
company sizes. Even small and moderately sized retail firms are often familiar with basic location
techniques and are increasingly using geographic information systems (GIS) to support their decision-
making, although they may not be able to afford the more sophisticated methods such as neural
networks and expert systems (Reynolds and Wood 2010). The most advanced location analysis
techniques are usually employed by high-tech, energy and manufacturing industries with an emphasis
on the forward facility location problem (Clark and Rowley 1995; Ghadge, Yang, Caldwell, Koenig
and Tiware 2016; Seyedhosseini, Makui, Shahangaghi and Torkestani 2016; Torkestani,
Seyedhosseini, Makui and Shahanaghi 2016). Typical focus on customer demographics and specific applications of facility location problems are
studied by Clarke and Rowley, 1995; Clarke et al. 2003; Ghosh and McLafferty, 1987; Laulajainen,
R., & Stafford, H., 1995. The literature on location analysis of nonprofits and government facilities
remains an open area (Sirinesa and Shnoer, 2018). A study by Walton, Wallace, & Martin (2015)
explores the requirements for REAL ID by presenting the eight REAL ID requirements,
recommendations for implementation, personally identifiable information (PII) security, training
requirements, and review of compliant states and their methods. A more recent article by Martin et
al. (2018) presents a nationwide comparative study of DMV service operations with a focus on
improvements in productivity and service quality. The authors used a mixed-methods approach,
including surveys and Data Envelopment Analysis, which resulted in best practices and the highest
efficiency achieved by DMV offices in Minnesota, Texas, Indiana, and Ohio.
To gain an understanding of potential optimization models that could assist with responding to
demand, an article covering D-level nested logit models with random utility and maximization
equivalent to elimination by aspects was reviewed (Li, Rusmevichientong, and Topaloglu, 2014).
Additional articles reviewed included: 1. Another study by Sumida et al. (2016) generates candidate
assortments that guarantee the inclusion of optimal solutions to balance cost and utility in an
assortment optimization setting under the multinomial logit model. 2. Capacity Constrained
Assortment Optimization under the Markov Chain based Choice Model, which utilized an assortment
8
optimization model that leverages the Markov Chain based choice model and "local-ratio" paradigm
to allow the transformation of non-linear function into a linear function (Goyal, Segev, & Ye, 2015).
3. Near-Optimal Algorithms for the Assortment Planning Problem under Dynamic Substitution and
Stochastic Demand, an efficient algorithm with a near-optimal performance that guarantees for
assortment planning problems, useful for optimizing assortments of services, equipment, and
personnel (Goyal & Segev, 2016). Ultimately the optimization models reviewed were overly
complex based on the aggregate planning that needed to be addressed. However, they were highly
informative and assisted with understanding the dynamics of a service planning problem.
In recent years, NCDOT has made great strides in improving the tax-payer ability to utilize the
transportation network of North Carolina through the creative application of powerful technologies.
Recent efforts have been initiated to invest in resources for sustainable transportation, and a
commission has been formed to offer recommendations for the modernization of transportation
revenues (NCDOT FIRST Commission, 2019). The NC Transportation Innovation Council (NC-
TIC) is concerned with fostering an organizational culture of collaboration that identifies and
implements meaningful innovations to deliver efficient solutions to the public with modern and high-
quality deliverables. Rapid implementation of technology, tactics, and techniques with regard to
transportation programs and all levels of state government is a primary goal of NC-TIC (NC-TIC,
2020). This is in alignment with the goal of this research, which is to utilize existing resources instead
of wasting time, money, and resources that would inherently be in opposition to environmental
sustainability.
In a joint effort with NCDOT and JMP, lean six sigma, data analysis, and Monte Carlo simulation
methods are used to improve customer experience by minimizing wait times, which was reported to
be more than 30 minutes (JMP Customer Story, 2017). The team used JMP software to determine
the potential causes for excessive wait times and identify which causes were most significant. Simio
was used to develop the simulation model to determine optimum staffing. The results suggested that
an additional 13 examiners at the high-volume driver license offices were optimal.
According to 2017-2018 NCDOT customer service survey results (Findley et al., 2018), 38% of
2,300+ respondents reported that they visited a Driver License Office in the past year. The top five
most important factors that influenced which DMV office North Carolinians chose to visit are
reported to be the location (86% of the respondents); shorter wait times (25%); previous experience
(20%); the attitude of employees/customer service (15%) and hours of operation (11%).
All these studies and NCDOT documentation helped the project team to better execute the primary
goals of the project. Instead of only providing a general idea of the knowledge landscape, it provided
crucial elements in the pursuit to reduce wait times and increase REAL ID issuance.
3. Location Analysis
In this section, we present the results of Expert Knowledge and Evidence-Based Location
Methodology (Appendix Figure 1), developed by Glackin and Adivar (2019). This framework
structures the location decision by combining current business model search techniques with
underlying lean startup methods and an overall analytical framework for location analysis. We
implement the Factor Rating Method (FRM) as a multicriteria decision-making (MCDM) tool which
uses multiple location factors and their weights to evaluate alternative locations. AHP is applied to
calculate weights for sixteen key factors that emerged from the third iteration of the NVDMV's
Business Model Canvas. The AHP method developed by Saaty (1994) helps with determining factor
9
weights by assigning a score to each factor or criteria according to the decision-makers pairwise
comparisons with the other factor or criteria.
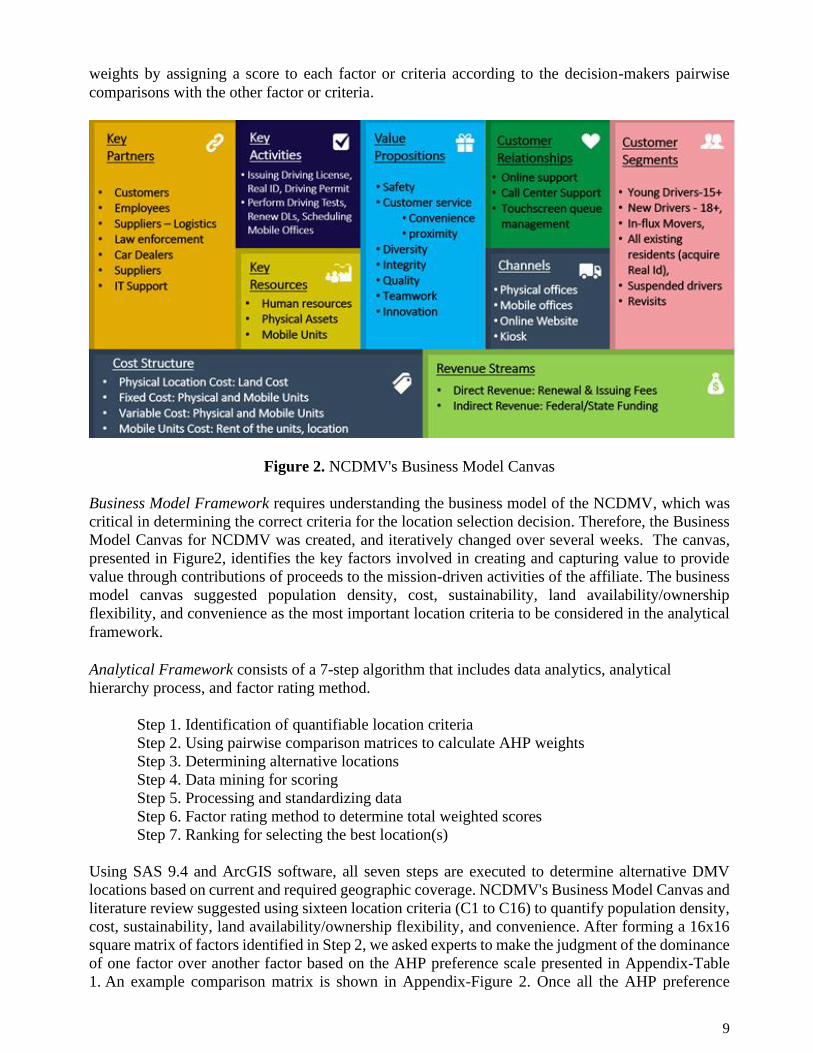
Figure 2. NCDMV's Business Model Canvas
Business Model Framework requires understanding the business model of the NCDMV, which was
critical in determining the correct criteria for the location selection decision. Therefore, the Business
Model Canvas for NCDMV was created, and iteratively changed over several weeks. The canvas,
presented in Figure2, identifies the key factors involved in creating and capturing value to provide
value through contributions of proceeds to the mission-driven activities of the affiliate. The business
model canvas suggested population density, cost, sustainability, land availability/ownership
flexibility, and convenience as the most important location criteria to be considered in the analytical
framework.
Analytical Framework consists of a 7-step algorithm that includes data analytics, analytical
hierarchy process, and factor rating method.
Step 1. Identification of quantifiable location criteria
Step 2. Using pairwise comparison matrices to calculate AHP weights
Step 3. Determining alternative locations
Step 4. Data mining for scoring
Step 5. Processing and standardizing data
Step 6. Factor rating method to determine total weighted scores
Step 7. Ranking for selecting the best location(s)
Using SAS 9.4 and ArcGIS software, all seven steps are executed to determine alternative DMV
locations based on current and required geographic coverage. NCDMV's Business Model Canvas and
literature review suggested using sixteen location criteria (C1 to C16) to quantify population density,
cost, sustainability, land availability/ownership flexibility, and convenience. After forming a 16x16
square matrix of factors identified in Step 2, we asked experts to make the judgment of the dominance
of one factor over another factor based on the AHP preference scale presented in Appendix-Table
1. An example comparison matrix is shown in Appendix-Figure 2. Once all the AHP preference
10
values were assigned, weights for the location criteria were obtained. Overall, the most important
criteria were found to be C1 – population density (14.55%), C13 – proximity to shopping malls
(14.28%), and C16 – proximity to highways (11.77%). The location criteria and the corresponding
AHP weights that have been used in the remainder of the study are presented in Table 1.
Table 1. Location Criteria and the AHP Weights Index Location Criteria Weight
C1 Population density of the county (15+) 0.1455
C2 Cost of living 0.0556
C3 Housing rent 0.0303
C4 Housing value 0.0154
C5 County overall tax rates (sales) 0.0128
C6 All transit performance score 0.0732
C7 Natural disaster index 0.0179
C8 Unemployment 0.0259
C9 Recent job growth (over the past year) 0.0681
C10 Future job growth (over the next 10 years) 0.0760
C11 Clean energy index 0.0117
C12 Number of companies with 500+ employees (2011) 0.0595
C13 Proximity to shopping malls 0.1428
C14 Proximity to hospitals 0.0536
C15 Proximity to universities 0.0939
C16 Proximity to highways 0.1177
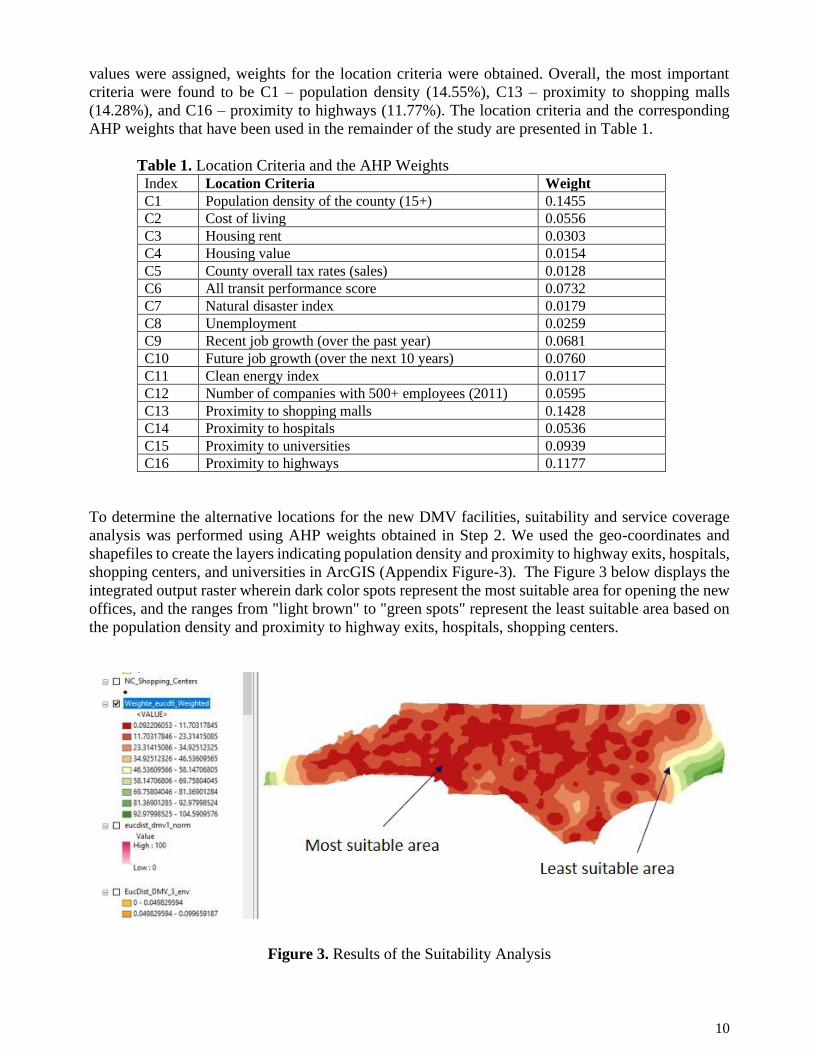
To determine the alternative locations for the new DMV facilities, suitability and service coverage
analysis was performed using AHP weights obtained in Step 2. We used the geo-coordinates and
shapefiles to create the layers indicating population density and proximity to highway exits, hospitals,
shopping centers, and universities in ArcGIS (Appendix Figure-3). The Figure 3 below displays the
integrated output raster wherein dark color spots represent the most suitable area for opening the new
offices, and the ranges from "light brown" to "green spots" represent the least suitable area based on
the population density and proximity to highway exits, hospitals, shopping centers.
Figure 3. Results of the Suitability Analysis
11
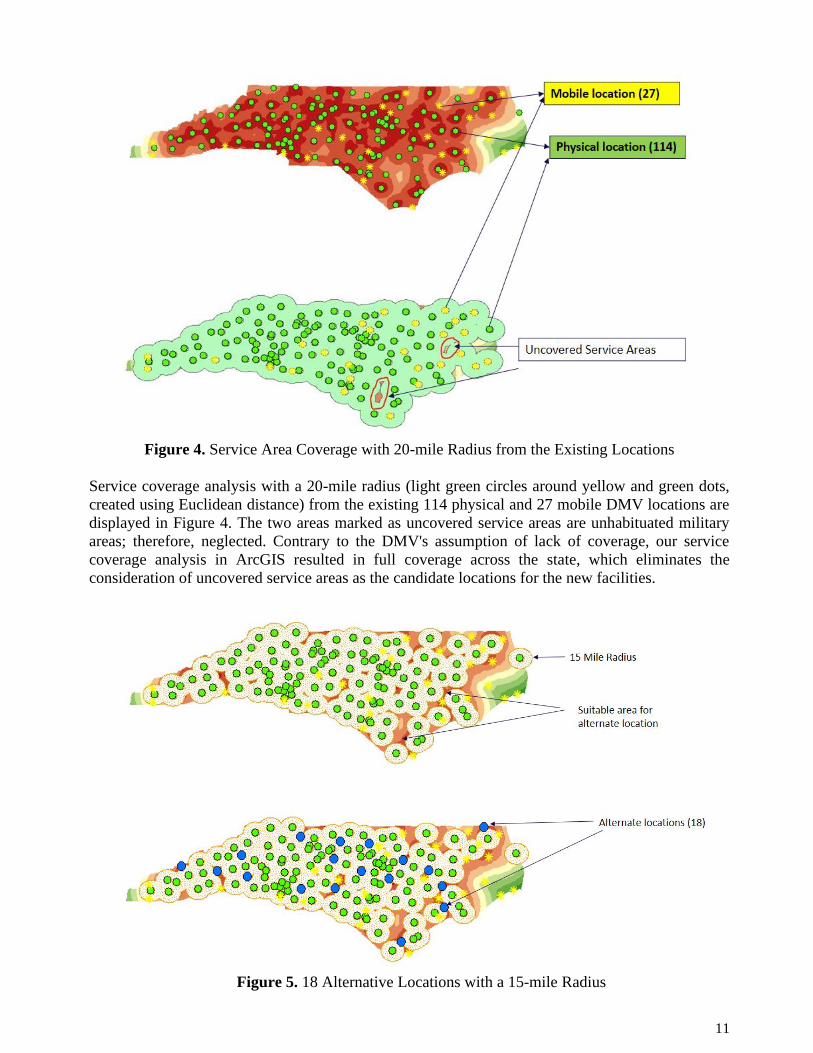
Figure 4. Service Area Coverage with 20-mile Radius from the Existing Locations
Service coverage analysis with a 20-mile radius (light green circles around yellow and green dots,
created using Euclidean distance) from the existing 114 physical and 27 mobile DMV locations are
displayed in Figure 4. The two areas marked as uncovered service areas are unhabituated military
areas; therefore, neglected. Contrary to the DMV's assumption of lack of coverage, our service
coverage analysis in ArcGIS resulted in full coverage across the state, which eliminates the
consideration of uncovered service areas as the candidate locations for the new facilities.
Figure 5. 18 Alternative Locations with a 15-mile Radius
12
After simulating various radius values for the service area coverage analysis in ArcGIS, the
project team observed that the 15-mile proximity in Euclidean distance offers more convenience for
the customers and delivers the best results for finding new locations. Service area coverage analysis
with a 15-mile radius resulted in 18 areas that are not covered, therefore constituting alternative
locations to open new DMV driver license offices. Figure 5 displays visualization through ArcGIS, in
which the new alternative locations (blue dots) overlaid with a 15-mile service area around the
existing locations. Note that "yellow asterisks" represent current mobile locations (27), and green
dots represent the existing DMV offices (114).
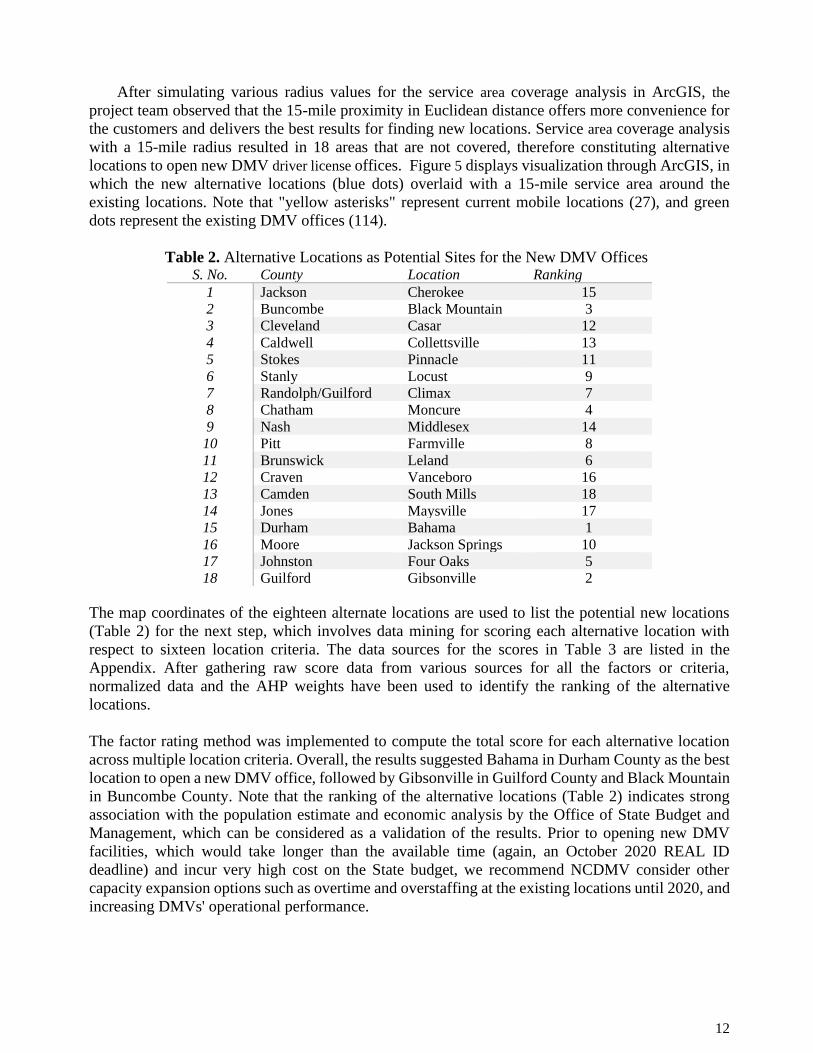
Table 2. Alternative Locations as Potential Sites for the New DMV Offices S. No. County Location Ranking
1 Jackson Cherokee 15
2 Buncombe Black Mountain 3
3 Cleveland Casar 12
4 Caldwell Collettsville 13
5 Stokes Pinnacle 11
6 Stanly Locust 9
7 Randolph/Guilford Climax 7
8 Chatham Moncure 4
9 Nash Middlesex 14
10 Pitt Farmville 8
11 Brunswick Leland 6
12 Craven Vanceboro 16
13 Camden South Mills 18
14 Jones Maysville 17
15 Durham Bahama 1
16 Moore Jackson Springs 10
17 Johnston Four Oaks 5
18 Guilford Gibsonville 2
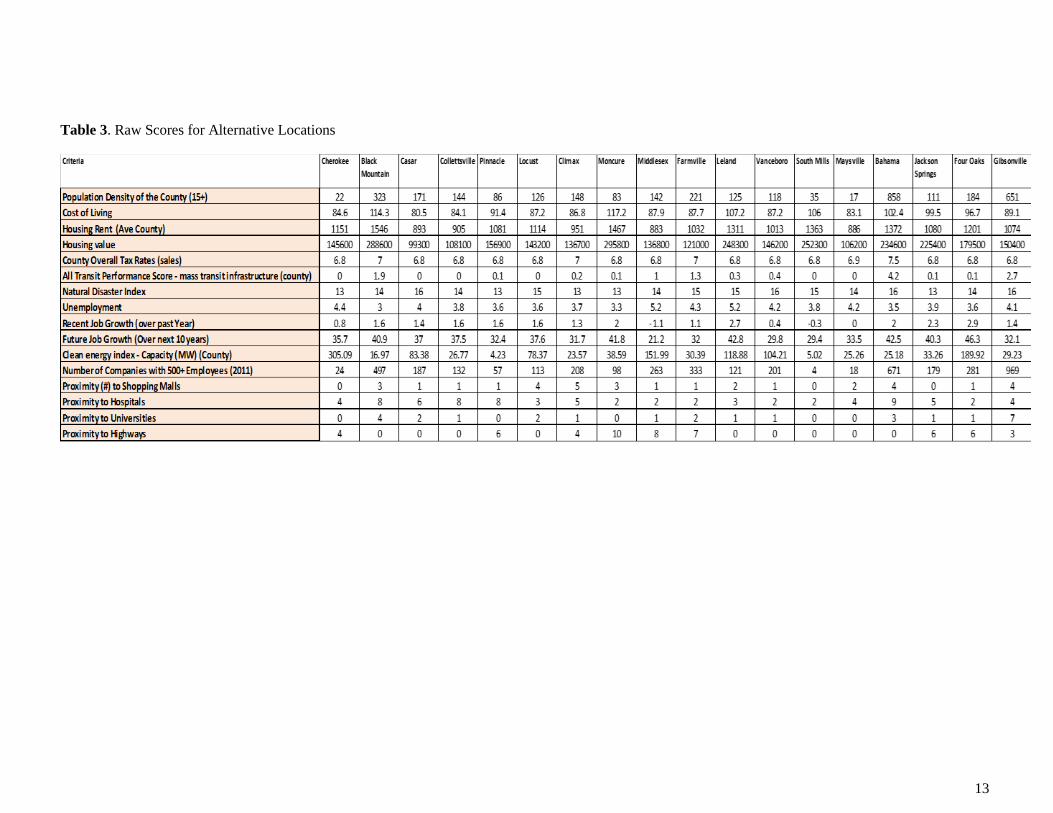
The map coordinates of the eighteen alternate locations are used to list the potential new locations
(Table 2) for the next step, which involves data mining for scoring each alternative location with
respect to sixteen location criteria. The data sources for the scores in Table 3 are listed in the
Appendix. After gathering raw score data from various sources for all the factors or criteria,
normalized data and the AHP weights have been used to identify the ranking of the alternative
locations.
The factor rating method was implemented to compute the total score for each alternative location
across multiple location criteria. Overall, the results suggested Bahama in Durham County as the best
location to open a new DMV office, followed by Gibsonville in Guilford County and Black Mountain
in Buncombe County. Note that the ranking of the alternative locations (Table 2) indicates strong
association with the population estimate and economic analysis by the Office of State Budget and
Management, which can be considered as a validation of the results. Prior to opening new DMV
facilities, which would take longer than the available time (again, an October 2020 REAL ID
deadline) and incur very high cost on the State budget, we recommend NCDMV consider other
capacity expansion options such as overtime and overstaffing at the existing locations until 2020, and
increasing DMVs' operational performance.
13
Table 3. Raw Scores for Alternative Locations
14
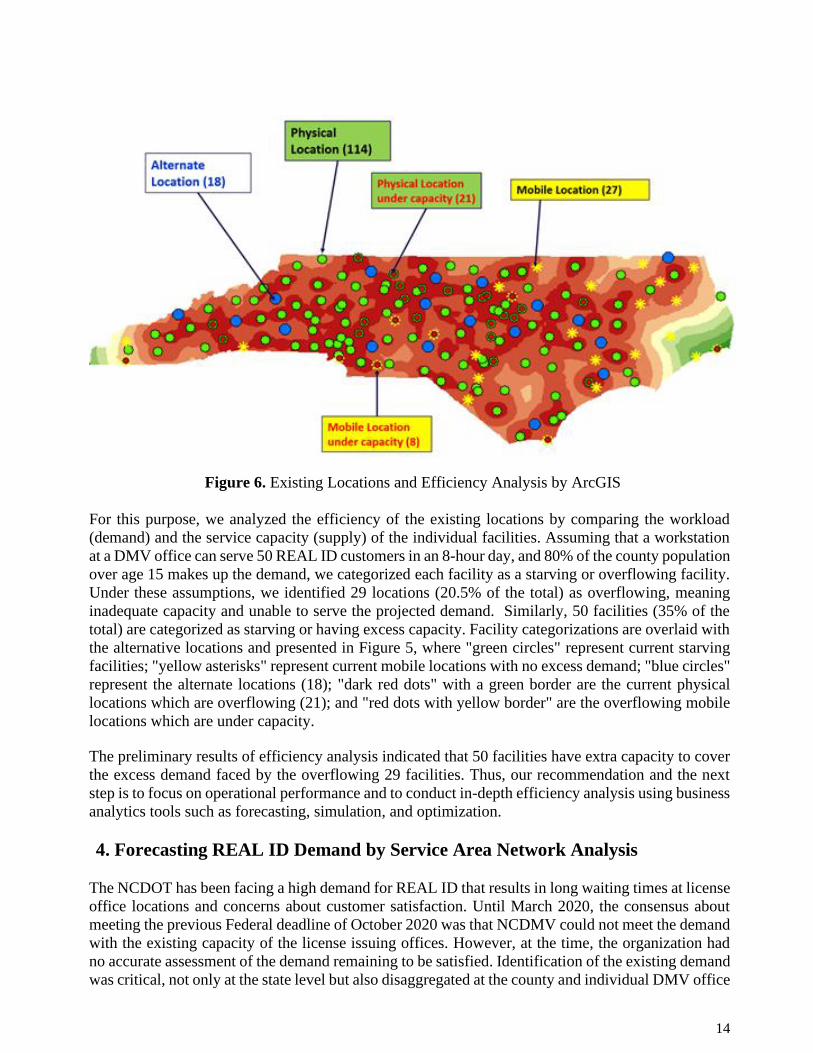
Figure 6. Existing Locations and Efficiency Analysis by ArcGIS
For this purpose, we analyzed the efficiency of the existing locations by comparing the workload
(demand) and the service capacity (supply) of the individual facilities. Assuming that a workstation
at a DMV office can serve 50 REAL ID customers in an 8-hour day, and 80% of the county population
over age 15 makes up the demand, we categorized each facility as a starving or overflowing facility.
Under these assumptions, we identified 29 locations (20.5% of the total) as overflowing, meaning
inadequate capacity and unable to serve the projected demand. Similarly, 50 facilities (35% of the
total) are categorized as starving or having excess capacity. Facility categorizations are overlaid with
the alternative locations and presented in Figure 5, where "green circles" represent current starving
facilities; "yellow asterisks" represent current mobile locations with no excess demand; "blue circles"
represent the alternate locations (18); "dark red dots" with a green border are the current physical
locations which are overflowing (21); and "red dots with yellow border" are the overflowing mobile
locations which are under capacity.
The preliminary results of efficiency analysis indicated that 50 facilities have extra capacity to cover
the excess demand faced by the overflowing 29 facilities. Thus, our recommendation and the next
step is to focus on operational performance and to conduct in-depth efficiency analysis using business
analytics tools such as forecasting, simulation, and optimization.
4. Forecasting REAL ID Demand by Service Area Network Analysis
The NCDOT has been facing a high demand for REAL ID that results in long waiting times at license
office locations and concerns about customer satisfaction. Until March 2020, the consensus about
meeting the previous Federal deadline of October 2020 was that NCDMV could not meet the demand
with the existing capacity of the license issuing offices. However, at the time, the organization had
no accurate assessment of the demand remaining to be satisfied. Identification of the existing demand
was critical, not only at the state level but also disaggregated at the county and individual DMV office
15
level. Detailed data was not available from the organization; therefore, the project team resorted to
data mining and forecasting methods utilizing publicly available census data. The issue remained:
How to separate aggregate statewide census data and transform it into REAL ID demand that was
localized by the individual office?
To extract the population data that was relevant to the NCDMV, a platform that could identify the
demand for each office was required. Each REAL ID issuing office had to be plotted via latitude and
longitude, and the surrounding population needed to be assigned in reasonable segments to each
office. Considering NCDOT's value proposition for convenience and the service coverage
requirements of the NCDMV, the most viable solution was to use GIS technology, specifically ESRI
ArcGIS (McCoy and Johnston, 2005). ArcGIS is a Geographic Information System (GIS) designed
to work with data-rich maps and geographic information maintained by the Environmental Systems
Research Institute (ESRI). GIS technology is an important tool for transportation (Thill, 2000) and
many other industries (see http://www.esri.com/industries.html) to analyze and visualize spatial data
to explore relationships, patterns, and trends. Spatial queries, map overlay, proximity calculations,
buffer analysis, geostatistical techniques, raster analysis, network analytics, and space-time dynamics
are the most common tools for spatial analysis (Mitchell, 1999). ArcGIS has multiple options for
modeling spatial relationships. These options include Euclidean distance, inverse distance, fixed
distance, Delaunay triangulation, travel time, and travel distance based on a real road network. The
Euclidean distance was the option used to conduct the location analysis presented in the previous
section. Since the traffic conditions or the physical landscape can dramatically change, the actual
driving time and distance use of the actual travel times - rather than Euclidean distances- for more
accurate results was selected.
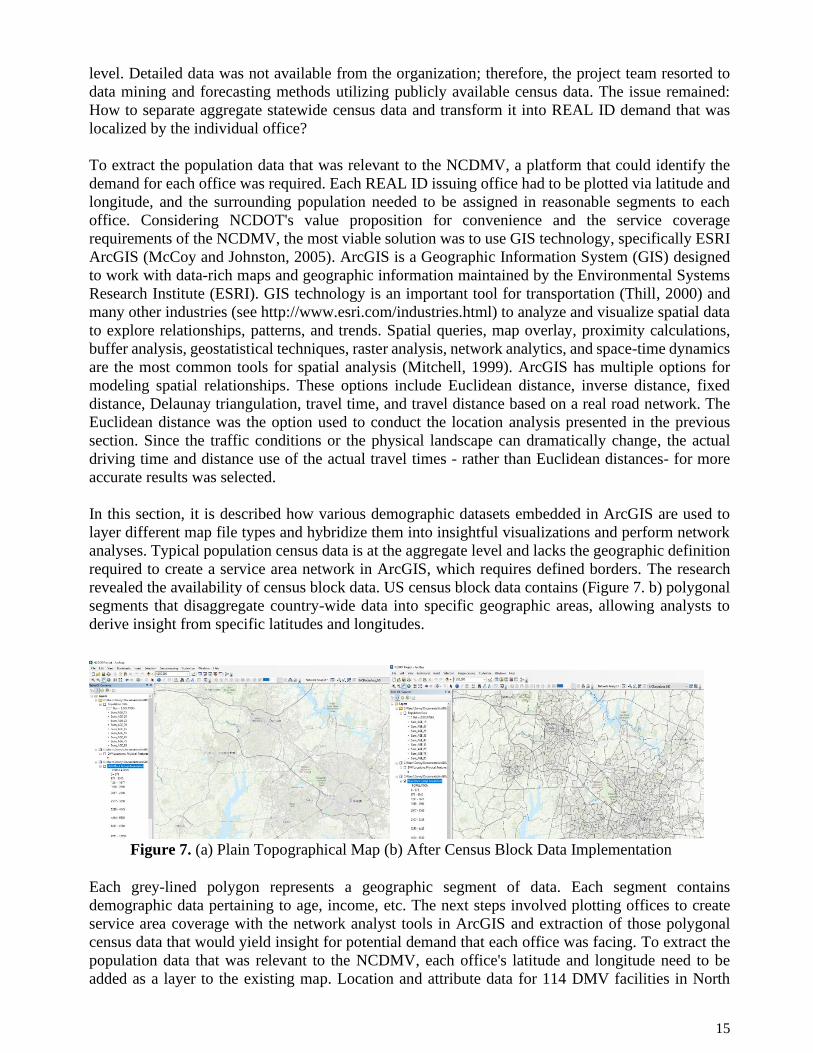
In this section, it is described how various demographic datasets embedded in ArcGIS are used to
layer different map file types and hybridize them into insightful visualizations and perform network
analyses. Typical population census data is at the aggregate level and lacks the geographic definition
required to create a service area network in ArcGIS, which requires defined borders. The research
revealed the availability of census block data. US census block data contains (Figure 7. b) polygonal
segments that disaggregate country-wide data into specific geographic areas, allowing analysts to
derive insight from specific latitudes and longitudes.
Figure 7. (a) Plain Topographical Map (b) After Census Block Data Implementation
Each grey-lined polygon represents a geographic segment of data. Each segment contains
demographic data pertaining to age, income, etc. The next steps involved plotting offices to create
service area coverage with the network analyst tools in ArcGIS and extraction of those polygonal
census data that would yield insight for potential demand that each office was facing. To extract the
population data that was relevant to the NCDMV, each office's latitude and longitude need to be
added as a layer to the existing map. Location and attribute data for 114 DMV facilities in North
16
Carolina were acquired by geocoding addresses in ArcGIS and converting to point features. This
allows for the calculation of specific areas that were within certain driving times of each office,
assuming most customers will drive to their nearest office. Average driving speed of 35 mph was
used to emulate the speed most drivers will achieve on average in a typical trip, including a
combination of unimpeded travel, traffic, and traffic stops.
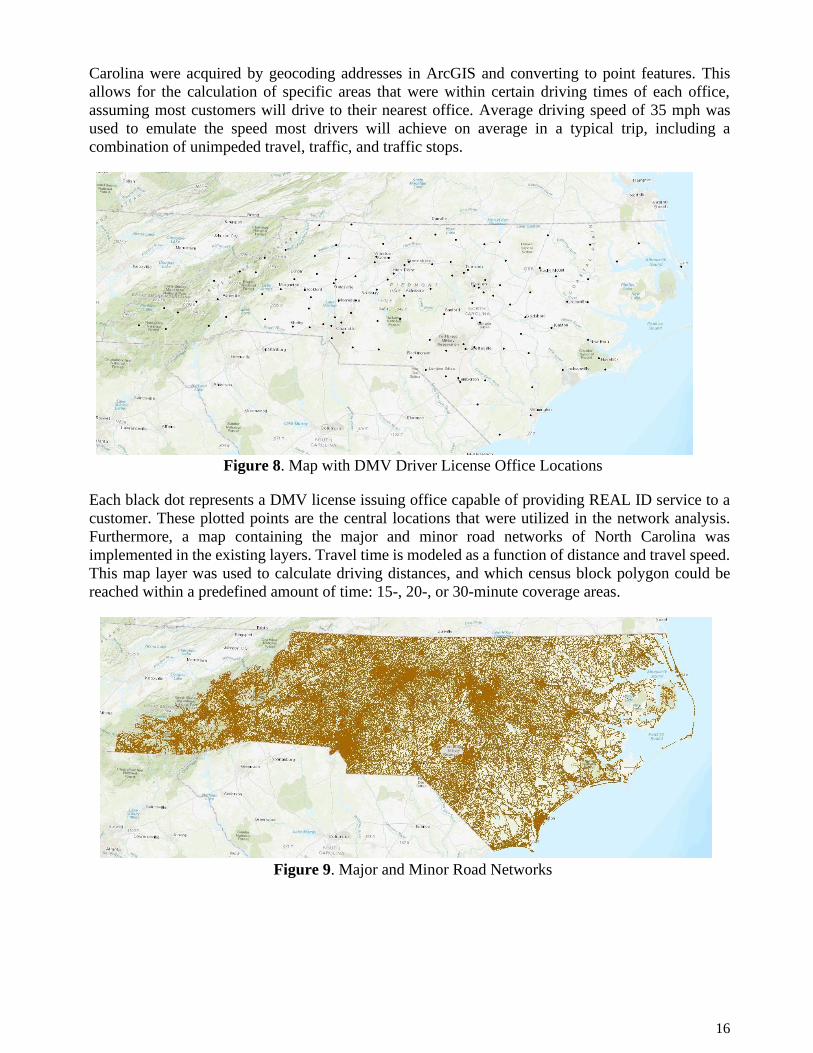
Figure 8. Map with DMV Driver License Office Locations
Each black dot represents a DMV license issuing office capable of providing REAL ID service to a
customer. These plotted points are the central locations that were utilized in the network analysis.
Furthermore, a map containing the major and minor road networks of North Carolina was
implemented in the existing layers. Travel time is modeled as a function of distance and travel speed.
This map layer was used to calculate driving distances, and which census block polygon could be
reached within a predefined amount of time: 15-, 20-, or 30-minute coverage areas.
Figure 9. Major and Minor Road Networks
17
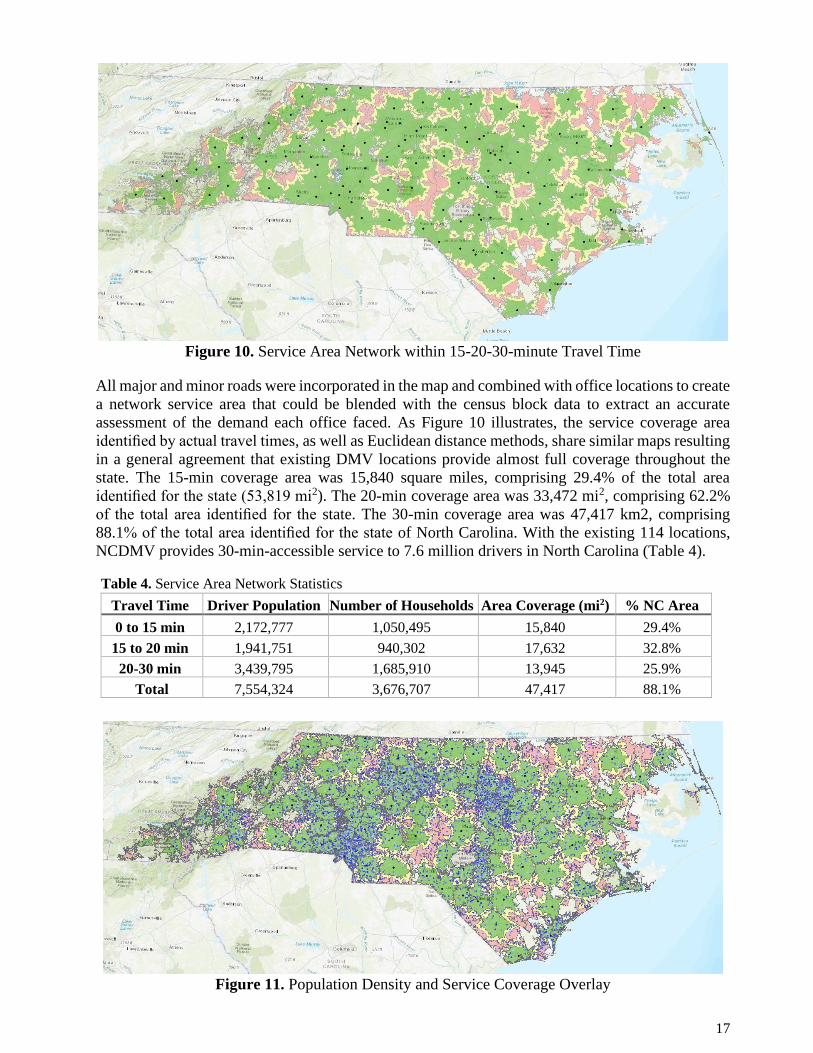
Figure 10. Service Area Network within 15-20-30-minute Travel Time
All major and minor roads were incorporated in the map and combined with office locations to create
a network service area that could be blended with the census block data to extract an accurate
assessment of the demand each office faced. As Figure 10 illustrates, the service coverage area
identified by actual travel times, as well as Euclidean distance methods, share similar maps resulting
in a general agreement that existing DMV locations provide almost full coverage throughout the
state. The 15-min coverage area was 15,840 square miles, comprising 29.4% of the total area
identified for the state (53,819 mi2). The 20-min coverage area was 33,472 mi2, comprising 62.2%
of the total area identified for the state. The 30-min coverage area was 47,417 km2, comprising
88.1% of the total area identified for the state of North Carolina. With the existing 114 locations,
NCDMV provides 30-min-accessible service to 7.6 million drivers in North Carolina (Table 4).
Table 4. Service Area Network Statistics
Travel Time Driver Population Number of Households Area Coverage (mi2) % NC Area
0 to 15 min 2,172,777 1,050,495 15,840 29.4%
15 to 20 min 1,941,751 940,302 17,632 32.8%
20-30 min 3,439,795 1,685,910 13,945 25.9%
Total 7,554,324 3,676,707 47,417 88.1%
Figure 11. Population Density and Service Coverage Overlay
18
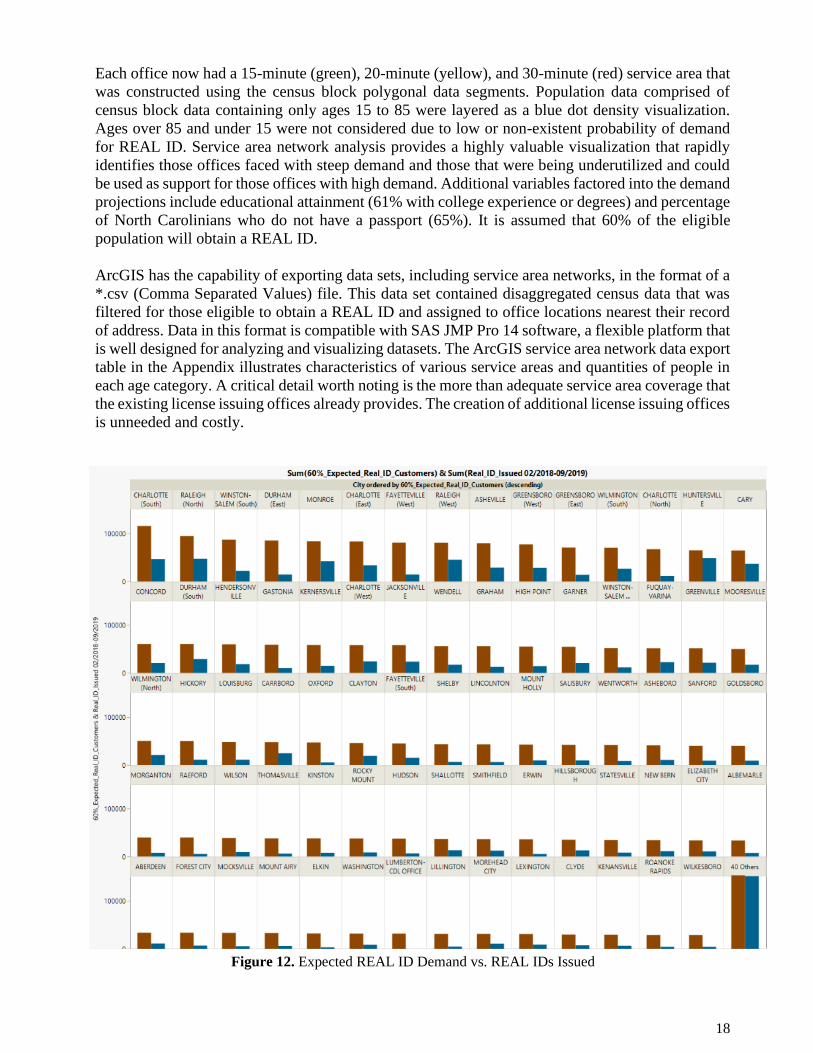
Each office now had a 15-minute (green), 20-minute (yellow), and 30-minute (red) service area that
was constructed using the census block polygonal data segments. Population data comprised of
census block data containing only ages 15 to 85 were layered as a blue dot density visualization.
Ages over 85 and under 15 were not considered due to low or non-existent probability of demand
for REAL ID. Service area network analysis provides a highly valuable visualization that rapidly
identifies those offices faced with steep demand and those that were being underutilized and could
be used as support for those offices with high demand. Additional variables factored into the demand
projections include educational attainment (61% with college experience or degrees) and percentage
of North Carolinians who do not have a passport (65%). It is assumed that 60% of the eligible
population will obtain a REAL ID.
ArcGIS has the capability of exporting data sets, including service area networks, in the format of a
*.csv (Comma Separated Values) file. This data set contained disaggregated census data that was
filtered for those eligible to obtain a REAL ID and assigned to office locations nearest their record
of address. Data in this format is compatible with SAS JMP Pro 14 software, a flexible platform that
is well designed for analyzing and visualizing datasets. The ArcGIS service area network data export
table in the Appendix illustrates characteristics of various service areas and quantities of people in
each age category. A critical detail worth noting is the more than adequate service area coverage that
the existing license issuing offices already provides. The creation of additional license issuing offices
is unneeded and costly.
Figure 12. Expected REAL ID Demand vs. REAL IDs Issued
19
Figure 12 presents a visualization of the NCDMV's rate of issuance compared to the projected
demand for REAL ID, assuming 60% of the current drivers demand by the population. The
blue columns of the bar graph represent NCDMV's total REAL IDs issued as of
September 2019, while the red columns represent only a 60% demand of REAL ID. The possibility
for the REAL ID demand to be a higher percentage is a highly probable issue facing NCDMV; what
is needed is a flexible tool for rapid response to spikes in demand that was approximately ten times
higher than what had already been issued over a similar span of time. NCDMV has completed
approximately 1.7 million REAL ID transactions to date. Proposals have been put forth to expand
the number of driver license issuing facilities, which appear to be a misguided use of resources
considering adequate service area coverage. There are many facilities which are not being used at
full capacity or have low traffic. By implementing the proposed organizational intelligence platform
that hosts multiple business analytics tools, NCDMV can satisfy the REAL ID demand without
opening new facilities. This requires a technological investment to incorporate what is suggested
with the current SAS powered data management system.
5. Comparative Performance and the Proposed Performance Management
Framework
The overall objective of this project was to minimize the number of new locations to be opened by
the efficient use of existing resources. NCDMV administration prioritizes minimizing waiting times
at high-demand locations and leveraging capacity utilization across all locations - including rural
areas. For this purpose, the project team performed multiple interviews, process analysis and
reviewed the relevant literature to gain more insights about the customers’ perceptions towards
NCDMV services. A recent study on customer service survey (Findley et al. 2018) indicates high
satisfaction with the courtesy and helpfulness of DMV staff. However, most of the survey
respondents selected length of wait time at DMV offices (73%) as the issue that needs the most
attention, followed by the overall quality of customer service at DMV office (51%) and convenience
of hours of operation at DMV office (45%).
The project team reached consensus that from an operational perspective, NCDMV is experiencing
long wait times and customer service challenges due to a set of:
• Technology related limitations
• Workforce related limitations
• Space-related limitations (number of terminals)
• Lack of integrated performance management framework.
This section will shed some light on these limitations with the anticipation that NCDMV would take
necessary actions to eliminate them. Without waiting times and other performance measures related
to efficiency, the project team used demand projections and observations to select specific driver
license offices to conduct efficiency analysis. For this purpose, the following metrics are calculated
to identify Driver License Offices (DLOs) that need operational improvements:
• Expected net demand = Projected demand – total number of REAL IDs issued so far
• Capacity utilization = total number of REAL IDs issued / service capacity to issue
REAL ID
• Number of days required to fulfill the net demand = Net demand / daily service
capacity
20
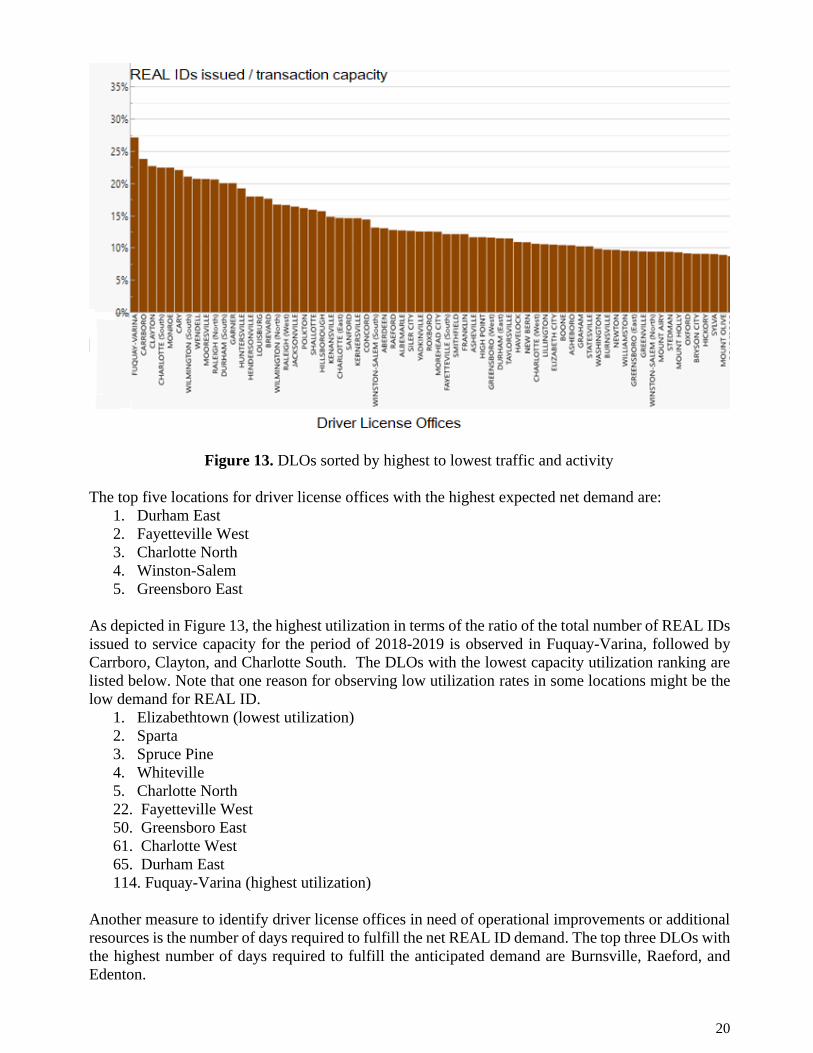
Figure 13. DLOs sorted by highest to lowest traffic and activity
The top five locations for driver license offices with the highest expected net demand are:
1. Durham East
2. Fayetteville West
3. Charlotte North
4. Winston-Salem
5. Greensboro East
As depicted in Figure 13, the highest utilization in terms of the ratio of the total number of REAL IDs
issued to service capacity for the period of 2018-2019 is observed in Fuquay-Varina, followed by
Carrboro, Clayton, and Charlotte South. The DLOs with the lowest capacity utilization ranking are
listed below. Note that one reason for observing low utilization rates in some locations might be the
low demand for REAL ID.
1. Elizabethtown (lowest utilization)
2. Sparta
3. Spruce Pine
4. Whiteville
5. Charlotte North
22. Fayetteville West
50. Greensboro East
61. Charlotte West
65. Durham East
114. Fuquay-Varina (highest utilization)
Another measure to identify driver license offices in need of operational improvements or additional
resources is the number of days required to fulfill the net REAL ID demand. The top three DLOs with
the highest number of days required to fulfill the anticipated demand are Burnsville, Raeford, and
Edenton.
21
For any organization, the waiting time is highly correlated with the service capacity, which is a
function of service time and the number of servers. Noting the criticality of the waiting time data, the
project team presented a set of candidate locations to DMV Administration in September 2019. The
candidate locations to conduct operational efficiency analysis included Durham East, Fayetteville
West, or Raeford. On February 18, 2020, the project team was notified with the selection of the North
Raleigh Driver License Office as the focus-DLO. This decision is followed by a series of meetings,
visits, and observations at the selected DLO.
To understand the relationship between REAL ID demand and the service capacity of the Driver
License Offices, the project team observed specific limitations faced by the NCDMV North Raleigh
Driver License Office. These limitations are summarized in the subsequent sections.
5.1. Technology Related Limitations
With the intention to perform a comparative analysis of the performance of the driver license offices,
the project team wanted to clarify questions such as: How does NCDMV measure the efficiency of a
driver license office and compare the performance of different DLOs? What is the efficiency,
utilization, and other productivity measures? The following data was requested on September 4, 2019:
• Number of REAL IDs Processed per Staff/per hour/per month
• Number of REAL IDs Processed per terminal/per hour/per month
• Number of REAL IDs Processed per location/per hour/per month
• Cost per REAL ID processed
• Wait Times for REAL ID customers
• Percent of REAL ID Renewals
• Percent of Errors with REAL ID issuance or renewal
• Unlicensed drivers as a percent of licensed drivers
• Percent of License Renewals Done Online
• Number of REAL IDs issued for unlicensed residents
• Number of REAL IDs issued for 15-18-year-old residents
• DMV Queuing system data (wait and serve times, ticket type, transaction time,
classification, etc.)
NCDMV's response to our initial data request revealed the technological limitations of their systems.
Following quote clearly expresses the inability of the existing queueing system to categorize REAL
ID transactions:
"DMV has several systems to collect wait and service time. The queuing system alone is
focused sole [sic]on queuing and is not tied to transaction and therefore will not provide
meaningful wait and service time insight. Operations at DLO offices does [sic] not
segregate REAL ID customers." October 2019.
The data provided by the DMV administration included monthly REAL ID issuance data with
location breakdown, QFlow screenshots, and SAS Scorecard data, which was helpful in
understanding the processes and staff resources to issue REAL ID. QFlow system has the capability
to provide real-time data for the following fields: date, customer number, case number, check-in time
(time customer receives ticket/case number at the greeting desk), time customer called for the
transaction, time transaction starts, time transaction completed, terminal number. The project team
developed a different set of fields to be used during data collection and observations, which
22
resulted in useful insights for process improvements. Having DLEs switch between five
different information systems (QFlow, Capture, SADLS, Enforcement, and Inova) for each
transaction was identified as an improvement area. Log in and switching from one screen to another
prolongs the transaction time to issue REAL ID up to 27 minutes. Streamlining all these systems and
eliminating unnecessary tasks in between can potentially reduce the transaction time by 50%.
Another drawback is regarding the current queuing system, QFlow, which creates the first record
when the customer meets the greeter. Unfortunately, there is a considerable amount of wait time
before a customer is greeted by a DLE, and QFlow cannot capture this wait time. With a simple
sensor solution, DMV can collect the actual arrival time of customers. The project team recommends
an update to the queueing system to include the following information:
− Customer #
− Time in (customer enters the facility)
− Number of people in the company
− Time to start talking to the receptionist
− Time to get a ticket
− Time to be called for service
− Terminal number
− Transaction start time
− Time documents approved
− Time scanning is completed
− Time Voter registration is completed
− Time Sex offender check is completed
− Payment completed
− Time TDC is printed
− Time customer leaves the terminal
5.2. Workforce Related Limitations
The service capacity of the NCDMV is determined by the transaction time, the number of Driver
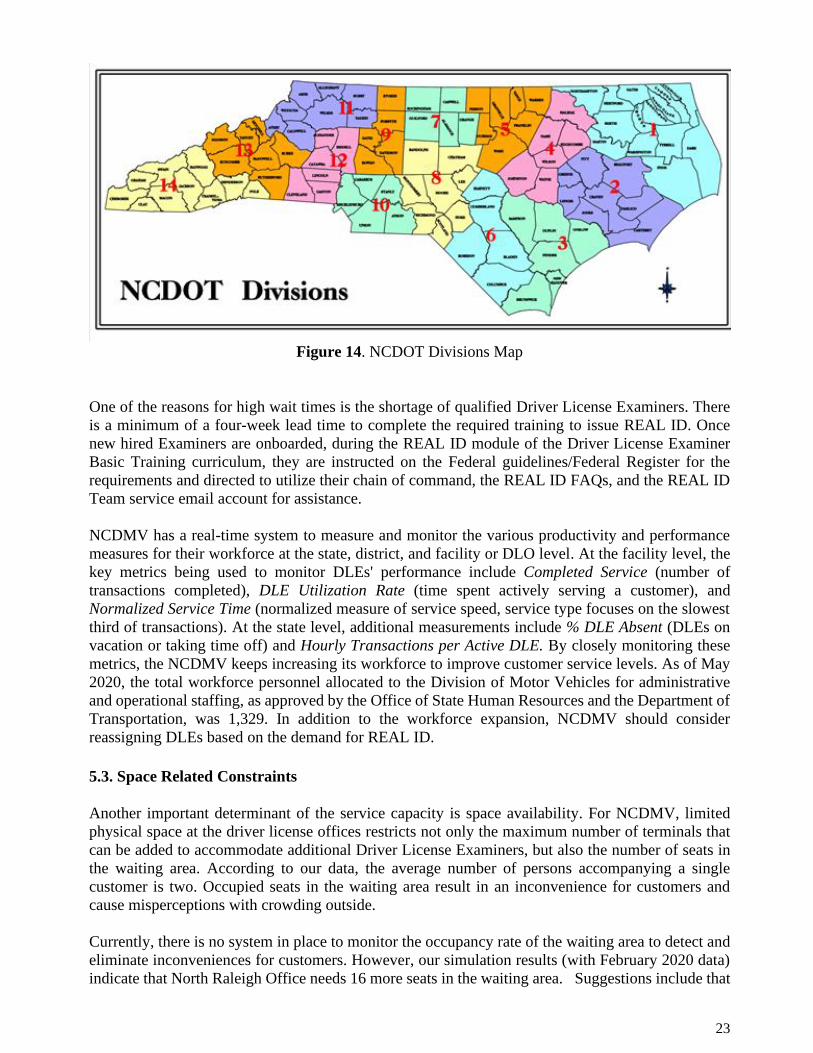
License Examiners (DLEs), and the number of terminals. Across 14 NCDOT divisions, there are 9
NCDMV districts that manage the 114 Driver License Offices as well as mobile units. As of
September 2019, there were a total of 579 Driver License field employees working across 114 Driver
License Offices and 8 Mobile Units. Those 579 employees are classified as Chiefs & DM (2), DDM
(3), DL Sups (82), DLE II (19), and DLE I (466). Among these classifications, only examiners who
have received First-tier, Downstream, and Related entities (FDR) training can issue REAL ID. New
employees receive Driver Examiner Basic Training that includes training for many types of
transactions, including REAL ID, which is a module within the training curriculum.
23
Figure 14. NCDOT Divisions Map
One of the reasons for high wait times is the shortage of qualified Driver License Examiners. There
is a minimum of a four-week lead time to complete the required training to issue REAL ID. Once
new hired Examiners are onboarded, during the REAL ID module of the Driver License Examiner
Basic Training curriculum, they are instructed on the Federal guidelines/Federal Register for the
requirements and directed to utilize their chain of command, the REAL ID FAQs, and the REAL ID
Team service email account for assistance.
NCDMV has a real-time system to measure and monitor the various productivity and performance
measures for their workforce at the state, district, and facility or DLO level. At the facility level, the
key metrics being used to monitor DLEs' performance include Completed Service (number of
transactions completed), DLE Utilization Rate (time spent actively serving a customer), and
Normalized Service Time (normalized measure of service speed, service type focuses on the slowest
third of transactions). At the state level, additional measurements include % DLE Absent (DLEs on
vacation or taking time off) and Hourly Transactions per Active DLE. By closely monitoring these
metrics, the NCDMV keeps increasing its workforce to improve customer service levels. As of May
2020, the total workforce personnel allocated to the Division of Motor Vehicles for administrative
and operational staffing, as approved by the Office of State Human Resources and the Department of
Transportation, was 1,329. In addition to the workforce expansion, NCDMV should consider
reassigning DLEs based on the demand for REAL ID.
5.3. Space Related Constraints
Another important determinant of the service capacity is space availability. For NCDMV, limited
physical space at the driver license offices restricts not only the maximum number of terminals that
can be added to accommodate additional Driver License Examiners, but also the number of seats in
the waiting area. According to our data, the average number of persons accompanying a single
customer is two. Occupied seats in the waiting area result in an inconvenience for customers and
cause misperceptions with crowding outside.
Currently, there is no system in place to monitor the occupancy rate of the waiting area to detect and
eliminate inconveniences for customers. However, our simulation results (with February 2020 data)
indicate that North Raleigh Office needs 16 more seats in the waiting area. Suggestions include that
24
DMV designate a separate area for accompanying people and develop measures to manage the
maximum number of customers waiting. Another suggestion is to increase online engagement with
customers. If customers who are not applying for REAL ID choose to complete their transactions
online, there will be more space for REAL ID customers.
Finally, expansion of the service capacity requires additional space for adding new terminals in the
existing facilities. Unfortunately, the social distancing requirements due to the current outbreak will
add more restrictions to the capacity expansion efforts of the NCDMV.
5.4. Current Performance Management Framework
A performance management framework should contain a performance measurement plan that
identifies specific and outcome-based metrics that help an organization to fulfill its mission. With its
commitment to Responsiveness, Efficiency, Performance, Oversight, Restructure, and Transparency
(REPORT), the North Carolina Department of Transportation has established the DOT REPORT
program, which is a comprehensive performance management framework helping NCDOT to achieve
its mission. In this program, Responsiveness is associated with addressing structural problems and
other reported road hazards in a timely manner. Efficiency aims to streamline project delivery and
establish baseline unit pricing for transportation goods. Performance is associated with increased
transparency and responsiveness and measured by the level of satisfaction with transportation
services and an annual employee satisfaction survey. Oversight involves budget transparency and
allows for greater legislative and citizen oversight. Restructure covers improving the efficiency and
effectiveness of operations and aligning operations and staffing with strategic planning, performance
goals, and measures (see Appendix). Transparency aims to increase public transparency via
performance dashboards, project progress, and traveler information.
As the largest division within NCDOT, NCDMV follows the same REPORT program. For this
purpose, NCDMV administrators use the SAS Scorecard System as a performance dashboard. The
SAS Scorecard System includes performance metrics retrieved from SADLS and QFlow systems.
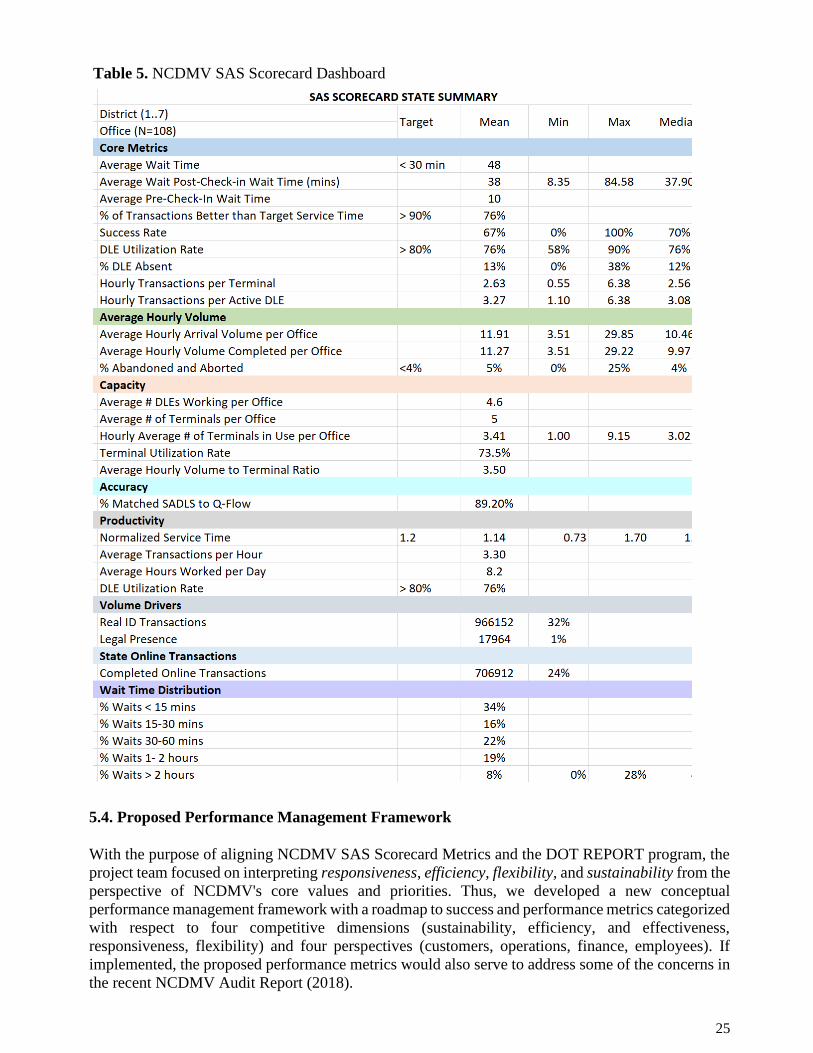
SAS Scorecard categories and relevant statewide performance metrics as of February 24, 2020, are
listed in Table 5. The core performance metrics such as wait times, DLE utilization rate, and
percentage of abandoned transactions are far from target levels. The normalized service time, which
is a productivity measure, indicates needs for improvement. The accuracy measure "% Matched
SADLS to Q-Flow" indicates data inconsistencies between the two systems and acts as a
technological limitation that needs improvement.
Note that the number of driver license offices in Table 5 is 108 (N=108). Although NCDMV had 114
offices, SAS Scorecard System was not synchronized with six offices. The missing offices are
Lumberton-CDL Office; Pembroke; Raleigh (North); Statesville-CDL Office; Walnut Cove and
Yanceyville. Unfortunately, the focus of this project, the North Raleigh Office, was one of the six
missing offices.
25
Table 5. NCDMV SAS Scorecard Dashboard
5.4. Proposed Performance Management Framework
With the purpose of aligning NCDMV SAS Scorecard Metrics and the DOT REPORT program, the
project team focused on interpreting responsiveness, efficiency, flexibility, and sustainability from the
perspective of NCDMV's core values and priorities. Thus, we developed a new conceptual
performance management framework with a roadmap to success and performance metrics categorized
with respect to four competitive dimensions (sustainability, efficiency, and effectiveness,
responsiveness, flexibility) and four perspectives (customers, operations, finance, employees). If
implemented, the proposed performance metrics would also serve to address some of the concerns in
the recent NCDMV Audit Report (2018).
26
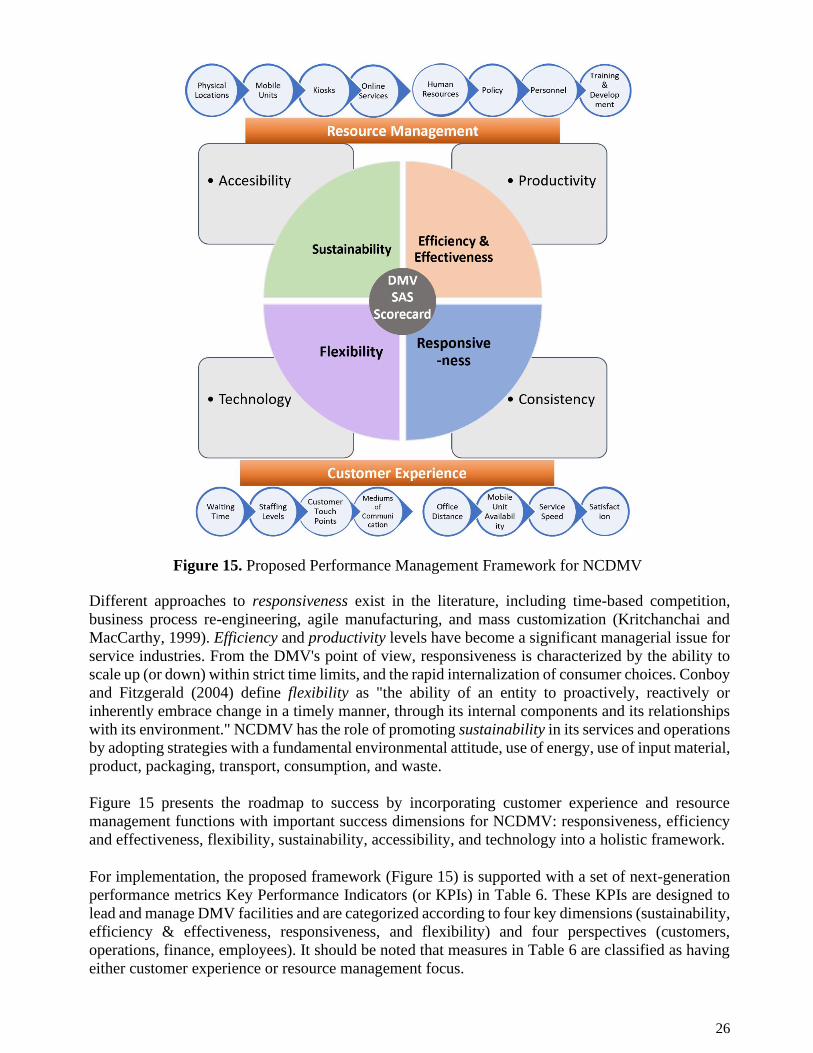
Figure 15. Proposed Performance Management Framework for NCDMV
Different approaches to responsiveness exist in the literature, including time-based competition,
business process re-engineering, agile manufacturing, and mass customization (Kritchanchai and
MacCarthy, 1999). Efficiency and productivity levels have become a significant managerial issue for
service industries. From the DMV's point of view, responsiveness is characterized by the ability to
scale up (or down) within strict time limits, and the rapid internalization of consumer choices. Conboy
and Fitzgerald (2004) define flexibility as "the ability of an entity to proactively, reactively or
inherently embrace change in a timely manner, through its internal components and its relationships
with its environment." NCDMV has the role of promoting sustainability in its services and operations
by adopting strategies with a fundamental environmental attitude, use of energy, use of input material,
product, packaging, transport, consumption, and waste.
Figure 15 presents the roadmap to success by incorporating customer experience and resource
management functions with important success dimensions for NCDMV: responsiveness, efficiency
and effectiveness, flexibility, sustainability, accessibility, and technology into a holistic framework.
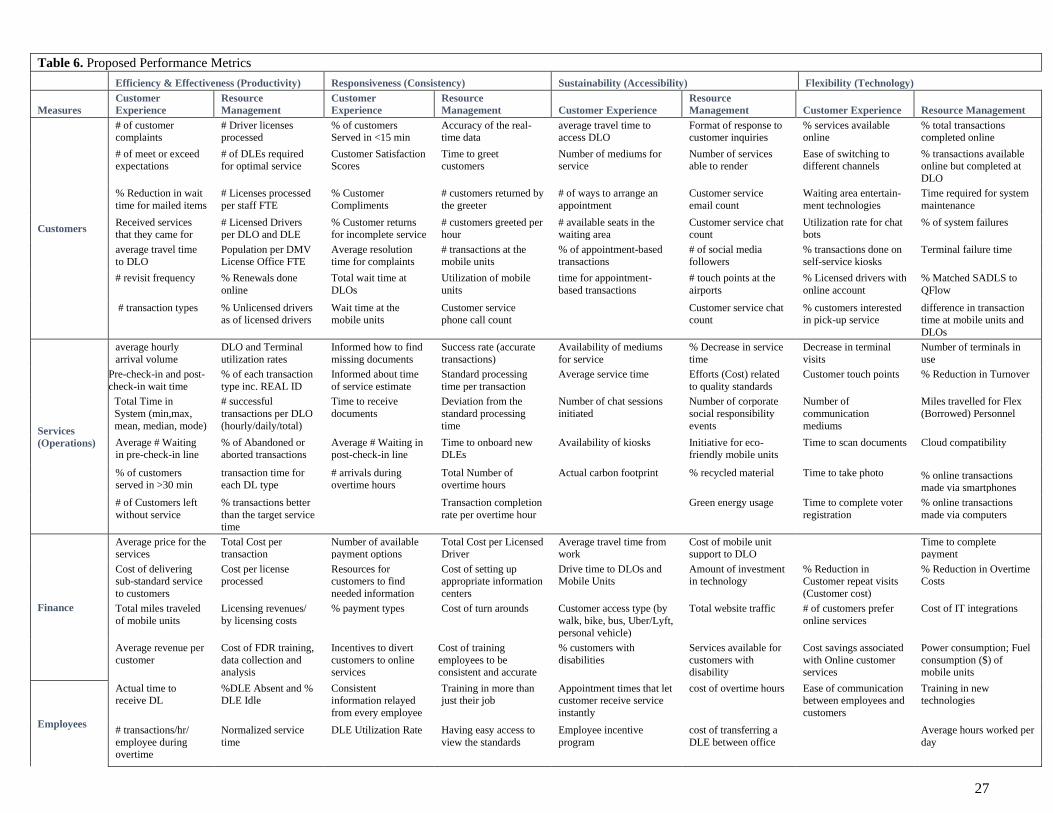
For implementation, the proposed framework (Figure 15) is supported with a set of next-generation
performance metrics Key Performance Indicators (or KPIs) in Table 6. These KPIs are designed to
lead and manage DMV facilities and are categorized according to four key dimensions (sustainability,
efficiency & effectiveness, responsiveness, and flexibility) and four perspectives (customers,
operations, finance, employees). It should be noted that measures in Table 6 are classified as having
either customer experience or resource management focus.
27
Table 6. Proposed Performance Metrics
Efficiency & Effectiveness (Productivity) Responsiveness (Consistency) Sustainability (Accessibility) Flexibility (Technology)
Measures
Customer
Experience
Resource
Management
Customer
Experience
Resource
Management Customer Experience
Resource
Management Customer Experience Resource Management
Customers
# of customer complaints
# Driver licenses processed
% of customers Served in <15 min
Accuracy of the real-time data
average travel time to access DLO
Format of response to customer inquiries
% services available online
% total transactions completed online
# of meet or exceed expectations
# of DLEs required for optimal service
Customer Satisfaction Scores
Time to greet customers
Number of mediums for service
Number of services able to render
Ease of switching to different channels
% transactions available online but completed at
DLO
% Reduction in wait
time for mailed items
# Licenses processed
per staff FTE
% Customer
Compliments
# customers returned by
the greeter
# of ways to arrange an
appointment
Customer service
email count
Waiting area entertain-
ment technologies
Time required for system
maintenance
Received services that they came for
# Licensed Drivers per DLO and DLE
% Customer returns for incomplete service
# customers greeted per hour
# available seats in the waiting area
Customer service chat count
Utilization rate for chat bots
% of system failures
average travel time
to DLO
Population per DMV
License Office FTE
Average resolution
time for complaints
# transactions at the
mobile units
% of appointment-based
transactions
# of social media
followers
% transactions done on
self-service kiosks
Terminal failure time
# revisit frequency % Renewals done
online
Total wait time at
DLOs
Utilization of mobile
units
time for appointment-
based transactions
# touch points at the
airports
% Licensed drivers with
online account
% Matched SADLS to
QFlow
# transaction types % Unlicensed drivers as of licensed drivers
Wait time at the mobile units
Customer service phone call count
Customer service chat count
% customers interested in pick-up service
difference in transaction time at mobile units and
DLOs
Services
(Operations)
average hourly
arrival volume
DLO and Terminal
utilization rates
Informed how to find
missing documents
Success rate (accurate
transactions)
Availability of mediums
for service
% Decrease in service
time
Decrease in terminal
visits
Number of terminals in
use
Pre-check-in and post-
check-in wait time
% of each transaction
type inc. REAL ID
Informed about time
of service estimate
Standard processing
time per transaction
Average service time Efforts (Cost) related
to quality standards
Customer touch points % Reduction in Turnover
Total Time in
System (min,max,
mean, median, mode)
# successful
transactions per DLO
(hourly/daily/total)
Time to receive
documents
Deviation from the
standard processing
time
Number of chat sessions
initiated
Number of corporate
social responsibility
events
Number of
communication
mediums
Miles travelled for Flex
(Borrowed) Personnel
Average # Waiting in pre-check-in line
% of Abandoned or aborted transactions
Average # Waiting in post-check-in line
Time to onboard new DLEs
Availability of kiosks Initiative for eco-friendly mobile units
Time to scan documents Cloud compatibility
% of customers served in >30 min
transaction time for each DL type
# arrivals during overtime hours
Total Number of overtime hours
Actual carbon footprint % recycled material Time to take photo % online transactions
made via smartphones
# of Customers left
without service
% transactions better
than the target service time
Transaction completion
rate per overtime hour
Green energy usage Time to complete voter
registration
% online transactions
made via computers
Finance
Average price for the services
Total Cost per transaction
Number of available payment options
Total Cost per Licensed Driver
Average travel time from work
Cost of mobile unit support to DLO
Time to complete payment
Cost of delivering sub-standard service
to customers
Cost per license processed
Resources for customers to find
needed information
Cost of setting up appropriate information
centers
Drive time to DLOs and Mobile Units
Amount of investment in technology
% Reduction in Customer repeat visits
(Customer cost)
% Reduction in Overtime Costs
Total miles traveled
of mobile units
Licensing revenues/
by licensing costs
% payment types Cost of turn arounds Customer access type (by
walk, bike, bus, Uber/Lyft,
personal vehicle)
Total website traffic # of customers prefer
online services
Cost of IT integrations
Average revenue per
customer
Cost of FDR training,
data collection and analysis
Incentives to divert
customers to online services
Cost of training
employees to be consistent and accurate
% customers with
disabilities
Services available for
customers with disability
Cost savings associated
with Online customer services
Power consumption; Fuel
consumption ($) of mobile units
Employees
Actual time to receive DL
%DLE Absent and % DLE Idle
Consistent information relayed
from every employee
Training in more than just their job
Appointment times that let customer receive service
instantly
cost of overtime hours Ease of communication between employees and
customers
Training in new technologies
# transactions/hr/
employee during overtime
Normalized service
time
DLE Utilization Rate Having easy access to
view the standards
Employee incentive
program
cost of transferring a
DLE between office
Average hours worked per
day
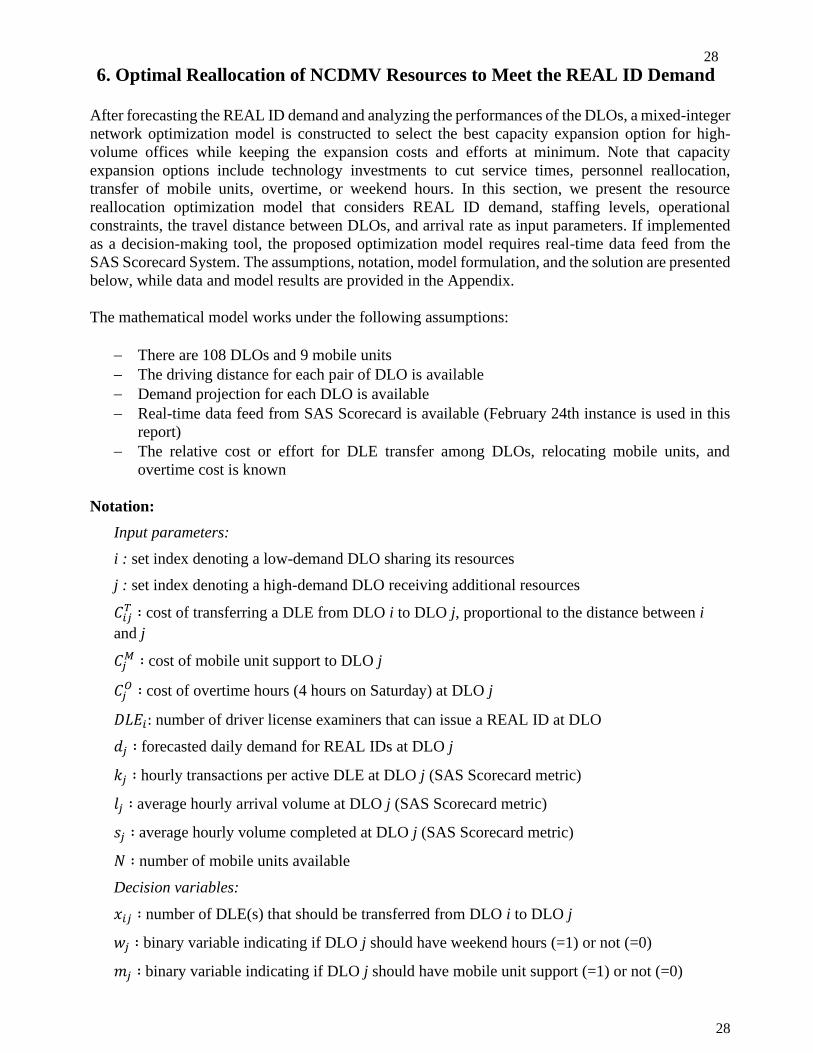
28
28
6. Optimal Reallocation of NCDMV Resources to Meet the REAL ID Demand
After forecasting the REAL ID demand and analyzing the performances of the DLOs, a mixed-integer
network optimization model is constructed to select the best capacity expansion option for high-
volume offices while keeping the expansion costs and efforts at minimum. Note that capacity
expansion options include technology investments to cut service times, personnel reallocation,
transfer of mobile units, overtime, or weekend hours. In this section, we present the resource
reallocation optimization model that considers REAL ID demand, staffing levels, operational
constraints, the travel distance between DLOs, and arrival rate as input parameters. If implemented
as a decision-making tool, the proposed optimization model requires real-time data feed from the
SAS Scorecard System. The assumptions, notation, model formulation, and the solution are presented
below, while data and model results are provided in the Appendix.
The mathematical model works under the following assumptions:
− There are 108 DLOs and 9 mobile units
− The driving distance for each pair of DLO is available
− Demand projection for each DLO is available
− Real-time data feed from SAS Scorecard is available (February 24th instance is used in this
report)
− The relative cost or effort for DLE transfer among DLOs, relocating mobile units, and
overtime cost is known
Notation:
Input parameters:
i : set index denoting a low-demand DLO sharing its resources
j : set index denoting a high-demand DLO receiving additional resources
𝐶𝑖𝑗𝑇 ∶ cost of transferring a DLE from DLO i to DLO j, proportional to the distance between i
and j
𝐶𝑗𝑀 ∶ cost of mobile unit support to DLO j
𝐶𝑗𝑂 ∶ cost of overtime hours (4 hours on Saturday) at DLO j
𝐷𝐿𝐸𝑖: number of driver license examiners that can issue a REAL ID at DLO
𝑑𝑗 ∶ forecasted daily demand for REAL IDs at DLO j
𝑘𝑗 ∶ hourly transactions per active DLE at DLO j (SAS Scorecard metric)
𝑙𝑗 ∶ average hourly arrival volume at DLO j (SAS Scorecard metric)
𝑠𝑗 ∶ average hourly volume completed at DLO j (SAS Scorecard metric)
𝑁 ∶ number of mobile units available
Decision variables:
𝑥𝑖𝑗 ∶ number of DLE(s) that should be transferred from DLO i to DLO j
𝑤𝑗 ∶ binary variable indicating if DLO j should have weekend hours (=1) or not (=0)
𝑚𝑗 ∶ binary variable indicating if DLO j should have mobile unit support (=1) or not (=0)
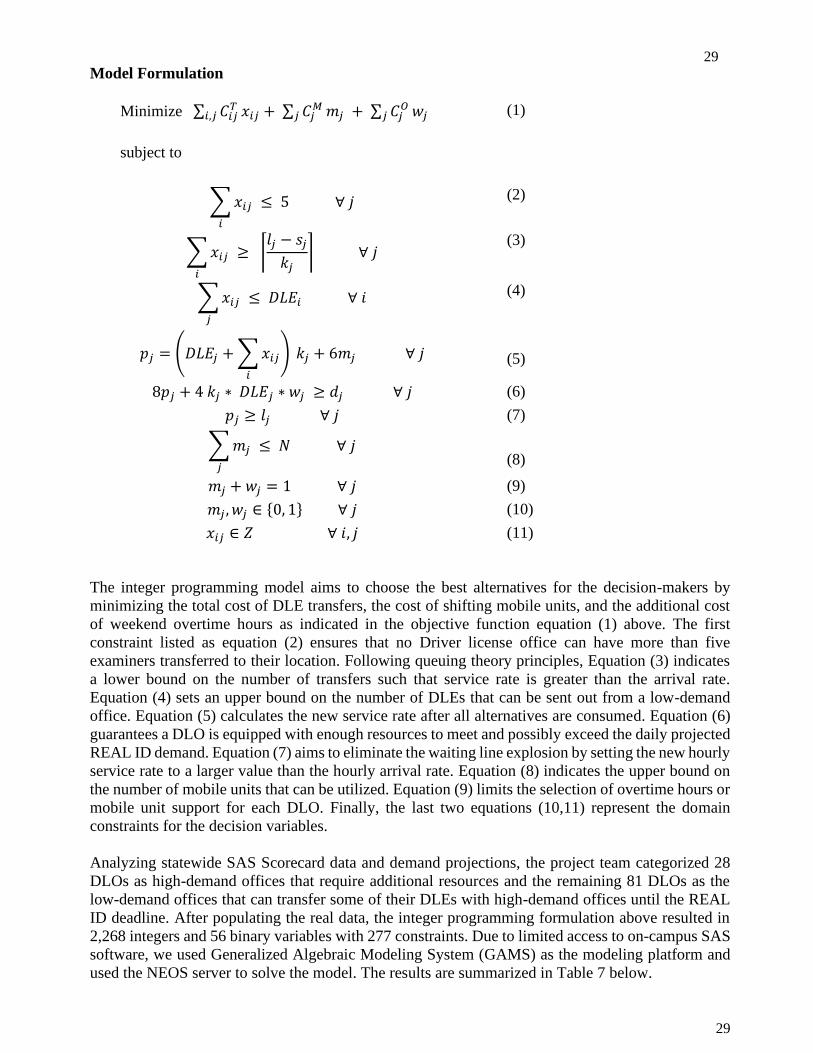
29
29
Model Formulation
The integer programming model aims to choose the best alternatives for the decision-makers by
minimizing the total cost of DLE transfers, the cost of shifting mobile units, and the additional cost
of weekend overtime hours as indicated in the objective function equation (1) above. The first
constraint listed as equation (2) ensures that no Driver license office can have more than five
examiners transferred to their location. Following queuing theory principles, Equation (3) indicates
a lower bound on the number of transfers such that service rate is greater than the arrival rate.
Equation (4) sets an upper bound on the number of DLEs that can be sent out from a low-demand
office. Equation (5) calculates the new service rate after all alternatives are consumed. Equation (6)
guarantees a DLO is equipped with enough resources to meet and possibly exceed the daily projected
REAL ID demand. Equation (7) aims to eliminate the waiting line explosion by setting the new hourly
service rate to a larger value than the hourly arrival rate. Equation (8) indicates the upper bound on
the number of mobile units that can be utilized. Equation (9) limits the selection of overtime hours or
mobile unit support for each DLO. Finally, the last two equations (10,11) represent the domain
constraints for the decision variables.
Analyzing statewide SAS Scorecard data and demand projections, the project team categorized 28
DLOs as high-demand offices that require additional resources and the remaining 81 DLOs as the
low-demand offices that can transfer some of their DLEs with high-demand offices until the REAL
ID deadline. After populating the real data, the integer programming formulation above resulted in
2,268 integers and 56 binary variables with 277 constraints. Due to limited access to on-campus SAS
software, we used Generalized Algebraic Modeling System (GAMS) as the modeling platform and
used the NEOS server to solve the model. The results are summarized in Table 7 below.
Minimize ∑ 𝐶𝑖𝑗𝑇
𝑖,𝑗 𝑥𝑖𝑗 + ∑ 𝐶𝑗𝑀
𝑗 𝑚𝑗 + ∑ 𝐶𝑗𝑂
𝑗 𝑤𝑗 (1)
subject to
∑ 𝑥𝑖𝑗
𝑖
≤ 5 ∀ 𝑗 (2)
∑ 𝑥𝑖𝑗
𝑖
≥ ⌈𝑙𝑗 − 𝑠𝑗
𝑘𝑗⌉ ∀ 𝑗
(3)
∑ 𝑥𝑖𝑗
𝑗
≤ 𝐷𝐿𝐸𝑖 ∀ 𝑖 (4)
𝑝𝑗 = (𝐷𝐿𝐸𝑗 + ∑ 𝑥𝑖𝑗
𝑖
) 𝑘𝑗 + 6𝑚𝑗 ∀ 𝑗
(5)
8𝑝𝑗 + 4 𝑘𝑗 ∗ 𝐷𝐿𝐸𝑗 ∗ 𝑤𝑗 ≥ 𝑑𝑗 ∀ 𝑗 (6)
𝑝𝑗 ≥ 𝑙𝑗 ∀ 𝑗 (7)
∑ 𝑚𝑗
𝑗
≤ 𝑁 ∀ 𝑗
(8)
𝑚𝑗 + 𝑤𝑗 = 1 ∀ 𝑗 (9)
𝑚𝑗 , 𝑤𝑗 ∈ {0, 1} ∀ 𝑗 (10)
𝑥𝑖𝑗 ∈ 𝑍 ∀ 𝑖, 𝑗 (11)
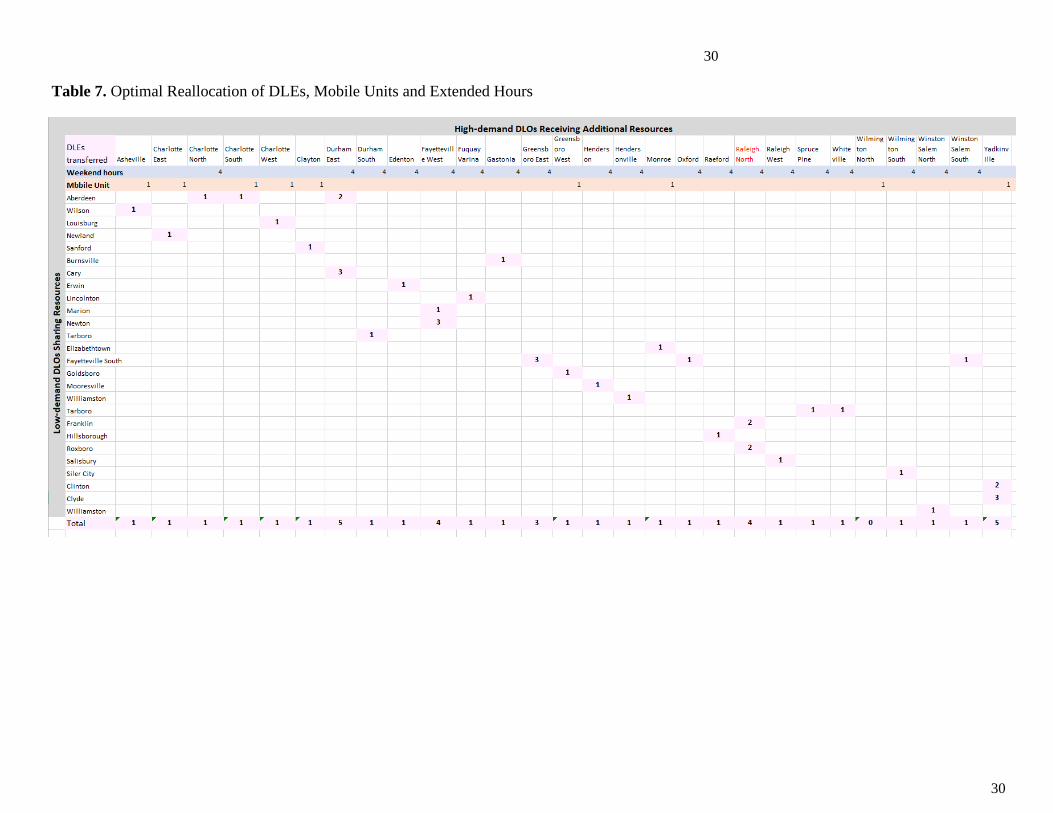
30
30
Table 7. Optimal Reallocation of DLEs, Mobile Units and Extended Hours
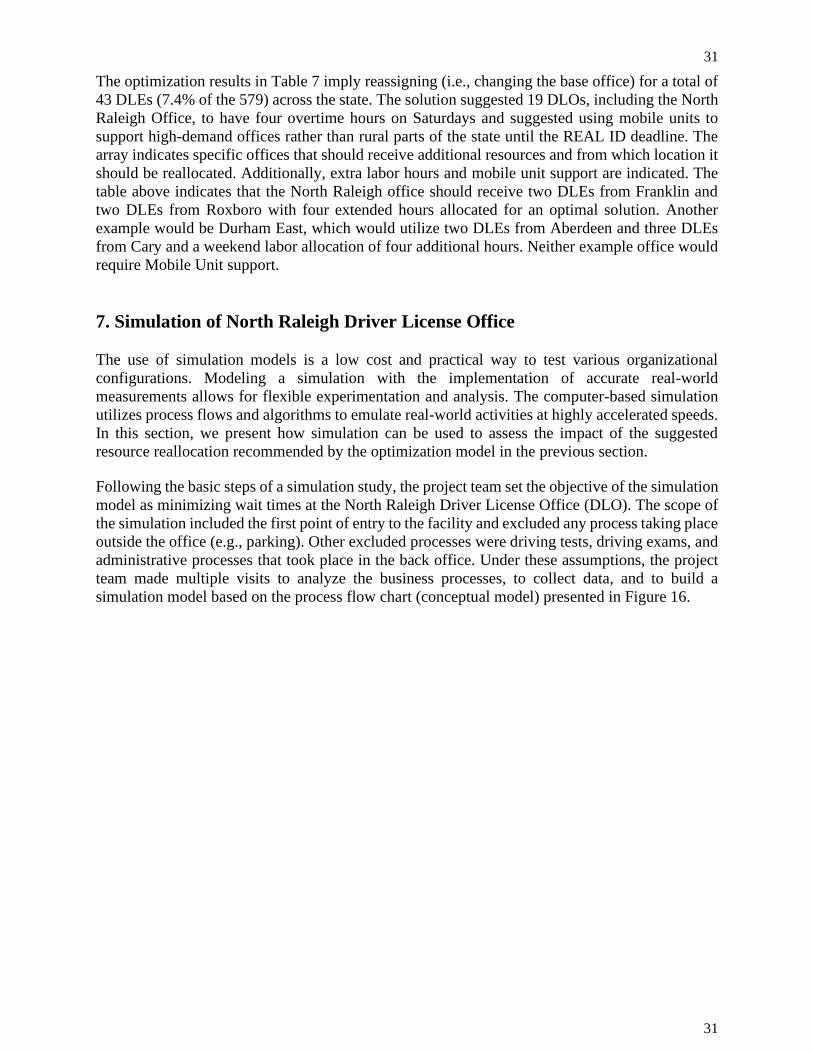
31
31
The optimization results in Table 7 imply reassigning (i.e., changing the base office) for a total of
43 DLEs (7.4% of the 579) across the state. The solution suggested 19 DLOs, including the North
Raleigh Office, to have four overtime hours on Saturdays and suggested using mobile units to
support high-demand offices rather than rural parts of the state until the REAL ID deadline. The
array indicates specific offices that should receive additional resources and from which location it
should be reallocated. Additionally, extra labor hours and mobile unit support are indicated. The
table above indicates that the North Raleigh office should receive two DLEs from Franklin and
two DLEs from Roxboro with four extended hours allocated for an optimal solution. Another
example would be Durham East, which would utilize two DLEs from Aberdeen and three DLEs
from Cary and a weekend labor allocation of four additional hours. Neither example office would
require Mobile Unit support.
7. Simulation of North Raleigh Driver License Office
The use of simulation models is a low cost and practical way to test various organizational
configurations. Modeling a simulation with the implementation of accurate real-world
measurements allows for flexible experimentation and analysis. The computer-based simulation
utilizes process flows and algorithms to emulate real-world activities at highly accelerated speeds.
In this section, we present how simulation can be used to assess the impact of the suggested
resource reallocation recommended by the optimization model in the previous section.
Following the basic steps of a simulation study, the project team set the objective of the simulation
model as minimizing wait times at the North Raleigh Driver License Office (DLO). The scope of
the simulation included the first point of entry to the facility and excluded any process taking place
outside the office (e.g., parking). Other excluded processes were driving tests, driving exams, and
administrative processes that took place in the back office. Under these assumptions, the project
team made multiple visits to analyze the business processes, to collect data, and to build a
simulation model based on the process flow chart (conceptual model) presented in Figure 16.

32
32
Figure 16. DLO Process Flow Chart
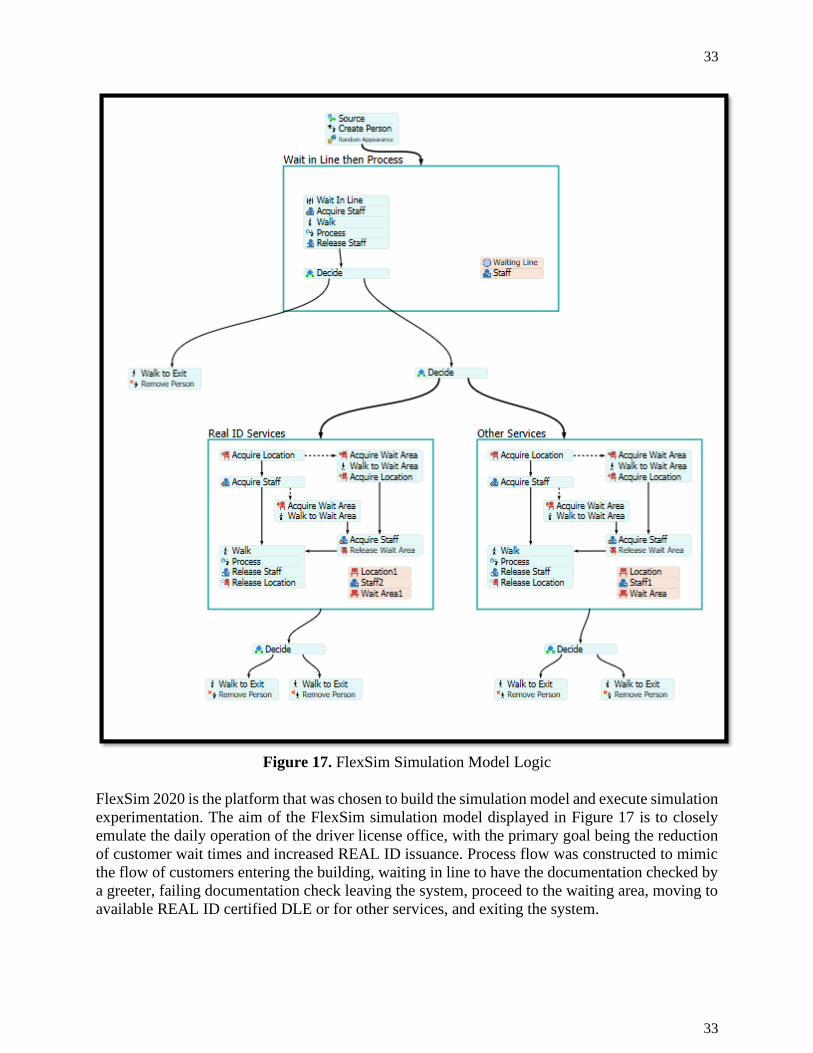
33
33
Figure 17. FlexSim Simulation Model Logic
FlexSim 2020 is the platform that was chosen to build the simulation model and execute simulation
experimentation. The aim of the FlexSim simulation model displayed in Figure 17 is to closely
emulate the daily operation of the driver license office, with the primary goal being the reduction
of customer wait times and increased REAL ID issuance. Process flow was constructed to mimic
the flow of customers entering the building, waiting in line to have the documentation checked by
a greeter, failing documentation check leaving the system, proceed to the waiting area, moving to
available REAL ID certified DLE or for other services, and exiting the system.
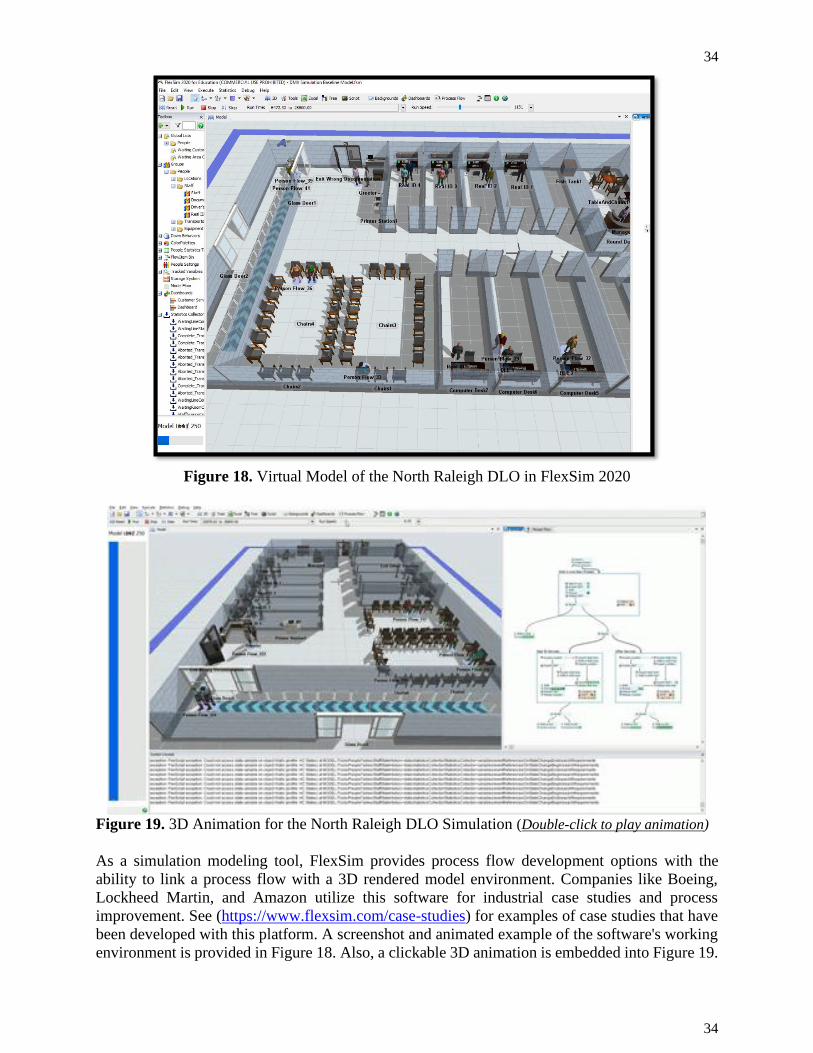
34
34
Figure 18. Virtual Model of the North Raleigh DLO in FlexSim 2020
Figure 19. 3D Animation for the North Raleigh DLO Simulation (Double-click to play animation)
As a simulation modeling tool, FlexSim provides process flow development options with the
ability to link a process flow with a 3D rendered model environment. Companies like Boeing,
Lockheed Martin, and Amazon utilize this software for industrial case studies and process
improvement. See (https://www.flexsim.com/case-studies) for examples of case studies that have
been developed with this platform. A screenshot and animated example of the software's working
environment is provided in Figure 18. Also, a clickable 3D animation is embedded into Figure 19.
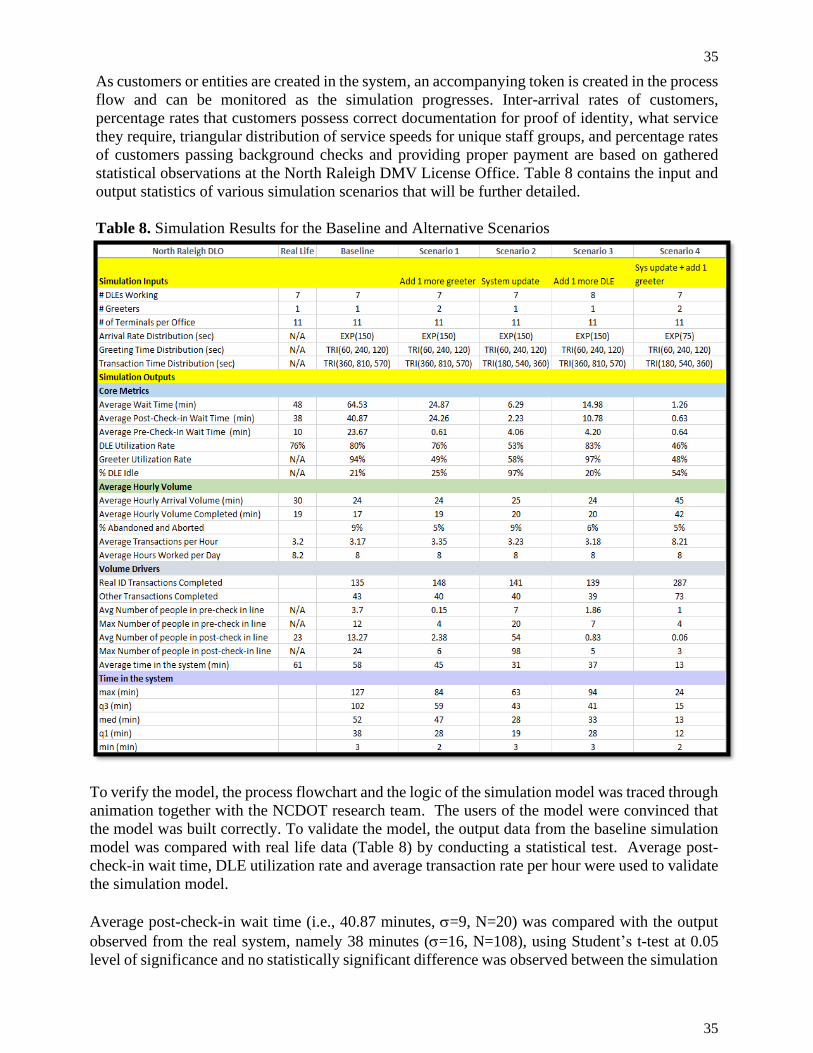
35
35
As customers or entities are created in the system, an accompanying token is created in the process
flow and can be monitored as the simulation progresses. Inter-arrival rates of customers,
percentage rates that customers possess correct documentation for proof of identity, what service
they require, triangular distribution of service speeds for unique staff groups, and percentage rates
of customers passing background checks and providing proper payment are based on gathered
statistical observations at the North Raleigh DMV License Office. Table 8 contains the input and
output statistics of various simulation scenarios that will be further detailed.
Table 8. Simulation Results for the Baseline and Alternative Scenarios
To verify the model, the process flowchart and the logic of the simulation model was traced through
animation together with the NCDOT research team. The users of the model were convinced that
the model was built correctly. To validate the model, the output data from the baseline simulation
model was compared with real life data (Table 8) by conducting a statistical test. Average post-
check-in wait time, DLE utilization rate and average transaction rate per hour were used to validate
the simulation model.
Average post-check-in wait time (i.e., 40.87 minutes, =9, N=20) was compared with the output
observed from the real system, namely 38 minutes (=16, N=108), using Student’s t-test at 0.05
level of significance and no statistically significant difference was observed between the simulation
36
36
model and the real system. Similarly, the difference between simulated versus actual DLE
utilization rate and average transaction rate per hour was not statistically significant.
After the baseline scenario has been verified and validated by using data collected during our
observations as well as SAS Scorecard data provided, four alternative scenarios were tested in the
simulation. The baseline scenario is the as-is situation and contains one greeter that checks
documents, five employees that can provide DLE services including REAL ID, and two employees
that can provide all services except for REAL ID. Four alternative scenarios were simulated:
1. Alternative scenario one adds a greeter for a total of two personnel that can check
customer documentation.
2. Alternative scenario two has the same number of personnel as the baseline scenario but
reduces the service time required by all DLEs by 50% under the assumption that
technological improvements and capture, scan, voter registration, and payment systems
would greatly reduce the time required for DLEs to execute necessary steps to render
services.
3. Alternative scenario three adds one extra employee to the baseline that can issue REAL
ID.
4. Alternative scenario four adds an extra greeter checking documentation for a total of
two greeters and reduces DLE service time by 50% under the same assumption as
scenario two.
The alternative scenario that provided the best results was scenario four. This is promising since it
only involves adding one employee that can verify documentation for proof of identity, relatively
less training that is increasing REAL ID certified employees, and the improvement of information
technology infrastructure. In fact, the simulation had to double the flow of customers in order to
truly test the capability of this design. Even with double the customer foot traffic, there was little
to no wait time.
Based on the SAS Scorecard data provided, the average number of hourly transactions is 3.2, which
implies 18.75 minutes per transaction on average. At this rate, NCDMV can complete 1639
transactions in all 512 terminals per hour, and it would take 1717 hours or 215 days to satisfy the
projected REAL ID demand of 2,813,167. Obviously, at the current rate, the original October 2020
deadline was not attainable. However, extension due to COVID-19 gives NCDMV approximately
300 business days to satisfy all the REAL ID demand. In the case of the original deadline, our
simulation suggested implementing scenario four, which would double the number of transactions
completed and cut the number of days required to fulfill the demand approximately by half.
Additionally, implementing reallocation strategies suggested by our optimization model would
have ensured meeting the demand in 95 days.
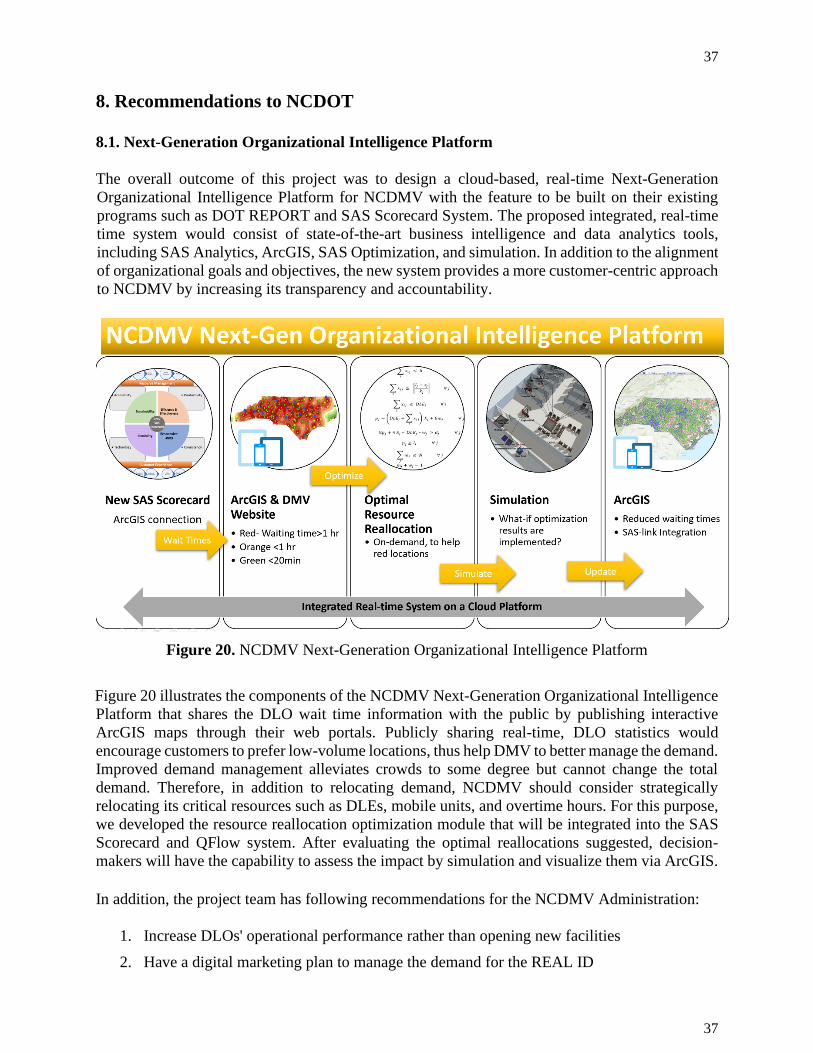
37
37
8. Recommendations to NCDOT
8.1. Next-Generation Organizational Intelligence Platform
The overall outcome of this project was to design a cloud-based, real-time Next-Generation
Organizational Intelligence Platform for NCDMV with the feature to be built on their existing
programs such as DOT REPORT and SAS Scorecard System. The proposed integrated, real-time
time system would consist of state-of-the-art business intelligence and data analytics tools,
including SAS Analytics, ArcGIS, SAS Optimization, and simulation. In addition to the alignment
of organizational goals and objectives, the new system provides a more customer-centric approach
to NCDMV by increasing its transparency and accountability.
Figure 20. NCDMV Next-Generation Organizational Intelligence Platform
Figure 20 illustrates the components of the NCDMV Next-Generation Organizational Intelligence
Platform that shares the DLO wait time information with the public by publishing interactive
ArcGIS maps through their web portals. Publicly sharing real-time, DLO statistics would
encourage customers to prefer low-volume locations, thus help DMV to better manage the demand.
Improved demand management alleviates crowds to some degree but cannot change the total
demand. Therefore, in addition to relocating demand, NCDMV should consider strategically
relocating its critical resources such as DLEs, mobile units, and overtime hours. For this purpose,
we developed the resource reallocation optimization module that will be integrated into the SAS
Scorecard and QFlow system. After evaluating the optimal reallocations suggested, decision-
makers will have the capability to assess the impact by simulation and visualize them via ArcGIS.
In addition, the project team has following recommendations for the NCDMV Administration:
1. Increase DLOs' operational performance rather than opening new facilities
2. Have a digital marketing plan to manage the demand for the REAL ID
38
38
3. Start an incentive mechanism to award the best performing DLO (not DLE).
4. Consider redesigning SAS Scorecard system using the proposed performance
management framework
5. Integrate ArcGIS with SAS Scorecard and QFlow Systems to visualize the statewide
system performance and to make better decisions
6. Speed up digital transformation by renovating existing legacy systems
7. Train and upskill DMV workforce
8. Improve QFlow or replace with a more comprehensive and flexible queuing system that
can collect foot traffic data through IoT applications (see Section 5.1 for recommended
fields for QFlow)
9. Monitor the occupancy rate of the waiting area and designate a separate area for
accompanying people
10. Focus on multiple statistical measures mean, median, min, max, rather than considering
the average values only. Some DLEs can complete more than six transactions per hour
while the majority completes 2-3.
8.2. COVID-19 Implications
Unfortunately, most of the project tasks have been performed prior to the COVID-19 outbreak,
which had a tremendous impact on people's lives and organizations globally. Unsurprisingly, the
global pandemic impacted our team's access to technology available on campus, the ability to meet,
travel and collect further data. While we were scheduled to complete the project on time, social
distancing due to COVID-19 disrupted DMV operations and NC. Department of Motor Vehicles
driver license offices was closed on Wednesday, March 18. Note that the data and results provided
in this report took place before the onset of the pandemic. However, there are still serious
implications of the COVID-19 on this project.
The biggest impact of COVID-19 is the extension of the REAL ID Federal enforcement deadline.
Note that the main motivation for this project was to ensure that all North Carolinians who need
REAL ID would get high-quality service by the October 2020 deadline. However, due to the
pandemic and the national emergency declaration, the Department of Homeland Security has
extended the REAL ID enforcement deadline by a year. The new deadline for REAL ID
enforcement is October 1, 2021.
Another impact is the reassessment of the need for the new DLOs. While this project was about
opening new DMV locations, ironically, NCDMV shut down many of its existing locations.
Therefore, the one-year extension on the federal deadline caused significant changes not only on
DMV's operations but also in demand for REAL ID. Backed up demand during shutdown brought
an additional surge in demand. However, rapid digitization of the economy resulted in reduced
demand for business travel and consequently postponement of the need for REAL ID. On the other
hand, increased unrest and the post-pandemic situation will be increasing the need for more
reliable, secure identification options like a REAL ID.
Future simulations could involve the implementation of social distancing and distanced seating in
response to COVID-19. This would provide insights into the effects of these changes for daily
39
39
operations prior to real-world implementation.
8.3. Future Steps to Explore
The original objective was to minimize the number of new DMV offices to be opened by efficient
use of existing resources under normal (pre-COVID-19) conditions. Under post-pandemic
conditions, NCDMV Administration might have new priorities such as the health and well-being
of its customers and employees in addition to minimizing waiting times at high-demand locations,
focusing on metropolitan areas to ensure they meet the October 2021 deadline, leveraging capacity
utilization across all locations.
As for the future steps to explore, we recommend following:
− Post-pandemic demand analysis using surveys and data mining
− Demand projection and location analysis based on 2020 U.S. Census data
− To create and run additional simulation scenarios
− To perform sensitivity analysis
− To develop a SAS code to use SAS PROC OPTMODEL
− To design GUI and custom reports for different user groups
− To analyze the efficiency of DLOs by simulating appointment based DLO operations − To simulate various layout alternatives to see the impact of social distancing on DLO
performance
− To develop a simulation-optimization approach to optimize the reallocation of resources
− To provide training for the NCDMV personnel to use the proposed tools
9. Implementation and Technology Transfer Plan
Early involvement of the potential users was the essential component in developing the research
outputs of this project. The project team worked closely with NCDOT to characterize the user
needs and to understand the current system capabilities. The work in progress presented during
several meetings with the NCDMV received positive feedback in terms of assessing the need for
the proposed platform, which will be used by the NCDMV Commissioners, Regional Chief
Examiners, the Directorate of Planning and Programming, and the Directorate of Performance
Metrics & Management. Either as a standalone tool or as an integrated tool to their decision support
system, proposed technology can be considered as modernization of the existing technology.
Technology adoption decision requires review and discussion of the proposed technology in a
meeting with the participation of all potential users and the implementation team. Implementation
of the new performance management framework; integration between SAS Scorecard and ArcGIS;
deployment of simulation and reallocation optimization can be evaluated separately or in an
integrated cloud platform. The project team has already addressed various questions by potential
users and available to provide additional analysis if more information is needed.
If expected benefits and the technical requirements of the technology are compatible with the
functionality of the existing system, then the next step will be experimentation in real user settings
but on limited basis. At this stage, implementation of the new performance management
framework and integration between SAS Scorecard, ArcGIS, and NCDOT web portals will require
40
40
collaboration among researchers, users, IT, SAS, ArcGIS, QFlow and SADLS. The proposed
animated 3D simulation might be used as a marketing and promotion material. However, its
deployment may require FlexSim license. Similarly, proposed optimization model requires integer
programming solver such as CPLEX or SAS OR. In either case, it should be integrated to SAS
Scorecard and QFlow systems.
Once the small-scale implementation is tested and validated, implementation team and potential
users need to identify and work closely with the relevant standards-setting bodies. For the best user
experience, acceptance and adoption, custom GUI designs and APIs need to be developed.
Especially simulation and optimization implementation require technical training and written
users-guide if the new technology is to succeed. If NCDOT staff do not have the required expertise,
research team can deliver a hands-on training or workshop.
A successful implementation and technology transfer require strong commitment from senior
management; adequate funding; user participation and satisfaction; collaboration among users,
researchers, vendors; periodical assessment of the achievements due to new technology. The
advantages of the potential technology will be assessed by reduced wait times, improved DLE
utilization, increased customer satisfaction and issuing 3 million REAL IDs by October 2021.
Research team will be available for additional training and implementation activities to integrate
the proposed platform into decision support systems of the NCDMV.
41
41
10. References
Alexander, Andrew, David Cryer, and Steve Wood (2008). 'Location Planning in Charity
Retailing,' International Journal of Retail & Distribution Management, 36(7), 536-550,
https://doi.org/10.1108/09590550810880570.
Clarke, I., and J. Rowley (1995). 'A Case for Spatial Decision‐Support Systems in Retail Location
Planning,' International Journal of Retail & Distribution Management, 23(3), 4-10.
Clarke, I., W. Mackaness, and B. Ball (2003). 'Modelling Intuition in Retail Site Assessment
(MIRSA): Making Sense of Retail Location Using Retailer's Intuitive Judgments as Support
for Decision-Making,' International Review of Retail, Distribution and Consumer Research,
13(2), 175-193.
Conboy, K. and Fitzgerald, B. (2004), “Towards a conceptual framework of agile methods: a study
of agility in different disciplines”, in Proceedings of the 2004 ACM workshop on
Interdisciplinary software engineering research, ACM New York, NY,USA, pp. 37-44.
Contemporary Marketing Issues, (ICCMI).Czamanski, D. Z. (1981), 'Some Considerations
Concerning Industrial Location Decisions,' European Journal of Operations Research, 6, 227-
31.
Ddsir, A., Goyal, V., Segev, D., & Ye, C. (2015). Capacity Constrained Assortment Optimization
Under the Markov Chain Based Choice Model. SSRN Electronic Journal. DOI:
10.2139/ssrn.2626484
Findley, Daniel J., Joy Davis, Hari Akella, Weston Head, Steve Bert (2018) North Carolina
Department of Transportation Customer Survey Results 2017‐2018, available at
https://www.ncdot.gov/about-us/our-mission/Performance/Documents/customer-survey-
service-report.pdf.
Ghadge, A., Q. Yang, N. Caldwell, C. König, and M. K. Tiware (2016). 'Facility Locations for a
Closed-Loop Distribution Network: A Hybrid Approach,' International Journal of Retail &
Distribution Management, 44(9), 884-902.
Ghosh, A., and S. L. McLafferty (1987). Location Strategies for Retail and Service Firms.
Lexington, Mass. and Toronto: Heath, Lexington Books.
Glackin, C. and B. Adivar (2019) Coloring Outside the Lines: Combining Customer Discovery &
Multicriteria Decision Making Approaches in the Case of a Habitat for Humanity ReStore.
United States Association for Small Business & Entrepreneurship (USASBE), St. Pete Beach,
FL.
Goyal, V., Levi, R., & Segev, D. (2016). Near-Optimal Algorithms for the Assortment Planning
Problem Under Dynamic Substitution and Stochastic Demand. Operations Research, 64(1),
219–235. DOI: 10.1287/opre.2015.1450
Hernández, T., and D. Bennison (2000). 'The Art and Science of Retail Location Decisions,'
International Journal of Retail & Distribution Management, 28(8), 357-367,
https://doi.org/10.1108/09590550010337391
Hoover, E. M. (1937). Location Theory and the Shoe and Leather Industries. Cambridge, Mass.:
Harvard University Press.
JMP Customer Story (2017) "North Carolina's Division of Motor Vehicles' drives change' through
42
42
data analysis" available at https://www.jmp.com/content/dam/jmp/documents/en/customer-
stories/nc-dept-of-transportation/nc_dot.pdf
Kritchanchai, D. and MacCarthy, B.L. (1999), “Responsiveness of the order fulfillment process”,
International Journal of Operations & Production Management, Vol. 19 No.8, pp.812-833.
Laulajainen, R., and H. Stafford (1995). Corporate Geography: Business Location Principles and
Cases. Dordrecht: Springer Science+Business Media.
Li, G., Rusmevichientong, P., & Topaloglu, H. (2015). The d-Level Nested Logit Model:
Assortment and Price Optimization Problems. Operations Research, 63(2), 325–342. DOI:
10.1287/opre.2015.1355
Martin, J. B., Bhadury, J., Cordeiro, J., Waite, M. L., & Amoako-Gyampah, K. (2018). Service
operations in DMV (Division of Motor Vehicles) offices of the USA - a comparative study.
Management Research Review, 41(4), 504–523. DOI: 10.1108/mrr-02-2017-0060
McCoy, J., and Johnston, K., 2005. "Using ESRI ArcGIS Spatial Analyst," Accessed from
http://www.esri.com on June 5, 2010.
NC FIRST Commission. (2019, May 3). NCDOT History. Retrieved from
https://connect.ncdot.gov/resources/State-Mapping/Pages/Historical-County-Maps.aspx
NC-TIC. (2020). NC Transportation Innovation Council (NC-TIC) The purpose of the NC-TIC is
to foster a collaborative culture within NCDOT for the rapid implementation of meaningful
innovations to efficiently deliver to the public a modern, high-quality transportation system.
Retrieved from https://connect.ncdot.gov/groups/NCSTIC/Pages/default.aspx
Mitchell A (1999) The ESRI Guide to GIS analysis, volume 1: geographic patterns and
relationships. ESRI, Redlands.
Reynolds, J., and S. Wood (2010). 'Location Decision Making in Retail Firms: Evolution and
Challenge,' International Journal of Retail & Distribution Management, 38(11/12), 828-845,
https://doi.org/10.1108/09590551011085939
Rusmevichientong, P., & Topaloglu, H. (2012). Robust Assortment Optimization in Revenue
Management Under the Multinomial Logit Choice Model. Operations Research, 60(4), 865–
882. DOI: 10.1287/opre.1120.1063
Saaty, T.L. (1994), “How to make a decision: the analytical hierarchy process”, Interfaces, Vol. 24,
No. 6, pp. 19-43.
Seyedhosseini, S. M., A. Makui, K. Shahanaghi, and S. S. Torkestani (2016). 'Models, Solution,
Methods and Their Applicability of Dynamic Location Problems (DLPs) (a gap analysis for
further research),' Journal of Industrial Engineering International, 12(3), 311-341.
Sirinesa, B., and R. Shnoer (2018). 'Understanding International Location Decisions of Poverty
Alleviation Non-Profit Organizations,' International Journal of Emerging Markets, 13(1), 2-
26.
Stevenson, W. J., M. Hojati, and J. Cao (2007). Operations Management (Vol. 8). Boston, Mass.:
McGraw-Hill/Irwin.
Thill J-C (2000) Geographic information systems in transportation research. Elsevier Science,
Oxford.
Torkestani, S. S., S. M. Seyedhosseini, A. Makui, and K. Shahanaghi (2016). 'Hierarchical Facility
Location and Hub Network Problems: A Literature Review,' Journal of Industrial and

43
43
Systems Engineering, 9, 1-22
Walton, J., Wallace, C., & Martin, A. (2015). Best Practice Considerations Checklist. Scorecard
Best Practices, 127–130. DOI: 10.1002/9781119197799.ch10.

44
44
APPENDIX
APPENDIX A. Additional Details for Location Analysis
Figure A-1. Expert Knowledge and Evidence-Based Location Methodology
Table A-1. AHP Preference Scale
Intensity
of Importance
Definition Explanation
1 Equal importance Two factors contribute equally
3 Moderate importance Experience and judgment slightly favor
one Factor over another
5 Strong importance Experience and judgment strongly favor
one Factor over another
7 Very strong or demonstrated
importance
A factor is favored very strongly over
another, its dominance demonstrated in
practice.
9 Extreme importance The evidence favoring one factor over
another is of the highest possible order of
affirmation.
Reciprocals of
above
If factor i has one of the above
nonzero numbers assigned to it
when compared with factor j, then j
has the reciprocal value when
compared with i
A comparison mandated by choosing the
smaller element as the unit to estimate the
larger one as a multiple of that unit
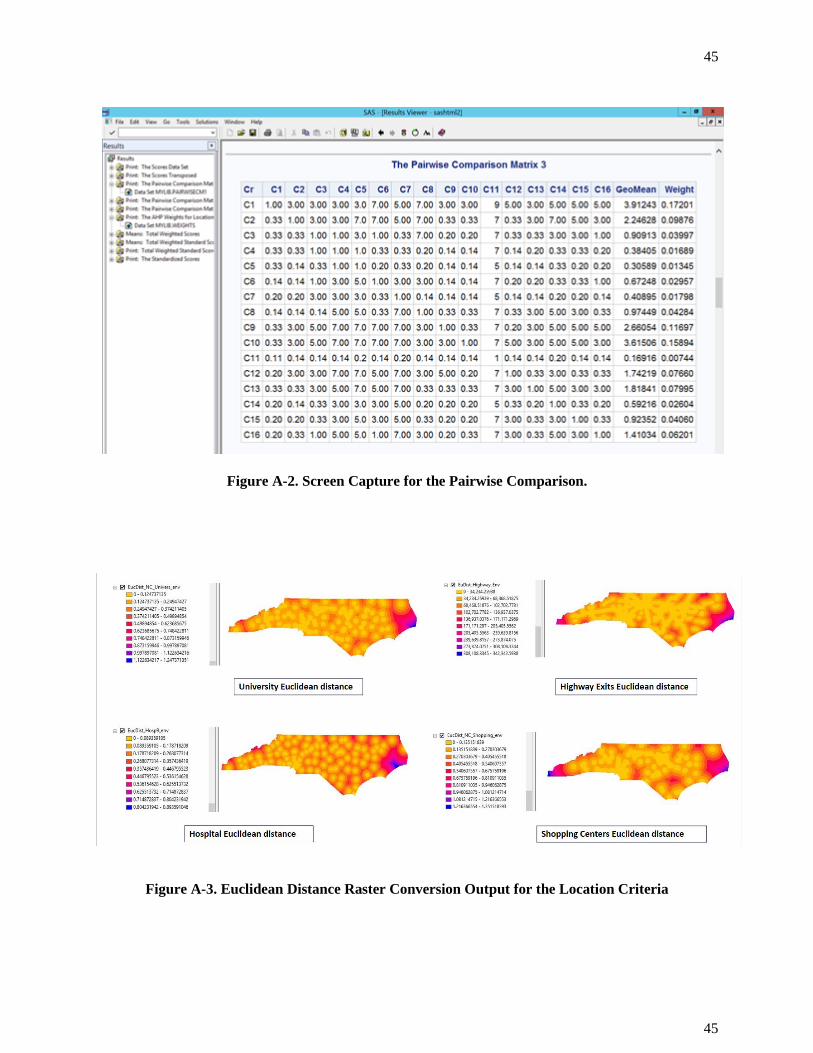
45
45
Figure A-2. Screen Capture for the Pairwise Comparison.
Figure A-3. Euclidean Distance Raster Conversion Output for the Location Criteria
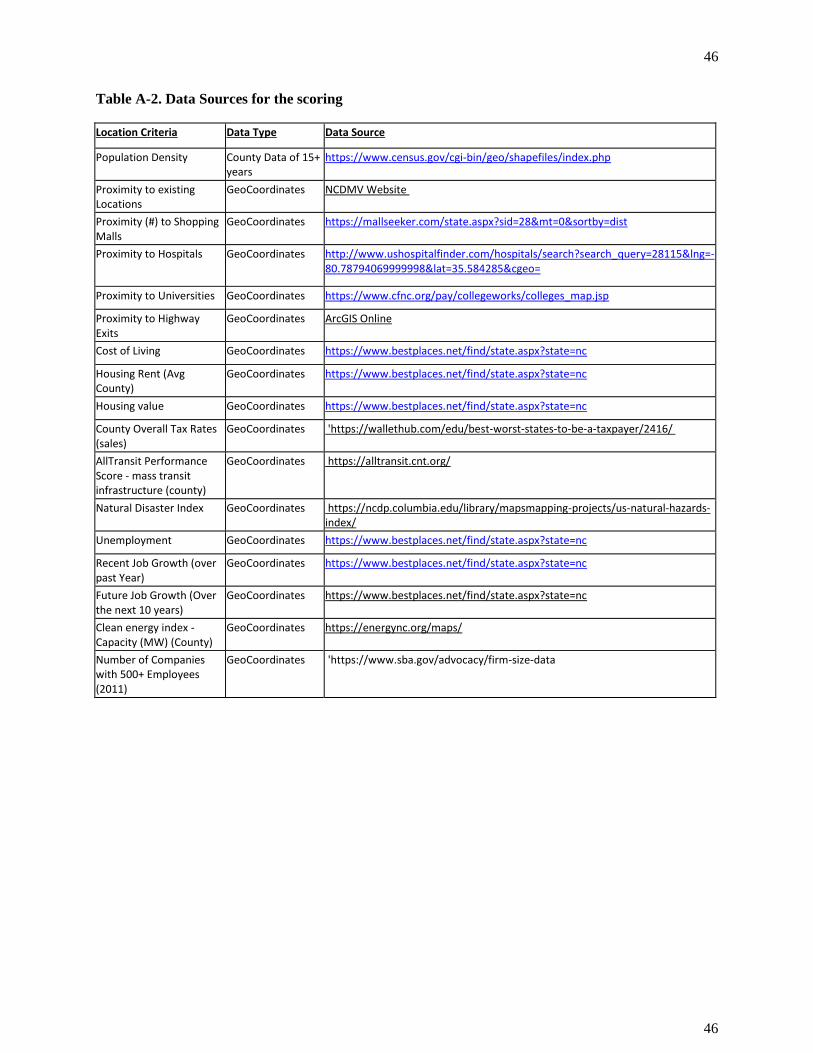
46
46
Table A-2. Data Sources for the scoring
Location Criteria Data Type Data Source
Population Density County Data of 15+ years
https://www.census.gov/cgi-bin/geo/shapefiles/index.php
Proximity to existing Locations
GeoCoordinates NCDMV Website
Proximity (#) to Shopping Malls
GeoCoordinates https://mallseeker.com/state.aspx?sid=28&mt=0&sortby=dist
Proximity to Hospitals GeoCoordinates http://www.ushospitalfinder.com/hospitals/search?search_query=28115&lng=-80.78794069999998&lat=35.584285&cgeo=
Proximity to Universities GeoCoordinates https://www.cfnc.org/pay/collegeworks/colleges_map.jsp
Proximity to Highway Exits
GeoCoordinates ArcGIS Online
Cost of Living GeoCoordinates https://www.bestplaces.net/find/state.aspx?state=nc
Housing Rent (Avg County)
GeoCoordinates https://www.bestplaces.net/find/state.aspx?state=nc
Housing value GeoCoordinates https://www.bestplaces.net/find/state.aspx?state=nc
County Overall Tax Rates (sales)
GeoCoordinates 'https://wallethub.com/edu/best-worst-states-to-be-a-taxpayer/2416/
AllTransit Performance Score - mass transit infrastructure (county)
GeoCoordinates https://alltransit.cnt.org/
Natural Disaster Index GeoCoordinates https://ncdp.columbia.edu/library/mapsmapping-projects/us-natural-hazards-index/
Unemployment GeoCoordinates https://www.bestplaces.net/find/state.aspx?state=nc
Recent Job Growth (over past Year)
GeoCoordinates https://www.bestplaces.net/find/state.aspx?state=nc
Future Job Growth (Over the next 10 years)
GeoCoordinates https://www.bestplaces.net/find/state.aspx?state=nc
Clean energy index - Capacity (MW) (County)
GeoCoordinates https://energync.org/maps/
Number of Companies with 500+ Employees (2011)
GeoCoordinates 'https://www.sba.gov/advocacy/firm-size-data
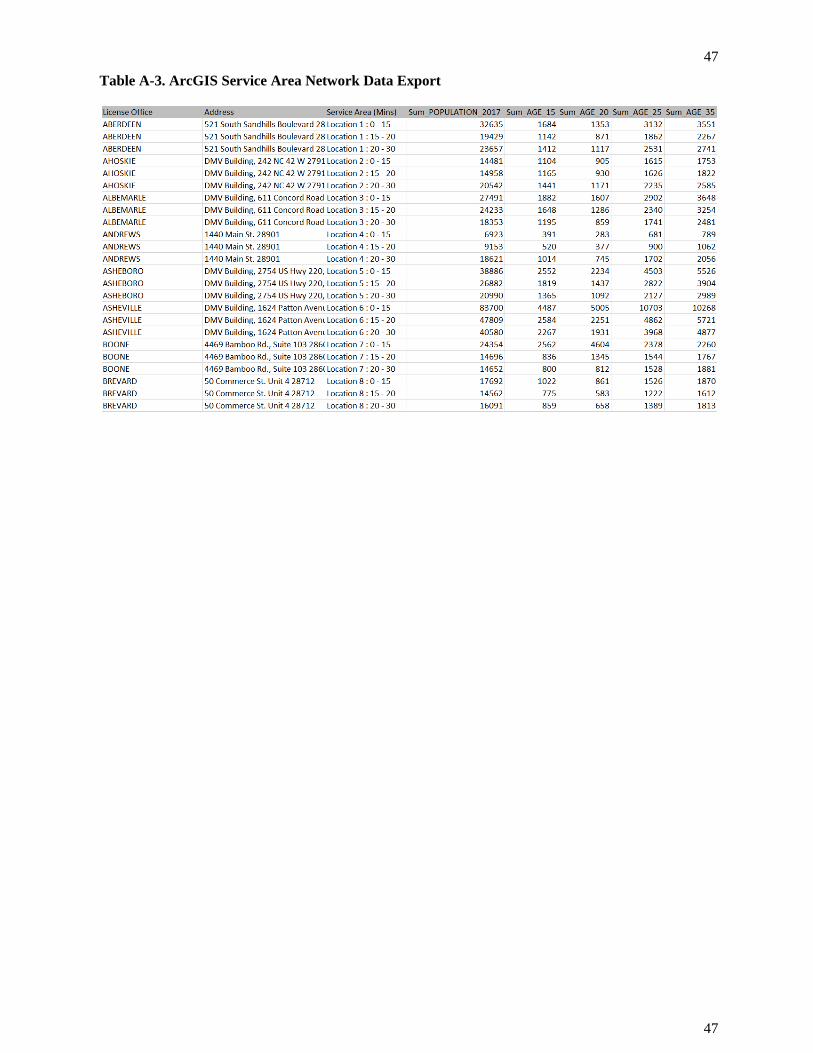
47
47
Table A-3. ArcGIS Service Area Network Data Export
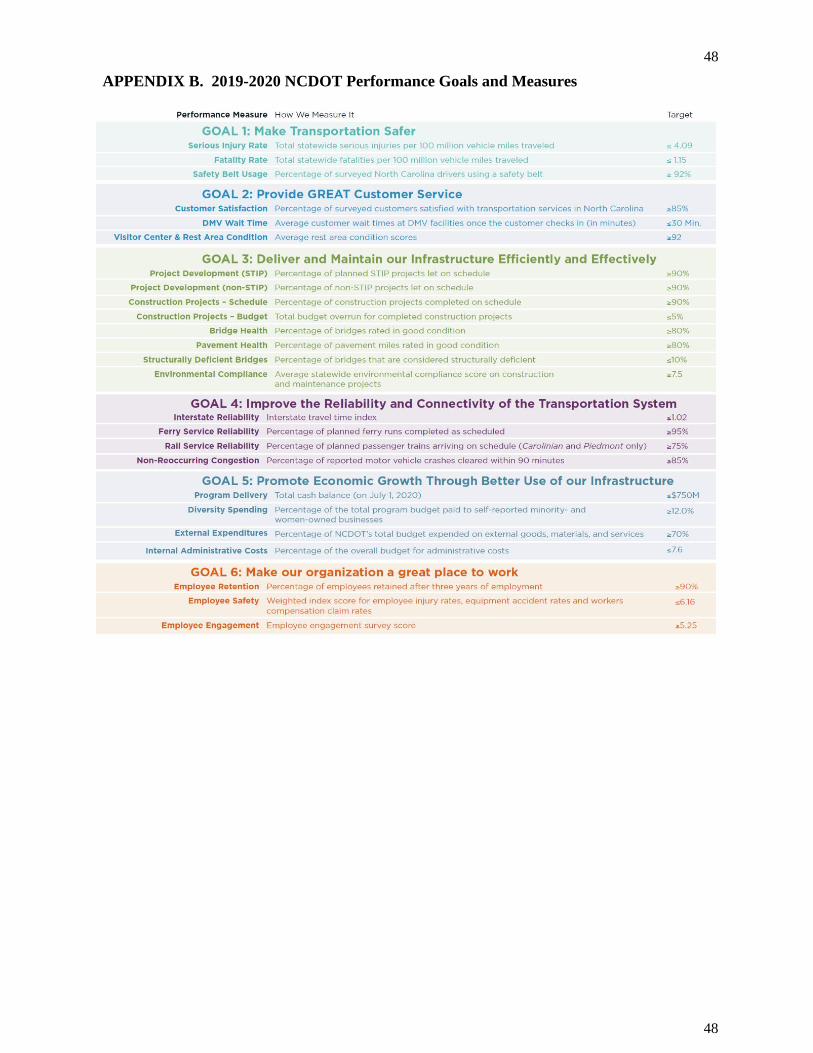
48
48
APPENDIX B. 2019-2020 NCDOT Performance Goals and Measures
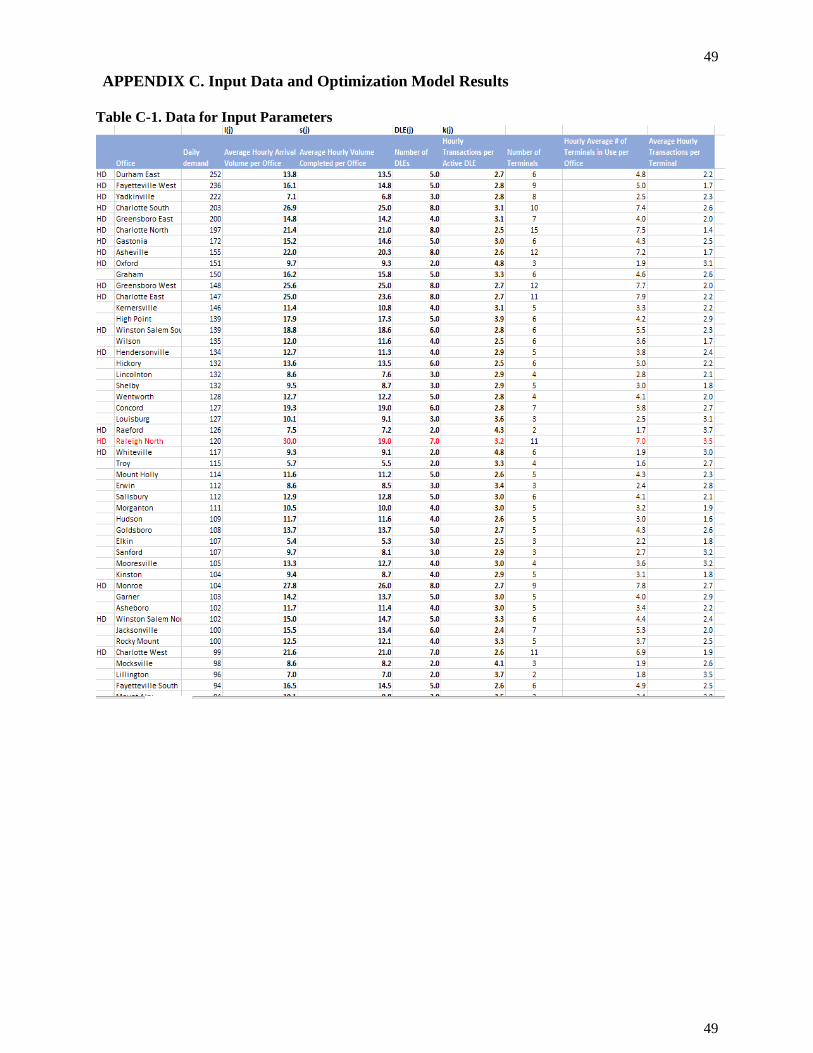
49
49
APPENDIX C. Input Data and Optimization Model Results
Table C-1. Data for Input Parameters
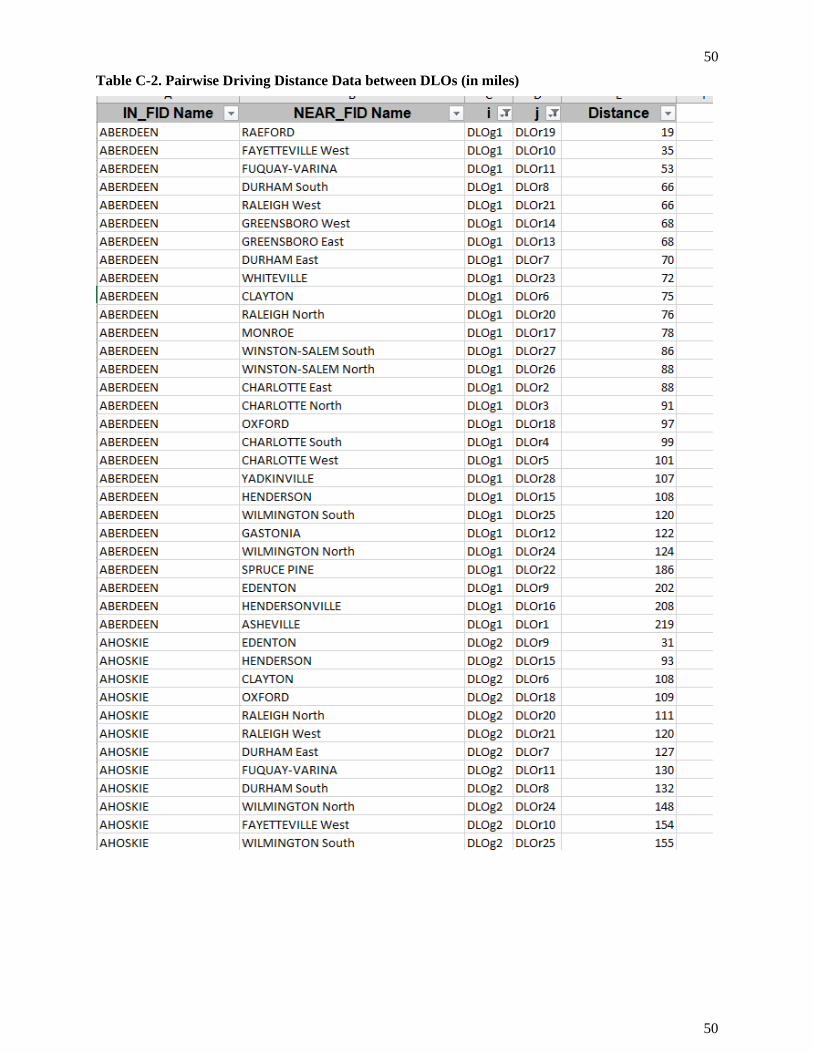
50
50
Table C-2. Pairwise Driving Distance Data between DLOs (in miles)
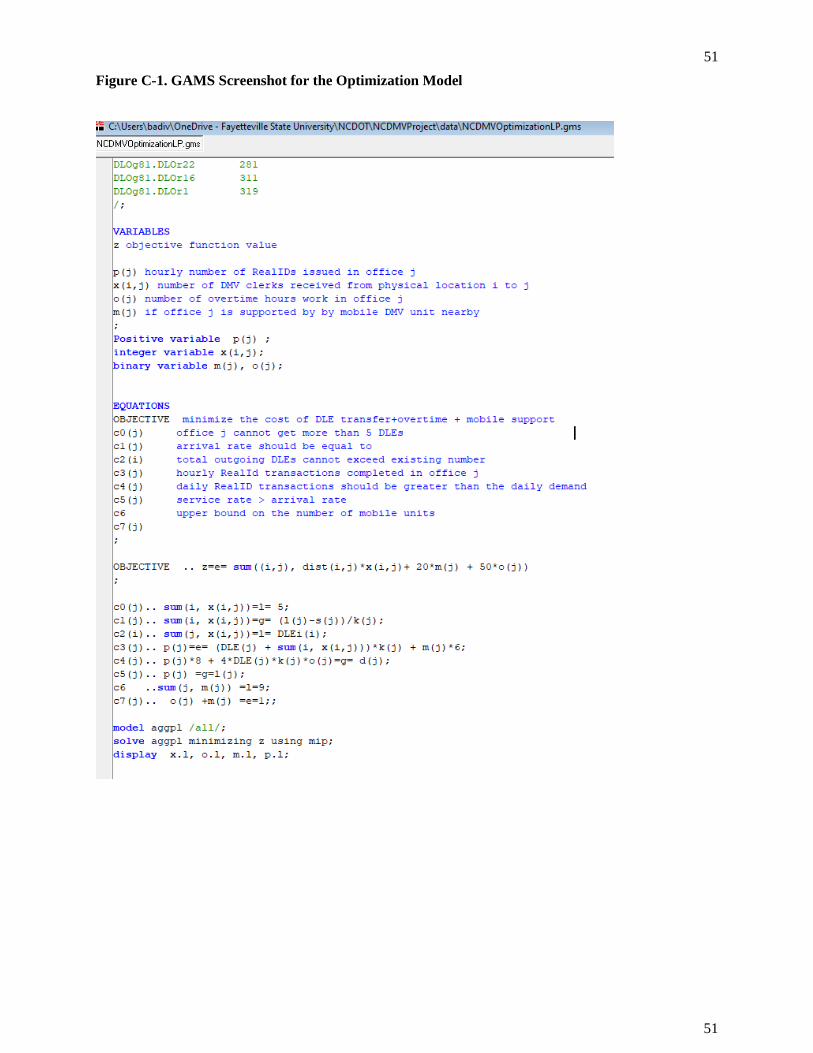
51
51
Figure C-1. GAMS Screenshot for the Optimization Model
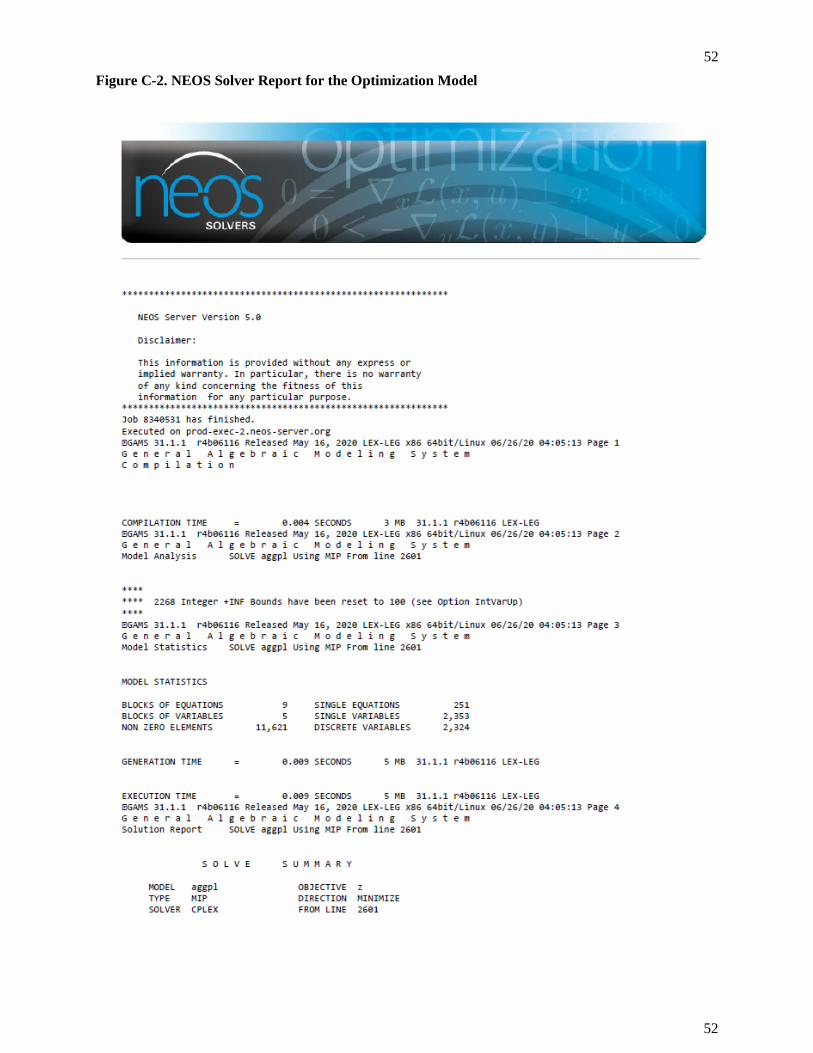
52
52
Figure C-2. NEOS Solver Report for the Optimization Model