Embed Size (px)
Citation preview
NC Demographic Trends Through 2035
House Select Committee on Strategic Transportation Planning and Long Term Funding
Solutions
February 22, 2016
Rebecca Tippett, University of North Carolina
0
2
4
6
8
10
12
14
1990 1993 1996 1999 2002 2005 2008 2011 2014 2017 2020 2023 2026 2029 2032 2035
July
1 P
op
ula
tio
n (
Mil
lio
ns)
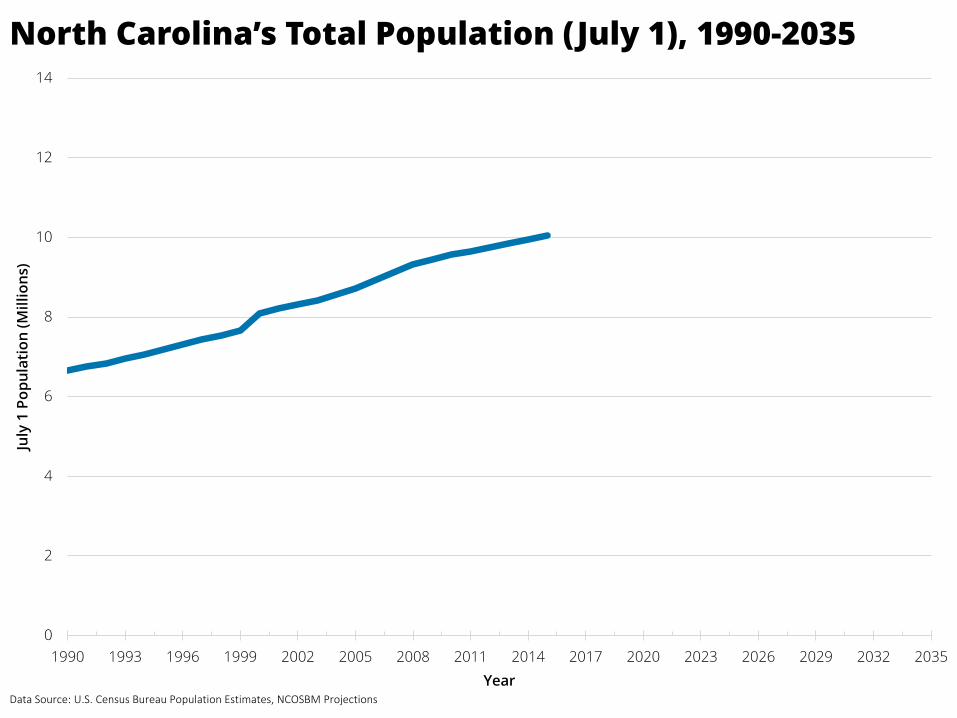
YearData Source: U.S. Census Bureau Population Estimates, NCOSBM Projections
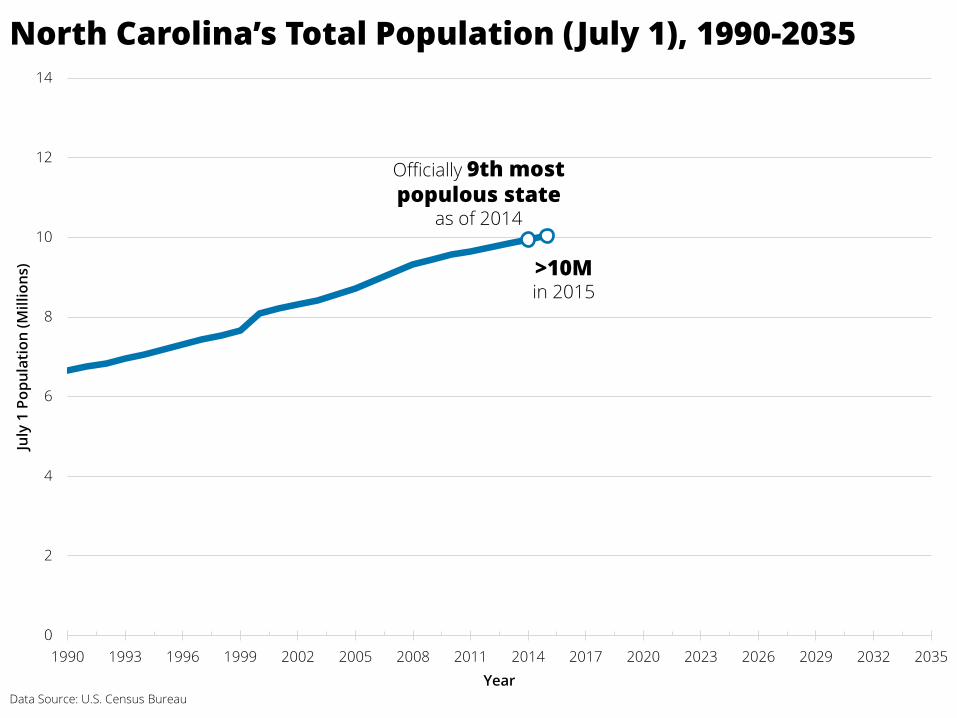
North Carolina’s Total Population (July 1), 1990-2035
0
2
4
6
8
10
12
14
1990 1993 1996 1999 2002 2005 2008 2011 2014 2017 2020 2023 2026 2029 2032 2035
July
1 P
op
ula
tio
n (
Mil
lio
ns)
Year
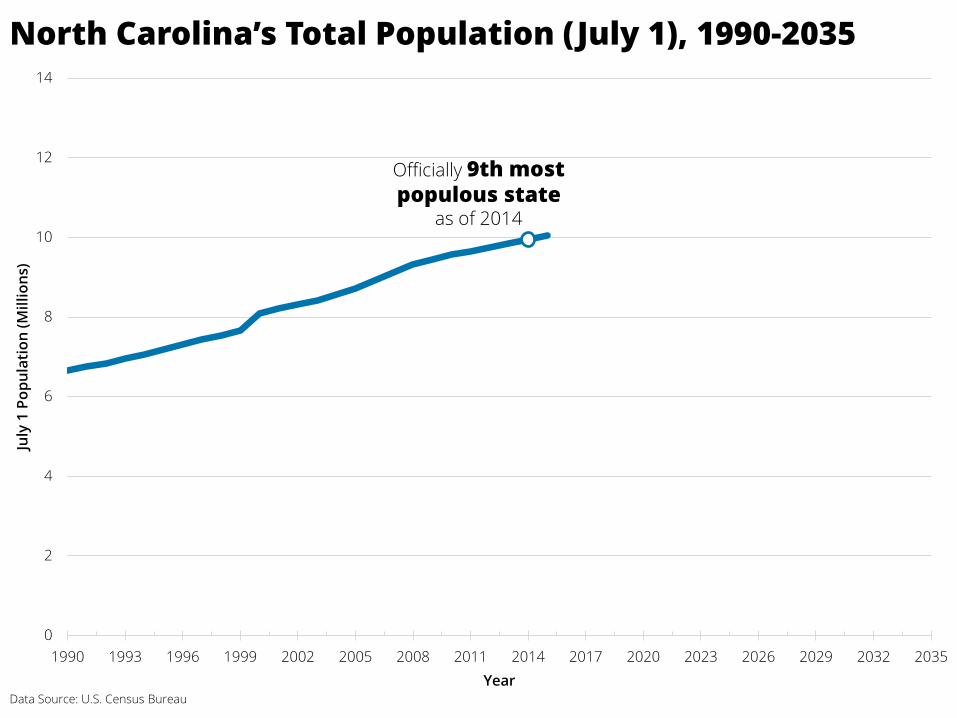
Officially 9th most populous state
as of 2014
North Carolina’s Total Population (July 1), 1990-2035
Data Source: U.S. Census Bureau
0
2
4
6
8
10
12
14
1990 1993 1996 1999 2002 2005 2008 2011 2014 2017 2020 2023 2026 2029 2032 2035
July
1 P
op
ula
tio
n (
Mil
lio
ns)
Year
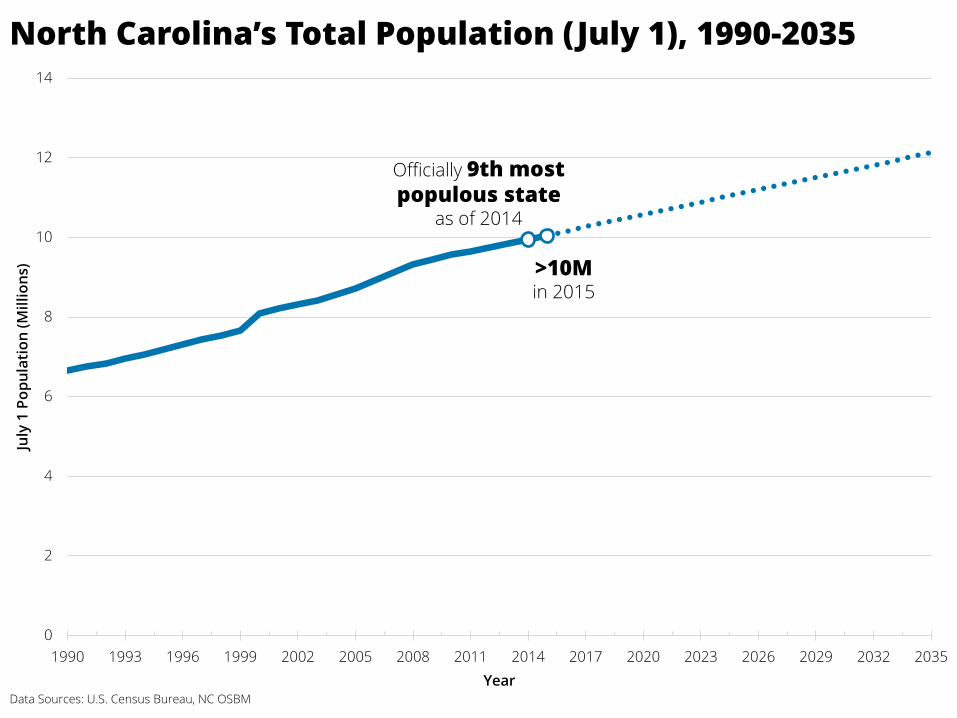
Officially 9th most populous state
as of 2014
>10M in 2015
North Carolina’s Total Population (July 1), 1990-2035
Data Source: U.S. Census Bureau
0
2
4
6
8
10
12
14
1990 1993 1996 1999 2002 2005 2008 2011 2014 2017 2020 2023 2026 2029 2032 2035
July
1 P
op
ula
tio
n (
Mil
lio
ns)
Year
Officially 9th most populous state
as of 2014
>10M in 2015
North Carolina’s Total Population (July 1), 1990-2035
Data Sources: U.S. Census Bureau, NC OSBM
0
2
4
6
8
10
12
14
1990 1993 1996 1999 2002 2005 2008 2011 2014 2017 2020 2023 2026 2029 2032 2035
July
1 P
op
ula
tio
n (
Mil
lio
ns)
Year
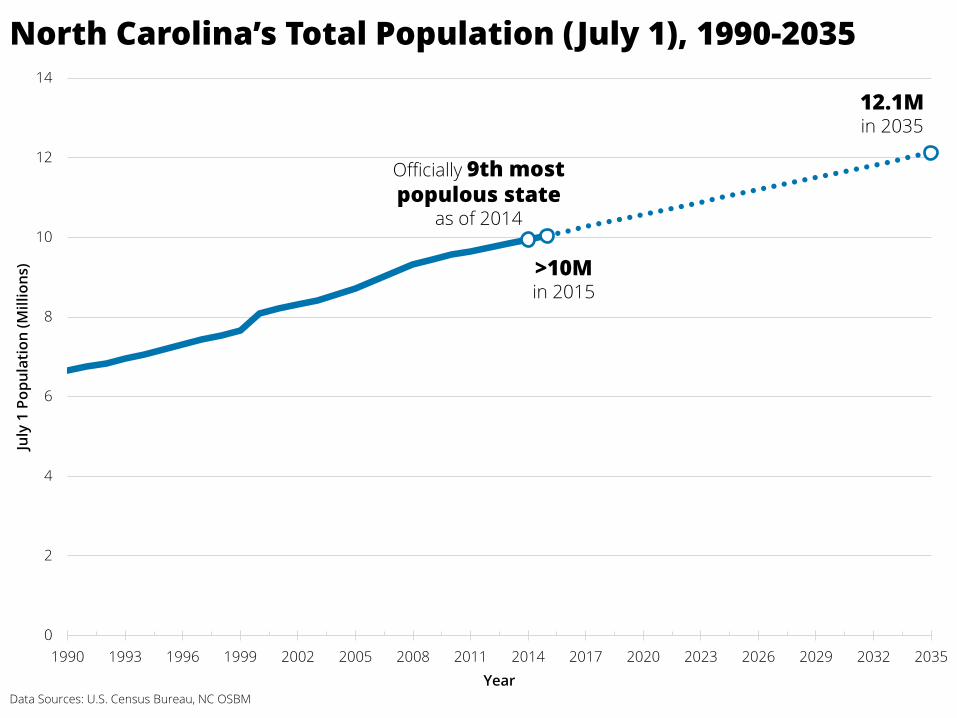
Officially 9th most populous state
as of 2014
>10M in 2015
12.1M in 2035
Data Sources: U.S. Census Bureau, NC OSBM
North Carolina’s Total Population (July 1), 1990-2035
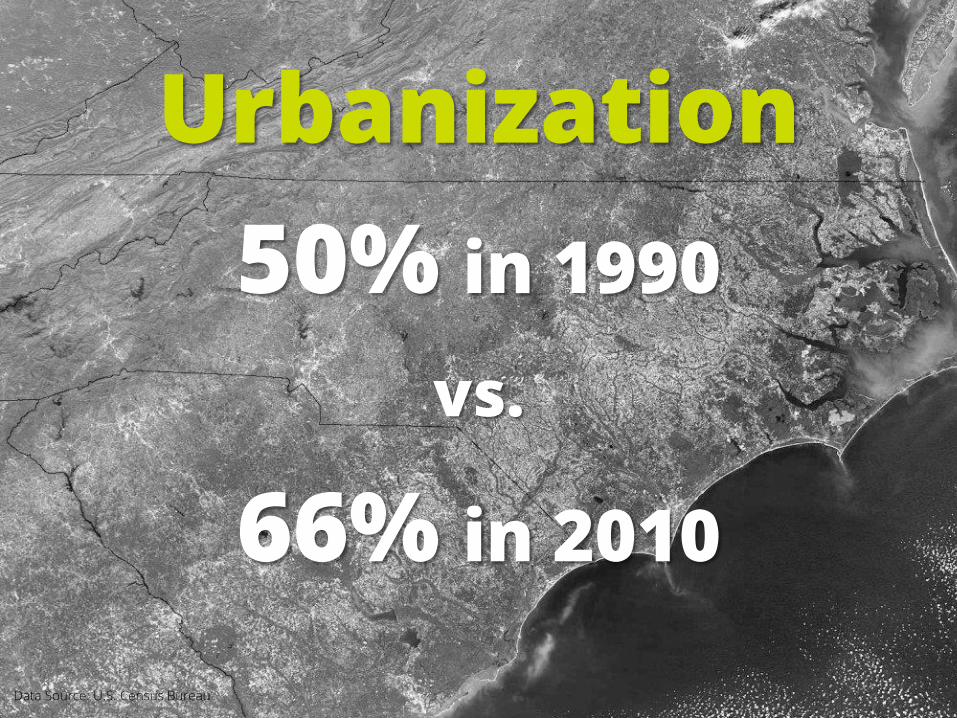
Urbanization
50% in 1990
vs.
66% in 2010
Data Source: U.S. Census Bureau
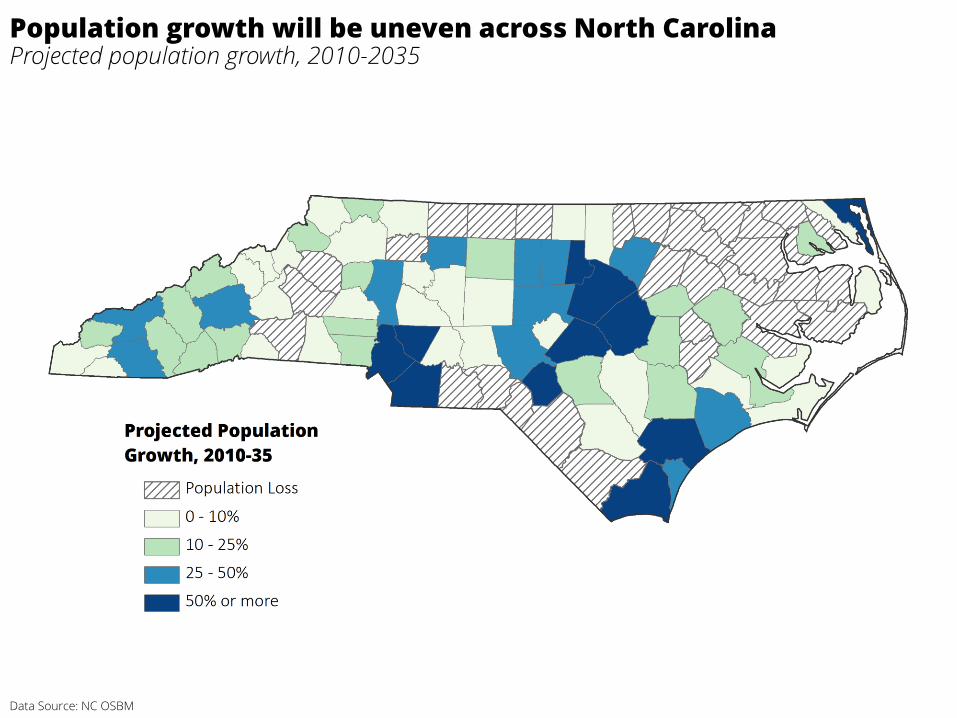
Population growth will be uneven across North CarolinaProjected population growth, 2010-2035
Data Source: NC OSBM
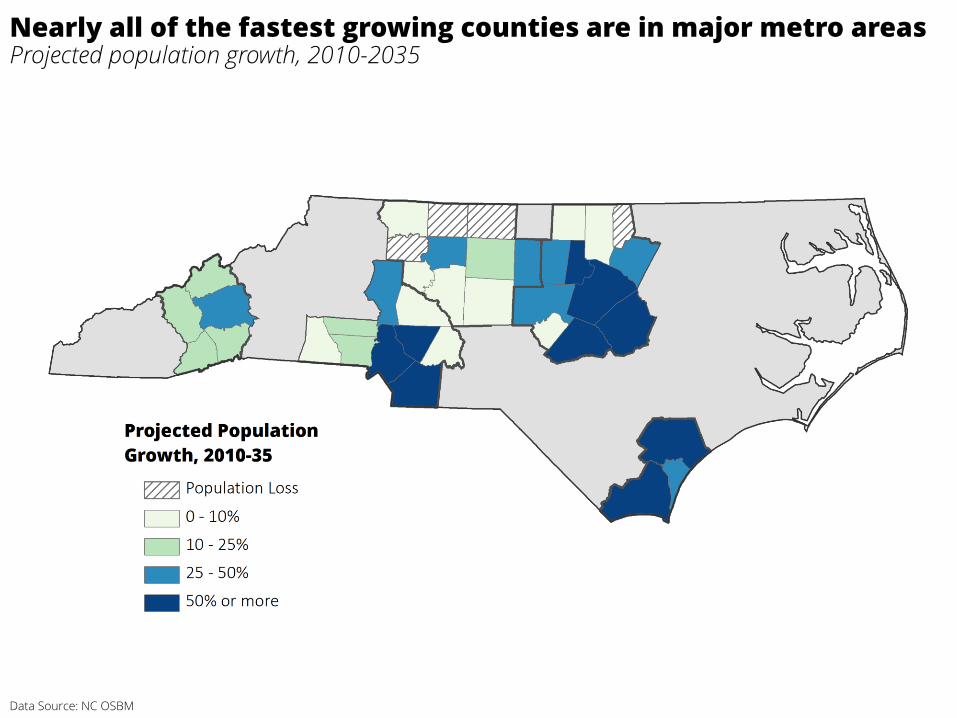
Data Source: NC OSBM
Nearly all of the fastest growing counties are in major metro areasProjected population growth, 2010-2035
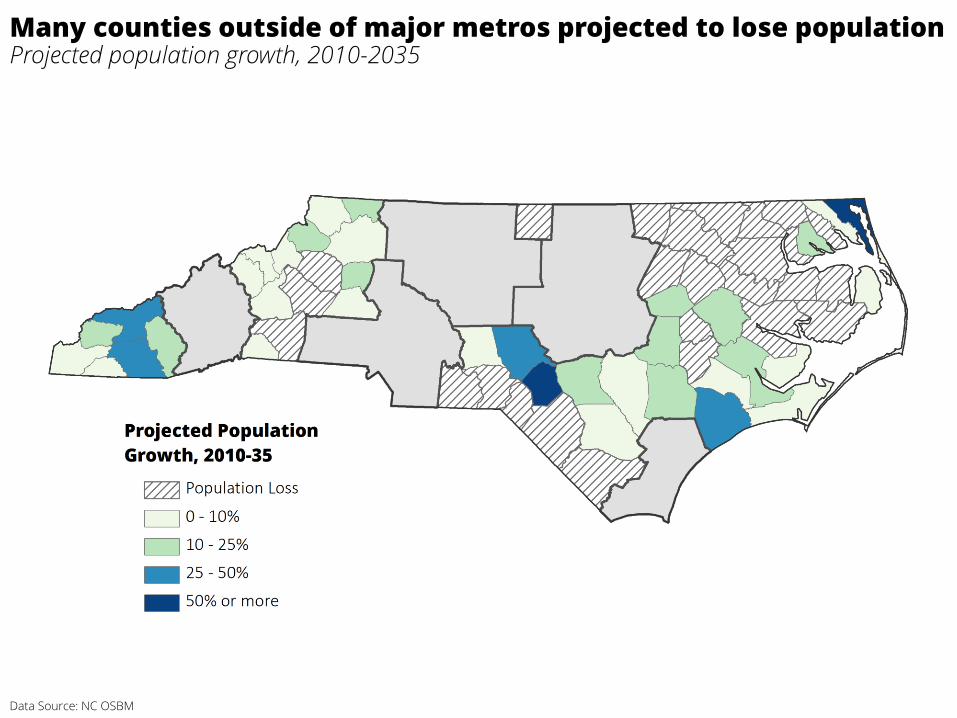
Data Source: NC OSBM
Many counties outside of major metros projected to lose populationProjected population growth, 2010-2035
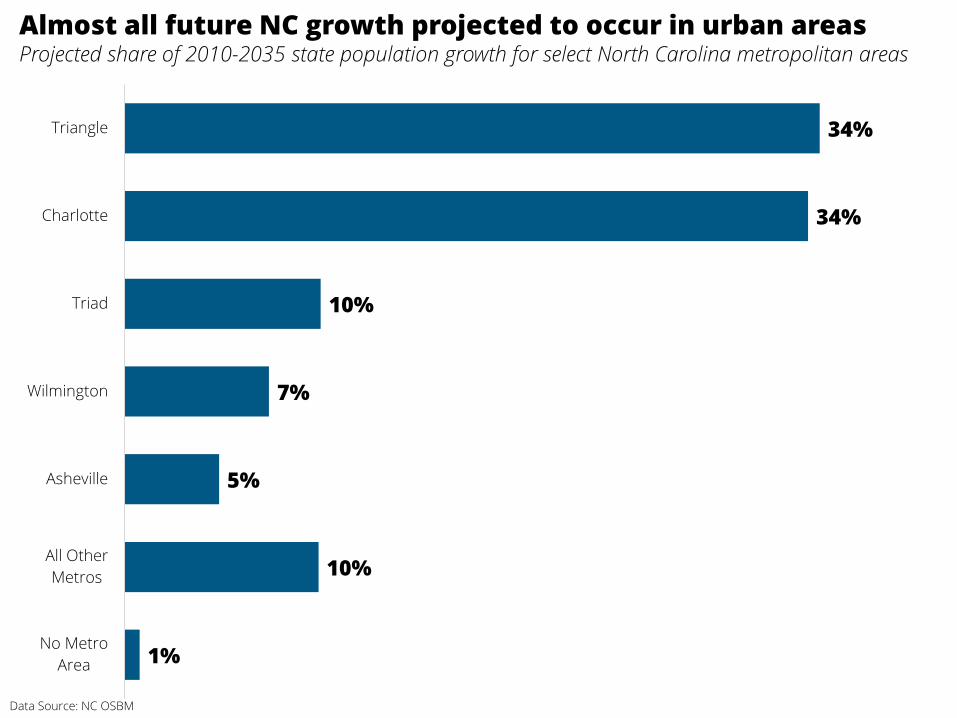
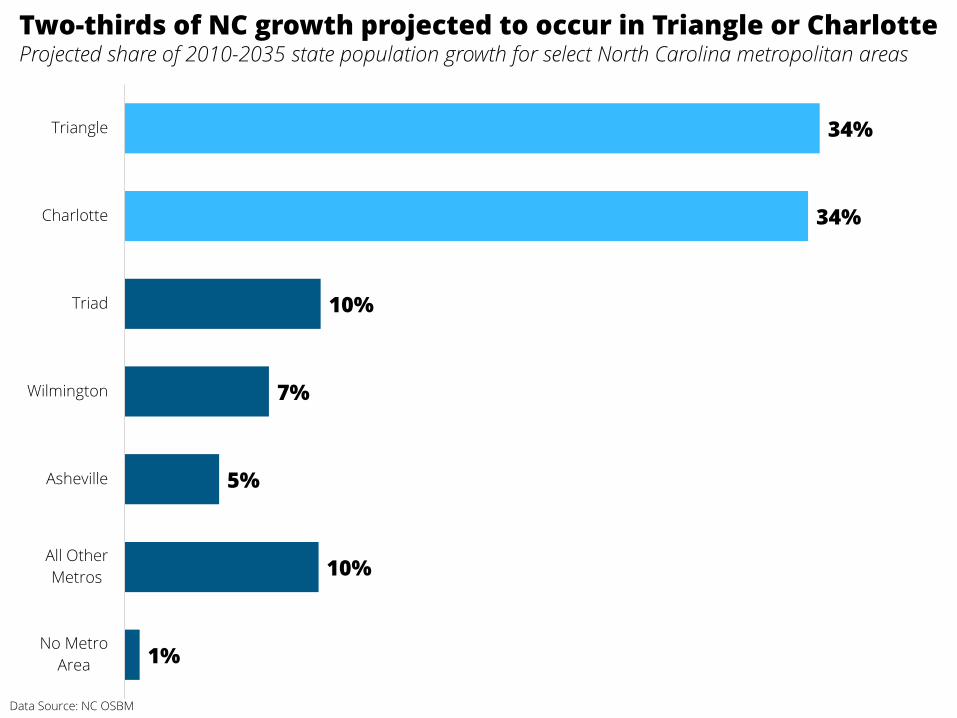
34%
34%
10%
7%
5%
10%
1%
Triangle
Charlotte
Triad
Wilmington
Asheville
All Other
Metros
No Metro
Area
Almost all future NC growth projected to occur in urban areasProjected share of 2010-2035 state population growth for select North Carolina metropolitan areas
Data Source: NC OSBM
34%
34%
10%
7%
5%
10%
1%
Triangle
Charlotte
Triad
Wilmington
Asheville
All Other
Metros
No Metro
Area
Two-thirds of NC growth projected to occur in Triangle or CharlotteProjected share of 2010-2035 state population growth for select North Carolina metropolitan areas
Data Source: NC OSBM
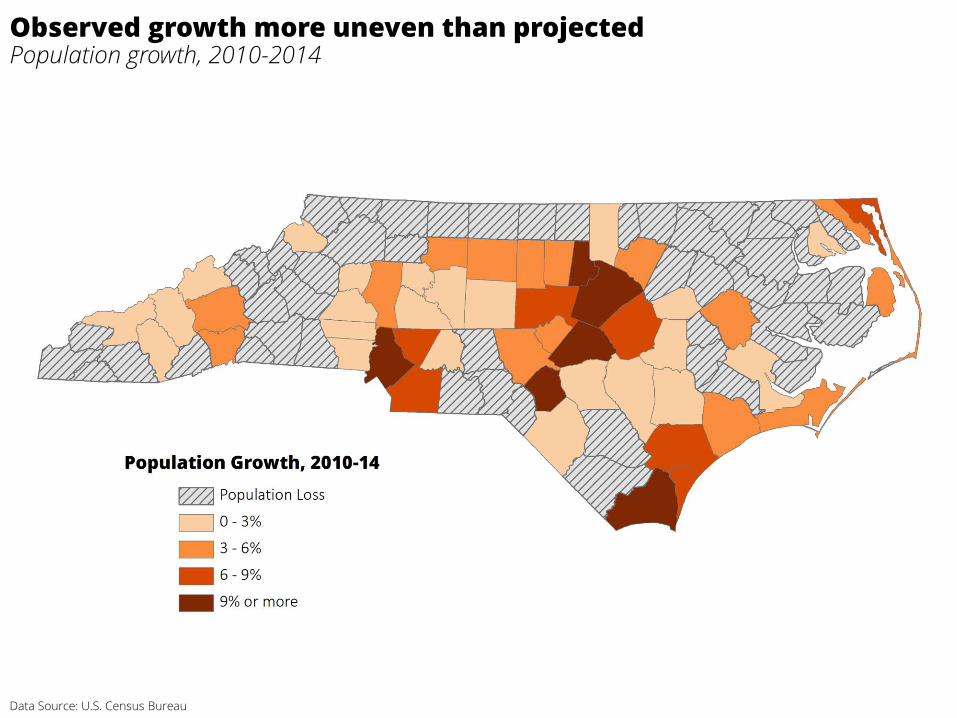
Observed growth more uneven than projectedPopulation growth, 2010-2014
Data Source: U.S. Census Bureau
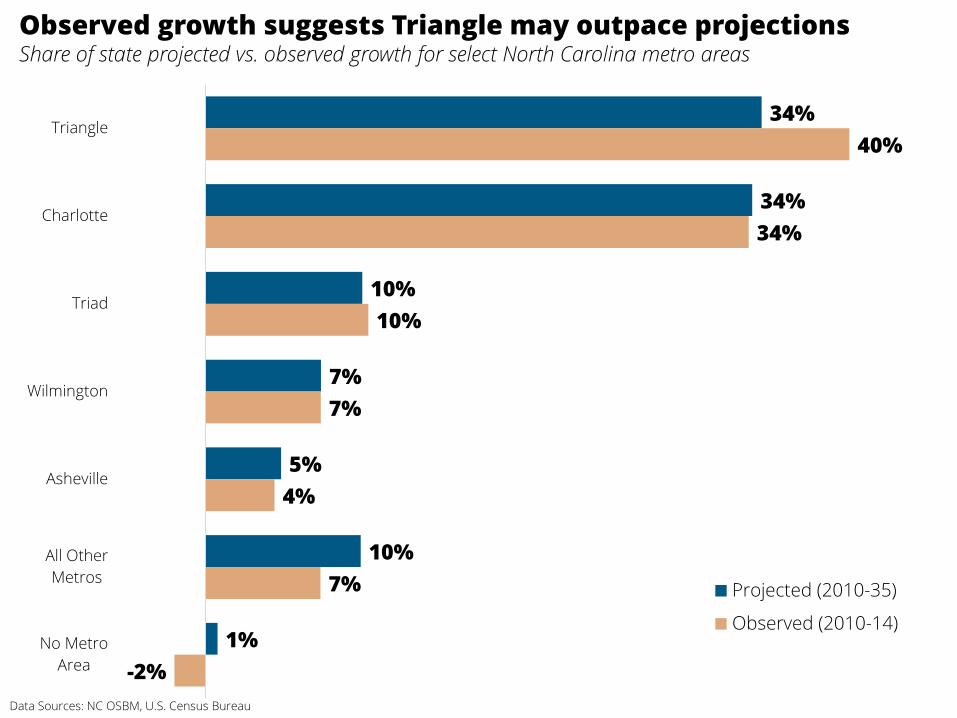
34%
34%
10%
7%
5%
10%
1%
40%
34%
10%
7%
4%
7%
-2%
Triangle
Charlotte
Triad
Wilmington
Asheville
All Other
Metros
No Metro
Area
Projected (2010-35)
Observed (2010-14)
Observed growth suggests Triangle may outpace projectionsShare of state projected vs. observed growth for select North Carolina metro areas
Data Sources: NC OSBM, U.S. Census Bureau
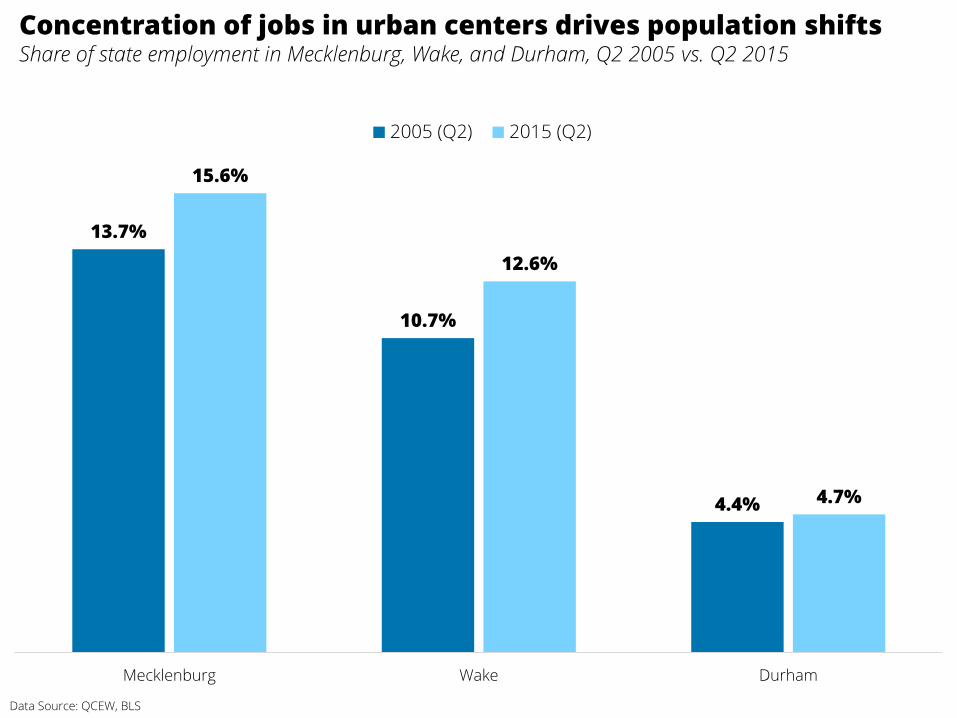
Concentration of jobs in urban centers drives population shiftsShare of state employment in Mecklenburg, Wake, and Durham, Q2 2005 vs. Q2 2015
Data Source: QCEW, BLS
13.7%
10.7%
4.4%
15.6%
12.6%
4.7%
Mecklenburg Wake Durham
2005 (Q2) 2015 (Q2)

-100,000 0 100,000 200,000 300,000 400,000 500,000 600,000
Mecklenburg
Wake
Guilford
Durham
Forsyth
Residents who Work Elsewhere
Resident Workers
Non-Resident Workers
Data Source: 2009-2013 5-Year American Community Survey
More than 40% of NC workers work in these 5 counties Net commuting patterns, 2009-2013
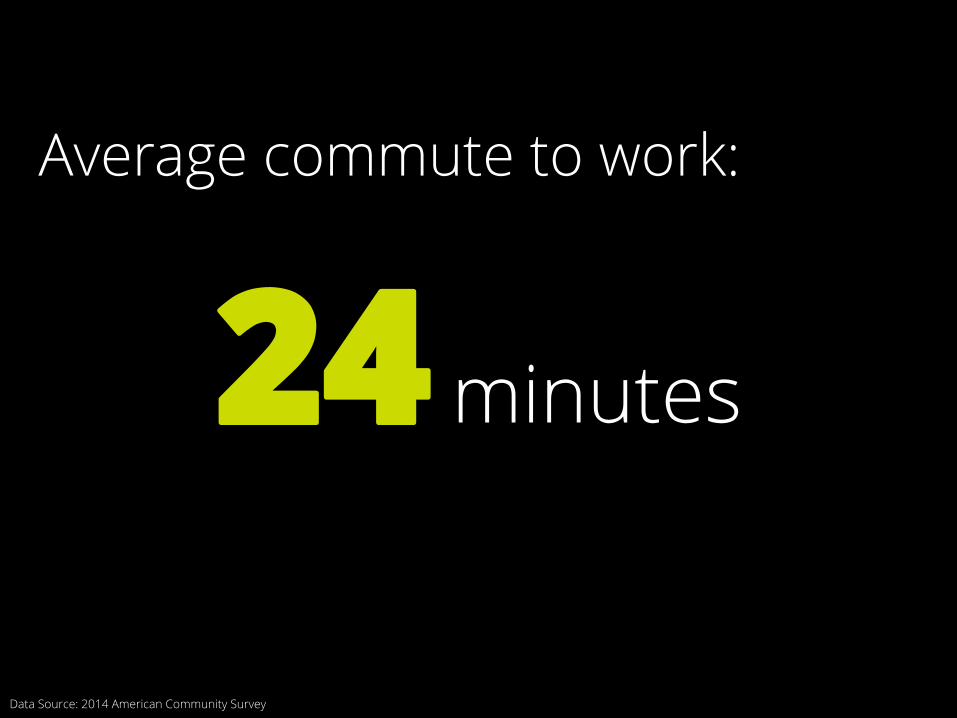
Average commute to work:
24 minutes
Data Source: 2014 American Community Survey
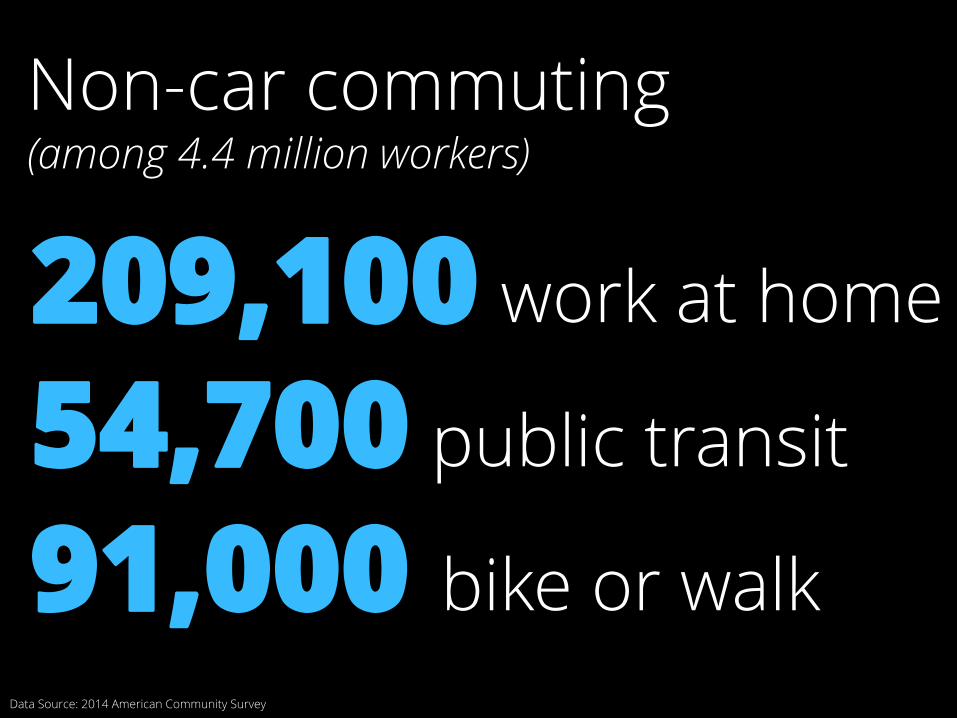
Data Source: 2014 American Community Survey
54,700 public transit
91,000 bike or walk
209,100 work at home
Non-car commuting(among 4.4 million workers)
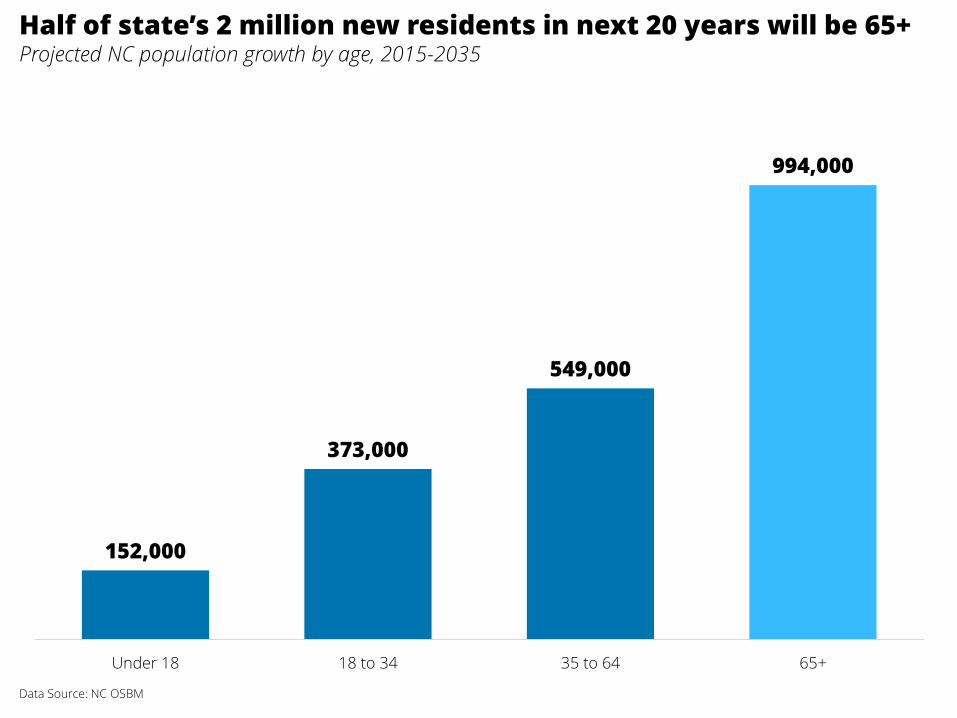
152,000
373,000
549,000
994,000
Under 18 18 to 34 35 to 64 65+
Half of state’s 2 million new residents in next 20 years will be 65+Projected NC population growth by age, 2015-2035
Data Source: NC OSBM
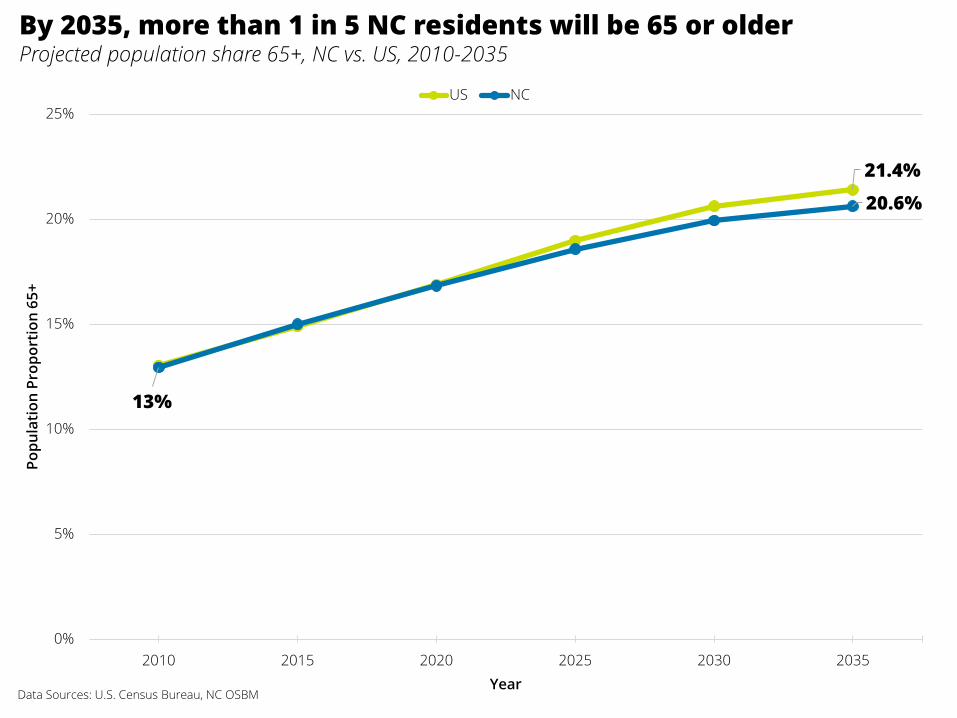
21.4%
13%
20.6%
0%
5%
10%
15%
20%
25%
2010 2015 2020 2025 2030 2035
Po
pu
lati
on
Pro
po
rtio
n 6
5+
Year
US NC
Data Sources: U.S. Census Bureau, NC OSBM
By 2035, more than 1 in 5 NC residents will be 65 or olderProjected population share 65+, NC vs. US, 2010-2035
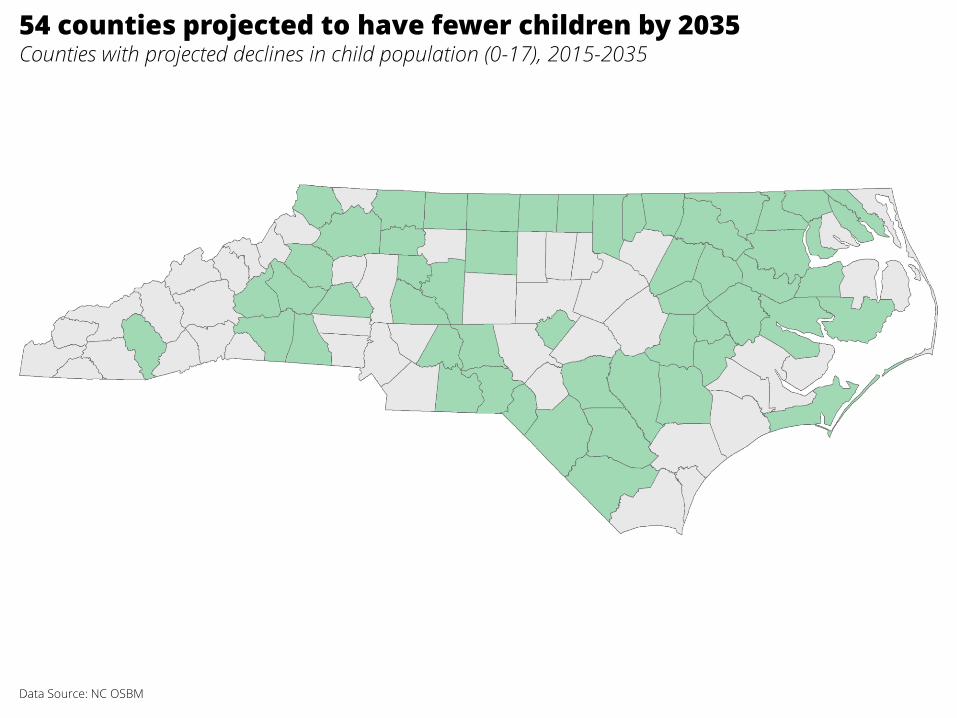
54 counties projected to have fewer children by 2035Counties with projected declines in child population (0-17), 2015-2035
Data Source: NC OSBM
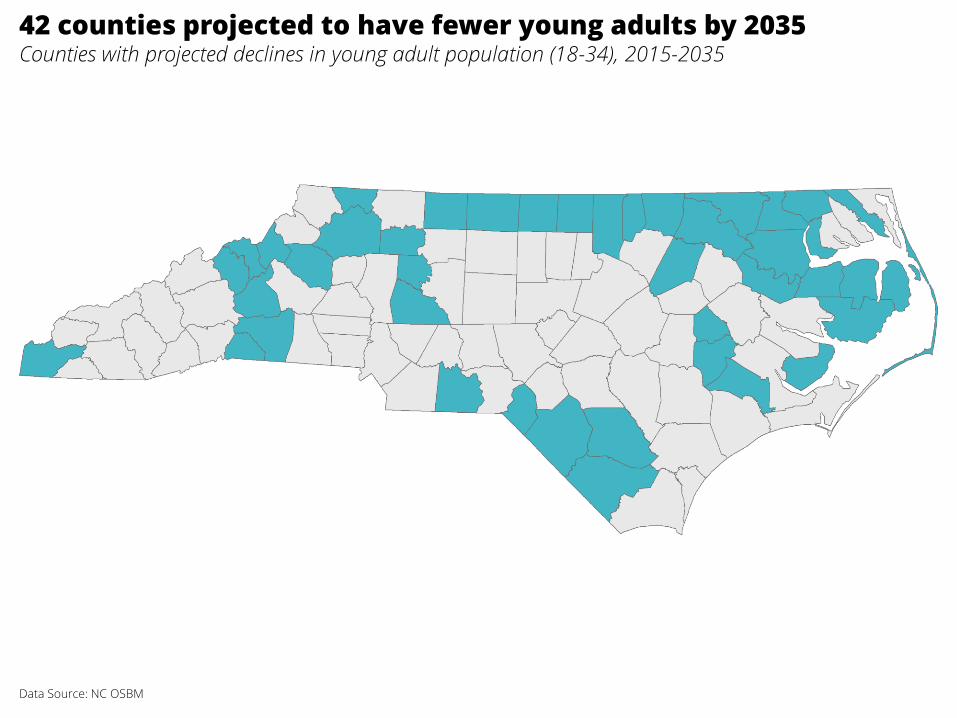
42 counties projected to have fewer young adults by 2035Counties with projected declines in young adult population (18-34), 2015-2035
Data Source: NC OSBM
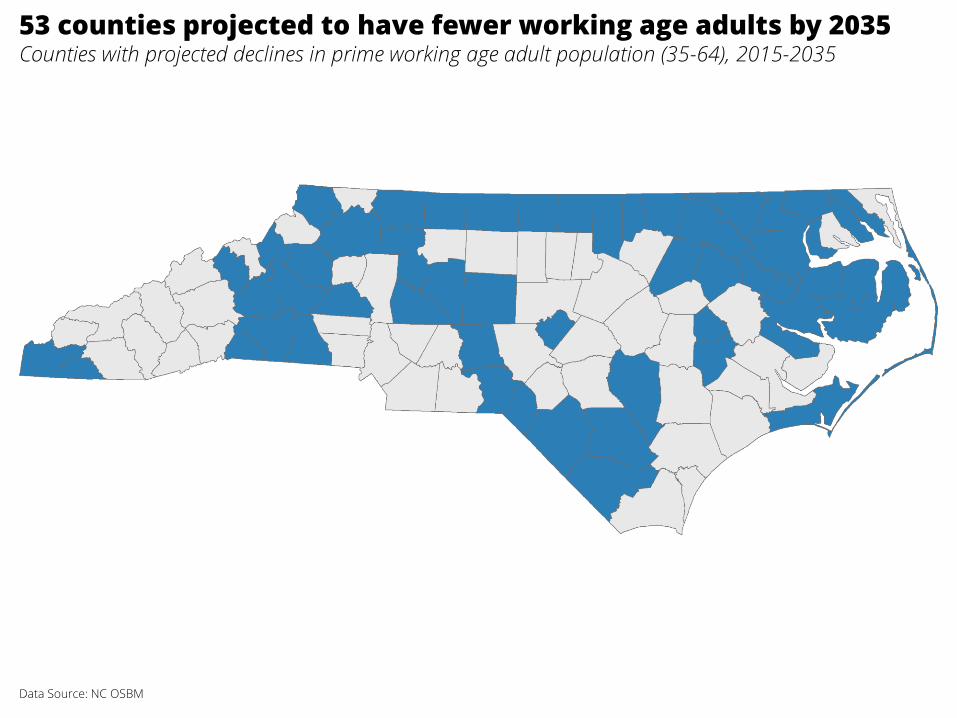
53 counties projected to have fewer working age adults by 2035Counties with projected declines in prime working age adult population (35-64), 2015-2035
Data Source: NC OSBM
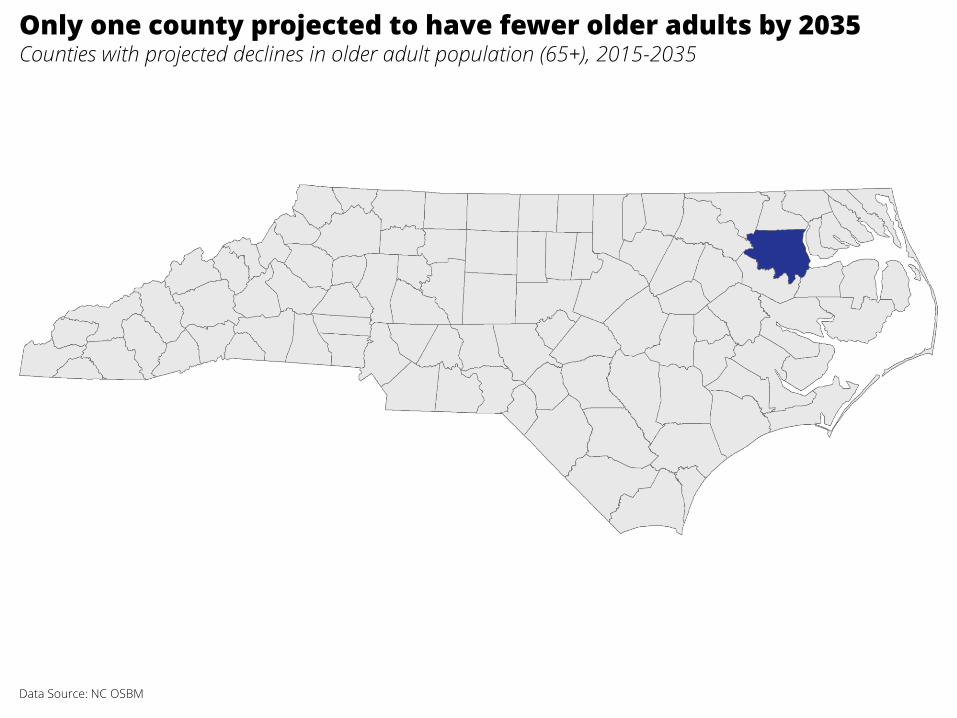
Only one county projected to have fewer older adults by 2035Counties with projected declines in older adult population (65+), 2015-2035
Data Source: NC OSBM
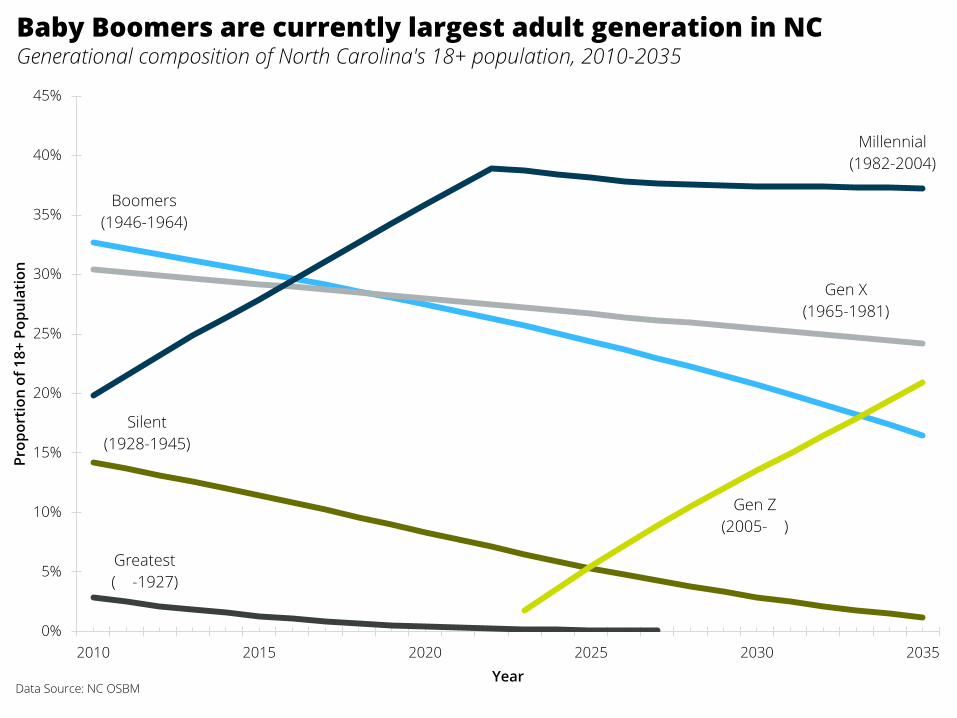
Greatest
( -1927)
Silent
(1928-1945)
Boomers
(1946-1964)
Gen X
(1965-1981)
Millennial
(1982-2004)
Gen Z
(2005- )
0%
5%
10%
15%
20%
25%
30%
35%
40%
45%
2010 2015 2020 2025 2030 2035
Pro
po
rtio
n o
f 1
8+
Po
pu
lati
on
YearData Source: NC OSBM
Baby Boomers are currently largest adult generation in NCGenerational composition of North Carolina's 18+ population, 2010-2035
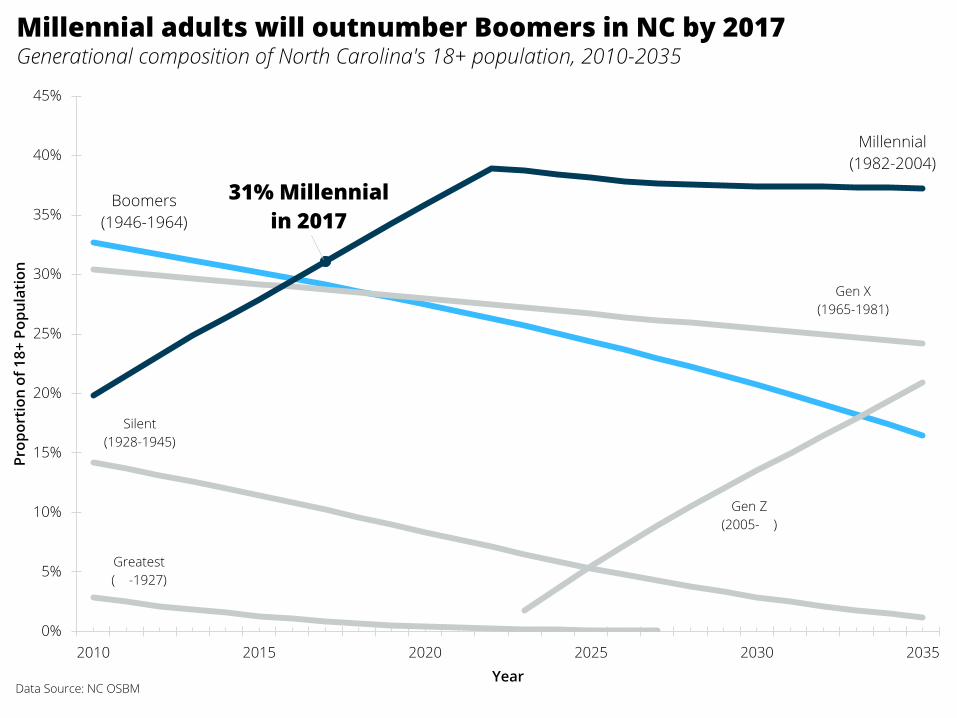
Greatest
( -1927)
Silent
(1928-1945)
Boomers
(1946-1964)
Gen X
(1965-1981)
31% Millennial
in 2017
Millennial
(1982-2004)
Gen Z
(2005- )
0%
5%
10%
15%
20%
25%
30%
35%
40%
45%
2010 2015 2020 2025 2030 2035
Pro
po
rtio
n o
f 1
8+
Po
pu
lati
on
YearData Source: NC OSBM
Millennial adults will outnumber Boomers in NC by 2017Generational composition of North Carolina's 18+ population, 2010-2035
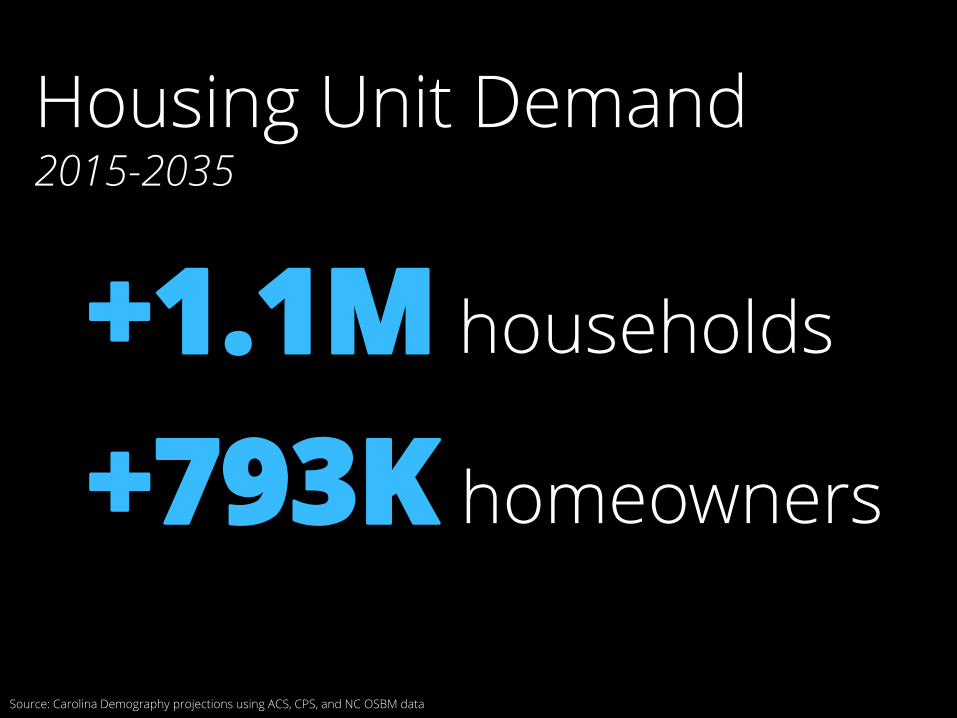
Source: Carolina Demography projections using ACS, CPS, and NC OSBM data
+793K homeowners
+1.1M households
Housing Unit Demand2015-2035
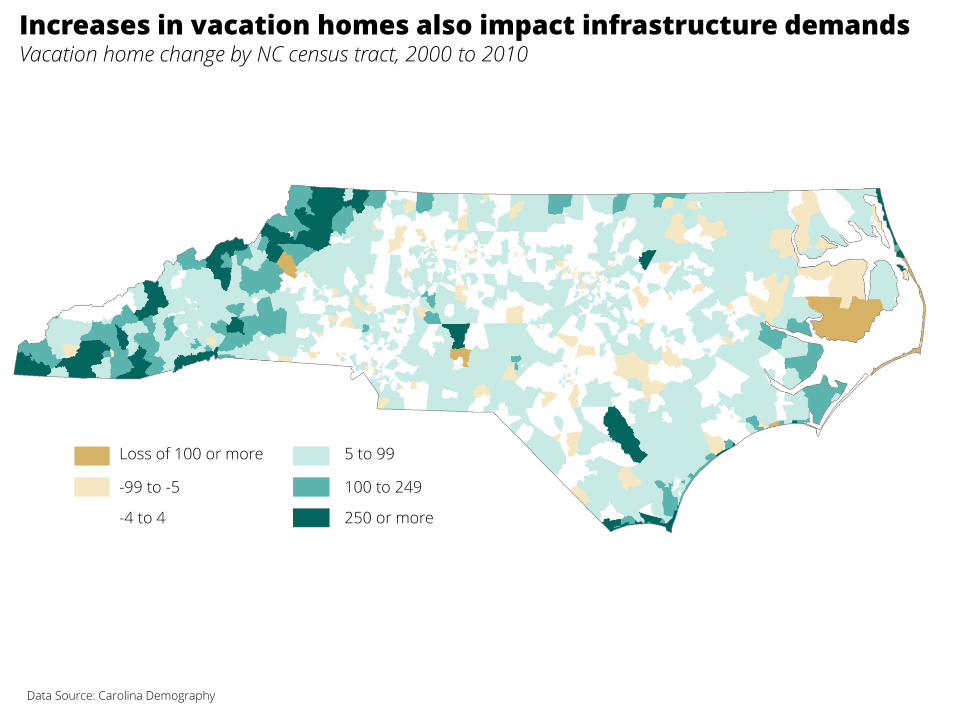
Increases in vacation homes also impact infrastructure demandsVacation home change by NC census tract, 2000 to 2010
Data Source: Carolina Demography
Loss of 100 or more
-99 to -5
-4 to 4
5 to 99
100 to 249
250 or more
We help organizations make data-driven decisions.DEMOGRAPHIC RESEARCH AND CONSULTING
Contact us:
[email protected] | (919) 962-6151
Learn more:
http://demography.cpc.unc.edu | @ncdemography