Embed Size (px)
Citation preview
NC Collaboratory Final Report
February 8, 2021
Title: Tracking SARS-CoV-2 in the Wastewater Across a Range of North Carolina Municipalities
Short title: NC Wastewater Pathogen Research Network (NC WW Path)
Rachel T. Noble (lead PI, UNC Chapel Hill Institute of Marine Sciences), Francis de los Reyes (coPI, North Carolina State University), Angela Harris (coPI, North Carolina State University), Jill Stewart (coPI, UNC Chapel Hill Gillings School of Global Public Health), Larry Cahoon (coPI, UNC Wilmington), Lawrence Engel (coPI, UNC Chapel Hill Gillings School of Global Public Health), Art Frampton (coPI, UNC Wilmington), David Holcomb (coPI, UNC Chapel Hill Gillings School of Global Public Health), Jane Hoppin (coPI, North Carolina State University), Helena Mitasova (coPI, North Carolina State University), Mariya Munir (coPI, UNC Charlotte), Marc Serre (coPI, UNC Chapel Hill Gillings School of Global Public Health)
Advisors: Virginia T. Guidry (NC DHHS), Steven Berkowitz (NC DHHS), Ariel Christensen (NC DHHS), Sheila Holman (NC DEQ), Danny Smith (NC DEQ), Rick Bolich (NC DEQ), and Melanie Williams (NC DEQ)
Funding period: May 4, 2020 through December 30, 2020
BACKGROUND: The novel coronavirus referred to as SARS-CoV-2 causes severe respiratory distress, therefore its label as a SARS-like virus (Severe Acute Respiratory Syndrome). The disease that SARS-CoV-2 causes is referred to as COVID-19 (Coronavirus Infectious Disease 19). COVID-19 is caused by a group of viruses within the family “Coronaviridae” within the genus Betacoronavirus. Coronaviruses are positive-sense single-stranded RNA viruses. SARS-CoV-2 is contagious in humans and is the causative agent of a major pandemic outbreak that initiated in the Wuhan Region of China. At the current time, millions of cases have been counted, with case fatality rates (CFR) that range from less than 1% to as high at 15% in specific populations. Over the course of a pandemic that has seen millions of deaths, clinical testing is now well-entrenched in most countries. At the writing of this document (16 January 2021), over 195 universities, 983 sites, with 45 countries represented (https://www.covid19wbec.org/covidpoops19) globally were participating in wastewater-based epidemiological studies around the world. Furthermore, over the course of 2020, a collaborative team outlined the needs for wastewater-based epidemiology to provide important information on aggregate levels of community disease in a peer-reviewed publication (e.g. Bivins et al., 2020). It was noted early in the pandemic that quantification of the SARS-CoV-2 RNA in wastewater was a key, but often complex, step in being able to use wastewater-based epidemiology for public
health management (WBE, e.g. Medema et al., 2020). It has already been shown that the tools for quantification, if conducted at a high level of technical molecular proficiency, can be accurate for understanding the dynamics of the pandemic in a way that is non-invasive and aggregate. Furthermore, cross-laboratory studies have shown that even if teams of researchers use slightly different approaches and materials, they tend to generate similar SARS-CoV-2 data for wastewater-based analyses (Pecson et al., 2020).
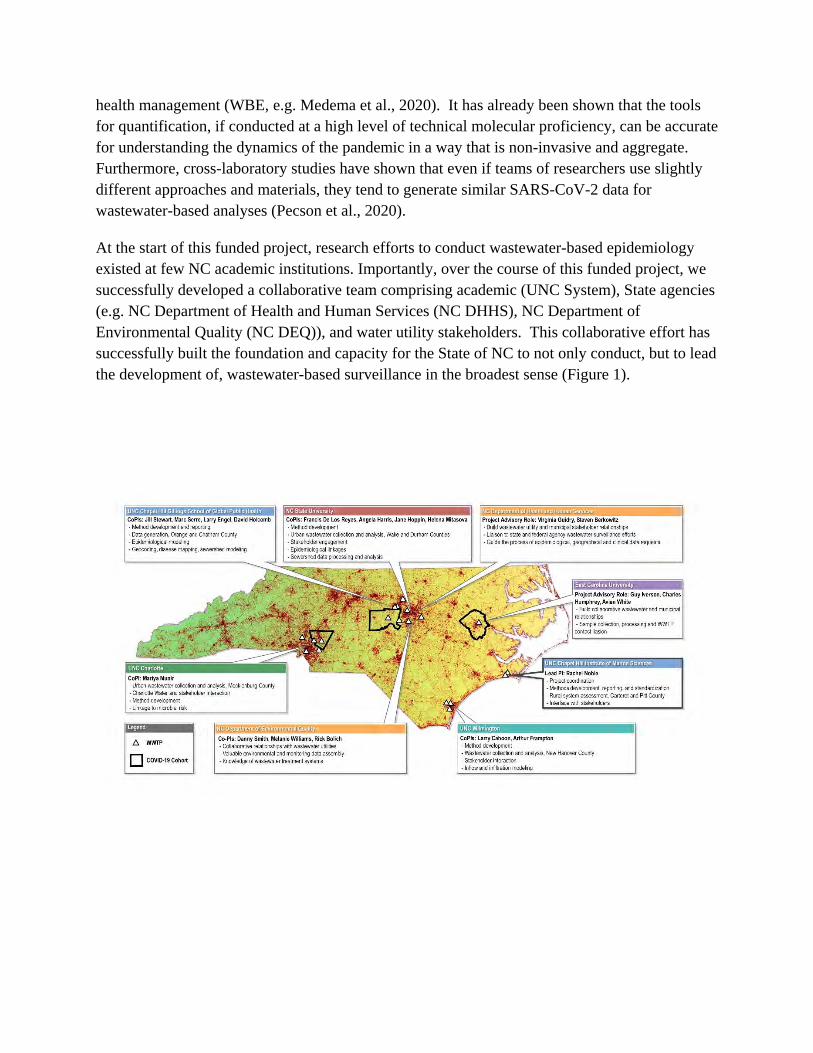
At the start of this funded project, research efforts to conduct wastewater-based epidemiology existed at few NC academic institutions. Importantly, over the course of this funded project, we successfully developed a collaborative team comprising academic (UNC System), State agencies (e.g. NC Department of Health and Human Services (NC DHHS), NC Department of Environmental Quality (NC DEQ)), and water utility stakeholders. This collaborative effort has successfully built the foundation and capacity for the State of NC to not only conduct, but to lead the development of, wastewater-based surveillance in the broadest sense (Figure 1).
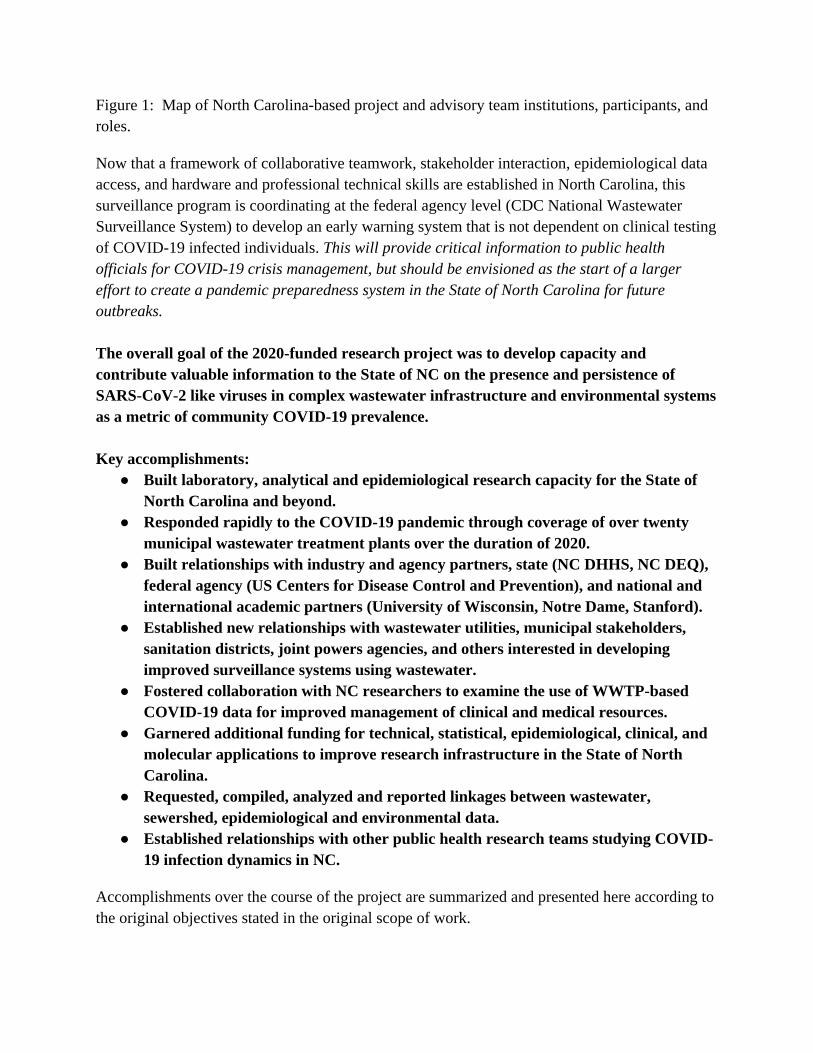
Figure 1: Map of North Carolina-based project and advisory team institutions, participants, and roles.
Now that a framework of collaborative teamwork, stakeholder interaction, epidemiological data access, and hardware and professional technical skills are established in North Carolina, this surveillance program is coordinating at the federal agency level (CDC National Wastewater Surveillance System) to develop an early warning system that is not dependent on clinical testing of COVID-19 infected individuals. This will provide critical information to public health officials for COVID-19 crisis management, but should be envisioned as the start of a larger effort to create a pandemic preparedness system in the State of North Carolina for future outbreaks.
The overall goal of the 2020-funded research project was to develop capacity and contribute valuable information to the State of NC on the presence and persistence of SARS-CoV-2 like viruses in complex wastewater infrastructure and environmental systems as a metric of community COVID-19 prevalence.
Key accomplishments: ● Built laboratory, analytical and epidemiological research capacity for the State of
North Carolina and beyond. ● Responded rapidly to the COVID-19 pandemic through coverage of over twenty
municipal wastewater treatment plants over the duration of 2020. ● Built relationships with industry and agency partners, state (NC DHHS, NC DEQ),
federal agency (US Centers for Disease Control and Prevention), and national and international academic partners (University of Wisconsin, Notre Dame, Stanford).
● Established new relationships with wastewater utilities, municipal stakeholders, sanitation districts, joint powers agencies, and others interested in developing improved surveillance systems using wastewater.
● Fostered collaboration with NC researchers to examine the use of WWTP-based COVID-19 data for improved management of clinical and medical resources.
● Garnered additional funding for technical, statistical, epidemiological, clinical, and molecular applications to improve research infrastructure in the State of North Carolina.
● Requested, compiled, analyzed and reported linkages between wastewater, sewershed, epidemiological and environmental data.
● Established relationships with other public health research teams studying COVID-19 infection dynamics in NC.
Accomplishments over the course of the project are summarized and presented here according to the original objectives stated in the original scope of work.
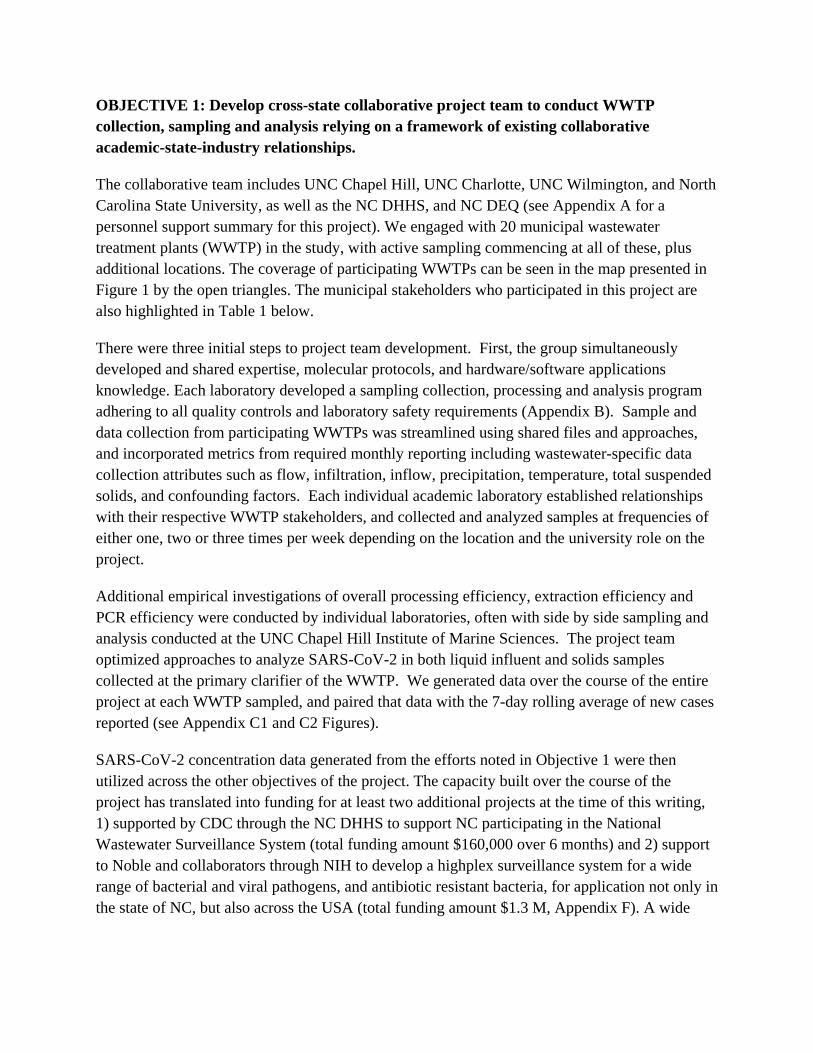
OBJECTIVE 1: Develop cross-state collaborative project team to conduct WWTP collection, sampling and analysis relying on a framework of existing collaborative academic-state-industry relationships.
The collaborative team includes UNC Chapel Hill, UNC Charlotte, UNC Wilmington, and North Carolina State University, as well as the NC DHHS, and NC DEQ (see Appendix A for a personnel support summary for this project). We engaged with 20 municipal wastewater treatment plants (WWTP) in the study, with active sampling commencing at all of these, plus additional locations. The coverage of participating WWTPs can be seen in the map presented in Figure 1 by the open triangles. The municipal stakeholders who participated in this project are also highlighted in Table 1 below.
There were three initial steps to project team development. First, the group simultaneously developed and shared expertise, molecular protocols, and hardware/software applications knowledge. Each laboratory developed a sampling collection, processing and analysis program adhering to all quality controls and laboratory safety requirements (Appendix B). Sample and data collection from participating WWTPs was streamlined using shared files and approaches, and incorporated metrics from required monthly reporting including wastewater-specific data collection attributes such as flow, infiltration, inflow, precipitation, temperature, total suspended solids, and confounding factors. Each individual academic laboratory established relationships with their respective WWTP stakeholders, and collected and analyzed samples at frequencies of either one, two or three times per week depending on the location and the university role on the project.
Additional empirical investigations of overall processing efficiency, extraction efficiency and PCR efficiency were conducted by individual laboratories, often with side by side sampling and analysis conducted at the UNC Chapel Hill Institute of Marine Sciences. The project team optimized approaches to analyze SARS-CoV-2 in both liquid influent and solids samples collected at the primary clarifier of the WWTP. We generated data over the course of the entire project at each WWTP sampled, and paired that data with the 7-day rolling average of new cases reported (see Appendix C1 and C2 Figures).
SARS-CoV-2 concentration data generated from the efforts noted in Objective 1 were then utilized across the other objectives of the project. The capacity built over the course of the project has translated into funding for at least two additional projects at the time of this writing, 1) supported by CDC through the NC DHHS to support NC participating in the National Wastewater Surveillance System (total funding amount $160,000 over 6 months) and 2) support to Noble and collaborators through NIH to develop a highplex surveillance system for a wide range of bacterial and viral pathogens, and antibiotic resistant bacteria, for application not only in the state of NC, but also across the USA (total funding amount $1.3 M, Appendix F). A wide
range of project presentations, outcomes, and stakeholder interaction examples are provided on the Sharepointe site, and can be requested for further presentation.
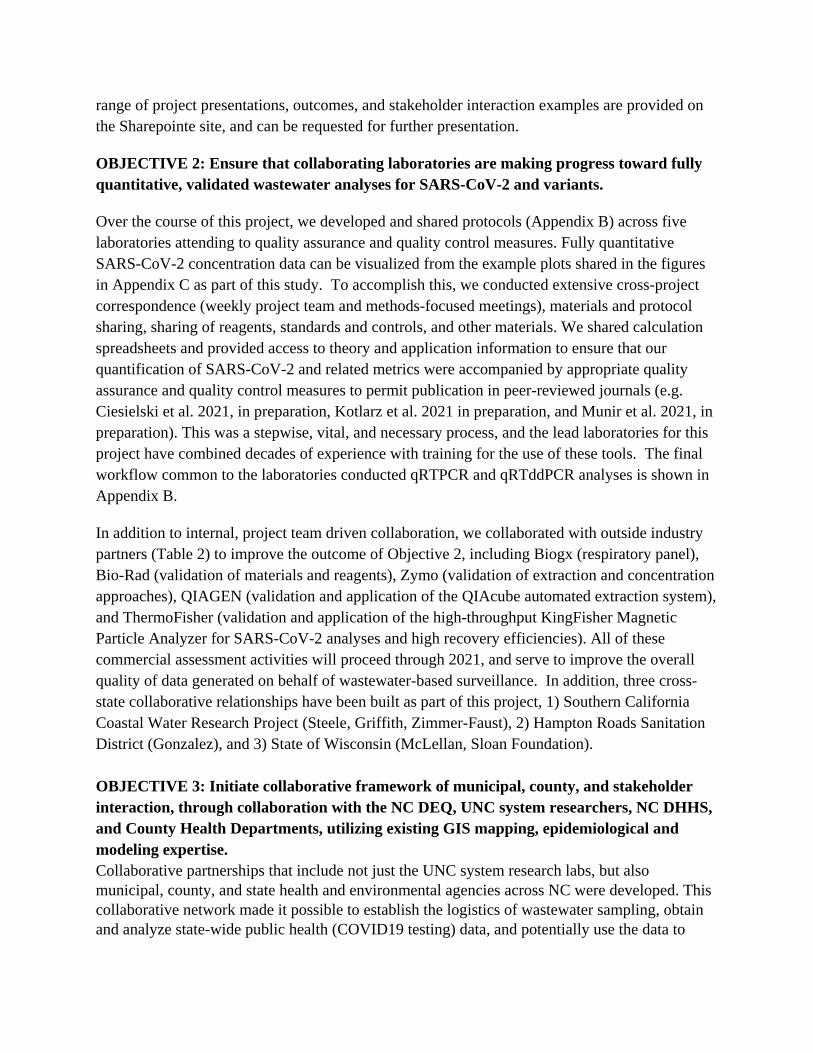
OBJECTIVE 2: Ensure that collaborating laboratories are making progress toward fully quantitative, validated wastewater analyses for SARS-CoV-2 and variants.
Over the course of this project, we developed and shared protocols (Appendix B) across five laboratories attending to quality assurance and quality control measures. Fully quantitative SARS-CoV-2 concentration data can be visualized from the example plots shared in the figures in Appendix C as part of this study. To accomplish this, we conducted extensive cross-project correspondence (weekly project team and methods-focused meetings), materials and protocol sharing, sharing of reagents, standards and controls, and other materials. We shared calculation spreadsheets and provided access to theory and application information to ensure that our quantification of SARS-CoV-2 and related metrics were accompanied by appropriate quality assurance and quality control measures to permit publication in peer-reviewed journals (e.g. Ciesielski et al. 2021, in preparation, Kotlarz et al. 2021 in preparation, and Munir et al. 2021, in preparation). This was a stepwise, vital, and necessary process, and the lead laboratories for this project have combined decades of experience with training for the use of these tools. The final workflow common to the laboratories conducted qRTPCR and qRTddPCR analyses is shown in Appendix B.
In addition to internal, project team driven collaboration, we collaborated with outside industry partners (Table 2) to improve the outcome of Objective 2, including Biogx (respiratory panel), Bio-Rad (validation of materials and reagents), Zymo (validation of extraction and concentration approaches), QIAGEN (validation and application of the QIAcube automated extraction system), and ThermoFisher (validation and application of the high-throughput KingFisher Magnetic Particle Analyzer for SARS-CoV-2 analyses and high recovery efficiencies). All of these commercial assessment activities will proceed through 2021, and serve to improve the overall quality of data generated on behalf of wastewater-based surveillance. In addition, three cross-state collaborative relationships have been built as part of this project, 1) Southern California Coastal Water Research Project (Steele, Griffith, Zimmer-Faust), 2) Hampton Roads Sanitation District (Gonzalez), and 3) State of Wisconsin (McLellan, Sloan Foundation).
OBJECTIVE 3: Initiate collaborative framework of municipal, county, and stakeholder interaction, through collaboration with the NC DEQ, UNC system researchers, NC DHHS, and County Health Departments, utilizing existing GIS mapping, epidemiological and modeling expertise. Collaborative partnerships that include not just the UNC system research labs, but also municipal, county, and state health and environmental agencies across NC were developed. This collaborative network made it possible to establish the logistics of wastewater sampling, obtain and analyze state-wide public health (COVID19 testing) data, and potentially use the data to
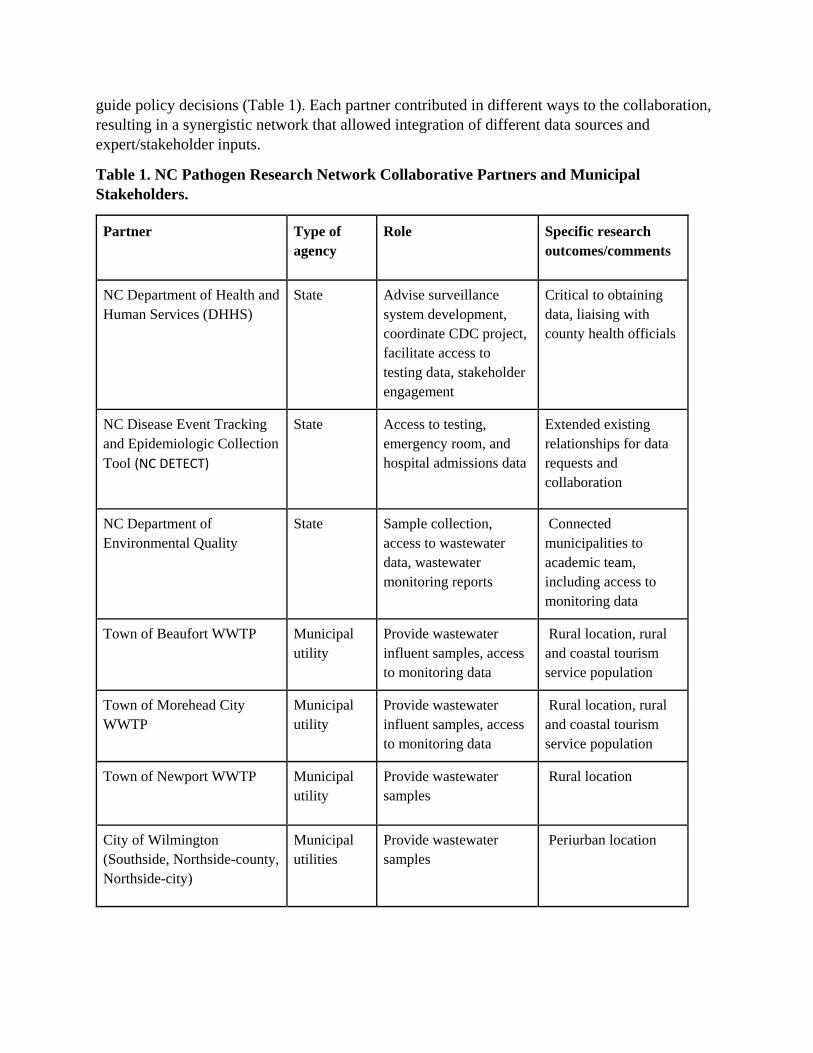
guide policy decisions (Table 1). Each partner contributed in different ways to the collaboration, resulting in a synergistic network that allowed integration of different data sources and expert/stakeholder inputs.
Table 1. NC Pathogen Research Network Collaborative Partners and Municipal Stakeholders.
Partner Type of agency
Role Specific research outcomes/comments
NC Department of Health and Human Services (DHHS)
State Advise surveillance system development, coordinate CDC project, facilitate access to testing data, stakeholder engagement
Critical to obtaining data, liaising with county health officials
NC Disease Event Tracking and Epidemiologic Collection Tool (NC DETECT)
State Access to testing, emergency room, and hospital admissions data
Extended existing relationships for data requests and collaboration
NC Department of Environmental Quality
State Sample collection, access to wastewater data, wastewater monitoring reports
Connected municipalities to academic team, including access to monitoring data
Town of Beaufort WWTP Municipal utility
Provide wastewater influent samples, access to monitoring data
Rural location, rural and coastal tourism service population
Town of Morehead City WWTP
Municipal utility
Provide wastewater influent samples, access to monitoring data
Rural location, rural and coastal tourism service population
Town of Newport WWTP Municipal utility
Provide wastewater samples
Rural location
City of Wilmington (Southside, Northside-county, Northside-city)
Municipal utilities
Provide wastewater samples
Periurban location
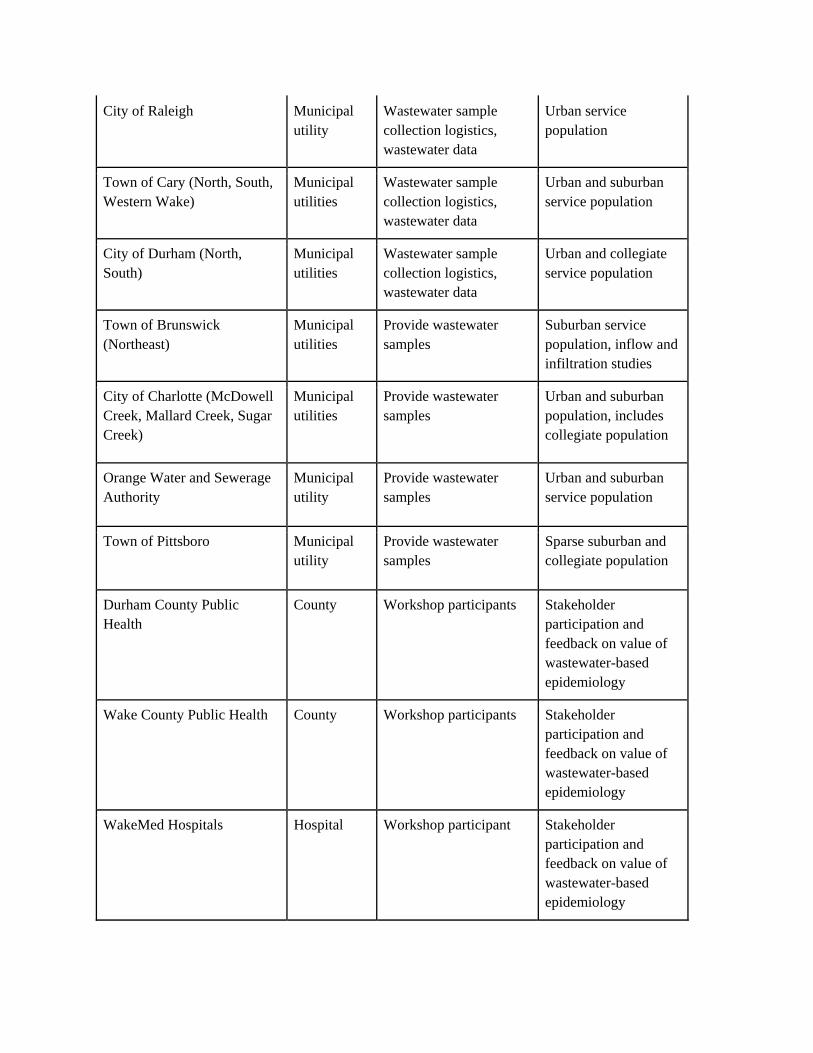
City of Raleigh Municipal utility
Wastewater sample collection logistics, wastewater data
Urban service population
Town of Cary (North, South, Western Wake)
Municipal utilities
Wastewater sample collection logistics, wastewater data
Urban and suburban service population
City of Durham (North, South)
Municipal utilities
Wastewater sample collection logistics, wastewater data
Urban and collegiate service population
Town of Brunswick (Northeast)
Municipal utilities
Provide wastewater samples
Suburban service population, inflow and infiltration studies
City of Charlotte (McDowell Creek, Mallard Creek, Sugar Creek)
Municipal utilities
Provide wastewater samples
Urban and suburban population, includes collegiate population
Orange Water and Sewerage Authority
Municipal utility
Provide wastewater samples
Urban and suburban service population
Town of Pittsboro Municipal utility
Provide wastewater samples
Sparse suburban and collegiate population
Durham County Public Health
County Workshop participants Stakeholder participation and feedback on value of wastewater-based epidemiology
Wake County Public Health County Workshop participants Stakeholder participation and feedback on value of wastewater-based epidemiology
WakeMed Hospitals Hospital Workshop participant Stakeholder participation and feedback on value of wastewater-based epidemiology
A major challenge in the public health interpretation of SARS-CoV-2 wastewater surveillance data is that, currently, it is not recommended to convert wastewater concentrations into infection prevalence estimates. Therefore, once SARS-CoV-2 wastewater data is in hand, it is not clear how best to communicate it to public health officials. On Dec 2, 2020, NC State University hosted a virtual stakeholder workshop using Zoom with representatives from NC DHHS, local health departments, wastewater utilities and other organizations, to discuss communication strategies for SARS-CoV-2 wastewater surveillance data. Specifically, we discussed the relative importance of presenting 1) uncertainty and detail in wastewater surveillance data; 2) relationships between wastewater surveillance data and case data; and 3) specific formats aimed at public health decision making. There were 29 workshop attendees at the time of peak attendance. We sent an anonymous, electronic pre-survey before the workshop, and an anonymous, electronic post-survey after the workshop. During the workshop, we administered Zoom polls. We are working on compiling the survey and poll results, and reviewing the transcript from the discussion. The NC State IRB reviewed our protocol and determined this work to be IRB exempt. We are writing a commentary on the importance of effective data visualizations for SARS-CoV-2 wastewater surveillance.
Our project team has also worked collaboratively with PI Dr. Greg Characklis (UNC Chapel Hill) to provide wastewater sampling and concentration data that has been incorporated into a susceptible-exposed-infected-recovered (SEIR) epidemiological model making short-term ensemble projections of new hospital admissions in the Raleigh/Durham/Chapel Hill and Charlotte regions. The ensemble projections are being used to trigger hospital management decisions, including elective procedure cancellations and admission triage, under a range of COVID-19 outbreak scenarios. The project team running the model is running simulations to test if more resolved forecasts using wastewater sampling data can improve tradeoffs between capacity utilization, cost, and standard-of-care objectives during the potential outbreak periods. We have benefitted from this collaborative relationship, and view this research as a specific example of economic benefit potentially tied to wastewater-based pathogen concentration data.
OBJECTIVE 4: Continue to develop and optimize molecular diagnostic tools to build surveillance capabilities for the next decade, and for future pandemics.
Our team has worked over the course of 2020 to build and expand our collaborative relationships with industry partners that are playing a prominent role in the expansion of COVID-19 related molecular applications. During the project, Mark Ciesielski (Ph. D. Marine Sciences) and Rachel T. Noble presented a webinar on ddPCR and qPCR workflows as related to clinical microbiologists around the country as part of an invited webinar series led by Bio-Rad. Table 2. NC Pathogen Research Network Industry Partners
Collaborative Partner
Component Outcome Status
BioGx, Inc. Multiplex for pan- Wastewater/clinical In process
respiratory panel generated
ThermoFisher Streamlining speed of sample processing and throughput
Save cost, improve throughput and QA/QC
QIAGEN Streamlining speed of sample processing and throughput
Save cost, improve throughput and QA/QC
Bio-Rad, Inc. Streamlining, speed of reactions
Save cost, improve throughput
plete
Zymo Research, Inc. Inhibitor removal, streamline sample processing
Reduce volumes necessary for processing
OBJECTIVE 5: Interact with a team of epidemiologists (Dr. Larry Engel, Dr. David Holcomb, and Dr. Jane Hoppin), spatial and GIS modeling researchers (Dr. Marc Serre and Dr. Helena Mitasova) to understand the impact of social distancing and mitigation measures to place the data into a useful context for future surveillance system development.
There were several research areas that were advanced over the course of this project including geospatial analysis, epidemiological analysis, and disease mapping. Each of these are highlighted below with a short summary.
Geospatial analysis (NCSU): In order to acquire accurate, comprehensive digital sewer networks for each of the 19 monitored WWTPs, we requested sewer network data from local water utilities and GIS departments. Then we developed a GIS-based workflow to delineate sewershed boundaries for each of the individual WWTPs, based on their sewer networks. Relevant components of each sewer system’s data, including, but not limited to, sewersheds, sewer pipes and their properties, and manholes, were integrated into a GIS database and converted to a shareable geospatial format for use in further analyses. Wastewater sampling was completed for a variety of sewersheds in North Carolina, including inland and coastal regions, as well as large, metropolitan and small, rural sewersheds. The area of the sewersheds varied from 2 to 207 square miles, with estimated service populations ranging from 3,000 to 550,000 people.
We generated several GIS-based methods which were automated and stored in a code-sharing repository so that they can be utilized for this and future wastewater-based monitoring projects. These efforts have been conducted across NC, even though the examples that we highlight here
are from Raleigh. Of particular interest to current reporting of clinical data, we found that sewershed boundaries often didn’t align with zip codes or county boundaries (Figure 2). Therefore, we developed a technique which could modify publicly available case data to more accurately reflect the number of COVID-19-positive cases that were contributing to SARS-CoV-2 detected in the wastewater samples. Specifically, this method calculates the proportion of people living inside the sewershed based on census block geography and the 2010 census population and weights the zip code cases according to the estimated population. We plan to compare the results generated from this method to other COVID case datasets, including county data, zip code cases weighted by area, and geocoded, address level case data aggregated to the sewersheds in order to better understand if publicly available data can be used if more granular data is not available.
In order to interpret the signal of viral pathogens stemming from areas contributing to a single wastewater influent source, it is necessary to understand sewerage transport time. This is because as sewage is moving from the source (home or business) to the wastewater treatment plant, the sewage is undergoing change and sometimes dilution along the way, as well as degradation of the viral pathogen nucleic acid. This travel time is likely to be an important factor impacting the integrated SARS CoV-2 signal that is observed in the municipal wastewater influent. During this project, we created a method that can estimate the time it takes for sewage to travel from any location in the sewershed to the WWTP based on the attributes of the sewer pipes. (Figure 3). We plan to incorporate these sewage travel times into a SARS-CoV-2 decay model in order to better understand how the level of SARS-CoV-2 detected in the WWTP influent is affected by the time it takes for the sewage to reach the plant. In particular, our efforts have demonstrated that even though degradation will likely contribute to changes in the overall concentrations of viral pathogen nucleic acid in wastewater influent, it is unlikely to be a major source of loss given the short time estimates for sewage transport.
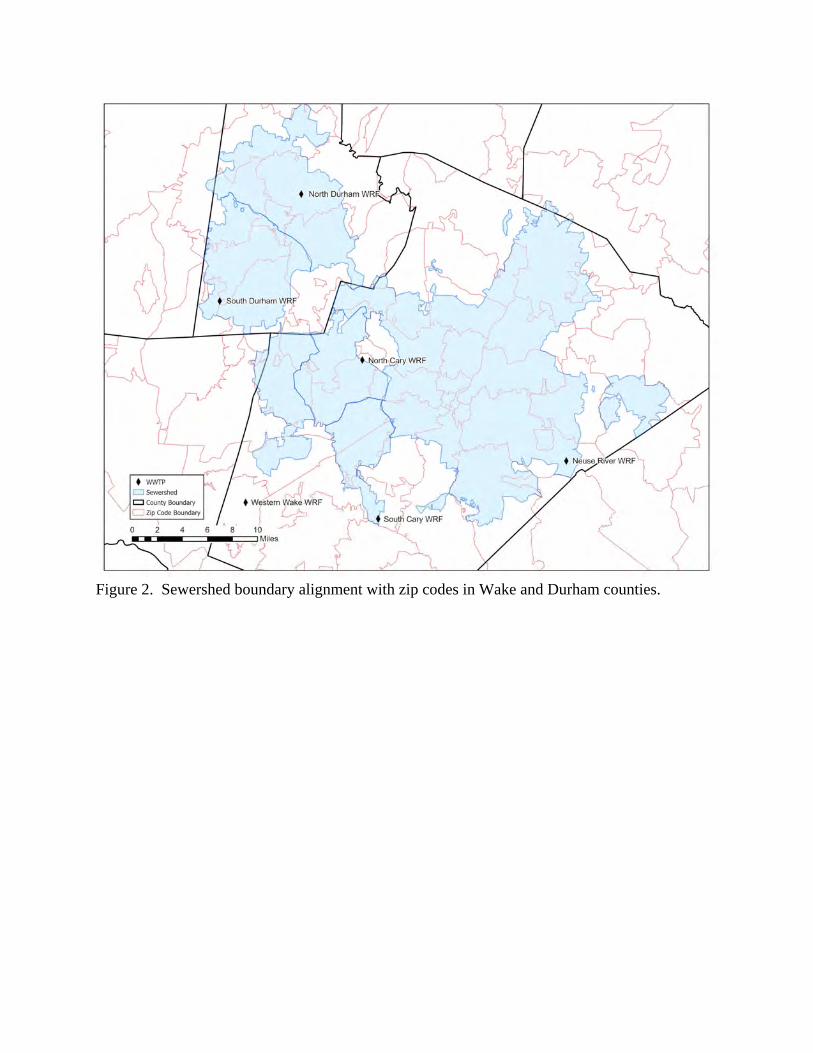
Figure 2. Sewershed boundary alignment with zip codes in Wake and Durham counties.
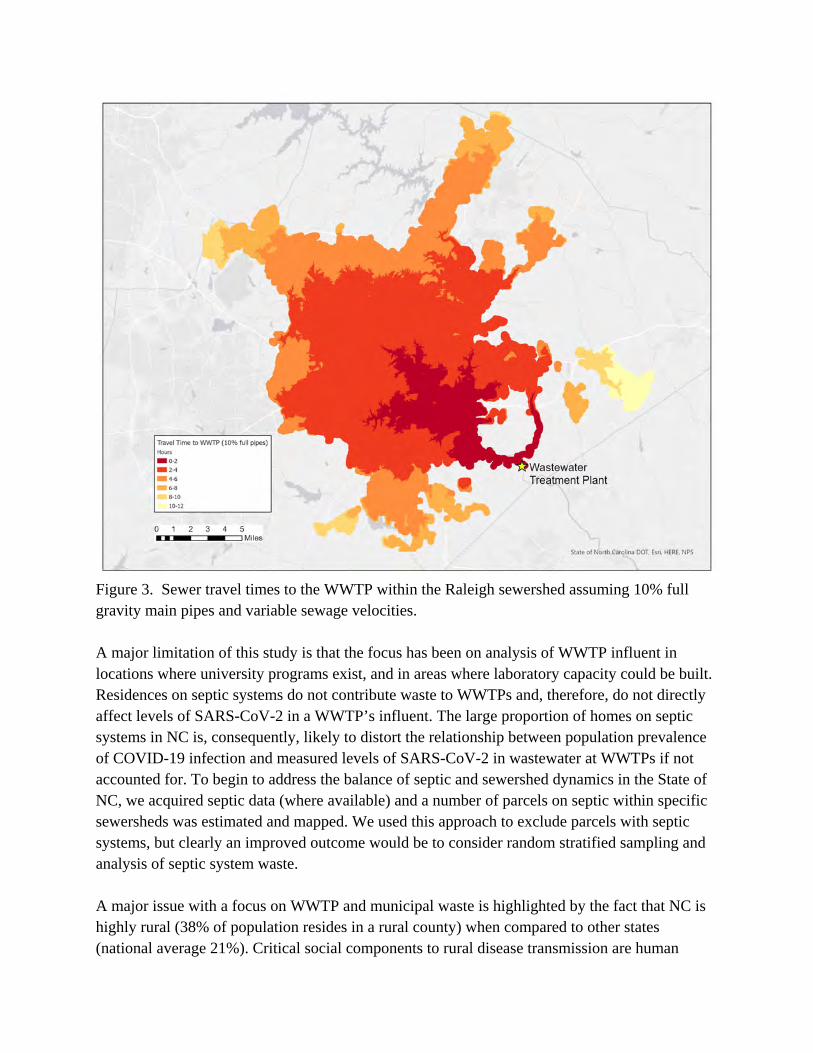
Figure 3. Sewer travel times to the WWTP within the Raleigh sewershed assuming 10% full gravity main pipes and variable sewage velocities.
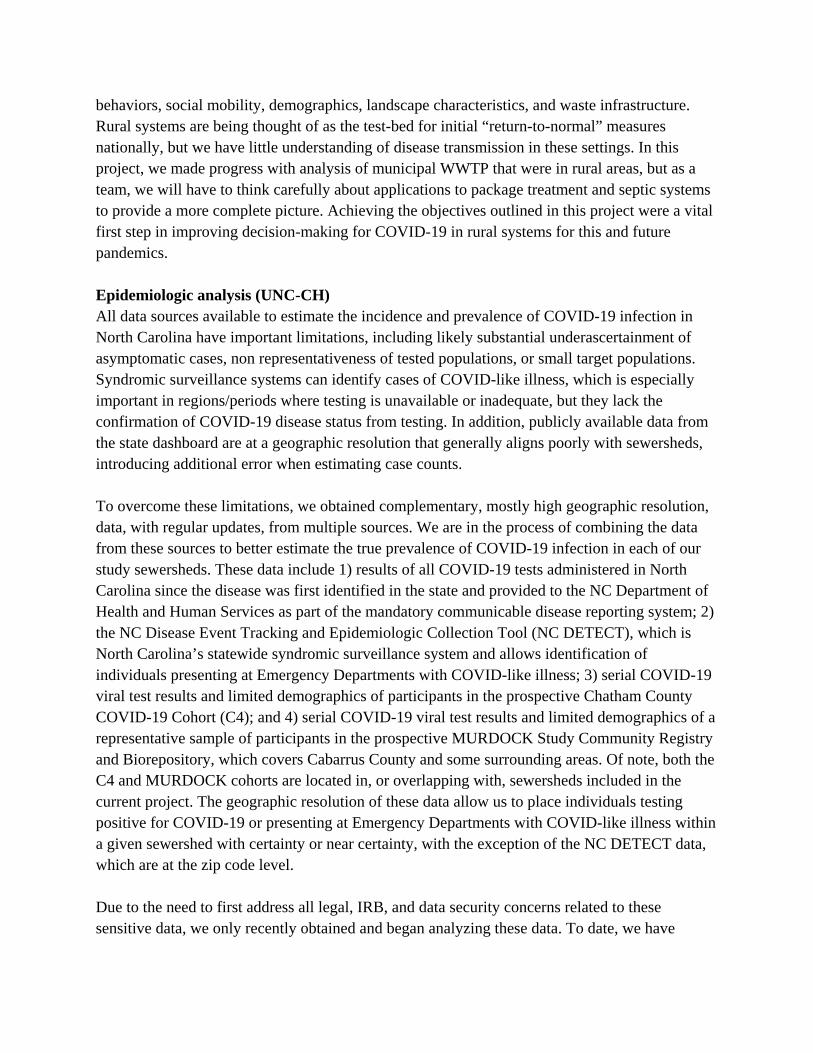
A major limitation of this study is that the focus has been on analysis of WWTP influent in locations where university programs exist, and in areas where laboratory capacity could be built. Residences on septic systems do not contribute waste to WWTPs and, therefore, do not directly affect levels of SARS-CoV-2 in a WWTP’s influent. The large proportion of homes on septic systems in NC is, consequently, likely to distort the relationship between population prevalence of COVID-19 infection and measured levels of SARS-CoV-2 in wastewater at WWTPs if not accounted for. To begin to address the balance of septic and sewershed dynamics in the State of NC, we acquired septic data (where available) and a number of parcels on septic within specific sewersheds was estimated and mapped. We used this approach to exclude parcels with septic systems, but clearly an improved outcome would be to consider random stratified sampling and analysis of septic system waste.
A major issue with a focus on WWTP and municipal waste is highlighted by the fact that NC is highly rural (38% of population resides in a rural county) when compared to other states (national average 21%). Critical social components to rural disease transmission are human
behaviors, social mobility, demographics, landscape characteristics, and waste infrastructure. Rural systems are being thought of as the test-bed for initial “return-to-normal” measures nationally, but we have little understanding of disease transmission in these settings. In this project, we made progress with analysis of municipal WWTP that were in rural areas, but as a team, we will have to think carefully about applications to package treatment and septic systems to provide a more complete picture. Achieving the objectives outlined in this project were a vital first step in improving decision-making for COVID-19 in rural systems for this and future pandemics.
Epidemiologic analysis (UNC-CH) All data sources available to estimate the incidence and prevalence of COVID-19 infection in North Carolina have important limitations, including likely substantial underascertainment of asymptomatic cases, non representativeness of tested populations, or small target populations. Syndromic surveillance systems can identify cases of COVID-like illness, which is especially important in regions/periods where testing is unavailable or inadequate, but they lack the confirmation of COVID-19 disease status from testing. In addition, publicly available data from the state dashboard are at a geographic resolution that generally aligns poorly with sewersheds, introducing additional error when estimating case counts.
To overcome these limitations, we obtained complementary, mostly high geographic resolution, data, with regular updates, from multiple sources. We are in the process of combining the data from these sources to better estimate the true prevalence of COVID-19 infection in each of our study sewersheds. These data include 1) results of all COVID-19 tests administered in North Carolina since the disease was first identified in the state and provided to the NC Department of Health and Human Services as part of the mandatory communicable disease reporting system; 2) the NC Disease Event Tracking and Epidemiologic Collection Tool (NC DETECT), which is North Carolina’s statewide syndromic surveillance system and allows identification of individuals presenting at Emergency Departments with COVID-like illness; 3) serial COVID-19 viral test results and limited demographics of participants in the prospective Chatham County COVID-19 Cohort (C4); and 4) serial COVID-19 viral test results and limited demographics of a representative sample of participants in the prospective MURDOCK Study Community Registry and Biorepository, which covers Cabarrus County and some surrounding areas. Of note, both the C4 and MURDOCK cohorts are located in, or overlapping with, sewersheds included in the current project. The geographic resolution of these data allow us to place individuals testing positive for COVID-19 or presenting at Emergency Departments with COVID-like illness within a given sewershed with certainty or near certainty, with the exception of the NC DETECT data, which are at the zip code level.
Due to the need to first address all legal, IRB, and data security concerns related to these sensitive data, we only recently obtained and began analyzing these data. To date, we have
geocoded all individuals in the state testing database who tested positive for COVID-19 since 2/1/2020 and, based only on these data, estimated the number of individuals testing positive each day within each of our study sewersheds. Our plans, currently underway, are to estimate not only how many individuals within a sewershed test positive each day, but to estimate how many individuals within a sewershed are likely to be shedding SARS-CoV-2 in their feces each day, based on symptom reporting data in some of the data sources, together with viral shedding data from published studies. We will use the serial test results from the two prospective cohorts, together with census data, to estimate and account for asymptomatic cases not routinely captured in the state mandatory reporting system, with a particular focus on the two sewersheds in which these cohorts reside. In a further refinement of our models, we will account for viral transit time, which has been addressed above, and viral degradation in the sewer lines, based on the distance between each case’s residence and their respective WWTP, as well as the ambient temperature. Because precipitation can, through inflow and infiltration, dilute wastewater and, consequently, distort the measured viral concentrations in that wastewater, we will use weather data, together with validated models, to account for the impact of the estimated inflow and infiltration. Precipitation from all NOAA stations across the states were used to estimate precipitation at each of the WWTPs in our study, and compared with the WWTP flow. Plots of the WWTP flow and estimated precipitation at the WWTPs in our study show that WWTP flow is significantly associated with precipitation, which indicates significant inflow and infiltration into the sewer lines (Appendix E).
Disease Mapping (UNC-CH) Counts of confirmed cases of COVID-19 were obtained for all counties and zip codes across the state of North Carolina. These data were used as input for the Bayesian Maximum Entropy (BME) method of geostatistics to estimate the COVID-19 incidence across North Carolina for different time aggregates between March 12th, 2020 and January 5th, 2021 (See maps in Appendix D). The BME method was used because it accounts for the space/time autocorrelation in COVID-19 incidence rates and treats observations as interval or Gaussian soft data to smooth out outliers observed in counties with small populations.
The BME estimation of COVID-19 cases serves two purposes. The first purpose is to map the incidence rate of COVID-19 across sewersheds, which can then be used to model SARS-CoV-2 shedding into the sewers and improve the model used to predict COVID-19 cases from SARS-CoV-2 measured at WWTPs. The second purpose is to develop an early warning system that will use SARS-CoV-2 measured at WWTPs together with reported COVID-19 cases to create maps of COVID-19 that can anticipate outbreaks and allow public health measures to be taken as soon as levels are increasing.
References cited: Pecson, B., Darby, E., Haas, C.N. et al., 2020. Reproducibility and sensitivity of 36 methods to
quantify the SARS-CoV-2 genetic signal in raw wastewater: Findings from an interlaboratory methods evaluation in the U.S. SARS-CoV-2 Interlaboratory Consortium medRxiv 2020.11.02.20221622; doi: https://doi.org/10.1101/2020.11.02.20221622
Bivins, A., North, D., Ahmad, A. et al., 2020. Wastewater-Based Epidemiology: Global Collaborative to Maximize Contributions in the Fight Against COVID-19. Environmental Science & Technology 2020 54 (13), 7754-7757 DOI: 10.1021/acs.est.0c02388
Medema, G., Heijnen, L., Elsinga, G., Italiaander, R., and A. Brouwer. 2020. Presence of SARS-Coronavirus-2 in sewage. Environmental Science & Technology Letters. DOI: 10.1021/acs.estlett.0c00357
Visva Bharati Barua, Md Ariful Islam Juel, Adeola Sorinolu, Isaiah Young, David Holcomb, Mark Ciesielski, Thomas Clerkin, Denene Blackwood, Rachel Noble, and Mariya Munir. Quantitative analysis of SARS-CoV-2 in wastewater and tracking the temporal variation of COVID-19 surges/cases in Charlotte, North Carolina using wastewater based epidemiology. February 2021. In preparation. Science of the Total Environment
Md Ariful Islam Juel, Visva Bharati Barua, Blackwood, Denene, Noble, Rachel, and Mariya Munir. Comparative evaluation of virus concentration methods for detecting SARS-CoV-2 virus in wastewater. February 2021. In preparation. Environment Science and Pollution Research
Mark Ciesielski, Denene Blackwood, Thomas Clerkin, Raul Gonzalez, Hannah Thompson, Allison Larson, Rachel Noble*. Assessing Sensitivity and Reproducibility of Two Molecular Workflows for the Detection of SARS-CoV-2 in Wastewater. February 2021. In preparation. Journal of Virological Methods.
Appendix A
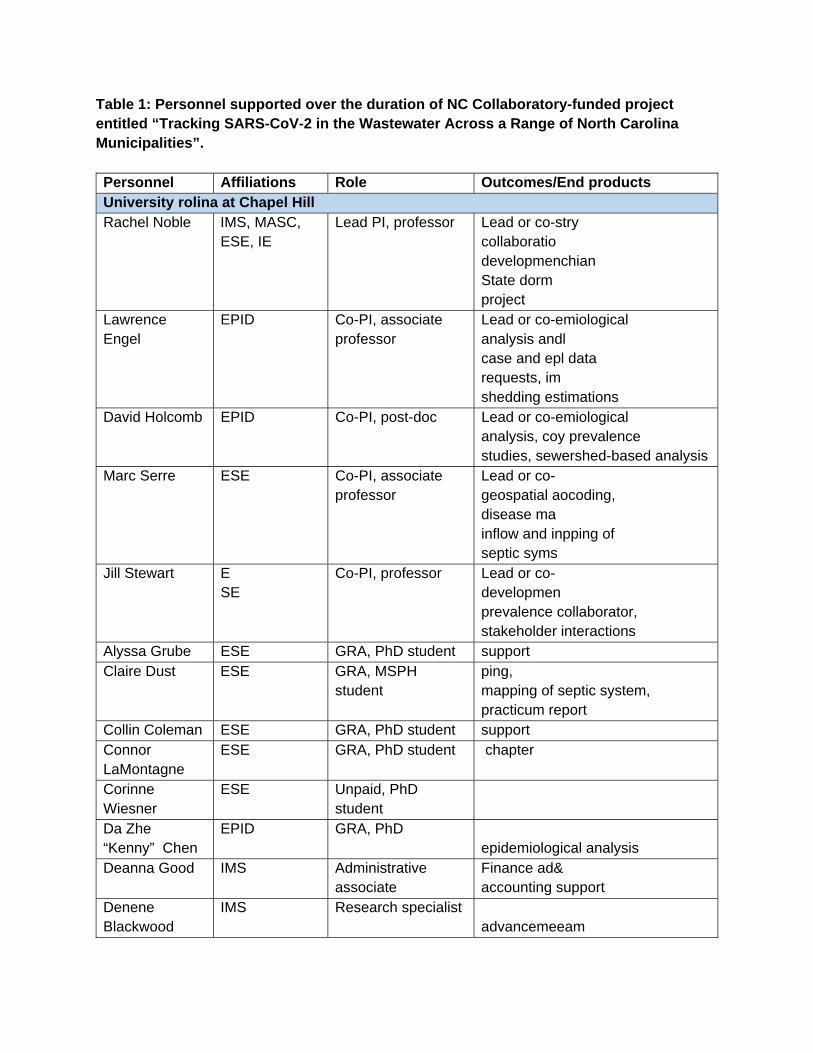
Table 1: Personnel supported over the duration of NC Collaboratory-funded project entitled “Tracking SARS-CoV-2 in the Wastewater Across a Range of North Carolina Municipalities”.
Personnel Affiliations Role Outcomes/End products University rolina at Chapel Hill Rachel Noble IMS, MASC,
ESE, IE Lead PI, professor Lead or co-stry
collaboratiodevelopmenchian State dorm project
Lawrence Engel
EPID Co-PI, associate professor
Lead or co-emiological analysis andl case and epl data requests, imshedding estimations
David Holcomb EPID Co-PI, post-doc Lead or co-emiological analysis, coy prevalence studies, sewershed-based analysis
Marc Serre ESE Co-PI, associate professor
Lead or co-geospatial aocoding, disease mainflow and inpping of septic syms
Jill Stewart E SE
Co-PI, professor Lead or co-developmenprevalence collaborator, stakeholder interactions
Alyssa Grube ESE GRA, PhD student support Claire Dust ESE GRA, MSPH
student ping, mapping of septic system, practicum report
Collin Coleman ESE GRA, PhD student support Connor LaMontagne
ESE GRA, PhD student chapter
Corinne Wiesner
ESE Unpaid, PhD student
Da Zhe “Kenny” Chen
EPID GRA, PhD epidemiological analysis
Deanna Good IMS Administrative associate
Finance ad& accounting support
Denene Blackwood
IMS Research specialist advancemeeam
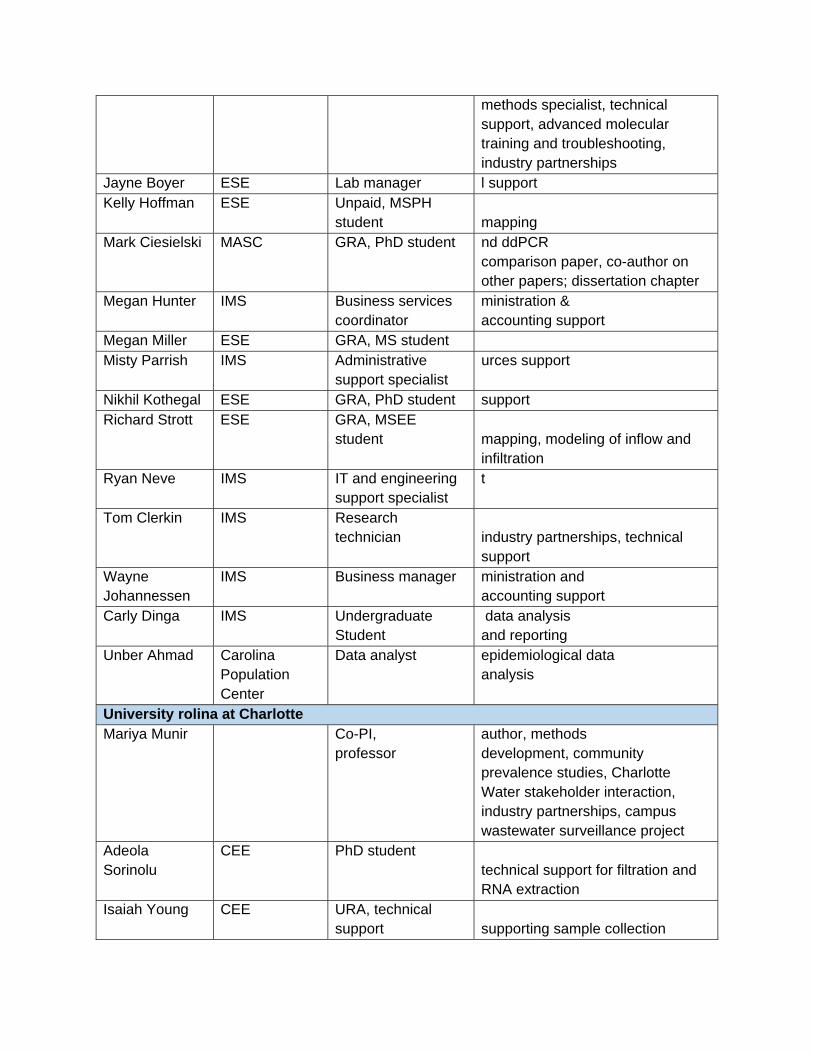
methods specialist, technical support, advanced molecular training and troubleshooting, industry partnerships
Jayne Boyer ESE Lab manager l support Kelly Hoffman ESE Unpaid, MSPH
student mapping Mark Ciesielski MASC GRA, PhD student nd ddPCR
comparison paper, co-author on other papers; dissertation chapter
Megan Hunter IMS Business services coordinator
ministration & accounting support
Megan Miller ESE GRA, MS student Misty Parrish IMS Administrative
support specialist urces support
Nikhil Kothegal ESE GRA, PhD student support Richard Strott ESE GRA, MSEE
student mapping, modeling of inflow and infiltration
Ryan Neve IMS IT and engineering support specialist
t
Tom Clerkin IMS Research technician industry partnerships, technical
support Wayne Johannessen
IMS Business manager ministration and accounting support
Carly Dinga IMS Undergraduate Student
data analysis and reporting
Unber Ahmad Carolina Population Center
Data analyst epidemiological data analysis
University rolina at Charlotte Mariya Munir Co-PI,
professor author, methods development, community prevalence studies, Charlotte Water stakeholder interaction, industry partnerships, campus wastewater surveillance project
Adeola Sorinolu
CEE PhD student technical support for filtration and RNA extraction
Isaiah Young CEE URA, technical support supporting sample collection
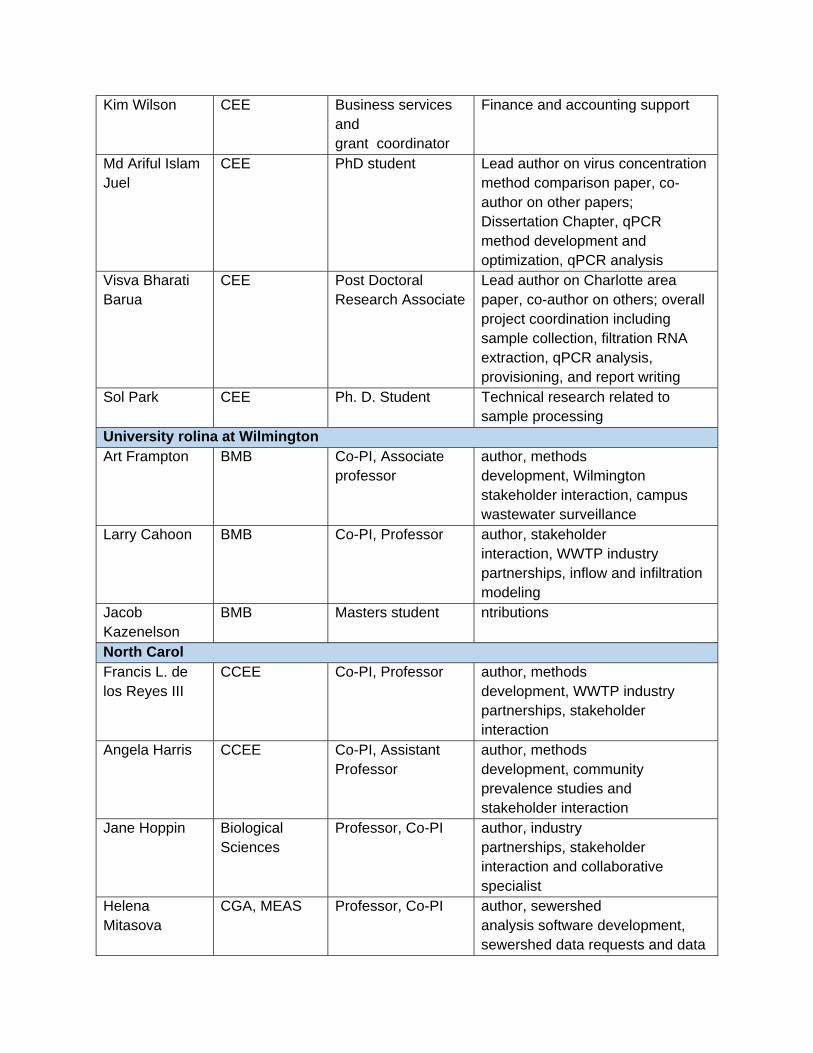
Kim Wilson CEE Business services and grant coordinator
Finance and accounting support
Md Ariful Islam Juel
CEE PhD student Lead author on virus concentration method comparison paper, co-author on other papers; Dissertation Chapter, qPCR method development and optimization, qPCR analysis
Visva Bharati Barua
CEE Post Doctoral Research Associate
Lead author on Charlotte area paper, co-author on others; overall project coordination including sample collection, filtration RNA extraction, qPCR analysis, provisioning, and report writing
Sol Park CEE Ph. D. Student Technical research related to sample processing
University rolina at Wilmington Art Frampton BMB Co-PI, Associate
professor author, methods development, Wilmington stakeholder interaction, campus wastewater surveillance
Larry Cahoon BMB Co-PI, Professor author, stakeholder interaction, WWTP industry partnerships, inflow and infiltration modeling
Jacob Kazenelson
BMB Masters student ntributions
North CarolFrancis L. de los Reyes III
CCEE Co-PI, Professor author, methods development, WWTP industry partnerships, stakeholder interaction
Angela Harris CCEE Co-PI, Assistant Professor
author, methods development, community prevalence studies and stakeholder interaction
Jane Hoppin Biological Sciences
Professor, Co-PI author, industry partnerships, stakeholder interaction and collaborative specialist
Helena Mitasova
CGA, MEAS Professor, Co-PI author, sewershed analysis software development, sewershed data requests and data
management, methods for public cases data processing
Daniel Cockson CCEE Undergraduate research assistant
SE
Emma Bolden CCEE Undergraduate research assistant
Diver, BS ENE
Gracie Hornsby CCEE Research assistant support, provisioning Jeremy Lowe CCEE Undergraduate
research assistant Diver, BS ENE
Judith Kays CCEE Research assistant support for protocol development and RNA extractions
Julia Kaplan Biological Sciences
Data Manager ms paper, data download of publicly available data, data sources collaborator
Justyna Jeziorska
CGA Research Associate derived sewershed data, precipitation analysis data lead
Laura Gomez CCEE URA Marisa Incremona
Biological Sciences
Science Communicator
author, facilitator for stakeholder engagement project
Nadine Kotlarz Biological Sciences
Post-doctoral research associate
solids paper and Stakeholder engagement paper, co-author on other papers
Sean Daly CCEE GRA chapter Sivaranjani Palani
Microbiology GRA analysis
Stacie Reckling
CGA Research Associate
wershed data lead; sewershed analysis techniques and software
Tanvir Pasha CCEE GRA ershed paper, Co-author on other papers; dissertation chapter
Vaclav Petras CGA Geospatial Software Engineer software modules for sewershed
and public cases data processing and visualization, sewershed and derived cases data co-lead
Victoria Ponthier
CCEE URA NE
Yi-Chun Lai CCEE GRA Co-author; sample processing and analysis
Zach Bennett CCEE URA Driver, BS CE NCDEQ Dives Danny Smith NCDEQ
Division of Water Resources
Director support for wastewater collection and treatment systems
Melanie Williams
NCDEQ Division of Water Resources
Environmental Program Consultant wastewater collection and
treatment systems
Rick Bolich NCDEQ Division of Water Resources
Section Chief support for wastewater collection and treatment systems
List of abbreviations: BAE-Biological and Agricultural Engineering BMB-Biology & Marine Biology CCE- Civil and Environmental Engineering CCEE -Civil, Construction, and Environmental Engineering CE-Civil Engineering CGA-Center for Geospatial Analytics ENE-Environmental Engineering EPID-Department of Epidemiology ESE-Environmental Science & Engineering GRA- graduate research assistant IE-Institute for the Environment IMS-Institute of Marine Sciences ISE-Industrial and Systems Engineering MASC-Marine Sciences MEAS- Department of Marine, Earth and Atmospheric Sciences RA-research assistant URA-Undergraduate Research Assistant
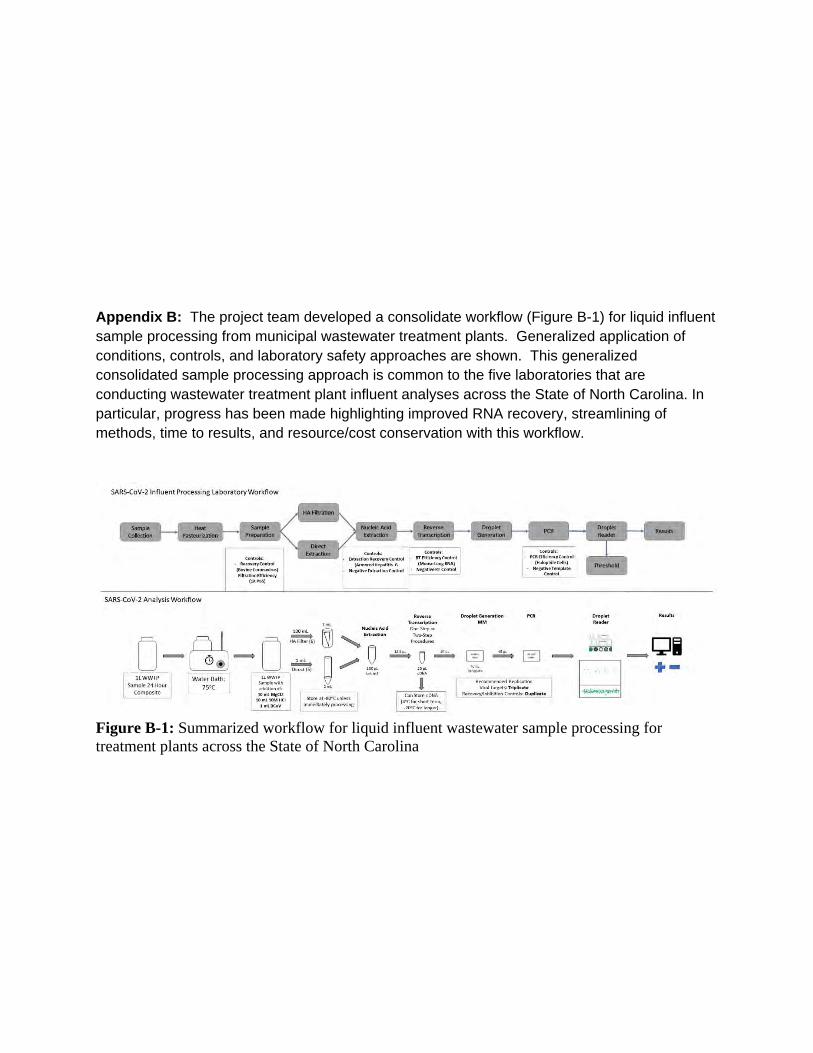
Appendix B: The project team developed a consolidate workflow (Figure B-1) for liquid influent sample processing from municipal wastewater treatment plants. Generalized application of conditions, controls, and laboratory safety approaches are shown. This generalized consolidated sample processing approach is common to the five laboratories that are conducting wastewater treatment plant influent analyses across the State of North Carolina. In particular, progress has been made highlighting improved RNA recovery, streamlining of methods, time to results, and resource/cost conservation with this workflow.
Figure B-1: Summarized workflow for liquid influent wastewater sample processing for treatment plants across the State of North Carolina
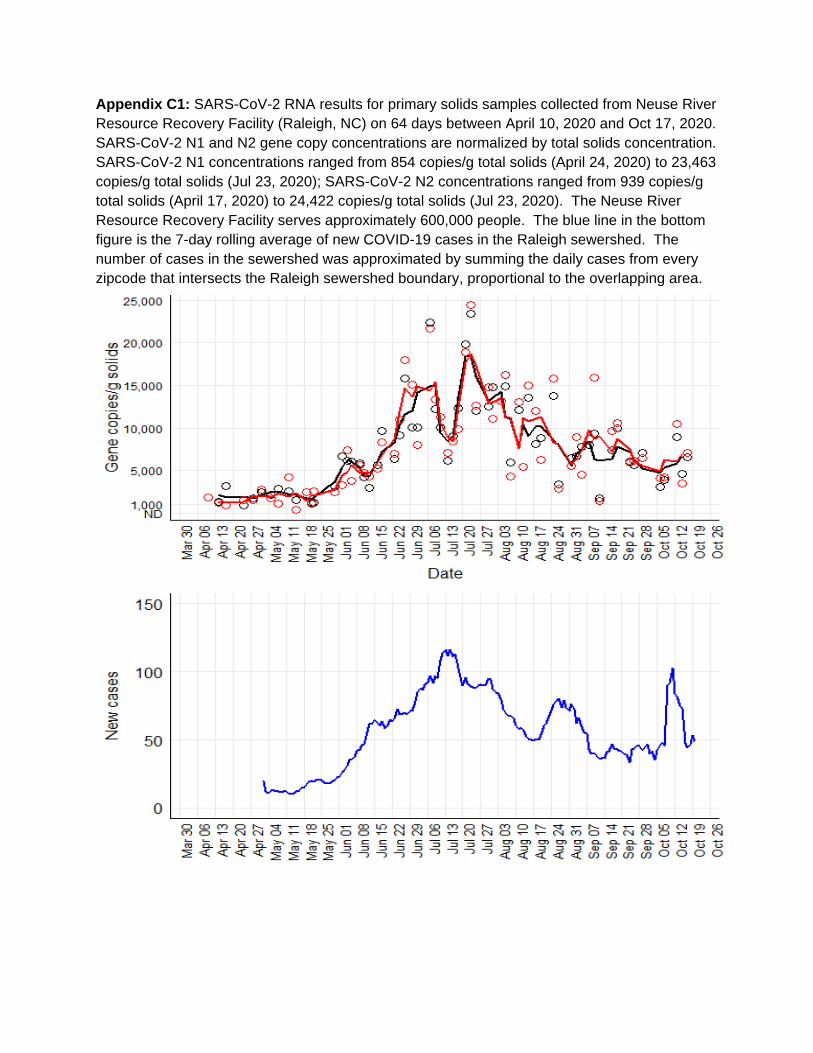
Appendix C1: SARS-CoV-2 RNA results for primary solids samples collected from Neuse River Resource Recovery Facility (Raleigh, NC) on 64 days between April 10, 2020 and Oct 17, 2020. SARS-CoV-2 N1 and N2 gene copy concentrations are normalized by total solids concentration. SARS-CoV-2 N1 concentrations ranged from 854 copies/g total solids (April 24, 2020) to 23,463 copies/g total solids (Jul 23, 2020); SARS-CoV-2 N2 concentrations ranged from 939 copies/g total solids (April 17, 2020) to 24,422 copies/g total solids (Jul 23, 2020). The Neuse River Resource Recovery Facility serves approximately 600,000 people. The blue line in the bottom figure is the 7-day rolling average of new COVID-19 cases in the Raleigh sewershed. The number of cases in the sewershed was approximated by summing the daily cases from every zipcode that intersects the Raleigh sewershed boundary, proportional to the overlapping area.
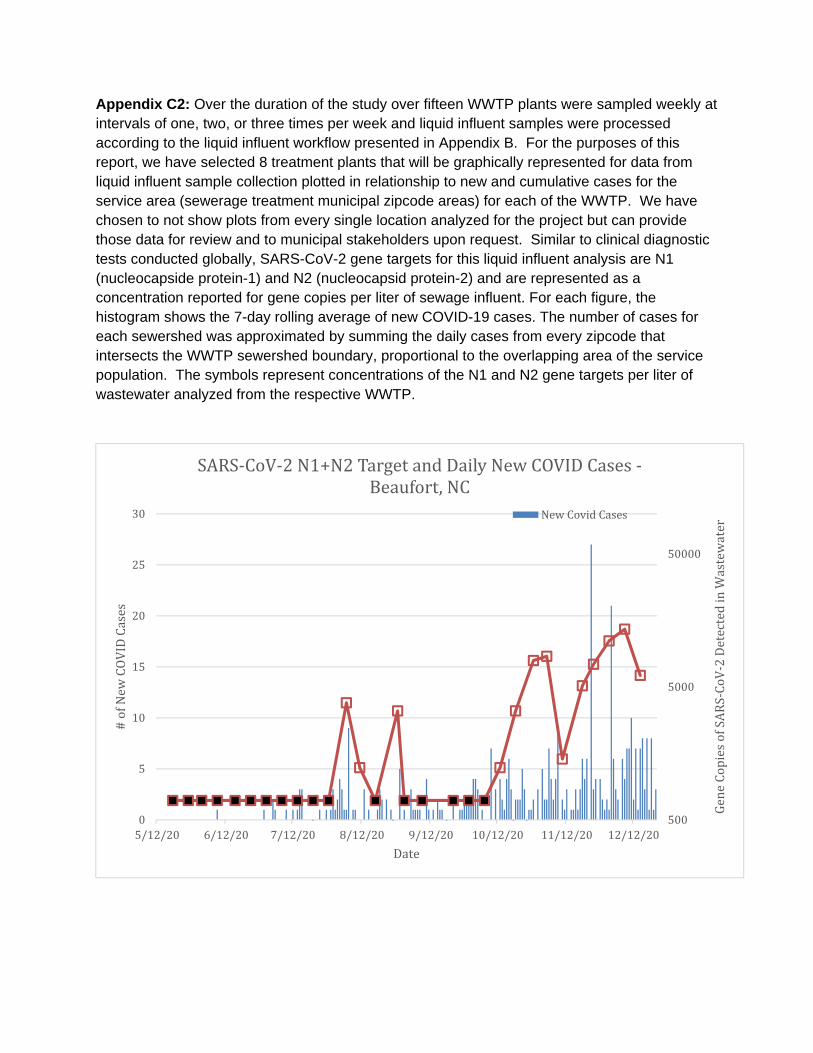
Appendix C2: Over the duration of the study over fifteen WWTP plants were sampled weekly at intervals of one, two, or three times per week and liquid influent samples were processed according to the liquid influent workflow presented in Appendix B. For the purposes of this report, we have selected 8 treatment plants that will be graphically represented for data from liquid influent sample collection plotted in relationship to new and cumulative cases for the service area (sewerage treatment municipal zipcode areas) for each of the WWTP. We have chosen to not show plots from every single location analyzed for the project but can provide those data for review and to municipal stakeholders upon request. Similar to clinical diagnostic tests conducted globally, SARS-CoV-2 gene targets for this liquid influent analysis are N1 (nucleocapside protein-1) and N2 (nucleocapsid protein-2) and are represented as a concentration reported for gene copies per liter of sewage influent. For each figure, the histogram shows the 7-day rolling average of new COVID-19 cases. The number of cases for each sewershed was approximated by summing the daily cases from every zipcode that intersects the WWTP sewershed boundary, proportional to the overlapping area of the service population. The symbols represent concentrations of the N1 and N2 gene targets per liter of wastewater analyzed from the respective WWTP.
500
5000
50000
0
5
10
15
20
25
30
5/12/20 6/12/20 7/12/20 8/12/20 9/12/20 10/12/20 11/12/20 12/12/20
Gen
e Co
pies
of S
AR
S-Co
V-2
Det
ecte
d in
Was
tew
ater
# o
f New
CO
VID
Cas
es
Date
SARS-CoV-2 N1+N2 Target and Daily New COVID Cases -Beaufort, NC
New Covid Cases
500
5000
50000
0
50
100
150
200
250
Gen
e Co
pies
of S
AR
S-Co
V-2
Det
ecte
d in
Was
tew
ater
# o
f New
CO
VID
Cas
es
Date
SARS-CoV-2 N1+N2 Target and Daily New COVID -Greenville, NC
New Covid Cases
4000
40000
400000
4000000
0
10
20
30
40
50
60
6/17/20 7/17/20 8/17/20 9/17/20 10/17/20 11/17/20 12/17/20
Gen
e Copies of SARS‐CoV‐2
Detected
inWastewater
# of N
ew COVID
Cases
Date
SARS‐CoV‐2 N1+N2 Target and Daily New COVID ‐Charlotte, NC WWTP B
New Covid Cases
4000
40000
400000
4000000
0
20
40
60
80
100
120
140
160
6/17/20 7/17/20 8/17/20 9/17/20 10/17/20 11/17/20 12/17/20
Gen
e Copies of SARS‐CoV‐2
Detected
in W
astewater
# of N
ew COVID
Cases
Date
SARS‐CoV‐2 N1+N2 Target and Daily New COVID Cases ‐Charlotte, NC WWTP C
New Covid Cases
500
5000
50000
500000
0
2
4
6
8
10
12
7/1/20 8/1/20 9/1/20 10/1/20 11/1/20 12/1/20
Gen
e Co
pies
of S
AR
S-Co
V-2
Det
ecte
d in
Was
tew
ater
# o
f New
CO
VID
Cas
es
Date
SARS-CoV-2 N1 Target and Daily New COVID Cases -Zipcode 27312 - Pittsboro, NC
New Covid Cases
500
5000
50000
500000
0
10
20
30
40
50
60
70
80
7/1/20 8/1/20 9/1/20 10/1/20 11/1/20 12/1/20
Gen
e Co
pies
of S
AR
S-Co
V-2
Det
ecte
d in
Was
tew
ater
# o
f New
CO
VID
Cas
es
Date
SARS-CoV-2 N1 Target and Daily New COVID Cases - Zipcode 27514, 27516, 27510 - Chapel Hill+Carrboro, NC
New Covid Cases
500
5000
50000
500000
0
50
100
150
200
250
300
7/13/20 8/13/20 9/13/20 10/13/20 11/13/20 12/13/20
Gen
e Co
pies
of S
AR
S-Co
V-2
Det
ecte
d in
W
aste
wat
er
# o
f New
CO
VID
Cas
es
Date
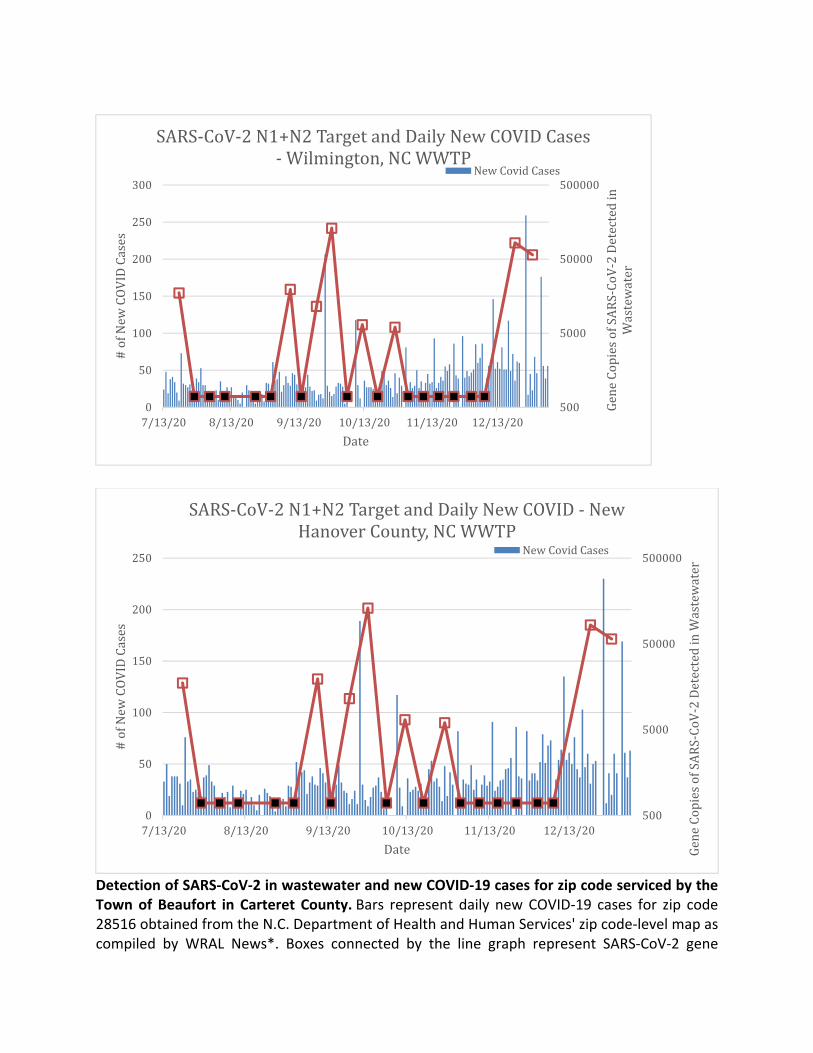
SARS-CoV-2 N1+N2 Target and Daily New COVID Cases - Wilmington, NC WWTP
New Covid Cases
500
5000
50000
500000
0
50
100
150
200
250
7/13/20 8/13/20 9/13/20 10/13/20 11/13/20 12/13/20
Gen
e Co
pies
of S
AR
S-Co
V-2
Det
ecte
d in
Was
tew
ater
# o
f New
CO
VID
Cas
es
Date
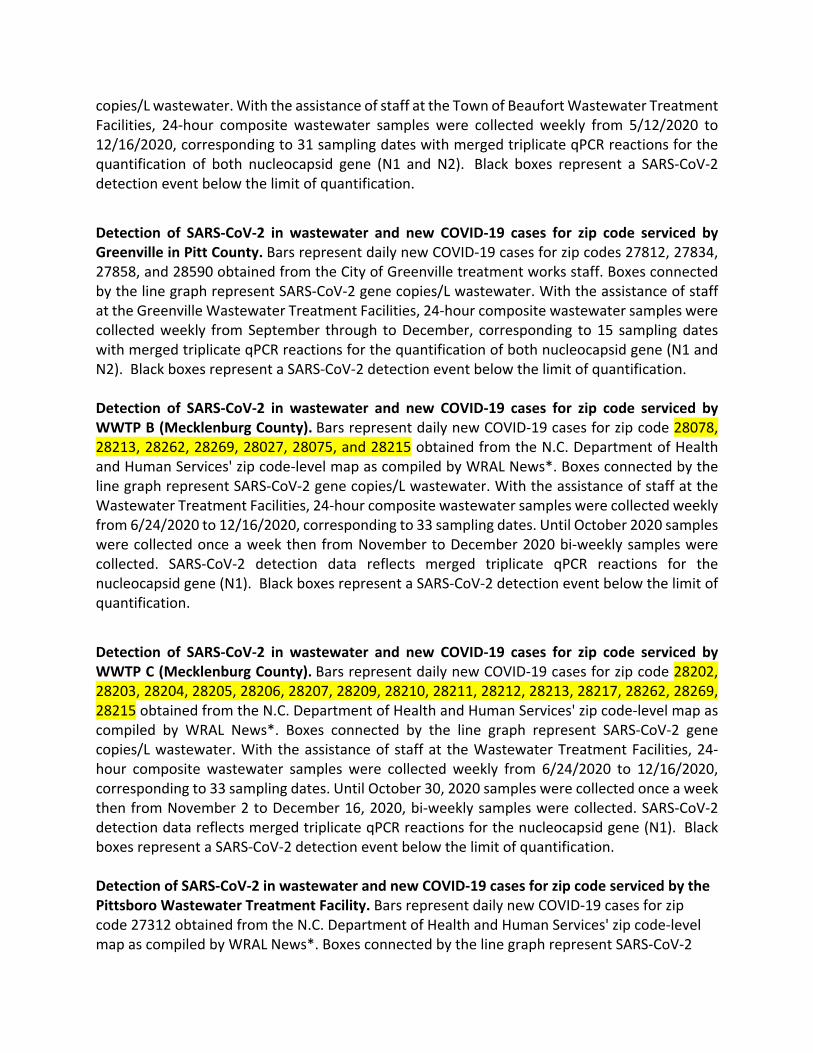
SARS-CoV-2 N1+N2 Target and Daily New COVID - New Hanover County, NC WWTP
New Covid Cases
Detection of SARS‐CoV‐2 in wastewater and new COVID‐19 cases for zip code serviced by the Town of Beaufort in Carteret County. Bars represent daily new COVID‐19 cases for zip code 28516 obtained from the N.C. Department of Health and Human Services' zip code‐level map as compiled by WRAL News*. Boxes connected by the line graph represent SARS‐CoV‐2 gene
copies/L wastewater. With the assistance of staff at the Town of Beaufort Wastewater Treatment Facilities, 24‐hour composite wastewater samples were collected weekly from 5/12/2020 to 12/16/2020, corresponding to 31 sampling dates with merged triplicate qPCR reactions for the quantification of both nucleocapsid gene (N1 and N2). Black boxes represent a SARS‐CoV‐2 detection event below the limit of quantification.
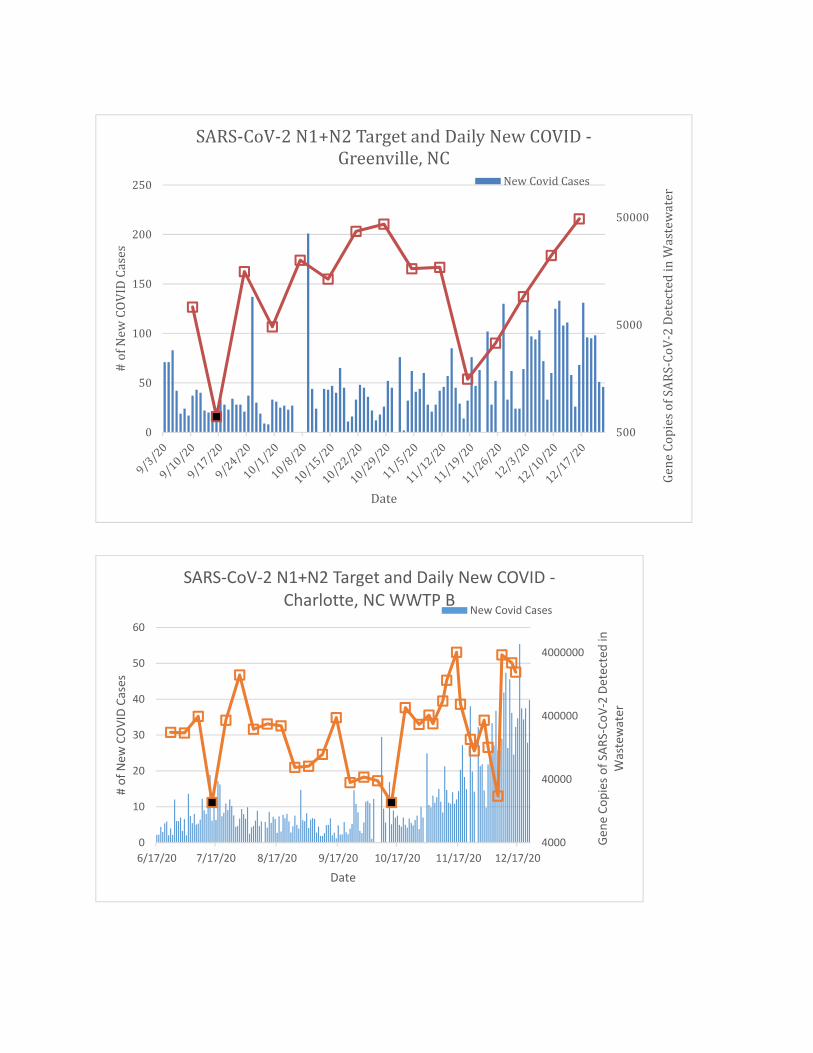
Detection of SARS‐CoV‐2 in wastewater and new COVID‐19 cases for zip code serviced by Greenville in Pitt County. Bars represent daily new COVID‐19 cases for zip codes 27812, 27834, 27858, and 28590 obtained from the City of Greenville treatment works staff. Boxes connected by the line graph represent SARS‐CoV‐2 gene copies/L wastewater. With the assistance of staff at the Greenville Wastewater Treatment Facilities, 24‐hour composite wastewater samples were collected weekly from September through to December, corresponding to 15 sampling dates with merged triplicate qPCR reactions for the quantification of both nucleocapsid gene (N1 and N2). Black boxes represent a SARS‐CoV‐2 detection event below the limit of quantification.
Detection of SARS‐CoV‐2 in wastewater and new COVID‐19 cases for zip code serviced by WWTP B (Mecklenburg County). Bars represent daily new COVID‐19 cases for zip code 28078, 28213, 28262, 28269, 28027, 28075, and 28215 obtained from the N.C. Department of Health and Human Services' zip code‐level map as compiled by WRAL News*. Boxes connected by the line graph represent SARS‐CoV‐2 gene copies/L wastewater. With the assistance of staff at the Wastewater Treatment Facilities, 24‐hour composite wastewater samples were collected weekly from 6/24/2020 to 12/16/2020, corresponding to 33 sampling dates. Until October 2020 samples were collected once a week then from November to December 2020 bi‐weekly samples were collected. SARS‐CoV‐2 detection data reflects merged triplicate qPCR reactions for the nucleocapsid gene (N1). Black boxes represent a SARS‐CoV‐2 detection event below the limit of quantification.
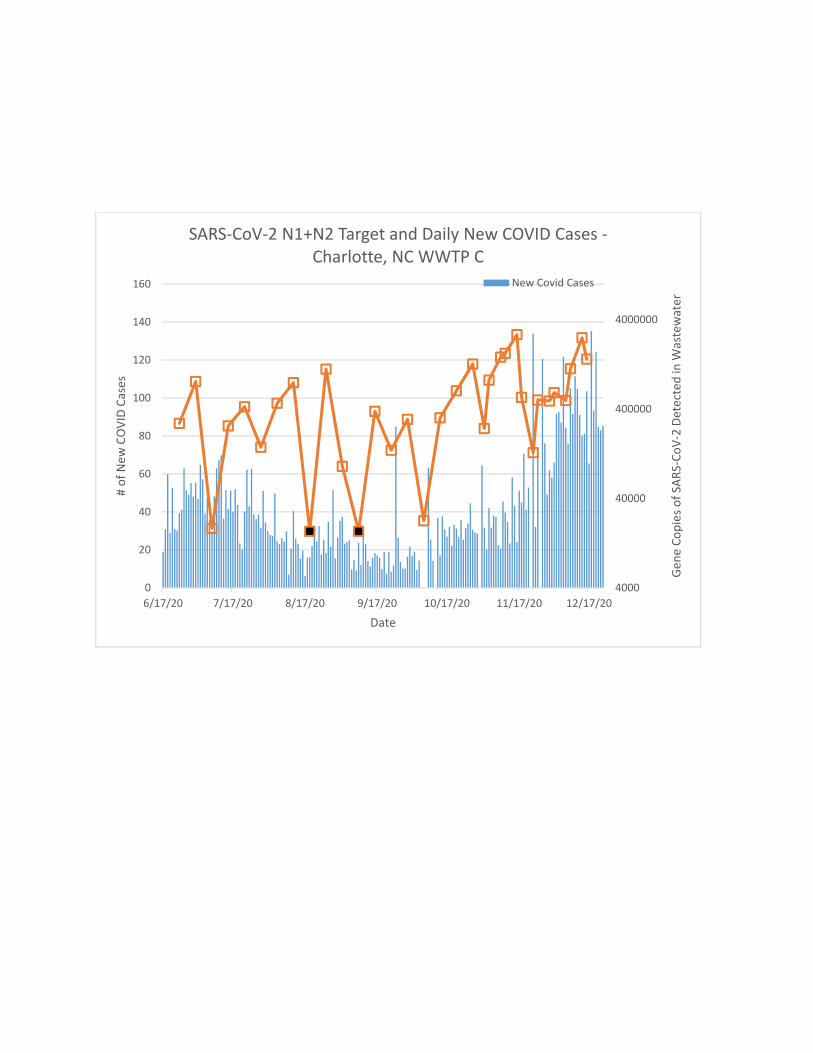
Detection of SARS‐CoV‐2 in wastewater and new COVID‐19 cases for zip code serviced by WWTP C (Mecklenburg County). Bars represent daily new COVID‐19 cases for zip code 28202, 28203, 28204, 28205, 28206, 28207, 28209, 28210, 28211, 28212, 28213, 28217, 28262, 28269, 28215 obtained from the N.C. Department of Health and Human Services' zip code‐level map as compiled by WRAL News*. Boxes connected by the line graph represent SARS‐CoV‐2 gene copies/L wastewater. With the assistance of staff at the Wastewater Treatment Facilities, 24‐hour composite wastewater samples were collected weekly from 6/24/2020 to 12/16/2020, corresponding to 33 sampling dates. Until October 30, 2020 samples were collected once a week then from November 2 to December 16, 2020, bi‐weekly samples were collected. SARS‐CoV‐2 detection data reflects merged triplicate qPCR reactions for the nucleocapsid gene (N1). Black boxes represent a SARS‐CoV‐2 detection event below the limit of quantification.
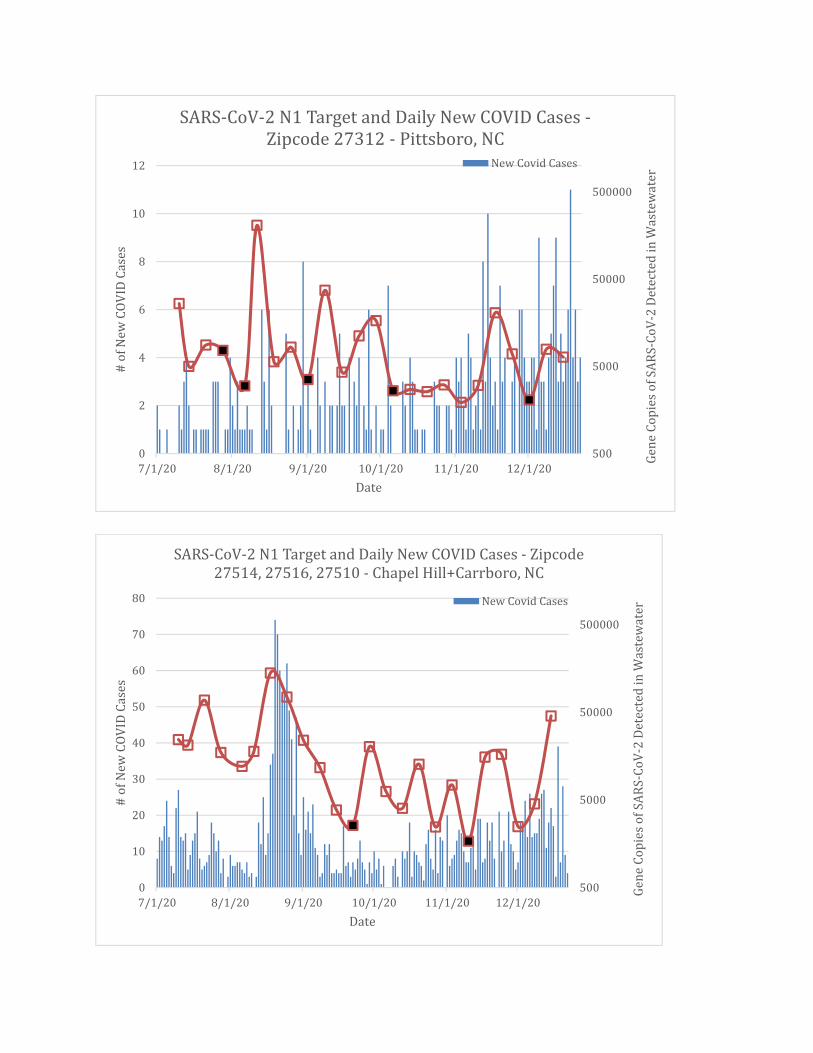
Detection of SARS‐CoV‐2 in wastewater and new COVID‐19 cases for zip code serviced by the Pittsboro Wastewater Treatment Facility. Bars represent daily new COVID‐19 cases for zip code 27312 obtained from the N.C. Department of Health and Human Services' zip code‐level map as compiled by WRAL News*. Boxes connected by the line graph represent SARS‐CoV‐2
gene copies/L wastewater. With the assistance of staff at the Pittsboro Wastewater Treatment Facility, 24‐hour composite wastewater samples were collected weekly from 7/10/2020 to 12/15/2020, corresponding to 24 sampling dates. SARS‐CoV‐2 detection data reflects merged duplicate ddPCR reactions for the nucleocapsid gene (N1). Black boxes represent a SARS‐CoV‐2 detection event below the limit of quantification. *https://github.com/wraldata/nc‐covid‐data/tree/master/zip_level_data/time_series_data/csv
Detection of SARS‐CoV‐2 in wastewater and new COVID‐19 cases for zip codes serviced by the Orange County Water and Sewer Authority (OWASA) treatment facility. Bars represent daily new COVID‐19 cases for zip codes 27510, 27514, and 27516 obtained from the N.C. Department of Health and Human Services' zip code‐level map as compiled by WRAL News*. Boxes connected by the line graph represent SARS‐CoV‐2 gene copies/L wastewater. With the assistance of staff at the OWASA treatment facility, 24‐hour composite wastewater samples were collected weekly from 7/10/2020 to 12/15/2020, corresponding to 24 sampling dates. SARS‐CoV‐2 detection data reflects merged duplicate ddPCR reactions for the nucleocapsid gene (N1). Black boxes represent a SARS‐CoV‐2 detection event below the limit of quantification.
Detection of SARS‐CoV‐2 in Wilmington, NC (Northside) wastewater and new COVID‐19 cases by zip code. Bars represent daily new COVID‐19 cases by zip codes. Boxes connected by the line graph represent SARS‐CoV‐2 gene copies/L wastewater. With the assistance of staff at the Cape Fear Public Utility Authority, 6‐hour composite wastewater samples were collected weekly from June 29 to December 29 corresponding to 27 sampling dates with merged duplicate qPCR reactions for the quantification of both nucleocapsid gene (N1 and N2). Black boxes represent a SARS‐CoV‐2 detection event below the limit of quantification.
Detection of SARS‐CoV‐2 in Wilmington, NC (Southside) wastewater and new COVID‐19 cases by zip code. Bars represent daily new COVID‐19 cases by zip code. Boxes connected by the line graph represent SARS‐CoV‐2 gene copies/L wastewater. With the assistance of staff at the Cape Fear Public Utility Authority, 6‐hour composite wastewater samples were collected weekly from June 29 to December 29 corresponding to 27 sampling dates with merged duplicate qPCR reactions for the quantification of both nucleocapsid gene (N1 and N2). Black boxes represent a SARS‐CoV‐2 detection event below the limit of quantification.
*https://github.com/wraldata/nc‐covid‐data/tree/master/zip_level_data/time_series_data/csv
Appendix D: Mapping COVID-19 incidence rate
The incidence rate of COVID-19 was mapped using the Bayesian Maximum Entropy (BME) method of geostatistics developed at UNC-CH. This method accounts for the spatio-temporal
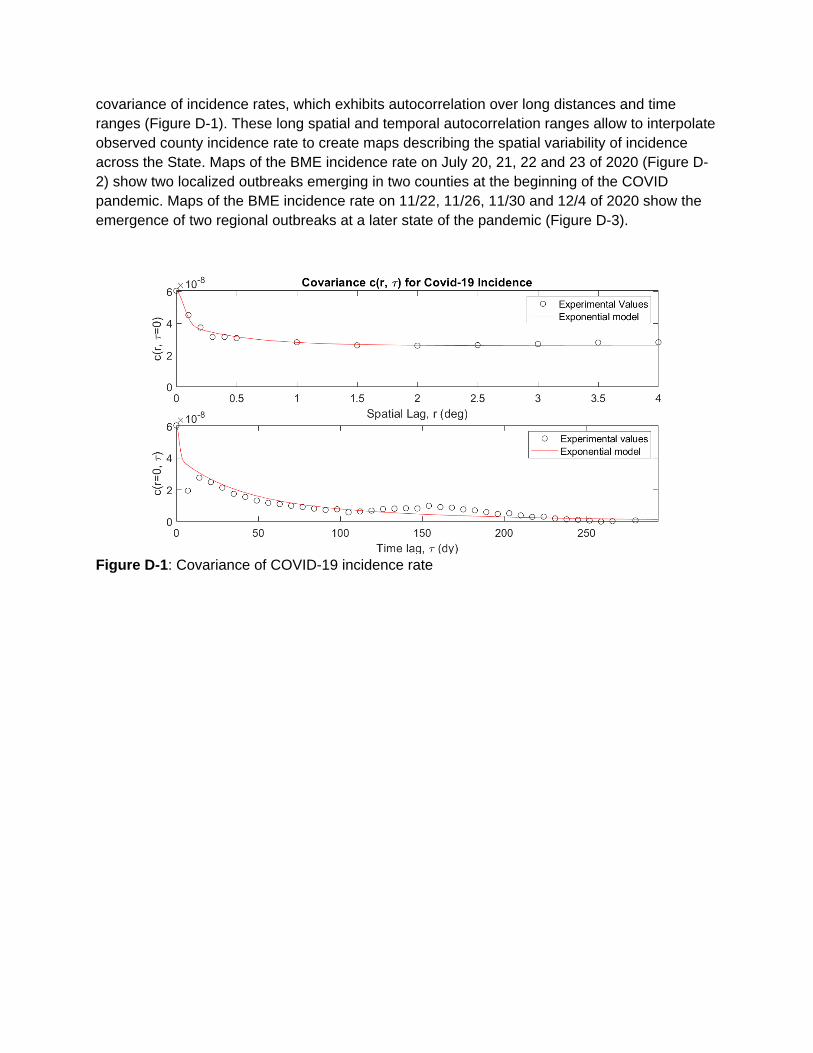
covariance of incidence rates, which exhibits autocorrelation over long distances and time ranges (Figure D-1). These long spatial and temporal autocorrelation ranges allow to interpolate observed county incidence rate to create maps describing the spatial variability of incidence across the State. Maps of the BME incidence rate on July 20, 21, 22 and 23 of 2020 (Figure D-2) show two localized outbreaks emerging in two counties at the beginning of the COVID pandemic. Maps of the BME incidence rate on 11/22, 11/26, 11/30 and 12/4 of 2020 show the emergence of two regional outbreaks at a later state of the pandemic (Figure D-3).
Figure D-1: Covariance of COVID-19 incidence rate
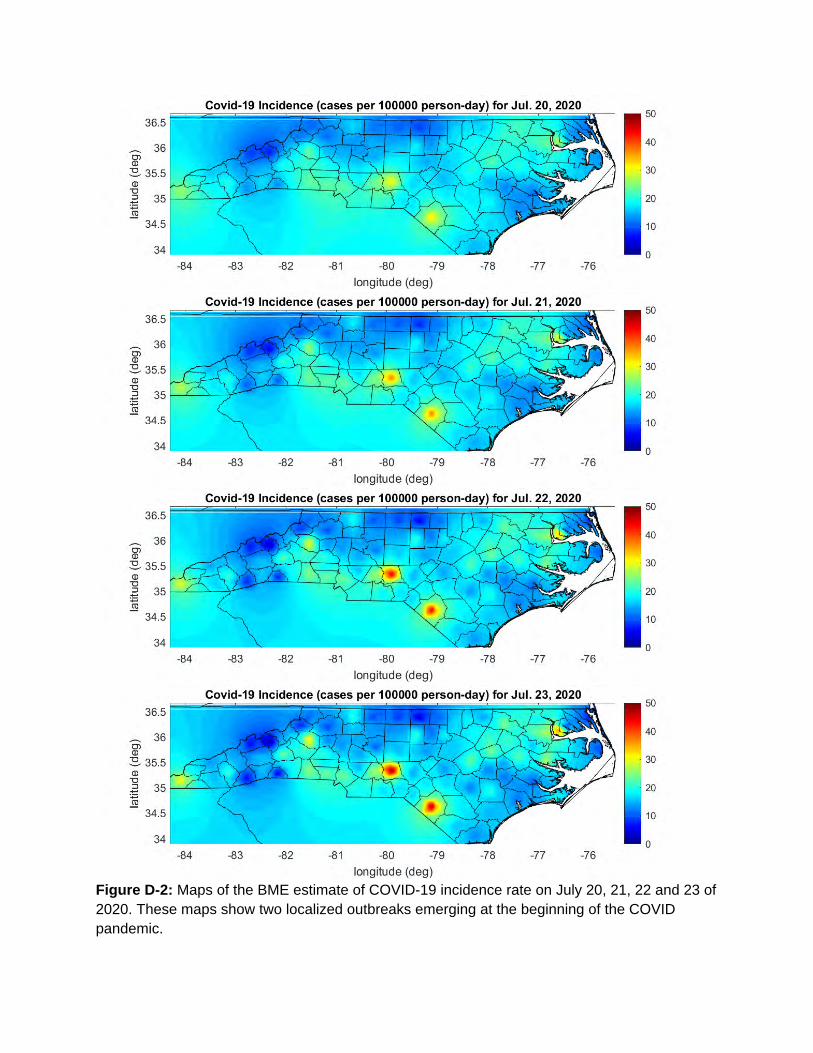
Figure D-2: Maps of the BME estimate of COVID-19 incidence rate on July 20, 21, 22 and 23 of 2020. These maps show two localized outbreaks emerging at the beginning of the COVID pandemic.
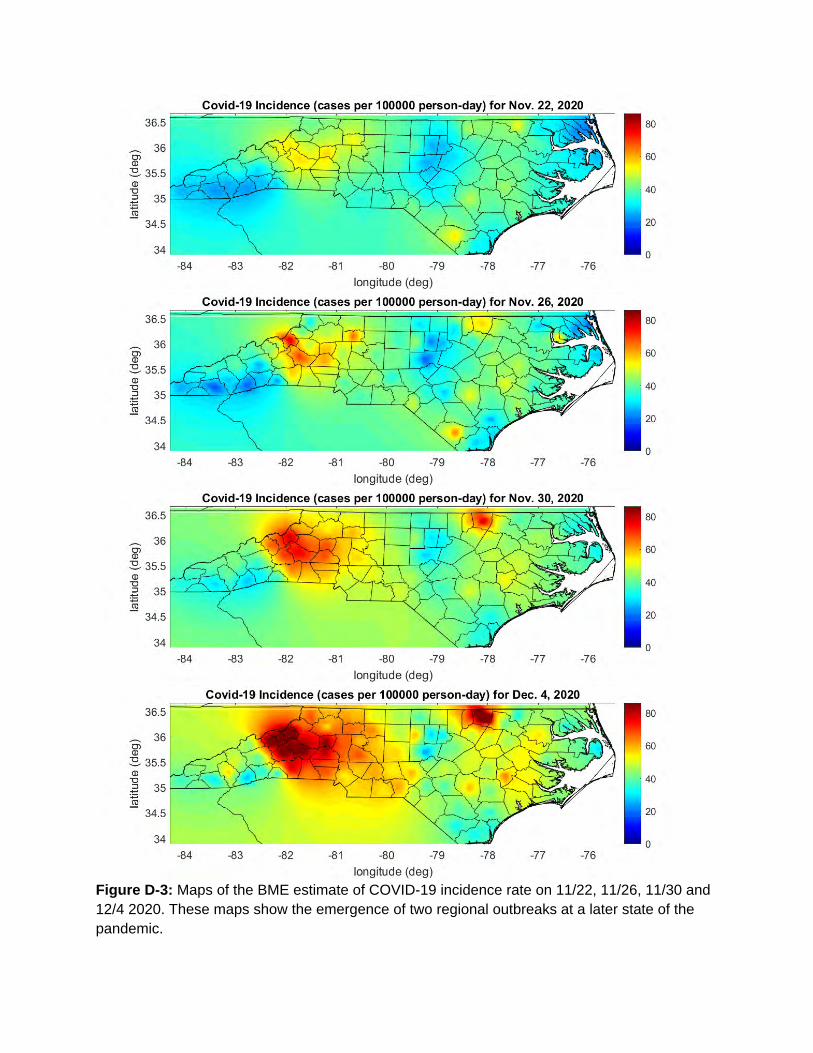
Figure D-3: Maps of the BME estimate of COVID-19 incidence rate on 11/22, 11/26, 11/30 and 12/4 2020. These maps show the emergence of two regional outbreaks at a later state of the pandemic.
Appendix E: Precipitation and WWTP flow
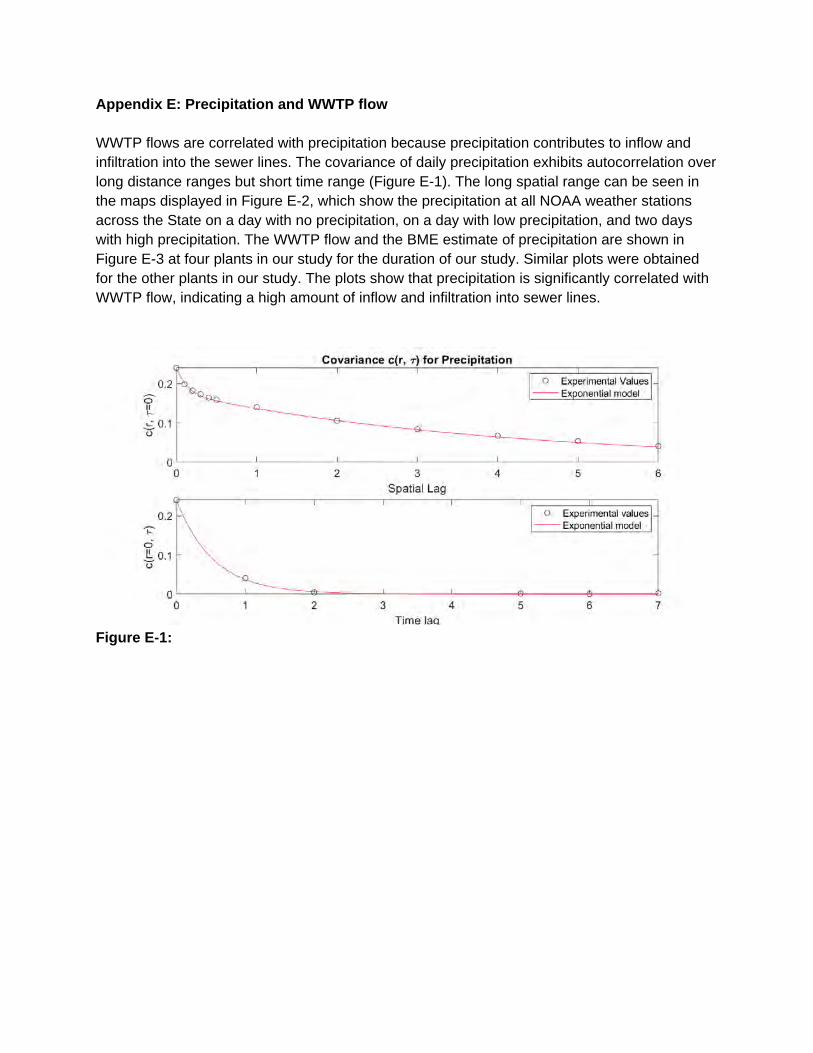
WWTP flows are correlated with precipitation because precipitation contributes to inflow and infiltration into the sewer lines. The covariance of daily precipitation exhibits autocorrelation over long distance ranges but short time range (Figure E-1). The long spatial range can be seen in the maps displayed in Figure E-2, which show the precipitation at all NOAA weather stations across the State on a day with no precipitation, on a day with low precipitation, and two days with high precipitation. The WWTP flow and the BME estimate of precipitation are shown in Figure E-3 at four plants in our study for the duration of our study. Similar plots were obtained for the other plants in our study. The plots show that precipitation is significantly correlated with WWTP flow, indicating a high amount of inflow and infiltration into sewer lines.
Figure E-1:
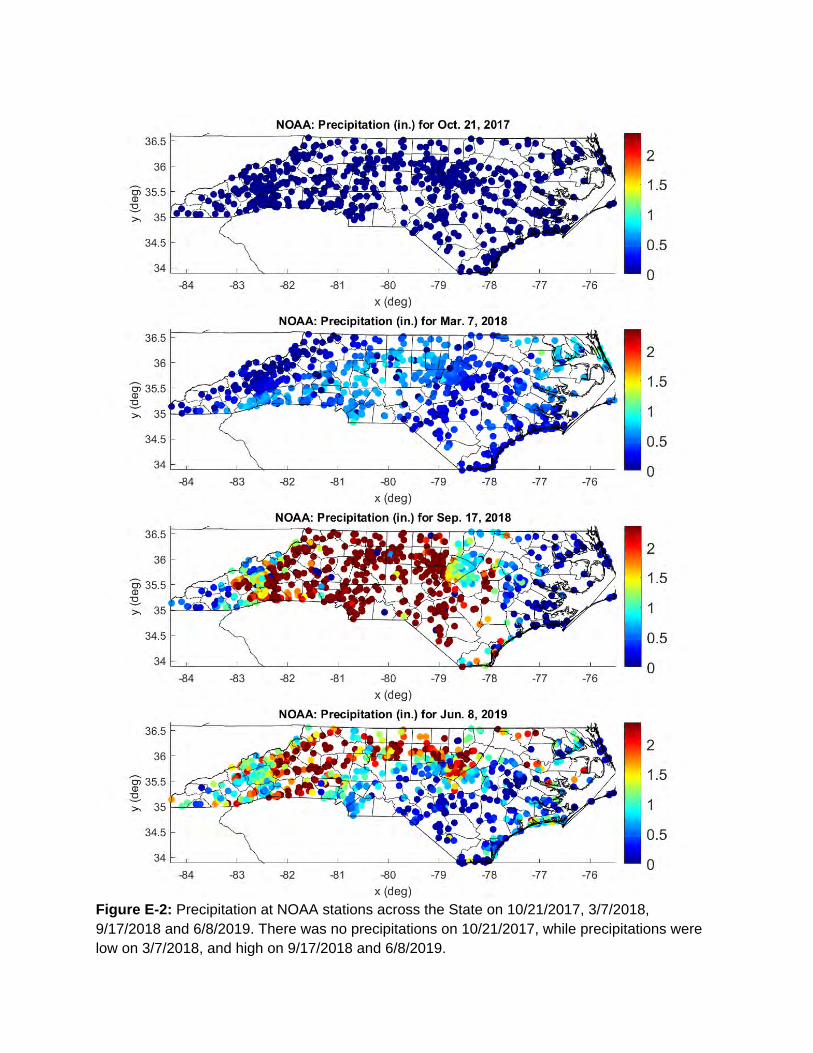
Figure E-2: Precipitation at NOAA stations across the State on 10/21/2017, 3/7/2018, 9/17/2018 and 6/8/2019. There was no precipitations on 10/21/2017, while precipitations were low on 3/7/2018, and high on 9/17/2018 and 6/8/2019.
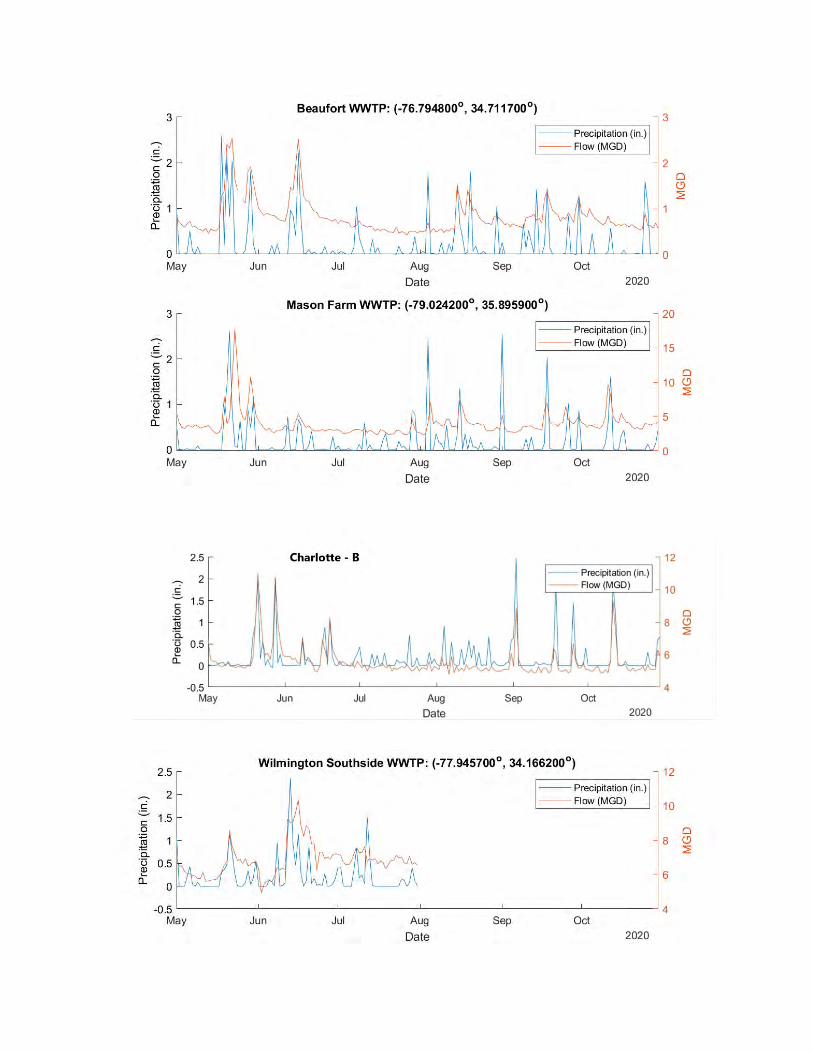
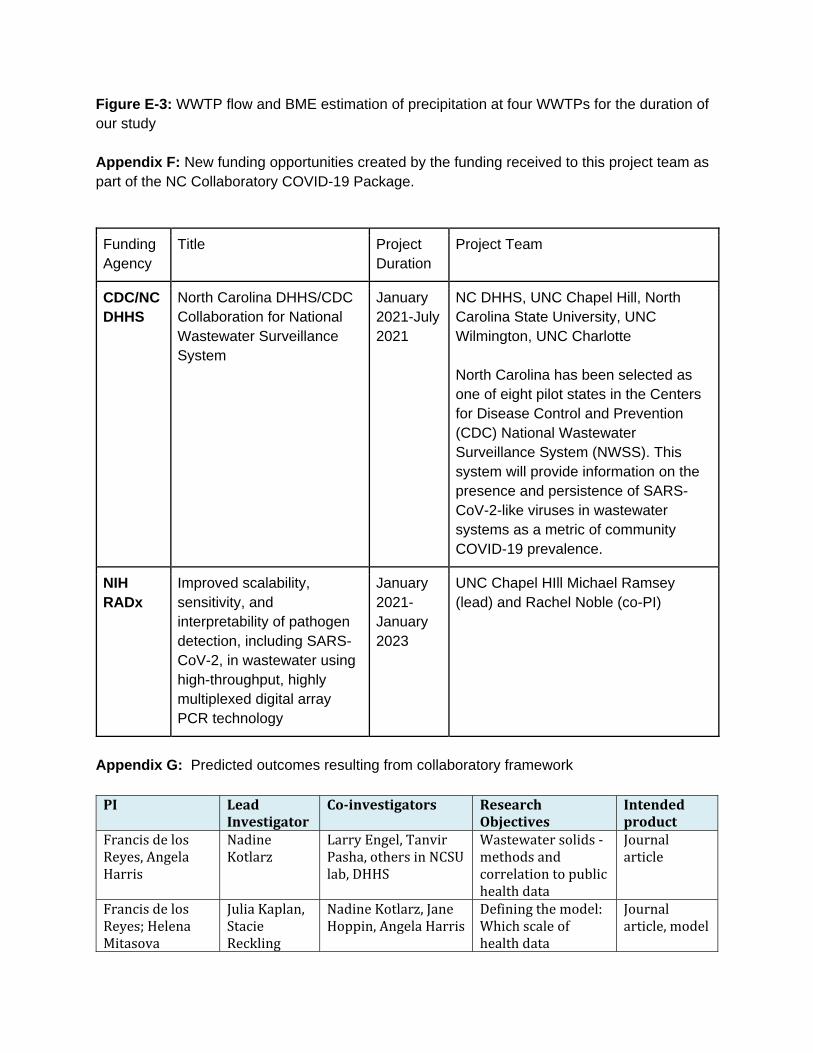
Figure E-3: WWTP flow and BME estimation of precipitation at four WWTPs for the duration of our study
Appendix F: New funding opportunities created by the funding received to this project team as part of the NC Collaboratory COVID-19 Package.
Funding Agency
Title Project Duration
Project Team
CDC/NC North Carolina DHHS/CDC January NC DHHS, UNC Chapel Hill, North DHHS Collaboration for National
Wastewater Surveillance System
2021-July 2021
Carolina State University, UNC Wilmington, UNC Charlotte
North Carolina has been selected as one of eight pilot states in the Centers for Disease Control and Prevention (CDC) National Wastewater Surveillance System (NWSS). This system will provide information on the presence and persistence of SARS-CoV-2-like viruses in wastewater systems as a metric of community COVID-19 prevalence.
NIH Improved scalability, January UNC Chapel HIll Michael Ramsey RADx sensitivity, and
interpretability of pathogen detection, including SARS-CoV-2, in wastewater using high-throughput, highly multiplexed digital array PCR technology
2021-January 2023
(lead) and Rachel Noble (co-PI)
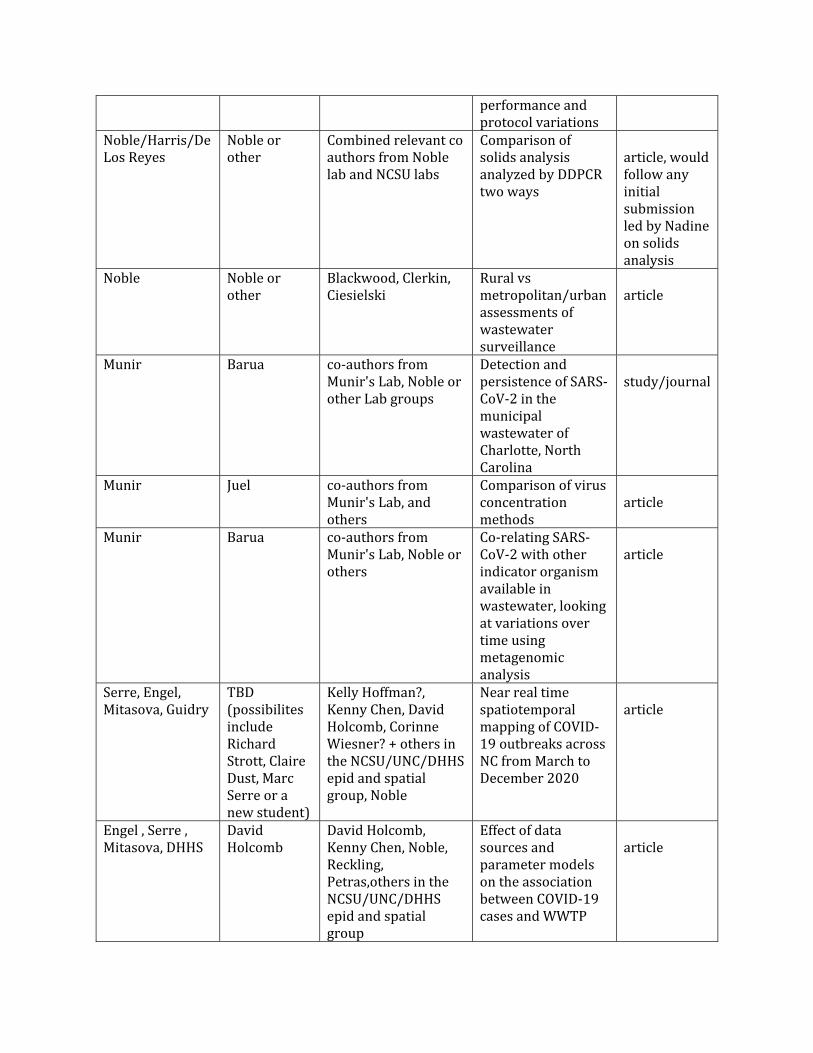
Appendix G: Predicted outcomes resulting from collaboratory framework
PI Lead Investigator
Co‐investigators Research Objectives
Intended product
Francis de losReyes, AngelaHarris
NadineKotlarz
Larry Engel, TanvirPasha, others in NCSU lab, DHHS
Wastewater solids -methods andcorrelation to publichealth data
Journalarticle
Francis de losReyes; HelenaMitasova
Julia Kaplan, StacieReckling
Nadine Kotlarz, JaneHoppin, Angela Harris
Defining the model: Which scale of health data
Journalarticle, model
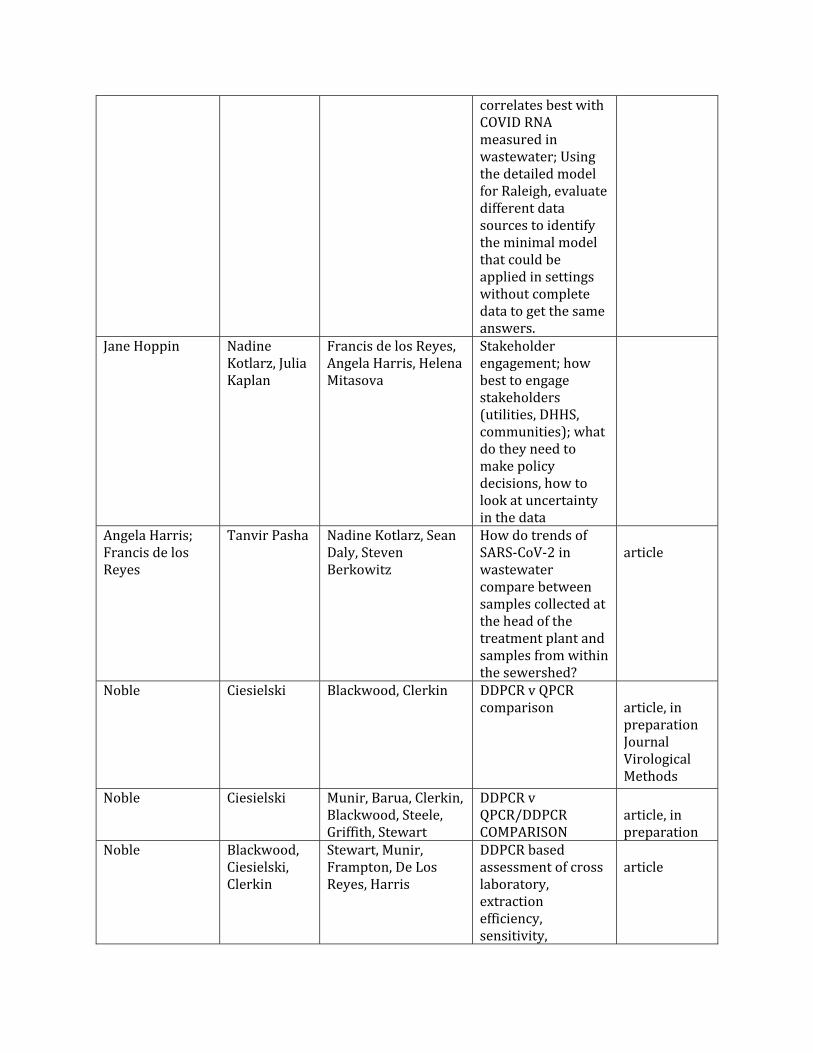
COVID RNAmeasured in wastewater; Using the detailed model for Raleigh, evaluatedifferent datasources to identify the minimal model that could be applied in settingswithout completedata to get the same answers.
Jane Hoppin NadineKotlarz, Julia Kaplan
Francis de los Reyes,Angela Harris, Helena Mitasova
Stakeholderengagement; howbest to engage stakeholders(utilities, DHHS,communities); whatdo they need to make policydecisions, how tolook at uncertainty in the data
Angela Harris; Francis de losReyes
Tanvir Pasha Nadine Kotlarz, SeanDaly, StevenBerkowitz
How do trends ofSARS-CoV-2 inwastewater compare betweensamples collected at the head of the treatment plant and samples from within the sewershed?
article
Noble Ciesielski Blackwood, Clerkin DDPCR v QPCR comparison article, in
preparation JournalVirologicalMethods
Noble Ciesielski Munir, Barua, Clerkin,Blackwood, Steele,Griffith, Stewart
DDPCR vQPCR/DDPCRCOMPARISON
article, inpreparation
Noble Blackwood,Ciesielski,Clerkin
Stewart, Munir,Frampton, De LosReyes, Harris
DDPCR basedassessment of cross laboratory,extraction efficiency,sensitivity,
article
correlates best with
performance andprotocol variations
Noble/Harris/DeLos Reyes
Noble orother
Combined relevant coauthors from Noble lab and NCSU labs
Comparison ofsolids analysis analyzed by DDPCR two ways
article, would follow anyinitialsubmissionled by Nadine on solidsanalysis
Noble Noble or other
Blackwood, Clerkin,Ciesielski
Rural vsmetropolitan/urbanassessments ofwastewater surveillance
article
Munir Barua co-authors from Munir's Lab, Noble or other Lab groups
Detection and persistence of SARS-CoV-2 in the municipalwastewater of Charlotte, North Carolina
study/journal
Munir Juel co-authors from Munir's Lab, andothers
Comparison of virusconcentration methods
article
Munir Barua co-authors from Munir's Lab, Noble or others
Co-relating SARS-CoV-2 with other indicator organismavailable in wastewater, looking at variations over time usingmetagenomic analysis
article
Serre, Engel,Mitasova, Guidry
TBD(possibilitesincludeRichardStrott, ClaireDust, MarcSerre or a new student)
Kelly Hoffman?,Kenny Chen, David Holcomb, CorinneWiesner? + others in the NCSU/UNC/DHHSepid and spatial group, Noble
Near real time spatiotemporal mapping of COVID-19 outbreaks across NC from March toDecember 2020
article
Engel , Serre , Mitasova, DHHS
DavidHolcomb
David Holcomb,Kenny Chen, Noble, Reckling,Petras,others in the NCSU/UNC/DHHS epid and spatial group
Effect of datasources andparameter modelson the association between COVID-19 cases and WWTP
article
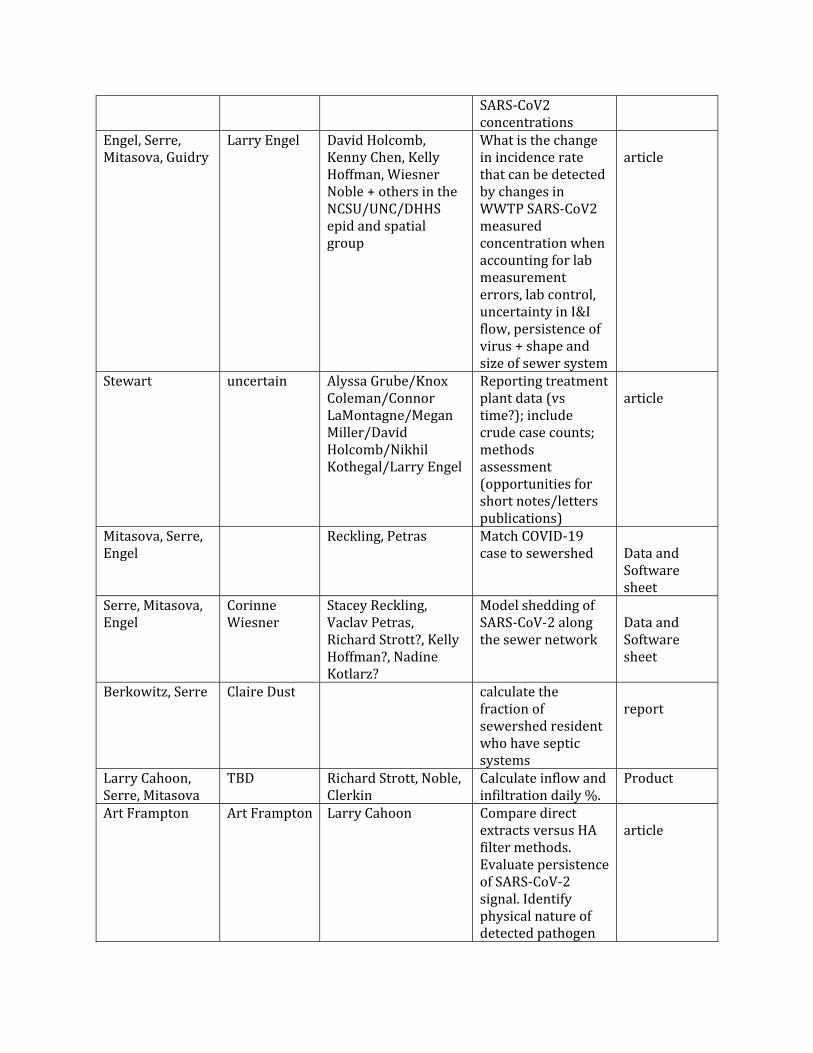
concentrations Engel, Serre,Mitasova, Guidry
Larry Engel David Holcomb, Kenny Chen, Kelly Hoffman, WiesnerNoble + others in the NCSU/UNC/DHHS epid and spatial group
What is the change in incidence rate that can be detected by changes inWWTP SARS-CoV2measured concentration when accounting for lab measurement errors, lab control, uncertainty in I&Iflow, persistence of virus + shape andsize of sewer system
article
Stewart uncertain Alyssa Grube/Knox Coleman/Connor LaMontagne/MeganMiller/DavidHolcomb/NikhilKothegal/Larry Engel
Reporting treatmentplant data (vstime?); include crude case counts; methodsassessment(opportunities forshort notes/letters publications)
article
Mitasova, Serre,Engel
Reckling, Petras Match COVID-19 case to sewershed Data and
Softwaresheet
Serre, Mitasova, Engel
CorinneWiesner
Stacey Reckling,Vaclav Petras,Richard Strott?, KellyHoffman?, Nadine Kotlarz?
Model shedding of SARS-CoV-2 alongthe sewer network
Data andSoftwaresheet
Berkowitz, Serre Claire Dust calculate the fraction of sewershed resident who have septicsystems
report
Larry Cahoon,Serre, Mitasova
TBD Richard Strott, Noble,Clerkin
Calculate inflow andinfiltration daily %.
Product
Art Frampton Art Frampton Larry Cahoon Compare direct extracts versus HA filter methods. Evaluate persistence of SARS-CoV-2signal. Identifyphysical nature ofdetected pathogen
article
SARS-CoV2

using immunogold electronmicroscopy.Detection of variant strains in collectedsamples by genomic sequencing