Embed Size (px)
Citation preview
NBER WORKING PAPER SERIES
WHO LEAVES? THE OUTMIGRATIONOF THE FOREIGN-BORN
George J. BorjasBernt Bratsberg
Working Paper No. 4913
NATIONAL BUREAU OF ECONOMIC RESEARCH1050 Massachusetts Avenue
Cambridge, MA 02138November 1994
We are grateful to Robert Warren for providing us with a number of unpublished INS statistics,and to two anonymous referees for helpful suggestions. This research was supported by theNational Science Foundation. This paper is part of NEER's research program in Labor Studies.Any opinions expressed are those of the authors and not those of the National Bureau ofEconomic Research.
1994 by George J. Borjas and Berm Bratsberg. All rights reserved. Short sections of text,not to exceed two paragraphs. may be quoted without explicit permission provided that fullcredit, including notice, is given to the source.

NBER Working Paper #4913November 1994
WHO LEAVES? THE OUTMIC3RATIONOF THE FOREIGN-BORN
ABSTRACT
This paper analyzes the return migration of foreign-born persons in the United States. We
argue that return migration may have been planned as part of an optimal life cycle residential
location sequence. Return migration also occurs because immigrants based their initial migration
decision on erroneous information about opportunities in the United States. The study uses the
1980 Census and administrative data from the immigration and Naturalization Service.
Immigrants tend to return to wealthy countries which are not too far from the United States.
Moreover, return migration accentuates the type of selection characterizing the immigrant
population left in the United States.
George J. Borjas Bernt BratsbergDepartment of Economics, 0508 Department of EconomicsUniversity of California. San Diego Waters Hall9500 Gilman Drive Kansas State UniversityLa Jolla. CA 92093 Manhattan, KS 66506and NBER
WHO LEAVES? THE OUTMIGRATION OF THE FOREIGN-BORN
George J. Borjas and Bent Bratsberg
I. Introduction
Migration decisions are reversible. Studies of internal migration within the United States
indicate that recent migrants have a high probability of returning to their origin or of moving onto
other locations (DaVanzo, 1973; Fields, 1979). Studies of international migration flows also
suggest the presence of large numbers of return migrants. Warren and Peck (1980) and Warren
and Kialy (1985) estimate that perhaps 30 percent of the foreign-born persons in the United
States leave the country within a decade or two after their arrival.'
The fact that large numbers of immigrants choose not to remain in the United States has
important implications. In fact, much of the empirical evidence about the economic impact of
immigration reported in the literature is contaminated by the nonrandom nature of the
outmigration decision. Consider, for instance, the cross-section finding that recently arrived
immigrants have lower earnings than earlier immigrants. Although this result can be interpreted
as evidence of rapid economic assimilation, it can also be explained through outmigration
behavior. In particular, suppose that immigrants who fail in the U.S. labor market leave the
country. In any given cross-section, early immigrant waves have been "weeded out," and have
higher average earnings than the more recent waves (which include future outmigrants).2
'It is unknown if these outmigrants are return migrants (in the sense that they are returning to theircountry of birth), or if they are remigratihg to a third country. Throughout this paper, therefore, we usethe terms return migrants and outinigrants as synonymous, even though we do not know the finaldestination of these flows. For additional estimates of return migration rates in the immigrant
population. see Jasso and Rosenzweig(1982) and Lam (1987).
tIt is important to note that the biases introduced by nonrandom outmigration remain even i-fimmigrants waves are tracked across Censuses (as in Boijas, 1985). Later censuses enumerate only
Despite the practical importance of return migration, little is known either conceptually or
empirically about the selection process guiding the outmigration decision of the foreign-born.
Two recent studies, by Borjas (1989) and Jasso and Rosenzweig (1988), begin to address these
issues. In the Sodas study, outmigration behavior is inferred from sample attrition in a
longitudinal data set of foreign-born scientists and engineers. He finds that the least successfiul
scientists and engineers are most likely to drop out from the sample, and concludes that the
outmigration process is one in which "failures" leave the United States. In contrast, Jasso and
Rosenzweig observe the naturalization decision of immigrants, and infer that those who do not
naturalize are most likely to leave the country. In their study, it is the most skilled workers who
do not naturalize, and are most likely to be outmigrants.3
This paper presents a conceptual and empirical analysis of the return migration behavior of
foreign-born persons in the United States. We argue that outmigration can arise for two reasons.
First, the return migration may have been planned as part of an optimal life-cycle residential
location sequence, wherein some immigrants migrate to the United States for a few years,
accumulate financial resources or other types of capital, and then return to the source country.
Alternatively, return migration occurs because immigrants based their initial migration decision on
erroneous information about economic opportunities in the United States.
those immigrants who reside in the United States, and hence much of what is measured as assimilationby the tracking procedure may be due to the changing composition of the immigrant cohort.
3A study by Lam (1987) also attempts to analyze outmigration behavior, and presents some estimates ofoutmigration rates, but does not address the questions about the self-selection underlying thephenomenon. Tunali (1986) addresses selection issues with respect to the remigration process ofpersons in Turkey. Finally, Pessino (1991) constructs a model of remigration based on the hypothesisthat outmigration can be mainly attributed to forecasting errors.

3
The empirical analysis relies on the 1980 Public Use Sample of the U.S. Censusand on
administrative microdata from the Immigration and Naturalization Service (INS). By combining
these data, as well as by bringing in outside information on such factors as the number of illegal
aliens, we calculate outrnigration rates for immigrants from 70 source countries. These
outmigration rates indicate that immigrants tend to return to wealthy countries that are not too
distant from the United States. In addition, the empirical evidence suggests that the return
migration process accentuates the type of selection characterizing the immigrant population left in
the United States.
H. Theory
There are two alternative approaches to modeling the return migration decision. The first
views return migration as part of an optimal residential location plan over the life cycle (as in the
occupational mobility model of Rosen, 1972). In other words, some workers consciously decide
to immigrate to the United States for a few years, and then return to their home countries after
accumulating sufficiently large levels of capital or wealth. Alternatively, return migration flows
may result from "mistakes" in the initial migration decision. Potential migrants in the source
country are uncertain about the economic conditions they will face in the United States. As long
as return migration costs are relatively low, workers who experience worse-than-expected
outcomes in the United States may wish to return to their home country.
We begin by presenting a model that incorporates both motives for return migration.
Suppose individuals originate in country 0 and consider the possibility of immigrating, either

4
temporarily or permanently, to country 1 (for concreteness, the United States). The logearnings
distributions in the source country and in the United States are described by:4
(1) w0=l.L0+nv,
(2)
where is is the mean income in the source country, and i. is the mean income that would be
observed if all persons in the source country migrated to the United States. The random variables
v and c measure deviations from mean incomes, have zero means and finite variances, and are
assumed to be independent. We also assume that v is known to the individual, while s remains
unknown unless the individual migrates to the United States. We interpret v as reflecting ability
or skills that are transferable across countries, while a reflects an uncertain component (perhaps
due to misinformation or luck) in U.S. earnings. The parameter r can be interpreted as the rate of
return to skills in the source country relative to that in the United States.3
Upon arrival to the United States, the immigrant makes a draw from the known density
g(c), and if the value of the random draw is sufficiently negative chooses to return to the source
country immediately. The immigrant also knows, however, that a temporary stay in the United
States might improve the economic options he faces in the source country. The simplest way of
'The model presented below generalizes the Roy model framework (Roy, 1951; Boijas, 1987) to includethe option of return migration.
5Note that the model assumes a perfect correlation between the skill components of earnings in the twocountries (i.e., between v and nv). Obviously, this asswnption restricts the types of migration flows thatcan be generated. Bosjas (1987) shows that if the correlation coefficient were sufficiently small ornegative, the migration flow would resemble a refugee sorting: The immigrant flow is then composed ofpersons who do badly in the source country, but who have skills which are useful in the United States.

5
modeling the gains to the immigrant's investment is to assume that after spending a fraction it of
the working life in the United States, immigrants can increase their earnings in the sourcecountry
by K percent. We assume that the parameter it is constant, and that the individual's temporary
stay in the United States, if it occurs at all, occurs at the beginning of the working life.'
Workers in the source country, therefore, have an additional option: residing in the
United States for a fraction of the working life, followed by a permanent return to the source
country. Ignoring discounting and using a first-order approximation, the log earnings associated
with this choice are given by:
(3)
We assume that the (percentage) gain to a temporary stay in the United States, it, is constant
among individuals.7
Workers choose the sequence of residential choices that maximizes their expected
earnings, net of migration and remigration costs. Let Mbe a "time-equivalent" measure of the
costs of migrating to the United States (IvI=C,,/w0, where C are the dollar costs of migration); R
be a time-equivalent measure of the costs of remigrating to the source country (R=C,1w0,where
Cr are the dollar costs of rernigration). Further, assume that the time-equivalent costs of
migration and remigration (M' and fl) are constant in the population.8
more general model would allow for the endogeneity of the length of time spent in the United States.
7Most of our findings are unaffected by a correlation between p and x as long as this correlation is notexcessive.
81t is easy to generalize the model to allow for variable migration costs. The qualitative nature of theresults does not change as long as the correlation between migration costs and v is not excessive.

6
Assuming risk neutrality, a person migrates to the United States if
(4) max[EwL -M,Ew10-M-R]>w0,
and a person migrates to the United States and then returns to the source country if:
(5) max[Ew1 -Ad', Ew10 -Ai'- RI> w0 ?i4 max[w0 -R, w10 -Ri> w1.
Equation (4) states that a person in the source country migrates if either the expected wage from
permanently migrating to the United States, or the expected wage from "investing" in a short stay
in the United States exceeds the wage in the source country, net of the relevant migration and
remigration costs. Equation (5) states that the sample of return migrants is generated from the
subsample of persons who were migrants in the first place, and who have better opportunities in
the source country (either in terms ofw0 or w10) than the actual income available in the United
States (w1).9
For the investment motive to be relevant for return migration, we need to assume:'°
9We do not distinguish between persons 'ho outmigrate immediately upon making a draw from thedensity g(s), and persons who remain in the United States for a fraction it of the work cycle and thenreturn to the source country.
t0This condition is necessary if anyone is to migrate to the United States as part of a planned life-cyclemobility pattern which includes remigration to the source country. To see why, note that for a worker toexpect to return to his source country, it must be the case that Lw10 -Al- R > Lw1 -A-land Lw10 -Al- R> w0. The first of these conditions implies that:
R(1— )v <t0 — + K —
while the second condition implies:

7
(6)
In effect, the returns to spending a fraction of the working life in the United States must be
sufficiently greater than the expected costs of migrating to and from the United States. Using this
condition to compare the terms inside the max(-) expressions in equations (4) and (5)generates
the following equilibrium sorting of persons among alternatives:
M+R—,c(7) Stay in Source Country: (1— q) vS (p0 — p1 + ic) ÷
M-1-R-K(8) Migrate to United States: (1—n) v> (s — +K) +It
(9) Return to Source Country: (M3—p1 ÷ic)+M÷R—x
<O—n)v<O.I —pIt 1—it
It is instructive to examine the characteristics of the migration flows when the distribution
g(c) degenerates at c = 0, so that there is no uncertainty in the migration decision. Return
migration can then only arise because a temporary stay in the United States increases the worker's
Al + R — K
Combining these two conditions yields the restriction given by equation (6) in the text.

8
earnings in the source country. The implications of the sorting summarized by equations (7)-(9)
are illustrated in Figure 1 for the case where < 1, and in Figure 2 for the case where r> 1.
Suppose initially that C 1. The immigrant flow is positively selected (i.e., it is composed
of workers with higher-than-average skills). Figure 1 also shows that the return migrant flow is
composed of the least skilled immigrants. Intuitively, it is the highly skilled who gain the most by
residing in the United States. The most skilled in this self-selected sample will wish to remain in
the United States even if their economic opportunities improve in the source country. The least-
skilled persons in this sample are the "marginal" immigrants. They are most responsive to
changing economic conditions in the source country, and they will become return migrants in
order to collect the returns on their investment.
Suppose instead that i > I. The immigrant flow is now composed of workers
of below-average skills. Because the rate of return to skills is higher in the source country, the
most skilled have little incentive to immigrate to the United States. As Figure 2 shows, even
though the immigrant flow is relatively unskilled, it is the most skilled in this self—selected sample
who find it optimal to become return migrants. Intuitively, workers with the lowest skill levels
find it optimal to reside in the United States, regardless of whether or not there are gains to be
made by migrating back to the source country. The sample of return migrants will be composed
of marginal immigrants, who in this case happen to be relatively more skilled than the typical
immigrant.
Therefore, the return n'iigtation process intensifies the selection that characterizes the
immigrant population in the United States. Because it is the marginal immigrants who leave, the
immigrants who remain in the United States are the "best of the best" if there is positive selection,
and the "worst of the worst" if there is negative selection.
9
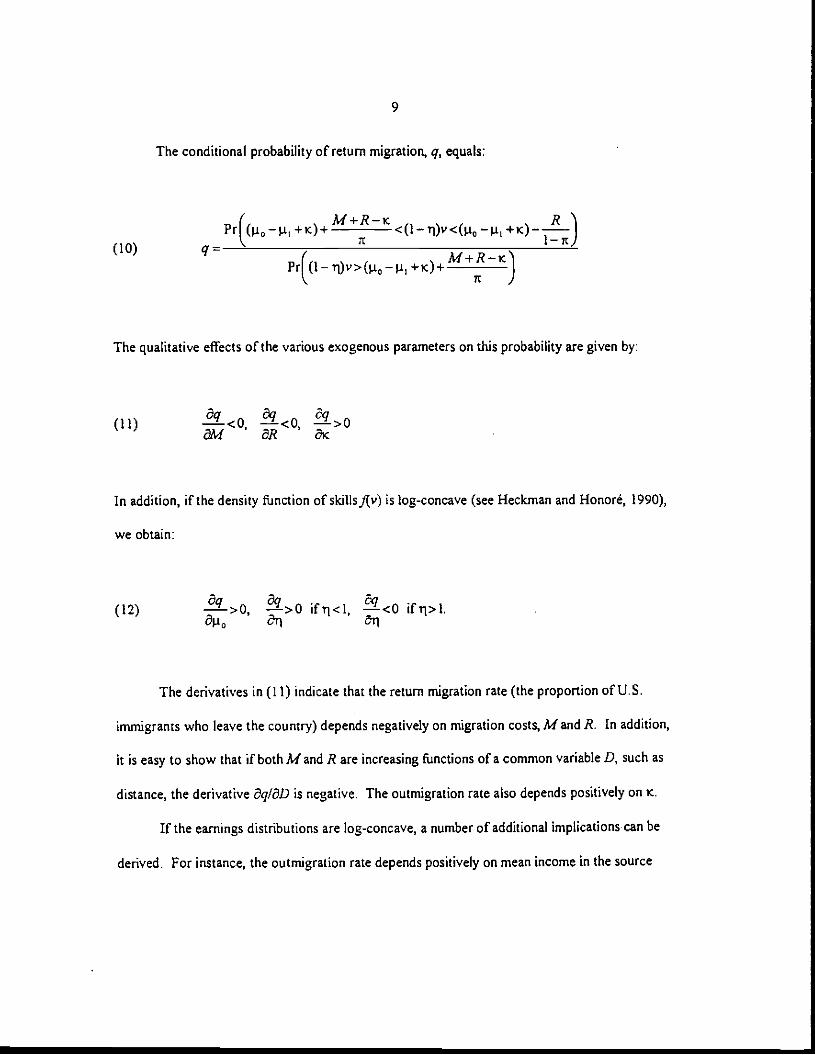
The conditional probability of return migration, q, equals:
( M-i-R-ic R<Ø—)vc(p0—j.i1 +ic)————-
(10) — litI M+R-ic
Pri (1— — l1 tic) +It
The qualitative effects of the various exogenous parameters on thisprobability are given by:
(Ii) <o -<o, 1L>3M 31? ôic
In addition, if the density function of skillsfiv) is log-concave (see Heckman and Honoré, 1990),
we obtain:
(12) gq_>0 >0 ifrjcl, L<0 if>I.& cr1
The derivatives in (11) indicate that the return migration rate (the proportion of U.S.
immigrants who leave the country) depends negatively on migration costs, M and B. In addition,
it is easy to show that if both M and 1? are increasing functions of a common variable D, such as
distance, the derivative 3q/ÔD is negative. The outmigration rate also depends positively on ic.
If the earnings distributions are log-concave, a number of additional implicationscan be
derived. For instance, the outmigration rate depends positively on mean income in the source

10
country.U Return migrants would rather return to rich than to poor countries. Further,the
outrnigration rate is first an increasing fUnction and then a decreasing fUnction of. Intuitively,
the larger the difference between the rates of return to skills in the source country and the United
States, the more that immigrants have to gain by staying in the United States, and the lower the
outmigration rate.
The empirical analysis presented below indicates that our estimated return migration rates
differ across source countries in ways that are generally consistent with these theoretical
implications. Perhaps the most novel implication of the theory, however, is that return migration
accentuates the type of selection that originally characterized the immigrant flow. Obviously, this
result could be directly tested by comparing the earnings of the return migrants with those of the
permanent immigrants, and determining if the differences between the two groups vary
systematically among source countries according to the parameter . Unfortunately, currently
available data do not generally allow this type of systematic analysis. Instead, we will use an
indirect implication of the theory to test its predictive power. In particular, Figures 1 and 2
indicate that holding constant the fraction of the source country's population that migrates to the
United States, larger outniigration rates are associated with higher mean earnings for immigrants
remaining in the United States if there is positive selection, and with lower mean earnings if there
is negative selection.
As noted earlier, return migration can also arise as immigrants attempt to correct mistakes
in the initial migration decision. As shown in the Appendix, allowing for uncertainty in the
ttThe prediction that Oq/Op.0> 0 is not affectedby the possibility that an increase in also increases t(presumably because skills are more easily transferable across advanced economies), as tong as<1.
II
migration decision introduces a number of complexities which require additional restrictions on
the joint density h(v, c). Nevertheless, the analysissuggests that both the human capital and the
uncertainty models lead to the same key insight: Return migration intensifies the selection that
characterized the original immigrant flow. Given this similarity in the implications of the two
models and the scarcity of data on return migration flows, it is unlikely that a simple test can be
devised to distinguish between the competing hypotheses.
m. Data
We begin the empirical analysis by briefly describing the construction of our measures of
outmigration rates for a large number of source countries. A detailed discussion of the data and
the sensitivity of the estimates to alternative assumptions is given in Bratsberg (1991).
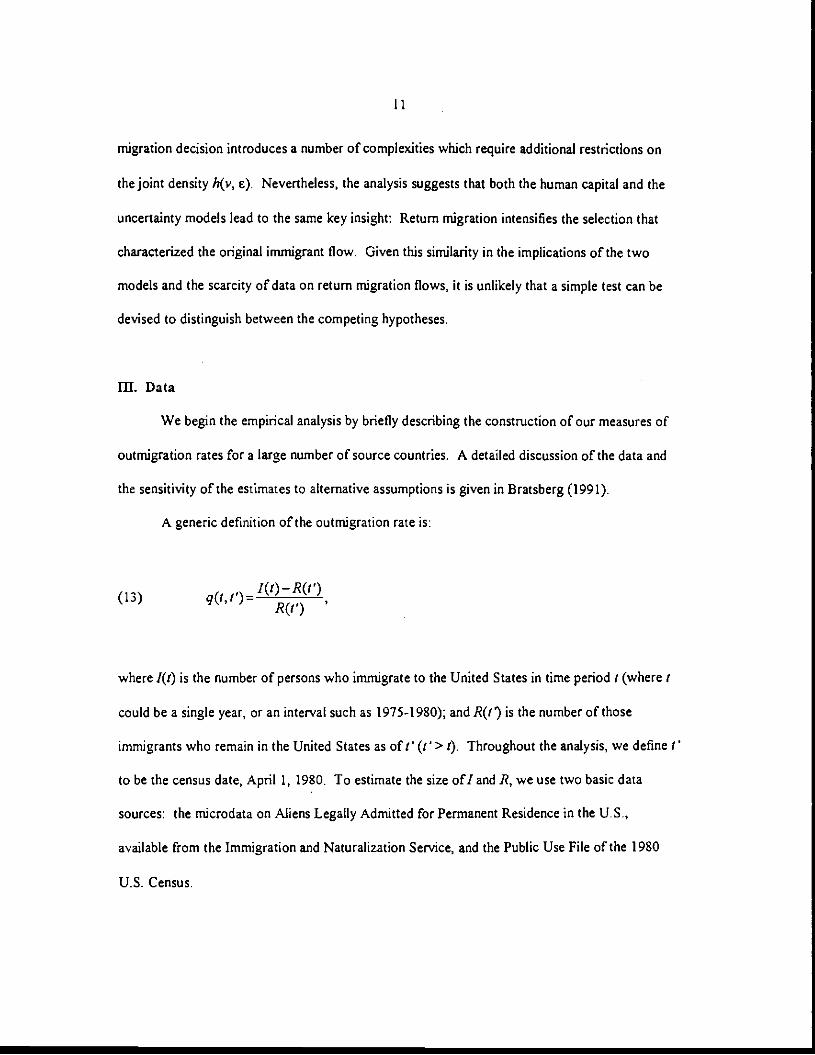
A generic definition of the outmigration rate is:
(13) qQ1t)=JO)RQ)
where 1(1) is the number of persons who immigrate to the United States in time period! (where!
could be a single year, or an interval such as 1975-1980); and R(t') is the number of those
immigrants who remain in the United States as oft' (t'> r). Throughout the analysis, we define 1'
to be the census date, April 1, 1980. To estimate the size ofl and .1?, we use two basic data
sources: the microdata on Aliens Legally Admitted for Permanent Residence in the U.S.,
available from the Immigration and Naturalization Service, and the Public Use File of the 1980
U.S. Census.
12
The INS rnicrodata contain a record for every legal immigrant admitted into the country
between July 1, 1971 and September 30, 1986. Each record contains limited information on the
demographic characteristics of the immigrant, as well as the date of entry into the United States.
It is important to stress that these data QthM contain observations on aliens legally admitted into
permanent residence during that period. Therefore, the INS data do not include any persons who
entered the United States illegally, or who entered by using a student visa, a business visa, or a
visitor's visa, unless these persons eventually adjusted their status to permanent residence. If they
did adjust their status, however, the INS includes them in the file, and reports both the date of
their initial entry into the United States and the date in which the status change took place. Hence
the INS microdata can be used to estimate the number of foreign-born persons who should have
been present in the United States on April 1, 1980.12
To calculate the size of the legal immigrant flow, 1(t), we make one adjustment on the INS
data. Because the INS reports each immigrant's age, sex, and country of birth, we use age and
sex to construct mortality-adjusted immigrant counts for each of 70 source countries, and for each
of the continents.'3
The data on R('/), the number of immigrants who remain in the United States, is drawn
mainly from the 1980 Census. The Census enumerated all foreign-born persons whose usual
place of residence was in the United States as of April 1, 1980. This enumeration, however,
120fcourse, because our This data stops at the end of fiscal year 1986, it is possible that some personswho entered the country prior to 1980 do not appear in the INS data at all because they changed statusin 1987 or beyond. By 1986, however, it is unusual to find adjustments ofstatus for persons whoactually arrived in the counuy prior to 1980.
131n particular, we use age/sex specific mortality rates to calculate the probability that an immigrant isalive as of April 1, 1980.

13
included many foreign-born persons who are absent from the INS counts, such as illegalaliens
and "nonimmigrants" (e.g., foreigii students and visitors to the United States for lengthier
business stays) who did not eventually adjust their status to permanent residence.'
Jn order to make the Census count of immigrants who remained in the United States
compatible with the official INS count of who should have been present in the country, we adjust
the Census data for the presence of these groups. Warren andPassel (1987) report that the 1980
Census enumerated 2. 1 million foreign-born persons who were not legally admitted into the
country. They also estimate the number of illegal aliens who originated in each of a large number
ofsource countries, with about 1.1 million of the illegal aliens originating in Mexico.
We use the Warren-Passel counts to adjust the 1980 Census data. In particular, for each
source country we subtract their estimates of the illegal population from the Census enumeration.
This procedure has the potential problem that the Warren-Passel estimates are based on their own
set of assumptions. Hence, our calculations may simply give us back some of the assumptions
underlying the Warren-Passel analysis.
We do not believe, however, that this presents a serious problem for our study. Various
data sources, including mortality statistics of the foreign-born residing in the United States and
counts from the Mexican census) suggest that the number of illegal aliens in the United States is in
the range suggested by the Warren-Passel estimates.'5 Moreover, an alternative (and
independent) source of data on illegal immigration can be obtained from the size of the population
14The INS data also omits refugees who do not adjust status to permanent residence. This population,however, is very small compared to those of illegal aliens and non-immigrants. Our estimatedoutsuigration rates do adjust the Census data for these uncounted refugees. For details, see Bratsberg
(199!).
15The evidence is reviewed in Passe! (1986) and Borjas, Freeman, and Lang (1990).

14
that applied for amnesty under the provisionsof the 1986 Immigration Reform and Control Act.
About I S million persons who entered illegally prior to 1982, as well as an additional 1.3 million
workers who worked in certain agricultural jobs during the mid-1980s, applied for amnesty. The
Wax-ren-Passel counts, therefore, are not far off the max-k. To check the sensitivity of our
estimates, we used the source-country distribution in the amnesty data, and applied it to the 2.1
million Warren-Passel illegal count so as to obtain a different series of illegal persons enumerated
by the Census. The correlation between the two series was very high (over .97). Hence we use
the simpler, and perhaps more reliable, Warren-Passel estimates throughout the paper.
A second problem with the Census data is that it contains a number of foreign-born
students who are not legal immigrants (i.e., who have not adjusted status into permanent
residence). Over 100,000 students entered the country annually during the 1970s. Internal INS
calculations--obtained from the 1-53 forms that aliens residing in the United States were required
to complete annually prior to 1980--report that 170,000 foreign students were present in the
country in 198016 We use the source country distribution of foreign students admitted in the
United States during the 1970s to allocate these students to particular national origin groups, and
then subtract out the estimated number of foreign students from the Census counts.
Finally, the Census data enumerated some persons who entered the United States for
lengthy business stays. Although the flow of business entrants is substantial, it has received little
attention in the literature. During the 1970s, for instance, approximately 560,000 business visitors
entered the United States per year (most of them for short-term visits). According to the INS.
approximately 186,000 business aliens filled out the 1-53 forms in 1980, and can be presumed to
16Tbese counts were made available to us by Robert Warren.

15
be residing in the United States for lengthier periods.'7 Using the source-country distribution of
business aliens in published JNS statistics, we allocate these persons to the various source
countries, and again subtract the resulting estimates from the Census population counts.
Using these adjustments, the 1980 Census allows us to estimate the number of legal
immigrants who arrived prior to 1980 and who were present in the United States on April 1,
1980. We calculate this number for two cohorts: 1975-1980 and 1970-1974 arrivals.19 To
estimate the emigration rate, we contrast these data with the counts provided bythe INS data of
who should have been present in the United States. Note, however, that for the earlier
cohort, the INS counts only persons who arrived between July 1, 1971 and December31, 1974.
Hence we adjust the INS counts to make them a frill five-year Census interval)9
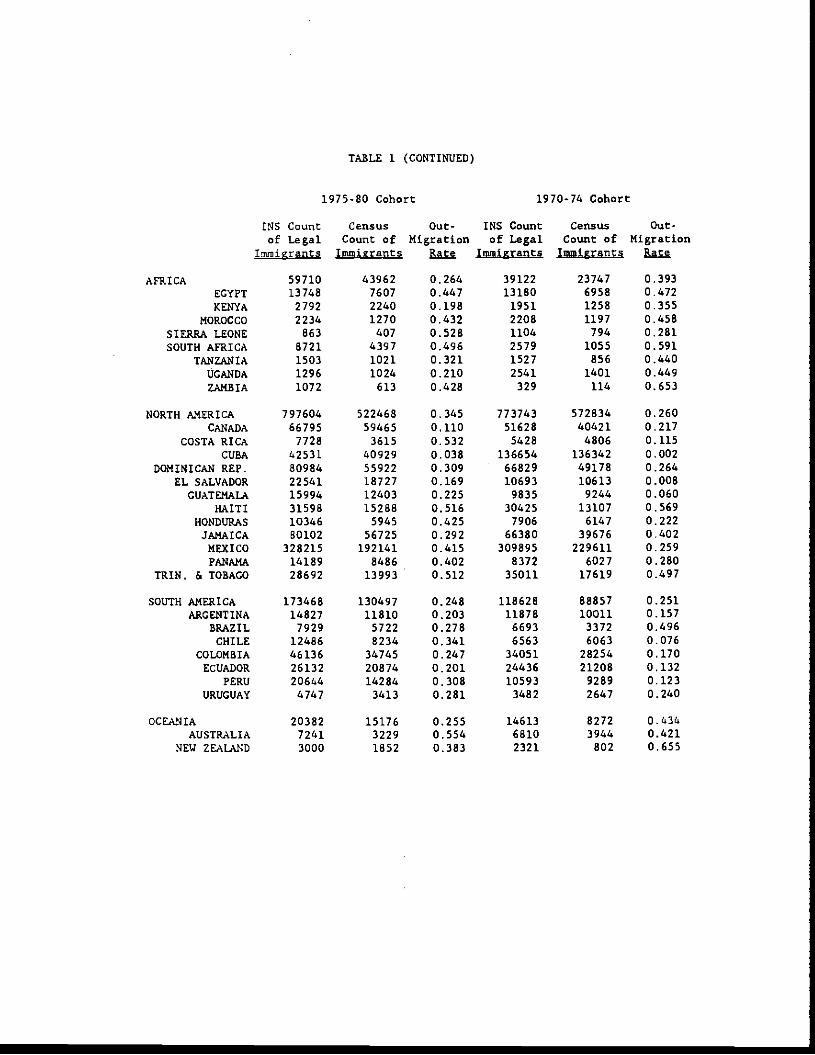
The estimated outmigration rates are reported in Table 1, by continent and country of
origin. The table also reports our estimate of the number of legal immigrants (after adjusting for
mortality), and the Census count of these immigrants (after adjusting for the presence of illegal
aliens and nonimmigrants). Of the 2 million legal immigrants who arrived in the U.S. between
1970 and 1974, approximately 1.6 million were enumerated in the 1980 Census, thus the earlier
cohort has an outmigration rate of 21.5 percent. Of the 2.6 million immigrants who arrived
between January 1, 1975 and April 1, 1980, about 2.1 million were enumerated by the 1980
17These include 'exchange aliens" and "all other aliens.'
allocate illegal aliens, students, and business migrants to the two cohorts based on the proportionsreported in the original data sources.
adjustment is actually a bit more complex. We use the actual number of immigrants admittedbetween 1970 and June 1, 1971 (as reported by the published INS statistics) to "blow up' the statisticsfor the earlier cohort.
16
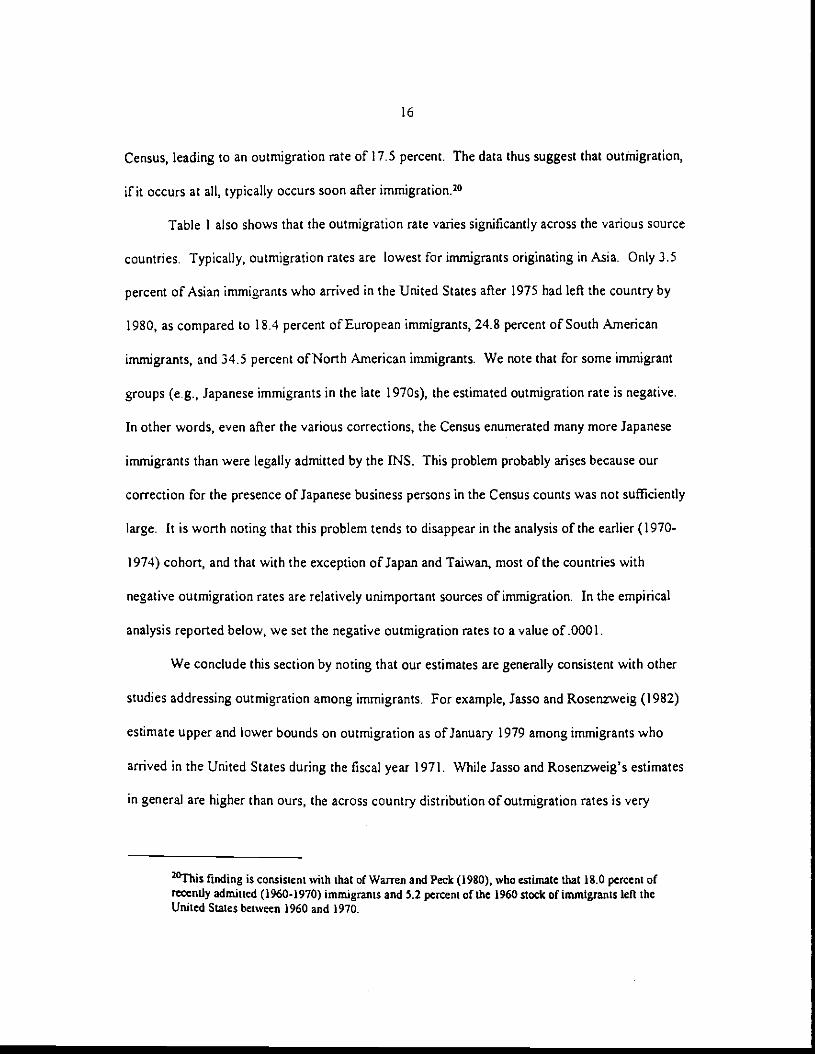
Census, leading to an outmigration rate of 17.5 percent. The data thus suggest that outtnigration,
if it occurs at all, typically occurs soon after immigration.2°
Table I also shows that the outrnigration rate varies significantly across the various source
countries. Typically, outmigration rates are lowest for immigrants originating in Asia. Only 3.5
percent of Asian immigrants who arrived in the United States after 1975 had left the country by
1980, as compared to 18.4 percent of European immigrants, 24.8 percent of South American
immigrants, and 34.5 percent of North American immigrants. We note that for some immigrant
groups (e.g., Japanese immigrants in the late 1970s), the estimated outmigration rate is negative.
In other words, even after the various corrections, the Census enumerated many more Japanese
immigrants than were legally admitted by the INS. This problem probably arises because our
correction for the presence of Japanese business persons in the Census counts was not sufficiently
large. It is worth noting that this problem tends to disappear in the analysis of the earlier (1970-
1974) cohort, and that with the exception of Japan and Taiwan, most of the countries with
negative outmigration rates are relatively unimportant sources of immigration. lathe empirical
analysis reported below, we set the negative outmigration rates to a value of .0001.
We conclude this section by noting that our estimates are generally consistent with other
studies addressing outmigration among immigrants. For example, Jasso and Rosenzweig (1982)
estimate upper and lower bounds on outmigration as of January 1979 among immigrants who
arrived in the United States during the fiscal year 1971. While Jasso and Rosenzweig's estimates
in general are higher than ours, the across country distribution of outmigration rates is very
20This finding is consistent with that of Warren and Peck (1980), who estimate that 18.0 percent ofrecently admitted (1960-1970) immigrants and 5.2 percent of the 1960 stock of immigrants left theUnited States between 1960 and 1970.
17
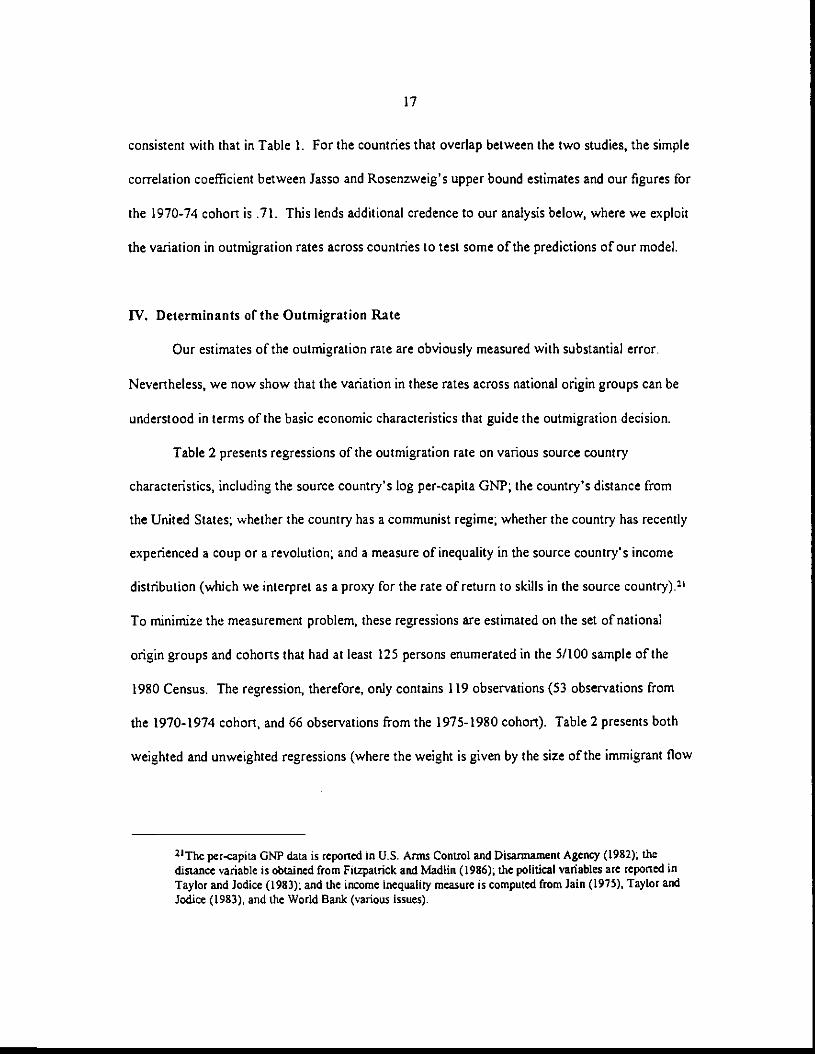
consistent with that inTable 1. For the countries that overlap between the two studies, the simple
correlation coefficient between Jasso and Rosenzweig's upper bound estimates and our figures for
the 1970-74 cohort is .71. This lends additional credence to our analysis below, where we exploit
the variation in outmigration rates across countries to test some of the predictions of our model.
IV. Determinants of the Outmigration Rate
Our estimates of the outmigration rate are obviously measured with substantial error.
Nevertheless, we now show that the variation in these rates across national origin groups can be
understood in terms of the basic economic characteristics that guide the outmigration decision.
Table 2 presents regressions of the outmigration rate on various source country
characteristics, including the source country's log per-capita GNP; the country's distance from
the United States; whether the country has a communist regime; whether the country has recently
experienced a coup or a revolution; and a measure of inequality in the source country's income
distribution (which we interpret as a proxy for the rate of return to skills in the source country).2'
To minimize the measurement problem, these regressions are estimated on the set of national
origin groups and cohorts that had at least 125 persons enumerated in the 5/100sample of the
1980 Census. The regression, therefore, only contains 119 observations (53 observations from
the 1970-1974 cohort, and 66 observations from the 1975-1980 cohort). Table 2 presents both
weighted and unweighted regressions (where the weight is given by the size of the immigrant flow
21Thc per-capita GNP data is reported in U.S. Arms Control and Disarmament Agency (1982); thedistance variable is obtained from Fitzpatrick and Madlin (1986); the political variables are reported inTaylor and Jodice (1983); and the income inequality measure is computed from Jam (1975), Taylor andJodice (1983), and the World Bank (various issues).

Is
in the out-migration equation), as welt as regressions using both the linear probability modet and a
grouped probit specification.22
Regardless of which specification one considers, a key variable determining the
outmigration rate is the per-capita GNP in the source country. Immigrants tend to return to rich
countries, not to poor countries. This is precisely the implication of the theoretical model
presented earlier. This effect is also numerically important: in the unweighted linear probability
model regression, for example, a doubling of per-capita GNP increases the outmigration rate by
4.9 percentage points (using the specification in colunm 2). We use distance from the source
country to the nearest major port in the United States as a proxy for migration costs. The
regressions in Table 2 indicate that distance has a strong negative impact on the outmigration rate.
Not surprisingly, an immigrant is more likely to return to a nearby country than to a distant one.
Every 1000-mite increase in distance between the United States and the source country reduces
the outmigration rate by 1.2 percentage pointsP
The regression also includes a measure of income inequality in the source country (defined
by the ratio of income accruing to the top 10 percent of the households to the income accruing to
the bottom 20 percent of the households). It is interesting to note that these data are highly
correlated with the rates of return to schooling estimated by Psacharapoulos (1973)24 The
22Although we prefer the weighted specifications (because the weights partially correct for theheteroscedasticity introduced by the fact that outinigration rates are likely to be measured withsubstantial error particularly for countries with small immigrant flows), we report the unweighted
regressions for comparison purposes.
This and other results reported in Table 2 are robust to the exclusion of Mexico and Canada from thesample. For example, in the specification reportcd in column 2. the coefficient on distance is -.0 130 andthe t-statistic is -2.35 when Mexico and Canada are removed from the sample. In other words, ourresults are not driven by "border effects".
24Among the countries common in our analysis and in the Psacharapoulos study, the correlationbetween the two measures is over .7.

19
theoretical model predicted that the relationship between the outmigration rate and the rate of
return to skills should have an inverse-U shape with the peak occurring at the U.S.rate of return.
The regressions reveal that the outmigration rate first increases and then decreases with the
inequality measure (though this pattern is statistically insignificant in the unweighted regressions).
The estimated coefficients suggest that the peak of this relationship occurs at a value of about 30,
even though the sample mean is only 9.0, and the U.S.value of the inequality measure is 5.9.
The additional variables in the regression characterize the source country's political
structure, which are presumably an important component in the calculation of return migration
costs. The presence of a communist regime in the source country has a strong negative impact on
the outmigration rate. Holding other factors constant, the return migration rate of communist
countries is about 18 percentage points lower than that of other countries.
Table 2 also presents analogous regressions using the in-migration rate—defined as the
fraction of the source country's population that migrated to the United States—as a dependent
variable. Although the two regressions are somewhat similar, they differ in one very striking way.
In particular, the source country's per-capita ON? has a negative (though sometimes insignificant)
impact on the in-migration rate, but a positive impact on the outmigration rate. This is precisely
what one would expect if migration decisions are strongly affected by economic conditions in the
source country (relative to those in the United States). The in-migration rate, like the
outmigration rate, depends negatively on migration costs, as measured by distance. The impact of
the political variables on the in-migration rate is harder to interpret, because local political

20
conditions may prevent certain types of persons from leaving the country, and hence are not
simply a reflection of the benefits and costs of immigration23
V. Self-Selection and Outmigration
The model presented in Section II predicts that return migration tends to accentuate the
selection that originally characterized the immigrant flow. In other words, if the immigrant flow is
positively selected, the outmigrants will be less skilled (on average) than the immigrants who
remain in the United States. Alternatively, if the immigrant flow is negatively selected, the
outmigrants will be more skilled than the immigrants who remain in the United States. Given the
nature of Census-type data, it is not generally possible to conduct a direct test of this theoretical
prediction because we have no direct measures on the skill composition of the return migration
flow. Nevertheless, the Census data do allow an indirect test of the key theoretical insight.
The Public Use Sample of the 1980 Census reports earnings for persons residing in the
United States as of the Census date. To determine the relative performance of immigrants in the
U.S. labor market, we pool the samples of immigrants who arrived in the United States after 1970
and natives, and estimate the regression:
(14) logw = X13÷X51C ÷e,,
"The regression also indicates that the in-migration rate is first an increasing and then a decreasingfunction of the income inequality variable. These results contradict the predictions of the model.
21
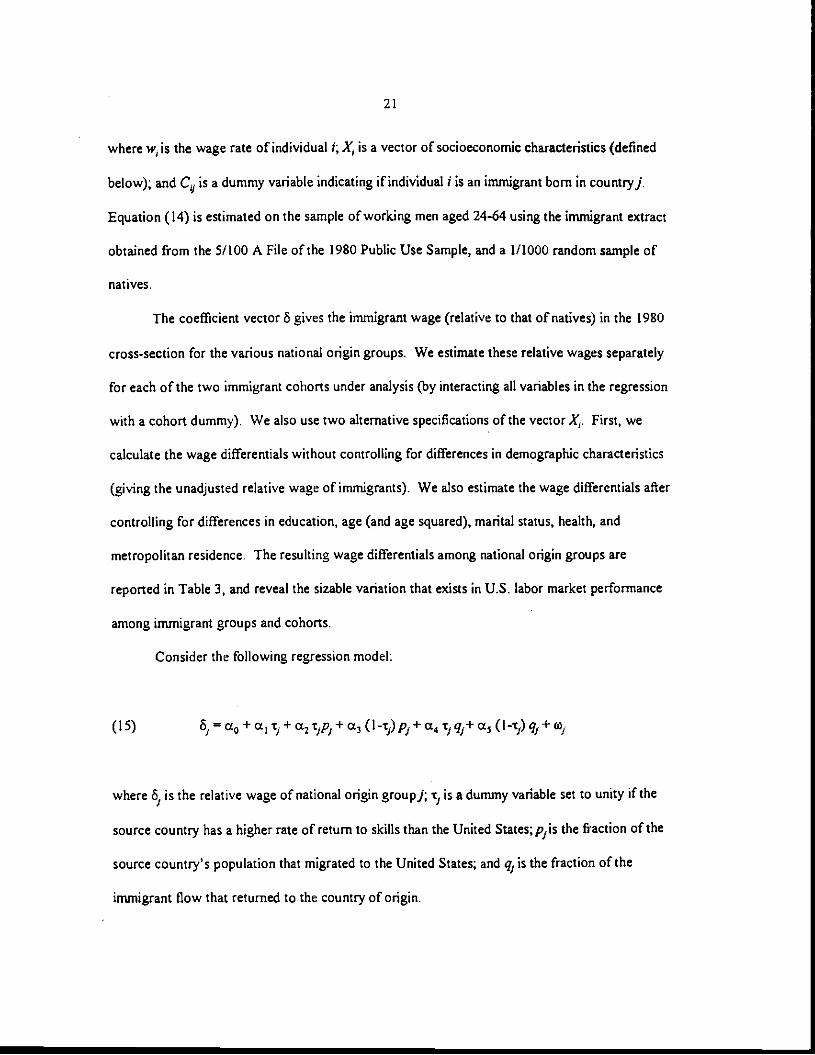
where w. is the wage rate of individual I; X1 is a vector of socioeconomic characteristics (defined
below); and C is a dummy variable indicating if individual i is an immigrant born in countryj.
Equation (14) is estimated on the sample of working men aged 24-64 using the immigrant extract
obtained from the 5/100 A File of the 1980 Public Use Sample, and a 1/1000 random sample of
natives.
The coefficient vector 3 gives the immigrant wage (relative to that of natives) in the 1980
cross-section for the various national origin groups. We estimate these relative wages separately
for each of the two immigrant cohorts under analysis (by interacting all variables in the regression
with a cohort dummy). We also use two alternative specifications of the vectorA. First, we
calculate the wage differentials without controlling for differences in demographic characteristics
(giving the unadjusted relative wage of immigrants). We also estimate the wage differentials after
controlling for differences in education, age (and age squared), marital status, health, and
metropolitan residence. The resulting wage differentials among national origin groups are
reported in Table 3, and reveal the sizable variation that exists in U.S. labor market performance
among immigrant groups and cohorts.
Consider the following regression model:
(IS) 3, a0 + a1t1+ a2tp1+ a3 (1-ti) pf+a4x/qf+ a5O-t,)q+w1
where is the relative wage of national origin groupj; t1 is a dummy variable set to unity if the
source country has a higher rate of return to skills than the United States;p1is the fraction of the
source country's population that migrated to the United States; and is the fraction of the
immigrant flow that returned to the country of origin.
22
The specification in (15) captures the basic implications of our model of outmigration
behavior. An increase inp, the fraction of the source country's population that migrated to the
United States, should have a negative impact on immigrant earnings if the flow originates in a
country with a lower rate of return to skills than the United States (i.e., a.3 <0). This occurs
because the largerp, the more diluted the quality of the typical immigrant in a flow that is
positively selected. By analogy, the coefficient a2 should be positive because the higherp, the
greater the skills of the typical immigrant in a flow that is negatively selected.
The model also indicates that for given p, a higher outmigration probability increases the
intensity of the selection characterizing the group of immigrants who remain in the United States.
Holding p constant, therefore, an increase in q increases the earnings of"stayers" if the immigrant
flow originated in a country with a low rate of return to skills, and decreases the earnings of
stayers if the flow originated in a country with a high rate of return to skills. This implies that a4
<0 and a3 >0.
To proxy for the rates of return to skills in the source country, we use our constructed
measure of income inequality in the source country. We define a dummy variable r indicating if
the source country has a higher rate of return to skills than the United States by comparing each
country's value to the US. value (which is 5.91)26
As before, we restrict the regression analysis to immigrant flows that are well represented
in the 1980 Census. Therefore, the regressions use only those national origin groups (and
26We also estimated a model where the difference in income inequality between the source country andthe United States is interacted with the in- and out-migration probabilities (rather than the dummyindicating if this difference is positive or negative). Although the results tend to be similar, we reportthe simpler specification because of the large amount of measurement error implicit in the incomeinequality measures.
23
'horts) that have 125 or more observations in the 5/100 Census file. We estimate equation (15)
by pooling the two cohorts, giving us 119 observations that satis& the sample size restriction.
Table 4 reports generalized least squares estimates for a number of alternative
specifications of the regression model.27 In particular, the regression is estimated using both the
unadjusted and adjusted relative wages of national origin groups. Because of potential
endogeneity of the variables p and q, the table also reports estimates based on two stage least
squares.28 In addition, the regression specification is expanded to include the log per-capita GNP
in the source country (relative to that in the U.S.), so as to control for the possibility that the skills
obtained in industrialized economies are better valued by U.S.employers. This variable has been
found to have a strong positive impact on immigrant earnings (Boijas, 1987), and it remains
positive in the specifications reported in Table 4.
The empirical evidence indicates that an increase in the in-migration rate, p, from countries
with low rates of return to skills lowers the average earnings of immigrants in the United States.
The regressions, however, do not always indicate that an increase in migration from countries
with high rates of return to skills increases the average earnings of immigrants. However, when
this coefficient is negative, it is insignificant, and is much lower (in absolute value) than the
respective coefficient for countries with low rates of return.
27Because the dependent variable is an estimated coefficient from a first-stage regression, thedisturbance in the regression is heteroscedastic, with the variance of the error term depending on thestandard error of the regression coefficient. To correct for this problem, we used a generalized leastsquares estimator. For details, see Borjas (1987).
28The instruments are predicted values from reduced form regressions on per-capita GNP, r, distancefrom the United States, whether the source country has a centrally planned economy, whether the sourcecountry experienced irregular executive transfers (i.e., a non-constitutional transfer of power in theexecutive branch), a dummy variable for the cohort, and dummies for the continent of origin.

24
Table 4 shows that the impact of the outmigration rate on the earnings of immigrants who
remain in the United States is precisely as suggested by theory. An increase in the outmigration
rate increases average earnings if the immigrant flow is positively selected (i.e., originates in
countries with low rates of return to skills) and decreases average earnings if the flow is
negatively selected (i.e., originated in countries with high rates of return to skills). Outmigration
behavior, therefore, accentuates the selection that characterized the immigrant flow.
As final evidence of the predictive power of our approach, we summarize evidence
reported in Ramos' (1992) study of Puerto Rican return migration. By exploiting the information
in both the 1980 U.S. Census and the Puerto Rican Census, Ramos can compare the education
levels of three groups of persons: Puerto Ricans (i.e., persons born in Puerto Rico) who never
migrated to the United States; Puerto Ricans who migrated to the U.S., but eventually returned to
Puerto Rico; and Puerto Ricans who migrated to the U.S. permanently. The Census data indicate
that Puerto Ricans who remained in Pueno Rico have an average education level of 10.8 years;
Puerto Ricans who moved permanently to the U.S. have 9.5 years of schooling; and Puerto
Ricans who moved to the U.S. but returned to Puerto Rico have 10.1 years of schooling. This is
precisely the pattern in conditional means predicted by our model as long as Puerto Rico has a
higher rate of return to skills than the United Sta;es. In fact, the rate of return to education in
Puerto Rico is about 1.5 times the rate of return to education in the United States. It is not
surprising, therefore, to observe the least skilled Puerto Ricans migrating to the United States,
and to observe the most skilled among these workers eventually returning to their birthplace.
VI. Summary

25
This paper presented a theoretical and empirical analysis of return migration behavior.
Our theoretical model ofreturn migration generates surprisingly strong predictions regarding the
size and skill composition of the population flows. Perhaps the most striking implication is that
return migration intensifies the type of selection that generated the immigrant flow in the first
place. In other words, if the immigrant flow is positively selected, so that immigrants have above-
average skills, the return migrants will be the least skilled immigrants. In contrast, if the
immigrant flow is negatively selected, the return migrants will be the most skilled immigrants.
A second contribution of our analysis is the construction ofa series ofoutmigration rates
for 70 source countries. We constructed these statistics by combining two data sources: the
1980 U.S. Census, and a recently available microdata set constructed by the Immigration and
Naturalization Service which reports a number of demographic characteristics for every legal
immigrant admitted into the United States since 1972. Our estimated outmigration rates exhibit
substantial variation across national origin groups, and indicate that immigrants tend to return to
countries that are not distant and that are not poor.
Finally, our empirical analysis confirms the theoretical prediction that the skill composition
of the return migrant flow depends on the type of selection that generated the immigrant flow in
the first place. Because of the selective nature of return migration, the skill composition of the
immigrant pool left behind in the United States is substantially different from than of the original
immigrant flow. This finding has significant implications for studies of the economic impact of
immigration and for immigration policy. In view of the growing importance of immigration as a
component of demographic change in the United States, it is clear that the economic and social
impacts of nonrandom return migration flows will need to be explored intensively in ffiture
research.

26
APPENDIX
In the general formulation of our model, return migration may arise both because a
temporary stay in the United States enhances earnings in the source country, and because a
component of U.S. earnings cannot be observed from abroad. To understand the implications of
the decision rules in equations (7)-(9), it is instructive to consider Figures A-I and A-2. Figure
A-I illustrates the various migration choices when q C 1, and Figure A-2 illustrates the outcomes
when> I.
As implied by equation (8), the initial immigration decision is entirely determined by a
truncation of the random variable v. In particular, if1 C 1, the migrant flow is positively selected,
while if1> I, the migrant flow is negatively selected. The introduction of uncertainty in U.S.
economic opportunities does not alter the type of selection that characterizes the immigrant flow
because individuals migrate in order to maximize the expected value of income.
After arrival in the United States, the immigrant makes a random draw from the gfr)
density, and reconsiders the profitability of his original decision. Obviously, the decision of
whether to return to the source country depends on whether the draw is favorable or unfavorable.
As Figures A-I and A-2 indicate, only those persons who have relatively unfavorable draws
become return migrants (regardless of whether there is positive or negative selection). Some
workers who expected to migrate temporarily to the United States now will settle permanently
because they receive particularly favorably draws. Others who expected the move to be
permanent will return to the source country because of unfavorable draws.

27
As long as p(v, c) = 0, it is easy to show that the skill composition of the return migration
flow in this model is identical to the sorting implied by the human capital model presented above.
In particular:
(A-I) E(v I Migrate and Stay)> E(v I Migrate and Return), for ii <
(A-2) E(v I Migrate and Stay) <E(v I Migrate and Return), for 1> 1.
If C 1, return migrants are relatively unskilled workers (selected from a skilled immigrant flow),
while if > I, return migrants are relativelyskilled workers (selected from an unskilled immigrant
flow) As before, return migration accentuates the selection that characterizes the original
immigration. These results are trivially implied by Figures A-I and A-2 because the random
variable v for return migrants is truncated from abovewhen < I, and from below when i> 1.
Although these insights exactly parallel those obtained earlier, they do not completely
describe the economic experiences of immigrants and return migrants in the United States. In
particular, U.S. earnings now depend not only on skills, but also on the particular draw from the
densityg(e). Because only those immigrants who have relatively low values of s return to their
home countries, the comparison of actual earnings (determined by the sum v + c) between those
who stay and those who go back may lead to different results.
If1 < 1, it is easy to show that:
(A-3) E(v + I Migrate and Stay) > E(v + a Migrate and Return).

28
As before, the actual earnings of return migrants are lower than the actual earnings of inunigrants
who remain in the United States. This follows from equation (A-i) because the return migrants
are less skilled than the "stayers," and the conditional expectation of v is higher for stayers than
for the return migrants.
This implication, however, cannot be derived when r> I unless more structure is imposed
on the joint density h(v, c). The problem is that the immigrants who stay in the United States
have the lowest v's and the highest c's. One possible restriction on h(v, a) is that the random
variable v has a sufficiently larger variance than the random variable c. It can then be shown that
the earnings of those who stay in the United States are lower than the earnings of those who
return home.

29
REFERENCES
Boijas, George J.," Assimilation, Changes in Cohort Quality, and the Earnings ofImmigrants,"Journal ofLabor Economics 3 (October 1985), 463-489.
_______ "Self-Selection and the Earnings of Immigrants," American Economic Re view 77(September 1987), 53 1-553.
"Immigrant and Emigrant Earnings: A Longitudinal Study," Economic inquiry 27(January 1989), 21-37.
Borjas, George J., Richard B. Freeman, and Kevin Lang, "Undocumented Mexican-Born Workersin the U-S.: How Many, How Permanent?" in John M. Abowd and Richard B. Freeman(eds.), Immigration, Trade, and the Labor Market (Chicago: University of Chicago Press,1991).
Bratsberg, Bernt, Return Migration and Self-Selection: The Exodus of Foreign-Born from theUnited States, Unpublished Ph.D. Dissertation, University of California, Santa Barbara,1991.
DaVanzo, Julie, "Repeat Migration in the United States: Who Moves Back and Who MovesOn?" Review of Economics and Statistics 65 (November 1983), 552-559.
Fields, Gary S., "Place to Place Migration: Some New Evidence," Review of Economics andStatistics 61 (February 1979), 21-32.
Fitzpatrick, Gary L. and Marilyn J. Madlin, Direct Line Distances, U.S. Edition (London: TheScarecrow Press, Inc., 1986).
Heckman, James J. and Bo E. Honoré, "The Empirical Content of the Roy Model,"Econometrica 58 (September 1990), 1121-1150.
Jam, Shail, Si:e Distribution of Income (Washington, D.C.: World Bank, 1975).
Jasso, Guillermina and Mark R. Rosenzweig, "Estimating the Emigration Rates of LegalImmigrants Using Administrative and SurveyData: The 1971 Cohort of Immigrants tothe United States," Demography 19 (August 1982), 279-290.
______ "How well do U.S. immigrants do? Vintage Effects, Emigration Selectivity, andOccupational Mobility," Research in Human Capital and Development 6 (1988), 229-253.
Lam, Kit-Chun, An analysis of the Outmigration of Foreign-Born Members in a Population,Unpublished Ph.D. Dissertation, Harvard University, 1987.
30
Passel, Jeffrey, "Undocumented Immigration," The Annals ofthe AmericanAcademy ofPoliticalandSocial Science 487 (September 1986), 181-200.
Pessino, Carob, "SequentialMigration Theory and Evidence from Pew," Jour;zal ofDevelopment Economics 36 (July 1991), 55-87.
Psacharopoutos, George, Returns to Education: An International Comparison (San Francisco:Jossey-B ass, 1973).
Ramos, Fernando. "Out-Migration and Return Migration of Puerto Ricans," in George J. Borjasand Richard B. Freeman (eds.), Immigration and the Work Force: EconomicConsequences for the United States and Source Areas (Chicago: University of ChicagoPress, 1992).
Rosen, Sherwin, "Learning and Experience in the Labor Market," Journal of Human Resources 7(Summer 1972), 326-342,
Roy, Andrew D., "Some Thoughts on the Distribution of Earnings," OxfordEconomic Papers 3(June 1951), 135-146.
Taylor, Charles Lewis and David A. Jodice, World Handbookof Political and Social Indicators,
Third Edition (New Haven, Conn.: Yale University Press, 1983).
Tunati, Insan, "A General Structure for Models of Double-Selection and an Application to a JointMigration/Earnings Process with Remigration," Research in Labor Economics 8 (1986,Part 8), 235-282.
U.S. Arms Control and Disarmament Agency, WorldMilitaiyExpendituresandArms Transfers(Washington, D.C.: Government Printing Office, 1982).
U.S. Immigration and Naturalization Service, Statistical Yearbook (Washington, D.C.:Government Printing Office, various issues).
Warren, Robert and Ellen Percy Kraty, "The Elusive Exodus: Emigration from the UnitedStates," Population Trends and Pith/ic Policy (March 1985, no.7).
Warren, Robert and Jeffrey Passel, "A Count of the Uncountable: Estimates of UndocumentedAliens Counted in the 1980 Census," Demography 24 (August 1987), 375-393.
Warren, Robert and Jennifer Marks Peck, "Foreign-Born Emigration from the United States:1960-1970," Demography 17 (Februaiy 1980). 71-84.
World Bank, WorldDevelopment Report (New York: Oxford University Press, various issues).
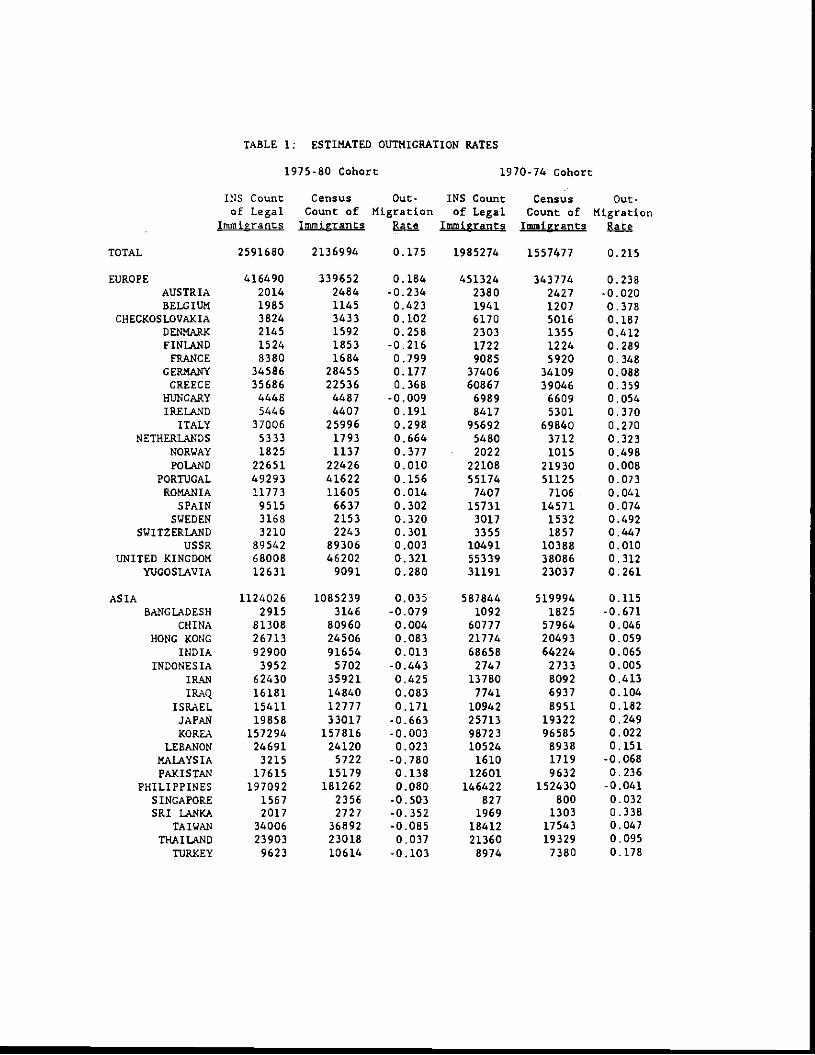
TABLE 1: ESTIMATED OUTMIGRATION RATES
1975-80 Cohort 1970-74 Cohort
INS Count Census Out- INS Count Census Out-
of Legal Count of Migration of Legal Count of MigrationImmigrants Immigrants Ea Inimierartts Immi2rants 8as
TOTAL 2591680 2136994 0.175 1985274 1557477 0.215
EUROPE 416490 339652 0.184 451324 343174 0.238AUSTRIA 2014 2484 -0.234 2380 2427 -0.020BELGIUM 1985 1145 0.423 1941 1207 0.378
CHECKOSLOVAXIA 3824 3433 0.102 6170 5016 0.187DENMARK 2145 1592 0.258 2303 1355 0.412FINLAND 1524 1853 -0.216 1722 1224 0.289FRANCE 8380 1684 0.799 9085 5920 0.348
GERMANY 34586 28455 0.177 37406 34109 0.088GREECE 35686 22536 0.368 60867 39046 0.359HUNGARY 4448 4487 -0.009 6989 6609 0.054IRELAND 5446 4407 0.191 8417 5301 0.370ITALY 37006 25996 0.298 95692 69840 0.270
NETHERLANDS 5333 1793 0.664 5480 3712 0.323NORWAY 1825 1137 0.377 2022 1015 0.498POLAND 22651 22426 0.010 22108 21930 0.008
PORTUGAL 49293 41622 0.156 55174 51125 0.073ROMANIA 11773 11605 0.014 7407 7106 0.041SPAIN 9515 6637 0.302 15731 16571 0.074SWEDEN 3168 2153 0.320 3017 1532 0.492
SWITZERLAND 3210 2243 0.301 3355 1857 0.647USSR 89542 89306 0.003 10491 10388 0.010
UNITED KINGDOM 68008 46202 0.321 55339 38086 0.312YUGOSLAVIA 12631 9091 0.280 31191 23037 0.261
ASIA 1124026 1085239 0.035 587844 519994 0.115BANGLADESH 2915 3146 -0.079 1092 1825 -0.671
CEIINA 81308 80960 0.004 60777 57964 0.046HONG KONG 26713 24506 0.083 21774 20493 0.059
INDIA 92900 91654 0.013 68658 64224 0.065
INDONESIA 3952 5702 -0.443 2747 2733 0.005IRAN 62430 35921 0.425 13780 8092 0.413
IRAQ 16181 14840 0.083 7741 6937 0.1.04
ISRAEL 15411 12777 0.171 10942 8951 0.1.82
JAPAN 19858 33017 -0.663 25713 19322 0.249KOREA 157294 157816 -0.003 98723 96585 0.022
LEBANON 24691 24120 0.023 10524 8938 0.151
MALAYSIA 3215 5722 -0.780 1610 1719 -0.068
PAKISTAN 17615 15179 0.138 12601 9632 0.236
PHILIPPINES 197092 181262 0.080 146422 152430 -0.041
SINGAPORE 1567 2356 -0.503 827 800 0.032
SRI LANKA 2011 2727 -0.352 1969 1303 0.338
TAIWAN 34006 36892 -0.085 18412 17543 0.047
THAILAND 23903 23018 0.037 21360 19329 0.095
TURKEY 9623 10614 -0.103 8974 7380 0.178
TA3LE I (CONTINUED)
1975-80 Cohort 1970-74 Cohort
INS Count Census Out- INS Count Census Out-
of Legal Count of Migration of Legal Count of MigrationIrnn,izrant$ Innigrants Ba Immigrants Immigrants
AFRICA 59710 43962 0.264 39122 23747 0.393
EGYPT 13748 7607 0.447 13180 6958 0.472
KENYA 2792 2240 0.198 1951 1258 0.355
MOROCCO 2234 1270 0.432 2208 1197 0.458
SIERRA LEONE 863 407 0.528 1104 794 0.281
SOUTH AFRICA 8721 4397 0.496 2579 1055 0.591
TANZANIA 1503 1021 0.321 1527 856 0.440
UGANDA 1296 1024 0.210 2541 1401 0.449
ZANEIA 1072 613 0.428 329 114 0.653
NORTH AMERICA 797604 522468 0.345 773743 572834 0.260
CANADA 66795 59465 0.110 51628 40421 0217COSTA RICA 7728 3615 0.532 5428 4806 0.115
CUBA 42531 40929 0.038 136654 136342 0.002
DOMINICAN REP. 80984 55922 0.309 66829 49178 0.264
EL SALVADOR 22541 18727 0.169 10693 10613 0.008GUATEMALA 15994 12403 0.225 9835 9244 0.060
HAITI 31598 15288 0.516 30425 13107 0.569HONDURAS 10346 5945 0.425 7906 6147 0.222
JAMAICA 80102 56725 0.292 66380 39676 0.402MEXICO 328215 192141 0.415 309895 229611 0.259PMcANA 14189 8486 0.402 8372 6027 0.280
TRIM. & TOBAGO 28692 13993 0.512 35011 17619 0.497
SOUTH AMERICA 173468 130497 0.248 118628 88857 0.251
ARGENTINA 14827 11810 0.203 11878 10011 0.157ZRAZIL 7929 5722 0.278 6693 3372 0.696
CHILE 12486 8234 0.341 6563 6063 0.076COLOMBIA 46136 34745 0.247 34051 28254 0.170ECUADOR 26132 20874 0.201 24436 21208 0.132
PERU 20644 14284 0.308 10593 9289 0.123
URUGUAY 4747 3413 0.281 3482 2647 0.240
OCEANIA 20382 15176 0.255 14613 8272 0.434AUSTRALIA 7241 3229 0.554 6810 3944 0.421
NEW ZEALAND 3000 1852 0.383 2321 802 0.655
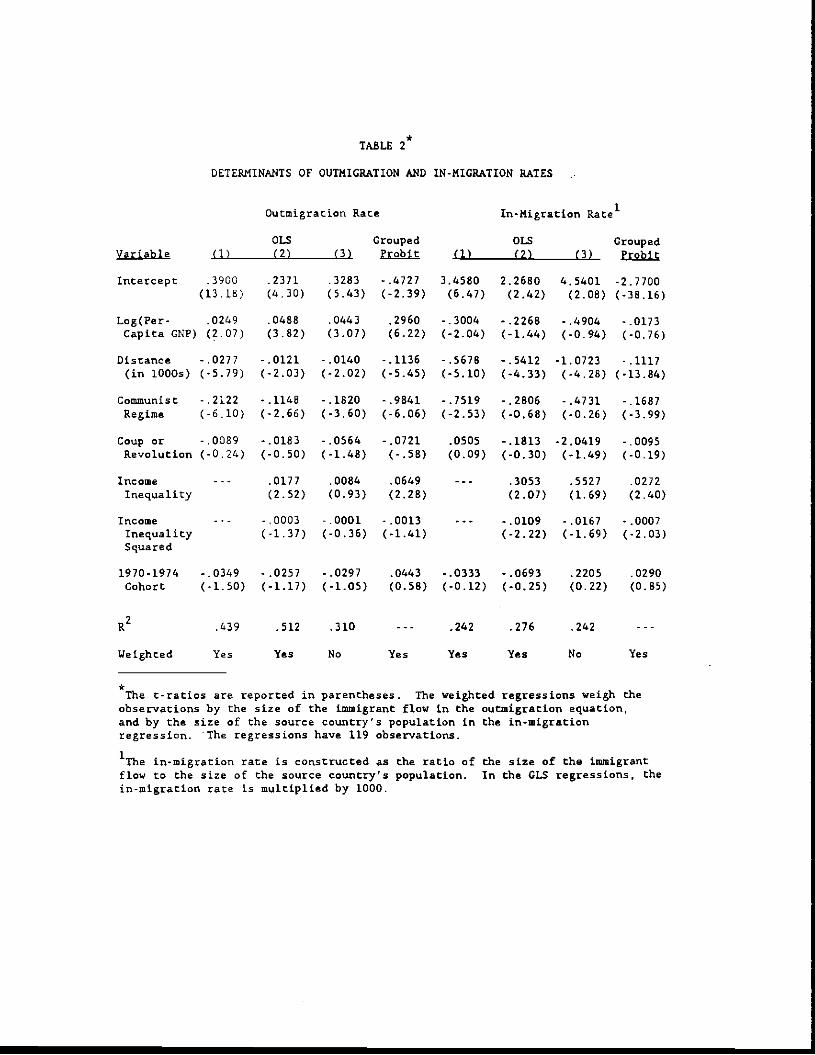
*TABLE 2
DETERMINANTS OF OUTMIGRATION AND IN-MIGRATION RATES
Outmigration Rate In-Migration Rate1
OLS Grouped OLS GroupedVariable (1) (2) (3) Probit (1) (2) (3) Probit
Intercept .3900 .2371 .3283 - .6721 3.6580 2.2680 4.5401 -2.7700(13.L8) (4.30) (5.43) (-2.39) (6.41) (2.42) (2.08) (-38.16)
Log(Per- .0249 .0488 .0443 .2960 - .3004 - .2266 - .4904 - .0173Capita ON?) (2.07) (3.82) (3.07) (6.22) (-2.04) (-1.44) (-0.94) (-0.76)
Distance - .0277 - .0121 -.0140 - .1136 -.5678 - .5412 -1.0723 .1117
(in bOOs) (-5.79) (-2.03) (-2.02) (-5.45) (-5.10) (-433) (-4.28) (-13.84)
Communist -.2122 -.1148 -.1620 -.9841 -.7519 -.2806 -.6731 -.1687
Regime (-6.10) (-2.66) (-3.60) (-6.06) (-2.53) (-0.68) (-0.26) (-3.99)
Coup or - .0089 -.0183 - .0564 - .0721 .0505 -.1813 -2.0419 -.0095
Revolution (-0.26) (-0.50) (-1.48) (- .58) (0.09) (-0.30) (-1.69) (-0.19)
Income - - - .0177 .0084 .0649 --- .3053 .5527 .0272
Inequality (2.52) (0.93) (2.28) (2.07) (1.69) (2.40)
Income --- -0003 -.0001 -.0013 --- -.0109 -.0167 -.0007
Inequality (-1.37) (-0.36) (-1.41) (-2.22) (-1.69) (-2.03)Squared
1970-1974 - .0349 - .0257 - .0297 .0443 - .0333 - .0693 .2205 .0290
Cohort (-1.50) (-1.17) (-1.05) (0.58) (-0.12) (-0.25) (0.22) (0.85)
.439 .512 .310 --- .242 .276 .242
Weighted Yes Yes No Yes Yes Yes No Yes
*The c-ratios are reported in parentheses. The weighted regressions weigh theobservations by the size of the immigrant flow in the outmigration equation,and by the size of the source country's population in the in-migrationregression. The regressions have 119 observations.
1The in-migration rate is constructed as the ratio of the size of the immigrantflow to the size of the source country's population. In the CLS regressions, thein-migration rate is multiplied by 1000.

TAZLE 3
Log Wage of Immigrants in 1980, By Cohort and National Origin Group(Relative to Natives)
1975-80 Cohort 1970-74 Cohort
Unadjusted Adjusted Unadjusted AdjustedWage Wage Ware Wage
EUROPE:AUSTRIA -0.027 -0.058 0.193 0.115BELGIUM 0.414* 0.274* 0.154 0.001
CHECKOSLOVAXIA 0.051 -0.067 -0.009 -0.102DENMARK 0.414* 0.387* 0.048 0.032FINLAND 0.183 0.135 0.141 0.175FRANCE 0.219* 0.152* 0.143* 0.086
GERMANY 0.275* 0.182* 0.226* 0.152*GREECE .0.330* .0.220* .0.322* .0.237*
HUNGARY .0.167* .0.167* -0.086 .0.129*IRELAND .0.188* .0.186* -0.049 -0.038
ITALY .Qjj9* -0.057 .0.121* -0.000NETHERLANDS 0.329* 0.218* -0.097 .0.169*
NORWAY 0.239* 0.203* 0;425* 0.278POLAND .0.346* .0.343* -0.039 -0.045
PORTUGAL .0.296* -0.046 .0.210* -0.011ROMANIA .0249* .0.299* 0.136* -0.024
SPAIN .0.194* .0.199* -0.058 -0.029SWEDEN 0.189* 0.097 0.218 0.163
SWITZERLAND 0.245* 0203* 0.211 0.161USSR .0.245* .0.360* 0.003 -0.035
UNITED KINGDOM 0.204* 0.111* 0.218* 0.111*YUGOSLAVIA .0.125* -0.039 -0.031 0.011
ASIA:BANGLADESH .0206* .0.275* 0.065 -0.094
CHINA .0.491* .0.469* .Q3Q9* .0364*HONG KONG .0.371* .0.325* .0215* .0.192*
INDIA .0176* .0.288* 0.204* .0.040*INDONESIA .0163* .0.265* -0.062 -0.150
IRAN .0.192* .0.216* -0.018 OO94*IRAQ .0296* .0.242* -0.060 -0.085
ISRAEL .0.197* .0.224* .0.099* .0.109*JAPAN 0.175* 0.068* 0.072 0.004KOREA .0.291* .0369* 0.010 .0.171*
LEBANON .0.191* .0.130* .0.122* .0144*MALAYSIA .0.350* .0.347* -0.045 -0.106PAKISTAN -0.283* .0314* 0.028 .0.094*
PHILIPPINES .Q339* .Q373* .0.050* .0.169*SINGAPORE 0.052 -0.012 0.420* 0.229SRI LANKA -0.010 -0.146 0.183 -0.050
TAIWAN .0.295* .0.328* 0.066 .Øj34*THAILAND .0.464* .0.450* .0.191* .0.232*
TURKEY .0.195* .0.182* 0.013 0.016
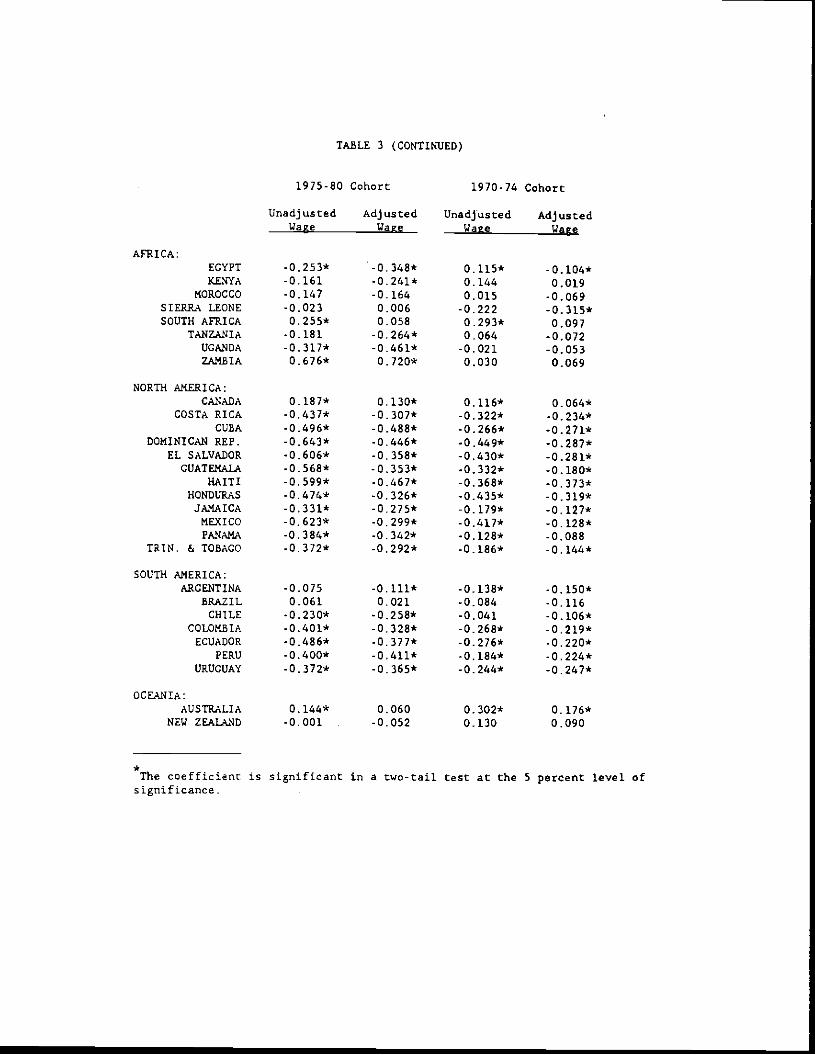
TABLE 3 (CONTINUED)
1975-60 Cohort 1970-74 Cohort
Unadjusted Adjusted Unadjusted AdjustedWage Wan Wan Wan
AFRICA:EGYPT .0.253* -0.348* 0.115* -0.104*KENYA -0.161 .0.241* 0.144 0.019
MOROCCO -0.147 -0.164 0.015 -0.069SIERRA LEONE -0.023 0.006 -0.222 -0.315*SOUTH AFRICA 0.255* 0.058 0.293* 0.097
TANZANIA -0.181 .0.264* 0.064 -0.072UGANDA .0.317* .0.461* -0.021 -0.053ZAMBIA 0.676* 0.720* 0.030 0.069
NORTH AMERICA:CANADA 0.187* 0.130* 0.116* 0.064*
COSTA RICA -3437* -0.307* .0.322* .0.234*CUBA .0.496* .0.488* -0.266* .0.271*
DOMINICAN REP. .0.643* .0.446* .Q•449* .0.287*EL SALVADOR .0.606* .0358* -0.430* .0.281*GUATEMALA .0,568* .0353* .0.332* 0.180*
HAITI .3,599* .0.467* .0.368* -0.373*HONDURAS .3474* .0.326* -Ø435* -0.319*JAMAICA .0.331* .3275* -0.179* .0.127*MEXICO .0.623* .0.299* .0.417* .0.128*PANAMA .0384* .0.342* -0.128* ,0.088
TRIN. 6 TOBAGO .0.372* .0.292* .0,186* .0.144*
SOUTH AMERICA:ARGENTINA -0.075 .0,111* .0.138* .0.150*
BRAZIL 0.061 0.021 -0.084 -0.116CHILE .0.230* .0.258* -0.041 .0.106*
COLOMBIA .0401* .0.328* -0.268* .0.219*ECUADOR .0.486* .0,377* .0.276* .0.220*
PERU .0,400* .0.411* .0,184* .0.224*URUGUAY .0.372* .0.365* -0.244* .0.247*
OCEANIA:AUSTRALIA 0.144* 0,060 0.302* 0.176*
NEW ZEALAND -0.001 -0.052 0.130 0.090
*The coefficient is significant in a two-tail test at the 5 percent level ofsignificance. -
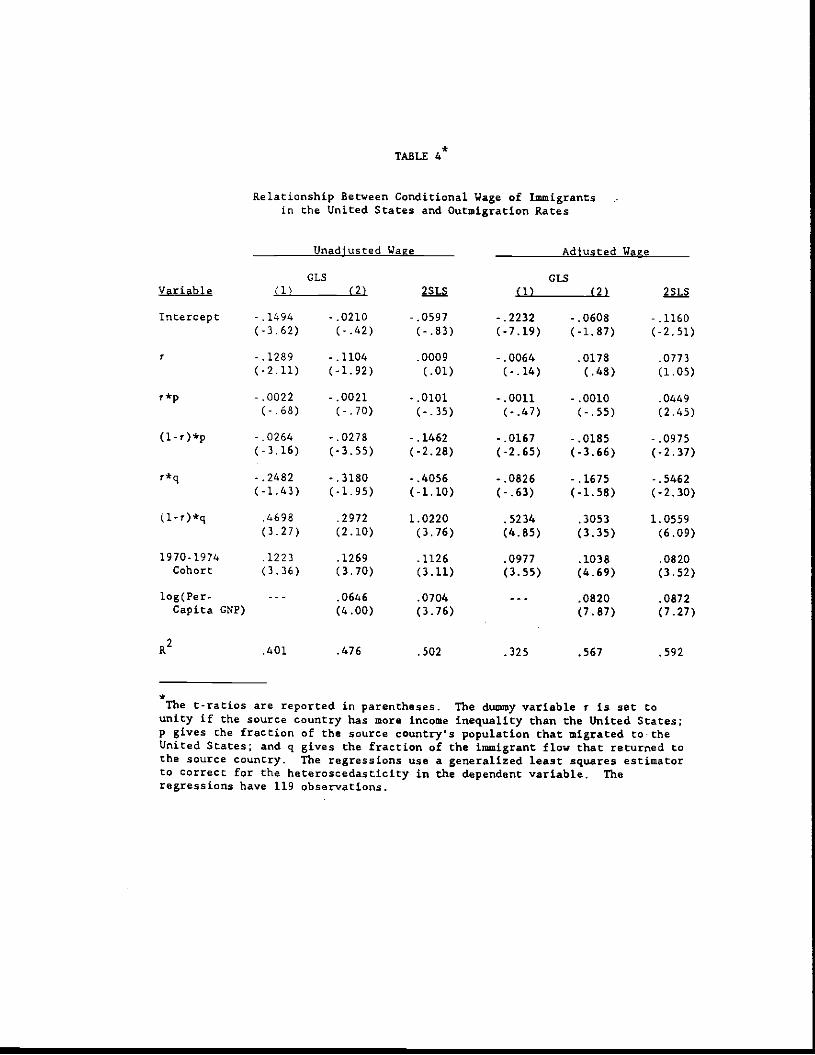
*TABLE 4
Relationship Between Conditional Wage of Immigrantsin the United States and Outmigration Rates
lJnadiusted ¶Ja2e Adjusted i-laze
CL.S CLSVariable CD (2) 2SLS (1) (2) 2SLS
Intercept -.1494 -.0210 -.0597 -.2232 -.0608 - .1160(-3.62) (-.42) (-.83) (-7.19) (-1.87) (-2.51)
r - .1289 - .1104 .0009 - .0064 .0178 .0773
(-2.11) (-1.92) (.01) (-.14) (.48) (1.05)
r*p - .0022 - .0021 - .0101 - .0011 - .0010 .0469
(-.68) (- .70) (-.35) (-.47) (-.55) (2.45)
(I.r)*p -.0264 -.0278 -.1462 -.0167 -.0185 -.0975(-3.16) (-3.55) (-2.28) (-2.65) (-3.66) (-2.37)
r*q -.2482 -.3180 -.4056 -.0826 -.1675 -.5462(-1.43) (-1.95) (-1.10) (-.63) (-1.58) (-2.30)
(l_r)*q .4698 .2972 1.0220 .5234 .3053 1.0559(3.27) (2.10) (3.76) (4.85) (3.35) (6.09)
1970-1974 .1223 .1269 .1126 .0977 .1038 .0820Cohort (3.36) (3.70) (3.11) (3.55) (4.69) (3.52)
log(Per- .0646 .0704 .0820 .0872Capita CNP) (4.00) (3.76) (7.87) (7.27)
.401 .476 .502 .325 .567 .592
*The t-ratios are reported in parentheses. The dummy variable r is set to
unity if the source country has more income inequality than the United States;p gives the fraction of the source country's population that migrated to theUnited States; and q gives the fraction of the immigrant flow that returned tothe source country. The regressions use a generalized least squares estimatorto correct for the heteroscedasticity in the dependent variable. Theregressions have 119 observations.

Figure 1. Skill Sorting in Human Capital Model when 1 < 1.
V
Stay in theSource Country
Migrate to U.S.Pennancntly

Figure 2. Skill Sorting in Human Capital Model when 1> 1.
V
to U.S-
Stay in theSource Country

C
Figure A-I. Skill Sorting in Uncertainty Model when 11< 1
V
/£ =J0 +$.Lj +K)
- P1(1—it)— (l—rt)i
V = (M — + K)/(1—fl)+ (NI + It -ic)/Dt(1—ti)I
Remain in U.S.
Return to Source Country

S
Figure A-2. Skill Sorting in Uncertainty Model when < 1
V
= — + K)/(17i)+ (NI + R -x)/(it(1—))
Remain in U.S. C = — + )- R,(I—iQ— (I—n) V
Return to Source Country

George J. Borjas
José De GregorioFederico Stunenegger
Brandice I. CanesHarvey S. Rosen
Raghurarn 0. RajanLuigi Zingales
Gene GrossmanEllianan Helpman
Gene GrossmanElhanan Helpman
C. Keith HeadJohn C. RiesDeborah L. Swenson
David M. Cutler
Douglas Holtz-EakinJohn R. PenrodHarvey S. Rosen
Nouriel RoubiniGian Maria Milesi-Ferretti
Nouriel RoubiniGina Maria Milesi-FerreW
Raquel Fernandez
Richard Rogerson
R. Glenn HubbardJonathan SkinnerStephen P. Zeldes
Martin Feldstein
Oliver HartJohn Moore
To order any of these papers, see instructions at the end of the list. To subscribe to all NBER WorkingPapers or the papers in a single area, see instructions Inside the back cover. A complete list of PIKER
Working Papers and Reprints can be accessed on the Internet by using our gopher at nber.harvard.edu.
Number Author(s) Dale
4871 Lan E. 0. Svensson 994
4872
4873
4874
4875
4876
4877
4878
4879
4880
4881
4882
4883
4884
4885
4886
Title
Estimating and Interpreting ForwardInterest Rates: Sweden 1992-1994
Immigration and Welfare. 1970-1990 9/94
Credit Markets and the Welfare Costs 10,94of Inflation
Following in Her Footsteps? Women's Choices 10,94of College Majors and Faculty Gender Composition
What Do We Know about Capital Structure? 10,94Some Evidence 1mm International Data
Foreign Investment with Endogenous Protection t0194
Electoral Competition and Special Interest 10j94Politics
The Attraction of Foreign Manufacturing 10,94Investments: Investment Promotion andAgglomeration Economies
Markct Failure in Small Group Health Insurance 10j94
Health Insurance and the Supply of 10,94
Entrepreneurs
Taxation and Endogenous Growth in Open 10,94Economies
Optimal Taxation of Human and Physical Capital 10j94in Endogenous Growth Models
Public Education and Income Distribution: A 1Q94
Quantitative Evaluation of Education Finance Reform
Precautionary Saving and Social Insurance 10j94
Fiscal Policies, Capital Formation and Capitalism 194
Debt and Seniori . An Anajysis of the Role 10,94
ol Haiti Claims in Constraining Management
To order any or these papers, see instructions at the end or the list. To subscribe to all NBER WorkingPapers or the papers in a single area, see instructions inside the back cover. A complete list of NBERWorking Papers and Reprints can be accessed on the Internet by using our gopher at nber.han'ard.edu.
Number Author(s) Title Dale
4887 Ricardo J. Caballero Explaining Investment Dynamics in U.S. l094Eduardo M.R.A. Engel Manufacturing: A Generalized (5,4 Apprcnch
4888 Martin Fcldstein Measuring Money Growth When Financial 10,94James H. Stock Markets Are Changing
4889 Mark Hooker Unemployment Effects of Military Spending: 10,94Michael Knetter Evidence from a Panel of States
4890 John R. Graham Market liming Ability and Volatility 10,94Campbell R. Harvey Implied in Investment Newsletters'
Asset Allocation Recommendations
4891 W. Kip Viscusi Cigarette Taxation andthe Social 10,94
Consequences of Smoking
4892 Alan M. Taylor Domestic Saving and International 10,94Capital flows Reconsidered
4893 Maurice Obstfetd The Intertemporal Approach to the 10,94Kenneth Rogoff Current Account
4894 Michael M. Knetter Why Are Retail Prices in Japan So High?: 10,94Evidence 1mm German Export Prices
4895 Peter Diamond Insulation of Pensions from Political Risk 10,94
4896 Lawrence H. Goulder Environmental Taxation and the "Double 10,94Dividend: A Reader's Guide
4897 A. L.ans Bovenberg Optimal Environmental Taxation in the Presence 10,94Lawrence H. Goulder of Other Taxes: General Equilitzium Analyses
4898 Barry Eichengreen Speculative Attacks on Pegged Exchange Rates: 10j94Andrew K. Rose An Empirical Exploration with Special ReferenceCharles Wyplosz to the European Monetary System
4899 Shane Greenstein From Superminis to Supercomputers: Estimating 10i94Surplus in the Computing Market
4900 Orazio P. Attanasio IRAs and Household Saving Revisited: 10i94Thomas C. DeLeire Some New Evidence
4901 Timothy F. Bresnahan The Competitive Crash in Large-Scale 1094Shane Greenstein Commercial Computing
To order any of these papers, see instructions at the end of the list. To subscribe to all NBER WorkingPapers or the papers in a single area, see instructions inside the back cover. A complete list of NBERWorking Papers and Reprints can be accessed on the Internet by using our gopher at izberiiarvard.edu.
How a Fee Per-Unit Garbage Affects 10194Aggregate Recycling in a Model withHeterogeneous Households
Aging and Productivity. Rationality andMatching: Evidence from Economists
Number Authcgfs) Tide
4902 Joel Slemrod Free Trade Taxation and Protectionist Taxation 10194
4903 Assaf RainEfraim Sadka
•
Resisting Migration: The Problems of WageRigidity and the Social Burden
10i94
4904 Ernst R. BerndtLinda BuiDavid ReileyGlen Urban
•
The Roles of Marketing. Product Quality andPrice Competition in the Growth andComposition of the U.S. Anti-UlcerDrug Industry
10i94
4905 Thomas C. KinnarnanDon Fullerton
4906 Daniel S. Hamermesh 1094
4907 Kooyul JungYong-Cheol KimRené M. Stulz
Investment Opportunities. ManagerialDiscretion, and the Security IssueDecision
10194
4908 Jun-Koo KangRené M: Stulz
• How Different is Japanese CorporateFinance? An Investigation of theInformation Content of New Security Issues
10j94
4909 Robert 3. Bairn Democracy and Growth I94
4910 Richard B. Freeman Crime and the Job Market l094
4911
4912
Rebecca M. Blank The Dynamics of Part-Time Work 11194
11/94
4913 11194
George .1. Borjas Ethnicity. Neighborhoods, and Human CapitalExternalities
Copies of the above working papers can be obtained by sending $5.00 per copy (plus $10.00 per outer forpostage and handling for all locations outside the continental U.S.) to Working Papers. NBER. 1050 MassachusettsAvenue, Cambridge. MA 02138-5398. Advance payment is required on all orders. Payment may be made by checkorcreditcard. ChecksshouldbemadepayabletotheNsEgandmustbemdollarsdrawflOnaU.S.baflk. Ifpaying by credit card, include the cardholdefs name, count number andexpiration date. For all mail orders, pleasebe suit to include your return address and telephone number. Working papers may also be ordered by telephone(617-868-3900). or by fax (617-868-2742).
George 3. BorjasBemt Bratsberg
Who Leaves? The.Outmigration of the
Foreign-Born

National Bureau of Economic Research
DomSicAcademic Librarjcxl Academic Librariesi
Standard Faculty Members Standard Faculty Members
O Full subscriptions' $1300 $650 $1625 $975Partial subscriptions0 Corporate Finance 300 75 350 110o Stocks, Bonds, and Foreign Currency 300 75 350 110o International Finance and Macroeconomics 270 135 350 210o International Trade and Investment 270 135 350 210o Monetary Economics 150 75 200 1100 EconomIc Fluctuations 270 13$ 350 210OLong-RunEconomlcGrowth 150 75 200 110O Sources ol Productivity Growlh 70 35 85 500 TaxatIon 270 135 350 210o labor StudIes 270 135 350 210O EconomIcs of Health and Health Case 150 75 200 110DEconomlcsoftheElderly 70 35 85 50o Inctustrlal OrganizatIon 70 35 85 50
DrechnlcalWortdngPapers 70 35 85 50o HIstorical Development of the American Economy 70 35 85 50
• A full subscription Includes all topics listed under partial subscripth nC except for Technical Worfdng Papers and paperson the HIstorIcal Development of the American Economy. These must be ordered hi addition to the full subscrIpllon.
Please Inquire about subscriptIon prices for Africa and Australia.
PAYMENT OflIONSo YES! Please begin my subscription to the AIDER Working Paper Series. 1 have indicated above which papers 1would like to receive.
Please mail nw papes to this addressBy Pbone (617) 868-3900
By FAX (617) 868-2742 Name _________________________________
By Mail: Publications Department Address _________________________National Bureau of Economic Research1050 Massachusetts Ave.Cambridge, MA 02138 _____
o Payment In the amount of________ enclosed.
C Please charge reT 0 VISA 0 MasterCard
Card Numba -
Phone:Card expiratloit ________________
FAXSignsture _____________________