Embed Size (px)
Citation preview

NBER WORKING PAPER SERIES
UNIVERSITIES, JOINT VENTURES AND SUCCESS IN THE ADVANCED TECHNOLOGY PROGRAM
Michael R. DarbyLynne G. Zucker
Andrew Wang
Working Paper 9463http://www.nber.org/papers/w9463
NATIONAL BUREAU OF ECONOMIC RESEARCH1050 Massachusetts Avenue
Cambridge, MA 02138January 2003
This is a revision of a paper presented at the Western Economic Association International 77th AnnualMeetings, Seattle, Washington, June 30, 2002. We thank the University of California’s Industry-UniversityCooperative Research Program, and especially its Director, Dr. Susanne L. Huttner, for providing supportfor licenses to limited use data and development of a “fuzzy matching” algorithm. This support provided forboth the data in IPR/UCLA Archive as well as the ability to match ATP participant companies into it. Wethank Adam Jaffe for advance access to the Hall, Jaffe, and Tratjenberg (2001) patent data through 1996 andLinda Cohen for thoughtful advice through multiple revisions. We are indebted to a remarkably talentedUCLA research team, especially David Johnson, Wenjin Kang, Qiao Liu, David Waguespak, and XiaogangWu, and also Stephanie Hwang, Andrew Jing, Henry Tang, and Mo Xiao. This paper is a part of the NBER'sresearch program in Productivity. Any opinions expressed are those of the authors and not those of theNational Bureau of Economic Research, the University of California, or the U.S. Department of Commerce.The views expressed herein are those of the authors and not necessarily those of the National Bureau ofEconomic Research.
©2003 by Michael R. Darby, Lynne G. Zucker and Andrew Wang. All rights reserved. Short sections of textnot to exceed two paragraphs, may be quoted without explicit permission provided that full credit includingnotice, is given to the source.
Universities, Joint Ventures, and Success in the Advanced Technology ProgramMichael R. Darby, Lynne G. Zucker, and Andrew WangNBER Working Paper No. 9462January 2003JEL No. R21, E21, G11, G12, J14
ABSTRACT
America’s most innovative firms participate in the U.S. Commerce Department’s Advanced
Technology Program (ATP) – those that participated at least once accounted for over 40 percent of
U.S. patents to U.S. entities during 1988-1996. Many firms are repeat participants. ATP participation
has significant and robust effects on innovation in firms, generally increasing firms’ patenting during
the time they are receiving ATP support, when compared to patenting by the same firms prior to and
after the ATP award. ATP participation increases firms’ patenting on average by between 5 and 30
patents per year during the period of ATP participation. This represents a 4 to 25 percent increase
in firms’ patenting compared to the period before ATP participation. Furthermore, joint-venture (JV)
project participation and university participation in a project both appear to have a positive impact
on firm patenting. The amount of funding received by the firm is crucial for single participants, with
the positive impact concentrated in those firms with large grants. Single participants are more likely
than JV members to be small startups for which ATP funding is large relative to the total R&D
budget. For JV participants, participation is more important than the level of funding.
Michael R. Darby Lynne G. Zucker, Professor of Sociology &Cordner Professor of Money & Financial Markets Director, Center for International Science,Depts. of Management, Economics & Policy Studies Technology, and Cultural Policy Anderson Graduate School of Management School of Public Policy & Social ResearchUniversity of California, Los Angeles University of California, Los AngelesLos Angeles, CA 90095-1481 Los Angeles, CA 90095-1551and NBER and [email protected] [email protected]
Andrew WangSenior EconomistOffice of Economic AssessmentAdvanced Technology ProgramNational Institute of Standards and TechnologyGaithersburg, MD [email protected]
1
UNIVERSITIES, JOINT VENTURES, AND SUCCESS IN THE ADVANCED TECHNOLOGY PROGRAM
MICHAEL R. DARBY, LYNNE G. ZUCKER, and ANDREW WANG
I. Introduction
The Advanced Technology Program (ATP), at the National Institute for Standards and
Technology (NIST), aims to fund enabling technologies which firms are not likely to pursue in a
timely way without the ATP. The role of the Advanced Technology Program (ATP) is to
“bridge” the gap from demonstrating a promising but risky idea to garnering the organizational
resources to commercialize a product. In doing so, the ATP increases the prospect of commercial
capture of advanced technology. NIST made its first awards in 1990, based on peer-reviewed
proposals submitted by either individual firms or joint ventures of two or more collaborating
firms. Over its ten-year history, ATP has managed over 1000 participants and subcontractors.
A necessary (but not sufficient) condition for the success of the Advanced Technology
Program is that it contributes to the success of participant firms: If the participant firms do not
benefit from the new technology, others are unlikely to adopt it. Hence, as a first step, we search
for evidence of ATP’s overall impact on firm success. Our second step is to investigate what
might explain any impact on firm success that we may discover. We consider the effect of
program design. ATP makes two types of awards — for projects that explicitly involve
collaboration between two or more firms (and also possibly other organizations such as
universities and federal laboratories); and for projects proposed by individual firms, with no
formal collaborative framework. The former we term joint venture or JV projects, and the latter
we call single participant or SP projects. Our study examines the effects on firms related to these
project structure differences, and also related to participation by universities (as a full member in
a JV, or as a subcontractor in either an SP or JV project).
We evaluate ATP’s effects in terms of overall change in successful patent applications
during the period of ATP support. Patents are a useful measure of innovation for all ATP
2
participants: small, privately held firms; larger public firms; universities; and other research
organizations. During the period 1988 to 1996, firms and organizations that participated in ATP
accounted for over 40% of all patents granted to U.S. entities by the U.S. Patent and Trademark
Office (USPTO). Firms comprise 88% of the total number of all ATP participants, and account
for over 80% of all patents awarded to ATP participants. Innovation in “advanced technology”
and patenting appear to go hand-in-hand for nearly all of the firms and organizations
participating in ATP. This concentration of technological progress in relatively few firms is the
stressed by Harberger (1998) and Darby and Zucker (2003).
In our view, ATP not only provides funding awards to participants, but also promotes
“institution-building” in the process, encouraging applicants to establish new organizational
structures that facilitate innovation and the capture of inventions in technologically advanced
commercial products. Institution-building takes place in ATP in a number of ways. First, ATP
supports firms willing to experiment and develop approaches that are novel and at the
technological frontier. ATP stimulates industry to initiate projects that are higher in risk, with
greater potential for broader economic impact. Second, ATP encourages cooperation and
collaboration in R&D activities, among JV partners, and also through subcontracting
relationships with universities, firms, and other organizations. Linkages that are important to
innovation and to technology transfer among firms/organizations are emphasized by ATP in
selecting projects initially, and then also in project review and monitoring activities.
In social science terminology, the ATP project changes participants’ “social
embeddedness” in networks of relations with other firms and organizations. While this effect
may be especially prominent for Joint Venture participants, firms in Single Participant projects
also note the importance of R&D subcontractors and relationships for achieving project
objectives. To the extent that ATP project participation enhances firms’ social network for R&D,
we expect that the impact on innovation outcomes will extend beyond the project level to the
firm level. Therefore, we assess the impact of ATP at the firm level in a ‘before’ and ‘after’
3
comparison of firm-level innovation outcomes.
The next section develops the analysis of ATP program design as institution building.
Section III lays out the methodology of our empirical analysis, focusing particularly on panel
design and sampling criteria and variable construction. The main empirical results are reported
in Section IV where we estimate the overall and separate effects of participation and funding
amount on the rate of patenting by program participants. Conclusions are drawn in Section V.
Beginning at page 32 after the main body of the paper is a technical appendix which elaborates
on methodology, data, and estimates.
II. ATP Program Design as Institution-Building
The “social embeddedness” perspective on economic behavior of individuals and firms
emphasizes the social context and interactions of economic actors. In traditional economic
theory, economic behavior is analyzed in terms of rational choice and utility-maximizing
individuals or profit-maximizing firms, and relatively little emphasis is placed on specific
historical and social context. Sociologists on the other hand have emphasized the importance of
understanding how specific social relationships shape economic behavior and economic
outcomes. Economic behavior is embedded in a social context, and the characteristics of
particular social relations affect economic behavior and determine economic outcomes.
Granovetter (1985) provides a number of useful examples. When disputes arise in business, they
are “frequently settled without reference to the contract or potential or actual legal sanctions.”
Instead, personal relationships based on cooperation and trust are important to solving problems
and reaching agreements. Or when firms subcontract, or make sales or purchasing decisions,
long-term sustained relationships between firms are often built on ongoing social interactions or
networks.
When ATP makes an award and funds a project, the participating firms and other
organizations establish R&D and business ties, thus extending and enhancing their social
network for innovation. By fostering organizational interactions, ATP builds the institutional

4
basis for innovation. From their networks, firms gain access to knowledge and complementary
expertise of R&D partners, as well as business and marketing resources of partner firms. The
social embeddedness perspective on R&D and innovation emphasizes that ATP project
participation is a conscious institution-building process — firms partner under the ATP to
establish R&D structures that are favorable to high-risk research, and conducive to socially
beneficial behaviors such as research cooperation and information sharing, in joint ventures and
in university collaborations for example.
We highlight a few types of social embeddedness — social relations that alter economic
behavior and outcomes — that are particularly important aspects of ATP’s institution-building:
• Close contact among researchers in collaborative R&D work. Such relationships are most
likely to transmit novel knowledge that is close to the knowledge frontier and hence often
tacit in nature (Zucker, Darby, and Armstrong 1998).
• Relaxation of boundaries around the firm, permitted because information gains are expected
to be sufficiently valuable to the firm to offset any losses (Zucker et al. 1996). The boundary
permeability allows more flow of information and hence more learning across organizations
than would otherwise be the case. Boundary design is often part of the strategic arsenal of a
firm (Helper, MacDuffie, and Sabel 2000).
• Development of institution-based trust that rests on institutional structures rather than
interpersonal or specific characteristics of the other party (Zucker 1986). Two examples of
institution-based trust provided for by ATP include: (a) Third-party (ATP) monitoring of
participants’ behavior in Joint Ventures to ensure cooperation (see Zucker et al. 1996); and
(b) Administrative structures and agreements (e.g., intellectual property agreements, JV
administrative structures) to increase confidence in successful coordination (see Das and
Teng 1998).
We believe that the implicit design of ATP encourages firms to relax their boundaries
and share knowledge. Actors will contribute more to a collective good when they believe their
5
action is likely to have efficacy, and when there are norms of fairness that encourage them to
match the contributions of others (Gould 1993). ATP provides an institutional structure and
mechanisms that makes efficacy and “fairness” more likely. The gains from research
collaboration derive from resource exchange in complementary capabilities, information,
financial resources, and access to particular technologies or science base. ATP provides
opportunities for firms (and other organizations) to collaborate and realize these potential gains.
Firms participating in ATP gain from the project, learn from each other, and become better at
innovating.
ATP institution-building is also evident in ATP guidelines for design of projects and
structuring of partners to produce greater research synergy. For example, ATP encourages a mix
of JV partners in order to further prospects for R&D success and technology commercialization
and diffusion: “Joint ventures should aim to include companies of diverse size, including smaller
companies, and possibly other organizations, such as universities and national laboratories”
(ATP 1999: 34). And many ATP projects involve universities. Since universities are often at the
center of new discoveries and their application, particularly discoveries that involve radical change
from prior knowledge (see Zucker and Darby 1996; Zucker, Darby and Brewer 1998; Liebeskind et
al. 1996; also Jaffe 1989), university relationships may be a key source of information for many
ATP projects.
ATP has a goal of encouraging collaborations among firms, and between firms and
universities and other organizations (federal labs, independent research institutes) in the U.S.
innovation system. ATP encourages formation of JVs, providing potentially higher award levels
and more years of funding, and encourages JV members to establish governance structures for
internal management of JVs. ATP’s suggestions for design of JVs tends to relax the boundaries of
participants’ organizations. ATP in effect opens up boundaries where the ATP project impinges,
encouraging joint governance and reasonable access by all JV members to intellectual property
created within the JV. “Spillovers” or transfers of knowledge to other JV members occur within this
6
enlarged “information envelope” that protects information dissemination (Zucker et al. 1996). In
particular, internal task routines that are difficult to understand from outside of organizations may be
transferred (see Nelson and Winter 1982: 123-124).
Enlarging effective organizational boundaries to encompass new research collaborations has
two main effects that cause more information sharing to occur: (1) JVs make knowledge created by
one participant organization more observable to the other participants, since internal task routines
that are often unobservable across organizational boundaries become transparent through joint work
among scientists, engineers, and other technically trained workers; and (2) boundary enlargement
may define a new “commons,” an area of mutual benefit around the shared ATP project, which may
draw in additional shared resources as research effort progresses or shows promise.
Our argument is that JV participants, because of ATP’s institution-building process and
reinforcing project management oversight, operate in — are “embedded in” — a different social
context or new social structure when they enter a new JV through an ATP award. By becoming
embedded in the new structure, JV participants derive an informational or knowledge benefit.
The firms not only have more financial resources through ATP funding, but also have changed
social relationships (more collaborators and different collaborators, and more intense
collaborations). These relationships provide intellectual capital, and social contacts that add value
through learning processes that result in information or knowledge transfer (Hamel 1991; Doz
1996). Many JVs, for example, come together specifically to apply for ATP funding, and bring
together firms that have not worked together before.
Comments by ATP participants in JVs support our argument. As one JV member notes:
“Excellent collaborative environment and complementary technical capabilities have improved
the quality of technical output and effectiveness of the team. There has been tremendous synergy
between the companies that are collaborating on this project. Each company brings a particular
expertise that the others don’t have and which would be difficult to develop. Each party is an
enabler for the others” (Powell and Lellock 2000: 23). Another JV participant states: “Exposed
7
to new ideas, technologies that would otherwise not have been exposed to. Enabled us to leap
forward with newer approaches into our architectural design.” For projects that involve
collaboration, 97% of participants report that the collaboration stimulated creative thinking, and
86% report that the collaboration allowed them to obtain R&D expertise (Powell and Lellock
2000: 20). (See Appendix Figure A2 for additional detail on intellectual property strategies.)
The new JV learning context also includes firms, universities, federal labs, and
organizations outside of the JV, organizations which JV partners collaborate with or are linked to
in some way. These connections multiply access to other kinds of knowledge, which provides
additional expanded information advantage (see Granovetter 1973, on the strength of weak ties
in social networks). As one JV member explains: “In general, the collaboration has allowed us to
contact new potential collaborators and markets. Some of these markets are for new equipment
using our technology in ways we had not considered. Due to the success of the JV, the various
members are investigating projects outside the ATP” (Powell and Lellock 2000: 25).
III. Methods
Institution-building by ATP and the resulting organizational and informational
advantages held by ATP participants are factors that enter into the innovation process in ATP
projects. How do we best measure the impact? To assess changes in organizational learning and
knowledge through ATP projects, we will study change in innovation outcomes, comparing
‘before’ and ‘after’ ATP. A major purpose of ATP is to increase commercial capture of advanced
technology. Patents are arguably the single best measure of commercial capture of invention,
conveying intellectual property rights. Patents are in fact commonly used to protect intellectual
property created under ATP support: 76% of organizations report that patenting is a primary or
secondary strategy for intellectual property, with only 12% reporting that patenting is unlikely
(Powell and Lellock 2000: 43).
In the analysis to follow, we assess whether ATP projects have a general effect on
formation of new intellectual property within the firm. While an ATP project may represent only
8
one R&D effort among many at a firm, to the extent that ATP changes firm behavior,
institutional setting, or social embeddedness, the impact of the ATP project may extend beyond
the project to affect the firm more generally. Our key indicator of impact on firm innovation is
whether the overall rate of patenting by a firm increases after participation in ATP begins. We
focus on project structure (Joint Venture vs. Single Participant), and university participation
(university partner in a JV project, and university subcontractor in a JV or SP project). We use a
patent count measure based on archival data assembled by Hall, Jaffe, and Tratjenberg (2001) and
significantly augmented by the Center for International Science, Technology, and Cultural
Policy (CISTCP) at UCLA.
Our first step is to set the unit of analysis. Archival data on patents are generally
available only for the firm or organization as a whole, and not for specific locations of multi-
location firms. Our analysis of whether participation in ATP has a positive effect on firms is
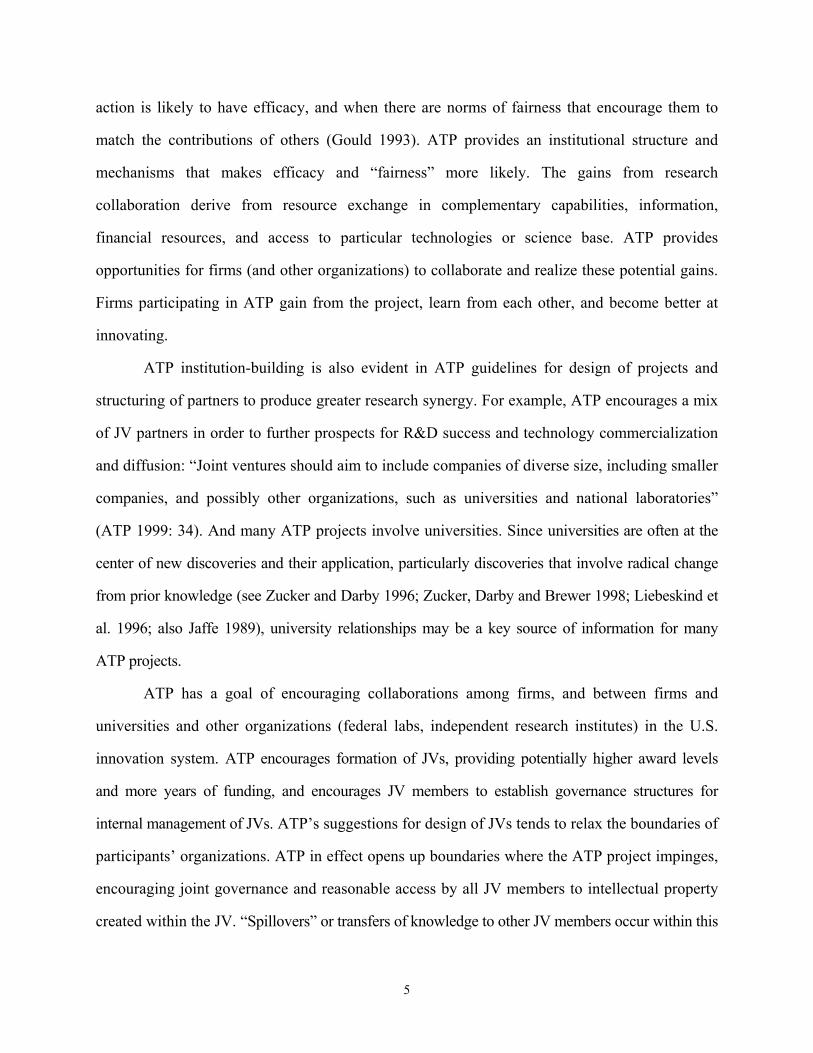
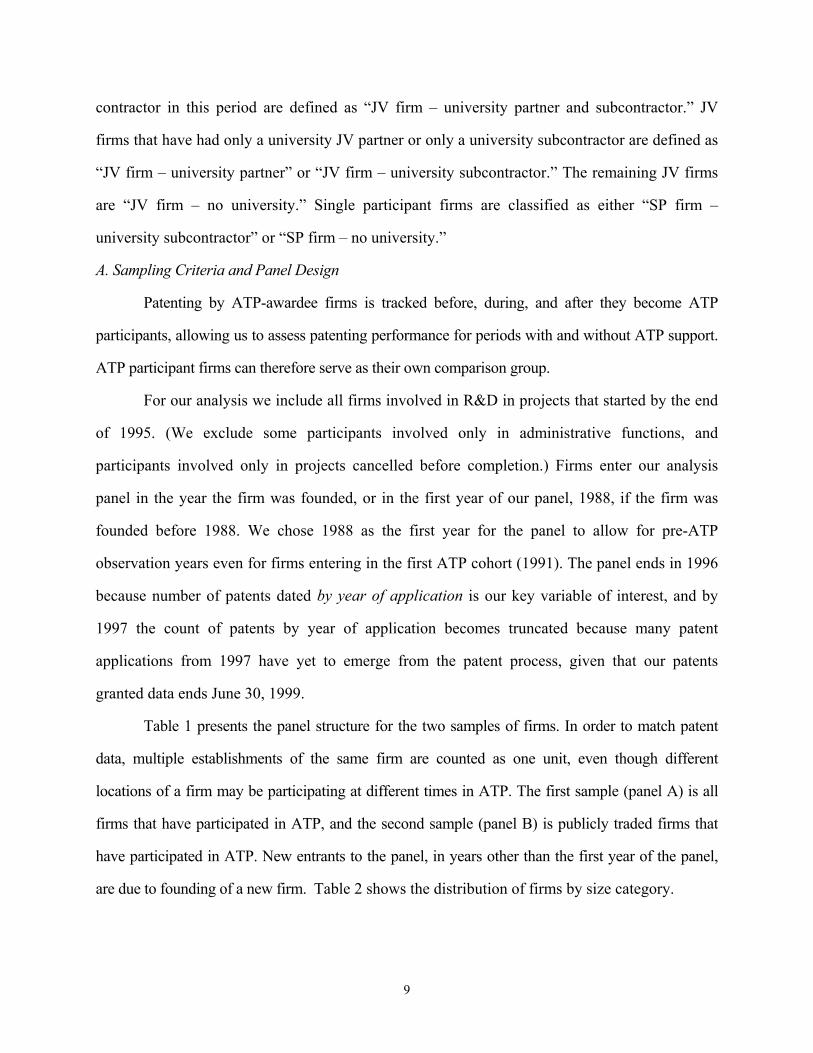
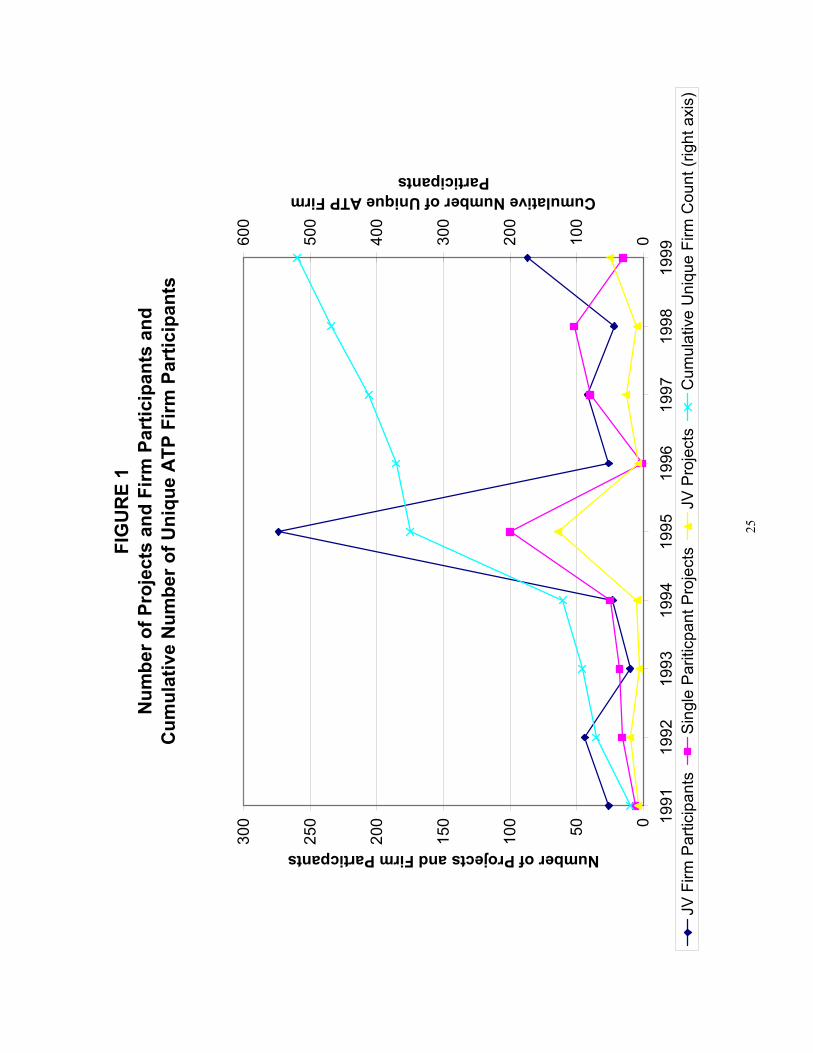
therefore centered on the firm/organization as the basic unit of analysis. Figure 1 shows the
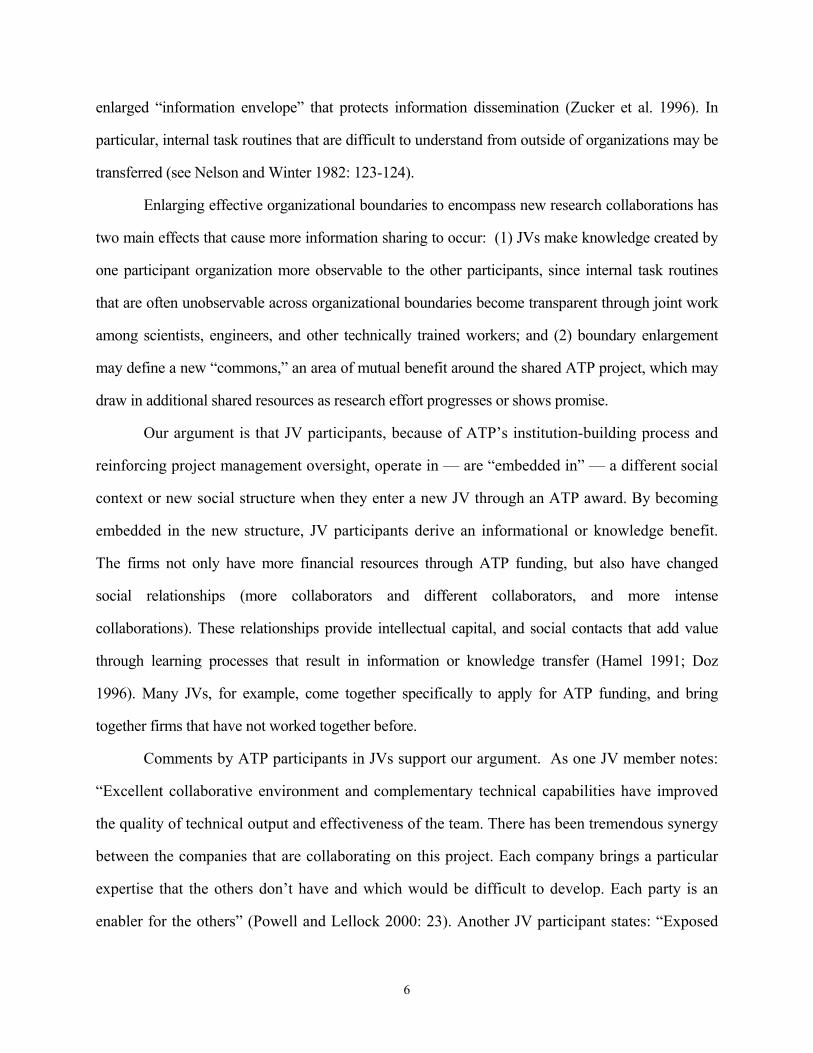
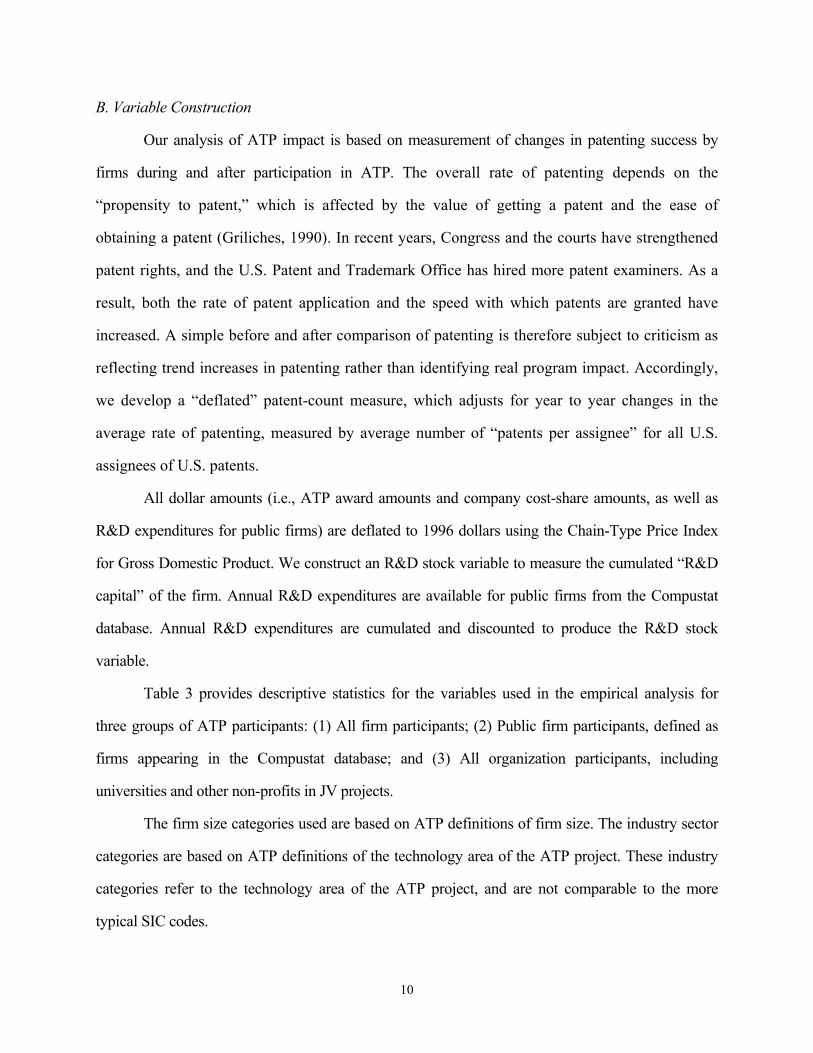
number of ATP projects and firm participants from ATP award years 1990-1998. Figure 2 shows
the distribution by SP or JV type for projects and all participants, from ATP award years 1990-
1998. The number of single firm projects is about twice the number of joint venture projects. But
because joint ventures involve multiple participants, the number of JV participants is more than
twice the number of SP participants. Some firms/organizations have participated in more than
one ATP project, and some have been in both JV and SP projects. More detailed description of
the data is included in the Technical Appendix.
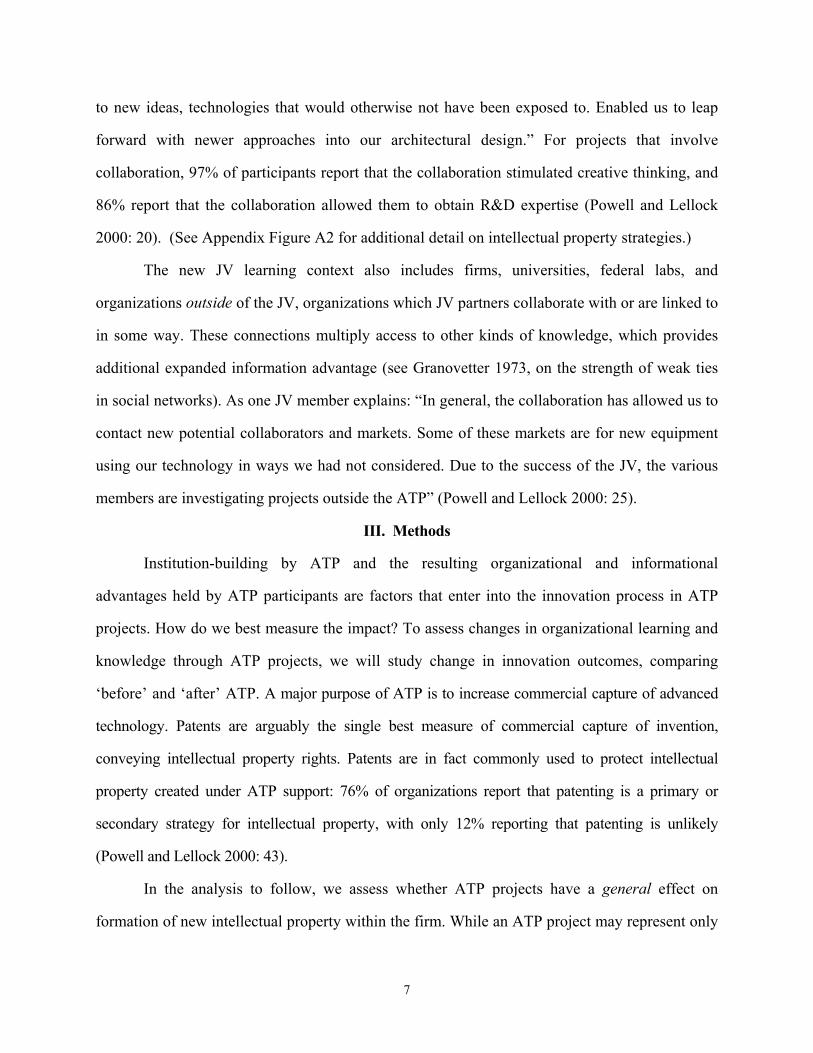
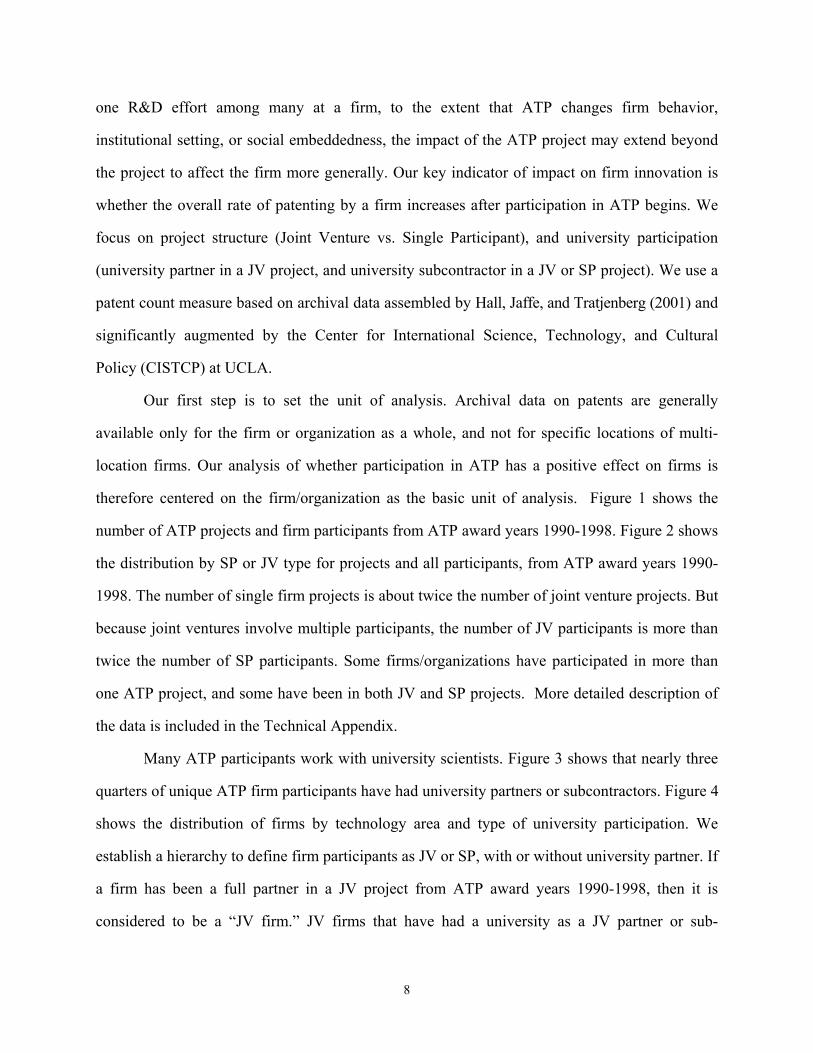
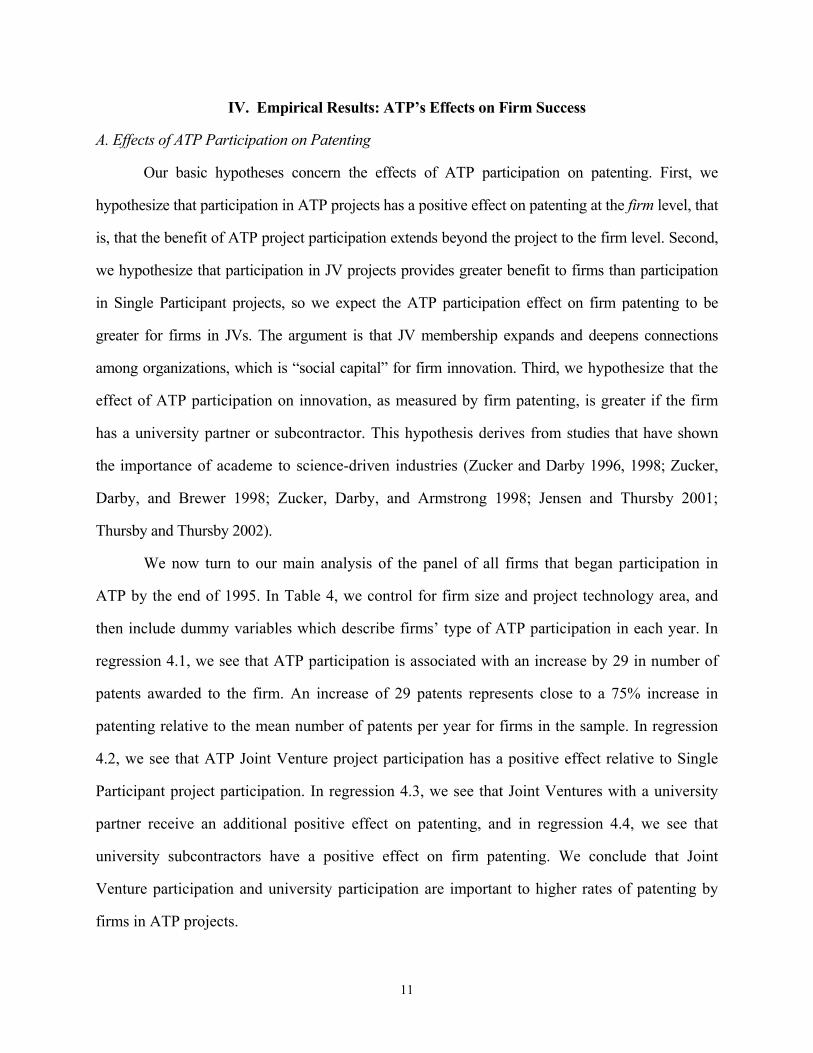
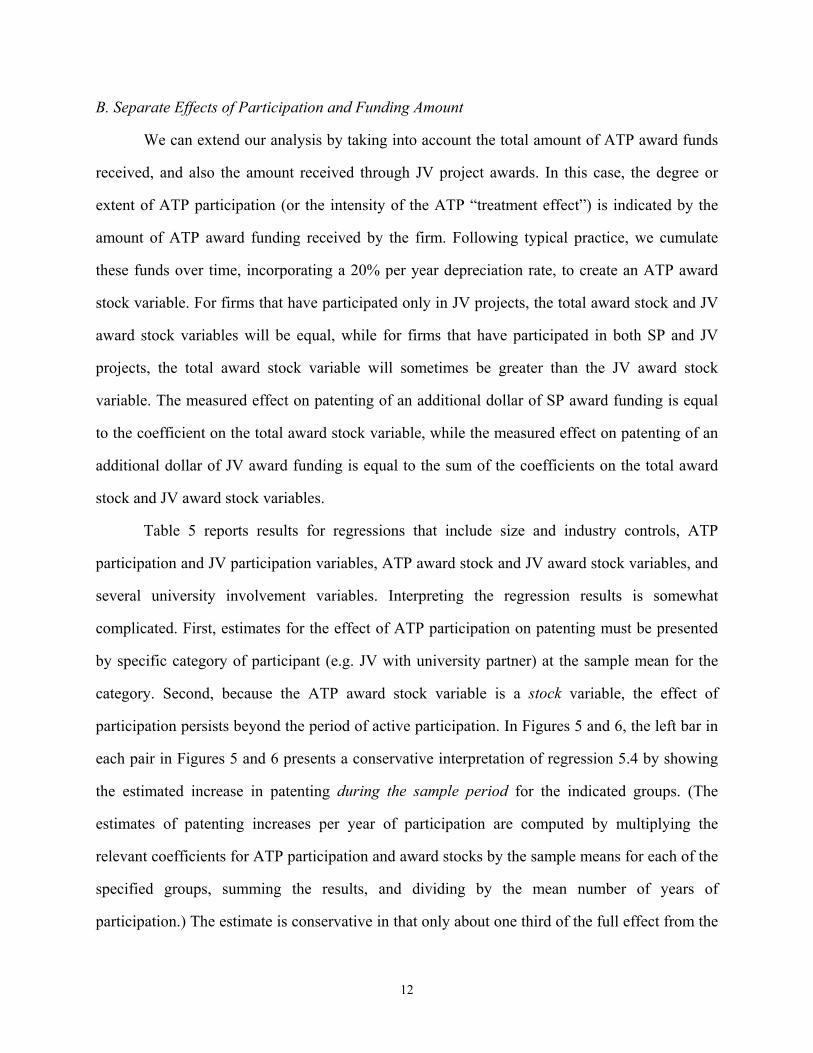
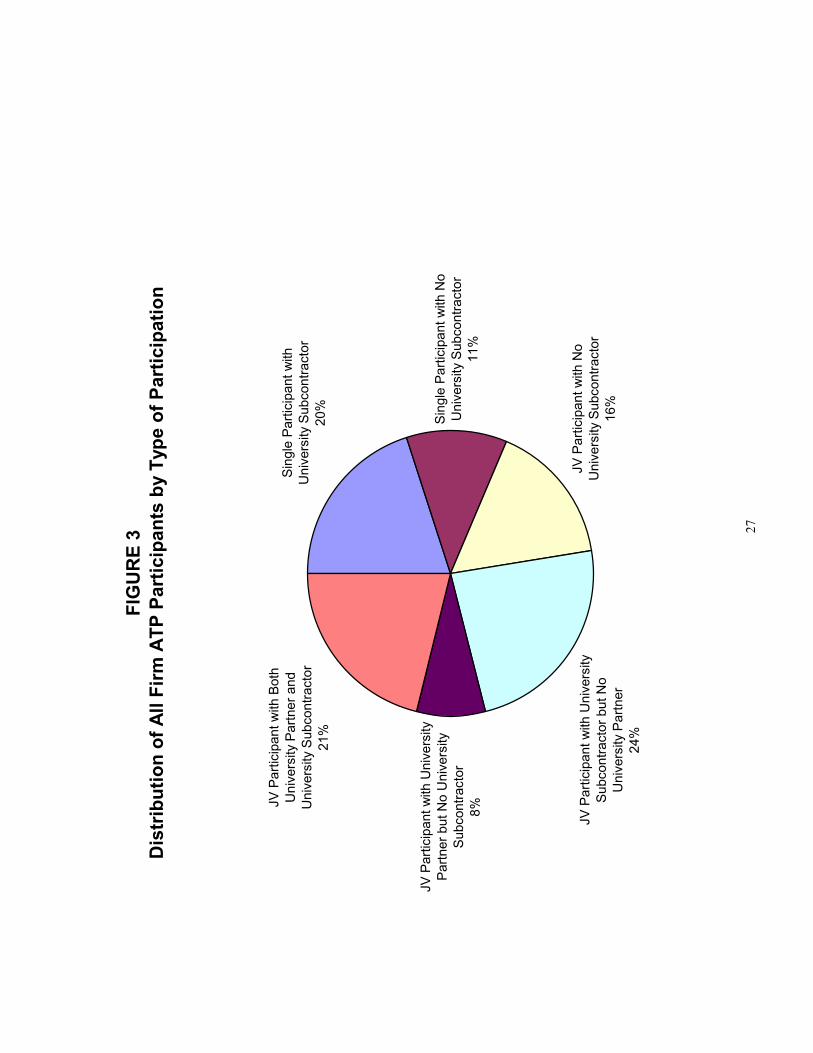
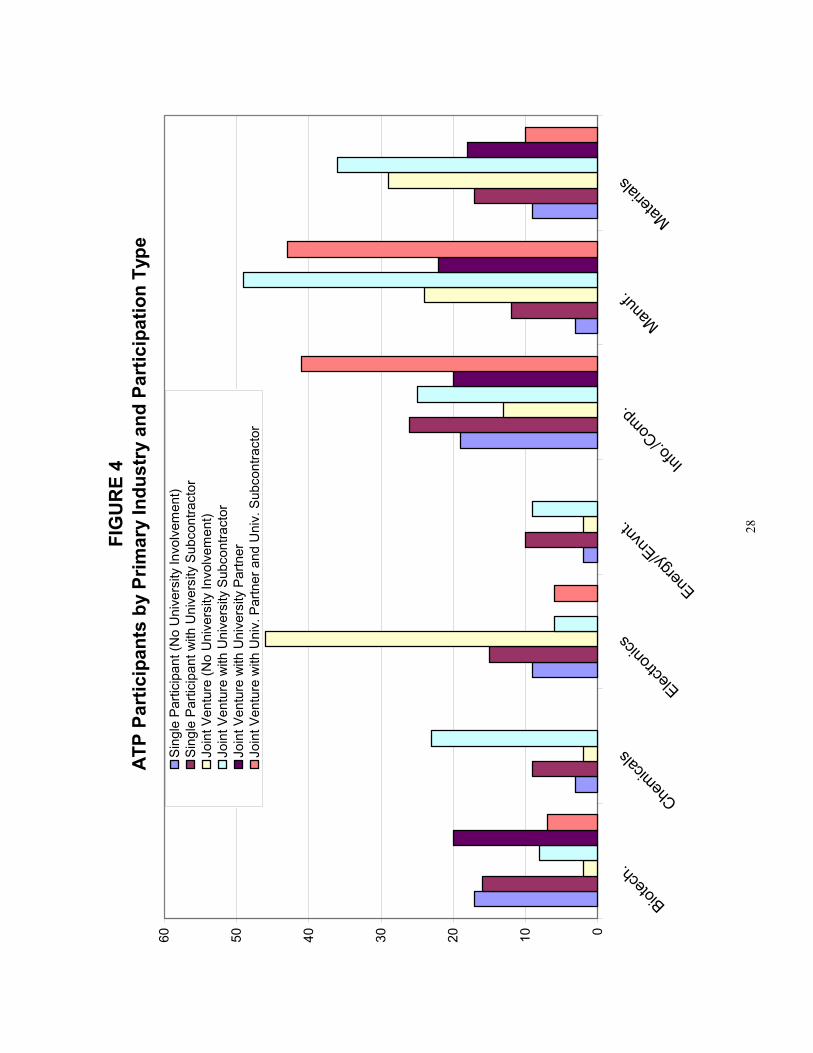
Many ATP participants work with university scientists. Figure 3 shows that nearly three
quarters of unique ATP firm participants have had university partners or subcontractors. Figure 4
shows the distribution of firms by technology area and type of university participation. We
establish a hierarchy to define firm participants as JV or SP, with or without university partner. If
a firm has been a full partner in a JV project from ATP award years 1990-1998, then it is
considered to be a “JV firm.” JV firms that have had a university as a JV partner or sub-
9
contractor in this period are defined as “JV firm – university partner and subcontractor.” JV
firms that have had only a university JV partner or only a university subcontractor are defined as
“JV firm – university partner” or “JV firm – university subcontractor.” The remaining JV firms
are “JV firm – no university.” Single participant firms are classified as either “SP firm –
university subcontractor” or “SP firm – no university.”
A. Sampling Criteria and Panel Design
Patenting by ATP-awardee firms is tracked before, during, and after they become ATP
participants, allowing us to assess patenting performance for periods with and without ATP support.
ATP participant firms can therefore serve as their own comparison group.
For our analysis we include all firms involved in R&D in projects that started by the end
of 1995. (We exclude some participants involved only in administrative functions, and
participants involved only in projects cancelled before completion.) Firms enter our analysis
panel in the year the firm was founded, or in the first year of our panel, 1988, if the firm was
founded before 1988. We chose 1988 as the first year for the panel to allow for pre-ATP
observation years even for firms entering in the first ATP cohort (1991). The panel ends in 1996
because number of patents dated by year of application is our key variable of interest, and by
1997 the count of patents by year of application becomes truncated because many patent
applications from 1997 have yet to emerge from the patent process, given that our patents
granted data ends June 30, 1999.
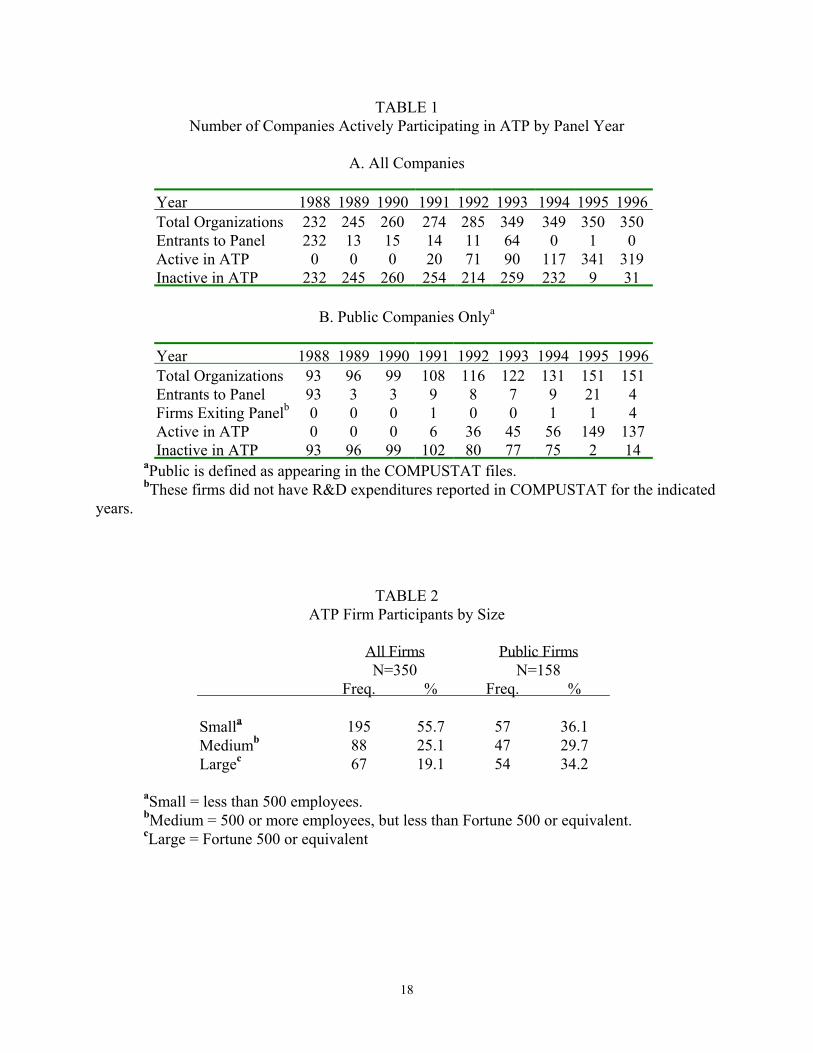
Table 1 presents the panel structure for the two samples of firms. In order to match patent
data, multiple establishments of the same firm are counted as one unit, even though different
locations of a firm may be participating at different times in ATP. The first sample (panel A) is all
firms that have participated in ATP, and the second sample (panel B) is publicly traded firms that
have participated in ATP. New entrants to the panel, in years other than the first year of the panel,
are due to founding of a new firm. Table 2 shows the distribution of firms by size category.
10
B. Variable Construction
Our analysis of ATP impact is based on measurement of changes in patenting success by
firms during and after participation in ATP. The overall rate of patenting depends on the
“propensity to patent,” which is affected by the value of getting a patent and the ease of
obtaining a patent (Griliches, 1990). In recent years, Congress and the courts have strengthened
patent rights, and the U.S. Patent and Trademark Office has hired more patent examiners. As a
result, both the rate of patent application and the speed with which patents are granted have
increased. A simple before and after comparison of patenting is therefore subject to criticism as
reflecting trend increases in patenting rather than identifying real program impact. Accordingly,
we develop a “deflated” patent-count measure, which adjusts for year to year changes in the
average rate of patenting, measured by average number of “patents per assignee” for all U.S.
assignees of U.S. patents.
All dollar amounts (i.e., ATP award amounts and company cost-share amounts, as well as
R&D expenditures for public firms) are deflated to 1996 dollars using the Chain-Type Price Index
for Gross Domestic Product. We construct an R&D stock variable to measure the cumulated “R&D
capital” of the firm. Annual R&D expenditures are available for public firms from the Compustat
database. Annual R&D expenditures are cumulated and discounted to produce the R&D stock
variable.
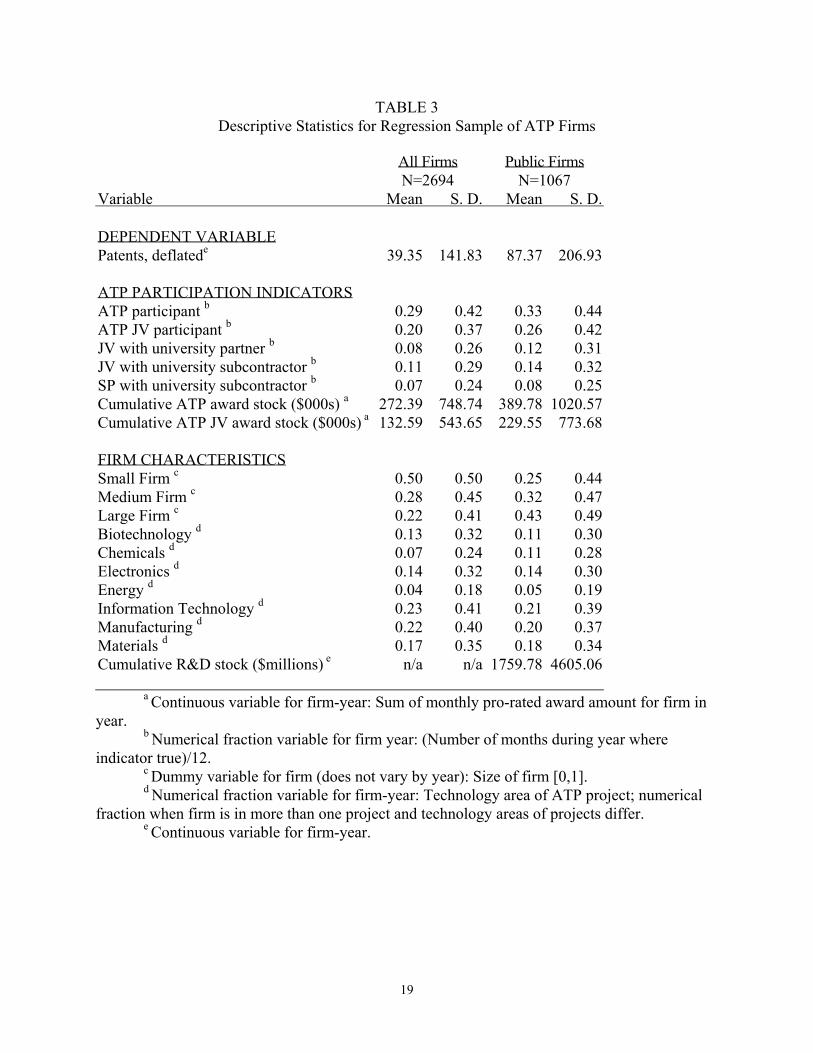
Table 3 provides descriptive statistics for the variables used in the empirical analysis for
three groups of ATP participants: (1) All firm participants; (2) Public firm participants, defined as
firms appearing in the Compustat database; and (3) All organization participants, including
universities and other non-profits in JV projects.
The firm size categories used are based on ATP definitions of firm size. The industry sector
categories are based on ATP definitions of the technology area of the ATP project. These industry
categories refer to the technology area of the ATP project, and are not comparable to the more
typical SIC codes.
11
IV. Empirical Results: ATP’s Effects on Firm Success
A. Effects of ATP Participation on Patenting
Our basic hypotheses concern the effects of ATP participation on patenting. First, we
hypothesize that participation in ATP projects has a positive effect on patenting at the firm level, that
is, that the benefit of ATP project participation extends beyond the project to the firm level. Second,
we hypothesize that participation in JV projects provides greater benefit to firms than participation
in Single Participant projects, so we expect the ATP participation effect on firm patenting to be
greater for firms in JVs. The argument is that JV membership expands and deepens connections
among organizations, which is “social capital” for firm innovation. Third, we hypothesize that the
effect of ATP participation on innovation, as measured by firm patenting, is greater if the firm
has a university partner or subcontractor. This hypothesis derives from studies that have shown
the importance of academe to science-driven industries (Zucker and Darby 1996, 1998; Zucker,
Darby, and Brewer 1998; Zucker, Darby, and Armstrong 1998; Jensen and Thursby 2001;
Thursby and Thursby 2002).
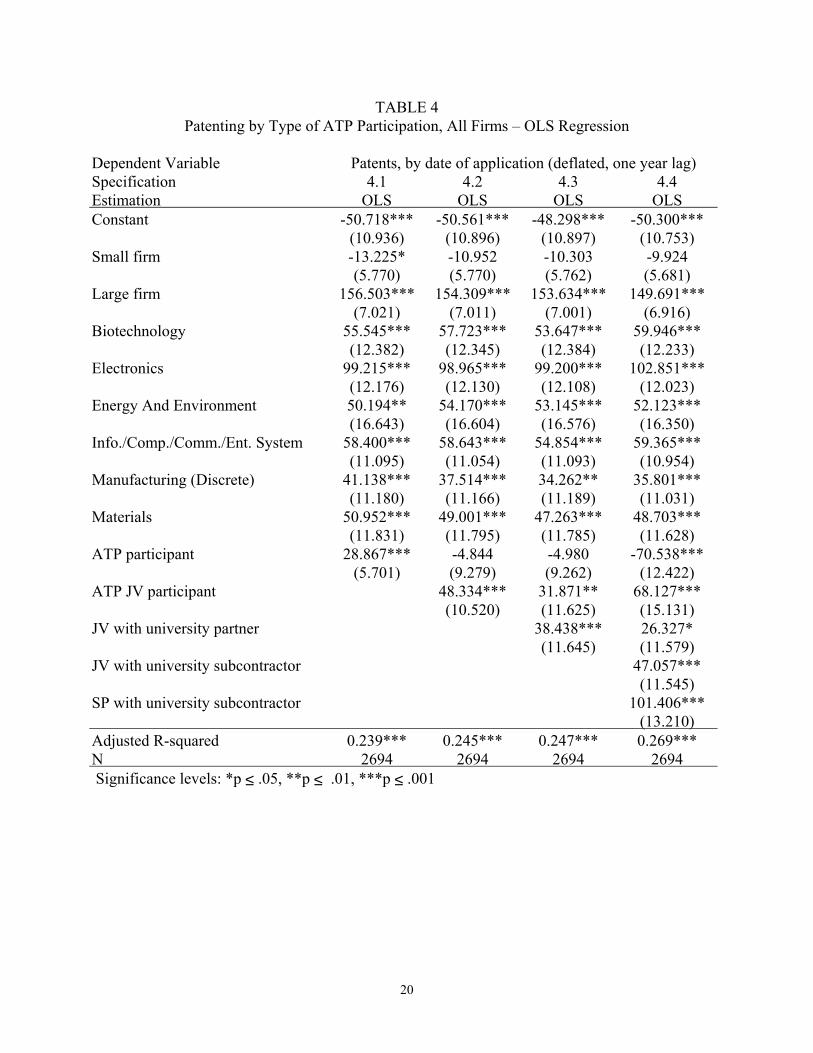
We now turn to our main analysis of the panel of all firms that began participation in
ATP by the end of 1995. In Table 4, we control for firm size and project technology area, and
then include dummy variables which describe firms’ type of ATP participation in each year. In
regression 4.1, we see that ATP participation is associated with an increase by 29 in number of
patents awarded to the firm. An increase of 29 patents represents close to a 75% increase in
patenting relative to the mean number of patents per year for firms in the sample. In regression
4.2, we see that ATP Joint Venture project participation has a positive effect relative to Single
Participant project participation. In regression 4.3, we see that Joint Ventures with a university
partner receive an additional positive effect on patenting, and in regression 4.4, we see that
university subcontractors have a positive effect on firm patenting. We conclude that Joint
Venture participation and university participation are important to higher rates of patenting by
firms in ATP projects.
12
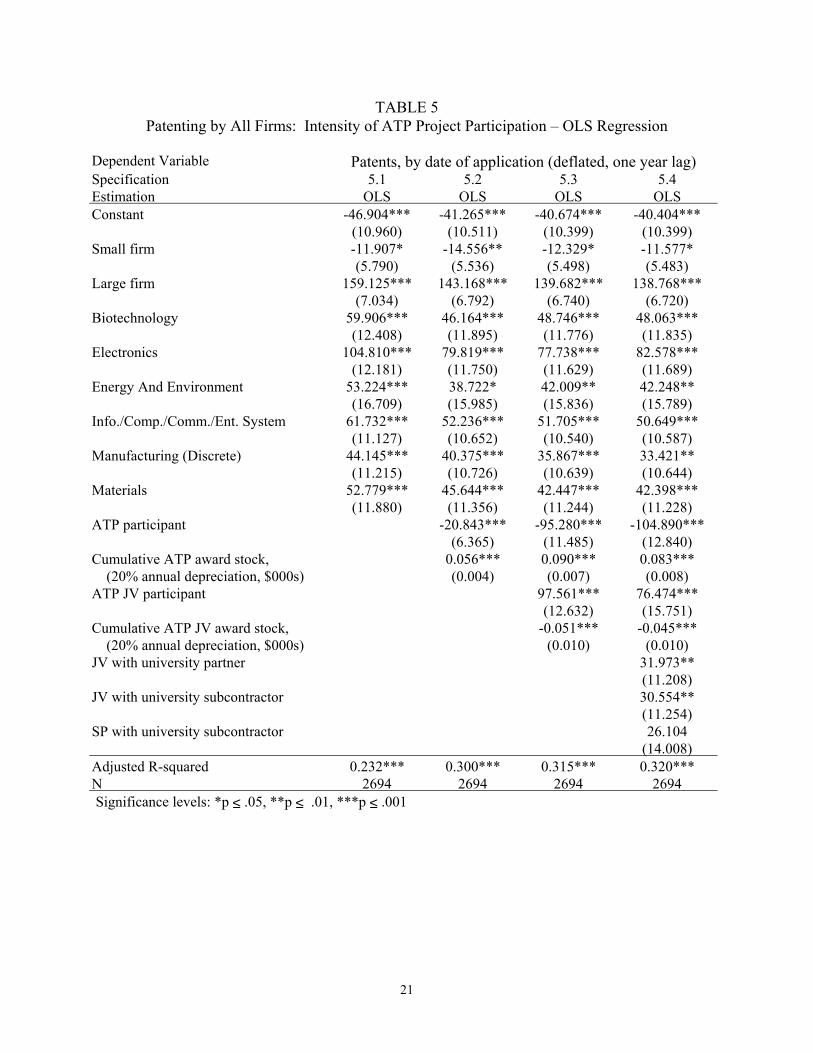
B. Separate Effects of Participation and Funding Amount
We can extend our analysis by taking into account the total amount of ATP award funds
received, and also the amount received through JV project awards. In this case, the degree or
extent of ATP participation (or the intensity of the ATP “treatment effect”) is indicated by the
amount of ATP award funding received by the firm. Following typical practice, we cumulate
these funds over time, incorporating a 20% per year depreciation rate, to create an ATP award
stock variable. For firms that have participated only in JV projects, the total award stock and JV
award stock variables will be equal, while for firms that have participated in both SP and JV
projects, the total award stock variable will sometimes be greater than the JV award stock
variable. The measured effect on patenting of an additional dollar of SP award funding is equal
to the coefficient on the total award stock variable, while the measured effect on patenting of an
additional dollar of JV award funding is equal to the sum of the coefficients on the total award
stock and JV award stock variables.
Table 5 reports results for regressions that include size and industry controls, ATP
participation and JV participation variables, ATP award stock and JV award stock variables, and
several university involvement variables. Interpreting the regression results is somewhat
complicated. First, estimates for the effect of ATP participation on patenting must be presented
by specific category of participant (e.g. JV with university partner) at the sample mean for the
category. Second, because the ATP award stock variable is a stock variable, the effect of
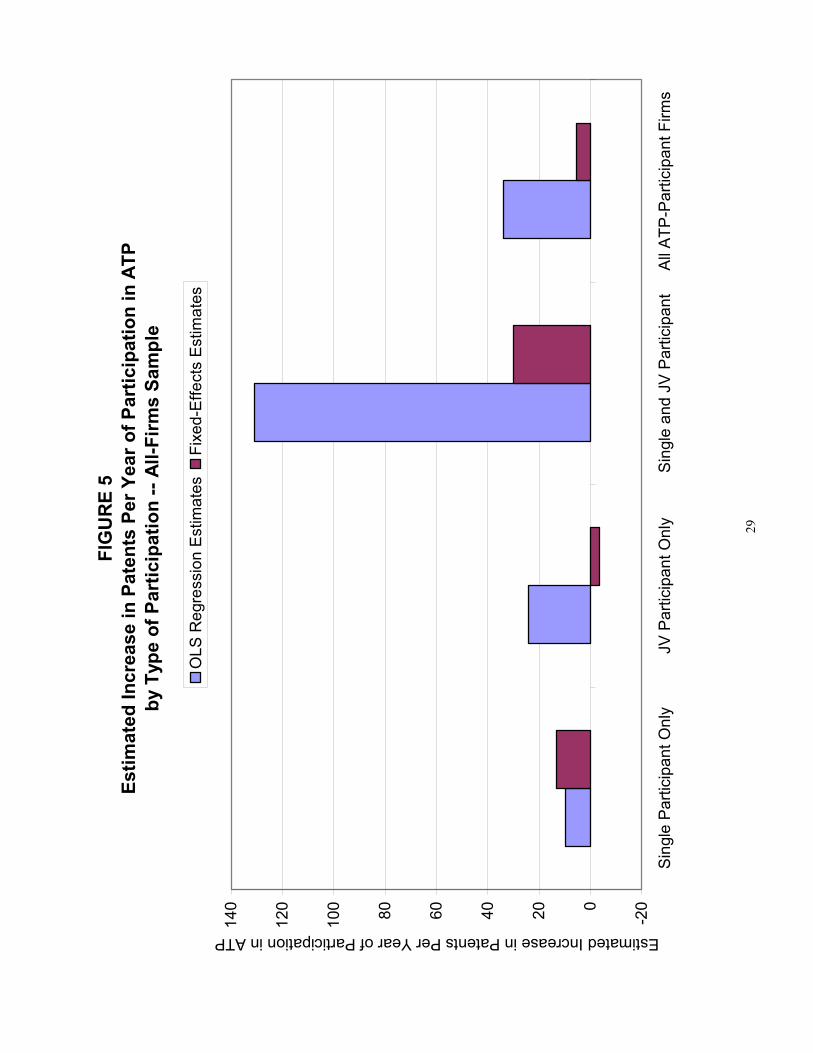
participation persists beyond the period of active participation. In Figures 5 and 6, the left bar in
each pair in Figures 5 and 6 presents a conservative interpretation of regression 5.4 by showing
the estimated increase in patenting during the sample period for the indicated groups. (The
estimates of patenting increases per year of participation are computed by multiplying the
relevant coefficients for ATP participation and award stocks by the sample means for each of the
specified groups, summing the results, and dividing by the mean number of years of
participation.) The estimate is conservative in that only about one third of the full effect from the

13
award-stock variables occurs within the sample period. Even under this conservative approach,
we estimate that the average ATP participant firm increases its patenting by 34 patents per year
of ATP participation during the sample period. Thus, even without allowing for the future effects
of the knowledge created under the ATP program, we find a very substantial effect on patenting
with one quarter of these firms’ patents during 1988-1996 attributable to ATP participation.
There is also evidence that the effect on patenting is greater for those firms that partner with
universities during their ATP participation.
Table 6 and the right bar in each pair in Figures 5 and 6 present results from similar
regressions with fixed effects for each firm instead of industry and size dummies to control for
unobserved heterogeneity. We find an average increase in patenting by 6 patents per year of ATP
participation during the sample period. This amounts to 4% of these firms’ patenting over the
entire sample period including all the years from 1988 until they began participating in ATP.
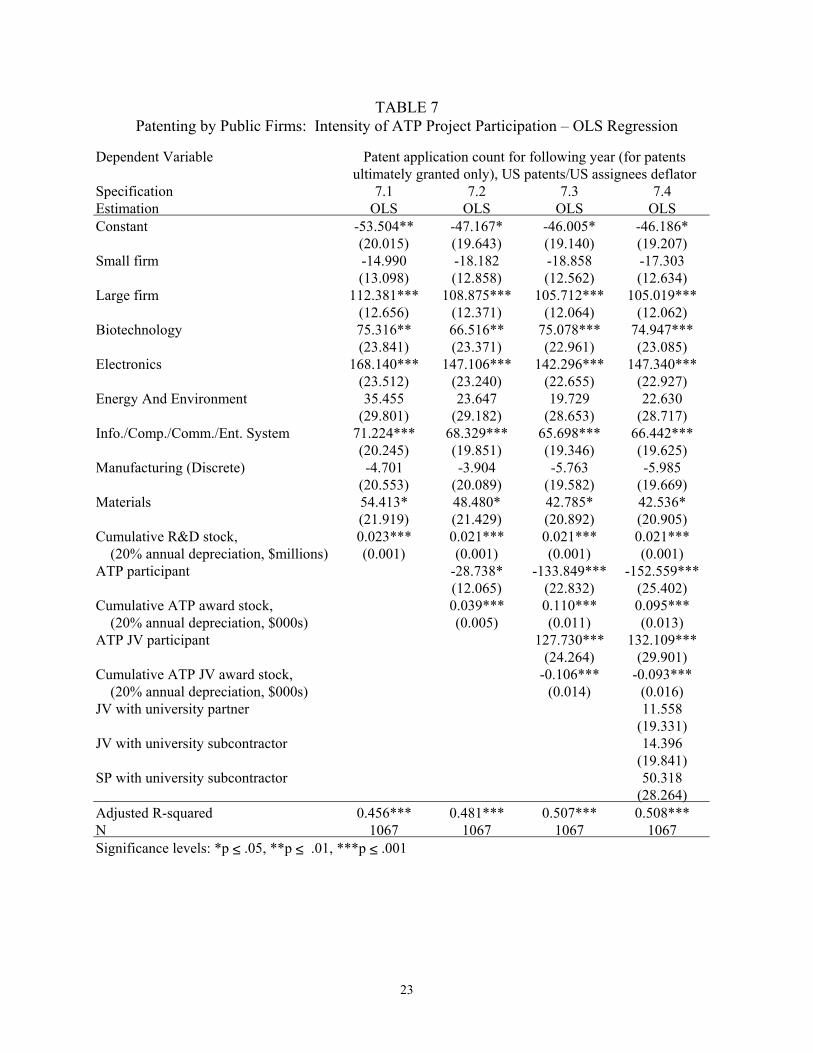
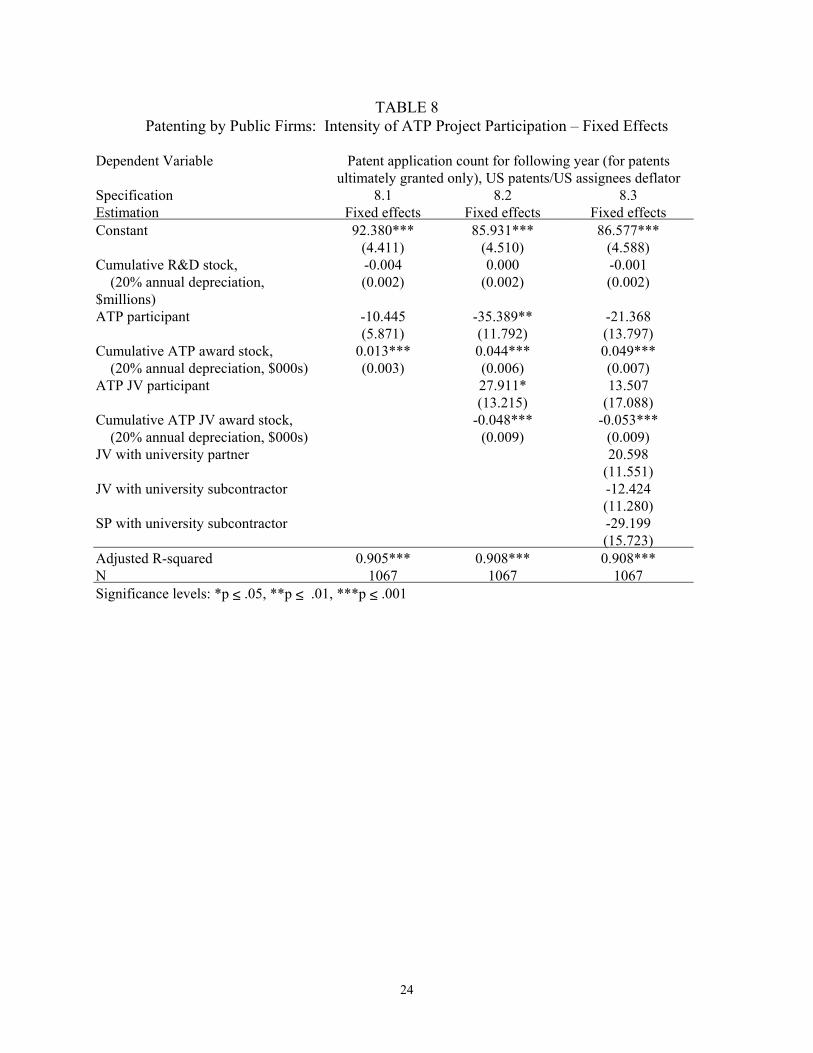
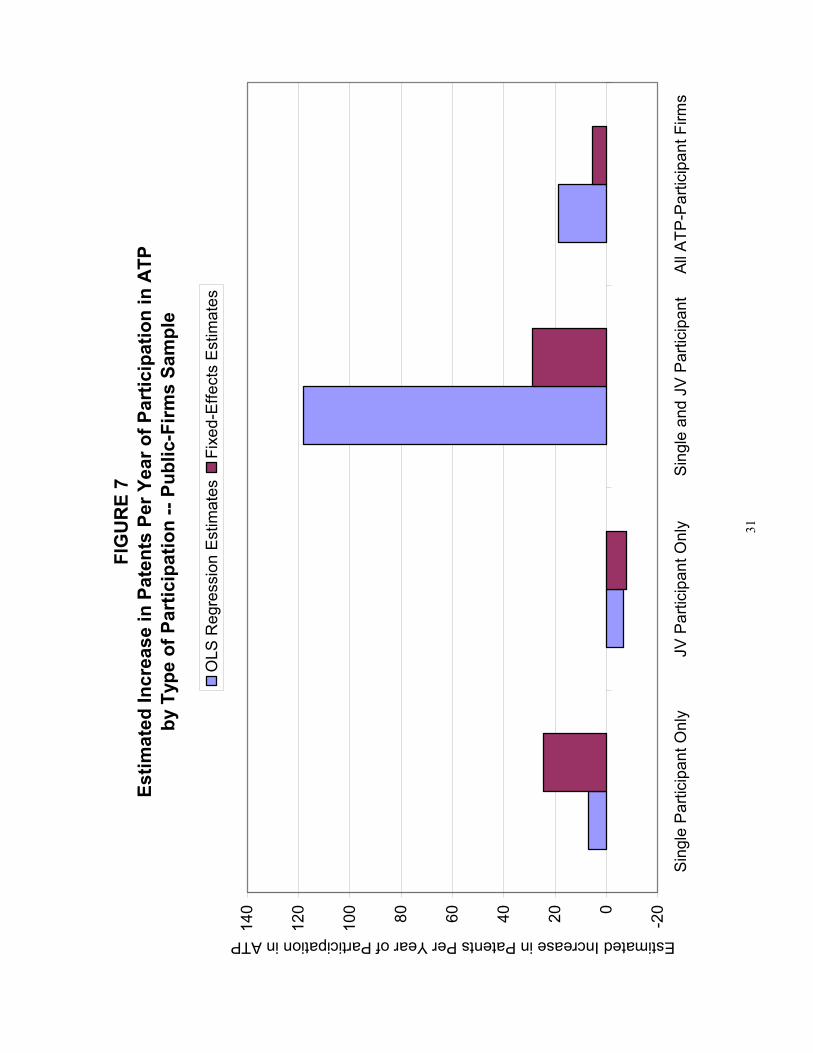
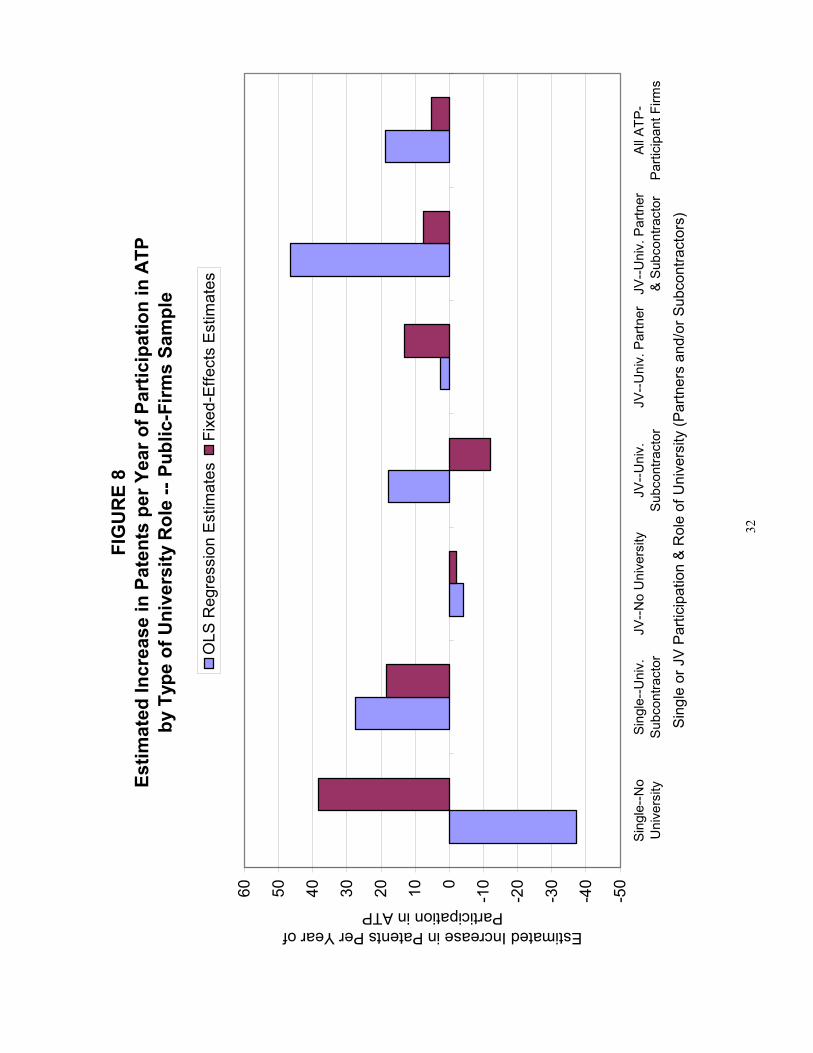
Tables 7 and 8 and the corresponding Figures 7 and 8 present results from similar
regressions for the subsample of firms that are publicly traded. For these firms we have data to
compute a cumulative R&D stock variable in the same way as the ATP award stock variable. For
these publicly traded firms, the regular and fixed-effect regressions produce estimates of increase
in patents by 19 patents and 5 patents per year of ATP participation during the sample period.
V. Conclusions and Implications
We find that patenting generally increases after ATP participation under a number of
different program and participant variations. ATP participation increases patenting on average by
between 5 and 30 patents per firm per year of participation, which represents a 4 to 25 percent
increase in firms’ patenting compared to the period before ATP participation. These estimates
are conservative since future effects from the ATP project participation are not included, even
though they are implied in our regression models. Also, joint-venture project participation and
university participation in a project both appear to have a positive impact on firm patenting. The
findings of this study support the idea that joint ventures and university collaboration have a
14
positive impact on innovation.
Positive effects of ATP on innovation in participating companies are significant and robust
in the analyses we report in this paper. Our measure of innovation—firm patents—suggests that the
effect of the ATP project spreads beyond the project and has impact on the entire firm. We may
interpret this result as evidence that ATP project participation supports firm-wide behavioral or
organizational changes which foster an increased rate innovation. Alternatively, “internal spillovers”
of knowledge or other benefits from one project to other projects may also help explain the broad
firm-wide effects of ATP participation.
This study considers the effect of program design—project structure and university
participation—on the innovation success of firm participants. The findings indicate that joint
venture collaboration and university participation have positive effect on innovation outcomes as
measured by patents. These results are interpreted from a sociological perspective that
emphasizes institution-building and social relations as essential to the innovation process. From
this perspective, ATP as a public-private partnership program fills a role in fostering the
institutions and social processes that facilitate innovation.
15
REFERENCES
Advanced Technology Program. Proposal Preparation Kit. Gaithersburg, MD: National Institute of
Standards and Technology, November 1999.
Darby, M. R., and L. G. Zucker. “Growing by Leaps and Inches: Creative Destruction, Real Cost
Reduction, and Inching Up.” Economic Inquiry, 41(1), 2003, 1-19.
Das, T. K., and B.-S. Teng. “Between Trust and Control: Developing Confidence in Partner
Cooperation in Alliances.” Academy of Management Review, 23(3), 1998, 491-512.
Doz, Y. L. “The Evolution of Cooperation in Strategic Alliances: Initial Conditions or Learning
Processes?” Strategic Management Journal, 17, 1996, 55-83.
Gould, R. V. “Collective Action and Network Structure.” American Sociological Review, 58(2),
1993, 182-196.
Granovetter, M. “The Strength of Weak Ties.” American Journal of Sociology, 78(6), 1973,
1360-1380.
Granovetter, M. “Economic Action and Social Structure: The Problem of Embeddedness.”
American Journal of Sociology, 91(3), 1985, 481-510.
Griliches, Z. "Patent Statistics as Economic Indicators: A Survey." Journal of Economic
Literature, 28(4), 1990, 1661-1707.
Hall, B. H., A. B. Jaffe, and M. Tratjenberg. "The NBER Patent Citation Data File: Lessons, Insights
and Methodological Tools." National Bureau of Economic Research Working Paper 8498,
October 2001. [Online database at http://www.nber.org/patents/]
Hamel, G. “Competition for Competence and Inter-Partner Learning within International
Strategic Alliances.” Strategic Management Journal, 12(special issue), 1991, 83-103.
Harberger, A. C. “A Vision of the Growth Process.” American Economic Rev, 88(1), 1998, 1-32.
Helper, S., J. P. MacDuffie, and C. Sabel, “Pragmatic Collaborations: Advancing Knowledge
while Controlling Opportunism.” Industrial and Corporate Change, 9(3), 2000, 443-87.
Jaffe, A. B. "Real Effects of Academic Research." American Economic Rev., 79(5), 1989, 957-970.
16
Jensen, R., and M. Thursby. "Proofs and Prototypes for Sale: The Tale of University Licensing."
American Economic Review, 91(1), 2001, 240-59.
Liebeskind, J. P., A. L. Oliver, L. G. Zucker, and M. B. Brewer. "Social Networks, Learning, and
Flexibility: Sourcing Scientific Knowledge in New Biotechnology Firms." Organization
Science, 7(4), 1996, 428-443.
Nelson, R. R., and S. G. Winter. An Evolutionary Theory of Economic Change. Cambridge, MA:
The Belknap Press of Harvard University Press, 1982.
Powell, J. W., and K. L. Lellock. Development, Commercialization, and Diffusion of Enabling
Technologies: Progress Report. Gaithersburg, MD: National Institute of Standards and
Technology, April 2000.
Thursby, J. G., and M. Thursby. “Who Is Selling the Ivory Tower? Sources of Growth in
University Licensing.” Management Science, 48(1), 2002, 90-104.
Zucker, L. G. "Production of Trust: Institutional Sources of Economic Structure, 1840-1920."
Research in Organizational Behavior, 8, 1986, 53-111.
Zucker, L. G., and M. R. Darby. "Star Scientists and Institutional Transformation: Patterns of
Invention and Innovation in the Formation of the Biotechnology Industry." Proceedings of
the National Academy of Sciences, 93(23), 1996, 12,709-12,716.
Zucker, L. G., and M. R. Darby. "Capturing Technological Opportunity Via Japan's Star
Scientists: Evidence from Japanese Firms' Biotech Patents and Products." Journal of
Technology Transfer, 26(1/2), 2001, 37-58.
Zucker, L. G., M. R. Darby, and J. Armstrong. "Geographically Localized Knowledge:
Spillovers or Markets?" Economic Inquiry, 36(1), 1998, 65-86.
Zucker, L. G., M. R. Darby, and M. B. Brewer. "Intellectual Human Capital and the Birth of U.S.
Biotechnology Enterprises." American Economic Review, 88(1), 1998, 290-306.
Zucker, L. G., M. R. Darby, M. B. Brewer, and Y. Peng. "Collaboration Structure and Information
Dilemmas in Biotechnology: Organizational Boundaries as Trust Production,” in Trust in

17
Organizations, edited by Roderick M. Kramer and Tom R. Tyler, Thousand Oaks, CA:
Sage, 1996, 90-113.
18
TABLE 1 Number of Companies Actively Participating in ATP by Panel Year
A. All Companies
Year 1988 1989 1990 1991 1992 1993 1994 1995 1996Total Organizations 232 245 260 274 285 349 349 350 350 Entrants to Panel 232 13 15 14 11 64 0 1 0 Active in ATP 0 0 0 20 71 90 117 341 319 Inactive in ATP 232 245 260 254 214 259 232 9 31
B. Public Companies Onlya
Year 1988 1989 1990 1991 1992 1993 1994 1995 1996 Total Organizations 93 96 99 108 116 122 131 151 151 Entrants to Panel 93 3 3 9 8 7 9 21 4 Firms Exiting Panelb 0 0 0 1 0 0 1 1 4 Active in ATP 0 0 0 6 36 45 56 149 137 Inactive in ATP 93 96 99 102 80 77 75 2 14
aPublic is defined as appearing in the COMPUSTAT files. bThese firms did not have R&D expenditures reported in COMPUSTAT for the indicated
years.
TABLE 2 ATP Firm Participants by Size
All Firms Public Firms N=350 N=158 Freq. % Freq. % Smalla 195 55.7 57 36.1 Mediumb 88 25.1 47 29.7 Largec 67 19.1 54 34.2
aSmall = less than 500 employees. bMedium = 500 or more employees, but less than Fortune 500 or equivalent. cLarge = Fortune 500 or equivalent
19
TABLE 3 Descriptive Statistics for Regression Sample of ATP Firms
All Firms Public Firms N=2694 N=1067 Variable Mean S. D. Mean S. D. DEPENDENT VARIABLE Patents, deflatede 39.35 141.83 87.37 206.93 ATP PARTICIPATION INDICATORS ATP participant b 0.29 0.42 0.33 0.44 ATP JV participant b 0.20 0.37 0.26 0.42 JV with university partner b 0.08 0.26 0.12 0.31 JV with university subcontractor b 0.11 0.29 0.14 0.32 SP with university subcontractor b 0.07 0.24 0.08 0.25 Cumulative ATP award stock ($000s) a 272.39 748.74 389.78 1020.57 Cumulative ATP JV award stock ($000s) a 132.59 543.65 229.55 773.68
FIRM CHARACTERISTICS Small Firm c 0.50 0.50 0.25 0.44 Medium Firm c 0.28 0.45 0.32 0.47 Large Firm c 0.22 0.41 0.43 0.49 Biotechnology d 0.13 0.32 0.11 0.30 Chemicals d 0.07 0.24 0.11 0.28 Electronics d 0.14 0.32 0.14 0.30 Energy d 0.04 0.18 0.05 0.19 Information Technology d 0.23 0.41 0.21 0.39 Manufacturing d 0.22 0.40 0.20 0.37 Materials d 0.17 0.35 0.18 0.34 Cumulative R&D stock ($millions) e n/a n/a 1759.78 4605.06
a Continuous variable for firm-year: Sum of monthly pro-rated award amount for firm in year.
b Numerical fraction variable for firm year: (Number of months during year where indicator true)/12.
c Dummy variable for firm (does not vary by year): Size of firm [0,1]. d Numerical fraction variable for firm-year: Technology area of ATP project; numerical
fraction when firm is in more than one project and technology areas of projects differ. e Continuous variable for firm-year.
20
TABLE 4 Patenting by Type of ATP Participation, All Firms – OLS Regression
Dependent Variable Patents, by date of application (deflated, one year lag) Specification 4.1 4.2 4.3 4.4 Estimation OLS OLS OLS OLS Constant -50.718*** -50.561*** -48.298*** -50.300***
(10.936) (10.896) (10.897) (10.753) Small firm -13.225* -10.952 -10.303 -9.924
(5.770) (5.770) (5.762) (5.681) Large firm 156.503*** 154.309*** 153.634*** 149.691***
(7.021) (7.011) (7.001) (6.916) Biotechnology 55.545*** 57.723*** 53.647*** 59.946***
(12.382) (12.345) (12.384) (12.233) Electronics 99.215*** 98.965*** 99.200*** 102.851***
(12.176) (12.130) (12.108) (12.023) Energy And Environment 50.194** 54.170*** 53.145*** 52.123***
(16.643) (16.604) (16.576) (16.350) Info./Comp./Comm./Ent. System 58.400*** 58.643*** 54.854*** 59.365***
(11.095) (11.054) (11.093) (10.954) Manufacturing (Discrete) 41.138*** 37.514*** 34.262** 35.801***
(11.180) (11.166) (11.189) (11.031) Materials 50.952*** 49.001*** 47.263*** 48.703***
(11.831) (11.795) (11.785) (11.628) ATP participant 28.867*** -4.844 -4.980 -70.538***
(5.701) (9.279) (9.262) (12.422) ATP JV participant 48.334*** 31.871** 68.127***
(10.520) (11.625) (15.131) JV with university partner 38.438*** 26.327*
(11.645) (11.579) JV with university subcontractor 47.057***
(11.545) SP with university subcontractor 101.406***
(13.210) Adjusted R-squared 0.239*** 0.245*** 0.247*** 0.269*** N 2694 2694 2694 2694 Significance levels: *p ≤ .05, **p ≤ .01, ***p ≤ .001
21
TABLE 5 Patenting by All Firms: Intensity of ATP Project Participation – OLS Regression
Dependent Variable Patents, by date of application (deflated, one year lag) Specification 5.1 5.2 5.3 5.4 Estimation OLS OLS OLS OLS Constant -46.904*** -41.265*** -40.674*** -40.404***
(10.960) (10.511) (10.399) (10.399) Small firm -11.907* -14.556** -12.329* -11.577*
(5.790) (5.536) (5.498) (5.483) Large firm 159.125*** 143.168*** 139.682*** 138.768***
(7.034) (6.792) (6.740) (6.720) Biotechnology 59.906*** 46.164*** 48.746*** 48.063***
(12.408) (11.895) (11.776) (11.835) Electronics 104.810*** 79.819*** 77.738*** 82.578***
(12.181) (11.750) (11.629) (11.689) Energy And Environment 53.224*** 38.722* 42.009** 42.248**
(16.709) (15.985) (15.836) (15.789) Info./Comp./Comm./Ent. System 61.732*** 52.236*** 51.705*** 50.649***
(11.127) (10.652) (10.540) (10.587) Manufacturing (Discrete) 44.145*** 40.375*** 35.867*** 33.421**
(11.215) (10.726) (10.639) (10.644) Materials 52.779*** 45.644*** 42.447*** 42.398***
(11.880) (11.356) (11.244) (11.228) ATP participant -20.843*** -95.280*** -104.890***
(6.365) (11.485) (12.840) Cumulative ATP award stock, 0.056*** 0.090*** 0.083*** (20% annual depreciation, $000s) (0.004) (0.007) (0.008) ATP JV participant 97.561*** 76.474***
(12.632) (15.751) Cumulative ATP JV award stock, -0.051*** -0.045*** (20% annual depreciation, $000s) (0.010) (0.010) JV with university partner 31.973**
(11.208) JV with university subcontractor 30.554**
(11.254) SP with university subcontractor 26.104
(14.008) Adjusted R-squared 0.232*** 0.300*** 0.315*** 0.320*** N 2694 2694 2694 2694 Significance levels: *p ≤ .05, **p ≤ .01, ***p ≤ .001

22
TABLE 6 Patenting by All Firms: Intensity of ATP Project Participation – Fixed Effects
Dependent Variable Patents, by date of application (deflated, one year lag) Specification 6.1 6.2 6.3 Estimation Fixed effects Fixed effects Fixed effects Constant 38.381*** 37.869*** 37.815***
(1.087) (1.079) (1.081) ATP participant -7.933** -26.099*** -26.423***
(2.617) (4.924) (5.663) Cumulative ATP award stock, 0.012*** 0.033*** 0.033*** (20% annual depreciation, $000s) (0.002) (0.003) (0.004) ATP JV participant 21.791*** 26.030***
(5.693) (7.306) Cumulative ATP JV award stock, -0.032*** -0.032*** (20% annual depreciation, $000s) (0.005) (0.005) JV with university partner 0.552
(5.366) JV with university subcontractor -7.500
(5.365) SP with university subcontractor 0.680
(6.540) Adjusted R-squared 0.896*** 0.898*** 0.898*** N 2694 2694 2694 Significance levels: *p ≤ .05, **p ≤ .01, ***p ≤ .001
23
TABLE 7 Patenting by Public Firms: Intensity of ATP Project Participation – OLS Regression
Dependent Variable Patent application count for following year (for patents
ultimately granted only), US patents/US assignees deflator Specification 7.1 7.2 7.3 7.4 Estimation OLS OLS OLS OLS Constant -53.504** -47.167* -46.005* -46.186*
(20.015) (19.643) (19.140) (19.207) Small firm -14.990 -18.182 -18.858 -17.303
(13.098) (12.858) (12.562) (12.634) Large firm 112.381*** 108.875*** 105.712*** 105.019***
(12.656) (12.371) (12.064) (12.062) Biotechnology 75.316** 66.516** 75.078*** 74.947***
(23.841) (23.371) (22.961) (23.085) Electronics 168.140*** 147.106*** 142.296*** 147.340***
(23.512) (23.240) (22.655) (22.927) Energy And Environment 35.455 23.647 19.729 22.630
(29.801) (29.182) (28.653) (28.717) Info./Comp./Comm./Ent. System 71.224*** 68.329*** 65.698*** 66.442***
(20.245) (19.851) (19.346) (19.625) Manufacturing (Discrete) -4.701 -3.904 -5.763 -5.985
(20.553) (20.089) (19.582) (19.669) Materials 54.413* 48.480* 42.785* 42.536*
(21.919) (21.429) (20.892) (20.905) Cumulative R&D stock, 0.023*** 0.021*** 0.021*** 0.021*** (20% annual depreciation, $millions) (0.001) (0.001) (0.001) (0.001) ATP participant -28.738* -133.849*** -152.559***
(12.065) (22.832) (25.402) Cumulative ATP award stock, 0.039*** 0.110*** 0.095*** (20% annual depreciation, $000s) (0.005) (0.011) (0.013) ATP JV participant 127.730*** 132.109***
(24.264) (29.901) Cumulative ATP JV award stock, -0.106*** -0.093*** (20% annual depreciation, $000s) (0.014) (0.016) JV with university partner 11.558
(19.331) JV with university subcontractor 14.396
(19.841) SP with university subcontractor 50.318
(28.264) Adjusted R-squared 0.456*** 0.481*** 0.507*** 0.508*** N 1067 1067 1067 1067 Significance levels: *p ≤ .05, **p ≤ .01, ***p ≤ .001
24
TABLE 8 Patenting by Public Firms: Intensity of ATP Project Participation – Fixed Effects
Dependent Variable Patent application count for following year (for patents
ultimately granted only), US patents/US assignees deflator Specification 8.1 8.2 8.3 Estimation Fixed effects Fixed effects Fixed effects Constant 92.380*** 85.931*** 86.577***
(4.411) (4.510) (4.588) Cumulative R&D stock, -0.004 0.000 -0.001 (20% annual depreciation, $millions)
(0.002) (0.002) (0.002)
ATP participant -10.445 -35.389** -21.368 (5.871) (11.792) (13.797)
Cumulative ATP award stock, 0.013*** 0.044*** 0.049*** (20% annual depreciation, $000s) (0.003) (0.006) (0.007) ATP JV participant 27.911* 13.507
(13.215) (17.088) Cumulative ATP JV award stock, -0.048*** -0.053*** (20% annual depreciation, $000s) (0.009) (0.009) JV with university partner 20.598
(11.551) JV with university subcontractor -12.424
(11.280) SP with university subcontractor -29.199
(15.723) Adjusted R-squared 0.905*** 0.908*** 0.908*** N 1067 1067 1067 Significance levels: *p ≤ .05, **p ≤ .01, ***p ≤ .001
25
FI
GU
RE
1N
umbe
r of P
roje
cts
and
Firm
Par
ticip
ants
and
C
umul
ativ
e N
umbe
r of U
niqu
e AT
P Fi
rm P
artic
ipan
ts
050100
150
200
250
300 19
9119
9219
9319
9419
9519
9619
9719
9819
99
Number of Projects and Firm Particpants
0100
200
300
400
500
600
Cumulative Number of Unique ATP Firm Participants
JV F
irm P
artic
ipan
tsSi
ngle
Par
iticp
ant P
roje
cts
JV P
roje
cts
Cum
ulat
ive
Uni
que
Firm
Cou
nt (r
ight
axi
s)

26
FI
GU
RE
2AT
P Pr
ojec
ts a
nd P
artic
ipan
tsby
Sin
gle
Part
icip
ant a
nd J
oint
-Ven
ture
Typ
e, 1
990-
1998
274
134
274
663
225
431
0
100
200
300
400
500
600
700
Sing
le P
artic
ipan
tPr
ojec
tsJo
int V
entu
rePr
ojec
tsSi
ngle
Par
ticip
ant
Proj
ects
Join
t Ven
ture
Proj
ects
Num
ber o
f Pro
ject
s
N
umbe
r of P
artic
ipan
ts
tota
l
uniq
ueor
gani
zatio
ns
27
FI
GU
RE
3D
istr
ibut
ion
of A
ll Fi
rm A
TP P
artic
ipan
ts b
y Ty
pe o
f Par
ticip
atio
n
Sing
le P
artic
ipan
t with
U
nive
rsity
Sub
cont
ract
or20
%
Sing
le P
artic
ipan
t with
No
Uni
vers
ity S
ubco
ntra
ctor
11%
JV P
artic
ipan
t with
No
Uni
vers
ity S
ubco
ntra
ctor
16%
JV P
artic
ipan
t with
Uni
vers
ity
Subc
ontra
ctor
but
No
Uni
vers
ity P
artn
er24
%
JV P
artic
ipan
t with
Uni
vers
ity
Partn
er b
ut N
o U
nive
rsity
Su
bcon
tract
or8%
JV P
artic
ipan
t with
Bot
h U
nive
rsity
Par
tner
and
U
nive
rsity
Sub
cont
ract
or21
%
28
FIG
UR
E 4
ATP
Part
icip
ants
by
Prim
ary
Indu
stry
and
Par
ticip
atio
n Ty
pe
0102030405060
Biotec
h.
Chemica
ls
Electro
nics
Energy
/Envnt.
Info./
Comp.
Manuf.
Materia
lsSi
ngle
Par
ticip
ant (
No
Uni
vers
ity In
volv
emen
t)Si
ngle
Par
ticip
ant w
ith U
nive
rsity
Sub
cont
ract
orJo
int V
entu
re (N
o U
nive
rsity
Invo
lvem
ent)
Join
t Ven
ture
with
Uni
vers
ity S
ubco
ntra
ctor
Join
t Ven
ture
with
Uni
vers
ity P
artn
erJo
int V
entu
re w
ith U
niv.
Par
tner
and
Uni
v. S
ubco
ntra
ctor
29
FIG
UR
E 5
Estim
ated
Incr
ease
in P
aten
ts P
er Y
ear o
f Par
ticip
atio
n in
ATP
by T
ype
of P
artic
ipat
ion
-- Al
l-Firm
s Sa
mpl
e
-20020406080100
120
140
Sing
le P
artic
ipan
t Onl
yJV
Par
ticip
ant O
nly
Sing
le a
nd J
V Pa
rtici
pant
All A
TP-P
artic
ipan
t Firm
s
Estimated Increase in Patents Per Year of Participation in ATP
OLS
Reg
ress
ion
Estim
ates
Fixe
d-Ef
fect
s Es
timat
es

30
FI
GU
RE
6Es
timat
ed In
crea
se in
Pat
ents
Per
Yea
r of P
artic
ipat
ion
in A
TPby
Typ
e of
Uni
vers
ity R
ole
-- Al
l-Firm
Sam
ple
-20
-100102030405060708090
Sing
le--N
oU
nive
rsity
Sing
le--U
niv.
Subc
ontra
ctor
JV--N
o U
nive
rsity
JV--U
niv.
Subc
ontra
ctor
JV--U
niv.
Par
tner
JV--U
niv.
Par
tner
& Su
bcon
tract
orAl
l ATP
-Pa
rtici
pant
Firm
s
Sing
le o
r JV
Parti
cipa
tion
& R
ole
of U
nive
rsity
(Par
tner
s an
d/or
Sub
cont
ract
ors)
Estimated Increase in Patents Per Year of Participation in ATP
OLS
Reg
ress
ion
Estim
ates
Fixe
d-Ef
fect
s Es
timat
es
31
FI
GU
RE
7Es
timat
ed In
crea
se in
Pat
ents
Per
Yea
r of P
artic
ipat
ion
in A
TPby
Typ
e of
Par
ticip
atio
n --
Publ
ic-F
irms
Sam
ple
-20020406080100
120
140
Sing
le P
artic
ipan
t Onl
yJV
Par
ticip
ant O
nly
Sing
le a
nd J
V Pa
rtici
pant
All A
TP-P
artic
ipan
t Firm
s
Estimated Increase in Patents Per Year of Participation in ATP
OLS
Reg
ress
ion
Estim
ates
Fixe
d-Ef
fect
s Es
timat
es
32
FI
GU
RE
8Es
timat
ed In
crea
se in
Pat
ents
per
Yea
r of P
artic
ipat
ion
in A
TPby
Typ
e of
Uni
vers
ity R
ole
-- Pu
blic
-Firm
s Sa
mpl
e
-50
-40
-30
-20
-100102030405060
Sing
le--N
oU
nive
rsity
Sing
le--U
niv.
Subc
ontra
ctor
JV--N
o U
nive
rsity
JV--U
niv.
Subc
ontra
ctor
JV--U
niv.
Par
tner
JV--U
niv.
Par
tner
& Su
bcon
tract
orAl
l ATP
-Pa
rtici
pant
Firm
s
Sing
le o
r JV
Parti
cipa
tion
& R
ole
of U
nive
rsity
(Par
tner
s an
d/or
Sub
cont
ract
ors)
Estimated Increase in Patents Per Year of Participation in ATP
OLS
Reg
ress
ion
Estim
ates
Fixe
d-Ef
fect
s Es
timat
es
33
TECHNICAL APPENDIX FOR
UNIVERSITIES, JOINT VENTURES, AND SUCCESS IN THE ADVANCED TECHNOLOGY PROGRAM
MICHAEL R. DARBY, LYNNE G. ZUCKER, and ANDREW WANG
Contents of the Technical Appendix A.1. Criteria for Inclusion in Sample and Construction of Industry Categories 34
A.2. Panel: Construction of the Panel and Integration of Merger/Acquisition & Founding 36
A.3. Variable Construction 38
A.4. Data Sources 40
A.5. Additional Empirical Results 40
A.6. Additional References for the Technical Appendix 42
Appendix Tables A1-A7 43
Appendix Figures A1-A4 48

34
Technical Appendix
We elaborate on five topics: (1) Criteria for inclusion in sample and technology areas; (2)
Technical details on construction of the panel, including an overview of the panel construction
process; (3) Variable construction; (4) Outline of data sources; and (5) Additional empirical
results.
A.1. Criteria for Inclusion in Sample and Construction of Industry Categories
Criteria for Inclusion in Sample
Table A1 summarizes the criteria we used to select eligible participants. For our main
analysis we selected firms only, because of the heterogeneity among non-profit ATP participants
and the fact that all are in JVs. In Appendix A.5 below, we briefly examine all organizations
that are ATP participants to check for potential bias in our results. Second, the ATP participant
must be involved in research and development, excluding joint venture participants that served
only administrative functions. Third, we exclude participants involved in projects that were
cancelled before completion. Fourth, the project must have started by the end of 1996, in order
to have multiple years of ATP participation for participants entering late in the period. Fifth, we
determined year of founding for each firm (universities and other non-profits were assumed to be
“born” by 1988 since there is no reliable data available). Firms enter the panel when founded or
in 1988 if founded before that date in order to be able to distinguish whether no patenting in a
given year meant that the organization did not yet exist or was in fact not patenting that year.
Sixth, still referring to Table A1, we selected 1988 as the starting observation year for
firms already founded to provide some pre-ATP observations even for firms entering in the first
ATP cohort (1991) and end the panel in 1996 because we use the number of patents, by year of
35
application, for patents already granted (the US Patent and Trademark office releases no
information on patents applied for but not yet granted). By 1997, the count of patent
applications becomes truncated because many have yet to emerge from the process given that
our patents granted data ends June 30, 1999.
Table A2 presents the number of organizations in the panel and whether or not they are
active in ATP by year. This table corresponds to panel A of Table 1, with the difference between the
two accounted for by universities and other non-profit organizations.
Construction of Industry Categories: Technology Area of ATP Project
As discussed in the text, when examining both public and privately held firms it is
difficult to develop an industry code for the privately-held firms that will match, or even
integrate well, with those customarily used for public firms. High technology industry codes,
developed and used in the venture capital industry, do not mesh sufficiently well with SIC codes;
industry categories available in data bases on public firms are not available for privately-held
companies and have the additional problem of not sufficiently identifying sub-industry
specialization across the firm. Further, universities do not have industry coding, though as
partners in ATP JV projects or as subcontractors to either JV or SP projects universities play a
significant role in firm success, as our results show. Accordingly, we used a common “work-
around” by selecting the technology areas of the ATP projects as an industry proxy. The
detailed categories are presented in Figure A1. We used the major bolded categories, except
Z0000-Other which never appeared in the source data.
ATP Participants: Intellectual Property Strategies Planned
Figure A2 presents additional detail on the distribution of intellectual property strategies
planned by ATP participants.
36
A.2. Panel: Construction of the Panel and Integration of Merger/Acquisition & Founding
Our initial problem was to identify the “patenting entity” and organize the ATP
information around that unit of analysis--not necessarily the same as the ATP participant name.
If we found no patents for a particular ATP participant, we were challenged to determine
whether it was a true zero or resulted from not tracing the appropriate patenting entity. In
practice, we found corporate lineage sometimes quite difficult to trace; further, merger activity
alters that relationship over time. Panel construction followed these steps:
Step 1: Identify the Unique Parent Organizations and Link to Patent Assignees
This step involved name cleaning and careful tracing of parent entities. We developed
and implemented code to filter names and do fuzzy matching with U.S. patent assignees,
followed by hand cleaning of the match results. We create a “variant to preferred” name list for
each ATP participant, locating for example "Regents of the University of California" for the
various UC campuses and associated federal laboratories.
Step 2: Link the ATP Organizations to Archival Firm Data and Refine “Patenting Entity”
Our refined list of “variant to preferred” names were then matched in to a very large data
set of archival business information about US firms, including venture capital and new issues to
cover both privately-held and public firms. These matches helped to identify additional variant
names, leading to better selection of the preferred name for the firm.
Step 3: Determine the Birth Year for ATP “Patenting Entity”
An organization doesn’t patent before it is founded, except under very unusual
circumstances (working in a garage with a “virtual firm”). A firm enters the panel after it is
founded. We used firm web sites or resources such as CorpTech and other archival listings of
firms. For firms where we could not find a birth date (less than 10% of the total, and only small
firms), we make the uniform assumption that the firm was born two years prior to its first ATP
37
participation (see Tables 1 and A2 for births post-1988 entry/birth data). It would be ideal to
also clean for firm death, but we did not have sufficient information. We assumed that
universities and other non-profits existed throughout the period; once again, our information was
too sparse to check this except for universities (and all existed throughout the panel).
Step 4: Determine “Patenting Entities” that Changed Identity With Merger/Acquisition
We used the SDC merger and acquisitions database, coupled with firms’ web sites, to
determine the date of acquisition 1988 to 1997, and then determined if the “patenting entity”
remained the same after the acquisition/merger or changed. Those that did not change required
no adjustment, but those that did meant that we merged the two company patenting records from
the beginning of the panel or founding (if later) in order to track the same entity over time. We
cannot determine exactly which patents published after the purchase or attributable to the
acquired firm, and which patents are attributable to the acquiring firm. In some cases this means
we also modify the birth year for this ATP parent. Table A3 presents these data, showing the
total number of mergers and acquisitions and then breaking out the number that still patent under
their “old” name and the number that do not—but patent under the new parent name. Among
new “patenting entity” parents, it is interesting to note that a sizeable proportion were also ATP
recipients, suggesting an interesting question for further research.
Deflated Patents
Our framework for analysis of ATP effects rests on measurement of changes in patent
applications made by companies (for patents that are later granted) during the period they are active
ATP participants and are receiving ATP funding.
The overall rate of patenting is affected by the value of patents and the ease of obtaining
them (Griliches, 1992). In recent years Congress and the courts have strengthened patent rights
and the U.S. Patent and Trademark Office has hired more patent examiners. As a result, both the
38
rate of patent application and the speed with which patents are granted have increased. Thus, a
simple before and after comparison is subject to criticism as reflecting trend increases rather than
any real effect.
Accordingly, we developed a “deflated” patent-count measure, which corrects for year-
to-year changes in the average number of patents issued to all U.S. assignees of U.S. patents.
We use 1996 as our base year. If there were 2.0 patents per assignee in 1996 and 2.4 patents per
assignee in some other year, firms in our sample that increased by 20% in that year compared to
the base year would show no change in deflated patents. A firm would have to have 1.32 times
as many patents to be credited with a 10% increase (1.32/1.2 = 1.1) and a firm that increased
patenting by 10% would be credited with an 8.3% decrease in deflated patents (1.1/1.2 = 0.917).
. Figure A3 reports data by application year on the total number of U.S. patents granted (up to
June 30, 1999) with a U.S. assignee at issue and the corresponding deflated patents. Note that
the values for 1996 and 1997 show that our procedure also corrects for truncation problems.
Zucker, and Darby (2003) discuss the deflation procedure in detail and examine several
alternative deflators.
Figure A4 shows that our method of deflation does not alter the basic comparison of
patenting rates before and after ATP participation. Deflation is preferred to including year
dummies in our regression analysis because the logged form of the equation (required to use year
dummies for widely different sized firms) requires us to make the implausible assumption that a
$2 million ATP award has the same percentage effect on patenting in a 10-person startup firm
and large technology firms with hundreds of patents per year.
A.3. Variable Construction
To construct panel data, all of the ATP program variables were divided into monthly
39
proportions, and then summed for the given year. For continuous variables, such as firm ATP
award, this entailed first dividing the money that the firm is awarded into monthly allocations
based on the duration of the project. If a firm is in more than one project in any given month,
then the firm's amount for that the month is the sum of the monthly allocation for these separate
projects. For ratio variables, such as ATP participation, we started by creating dummy variables
for each month. For instance, if a firm is in the ATP in March 1994 we give it a value of one for
ATP participation for that month. This value is always zero or one, regardless of how many
projects the firm is in simultaneously. We then sum these monthly dummy variables for each
year, and divide by 12, thus getting the fraction of the year that the firm is an ATP participant.
More generally: Some ATP organizations are in multiple projects, which means all the
organization’s separate involvements are consolidated when they overlap within the same year.
For example, the award amount variable in 1995 for a firm in two simultaneous projects in that
year is the sum of the money given to the firm in both projects that year. This also means, for
instance, that a single observation can be both a single applicant and a JV member in any given
year.
The unit of observation in the panels is the firm/year, but we construct those variables
from monthly observations because ATP projects are started throughout the year. With this
method, therefore, we do not overvalue ATP variables for a firm in 1995 whose project did not
start until November. For example, the values of ATP variables for this firm would be one sixth
(2 months/12) of their value if the firm were involved in the program all 12 months in the year.
We convert dollar amounts (i.e., the ATP and JV award dollars, as well as R&D
expenditures for public firms) to 1996 dollars by dividing by the Bureau of Economic Analysis’s
Chain-type Price Index for Gross Domestic Product (1996 = 1.000) downloaded from the BEA
site on July 17, 2000.
40
A.4. Data Sources
The data used in this paper come from a variety of sources, all of which except the NIST
web site are “limited use” data licensed specifically to UCLA or to Zucker and Darby as
Principal Investigators. Data about Advanced Technology Program (ATP) participants and
projects was provided by Jeanne W. Powell at ATP (limited use data) and from our own data
collection from the NIST web site. We used COMPUSTAT data for firm R&D expenditures.
Our patent data (patent applications for eventually granted patents) come from two different
sources: Hall, Jaffe, and Tratjenberg (2001) patent database through 1996 and from the UCLA-
CISTCUP patent files for 1997-June 1999. To track individual companies over time, we used
data on year of founding and identity of corporate parent, as well as dates of mergers and
acquisitions, from three major data series under separate license to UCLA from the Securities
Data Corporation (SDC), two supported by UC and CISTCP at UCLA and one supported by
ATP/NIST.
A.5. Additional Empirical Results
Chi-squared Tests for Constrained Coefficients in Tables 5-8
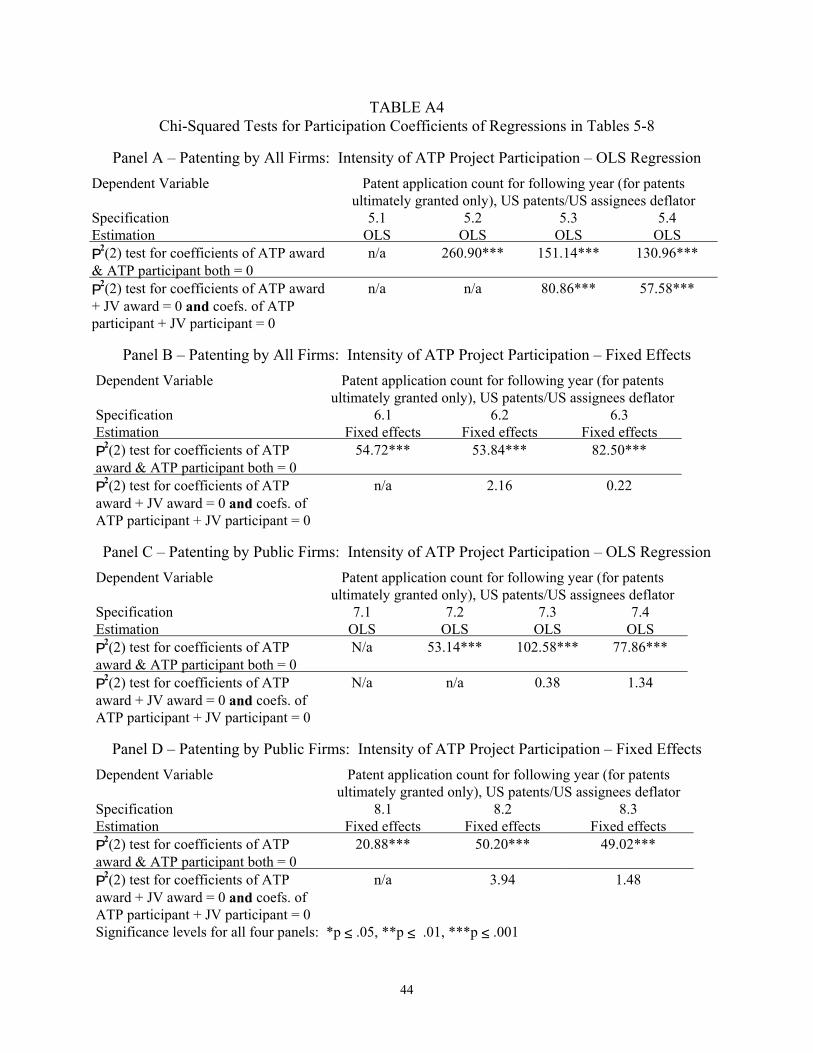
Table A4 presents the χ2 tests for the hypothesis that both the coefficient of the ATP
award and the coefficient of the ATP participant are simultaneously equal to zero in the
regressions reported in Tables 5-8. In every case this hypothesis is rejected at the 0.001
confidence level providing evidence that even where the signs are in opposite directions the net
impact of involvement in ATP is significantly different from 0.
Table A4 also presents the χ2 tests for the hypothesis that the coefficient of the ATP
award, the coefficient of the ATP participant, the coefficient of the JV award, and the coefficient

41
of the JV participant variables are all four simultaneously equal to zero in the regressions
reported in Tables 5-8 which contain all 4 variables. Here the results are mixed: In the
structural equations the joint hypothesis is again rejected at the 0.001 confidence level. In the
Fixed effects models, dropping all four variables does not increase the sum of squared residuals
by a statistically significant amount.
Estimates for Patenting by All Participants including Non-profit Organizations
Table A5 compares the descriptive statistics for the panel including all organizations
participating in ATP with those for the all firms and public firm panels (compare Table 3).
Table A6 estimates the results for the full sample (including university and non-profit
participants) and suggests that the full sample is rather like that for all firms.
Tobit Regressions
We experimented with Tobit regressions as a way to deal with truncation at zero so that
firms either patent so many times or not at all. The results in Table A7 are similar to the panel
and fixed effects regressions reported in the text and more difficult to interpret. Regressions
A7.1 and A7.2 are the controls only and full Tobit regressions for the all firms sample.
Regressions A7.3 and A7.4 and regressions A7.5 and A7.6 are the corresponding regressions for
the public firms and all organizations samples, respectively.
42
A.6. Additional References for the Technical Appendix
Griliches, Zvi. "The Search for R&D Spillovers." Scandinavian Journal of Economics,
94(Supplement), 1992, 29-47.
Powell, Jeanne W. Development, Commercialization, and Diffusion of Enabling Technologies,
Progress Report for Projects Funded 1993-1995. Advanced Technology Program, U.S.
National Institute of Standards and Technology NISTIR 6098, December 1997.
Zucker, Lynne G., and Michael R. Darby. “Measuring Success of ATP Participation Using
Archival Data.” Report to the Economic Assessment Office, Advanced Technology
Program, National Institute of Standards and Technology, U.S. Department of
Commerce, January 8, 2003.

43
TABLE A1 Analysis Sampling Criteria
ATP participants selected for analysis meet the following criteria: 1. Companies only first, then add Universities & non-profits. 2. Involved in ATP sponsored research and development. 3. Not involved in projects cancelled before completion. 4. Involved in a project that started work by 12/31/1995. 5. Observation years are from 1988 or the birth year of the organization, whichever is
greatest, to 1996. 6. Patent data has a one-year lead, so patent observations are from 1989 to 1997.
TABLE A2 ATP Active Organizations (Firms, Universities and Other Non-profits) by Panel Year
Year 1988 1989 1990 1991 1992 1993 1994 1995 1996Total Organizations 294 307 322 336 347 411 411 412 412 Entrants to Panel 294 13 15 14 11 64 0 1 0 Active in ATP 0 0 0 25 89 111 138 403 377 Inactive in ATP 294 307 322 311 258 300 273 9 35
TABLE A3 ATP Firms Acquired by Another Firm during Study Period
Year Total no. of
ATP firms acquired a
ATP firms acquired but still patenting independently
ATP firms acquired by another ATP firm
ATP firms acquired by a non-ATP firm and not patenting independently
1991 2 2 0 0 1992 3 2 0 1 1993 3 2 0 1 1994 2 1 1 0 1995 5 4 1 0 1996 8 5 2 1 1997 b 15 5 3 7
a Firms in the analysis sample only. Firms that first start ATP after 1995 are not included in this summary. b The dependent variable, patent application count, has a one year lead time. Therefore, although the panel ends in 1996, merger and acquisition activity in 1997 is relevant.
44
TABLE A4 Chi-Squared Tests for Participation Coefficients of Regressions in Tables 5-8
Panel A – Patenting by All Firms: Intensity of ATP Project Participation – OLS Regression
Dependent Variable Patent application count for following year (for patents ultimately granted only), US patents/US assignees deflator
Specification 5.1 5.2 5.3 5.4 Estimation OLS OLS OLS OLS P2(2) test for coefficients of ATP award & ATP participant both = 0
n/a 260.90*** 151.14*** 130.96***
P2(2) test for coefficients of ATP award + JV award = 0 and coefs. of ATP participant + JV participant = 0
n/a n/a 80.86*** 57.58***
Panel B – Patenting by All Firms: Intensity of ATP Project Participation – Fixed Effects
Dependent Variable Patent application count for following year (for patents ultimately granted only), US patents/US assignees deflator
Specification 6.1 6.2 6.3 Estimation Fixed effects Fixed effects Fixed effects P2(2) test for coefficients of ATP award & ATP participant both = 0
54.72*** 53.84*** 82.50***
P2(2) test for coefficients of ATP award + JV award = 0 and coefs. of ATP participant + JV participant = 0
n/a 2.16 0.22
Panel C – Patenting by Public Firms: Intensity of ATP Project Participation – OLS Regression
Dependent Variable Patent application count for following year (for patents ultimately granted only), US patents/US assignees deflator
Specification 7.1 7.2 7.3 7.4 Estimation OLS OLS OLS OLS P2(2) test for coefficients of ATP award & ATP participant both = 0
N/a 53.14*** 102.58*** 77.86***
P2(2) test for coefficients of ATP award + JV award = 0 and coefs. of ATP participant + JV participant = 0
N/a n/a 0.38 1.34
Panel D – Patenting by Public Firms: Intensity of ATP Project Participation – Fixed Effects
Dependent Variable Patent application count for following year (for patents ultimately granted only), US patents/US assignees deflator
Specification 8.1 8.2 8.3 Estimation Fixed effects Fixed effects Fixed effects P2(2) test for coefficients of ATP award & ATP participant both = 0
20.88*** 50.20*** 49.02***
P2(2) test for coefficients of ATP award + JV award = 0 and coefs. of ATP participant + JV participant = 0
n/a 3.94 1.48
Significance levels for all four panels: *p ≤ .05, **p ≤ .01, ***p ≤ .001
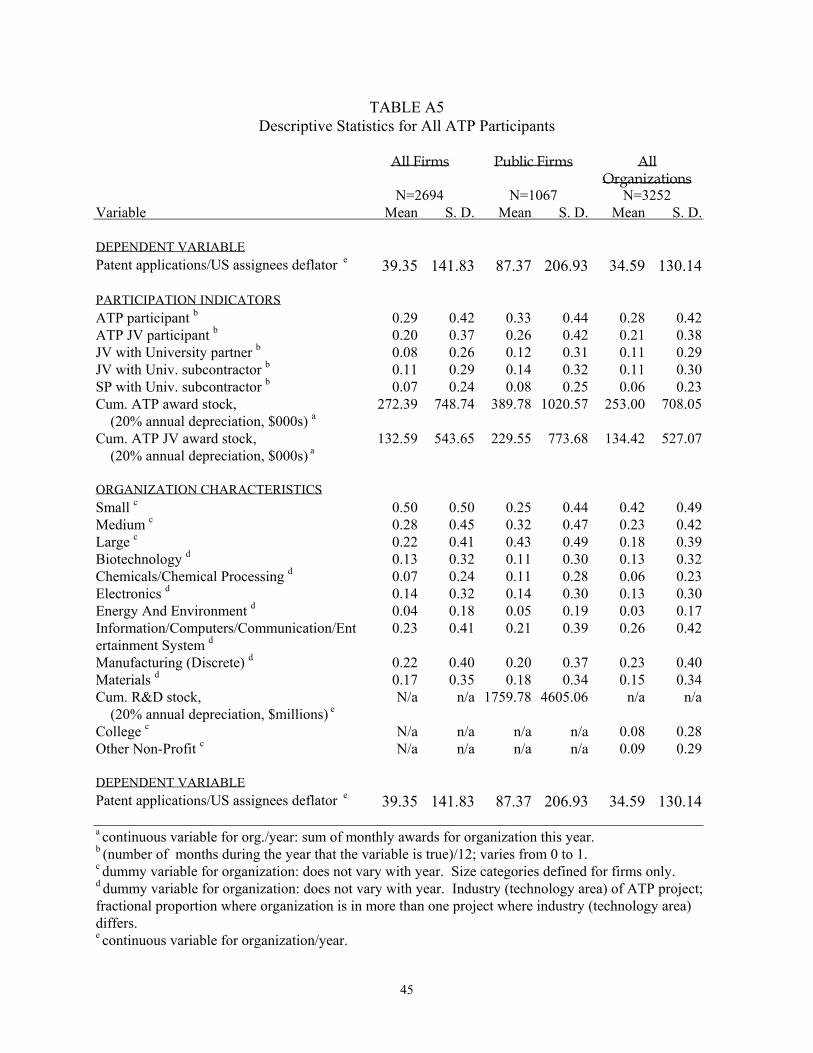
45
TABLE A5 Descriptive Statistics for All ATP Participants
All Firms Public Firms All
Organizations N=2694 N=1067 N=3252 Variable Mean S. D. Mean S. D. Mean S. D. DEPENDENT VARIABLE Patent applications/US assignees deflator e 39.35 141.83 87.37 206.93 34.59 130.14 PARTICIPATION INDICATORS ATP participant b 0.29 0.42 0.33 0.44 0.28 0.42 ATP JV participant b 0.20 0.37 0.26 0.42 0.21 0.38 JV with University partner b 0.08 0.26 0.12 0.31 0.11 0.29 JV with Univ. subcontractor b 0.11 0.29 0.14 0.32 0.11 0.30 SP with Univ. subcontractor b 0.07 0.24 0.08 0.25 0.06 0.23 Cum. ATP award stock, (20% annual depreciation, $000s) a
272.39 748.74 389.78 1020.57 253.00 708.05
Cum. ATP JV award stock, (20% annual depreciation, $000s) a
132.59 543.65 229.55 773.68 134.42 527.07
ORGANIZATION CHARACTERISTICS Small c 0.50 0.50 0.25 0.44 0.42 0.49 Medium c 0.28 0.45 0.32 0.47 0.23 0.42 Large c 0.22 0.41 0.43 0.49 0.18 0.39 Biotechnology d 0.13 0.32 0.11 0.30 0.13 0.32 Chemicals/Chemical Processing d 0.07 0.24 0.11 0.28 0.06 0.23 Electronics d 0.14 0.32 0.14 0.30 0.13 0.30 Energy And Environment d 0.04 0.18 0.05 0.19 0.03 0.17 Information/Computers/Communication/Entertainment System d
0.23 0.41 0.21 0.39 0.26 0.42
Manufacturing (Discrete) d 0.22 0.40 0.20 0.37 0.23 0.40 Materials d 0.17 0.35 0.18 0.34 0.15 0.34 Cum. R&D stock, (20% annual depreciation, $millions) e
N/a n/a 1759.78 4605.06 n/a n/a
College c N/a n/a n/a n/a 0.08 0.28 Other Non-Profit c N/a n/a n/a n/a 0.09 0.29
DEPENDENT VARIABLE Patent applications/US assignees deflator e 39.35 141.83 87.37 206.93 34.59 130.14 a continuous variable for org./year: sum of monthly awards for organization this year. b (number of months during the year that the variable is true)/12; varies from 0 to 1. c dummy variable for organization: does not vary with year. Size categories defined for firms only. d dummy variable for organization: does not vary with year. Industry (technology area) of ATP project; fractional proportion where organization is in more than one project where industry (technology area) differs. e continuous variable for organization/year.
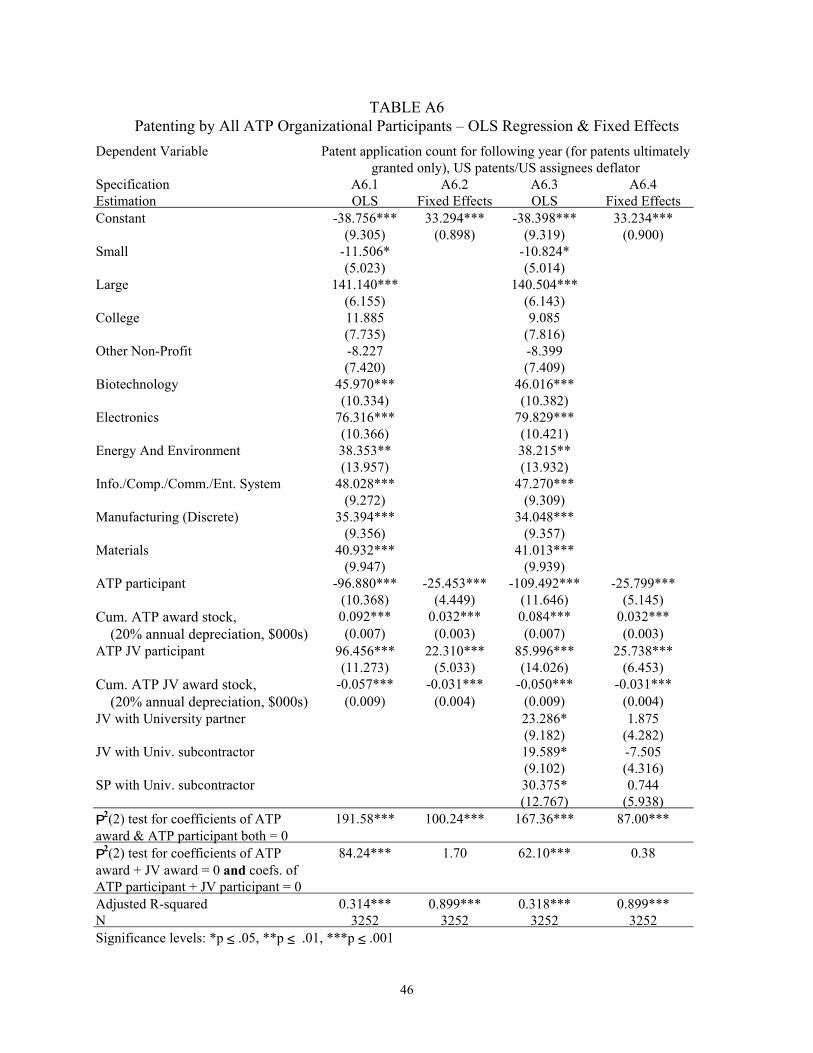
46
TABLE A6 Patenting by All ATP Organizational Participants – OLS Regression & Fixed Effects
Dependent Variable Patent application count for following year (for patents ultimately granted only), US patents/US assignees deflator
Specification A6.1 A6.2 A6.3 A6.4 Estimation OLS Fixed Effects OLS Fixed Effects Constant -38.756*** 33.294*** -38.398*** 33.234***
(9.305) (0.898) (9.319) (0.900) Small -11.506* -10.824*
(5.023) (5.014) Large 141.140*** 140.504***
(6.155) (6.143) College 11.885 9.085 (7.735) (7.816) Other Non-Profit -8.227 -8.399 (7.420) (7.409) Biotechnology 45.970*** 46.016***
(10.334) (10.382) Electronics 76.316*** 79.829***
(10.366) (10.421) Energy And Environment 38.353** 38.215**
(13.957) (13.932) Info./Comp./Comm./Ent. System 48.028*** 47.270***
(9.272) (9.309) Manufacturing (Discrete) 35.394*** 34.048***
(9.356) (9.357) Materials 40.932*** 41.013***
(9.947) (9.939) ATP participant -96.880*** -25.453*** -109.492*** -25.799***
(10.368) (4.449) (11.646) (5.145) Cum. ATP award stock, 0.092*** 0.032*** 0.084*** 0.032*** (20% annual depreciation, $000s) (0.007) (0.003) (0.007) (0.003) ATP JV participant 96.456*** 22.310*** 85.996*** 25.738***
(11.273) (5.033) (14.026) (6.453) Cum. ATP JV award stock, -0.057*** -0.031*** -0.050*** -0.031*** (20% annual depreciation, $000s) (0.009) (0.004) (0.009) (0.004) JV with University partner 23.286* 1.875
(9.182) (4.282) JV with Univ. subcontractor 19.589* -7.505 (9.102) (4.316) SP with Univ. subcontractor 30.375* 0.744
(12.767) (5.938) P2(2) test for coefficients of ATP award & ATP participant both = 0
191.58*** 100.24*** 167.36*** 87.00***
P2(2) test for coefficients of ATP award + JV award = 0 and coefs. of ATP participant + JV participant = 0
84.24*** 1.70 62.10*** 0.38
Adjusted R-squared 0.314*** 0.899*** 0.318*** 0.899*** N 3252 3252 3252 3252 Significance levels: *p ≤ .05, **p ≤ .01, ***p ≤ .001
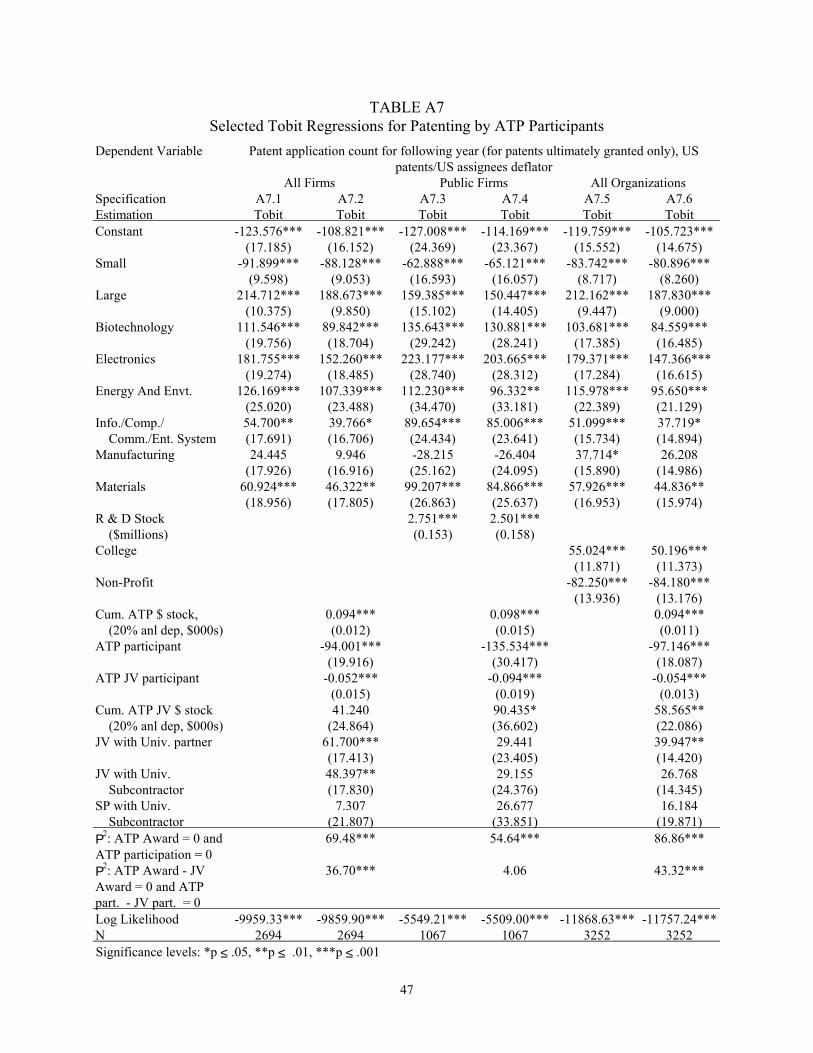
47
TABLE A7 Selected Tobit Regressions for Patenting by ATP Participants
Dependent Variable Patent application count for following year (for patents ultimately granted only), US patents/US assignees deflator
All Firms Public Firms All Organizations Specification A7.1 A7.2 A7.3 A7.4 A7.5 A7.6 Estimation Tobit Tobit Tobit Tobit Tobit Tobit Constant -123.576*** -108.821*** -127.008*** -114.169*** -119.759*** -105.723***
(17.185) (16.152) (24.369) (23.367) (15.552) (14.675) Small -91.899*** -88.128*** -62.888*** -65.121*** -83.742*** -80.896***
(9.598) (9.053) (16.593) (16.057) (8.717) (8.260) Large 214.712*** 188.673*** 159.385*** 150.447*** 212.162*** 187.830***
(10.375) (9.850) (15.102) (14.405) (9.447) (9.000) Biotechnology 111.546*** 89.842*** 135.643*** 130.881*** 103.681*** 84.559***
(19.756) (18.704) (29.242) (28.241) (17.385) (16.485) Electronics 181.755*** 152.260*** 223.177*** 203.665*** 179.371*** 147.366***
(19.274) (18.485) (28.740) (28.312) (17.284) (16.615) Energy And Envt. 126.169*** 107.339*** 112.230*** 96.332** 115.978*** 95.650***
(25.020) (23.488) (34.470) (33.181) (22.389) (21.129) Info./Comp./ 54.700** 39.766* 89.654*** 85.006*** 51.099*** 37.719* Comm./Ent. System (17.691) (16.706) (24.434) (23.641) (15.734) (14.894) Manufacturing 24.445 9.946 -28.215 -26.404 37.714* 26.208
(17.926) (16.916) (25.162) (24.095) (15.890) (14.986) Materials 60.924*** 46.322** 99.207*** 84.866*** 57.926*** 44.836**
(18.956) (17.805) (26.863) (25.637) (16.953) (15.974) R & D Stock 2.751*** 2.501*** ($millions) (0.153) (0.158) College 55.024*** 50.196*** (11.871) (11.373) Non-Profit -82.250*** -84.180*** (13.936) (13.176) Cum. ATP $ stock, 0.094*** 0.098*** 0.094*** (20% anl dep, $000s) (0.012) (0.015) (0.011) ATP participant -94.001*** -135.534*** -97.146***
(19.916) (30.417) (18.087) ATP JV participant -0.052*** -0.094*** -0.054***
(0.015) (0.019) (0.013) Cum. ATP JV $ stock 41.240 90.435* 58.565** (20% anl dep, $000s) (24.864) (36.602) (22.086) JV with Univ. partner 61.700*** 29.441 39.947**
(17.413) (23.405) (14.420) JV with Univ. 48.397** 29.155 26.768 Subcontractor (17.830) (24.376) (14.345) SP with Univ. 7.307 26.677 16.184 Subcontractor (21.807) (33.851) (19.871) P2: ATP Award = 0 and ATP participation = 0
69.48*** 54.64*** 86.86***
P2: ATP Award - JV Award = 0 and ATP part. - JV part. = 0
36.70*** 4.06 43.32***
Log Likelihood -9959.33*** -9859.90*** -5549.21*** -5509.00*** -11868.63*** -11757.24***N 2694 2694 1067 1067 3252 3252 Significance levels: *p ≤ .05, **p ≤ .01, ***p ≤ .001

48
FIG
UR
E A
1 AT
P Te
chno
logy
Are
a C
odes
B00
00 –
BIO
TE
CH
NO
LO
GY
M00
00 –
MA
NU
FAC
TU
RIN
G (D
ISC
RE
TE
)A
0000
– M
AT
ER
IAL
SB
0100
– A
nim
al &
Pla
nt B
iote
chno
logy
M
0100
– A
utom
obile
Man
ufac
turin
gA
0100
– A
bras
ives
B02
00 –
Bio
mol
ecul
ar &
Bio
mim
etic
Mat
eria
ls
M02
00 –
Airc
raft
Man
ufac
turin
gA
0200
– A
dhes
ives
B03
00 –
Bio
proc
essi
ng/B
ioen
gine
erin
g M
0300
– O
ther
Tra
nspo
rtatio
nA
0300
– C
eram
ics
B04
00 –
Bio
info
rmat
ics
Man
ufac
turin
gA
0400
– C
ompo
site
sB
0500
– H
uman
The
rape
utic
s M
0400
– S
atel
lite
Man
ufac
turin
gA
0500
– C
oatin
gsB
0600
– H
uman
Dia
gnos
tic B
iote
chno
logy
M
0500
– M
achi
ne T
ools
A06
00 –
Com
pute
r-B
ased
Des
ign
of M
ater
ials
B07
00 –
Mar
ine
Bio
logy
M
0600
– O
ther
Non
–Tra
nspo
rtatio
n,A
0700
– In
telli
gent
Pro
cess
Con
trol
B99
00 –
Oth
er B
iote
chno
logy
Equi
pmen
t Man
ufac
turin
gA
0800
– P
olym
ers
M07
00 –
Mat
eria
ls H
andl
ing
(M07
00)
A09
00 –
Pol
ymer
Fab
ricat
ion
Tech
nolo
gies
E00
00 –
EL
EC
TR
ON
ICS
M08
00 –
Inte
llige
nt M
anuf
actu
ring
A10
00 –
Met
als –
Allo
ysE0
100
– Se
mic
ondu
ctor
sM
9900
– O
ther
Dis
cret
e M
anuf
actu
ring
A11
00 –
Opt
ical
Mat
eria
lsE0
200
– Su
perc
ondu
ctor
sA
1200
– B
uild
ing/
Con
stru
ctio
n M
ater
ials
,E0
300
– M
icro
elec
trom
echa
nica
l Tec
hnol
ogy
H00
00 –
CH
EM
ICA
LS
& C
HE
MIC
AL
Not
Spe
cifie
d El
sew
here
E040
0 –
Elec
troph
otog
raph
yPR
OC
ESS
ING
(& O
ther
Con
tinuo
usA
1300
– N
on–D
estru
ctiv
e Te
stin
gE0
500
– D
ispl
ays
Man
ufac
turi
ng)
A99
00 –
Oth
er M
ater
ials
E060
0 –
Mic
roel
ectro
nic
Fabr
icat
ion
Tech
nolo
gyH
0100
– S
epar
atio
n Te
chno
logy
E070
0 –
Pack
agin
gH
0200
– C
atal
ysis
/Bio
cata
lysi
sN
0000
– E
NE
RG
Y &
EN
VIR
ON
ME
NT
E080
0 –
Elec
troni
c In
stru
men
tatio
n/Se
nsor
s &H
0300
– P
roce
ss C
ontro
lN
0100
– M
inin
g –
Dril
ling
Con
trol S
yste
ms
H04
00 –
Pol
lutio
n Pr
even
tion
N02
00 –
Ene
rgy
Res
ourc
es/G
ener
atio
nE0
900
– O
ptic
s & P
hoto
nics
H05
00 –
Pro
cess
Mod
ellin
g Te
chno
logi
esN
0300
– E
nerg
y C
onve
rsio
n (M
otor
s, G
ener
ator
s, et
c.)
E990
0 –
Oth
er E
lect
roni
csH
0600
– C
ompu
tatio
nal C
hem
istry
N04
00 –
Ene
rgy
Stor
age
H07
00 –
Com
bust
ion
Tech
nolo
gies
N05
00 –
Ene
rgy
Dis
tribu
tion/
Con
serv
atio
nI0
000
– IN
FOR
MA
TIO
N/C
OM
PUT
ER
S/H
0800
– E
ngin
eerin
g Pr
oces
s Des
ign
N06
00 –
Env
ironm
ent
CO
MM
UN
ICA
TIO
N/E
NT
ER
TA
INM
EN
TH
1000
– O
ther
Che
mic
al P
roce
ssin
gN
0900
– O
ther
Ene
rgy
& E
nviro
nmen
tSY
STE
MS
H15
00 –
Foo
d Pr
oces
sing
– P
rese
rvat
ion
I010
0 –
Com
pute
r Har
dwar
eH
9900
– O
ther
Con
tinuo
us M
anuf
actu
ring
C00
00 –
CO
NST
RU
CT
ION
I020
0 –
Com
pute
r Sof
twar
e (e
.g.,
Pulp
/Pap
er, T
extil
es)
C01
00 –
Eng
inee
ring
Scie
nce/
Stru
ctur
al M
echa
nics
I030
0 –
Des
ign
& T
est S
yste
ms
C02
00 –
Ear
thqu
ake/
Dis
aste
r Pre
vent
ion
Engi
neer
ing
I040
0 –
Imag
ing
& Im
age
Proc
essi
ngC
0300
– S
oil I
mpr
ovem
ent/S
tabi
lizat
ion
I050
0 –
Opt
oele
ctro
nics
C
9900
– O
ther
Con
stru
ctio
nI9
900
– O
ther
Info
rmat
ion/
Com
pute
rs/
Z000
0 –
OT
HE
RC
omm
unic
atio
n/En
terta
inm
ent S
yste
ms
Z000
– T
echn
olog
y A
rea
Not
Lis
ted
Abo
ve

49
FIG
UR
E A2
Inte
llect
ual P
rope
rty
Stra
tegi
es P
lann
ed
01020304050607080
Pate
nts
Cop
yrig
hts
Trad
e Se
cret
sO
ther
Sour
ce:
Jean
ne W
. Pow
ell,
NIS
TIR
609
8, D
ec. 1
997,
p. 4
1, b
ased
on
Busi
ness
Pr
ogre
ss R
epor
ts fr
om 4
80 o
rgan
izat
ions
fund
ed 1
993-
1995
.
Percent of Organizations
Prim
ary
Seco
ndar
yPo
ssib
leU
nlik
ely
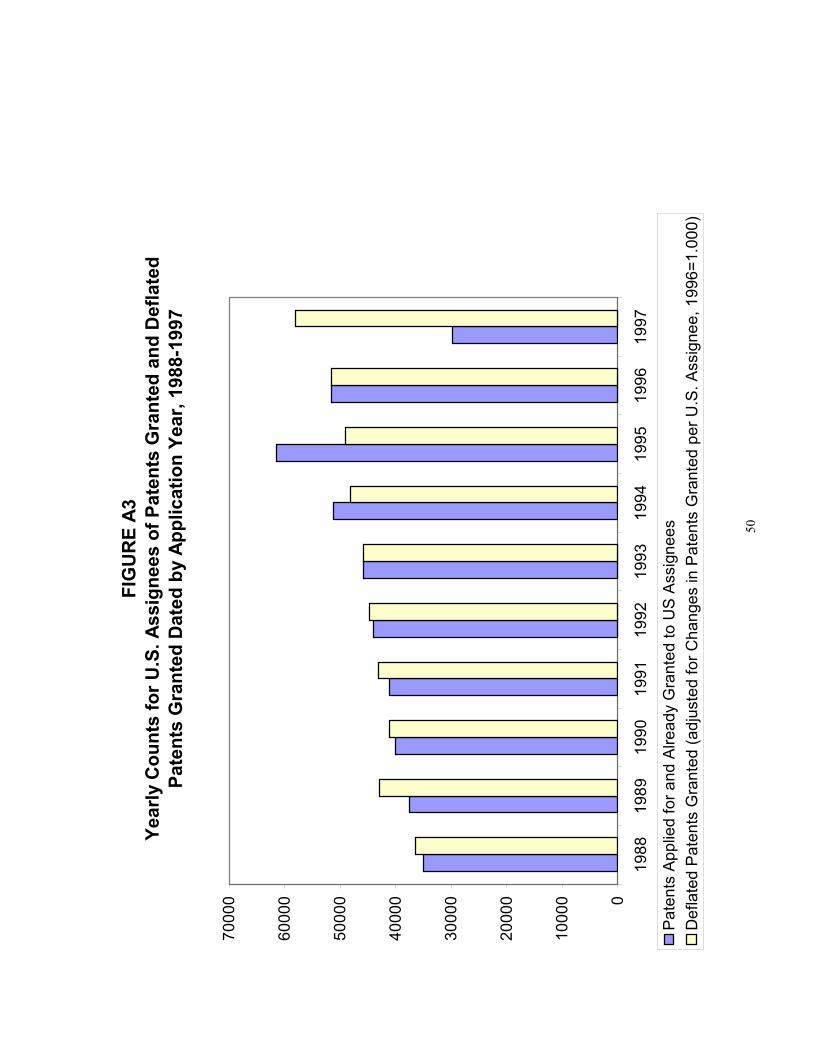
50
FIG
UR
E A3
Year
ly C
ount
s fo
r U.S
. Ass
igne
es o
f Pat
ents
Gra
nted
and
Def
late
d Pa
tent
s G
rant
ed D
ated
by
Appl
icat
ion
Year
, 198
8-19
97
0
1000
0
2000
0
3000
0
4000
0
5000
0
6000
0
7000
0
1988
1989
1990
1991
1992
1993
1994
1995
1996
1997
Pate
nts
Appl
ied
for a
nd A
lread
y G
rant
ed to
US
Assi
gnee
sD
efla
ted
Pate
nts
Gra
nted
(adj
uste
d fo
r Cha
nges
in P
aten
ts G
rant
ed p
er U
.S. A
ssig
nee,
199
6=1.
000)
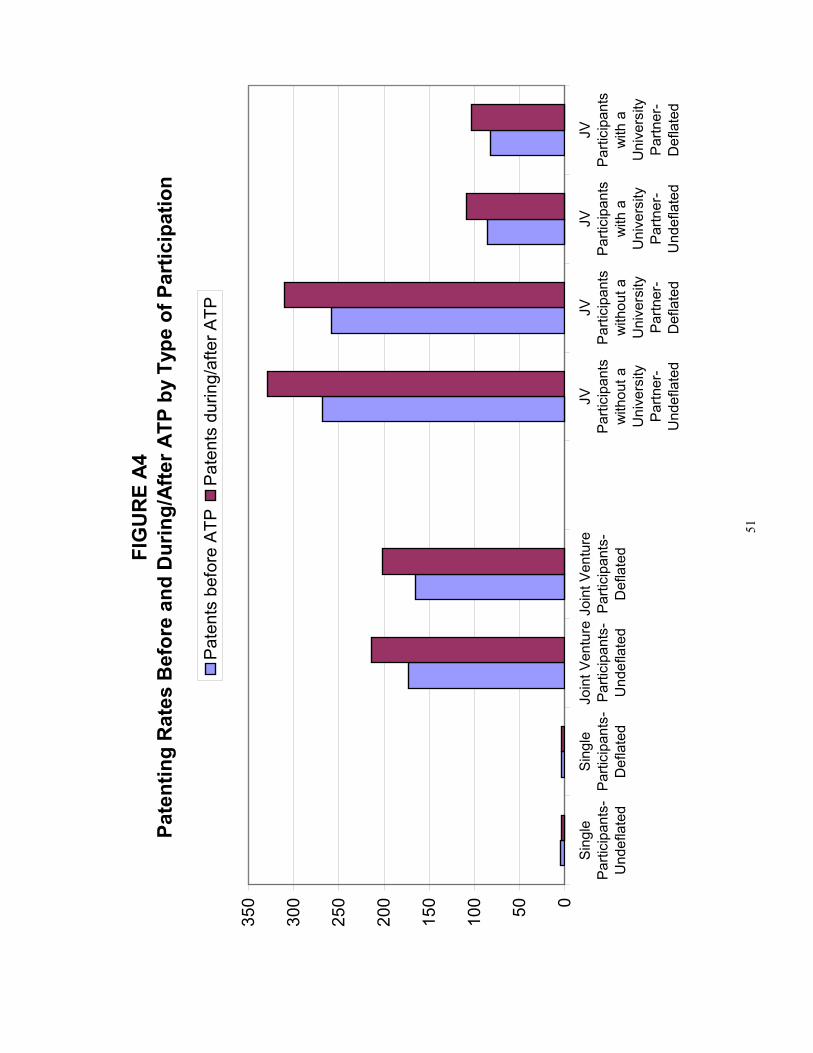
51
FIG
UR
E A4
Pate
ntin
g R
ates
Bef
ore
and
Dur
ing/
Afte
r ATP
by
Type
of P
artic
ipat
ion
050100
150
200
250
300
350
Sing
lePa
rtici
pant
s-U
ndef
late
d
Sing
lePa
rtici
pant
s-D
efla
ted
Join
t Ven
ture
Parti
cipa
nts-
Und
efla
ted
Join
t Ven
ture
Parti
cipa
nts-
Def
late
d
JVPa
rtici
pant
sw
ithou
t aU
nive
rsity
Partn
er-
Und
efla
ted
JVPa
rtici
pant
sw
ithou
t aU
nive
rsity
Partn
er-
Def
late
d
JVPa
rtici
pant
sw
ith a
Uni
vers
ityPa
rtner
-U
ndef
late
d
JVPa
rtici
pant
sw
ith a
Uni
vers
ityPa
rtner
-D
efla
ted
Pate
nts
befo
re A
TPPa
tent
s du
ring/
afte
r ATP