Embed Size (px)
Citation preview

NBER WORKING PAPER SERIES
THE SELF-EMPLOYMENTEXPERIENCE OF IMMIGRANTS
George J. Borjas
Working Paper No. 1942
NATIONAL BUREAU OF ECONOMIC RESEARCH1050 Massachusetts Avenue
Cambridge, MA 02138June 1986
The research reported here is part of the NBERs research programin Labor Studies. Any opinions expressed are those o-F the authorand not those of the National Bureau of Economic Research.

NBER Working Paper #1942June 1986
The Self-Employment Experience of Immigrants
ABSTRACT
Self-employment is an important aspect of the immigrant experience in
the labor market. Self-employment rates for immigrants exceed 15 percent
for some national groups. This paper addresses three related questions on
the self—employment experience of immigrants. First, how do self-employment
rates of immigrants compare to those of native-born men? Second, is there
an 'assimilationtt effect on the self-employment propensity of immigrants?
Finally, are the more recent waves of immigrants facing different self—
employment opportunities than the earlier waves? Using the 1970 and 1980
U.S. Censuses, the analysis shows that indeed self-employment rates of
immigrants exceed those of native-born men; that there is a strong, positive
impact of assimilation on self-employment rates; and that more recent waves
of immigrants are opting with increasing frequency for the self-employment
option.
George 3. BorjasDepartment of EconomicsUniversity of CaliforniaSanta Barbara, CA 93106

The Self-Employment Experience of Immigrants
George J. Borjas*
I. Introduction
The question of how immigrants do in the labor market has been studied
intensively in the last decade. Generally, this literature has demonstrated
that earlier waves of immigrants have higher earnings than more recent waves
and that, in addition, the earnings of immigrants who have been in the U.S.
for 10-15 years (or longer) exceed the earnings of the native-born.' Recent
work by Borjas (1985) questions the validity of the inference often made from
these cross-section studies that immigrants "assimilate" rapidly in the U.S.
labor market. In fact, by following immigrant cohorts over a decade Borjas
shows that the cross-section studies confound secular changes in cohort quality
with the assimilation process and that most of the earnings growth captured by
cross-section regressions is due to a sizable decline in the quality of
immigrants admitted to the United States in the postwar period.
Despite the important insights provided by these studies of how immi-
grants do in the labor market, a potentially significant aspect of this issue
has been ignored. In particular, it is not uncommon in the sociological
literature to assert that a major channel for immigrant assimilation has been
the ample availability of self-employment opportunities for immigrants (see,
for example, Bonacich and Nodell, 1980; and Cummings, 1980). These studies
argue that many immigrants begin their climb up the ladder of economic success
by becoming self-employed and catering to customers from the "old country,"
i.e., consumers who have similar national backgrounds and who demand products

2
where immigrants have a comparative advantage in the production process (due
perhaps to language barriers or to the familiarity with ethnic preferences).
Since all studies in the earnings determination literature discussed earlier
ignore the self-employment option and/or explicitly focus on the earnings of
salaried workers it is possible that these studies have provided an incomplete
picture of how immigrants assimilate in the labor market.
It must be noted, however, that the disinterest in the question of self-
employment among labor market participants is not restricted solely to the
immigration literature. In fact, the related questions of who are the self—
employed and how they do in the labor market have received only the most
tangential attention in labor economics.2 This disinterest could be justified
if self-employment was a numerically unimportant component of the labor
market. The summary statistics in Table 1, however, should quickly dispel
this myth. This table presents the self-employment propensities and incomes
observed in the 1980 Census for men aged 18-64 in each of 12 major racial!
ethnic/nativity groups. Among white male labor force participants, the prob-
ability of self-employment is 11.7 percent for the native-born and rises to
16.5 percent for the foreign-born. These probabilities remain above the 10
percent level for both Asian and Cuban immigrants and fall to about 8 percent
for ttother" Hispanics. The self-employment probabilities are lowest, both
among the native- and foreign-born, in the black and Mexican samples, where
they lie in the 4-5 percent range. Table 1 also shows differentials by na-
tivity status and ethnic groups in the annual incomes received by self—
employed and salaried workers. These statistics also indicate that self-
employed workers have higher annual incomes than salaried workers (although
part of these differences may be due to returns on the physical capital owned
by self-employed workers).

3
The fact that immigrants have higher self-employment propensities raises
the interesting question of exactly what it is that these individuals do in
the labor market. Table 2 sheds some light on this issue by presenting the
industrial distributions of the native- and foreign-born by self-employment
status. These statistics show that self-employed immigrant workers are
significantly more likely to be in a "retail-trade" job than native-born
self-employed workers: Over 27 percent of self-employed immigrants are in
this industry compared to 17 percent of the native-born self-employed popula-
ton. Since the retail trade industry contains such types of firms as "variety
stores", "grocery stores", and "eating and drinking places", Table 2 does
provide some support for the hypothesis that many immigrants assimilate in the
U.S. labor market by opening up small shops and catering to specialized consumer
groups.
The statistics in Tables 1 and 2, therefore, show that self-employment is a
significant activity among immigrant (and native-born) men in the labor market
and that it deserves careful study. This paper provides an initial attempt at
documenting the differences in self-employment propensities between the
native-born and the foreign-born and at analyzing the impact of assimilation
and changes in cohort quality on the self-employment experience of the immigrant
population. Section II of the paper presents the framework that will guide
the empirical analysis. Section III analyzes the self-employment propensities
of immigrants and native-born workers using the 1970 and 1980 U.S. Censuses,
while Section IV shows that the "enclave" effect is a major factor in the
creation of a gap in self-employment propensities between the foreign-born and
the native-born. Section V summarizes the results of the study.
II. Framework
In deciding whether or not to become self-employed immigrant i compares
4
the market wage he would earn as a salaried worker, w, with the expected net
income from self-employment, y. . Define the index function:
I. y. - w. = X. + v. (1)1 1 1 1 1
where X. is the vector of observable socioeconomic characteristics which1
affects y. and/or w. . If I. is positive the immigrant becomes self-employed
and is a salaried worker otherwise. The probability of self-employment is
then given by:
P. = Pr[I.>O] = Pr[v.>-X.n], (2)1 1 1 1
and the parameter vector 't can be estimated (up to a factor of proportionality)
once the stochastic nature of the disturbance v. is specified.
Little is known about the specification of the variables in the vector
X. in equation (2). It is reasonable to expect, however, that the standard
socioeconomic characteristics of education, age, marital status, etc., which
play a major role in the determination of salaries will also play a role in
the determination of self-employment incomes, and hence on the self-employment
propensity. Individuals who are self-employed differ from salaried workers
in two important respects: (1) they have a financial investment in the firm;
and (2) will bear more risk than a salaried worker. It clearly takes time and
some level of skill to raise the necessary resources for an individual to open
up his business. Thus it would not be surprising if the self-employment
propensity was positively correlated with age. In addition, to the extent
that education increases the types of skills necessary for an individual to
assess the extent of the market and the kinds of goods customers demand it
seems likely that education and self-employment rates would also be positively
related. Note, however, that both of these predictions implicitly assume

5
that marginal increases in both education and age affect self-employment
incomes by more than they affect the individual's salaried alternatives.
One type of risk that self-employed workers bear is the possibility
that their employees will shirk on the job. Harried self-employed persons
have a simple way of diminishing this type of risk: hire their spouses.
This allocation of labor within the family is optimal since both self-
employed workers will have identical incentives--the maximization of family
income or self-employment profits--and the shirking problem is thus solved.
Hence we would expect that self-employment propensities are greater for
married persons than for single persons.
As these examples illustrate interesting economic hypotheses about the
relationship between self-employment incomes (and probabilities) and standard
socioeconomic characteristics can be easily derived from basic economic
principles. Although the derivation of a complete theory of self-employment
is beyond the scope of this paper, these examples should illustrate that
important insights can be obtained from further research along these lines.
Our main interest, of course, is on the determination of self-employment
rates for immigrants, and how this process differs from the determination of
self—employment rates for native-born men. One key variable which clearly
plays a role in determining self-employment rates for immigrants is the number
of years that have elapsed since immigration, t. Since self-employment
requires a relatively large financial investment, it is unlikely that recently
arrived immigrants have the financial capability to start up a firm soon after
immigration. Hence self-employment rates and t. will be positively correlated.
In other words, as immigrants "assimilate" they are also more likely to become
self—employed. It is well known, however, that a single cross-section regression
of equation (2) will not provide estimates of this assimilation effect unless

6
it is also assumed that the ?lquality?t of immigrant cohorts has remained
stationary over the sample period. The evidence in Borjas (1985), however,
has shown that the stationarity assumption is, in fact, invalid in terms of
the market wage rate. In particular, the quality of immigrants admitted to
the U.S. has declined in the sense that more recent immigrants have lower
wage rates than earlier immigrants had at comparable stages of the assimila-
tion experience. Thus cross-section estimates of the effect of t. on the
self-employment probability confound the true assimilation impact with quality
differentials among immigrant cohorts.3
To derive a general framework that allows the identification of these
separate effects, consider the group of immigrants aged 18-54 in 1970. Using
the 1970 Census, it is convenient to partition this group into four cohorts:
arrivals in 1965—1969, arrivals in 1960-1964, arrivals in 1950—1959, and
immigrants who arrived prior to 1950. Consider next the group of immigrants
aged 28-64 in the 1980 Census. The 1980 Census data allows the partitioning
of this group of immigrants into six cohorts: arrivals in 1975-1979, arrivals
in 1970-1974, arrivals in 1965-1969, arrivals in 1960—1964, arrivals in 1950-1959,
and immigrants who arrived prior to 1950. Note that the last four cohorts
defined in the 1980 group exactly match the definitions of the cohorts from
the 1970 Census.4 Given these data, and assuming that the disturbance v.
follows a logistic distribution, two cross—section regressions can be estimated
by maximum likelihood:
=Xy70
+65D65
+a60D60
+a50D50
+a40D40
+
n(10) =Xy80
+ 75D75+ 70D70
+ 65D65+ 60D60 +
50D50
(4)+
1340D40+

7
where Pt is the probability of self-employment in Census year t , X is
a vector of socioeconomic characteristics, and the dummy variables indexing
years-since-immigration/cohort are defined by: D751 if immigrated in 1975-
1979; D70=1 if immigrated in 1970-1974; D65=l if immigrated in 1965-1969;
D60=1 if immigrated in 1960-1964; D501 if immigrated in 1950-1959; and D401
if immigrated prior to 1950. By definition, the vector X in (3) and (4)
does not contain a constant term.
Consider cohort k , where Dkl (k40,50,60,65). Let X give the mean
values of the socioeconomic characteristics for the immigrant group as of
1980. Define:
7O,k = l+exp[-(7O+k)]}'
8o,k 1+exp[-(gO+k)]1'(6)
80,k+10 = 1+exp[-(ygO+k÷lO)]} , (7)
Equations (5) and (6) give the predicted probability of self-employment
(evaluated at X) for the representative member of cohort k in 1970 and 1980,
respectively. Equation (7) gives the predicted self-employment probability
in 1980 for the cohort who arrived 10 years after cohort k . Note that
the comparison of cohort k in 1970 and cohort k+10 in 1980 holds constant
the number of years since immigration across Censuses.
Using the definitions in (5)-(7), the 1980 regression can be used to
estimate the cross-section change in the probability of self-employment over
a 10 year period (net of aging). The cross-section change in the probability
is, of course, given by 80,k 8o,k+1o . Note, however, that this term
can be rewritten as:
80,k - 80,k+10= 8o,k7o,k + 70,k80,k+10 . (8)
8
Equation (8) decomposes the cross-section change in the self-employment
probability into two parts. The first term in (8) gives the change in
the probability experienced by cohort k over the 1970-1980 decade, and
will be called the "within-cohort" change in the self-employment probability.
It is worth stressing that this within-cohort change measures the true impact
of the assimilation process on self-employment propensities. The second
term in (8) estimates the difference in P. which occurred over the decade1
for immigrants with a given number of years since immigration. Thus it
compares different cohorts at the same point of their U.S. life cycle and
will be called the "across-cohort" change in self-employment propensities.
If, for example, the quality decline experienced by immigrant cohorts has
affected mainly the level of market earnings, the "across-cohort" effect
would be negative since more recent cohorts would find self-employment more
profitable than earlier cohorts found it at comparable stages of the as-
similation experience. The existence of quality differences among immigrant
cohorts, therefore, implies that the cross-section regression provides a
biased measure of the impact of assimilation on self-employment propensities.
It should be noted, however, that the within-cohort change defined in
equation (8) can also be a biased measure of the impact of assimilation if
aggregate labor market conditions changed sufficiently between 1970 and 1980.
For instance, if economic changes over the decade led to a relative decline
in the earnings of salaried workers, the probability of self-employment will
have experienced a secular increase during the period. This aggregate shift
in the probability will bias upwards the within-cohort change and, due to
the decomposition in (8), will impart a downward bias on the across-cohort
change. One possible solution to this problem is simply to analyze the
behavior of the self-employment probability of immigrants net of the changes
9
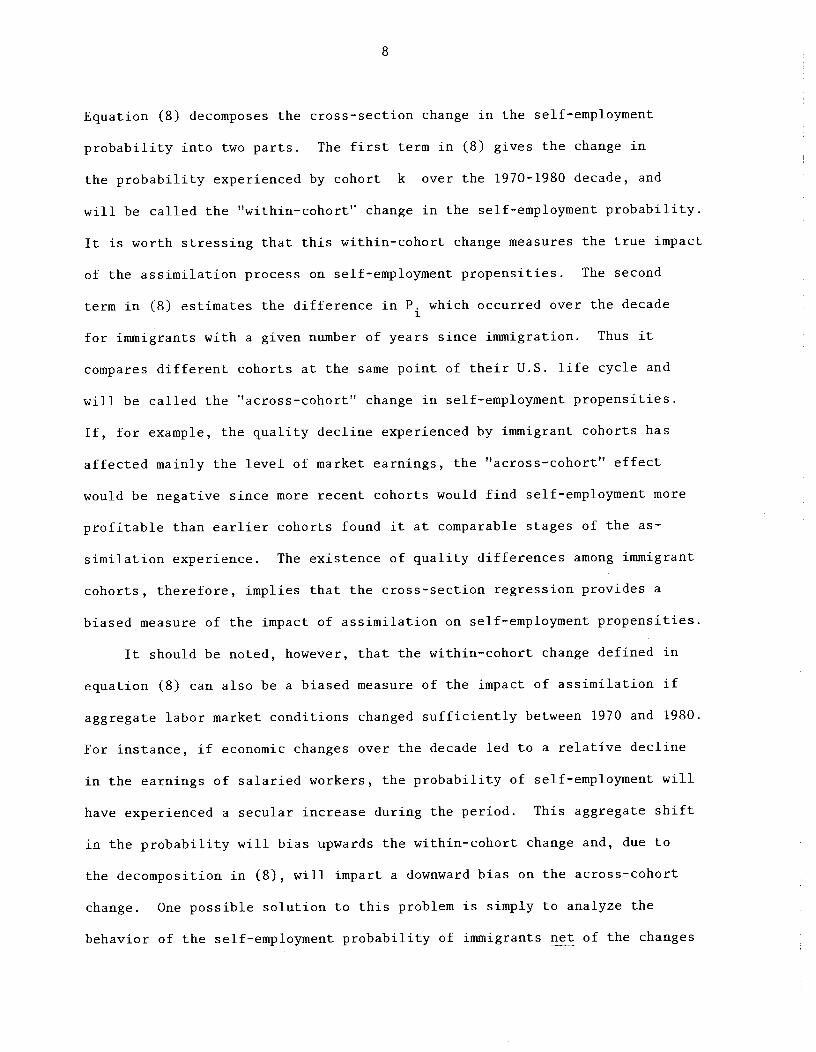
which occurred in the native-born population. Suppose the logit equations
determining self-employment propensities for the native-born are given by:
p
) = Xô + + u70 , (9)70
2n(10) Xô8 + + u80 , (10)
where the subscript nU indicates native-born status. Define the self-
employment probability of a native-born worker statistically similar to
the average immigrant by:
70,n = {1+exp[_(Ô70+)1}' . (11)
80,n = [1+exp[_(Ô80+)]I' . (12)
The decomposition of the cross-section change in the probability of self—
employment net of the secular changes occurring in the native-born population
can be written as:
80,k80,k+10 = -
8O,n7O,n1(13)
+ 7o,k8o,k÷1o-
70,n80,n
The first bracketed term in (13) gives the difference between the within—
cohort change in the self-employment probability of immigrants and the
change in that probability which occurred among native-born workers. Thus
it gives the change in self-employment propensities experienced by a specific
immigrant cohort net of the change experienced by similar native-born workers.
Likewise, the second bracketed term in (13) gives the across-cohort effect

10
net of the economy-wide changes experienced by native-born workers during
the 1970-1980 period.
III. Assimilation and Self-Employment
The data used in the analysis are drawn from the 1970 1/100 Public Use
Sample from the U.S. Census (5 percent SMSA and County Group file), and the
1980 A Sample from the U.S. Census (a 5 percent random sample of the popula-
tion). Due to the very large sample sizes in these data sets. random samples
were drawn for some of the larger groups (e.g., white natives in both 1970 and
1980, black natives in 1980, etc.).5
The analysis is restricted to male persons aged 18-54 in 1970 and 28-64
in 1980. The five sample selection rules used in both Censuses are: (1)
the individual is not in the Armed Forces; (2) the individual does not
reside in group quarters; (3) the individual is not enrolled in school;
(4) the individual worked at some point during 1969 or 1979; and (5) the
individual resides in an SHSA. This last restriction prevents the analysis
from being biased by the prevalence of self-employment in the farm sector and
by the relative absence of immigrants in rural areas. Since previous re-
search has shown that major differences in economic status exist within the
male immigrant (and native-born) labor force, the study will be conducted
separately for each of six major immigrant groups: Mexican, Cuban, other
Hispanic, Asian, white, and black, where the "white" and "black" immigrant
samples contain the observations which are neither Hispanic nor Asian.6
Finally, the definition of self-employment is drawn from the class of worker
variables in the 1970 and 1980 Censuses. An individual is classified as
self—employed if he is a self-employed worker (business not incorporated)
or if he is an employee of his own corporation. Unpaid family workers are
excluded from the analysis in this paper.

11
Before proceeding to the decomposition suggested by equations (8) and
(13) it is useful to describe the 1980 Census data in terms of a simple cross-
section regression. In particular, pool the native-born and foreign-born
samples in the 1980 Census and estimate the logit regression:
P
n (i0 = Z.y + c. (14)80
1 1
where the vector Z. includes both socioeconomic variables and the years-
since-migration vector, and the native-born sample pooled with the immigrant
samples is the immigrant's racial/ethnic counterpart in the native-born
population. The maximum likelihood estimates of equation (14) are presented
in Table 3.
These regressions show that education has a positive (and significant)
impact on self-employment rates in all the samples. This result, of course,
is consistent with the hypothesis presented earlier that higher education
levels increase the individual's ability to provide a service that other
persons may desire, or perhaps that higher education levels increases the
organizational or managerial skills of workers. Similarly, Table 3 shows
that self-employment propensities increase with potential labor force exper-
ience. The experience coefficient is positive and significant for all racial!
ethnic groups except black men. It is of interest to note that black men are
also the only group for whom there is zero correlation between marital status
and self-employment propensities. In general, married men have higher self-
employment rates, due perhaps to the fact that family-owned businesses have an
advantage over other firms in solving the shirking problem. As Table 3 shows,
however, this effect does not exist in the black male sample. This finding
probably reflects the inherent instability in the black family. Finally, the

12
regressions in Table 3 include a variable measuring the health status of the
individual (namely, if health ttlimitsf! work). Surprisingly, it is seen that
for most of the groups this variable has a positive impact on self-employment
propensities. It thus seems that the self-employment option expands the oppor-
tunities of persons with disabilities and gives them the flexibility of miti-
gating the negative labor market impacts of bad health.
The regressions in Table 3 include a vector of years-since-migration
dummies which are of more direct concern to the present study. The omitted
variable in the vector indexes if the individual is native-born. Two important
findings are evident in the table. First, self-employment probabilities are
almost always larger for immigrants than for the native-born. The exceptions
to this result are usually found in the samples of immigrants who have resided
in the U.S. fewer than 5 years. For immigrants who have resided in this
country longer than 10 years, however, Table 3 shows that, without exception,
the probability of self-employment is at least as large for immigrants as it
is for the native-born. A second important finding evident in Table 3 is that
the probability of self-employment is not monotonically increasing with years-
since-migration. For example, in the white sample the logit coefficients of
the years-since-migration dummies exhibits little variance (and, in fact, are
insignificantly different from each other) during the 1950-1975 period.
Roughly speaking, therefore, Table 3 suggests that, in the absence of quality
differences among immigrant cohorts, most of the gap in self-employment propen-
sities between the foreign-born and the native-born is created within 5-10
years after immigration. This result differs markedly from the conclusions
reached in the cross-section regression on immigrant earnings where it is
found that immigrant earnings are a monotonically increasing function of
years-since-migration.

13
However, as equations (8) and (13) make clear the cross-section regres-
sions in Table 3 say nothing about the assimilation process since they con-
found the true growth attributable to assimilation with quality differences
among immigrant cohorts. These decompositions are presented in Table 4 for 18
immigrant cohorts. Two important points should be made about the derivation
of the statistics in Table 4. First, the vector of socioeconomic character-
istics, X , held constant in the logit self-employment regressions includes
the variables: years of completed schooling; years of labor market experience
(defined by Age-Schooling-6); years of labor market experience squared; whether
or not health limits work; and whether or not married spouse present. Secondly,
to minimize the large number of parameters to be estimated by maximum likeli-
hood, and due to the large number of observations, the coefficients of the
socioeconomic variables 70' y80, 7O 680) are constrained so that 7O
= y and 670 680 = 6 . Thus the socioeconomic variables are allowed to have
a differential impact between the native- and foreign-born samples, but this
impact remained constant over the decade.7
The results in Table 4 are best understood by illustrating their deriva-
tion through an example. Consider the group of white men who arrived in
1965—1969. According to the 1980 cross-section regression, the probability of
self-employment for these men is - .0028 percentage points lower than that of
similarly skilled immigrants who arrived 10 years later.8 Thus the cross-
section regression reveals little change in self-employment propensities over
time. Using equation (8), however, this quantity can be decomposed into
within- and across-cohort changes in self-employment probabilities. This
decomposition reveals that as of 1980 this group of immigrants actually had a
self—employment probability that was 9.8 percentage points higher than in
1970. Thus the cohort experienced a significant increase in self-employment

14
propensities. Yet, at the same time, this cohort as of 1970 had a self—
employment probability that was 10.1 percentage points lower than the 1980
self-employment probability of men who arrived in 1975-1979. Thus the secular
changes in the quality mix of these immigrant cohorts have led to an increase
in self-employment propensities. In fact, the across-cohort change wipes out
the within-cohort change so that in the cross-section it appears as if years-
since-migration had no impact on the self-employment probability.
Of course, it may well be that these changes between 1970 and 1980 simply
reflect economy-wide fluctuations in self-employment incomes. The decomposi-
tion in equation (13) controls for this problem by netting out the change in
the self-employment probability achieved by the native-born group. It should
be noted, however, that the choice of the native-born reference group is
somewhat arbitrary since the immigrant population can be compared to a number
of different racial/ethnic native-born men. In this paper, each immigrant
group (except for the Cubans) is compared to its respective ethnic/racial
native-born counterpart. In the Cuban case, due to the small sample size (and
the even smaller number of self-employed Cuban unatives?t) the Cuban immigrants
are compared to white native-born men.
The last two columns of Table 4 conduct the decomposition of the cross-
section growth after netting out the change in the self-employment probabil-
ities of the native-born. In the case of the 1965-1969 white immigrant cohort,
the within-cohort change remains positive and significant and is approximately
8.1 percentage points. In other words, the self-employment probability of
white immigrants who arrived in 1965-1969 increased 8.1 percentage points
above the increased experienced by white native-born men over the 1970-1980
period. Similarly, the across-cohort change remains negative and significant
even after netting out the white native-born change so that, indeed, more

15
recent cohorts of immigrants are more likely to opt for self-employment
than earlier immigrants.
The remaining rows of Table 4 replicate the analysis for all other co-
horts in the six immigrant groups. Perhaps the major finding obtained from
these results is that there are sizable differences in the within- and across-
cohort changes experience by immigrants both within and across national groups.
In general, however, the within-cohort change in the probability of self-
employment is positive, while the across-cohort change is negative. For
instance, in the decomposition that nets out the change in P for the native-
born, 17 out of 18 within-cohort effects are positive (and 11 of these effects
have a t-ratio exceeding unity), while 14 of the across-cohort effects are
negative (with 9 of these effects having t-ratios above 1.0 in absolute value).
These results, therefore, are consistent with the hypothesis that as immigrants
assimilate in the United States the relative gains from self-employment increase.
In addition, the results in Table 3 also show the existence of a secular shift
in the relative gains of self-employment for immigrants. In other words, more
recent immigrant cohorts perceive self-employment as a relatively better employ-
ment alternative than earlier immigrant cohorts.
Thus two important substantive questions are raised by the results in Table
4. First, why does the assimilation process of immigrants involve a switch
from salaried jobs to self-employment? Second, why do more recent immigrants
find self-employment a much more profitable alternative than the earlier
waves of immigrants? With respect to the first question, it is clear that
self-employment requires a somewhat large financial investment in the firm.
It is unlikely that the most recent immigrants have accumulated the financial
resources needed to open up a business. Thus it is not too surprising to
find that, during their assimilation, immigrants switch from salaried jobs to

16
self-employment opportunities.
The second question posed above is somewhat harder to address. A possible
factor for the cohort effects is related to the analysis of Borjas (1985). One
interpretation of his findings is that salaried opportunities for recent waves
of immigrants are substantially worse than the opportunities faced by the
earlier waves of foreign-born persons. This implies that the more recent waves
of immigrants will find it relatively more profitable to enter self-employment
than the earlier waves did (at the same point of their U.S. life cycle). This,
however, raises the important question of why salaried opportunities declined
more than self-employment opportunities. A second factor which may be respon-
sible for the cohort effects in Table 4 is the change in immigrotion policy
implicit in the 1965 Immigration and Naturalization Act. This law has empha-
sized family reunification as the primary variable determining visa allocation
among potential entrants.9 Since self-employment opportunities increase
greatly when family members can join the firm, the family reunification goal
of the current law may well be playing a major role in the self-employment
cohort effects. Although the results in Table 4 cannot conclusively prove
the validity of these hypotheses, it is clear that additional research on
the self-employment of immigrants should be conducted to address these im-
portant questions.
IV. Enclaves and the Self-Employment of Immigrants
An important result in Section III was the finding that the probability
of self-employment of immigrants exceeds the probability of self-employment
of native-born men for practically all ethnic/racial groups. Although this
result can be explained in terms of the hypothesis that immigrants face
higher self-employment incomes (relative to the native-born), this explanation

17
does not really provide an understanding of y the nativity differences
arise. The sociological literature, however, has presented extensive anecdotal
evidence of how immigrants create enclaves by concentrating in specific
geographic areas, and of how these enclaves create and expand opportunities
for immigrants to become self-employed. These opportunities arise because
immigrants from a particular national group are assumed to have a comparative
advantage in serving the needs of consumers from that national group. The
comparative advantage, of course, is created by informational asymmetries
between the immigrants and the rest of the population, and these informational
asymmetries may include such factors as better knowledge of consumer preferences
and knowledge of the language spoken by the immigrant population.
This hypothesis can be easily tested by analyzing the self-employment
propensities of the three Hispanic groups (i.e., Mexicans, Cubans, and
other Hispanics) studied in the previous section. Since these three groups
are much more homogeneous in culture and language than the three other
groups analyzed earlier (namely, whites, blacks and Asians), it is likely
that enclaves of Hispanics may have opened up self-employment opportunities
for Hispanic immigrants. Formally, the enclave hypothesis can be tested
by estimating the regression:
= Zy + h + (15)
where Z. is a vector of socioeconomic characteristics, and is the fraction
of the SMSA's population that is Hispanic.1° The enclave hypothesis implies
that X is positive. In addition, if equation (15) is estimated separately
in the foreign-born and native-born samples, and if immigrants benefit more
from the self-employment opportunities opened up by the enclave, one would

18
expect that the impact of on the probability of self-employment is larger
in the immigrant than in the native-born sample.
Table 5 presents the estimated impact dp/dq = p(l-p) for each of the
six Hispanic groups under study, where the derivative is evaluated at the mean
self-employment probability of each group. For purposes of comparison the
table also presents the impact of on the self-employment probability of
non-Hispanic whites. Two important results are apparent. First, the coef-
ficient X is indeed positive and significant in the Hispanic samples. That
is, Hispanics are more likely to be self-employed in areas which have larger
Hispanic populations. Moreover, note that the impact of in the non-Hispanic
white samples is insignificantly different from zero; hence the results for
Hispanics cannot be dismissed as reflecting some unknown area-specific effect.
Second, the impact of on the self-employment probability is larger for
immigrants than for the native-born, and this difference is significant in two
of the three Hispanic samples."
It is possible to use the regression coefficients reported in Table 5 to
calculate the increase in the self-employment rates of immigrants (relative to
natives) due to the enclave effect. The results from this calculation are re-
ported in Table 6. Consider the sample of Mexican men. The average Mexican
immigrant lives in a metropolitan area that is 23.7 percent Hispanic, while the
average Mexican/American lives in an SMSA that is 25.6 percent Hispanic. The
regressions in Table 5 report the marginal increase in the self-employment prob-
ability due to changes in these proportions. The relevant calculation then
shows that the enclave effect increases the self-employment rate of Mexican
immigrants by 1.2 percentage points over that of Mexican native-born men.
Similar calculayions reported in Table 6 for the Cuban and other Hispanic

19
samples show that enclave effects increase foreign-born self-employment rates
by 1-2 percentage points over the native-born base. Hence enclave effects are
not only statistically significant, but they are also numerically important.
These results, however, cannot really answer the fundamental question
of enclave effects exist. The fact that the self-employment rates of non-
Hispanic whites (reported in the last row of Table 5) are not related to percent
Hispanic in the SHSA suggests that language (and/or culture) plays an important
role in the creation of the enclave effect. A number of additional experiments
were conducted to provide a better test of this hypothesis. These experiments
included relating the self-employment rates of Asians to the percent Asian in
the SMSA, and conducting a separate analysis of the self-employment rates of
immigrants from English-speaking countries. On the whole, however, these
preliminary calculations were negative and did not provie any additional
insights into the factors that are driving the results in Table 5. The likely
reason for this failure is the fact that the Asian sample is extremely hetero-
geneous--both in language and cluture--so that any future analysis of these
individuals will have to segment by country-of-origin. Similarly, the sample
of men from English-speaking countries includes men from the U.K. and Ireland,
as well as men from Jamaica and the Philipines. The cultural (and racial)
differences among these various samples makes it unlikely that a self-employed
immigrant from an English-speaking country can be equally efficient in catering
to all the groups that make up his "enclave". Future studies of this problem,
therefore, will have to increasingly look at the roles played by culture,
race, and language in differentiating among immigrant and native-born groups.
V. Summary
Self-employment represents an important component of the immigrant exper-
ience in the U.S. labor market. Its omission in earlier studies cannot be

20
justified by the presumption that self-employed workers represent a numerically
unimportant part of the immigrant labor force. In fact, among large immigrant
groups self-employment rates exceed 15 percent of the labor force. This paper
begins the study of the immigrant self-employment experience by analyzing the
self-employment rates of 18 immigrant cohorts using the 1970 and 1980 U.s.
Census. The major findings are:
1. Assimilation has a sizable impact on self-employment probabilities:
The longer the immigrant resides in the United States, the higher the pro-
bability of self-employment.
2. There has been a rapid increase in the self—employment rates exper-
ienced by recent immigrant cohorts as compared to earlier cohorts. These
across-cohort changes may have been caused by the relative decline of oppor-
tunities faced by immigrants in the salaried sector over the last decades.
3. Immigrants are more likely to be self-employed than similarly
skilled native-born workers. A major reason for this differential is that
geographic enclaves of immigrants increase self-employment opportunities
particularly for immigrants who share the same national background (or
language) as the residents of the enclave.
The prevalence of self-employment among immigrants (and native-born
workers) in the labor market suggests that much additional work is needed
in this area. The analysis in this paper makes clear that continued research
of the self-employment option and of self-employment incomes is likely to
greatly enhance our understanding of the immigrant assimilation process.

21
Footnotes
Professor of Economics, University of California, Santa Barbara, and
Research Associate, National Bureau of Economic Research. This research
was supported by grants from the Rockefeller Foundation and the Department
of Health and Human Services. I am grateful to two anonymous referees for
providing insightful comments and suggestions on a previous draft of this
paper.
1See Carliner (1980), Chiswick (1978), DeFreitas (1979) and Long
(1980).
2Recent studies by Lazear and Moore (1984) and Wolpin (1977) have
been concerned with the question of why there exist smaller wage differentials
(by skill) among the self-employed than among salaried workers. Studies by
Fuchs (1968, 1982) provide a descriptive analysis of the extent of self-
employment among older workers and in the service economy.
In addition, non-random emigration of the immigrant population biases
the impact of t. on both market wage rates and self-employment incomes. See
Borjas (1985) for a discussion of the biases introduced by the high emigration
rates of the foreign-born.
Of course, there are many reasons why, in actuality, the cohorts
in the 1970 and 1980 Census data may not be perfectly matched. For instance,
the presence of emigration will lead to secular trends in the size (and
quality) of a specific immigrant cohort. Similarly, institutional changes
in the Census enumeration procedures may lead to different counts of immi-
grants (and native-born persons) in particular cohorts across Censuses.
Finally, there may be age (and/or cohort) related differences in labor
supply and mortality rates which generate additional differences in the size

22
of the cohort samples included in the regressions over time. Note, however,
that all these problems will impart biases on both cross-section and cohort
analyses so that, in a sense, the cohort study presented below nets out only
one of the many sources of bias, that due to violations of the assumption of
stationarity in the quality of immigrants at the time of entry.
5 .
The sampling fractions for 1970 are: white native-born (.001 of
the population), all other groups (.01). The 1980 sampling fractions are:
black natives (.00245), black immigrants (.01651), Mexican natives (.01652),
Mexican immigrants (.01638), white natives (.00042), white immigrants (.00249),
all other groups (.05).
6 The Hispanic samples do not include the group of Puerto Rican
men since Puerto Ricans born in Puerto Rico are not asked the year they
migrated to the U.S. by the Census.
The t-ratios in Table 4 refer to the relevant transformations
of the logit coefficients and are estimated from the covariance matrix of the
regression coefficients.
8 Note that since the constraints = y and 670 = 680 6
have been imposed on the estimates, the cross-section regressions in Table 3
are not directly comparable to the cross-section estimates in Table 4. In
particular, Table 3 constrains the socioeconomic variables to have the same
impact for the foreign- and native-born in the 1980 Census year, while Table 4
allows a differential impact between the two groups but assumes this difference
is invariant to calendar year.
See Jasso and Rosenzweig (1986) for an interesting discussion and
empirical study of some of the implications of the family reunification
emphasis in the current law.

23
10The analysis was also conducted with alternative definitions for
the variable These specifications included such variables as percent
Mexican, percent Cuban, etc. The model in equation (15) does as good a job
in describing the enclave effect as the more detailed specification.
It would be of interest, of course, to analyze - along similar
lines - the relative levels of salaried and self-employment incomes. Unfortu-
nately, this extension of the work introduces the problem of correcting for
sample selection biases both within and across immigrant cohorts. In addition,
self-employment incomes, as reported in the Census, are an amalgam of returns
to human and physical capital. A complete study of the income levels, therefore,
will require much more detailed data on the source and types of incomes of the
self-employed.

24
TABLE 1
Self-Employment Rates and Incomes
Mean Annual Mean Annual
Self-Employment Income of Income of
GROUP Probability Salaried Workers Self-Employed Workers
White: Immigrant .165 19594.7 24707.7
Native-Born .117 18014.2 23995.4
Black: Immigrant .053 12192.7 16469.9
Native—Born .037 12756.7 15036.8
Asian: Immigrant .126 16350.3 25454.5
Native-Born .121 17613.4 24149.6
Mexican: Immigrant .042 10158.8 13981.8
Native-Born .056 12932.2 17189.2
Cuban: Immigrant .156 14090.2 20670.3
Native-Born .109 13762.7 21249.1
Other Hispanic: Immigrant .080 12382.4 22598.6
Native-Born .083 14867.5 21338.9
Source: 1980 U.S. Census.

—25—
Table 2
INDUSTRIAL DISTRIBUTION BYSELF-EMPLOYMENT STATUE
Native Born Immigrants2 Employedin Industry: Salaried Self-Employed Salaried Self—Employed
Agriculture 1.2 9.1 3.9 5.9
Mining 1.2 .5 .6 .1
Construction 9.5 17.6 8.6 13.5
Manufacturing 32.0 6.8 3L+.6 9.8
Transportation 11.0 4.7 7.0 3.6
Wholesale Trade 6.0 6.0 5.1 5.2
Retail Trade 11.0 17.2 13.1 27.6
Finance 4.6 7.2 4.7 3.9
Business Services 4.5 10.6 5.0 9.2
Personal Services 1.2 3.5 2.5 5.5
Entertainment .9 1.2 1.2 1.1
Professional Services 10.3 15.9 10.8 14.8
Public Administration 6.4 .0 2.9 .0
Source: 1980 U.S. Census

26
TABLE 3
Maximum Likelihood Logit Regressions on Probability of Self_Employment*
GROUPOther
Variable** White Black Asian Mexican Cuban Hispanic
CONSTANT -3.3575 -4.3717 -4.1438 -4.6183 -3.4602 -4.3481
(—17.51) (—11.72) (—31.48) (—19.37) (—21.54) (—24.55)
EDUC .0629 .0649 .0692 .0835 .0478 .1112
(7.53) (3.72) (12.69) (8.76) (7.23) (15.93)
EXPER .0353 .0223 .0520 .0544 .0468 .0347
(3.25) (1.04) (7.68) (4.07) (5.05) (3.31)
EXPER2 -.0004 .0000 - .0003 -.0006 - .0007 - .0003(—1.94) (.00) (-2.61) (—2.45) (-4.14) (—1.59)
MAR .1501 -.0541 .4519 .2829 .4311 .2016
(2.08) (-.48) (7.92) (3.01) (6.50) (3.17)
HLTH -.0208 .5741 .2902 .2700 .0232 .1834
(—. 17) (3.05) (2.91) (1.97) (.22) (1.60)
D40 .4194 .5914 .2117 .2707 .5809 - .0294(3.99) (2.22) (2.35) (1.73) (3.35) (—.20)
D50 .2706 .8109 .1794 .2132 .4544 .1706(2.96) (3.12) (2.34) (1.90) (5.28) (1.77)
D60 .3983 .6985 .2512 .-1306 .3867 .1829
(2.89) (2.84) (3.25) (-.83) (6.60) (2.24)
D65 .1980 -.0539 .0765 .0864 .1107 .1471
(1.38) (—.22) (1.31) (.20) (1.54) (2.05)
D70 .2453 .2785 .2065 —.3678 .2211 -.1419
(1.44) (1.44) (4.01) (—2.55) (2.59) (—1.78)
D75 .1111 .0421 -.4101 -.4693 -.4545 -.4188
(.70) (.17) (—7.34) (—2.72) (—2.01) (—4.24)
*The asymptotic t-ratios are given in parentheses.*Key to Variables: EDUC = years of completed education; EXPER age-Educ-6;MAR 1 if married, spouse present, 0 otherwise; HLTH = 1 if health limits
work, 0 otherwise.

27
TABLE 4
Decomposition of Changes in the Probability of Se1f-Employment
GROUP! Cross-Section Immigrants Only Relative to NativesYear Growth Within-Cohort Across-Cohort Within-Cohort Across-Cohort
White
1965-1969 - .0028 .0982 -.1010 .0806 - .0834(-.10) (5.78) (—5.55) (6.17) (—4.70)
1960-1964 .0228 .0659 - .0431 .0483 - .0255(.72) (3.05) (-1.82) (2.57) (—1.09)
1950-1959 .0002 .0319 - .0317 .0143 - .0141(.04) (2.28) (-.95) (.85) (-.23)
Black
1965—1969 - .0028 .0130 - .0158 .0179 — .0207(-.20) (.64) (-.75) (.72) (—.44)
1960-1964 .0281 .0245 .0036 .0294 - .0013(1.50) (.58) (.11) (.67) (—.09)
1950—1959 .0369 - .0108 .0477 .0157 .0428
(1.89) (—.25) (1.27) (.03) (.79)
Asian
1965-1969 .0525 .1062 -.0537 .1331 -.0806
(7.95) (4.62) (-3.02) (5.64) (—5.75)
1960-1964 .0088 .1219 -.1131 .1488 -.1400
(.83) (3.51) (—3.39) (2.21) (—1.76)
1950-1959 .0046 - .0432 .0478 - .0163 .0209
(.46) (—1.45) (1.70) (-.62) (1.03)
Mexican
1965-1969 .0247 .0453 - .0206 .0303 - .0056(2.66) (2.71) (—1.64) (2.65) (—1.35)
1960-1964 .0094 .0263 — .0169 .0113 - .0019(1.09) (1.80) (—. 1.32) (1.48) (—.87)
1950-1959 .0116 .0184 - .0068 .0034 .0082
(1.40) (1.41) (—.41) (.43) (.61)

28
TABLE 4 (Continued)
GROUP! Cross-Section Immigrants Only Relative to Natives
Year Growth Within-Cohort Across-Cohort Within-Cohort Across-Cohort
Cuban
1965-1969 .0551 .1037 —.0486 .0861 -.0310
(2.34) (4.95) (-2.41) (5.05) (-2.14)
1960-1964 .0336 .1110 -.0774 .0934 -.0598
(2.48) (5.18) (-3.79) (5.39) (-3.63)
1950-1959 .0308 .0898 — .0590 .0722 - .0414(2.43) (2.70) (-1.23) (2.38) (-.86)
Other Hispanics
1965-1969 .0396 .0614 -0.218 .0552 - .0156(5.13) (3.80) (-1.75) (5.34) (—2.22)
1960-1964 .0261 .0261 .0000 .0199 .0062
(3.19) (1.45) (.08) (1.93) (.56)
1950-1959 .0017 .0298 - .0281 .0236 - .0219(.13) (1.57) (—1.27) (.21) (—1.51)
*The asymptotic t-rat.ios given in parentheses refer to the respectivetransformation of the logLt coefficients.

29
TABLE 5
Impact of Enclave on Self-Employment Probabilities*
GROUP Immigrant Native-Born Difference
Nexican .0869 .0344 .0525
(6.37) (3.33) (2.10)
Cuban .1975 .1009 .0966
(5.04) (.64) (2.43)
Other Hispanic .0794 .0114 .0680
(3.64) (.65) (2,83)
White .1751 .1009 .0661
(.83) (.64) (.38)
*The asymptotic t-ratios are given in parentheses, and refer to the
corresponding lpgX coefficients.

30
TABLE 6
Immigrant/Native—Born Differential in Self-EmploymentPropensities Due to Enclave Effects
Fraction Hispanic in SFISA shere: Predicted
Average Average Difference in
Immigrant Non- Immigrant Se if-EmploymentResides Resides Probability
Nexican .237 .256 .012
Cuban .136 .061 .021
Other Hispanic .165 .161 .011

31
References
Bonacich, Edna and Jon Nodell. The Economic Basis of Ethnic Solidarity:Small Business in the Japanese American Community. Berkeley and LosAngeles: Univeristy of California Press, 1980.
Borjas, George J. "Assimilation, Changes in Cohort Quality, and the Earningsof Immigrants," Journal of Labor Economics 3, No. 4, October 1985, 463-489.
Carliner, Geoffrey. "Wages, Earnings, and Hours of Work of First, Second andThird Generation American Males," Economic Inquiry, January 1980, 87-102.
Chiswick, Barry R. "The Effect of Americanization on the Earnings of Foreign-Born Men," Journal of Political Economy 86, No. 5, October 1978, 897-921.
Cummings, Scott, editor. Self-Help in Urban America: Patterns of MinorityBusiness Enterprise. New York: Kenikart Press, 1980.
De Freitas, Gregory, "The Earnings of Immigrants in the American LaborMarket," Ph.D. Dissertation, Columbia University, 1980.
Fuchs, Victor R. "Self-Employment and Labor Force Participation of OlderMales," Journal of Human Resources 17, No. 3, Summer 1982, 339-357.
______________ The Service Economy. New York: National Bureau of EconomicResearch, 1968.
Jasso, Guillermina and Mark R. Rosenzweig. "Family Reunification and the
Immigration Multiplier: U.S. Immigration Law, Origin-Country Conditions,and the Reproduction of Immigrants," Demography, forthcoming, 1986.
Lazear, Edward and John Moore. "Incentives and Earnings Profiles." QuarterlyJournal of Economics 98, No. 2, May 1984, 275-296.
Long, James E. "The Effect of Americanization of Earnings: Some Evidence forWomen," Journal of Political Economy, June 1980, 620-629.
Wolpin, Kenneth. "Education and Screening." American Economics Review 67, No. 5,December 1977, 949-958.