Embed Size (px)
Citation preview
NBER WORKING PAPER SERIES
THE ANATOMY OF HEALTH INSURANCE
David M. CutlerRichard J. Zeckhauser
Working Paper 7176http://www.nber.org/paperS/W7176
NATIONAL BUREAU OF ECONOMIC RESEARCH1050 Massachusetts Avenue
Cambridge, MA 02138June 1999
This paper was prepared for the Handbook of Health Economics. We are gratefulto Dan Altman for
research assistance, to Jon Gruber, Tom McGuire, and Joe Newhouse for helpful comments,and to the
National Institutes on Aging for research support. All opinions expressed are those of the authors and not
those of the National Bureau of Economic Research.
1999 by David M. Cutler and Richard J. Zeckhauser. All rights reserved. Short sections of text, not to
exceed two paragraphs, may be quoted without explicit permission providedthat full credit, including
notice, is given to the source.
The Anatomy of Health InsuranceDavid M. Cutler and Richard J. ZeckhauserNBER Working Paper No. 7176June 1999JELNo. Ii
ABSTRACT
This article describes the anatomy of health insurance. It begins by consideringthe optimal
design of health insurance policies. Such policies must make tradeoffs appropriately between risk
sharing on the one hand and agency problems such as moral hazard (the incentive of people to seek
more care when they are insured) and supplier-induced demand (the incentive of physicians toprovide more care when they are well reimbursed) on the other. Optimal coinsurance arrangementsmake patients pay for care up to the point where the marginal gainsfrom less risk sharing are just
offset by the marginal benefits from less wasteful care being provided. Empirical evidence shows
that both moral hazard and demand-inducement are quantitatively important. Coinsurance based on
expenditure is a crude control mechanism. Moreover, it places no direct incentives on physicians,
who are responsible for most expenditure decisions. To place such incentives on physicians is the
goal of supply-side cost containment measures, such as utilization review and capitation. This goalmotivates the surge in managed care in the United States, whichunites the functions of insurance
and provision, and allows for active management of the care that is delivered.
The analysis then turns to the operation of health insurance markets. Economists generally
favor choice in health insurance for the same reasons they favor choice in other markets: choiceallows people to opt for the plan that is best for them and encourages plans to provide services
efficiently. But choice in health insurance is a mixed blessingbecause of adverse selection -- the
tendency of the sick to choose more generous insurance than the healthy. When sick and healthy
enroll in different plans, plans disproportionately composed of poor risks have to charge more than
they would if they insured an average mix of people. The resulting high premiums create twoadverse effects: they discourage those who are healthier but would prefer generous care from
enrolling in those plans (because the premiums are so high), and they encourage plans to adoptmeasures that deter the sick from enrolling (to reduce their overall costs). The welfare losses from
adverse selection are large in practice. Added to them are further losses from having premiums vary
with observable health status. Because insurance is contractedfor annually, people are denied a
valuable form of intertemporal insurance -- the right to buy health coverage at average rates inthe
future should they get sick today. As the ability to predict future health status increases, the lack
of intertemporal insurance will become more problematic.The article concludes by relating health insurance to the central goal of medical care
expenditures -- better health. Studies to date are not clear on which approaches to healthinsurance
promote health in the most cost-efficient manner. Resolving this question is the central policy
concern in health economics.
David M. Cutler Richard J. Zeckhauser
Department of Economics Kennedy School of Government
Harvard University Harvard University
Cambridge, MA 02138 Cambridge, MA 02138
and NBER and NBER
Insurance plays a central role in the health care arena. More than 80 percent of health care
expenditures in the United States are paid for by insurance, either public or private,with an even
greater percentage supported in most other developed nations. Insurance thus provides the money
that motivates and supports the health care system.
This paper describes the anatomy of health insurance. At the micro level, it details why
individuals seek insurance, and the challenges in structuring insurance policies. At the macro level,
it explains the role of health insurance in the medical care sector. The medical care triad (figure 1)
depicts that sector in a fundamental fashion. Insurers mediate between individuals and their
providers. Oftentimes, the flow of funds is more roundabout: governments or employersnominally
pay insurers, but these costs are then passed on to individuals, via increased taxes or lower wages.
The insurer intermediary must design a policy to pay for (and possibly provide) care. This
is a treacherous task. Designing a health insurance policy is not nearly so challenging
technologically as, say, designing a personal computer system, but it must still overcome some
distinct and substantial economic obstacles. The most important of these obstacles are agency
problems. Insurers cannot get relevant parties todo what efficiency requires. Thus, people with
generous insurance spend more on medical care than people with less generous insurance (moral
hazard), and providers paid on a fee-for-service (piece-rate) basis may provide more care due to
supplier-induced demand than they would if they were not paid pertask. In a situation where agency
relationships are imperfect, insurance is necessarily second-best. Insurers must trade off the benefits
from more generous insurance —primarily the reduction in risk it affords — against the costs of more
Throughout the paper, to facilitate exposition, we mostly refer to patients or insureds as
individuals, although most health insurance is purchased onbehalf of families.
generous insurance — moral hazard or supplier-induced demand. Throughout this chapter. we
highlight central lessons about health insurance, which are then collected in Table 10. This clash
between risk sharing and incentives is Lesson 1 about health insurance.
Agency problems in health care can be alleviated in two ways. The demand-side approach
discourages excessive utilization by making people pay something when they consume medical care.
Demand-side rationing is epitomized in the traditional indemnity insurance plan, which prevailed
in the United States for a half century. The supply-side approach discourages utilization by
monitoring providers carefully, penalizing them if they are profligate, and giving them financial
incentives to provide only essential care. Increasingly, supply-side limitations are fostered by
integrating insurance and provision. Some HMOs, for example, are both insurers and providers of
care. Integration of the insurance and provision functions is unique to medical care, and results from
the fundamental difficulties withjust demand-side rationing. The integration of health insurance and
provision of medical services is Lesson 2 about health insurance. Sections III through V of the
chapter lay out the issues involved in demand- and supply-side rationing.
We then move from these micro relationships to the broader arena of the market for health
insurance. People have preferences for different types of health insurance, and those preferences
should be accommodated to the extent possible. In addition, competition in health insurance can
encourage production efficiency, driving down overall costs. But competition in health insurance
produces results unlike competition in other markets, for a fundamental reason: the costs of
providing insurance, as opposed to say computers or food, depend on the characteristics of the buyer.
People with a poor medical history will benefit more from and cost more to insure than those with
a healthy past. Thus, the sick will sort themselves into more generous plans than will the healthy.
2
This process, called adverse selection, can substantially limit the benefits of health plan choice.
Individuals will have incentives to choose lessgenerous policies over more generous ones (to pool
with the healthy instead of the sick) and insurers will have incentives to reduce the generosity of their
benefits (to attract the healthy instead of the sick). Lesson 3 describes the consequences of
competition when buyer identity affects costs. Section VI discusses adverse selection and
approaches to deal with it.
The natural tendency of insurers to charge the sick greater premiums than thehealthy presents
a further challenge to health insurance: lack of coverage against the long-term risk of becoming sick
and having higher expected costs in the future. Using the thought experiment of individualsmaking
choices behind the veil of ignorance, they would choose to insure their risk of becoming sicker than
average, a multi-year risk,just as individuals in any year wish to insure their medical costs that year.
Markets for multi-year insurance do not exist, however, for understandablereasons, and in practice
individuals are left without this insurance. The kernel of the problem is that information on risk
levels becomes available before insurance contracts can be drawn. Lesson 4 is that early information
dries up insurance markets. Long-term insurance is taken up in Section VII of the chapter.
However effectively health insurance controls costs or spreads risks, the focus of most of this
chapter, its key goal is to promote health. In Section VIII we examine the relationship between
health insurance and health. Variations in insurance generosity have relatively little impact on health
among those with insurance. This finding is consistent with the idea that insurance generally
restricts care offering relatively low value. But the time frame over which these issues has been
examined is not large. We know less about the long-run effect of different health insurance
arrangements on health than we should. We mark the centrality of health as opposed merely to
3
financial transfers and the lack of clear evidence on the relative benefits of different systems as
Lesson 5 about health insurance.
At the outset, it is important to take account of the distinctive role health insurance plays in
society. Economists traditionally measure value by willingness to pay, and the value of health
insurance, or its byproduct medical care, is calibrated in dollar terms, the same as apples or television
sets. In much of the world, however, particularly outside the United States, medical care and
medical insurance are treated differently. Medical care is often viewed as a right, for which market-
based allocation is not appropriate. For some, the right is absolute; markets should play no role in
the allocation of medical services. More moderate positions assign government a special
responsibility for medical care, which leads to a government insurance system or set of subsidies.
Rights-oriented sentiments show up even in the United States. The United States subsidizes medical
insurance directly for poor people and old people, and indirectly for the working-age population
(through the exclusion of health insurance from individual taxable income). While some such
subsidies may bejustified on externality grounds (when people get medical care, they are less likely
to spread infectious diseases to others), merit good arguments, or fiscal externality arguments (when
people are healthier. they earn more, pay more in taxes, and receive less in public benefits), we
suspect that a right to medical care is the more basic motive.
But the rationale for subsidizing health insurance, as opposed to medical care,is less clear.
The government could promote consumption of medical care through direct delivery of services or
by subsidizing inputs, without intervening in the medical insurance market. We thus focus primarily
on the economic analysis of health insurance, leaving aside normative views about access to basic
medical services [CITE OTHER CHAPTERS]. We come back to the access issuein the last section.
4
In this essay, we follow common parlance by [primarilyj using the terms health care and
health insurance, although the terms medical care and medical care insurance might be better
descriptors. Health status cannot be insured. The costs of medical care can be, andare, albeit often
bearing the label health insurance.
We begin in the first section by discussing the provision of health insurance around the world
and in the second with a review of the principles of insurance. We then examine the micro and
macro issues in health insurance.
I. Health Insurance Structures in Developed Nations
Health insurance is common to all developed countries, but the mechanism for obtaining
insurance differs from country to country. Inmost countries, health insurance is universal;everyone
is entitled to coverage and is required to purchase it.2 In some nations, such as Canada, the financing
is through taxation; people pay an income or payroll tax, and the proceeds are used by the
government to purchase or provide health insurance. In other nations, the financing is through
private insurance; individuals or their employers contribute to health insurance companies. which
then provide insurance for the population. While the payment for any individual may differ in these
two systems (a tax financed system generally imposes relatively more on the rich), the implications
for the provision of health insurance are generally slight. Governments in both systems are
intimately involved in determining what services are covered, the cost sharing that patients face, and
2 In some countries, such as Germany, temporary workers do not receive health insurance,but they comprise a small part of the population. All citizens are entitled to insurance.
5
the restrictions imposed on providers.
The specifics of health insurance structures differ significantly across developed nations.
Countries like England and Italy finance health insurance through general taxation and (at least
historically) provide services publicly.3 Countries such as Canada and Germany finance insurance
publicly but contract for services through private providers.
I. 1 Health Insurance in the United States
Describing the detailed structures for health insurance in different nations would take an
entire volume. We focus our attention primarily on the United States. The United States is
distinctive among OECD countries because health insurance is not universal.4 Table 1 shows the
sources of health insurance in the United States. About one-quarter of the United States population
is insured through the public sector. The primary public programs are Medicare, which mostly
insures the elderly, along with the disabled and people with kidney failure; and Medicaid, which
insures younger women and children, the elderly (for services not covered by Medicare such as
nursing home care), and the blind and disabled. Other public programs, primarily for veterans and
dependents of active duty military personnel. insure another 1 percent of the population.
Another 60 percent of the population has private health insurance. Most of this insurance
is provided by employers; less than 10 percent of the population purchases insurance privately. The
Countries like the U.K. have moved to more of a decentralized provision system in recentyears. Hospitals have been set up as private trusts, for example, and physicians are no longersalaried.
Health insurance coverage is not required in Switzerland but it is subsidized so heavily that
essentially everyone purchases it.
6
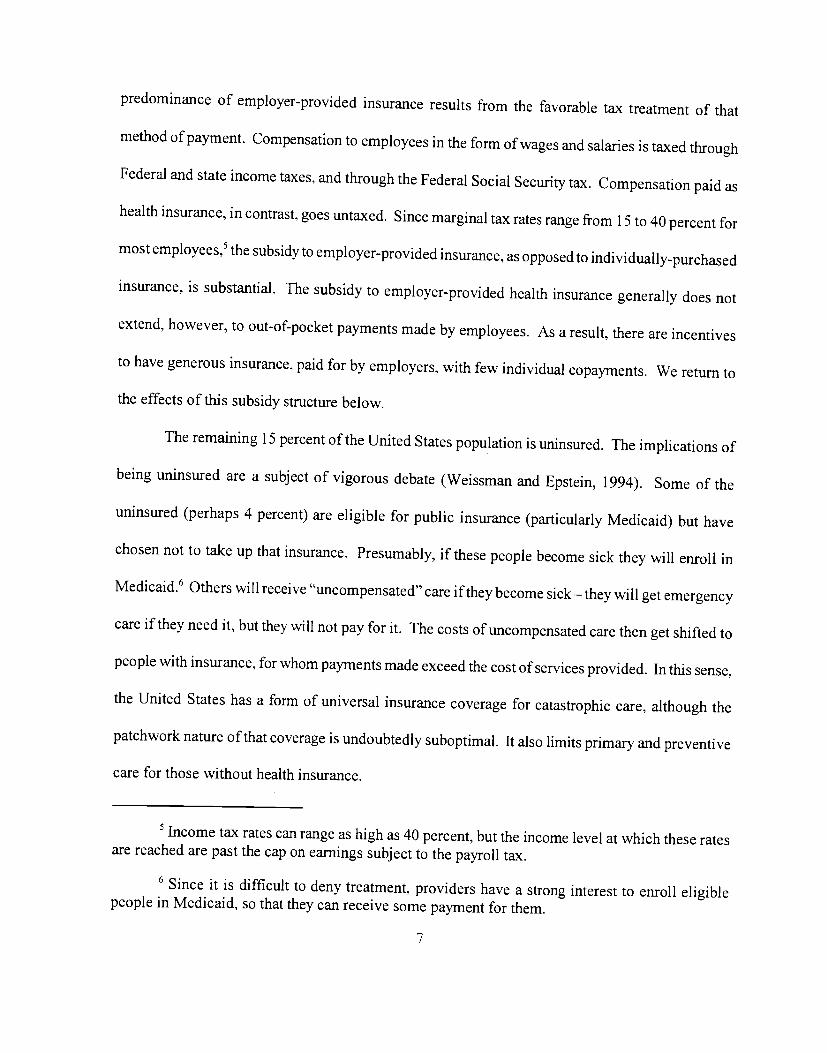
predominance of employer-provided insurance results from the favorable tax treatment of that
method of payment. Compensation to employees in the form of wages and salaries is taxedthrough
Federal and state income taxes, and through the Federal Social Security tax. Compensation paid as
health insurance, in contrast, goes untaxed. Since marginal tax rates range from 15 to 40percent for
most employees,5 the subsidy to employer-provided insurance, as opposed to individually-purchased
insurance, is substantial. The subsidy to employer-providedhealth insurance generally does not
extend, however, to out-of-pocket payments made by employees. As a result, there are incentives
to have generous insurance, paid for by employers, with few individual copayments. We return to
the effects of this subsidy structure below.
The remaining 15 percent of the United Statespopulation is uninsured. The implications of
being uninsured are a subject of vigorous debate (Weissman and Epstein, 1994). Some of the
uninsured (perhaps 4 percent) are eligible for public insurance (particularly Medicaid) but have
chosen not to take up that insurance. Presumably, if these people become sick they will enroll in
Medicaid.6 Others will receive "uncompensated"care if they become sick—they will get emergency
care if they need it, but they will not pay for it, The costs ofuncompensated care then get shifted to
people with insurance, for whom payments made exceed the cost of servicesprovided. In this sense,
the United States has a form of universal insurance coverage for catastrophic care, although the
patchwork nature of that coverage is undoubtedly suboptimal. It also limitsprimary and preventive
care for those without health insurance.
Income tax rates can range as high as 40 percent, but the income level at which these ratesare reached are past the cap on earnings subject to the payroll tax.
6 Since it is difficult to deny treatment, providers have a strong interest to enroll eligiblepeople in Medicaid, so that they can receive some payment for them.
7
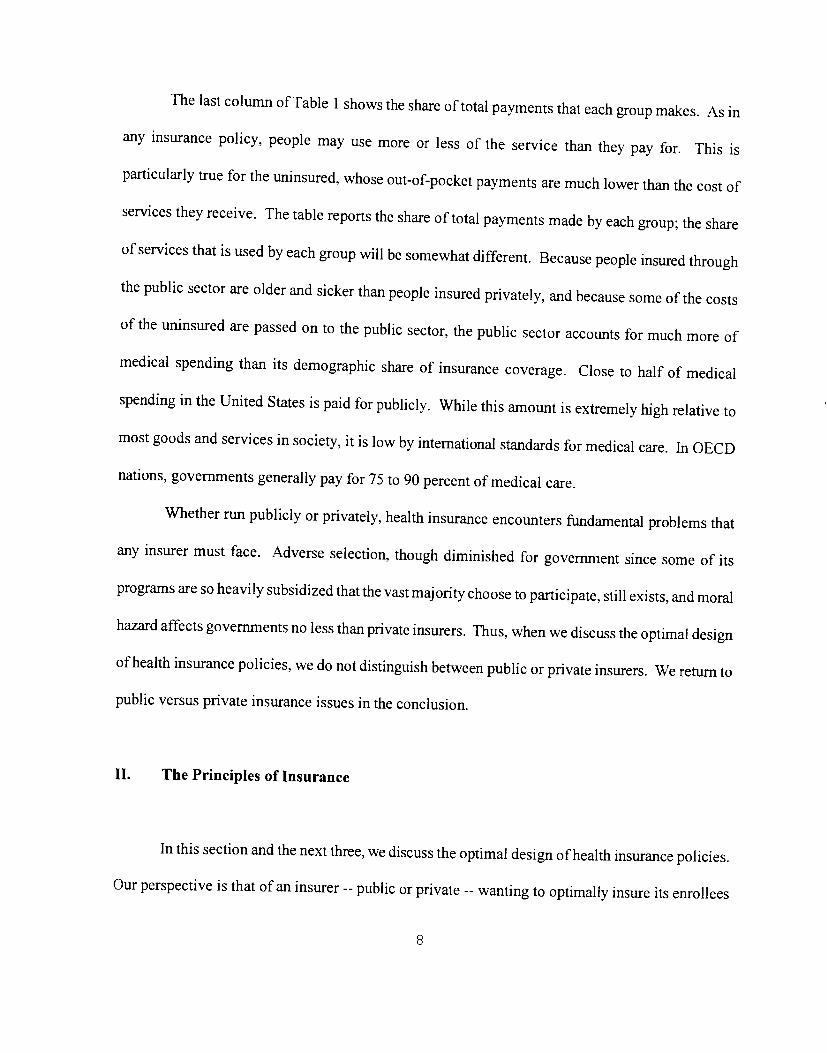
The last colunm of Table 1 shows the share oftotal payments that each group makes. As in
any insurance policy, people may use more or less of the service than they pay for. This is
particularly true for the uninsured, whose out-of-pocketpayments are much lower than the cost of
services they receive. The table reports the share of total payments made by eachgroup; the share
of services that is used by each group will be somewhat different. Because people insuredthrough
the public sector are older and sicker than people insured privately, and because some of the costs
of the uninsured are passed on to the public sector, the public sector accounts for much more of
medical spending than its demographic share of insurance coverage. Close to half of medical
spending in the United States is paid for publicly. While this amount is extremely high relative to
most goods and services in society, it is low by international standards for medical care. In OECD
nations, governments generally pay for 75 to 90 percent of medical care.
Whether run publicly or privately, health insurance encounters fundamental problems that
any insurer must face. Adverse selection, though diminished for government since some of its
programs are so heavily subsidized that the vast majority choose to participate, stillexists, and moral
hazard affects governments no less than private insurers. Thus,when we discuss the optimal design
of health insurance policies, we do not distinguish betweenpublic or private insurers. We return to
public versus private insurance issues in the conclusion.
II. The Principles of Insurance
In this section and the next three, we discuss theoptimal design of health insurance policies.
Our perspective is that of an insurer -- public or private -- wanting to optimally insure its enrollees
8
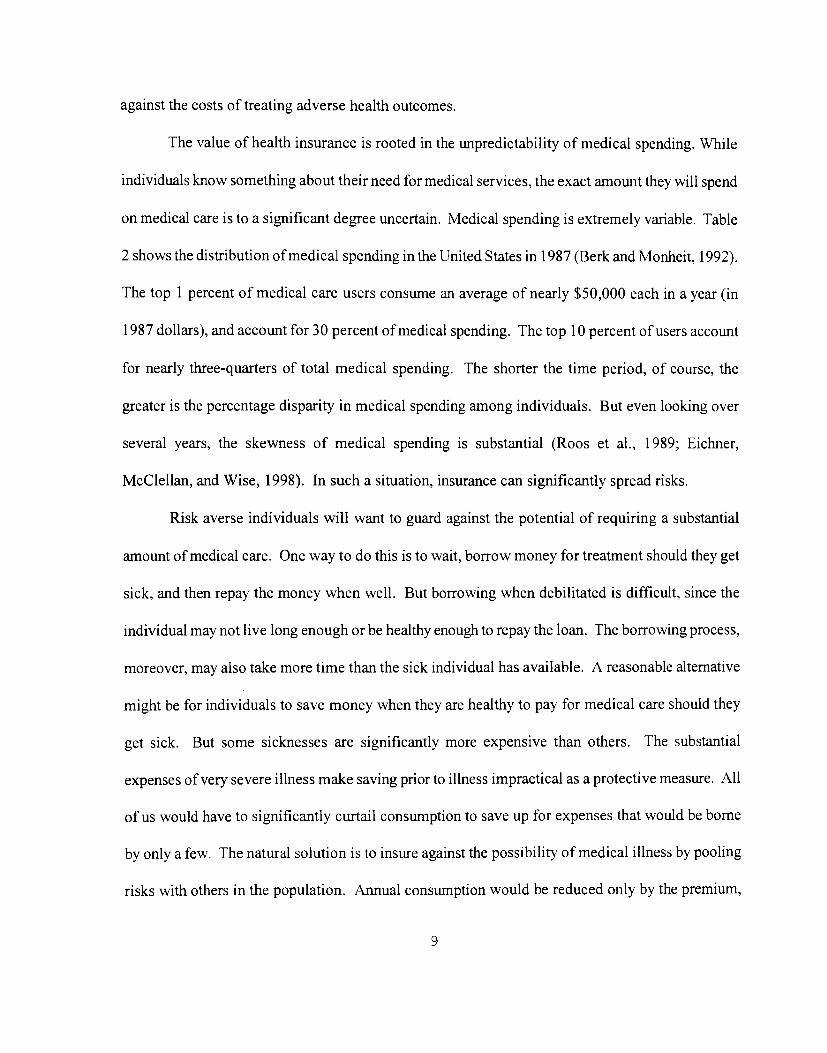
against the costs of treating adverse health outcomes.
The value of health insurance is rooted in the unpredictability of medical spending. While
individuals know something about their need for medical services, the exact amount they will spend
on medical care is to a significant degree uncertain. Medical spending is extremely variable. Table
2 shows the distribution of medical spending in the United States in 1987 (Berk and Monheit, 1992).
The top 1 percent of medical care users consume an average of nearly $50,000 each in a year (in
1987 dollars), and account for 30 percent of medical spending. The top 10 percent of users account
for nearly three-quarters of total medical spending. The shorter the time period, of course, the
greater is the percentage disparity in medical spending among individuals. But even looking over
several years, the skewness of medical spending is substantial (Roos et al., 1989; Eichner,
McClellan, and Wise, 1998). In such a situation, insurance can significantly spread risks.
Risk averse individuals will want to guard against the potential of requiring a substantial
amount of medical care. One way to do this is to wait, borrow money for treatment should they get
sick, and then repay the money when well. But borrowing when debilitated is difficult, since the
individual may not live long enough or be healthy enough to repay the loan. The borrowing process,
moreover, may also take more time than the sick individual has available. A reasonable alternative
might be for individuals to save money when they are healthy to pay for medical care should they
get sick. But some sicknesses are significantly more expensive than others. The substantial
expenses of very severe illness make saving prior to illness impractical as a protective measure. All
of us would have to significantly curtail consumption to save up for expenses that would be borne
by only a few. The natural solution is to insure against the possibility of medical illness by pooling
risks with others in the population. Annual consumption would be reduced only by the premium,
9
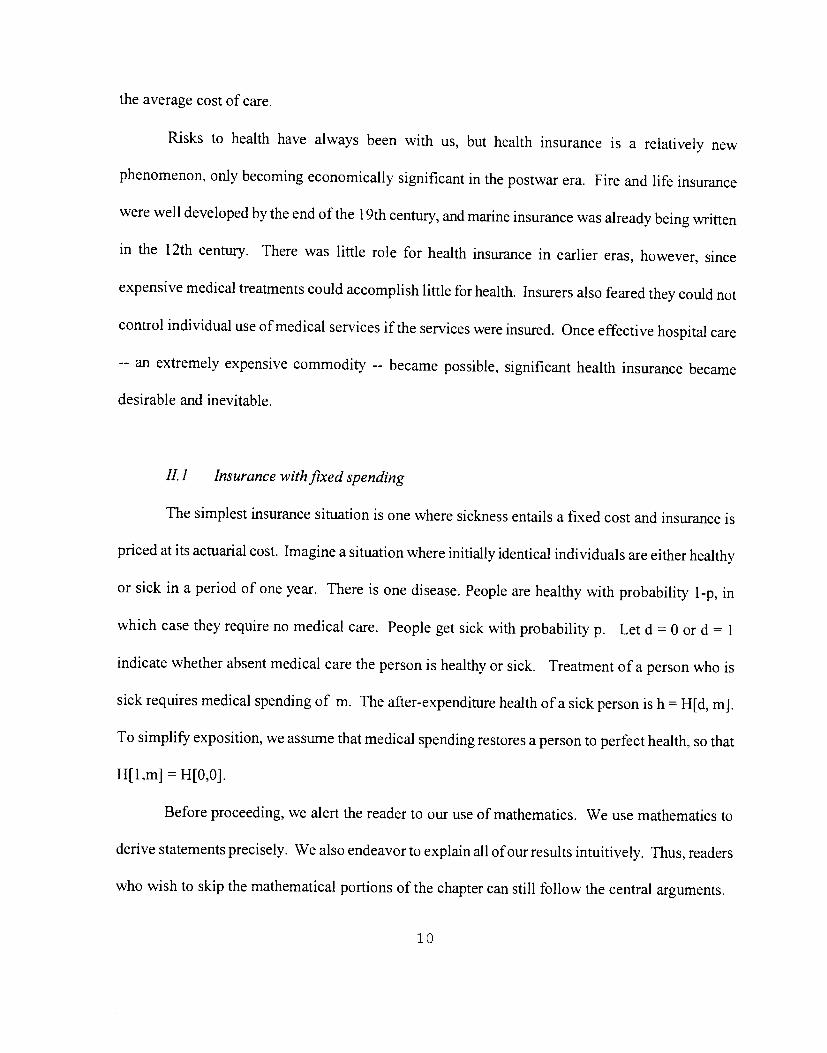
the average cost of care.
Risks to health have always been with us, but health insurance is a relatively new
phenomenon, only becoming economically significant in the postwar era. Fire and life insurance
were well developed by the end of the 19th century, and marine insurance was already being written
in the 12th century. There was little role for health insurance in earlier eras, however, since
expensive medical treatments could accomplish little for health. Insurers also fearedthey could not
control individual use of medical services if the services were insured. Once effectivehospital care
-- an extremely expensive commodity -- became possible, significant health insurance became
desirable and inevitable.
II.] Insurance with JIxed spending
The simplest insurance situation is one where sickness entails a fixed cost and insurance is
priced at its actuarial cost. Imagine a situation where initially identical individuals are either healthy
or sick in a period of one year. There is one disease. People are healthy with probability l-p, in
which case they require no medical care. People get sick with probabilityp. Let d = 0 or d = 1
indicate whether absent medical care the person is healthy or sick. Treatment of aperson who is
sick requires medical spending of m. The after-expenditure health of a sickperson is h = H[d, m].
To simplify exposition, we assume that medical spending restores a person to perfect health, so that
H[1,m] = H[0,0].
Before proceeding, we alert the reader to our use of mathematics. We use mathematics to
derive statements precisely. We also endeavor to explain all of our results intuitively. Thus, readers
who wish to skip the mathematical portions of the chapter can still follow the central arguments.
10
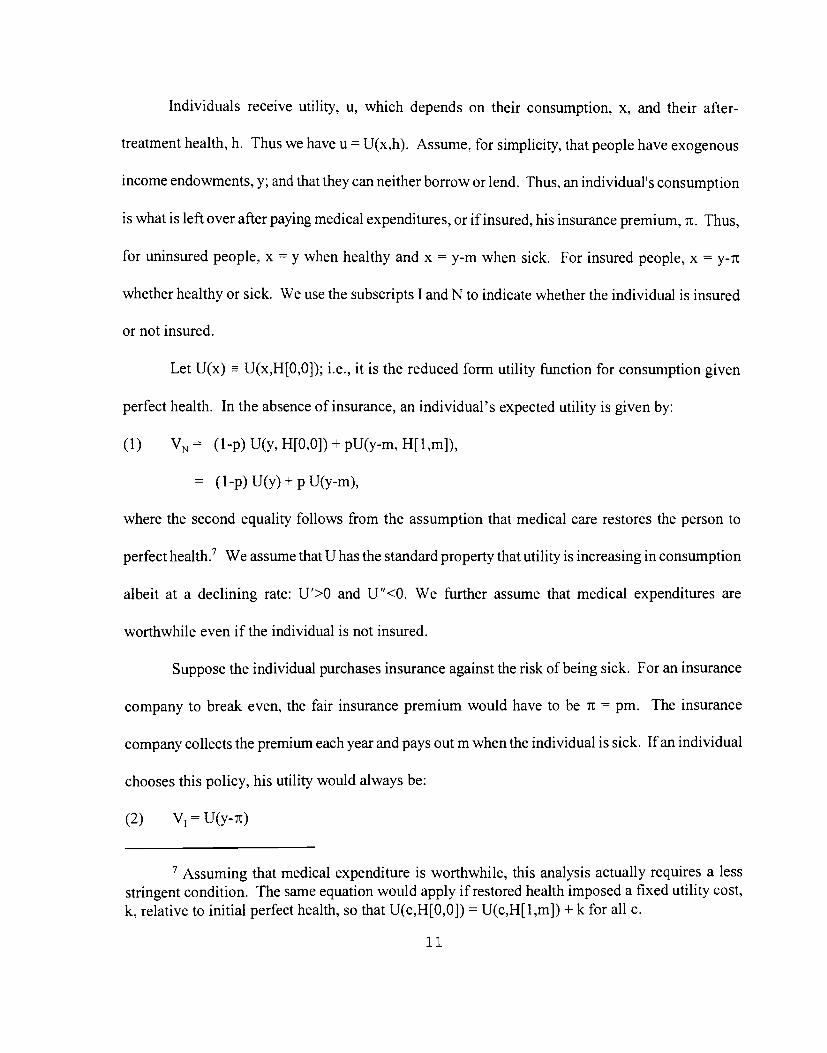
Individuals receive utility, u, which depends on their consumption, x, and their after-
treatment health, h. Thus we have u = U(x,h). Assume, for simplicity, that people have exogenous
income endowments, y; and that they can neither borrow or lend. Thus, an individual's consumption
is what is left over after paying medical expenditures, or if insured, his insurance premium, rc. Thus,
for uninsured people, x y when healthy and x =y-m when sick. For insured people, x = y-rt
whether healthy or sick. We use the subscripts I and N to indicate whether the individual is insured
or not insured.
Let U(x) U(x,H[O,O]); i.e., it is the reduced form utility function for consumption given
perfect health. In the absence of insurance, an individual's expected utility is given by:
(1) VN (l-p) U(y, H{O,O]) + pU(y-m, H[l,m]),
= (l-p) U(y) + p U(y-m),
where the second equality follows from the assumption that medical care restores the person to
perfect health.7 We assume that U has the standard property that utility is increasing in consumption
albeit at a declining rate: U'>O and U"<O. We further assume that medical expenditures are
worthwhile even if the individual is not insured.
Suppose the individual purchases insurance against the risk of being sick. For an insurance
company to break even, the fair insurance premium would have to be it = pm. The insurance
company collects the premium each year and pays out m when the individual is sick. If an individual
chooses this policy, his utility would always be:
(2) V1=U(y-it)
Assuming that medical expenditure is worthwhile, this analysis actually requires a lessstringent condition. The same equation would apply if restored health imposed a fixed utility cost,k, relative to initial perfect health, so that U(c,H[O,O]) = U(c,H[l,m]) + k for all c.
11
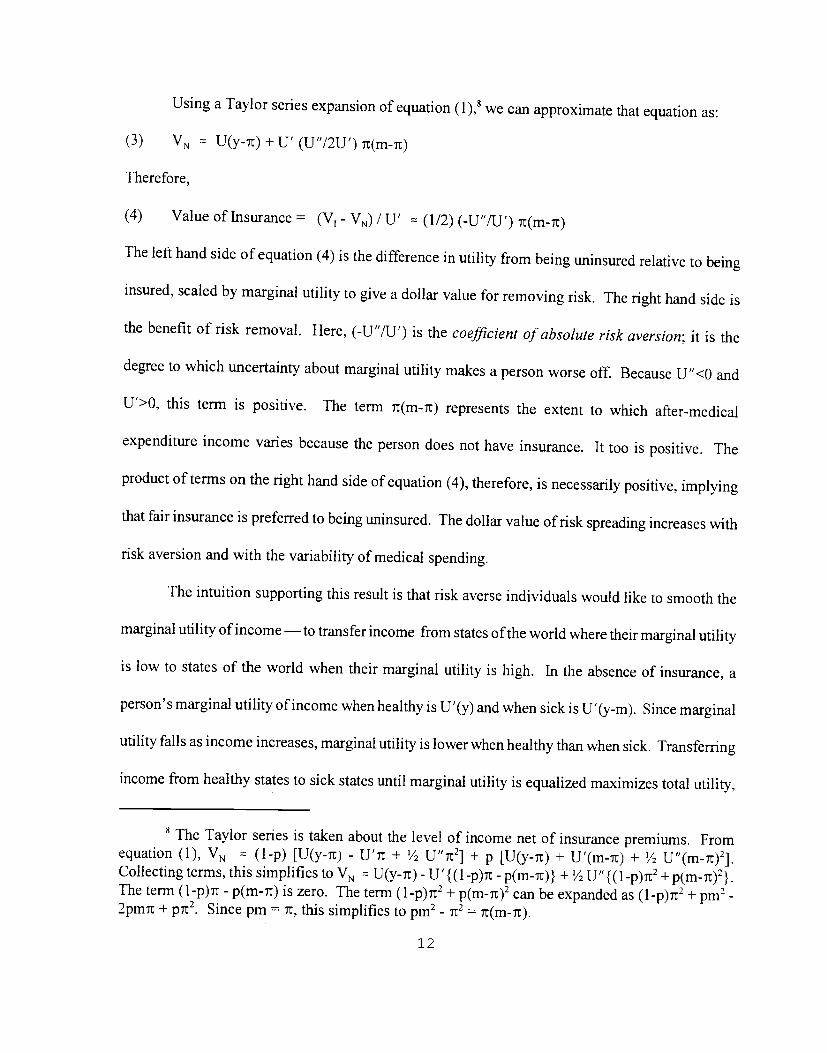
Using a Taylor series expansion of equation (l),8 we can approximate that equation as:
(3) VN U(y-it) + U' (U"/2U') Tt(m-lt)
Therefore,
(4) Value of Insurance = (V - VN) / U, (1/2) (-U"/U') t(m-iI)
The left hand side of equation (4) is the difference in utility from being uninsured relative to being
insured, scaled by marginal utility to give a dollar value for removing risk. The right hand side is
the benefit of risk removal. Here, (-U"/U') is the coefficient of absolute risk aversion; it is the
degree to which uncertainty about marginal utility makes aperson worse off. Because U"<O and
U'>O, this term is positive. The term lt(m-1t) represents the extent to which after-medical
expenditure income varies because the person does not have insurance. It too is positive. The
product of terms on the right hand side of equation (4), therefore, is necessarily positive, implying
that fair insurance is preferred to being uninsured. The dollar value of riskspreading increases with
risk aversion and with the variability of medical spending.
The intuition supporting this result is that risk averse individuals would like to smooth the
marginal utility of income — to transfer income from states of the world where their marginal utility
is low to states of the world when their marginal utility is high. In the absence of insurance, a
person's marginal utility of income when healthy is U'(y) and when sick is U'(y-m). Since marginal
utility falls as income increases, marginal utility is lower when healthy than when sick. Transferring
income from healthy states to sick states until marginal utility is equalized maximizes total utility,
8 The Taylor series is taken about the level of income net of insurance premiums. Fromequation (1), VN (l-p) [U(y-i) - U'it + V2 U"t2] + p [U(y-7c) + U'(m-Tc) + V2 U"(m-it)2}.Collectingterms, this simplifiesto VN U(y-it) - U'{(l-p)t -p(m-ir)} + V2 U"{(l-p)it2 +p(m-it)2}.The term (l-p)ir -p(m-it) is zero. The term (l-p)it2 + p(m-ic)2 can be expanded as (l-p)it2 + pm2 -2pmit + p7E2. Since pm = it, this simplifies to pm2 - it2 =
12
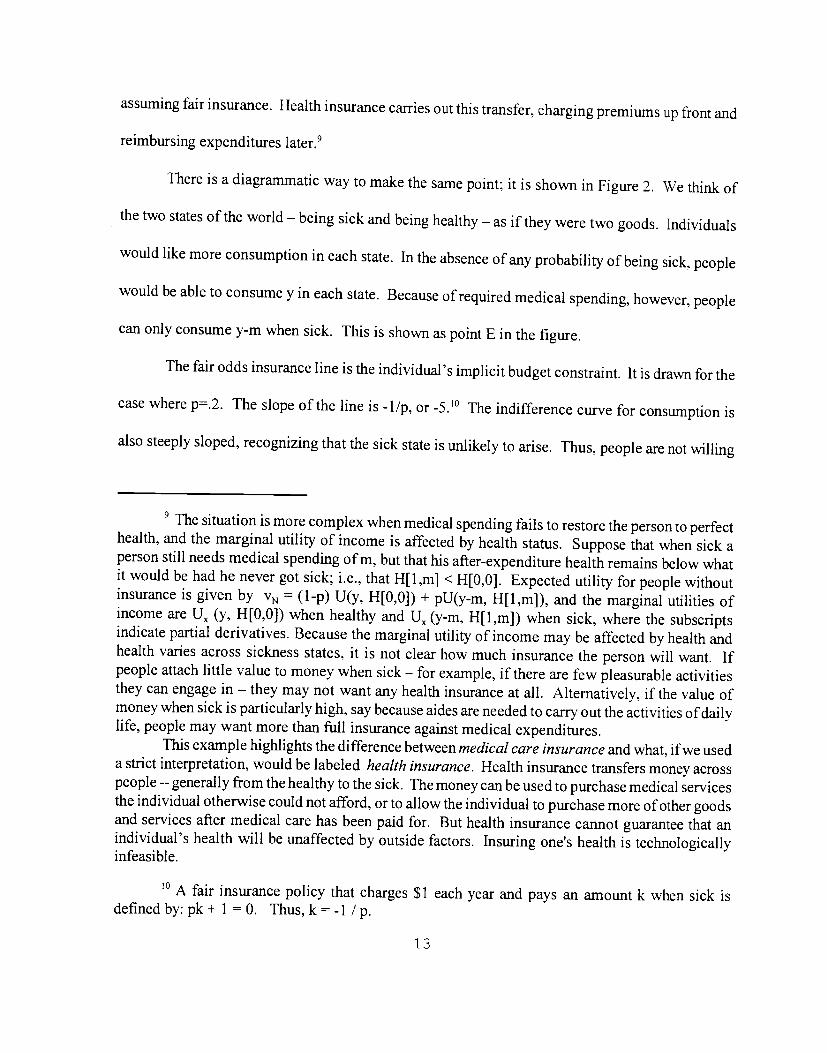
assuming fair insurance. Health insurance carries out this transfer,charging premiums up front and
reimbursing expenditures later.9
There is a diagrammatic way to make the same point; it is shown in Figure 2. We think of
the two states of the world — being sick and being healthy — as if they were two goods. Individuals
would like more consumption in each state. In the absence ofany probability of being sick, people
would be able to consume y in each state. Because ofrequired medical spending, however, people
can only consume y-m when sick. This is shown as point E in the figure.
The fair odds insurance line is the individual's implicitbudget constraint. It is drawn for the
case where p=.2. The slope of the line is -lip, or 5•! The indifference curve for consumption is
also steeply sloped, recognizing that the sick state is unlikely to arise. Thus, people are not willing
The situation is more complex when medical spending fails torestore the person to perfecthealth, and the marginal utility of income is affected by health status. Suppose that when sick aperson still needs medical spending of m, but that his after-expenditure health remains below whatit would be had he never got sick; i.e., that H[l,m] <H[O,OJ. Expected utility for people withoutinsurance is given by VN (l-p) U(y, H[O,OJ) + pU(y-m, H[l,m]), and the marginal utilities ofincome are U, (y, H{O,O]) when healthy and U, (y-m, H[1,m]) when sick, where the subscriptsindicate partial derivatives. Because the marginal utility of incomemay be affected by health andhealth varies across sickness states, it is not clear how much insurance the person will want. Ifpeople attach little value to money when sick — for example, if there are few pleasurable activitiesthey can engage in — they may not want any health insurance at all. Alternatively, if the value ofmoney when sick is particularly high, say because aides are needed to carry out the activities of dailylife, people may want more than full insurance against medical expenditures.
This example highlights the difference between medical care insurance and what, ifwe useda strict interpretation, would be labeled health insurance. Health insurance transfersmoney acrosspeople -- generally from the healthy to the sick. The money can be used to purchase medical servicesthe individual otherwise could not afford, or to allow the individual to purchasemore of other goodsand services after medical care has been paid for. But health insurance cannot guarantee that anindividual's health will be unaffected by outside factors. Insuring one's health is technologicallyinfeasible.
10 A fair insurance policy that charges $1 each year and pays an amount k when sick isdefined by: pk + 1 = 0. Thus, k = -I/p.
13
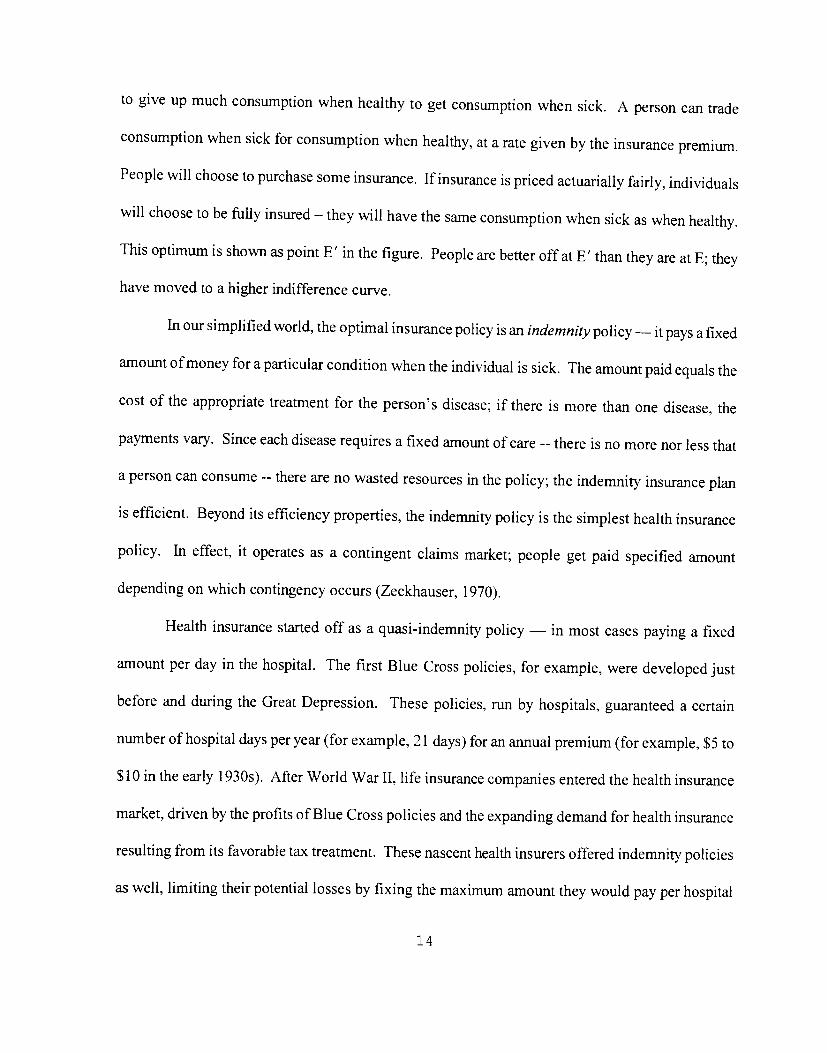
to give up much consumption when healthy to get consumption when sick. A person can trade
consumption when sick for consumption when healthy, at a rate given by the insurance premium.
People will choose to purchase some insurance. If insurance is priced actuarially fairly, individuals
will choose to be fully insured — they will have the same consumption when sick as whenhealthy.
This optimum is shown as point E' in the figure. People are better off at E' than they are at E; they
have moved to a higher indifference curve.
In our simplified world, the optimal insurance policy isan indemnity policy — it pays a fixed
amount of money for a particular condition when the individual is sick. Theamount paid equals the
cost of the appropriate treatment for the person's disease; if there is more than one disease, the
payments vary. Since each disease requires a fixed amount of care --there is no more nor less that
a person can consume -- there are no wasted resources in the policy; the indemnity insurance plan
is efficient. Beyond its efficiency properties, the indemnity policy is the simplest health insurance
policy. In effect, it operates as a contingent claims market; people get paid specifiedamount
depending on which contingency occurs (Zeckhauser, 1970).
Health insurance started off as a quasi-indemnity policy — in most cases paying a fixed
amount per day in the hospital. The first Blue Cross policies, for example, were developed just
before and during the Great Depression. These policies, run by hospitals, guaranteed a certain
number of hospital days per year (for example, 21 days) for an annual premium (for example, $5 to
$10 in the early 1930s). After World War II, life insurance companies entered the health insurance
market, driven by the profits of Blue Cross policies and the expanding demand for health insurance
resulting from its favorable tax treatment. These nascent health insurers offered indemnity policies
as well, limiting their potential losses by fixing the maximum amount they would pay per hospital
14
day.
III. Moral Hazard and Principal-Agent Problems
Health insurance must address several problems beyond risk spreading. We now turn to
some of these challenges.
III.] Moral hazard
Moral hazard refers to the likely malfeasance of an individual making purchases that are
partly or fuiiy paid for by others (Arrow, 1965; Pauly, 1968, 1974; Zeckhauser, 1970; Spence and
Zeckhauser, 1971; Kotowitz, 1987). ll He will overspend; i.e., he will use more services than he
would were he paying for the medical care himself. Since insurance is an arrangement where others
pay for the lion's share of one's losses, it creates a moral hazard to use additionalmedical resources.
The designation moral hazard, a disquieting term, frequently connotes some moral failure of
individuals, but this is not meant to be so. Indeed, Kenneth Arrow (1985) employs the less
judgmental and more informative term "hidden action" for moral hazard.
Moral hazard is a concern because it conflicts with risk-spreading goals. Insurance is
valuable because it allows people to transfer income from when they need it less to when they need
" The theory of moral hazard, if not the words, goes back at least to Adam Smith: "The
directors of such companies, however, being the managers rather of other peoples' money than oftheir own, it cannot well be expected, that they should watch over it with the same anxious vigilancewith which the partners in a private copartnery frequently watch over their own... Negligence andprofusion, therefore, must always prevail, more or less, in the management ofthe affairs of such a
company" (Smith, 1776, p. 700).
15
it more. But this transfer is not perfect becausepeople increase their consumption of medical care
when it is subsidized. This creates an inherent second best problem in designing insurance policies:
insurers must trade off the benefits from spreading more risk against the cost of increased moral
hazard. We formalize this Lesson 1 about health insurance:
Lesson 1: Risk Spreading versus Incentives. Health insurance involves a fundamental
tradeoff between risk spreading and appropriate incentives. Increasing the generosity of
insurance spreads risk more broadly but also leads to increased losses because individuals
choose more care (moral hazard) and providers supply more care (J)rincipal-agent problems).
Moral hazard, or hidden action, emerges in one form in the risks that individuals choose to
take. People may take worse care of themselves when they have insurance than if they do not. If
their actions were readily observed, the insurance company would merely not pay off were they
reckless or negligent. But individual actions are difficult to observe; they are hidden. The extent
of moral hazard in terms of actions that affect health may not be large for health insurance in most
instances, since the uncompensated loss of health itself is so consequential.2 Thus, it would be
surprising if people smoked because they knew health insurance would cover the costs of lung
cancer.
Hidden action also arises because individuals may get treatments they would not pay for
themselves. Though the action itself (seeking medical care) is not hidden, the motivation behind it
12 This does not mean that people will not smoke or faithfully take their medications. Butthere is no moral hazard if their actions would be the same if they hadno health insurance, i.e., ifthese health-harming behaviors are inelastic with respect to cost sharing.
16
is.'3
Optimal insurance plans would pay for treatment only if the individual would have chosen
the same treatment had he borne the full bill. The thought experiment here is whether theperson
would pay for the medical expenditure in expectation, before he knew his condition. For example,
suppose that a person has income of $25,000, and faces a 1 percent probability he will have a serious
illness. If he could commit in advance, he would agree to receive $50,000 of medical care when sick
in exchange for a $500 premium. If fully insured, however, the individual will choose to consume
$60,000 of care. The moral hazard in this example is $10,000— the additional spending beyond the
optimal amount of care he would contract for in advance of being sick.
In the terminology of demand theory, moral hazard is the substitution effect of people
spending more on medical care when its price is low, not the income effect of people spending more
on medical care because of insurance, by efficiently transferring resources from the healthy state to
the sick state, makes them richer when sicker (de Meza, 1983). In the example considered, say the
individual would have spent half his income, $12,500, on medical care in the absence of insurance.
Insurance thus raises medical spending by $47,500, but only a fraction of this increase is due to
moral hazard.
If some fixed m were the known optimal medical expenditure for any sick person, insurance
plans need experience no moral hazard. They could simply pay m in medical expenditures to or for
those who are sick. Moral hazard arises because medical needs are not fully monitorable, and
different people with the same condition have different optimal expenditures, at least as best the
3 hazard also results from patients making less effort to search for low-cost providers.For example, when patients pay but one-fifth of the cost of their drugs, they will have weakincentives to switch to generic brands or stray beyond the local pharmacy.
17
insurance company can determine. Suppose that the optimal medical expenditure for treating a
particular condition is rn, which varies across people, indexed by i. The insurance company requires
the individual to pay a coinsurance amount c(m) for medical care received. The rest of the care, m-
c(m), is paid by the insurer. In effect, the insurer takes the individual's medical expenditure to be
a signal of his true medical needs the coinsurance payment creates the necessary costs to have
signaling operate.
Two polar extremes for the form of c(m) are commonly found. The first is the indemnity
policy discussed above: the insurer pays a fixed amount, call it m*, and the individual pays c(m) =
m - m*. The second is full insurance: the insurer pays the full costs of medical care, regardless of
its cost, and the individual pays nothing (i.e., c(m) =0). The full insurance policy removes all risk
from the insured, but engenders greater moral hazard.
To understand the optimal insurance policy, consider a case where an indemnity policy is not
optimal. Suppose that rather than being healthy or sick, the individual has a range of potential illness
seventies, s, with s distributed with density function f(s). Health is given as before by hH[s,m].
The patient's s will determine the optimal treatment. The insurer cannot observe s, however. Thus,
making a fixed indemnity payment to anyone sick is not optimal. The ex ante utility function for the
insured consumer is:
(7) V1 = J U(y-t-c(m(s)), H[s,m(s)]) f(s) ds
where rn(s) tells how much medical care an individual with condition s chooses to receive.
We consider first the optimal policy -- the amount of medical services the person would like
to contract for if he could write a perfect state-contingent contract and thereby eliminate moral
hazard. A perfect contract is one that pays an indemnity amount conditional on s, financing the
18
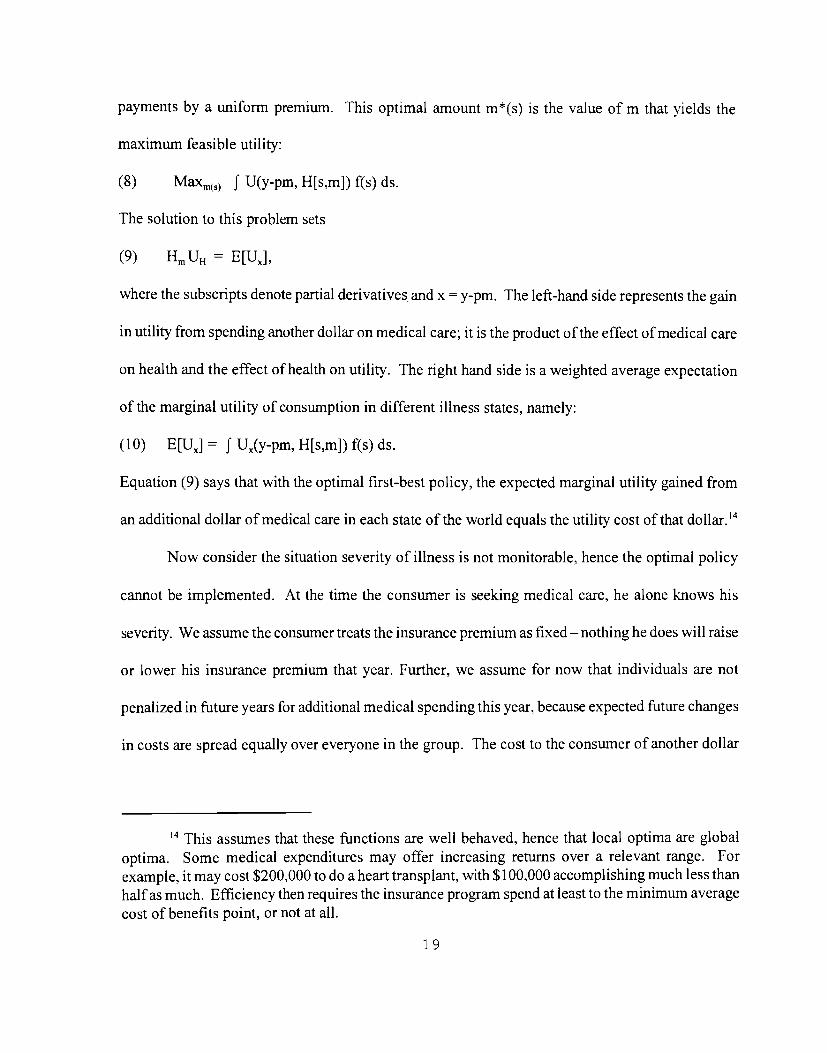
payments by a uniform premium. This optimal amount m*(s) is the value of m that yields the
maximum feasible utility:
(8) Maxm(S) f U(y-pm, H[s,m]) f(s) ds.
The solution to this problem sets
(9) HmUH = E[U],
where the subscripts denote partial derivatives and x =y-pm. The left-hand side represents the gain
in utility from spending another dollar on medical care; it is the product of the effect of medical care
on health and the effect of health on utility. The right hand side is a weighted average expectation
of the marginal utility of consumption in different illness states, namely:
(10) E[U] = f U(y-pm, H[s,m]) f(s) ds.
Equation (9) says that with the optimal first-best policy, the expected marginal utility gained from
an additional dollar of medical care in each state of the world equals the utility cost of that dollar)4
Now consider the situation severity of illness is not monitorable, hence the optimal policy
cannot be implemented. At the time the consumer is seeking medical care, he alone knows his
severity. We assume the consumer treats the insurance premium as fixed —nothing he does will raise
or lower his insurance premium that year. Further, we assume for now that individuals are not
penalized in future years for additional medical spending this year, because expected future changes
in costs are spread equally over everyone in the group. The cost to the consumer of another dollar
14 This assumes that these functions are well behaved, hence that local optima are globaloptima. Some medical expenditures may offer increasing returns over a relevant range. Forexample, it may cost $200,000 to do a heart transplant, with $100,000 accomplishing much less thanhalf as much. Efficiency then requires the insurance program spend at least to the minimum averagecost of benefits point, or not at all.
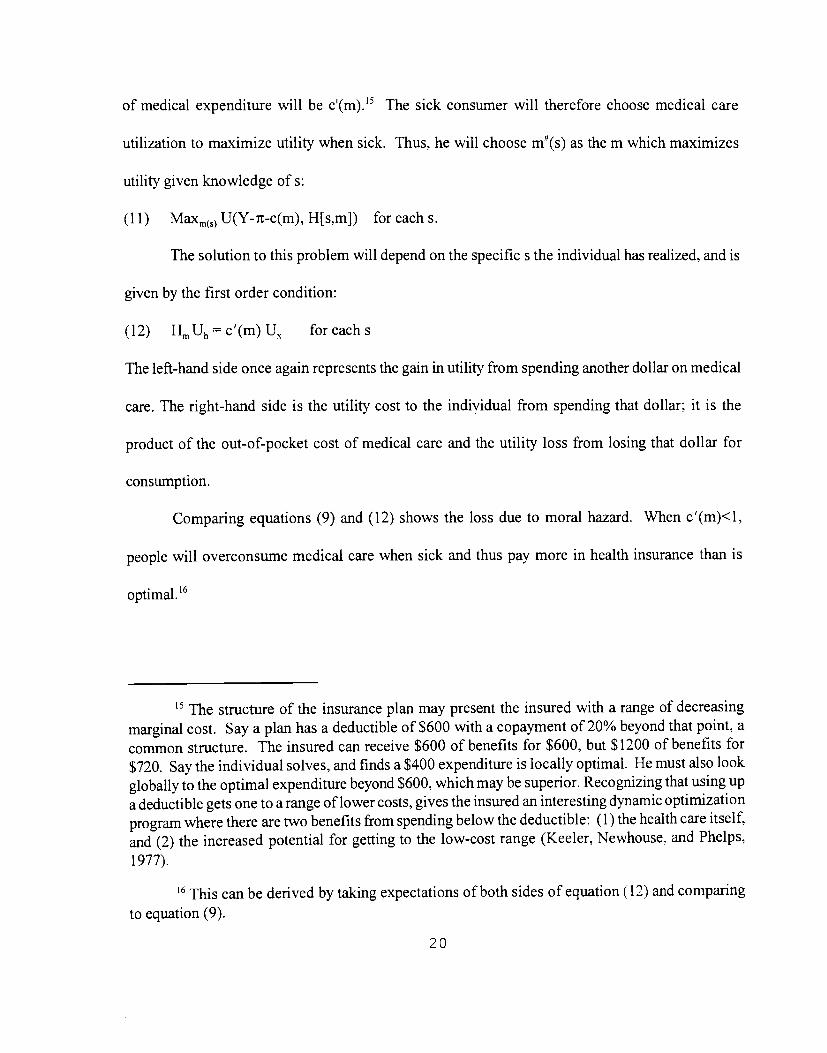
of medical expenditure will be c'(m).'5 The sick consumer will therefore choose medical care
utilization to maximize utility when sick. Thus, he will choose ma(s) as the m which maximizes
utility given knowledge of 5:
(11) Maxm(S) U(Y-it-c(m), H[s,m}) for each s.
The solution to this problem will depend on the specific s the individual has realized, and is
given by the first order condition:
(12) HmUh = c'(m) U, for each s
The left-hand side once again represents the gain in utility from spending another dollar on medical
care. The right-hand side is the utility cost to the individual from spending that dollar; it is the
product of the out-of-pocket cost of medical care and the utility loss from losing that dollar for
consumption.
Comparing equations (9) and (12) shows the loss due to moral hazard. When c'(m)<l,
people will overconsume medical care when sick and thus pay more in health insurance than is
optimal. 16
The structure of the insurance plan may present the insured with a range of decreasingmarginal cost. Say a plan has a deductible of $600 with a copayment of 20% beyond that point, acommon structure. The insured can receive $600 of benefits for $600, but $1200 of benefits for$720. Say the individual solves, and finds a $400 expenditure is locally optimal. He must also lookglobally to the optimal expenditure beyond $600, which may be superior. Recognizing that using upa deductible gets one to a range of lower costs, gives the insured an interesting dynamic optimizationprogram where there are two benefits from spending belowthe deductible: (1) the health care itself,and (2) the increased potential for getting to the low-cost range (Keeler, Newhouse, and Phelps,1977).
16 This can be derived by taking expectations of both sides of equation (12) and comparing
to equation (9).
20
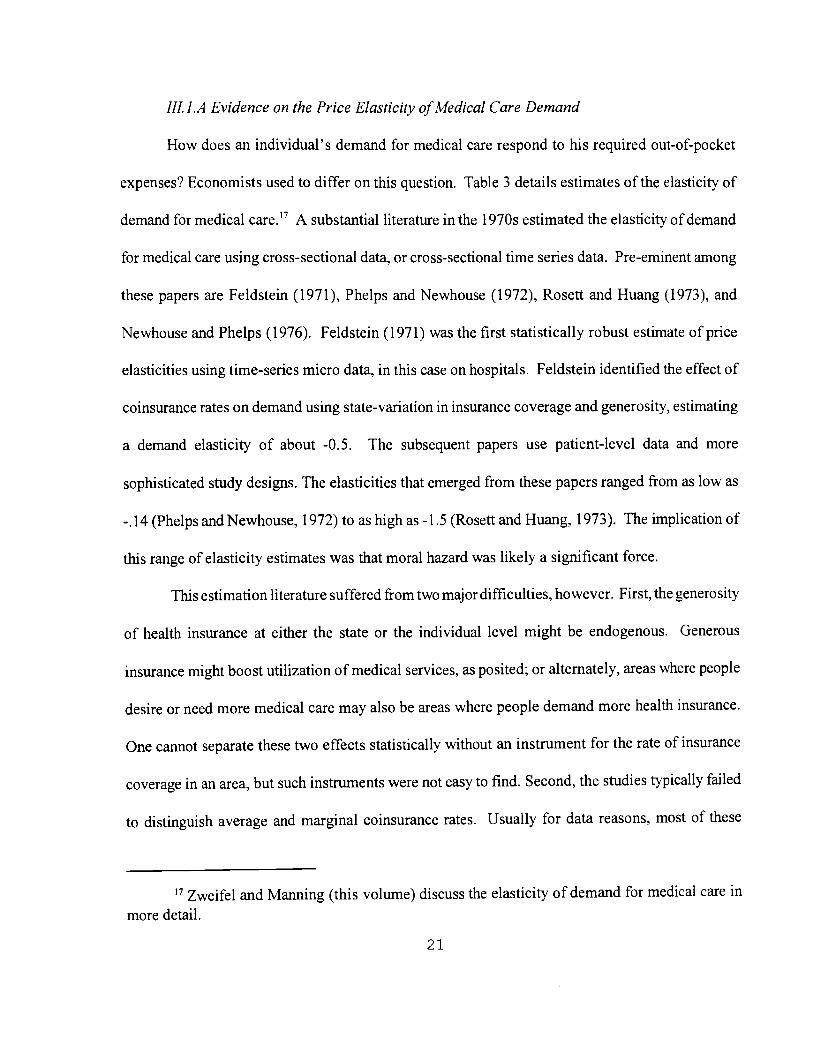
III. l.A Evidence on the Price Elasticity of Medical Care Demand
How does an individual's demand for medical care respond to his required out-of-pocket
expenses? Economists used to differ on this question. Table 3 details estimates of the elasticity of
demand for medical care.'7 A substantial literature in the 1970s estimated the elasticity of demand
for medical care using cross-sectional data, or cross-sectional time series data. Pre-eminent among
these papers are Feldstein (1971), Phelps and Newhouse (1972), Rosett and Huang (1973), and
Newhouse and Phelps (1976). Feldstein (1971) was the first statistically robust estimate of price
elasticities using time-series micro data, in this case on hospitals. Feldstein identified the effect of
coinsurance rates on demand using state-variation in insurance coverage and generosity, estimating
a demand elasticity of about -0.5. The subsequent papers use patient-level data and more
sophisticated study designs. The elasticities that emerged from these papers ranged from as low as
-.14 (Phelps andNewhouse, 1972) to as high as -1.5 (Rosett and Huang, 1973). The implication of
this range of elasticity estimates was that moral hazard was likely a significant force.
This estimation literature suffered from two major difficulties, however. First, the generosity
of health insurance at either the state or the individual level might be endogenous. Generous
insurance might boost utilization of medical services, as posited; or alternately, areas where people
desire or need more medical care may also be areas where people demand more health insurance.
One cannot separate these two effects statistically without an instrument for the rate of insurance
coverage in an area, but such instruments were not easy to find. Second,the studies typically failed
to distinguish average and marginal coinsurance rates. Usually for data reasons, most of these
17 Zweifel and Manning (this volume) discuss the elasticity of demand for medical care inmore detail.
21
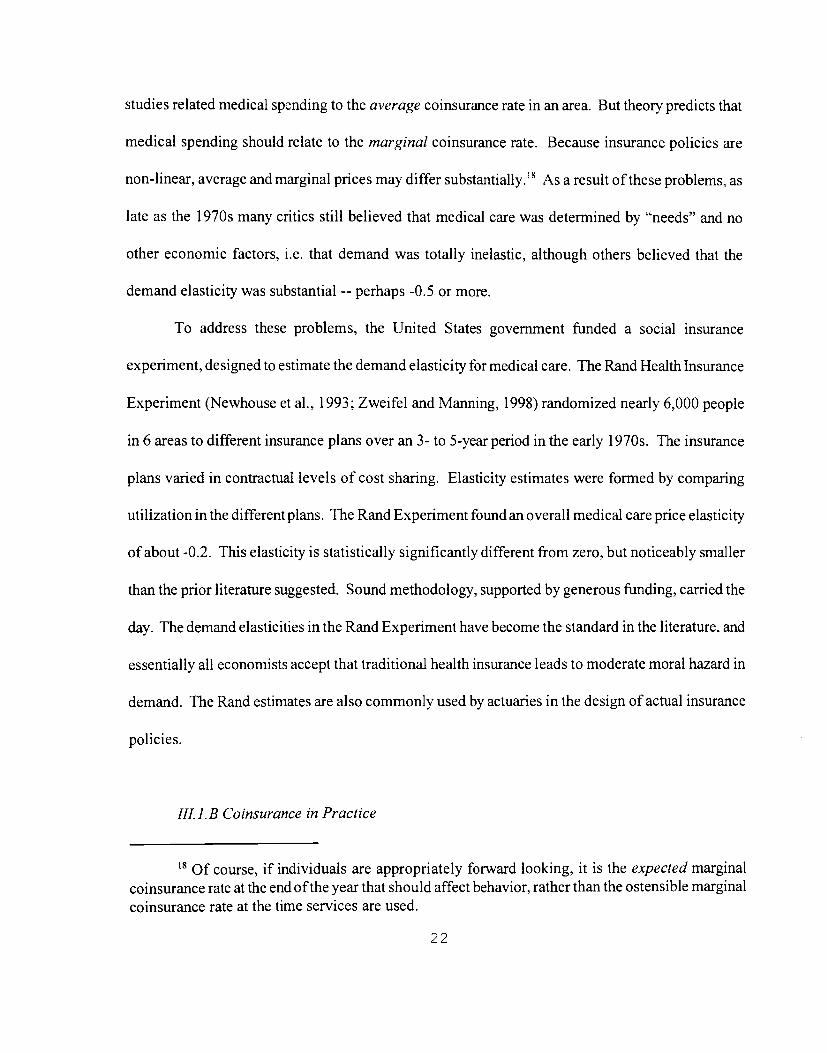
studies related medical spending to the average coinsurance rate in an area. But theory predicts that
medical spending should relate to the marginal coinsurance rate. Because insurance policies are
non-linear, average and marginal prices may differ substantially.18 As a result of these problems, as
late as the 1970s many critics still believed that medical care was determined by "needs" and no
other economic factors, i.e. that demand was totally inelastic, although others believed that the
demand elasticity was substantial -- perhaps -0.5 or more.
To address these problems, the United States government funded a social insurance
experiment, designed to estimate the demand elasticity for medical care. The Rand Health Insurance
Experiment (Newhouse et al., 1993; Zweifel and Manning, 1998) randomized nearly 6,000 people
in 6 areas to different insurance plans over an 3- to 5-year period in the early 1 970s. The insurance
plans varied in contractual levels of cost sharing. Elasticity estimates were formed by comparing
utilization in the different plans. The Rand Experiment found an overall medical care price elasticity
of about -0.2. This elasticity is statistically significantly different from zero, but noticeably smaller
than the prior literature suggested. Sound methodology, supported by generous funding, carried the
day. The demand elasticities in the Rand Experiment have become the standard in the literature, and
essentially all economists accept that traditional health insurance leads to moderate moral hazard in
demand. The Rand estimates are also commonly used by actuaries in the design of actual insurance
policies.
III. 1.B Coinsurance in Practice
8 Of course, if individuals are appropriately forward looking, it is the expected marginalcoinsurance rate at the end of the year that should affect behavior, rather than the ostensible marginalcoinsurance rate at the time services are used.
22
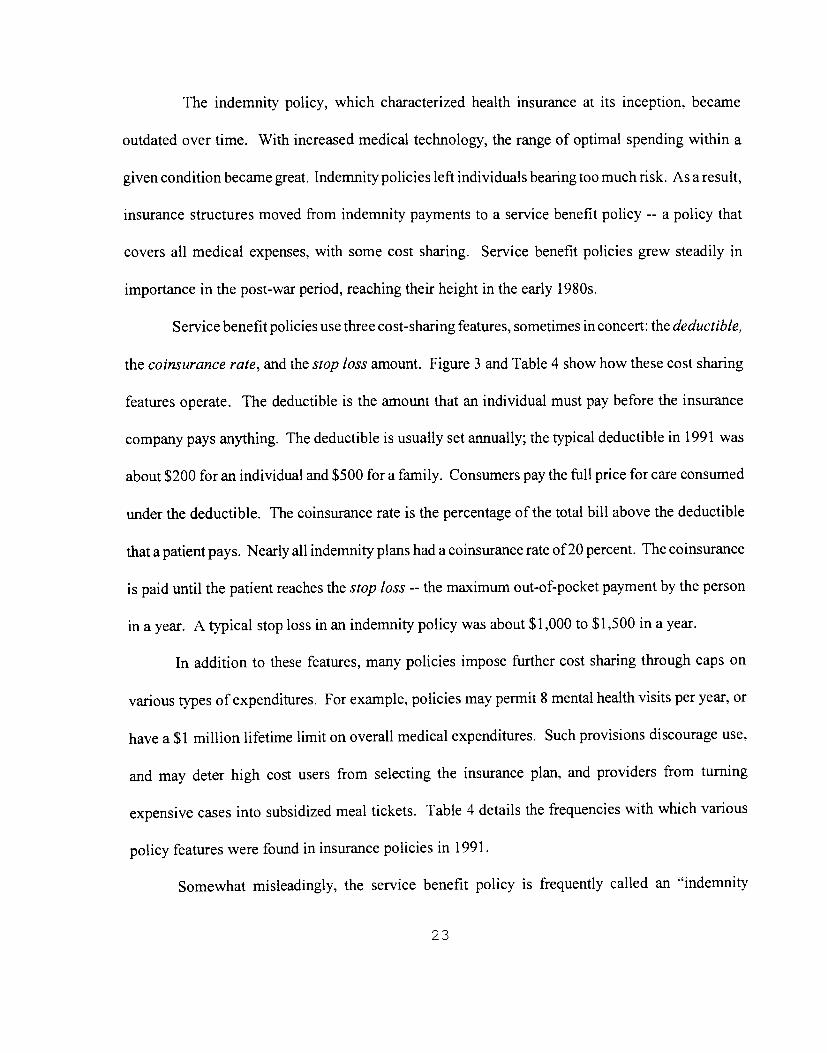
The indemnity policy, which characterized health insurance at its inception, became
outdated over time. With increased medical technology, the range of optimal spending within a
given condition became great. Indemnity policies left individuals bearing too much risk. As a result,
insurance structures moved from indemnity payments to a service benefit policy -- a policy that
covers all medical expenses, with some cost sharing. Service benefit policies grew steadily in
importance in the post-war period, reaching their height in the early 1980s.
Service benefit policies use three cost-sharing features, sometimes in concert: the deductible,
the coinsurance rate, and the stop loss amount. Figure 3 and Table 4 show how these cost sharing
features operate. The deductible is the amount that an individual must pay before the insurance
company pays anything. The deductible is usually set annually; the typical deductible in 1991 was
about $200 for an individual and $500 for a family. Consumers pay the full price for care consumed
under the deductible. The coinsurance rate is the percentage of the total bill above the deductible
that a patient pays. Nearly all indemnity plans had a coinsurance rate of2O percent. The coinsurance
is paid until the patient reaches the stop loss -- the maximum out-of-pocket payment by the person
in a year. A typical stop loss in an indemnity policy was about $1,000 to $1,500 in a year.
In addition to these features, many policies impose further cost sharing through caps on
various types of expenditures. For example, policies may permit 8 mental health visits per year, or
have a $1 million lifetime limit on overall medical expenditures. Such provisions discourage use.
and may deter high cost users from selecting the insurance plan, and providers from turning
expensive cases into subsidized meal tickets. Table 4 details the frequencies with whichvarious
policy features were found in insurance policies in 1991.
Somewhat misleadingly, the service benefit policy is frequently called an 'indemnity
23
insurance plan" by economists, with the system that developed to provide this policy termed the
"indemnity insurance system". In fact, true indemnity health insurance policies (a fixed payment per
disease) had existed but were largely replaced by the service benefit policy. For consistency with
other literature, we follow this nomenclature despite its inaccuracies. This nomenclature is
particularly unfortunate since recently insurance has been moving back towards the indemnity model,
frequently with the risk of above-average spending being placed on the provider rather than the
patient. We discuss regimes of provider responsibility in Section IV.
III]. C Optimal Insurance Given Moral Hazard
Knowledge of the utility function and the parameter values that determine medical spending
elasticities can be combined to design the optimal insurance policy -- the actuarially fair policy that
maximizes expected utility subject to the constraint that individuals will act in a self-interested
fashion, i.e., that moral hazard will operate. Such a policy is inherently second-best; in calibrating
its level of generosity, it balances the utility benefits of greater risk-sharing across people against the
moral hazard costs incurred. The insurer's challenge is to define the function of risk sharing by
insureds, the c(m) function, that maximizes expected utility.
To analyze the optimal policy, we assume patients differ in the severity of their illness.19 The
insurer will seek to find the c*(m) function that produces the maximum possible expected utility
with:
(13) E{U*J = MaxC(,fl) S U(Y_1t_c*(m), H[s,m#]) f(s)ds,
19 Moral hazard arises, let us remember, because individuals differ in unmonitorable ways.Thus it could be on income, on health status, or on some aspect of preferences.
24
where m# is defined as the solution to equation (12). Because insurers cannot tell an individual's
health state, the insurance policy cannot differentiate payments on the basis of illness severity.
An additional constraint operates on the insurance company: premiums must cover expected
costs. Thus.
(14) it = 5 {m#(s) - c(m(s))]f(s)ds.
The optimal insurance policy can be formally written as a problem in dynamic optimization
(Blomqvist, 1 997)•20 Alas, this is a complicated problem, whose algebra is not particularly revealing.
The analytic solution balances two factors. The first is the reduced overconsumption from making
people pay more out of pocket for medical care. If the coinsurance rate is increased in some range,
people in that range pay more for medical care, as do people at all higher levels of spending (because
their coinsurance rates have been increased). This increases boosts the efficiency of provision.
Countering this, however, is a loss in risk spreading benefits. As people are made to pay more out
of pocket, they are exposed to more risk, and this reduces their welfare. The optimal coinsurance
rate balances these two incentives.
A small literature has simulated optimal insurance policies using this framework. Table 5
shows the results of these simulations. Table 5 shows a wide range of disparities in optimal
insurance policies. Some of the studies find that simulated insurance policies are substantially less
generous than actual indemnity policies of the past 20 years (Feldstein and Friedman. 1977;
Blomqvist, 1997), while other studies find that they are about the same (Buchanan et al., 1991;
20 The problem is formally analogous to the optimal tax problem in public finance whenability is unobservable (Mirrlees, 1971; Diamond, 1998).
25
Newhouse et al., 1993: Manning and Marquis, 1996).21 The difference between these various
estimates has not been fully reconciled, although one suspects that differing degrees of risk aversion
and moral hazard are important. One suspects that real world policies will be more generous than
optimal policies because of the tax distortions favoring more generous insurance: payments to
insurance which are then made to providers are not taxed as income to employees, while wage and
salary payments, which might be used to pay for medical care out-of-pocket, are. Indeed, other
research shows that the benefits that employer health insurance policies offer are sensitive to
employee tax rates (Pauly, 1986).
A second importance difference between real world and optimal policies is that the former
almost invariably have a constant coinsurance rate, i.e., linear structures, whereas the latter donot.
The optimal policy can be substantially superior. Blomqvist (1997), for example, finds that
coinsurance rates should range from over 25 percent at low levels of spending to 5 percent at high
levels of spending. There is likely a tradeoff between optimality and simplicity. Optimal policies
can be very complicated, while real world situations are characterized by relatively simplistic
structures.
If services or diseases differ in the degree of moral hazard they entail, the optimal insurance
policy will differ by service or disease as well. Suppose, for example, there is a fixed number of
diseases that a person can have and that moral hazard varies by disease. The insurance company can
observe the disease of the person (e.g., cancer or appendicitis) but not the severity of illness within
the disease. Then, the optimal insurance policy will have different cost sharing by disease
21 The implication of the Blomqvist estimates for health insurance cost sharing depend onwhether income losses are compensated or not.
26
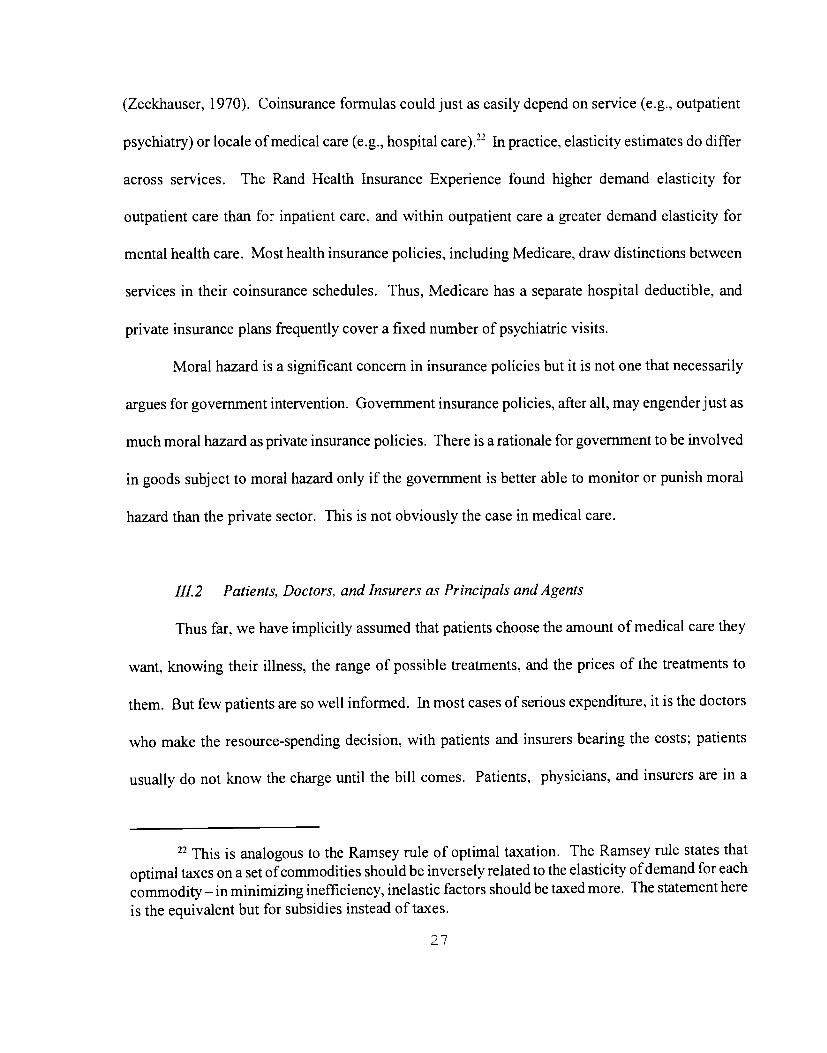
(Zeckhauser, 1970). Coinsurance formulas could just as easily depend on service (e.g., outpatient
psychiatry) or locale of medical care (e.g., hospital care).22 In practice, elasticity estimates do differ
across services. The Rand Health Insurance Experience found higher demand elasticity for
outpatient care than for inpatient care, and within outpatient care a greater demand elasticity for
mental health care. Most health insurance policies, including Medicare, draw distinctions between
services in their coinsurance schedules. Thus, Medicare has a separate hospital deductible, and
private insurance plans frequently cover a fixed number of psychiatric visits.
Moral hazard is a significant concern in insurance policies but it is not one that necessarily
argues for government intervention. Government insurance policies, after all, may engender just as
much moral hazard as private insurance policies. There is a rationale for government to be involved
in goods subject to moral hazard only if the government is better able to monitor or punish moral
hazard than the private sector. This is not obviously the case in medical care.
111.2 Patients, Doctors, and Insurers as Principals and Agents
Thus far, we have implicitly assumed that patients choose the amount of medical care they
want, knowing their illness, the range of possible treatments, and the prices of the treatments to
them. But few patients are so well informed. In most cases of serious expenditure, it is the doctors
who make the resource-spending decision, with patients and insurers bearing the costs; patients
usually do not know the charge until the bill comes. Patients, physicians. and insurers arein a
22 This is analogous to the Ramsey rule of optimal taxation. The Ramsey rule states thatoptimal taxes on a set of commodities should be inversely related to the elasticity ofdemand for each
commodity — inminimizing inefficiency, inelastic factors should be taxed more. The statement hereis the equivalent but for subsidies instead of taxes.
27
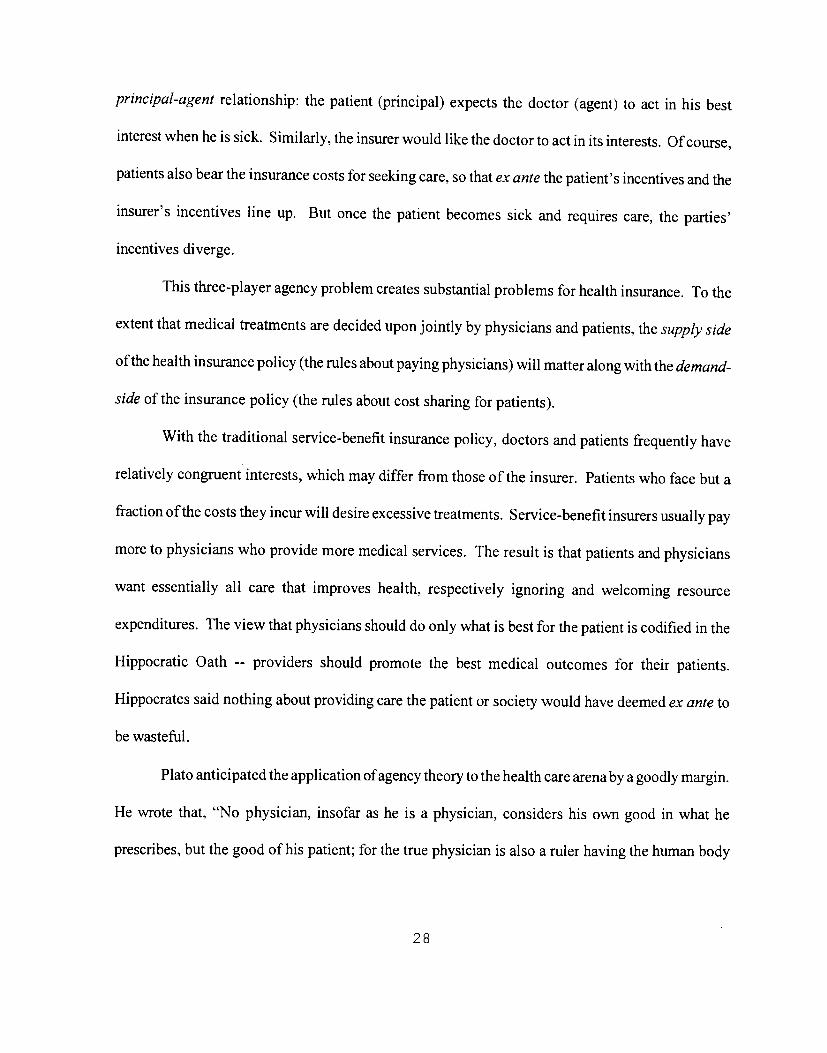
principal-agent relationship: the patient (principal) expects the doctor (agent) to act in his best
interest when he is sick. Similarly, the insurer would like the doctor to act in its interests. Ofcourse,
patients also bear the insurance costs for seeking care, so that ex ante the patient's incentives and the
insurer's incentives line up. But once the patient becomes sick and requires care, the parties'
incentives diverge.
This three-player agency problem creates substantial problems for health insurance. To the
extent that medical treatments are decided upon jointly by physicians and patients, the supply side
of the health insurance policy (the rules about paying physicians) will matteralong with the demand-
side of the insurance policy (the rules about cost sharing for patients).
With the traditional service-benefit insurance policy, doctors and patients frequently have
relatively congruent interests, which may differ from those of the insurer. Patients who face but a
fraction of the costs they incur will desire excessive treatments. Service-benefit insurersusually pay
more to physicians who provide more medical services. The result is that patients and physicians
want essentially all care that improves health, respectively ignoring and welcoming resource
expenditures. The view that physicians should do only what is best for the patient is codified in the
Hippocratic Oath -- providers should promote the best medical outcomes for their patients.
Hippocrates said nothing about providing care the patient or society would have deemed ex ante to
be wasteful.
Plato anticipated the application of agency theory to the health care arena by a goodly margin.
He wrote that, "No physician, insofar as he is a physician, considers his own good in what he
prescribes, but the good of his patient; for the true physician is also a ruler having the human body
28
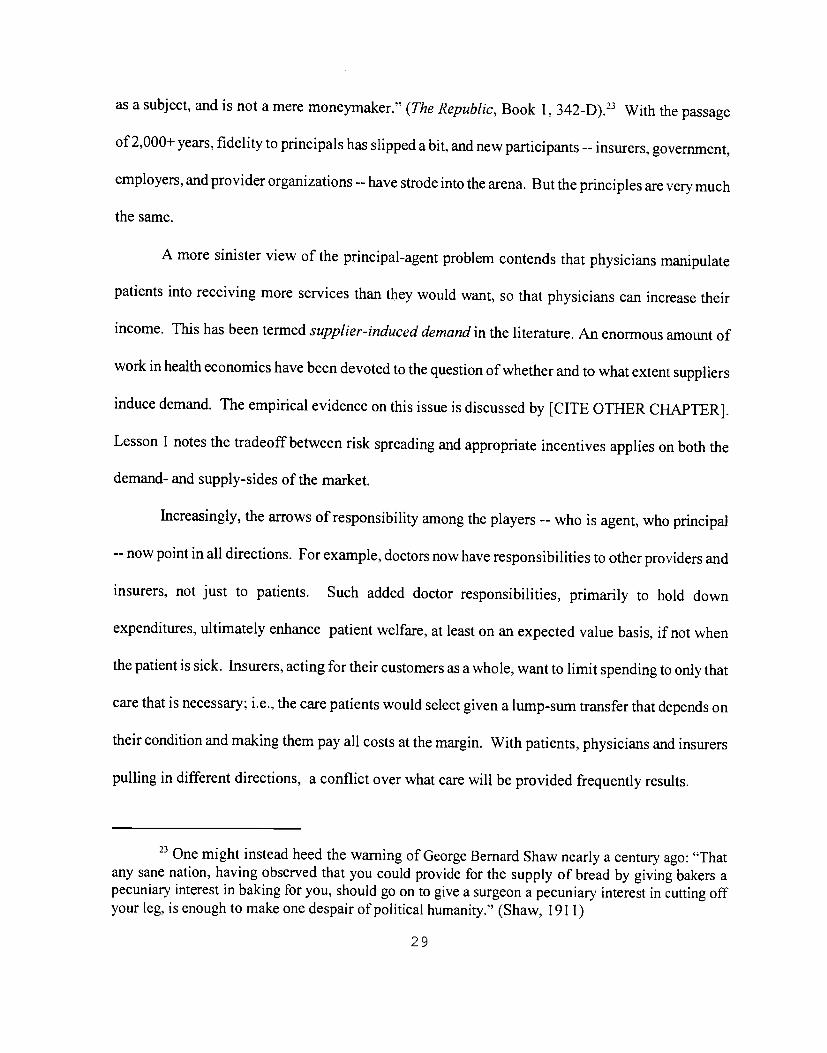
as a subject, and is not a mere moneymaker." (The Republic, Book 1, 342-D).23 With thepassage
of 2,000+ years, fidelity to principals has slipped a bit, andnew participants -- insurers, government,
employers, and provider organizations --have strode into the arena. But the principles are very much
the same.
A more sinister view of the principal-agent problem contends thatphysicians manipulate
patients into receiving more services than they would want, so that physicians can increase their
income. This has been termed supplier-induced demand in the literature. Anenormous amount of
work in health economics have been devoted to the question of whether and to whatextent suppliers
induce demand. The empirical evidence on this issue is discussed by [CITE OTHERCHAPTER].
Lesson 1 notes the tradeoff between risk spreading and appropriate incentivesapplies on both the
demand- and supply-sides of the market.
Increasingly, the arrows of responsibility among the players --who is agent, who principal
-- nowpoint in all directions. For example, doctors now have responsibilities to other providers and
insurers, not just to patients. Such added doctor responsibilities, primarily to hold down
expenditures, ultimately enhance patient welfare, at least on an expected value basis, if not when
the patient is sick. Insurers, acting for their customers as a whole, want to limit spending toonly that
care that is necessary; i.e., the care patients would select given a lump-sum transfer that depends on
their condition and making them pay all costs at the margin. With patients, physicians and insurers
pulling in different directions, a conflict over what care will be provided frequently results.
23 One might instead heed the warning of George Bernard Shaw nearly a century ago: "Thatany sane nation, having observed that you could provide for the supply of bread by giving bakers apecuniary interest in baking for you, should go on to give a surgeon a pecuniary interest in cutting offyour leg, is enough to make one despair of political humanity." (Shaw, 1911)
29
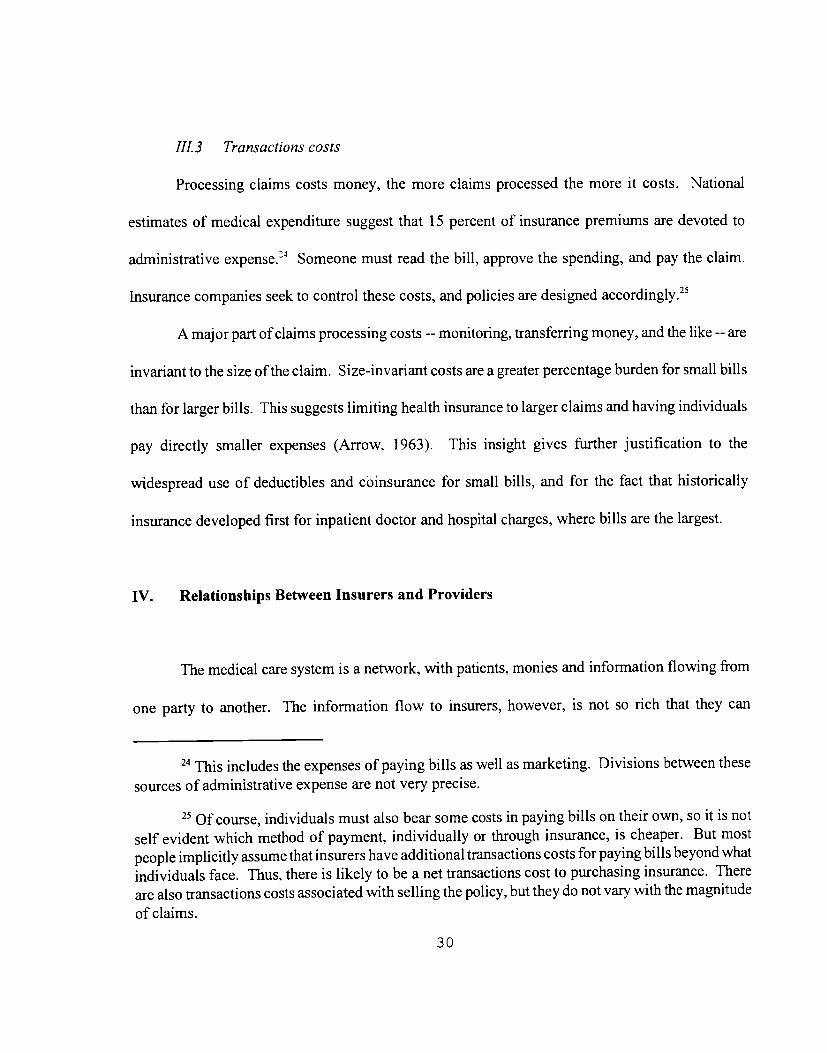
111.3 Transactions costs
Processing claims costs money, the more claims processed the more it costs. National
estimates of medical expenditure suggest that 15 percent of insurance premiums are devoted to
administrative expense.4 Someone must read the bill, approve the spending, and pay the claim.
Insurance companies seek to control these costs, and policies are designed accordingly.25
A major part of claims processing costs -- monitoring, transferring money, and the like --are
invariant to the size of the claim. Size-invariant costs are a greater percentage burden for small bills
than for larger bills. This suggests limiting health insurance to larger claims and having individuals
pay directly smaller expenses (Arrow, 1963). This insight gives further justification to the
widespread use of deductibles and coinsurance for small bills, and for the fact that historically
insurance developed first for inpatient doctor and hospital charges, where bills are the largest.
IV. Relationships Between Insurers and Providers
The medical care system is a network, with patients, monies and information flowing from
one party to another. The information flow to insurers, however, is not so rich that they can
24 This includes the expenses of paying bills as well as marketing. Divisions between thesesources of administrative expense are not very precise.
25 Of course, individuals must also bear some costs in paying bills on their own, so it is notself evident which method of payment. individually or through insurance, is cheaper. But mostpeople implicitly assume that insurers have additional transactions costs for payingbills beyond whatindividuals face. Thus, there is likely to be a net transactions cost to purchasing insurance. Thereare also transactions costs associated with selling the policy, but they do not vary with the magnitude
of claims.
30
guarantee that only cost-effective care will be provided. Their monitoringdifficulties provide the
motivation for cost-sharing in insurance policies. But cost sharing has limited value: Patients do not
make the most costly decisions, the Hippocratic Oath does not extend to conserving society's
resources, and risk spreading considerations severely limit what charges canbe imposed.
Return now to figure 1, the Medical Care Triad. Working solely on the left side of the
triangle, the demand side, these arguments suggest that passive insurers are unlikely to be able to
limit utilization appropriately. Recognizing this, insurers also work the right side of the triangle --
the supply side. Increasingly, insurers attempt to provide incentives for providers to limit spending.
The incentives may be imposed at arm's length, as Medicare does with its DRG system: treat a
simple heart attack, and a hospital gets paid a flat amount, roughly $5,000. Or the insurer may form
a contracting alliance with providers, as it does say with networkHMOs. At the extreme, insurers
and providers merge into a single entity. Uniting disparate organizations in this wayenhances
monitoring possibilities and better aligns incentives, but it also creates the potentialfor diseconomies
of scope, e.g., requiring another layer of management when care is delivered.
The sweeping nature of insurer-provider interactions is indicated by figure 4 (see also Glied,
1998). In 1980, over 90 percent of the privately insured-- i.e., employer- or self-paid -- population
in the United States was covered by "unmanaged" indemnity insurance. By 1996,that share had
shrunk to a mere 3 percent.
Table 6 provides a taxonomy of different insurance-provider arrangements. The most limited
arrangement is a "managed" indemnity insurance policy. It bundles a traditional indemnity policy
with limited utilization review, for example requiring that non-emergency hospital admissions be
precertified. At the most intrusive, insurers can seek tomonitor care on a retail basis through tissue
31
review committees, or on a statistical, wholesale basis by monitoring a physician or hospital'soverall
utilization. Such reviews can be used to refuse or reduce payment. Suchintrusiveness by insurers
may be unhelpful and, coming after-the-fact, may be ineffectual. It certainly is not welcome to
physicians. As Figure 4 shows, managed indemnity insurance, though non-existent in 1980, claimed
a 41 percent share by 1992, but has fallen to 22 percent today.
Preferred Provider Organizations (PPOs), a second type of managed care, form anetwork of
providers, including physicians, hospitals, pharmaceutical purveyors,and others, and control costs
by securing discounts from them. The quid pro quo forthe discounted fee is that insureds are steered
to in-network providers. Out-of-network providers may getreduced coverage or no coverage at all.
More typically, the patient's coinsurance or copayment rates are merely set lower for in-network
providers. In 1991, for example, the typical PPO had anin-network coinsurance rate of 10 percent
and an out-of-network coinsurance rate of 20 percent. PPOs usually impose pre-authorization
requirements as well, though they are rarely especially strict. As Figure 4 shows, PPO enrollment,
zero in 1980, now makes up about one-quarter of the privately insured population.
Full integration creates the strongest link between insuranceand provision. In the United
States, these merged entities are called healthmaintenance organizations (HMOs). They sell their
services directly to employers or individuals on an annual fee basis, and then they deliver care.
There are three major types of HMOs. Within a group/staffHMO -- the most common form, with
Kaiser being the best known example -- physicians are paid a salary and work exclusively for the
HMO. The HMO may have hospitals on contract, or may run its own.
HMOs employ a range of mechanisms to limit utilization. They reflect the traditional
economic instruments of regulation, incentives, and selection of types. HMOs frequently regulate
32
physicians' practices, for example limiting the referrals they can make or the tests they canorder.
But the efficiency benefits of HMOs arise much more from aligning the incentives of provider and
insurer, rather than through direct regulation. Some group/staff HMO physicians are salaried; as a
result, they have a weaker incentive to provide marginal care than their fee-for-service counterparts.
Moreover, HMOs monitor the services that physicians provide. They may reward parsimonious
resource use directly with compensation, though more likely with perks or subsequent promotion.
Extravagant users are kicked out of the network. Finally, since physicians differ substantiallyin their
treatment philosophies, HMOs can select physicians whose natural inclination is towardconservative
treatment.
Given the ability of HMOs to limit utilization on the supply-side, price-related demand-side
limitations can be less severe. Cost-sharing to enrollees is generally quite low -- typically about $5
to $10 per provider visit, although other forms of demand-side limitation survive (for example,
patients may have to get approval from their internist before seeing a specialist).
Independent Practice Associations (IPAs), or Network Model HMOs, represent a morerecent
innovation in managed care.26 These plans neither employ their own physicians nor run their own
hospitals. Instead, they contract with providers in the community. By limiting the size of the
network, the plans secure lower costs from willing providers. In addition, these plans employ
stringent review procedures. For example, patients mayneed approval to receive particular tests.
Finally, IPAs often provide financial incentives to limit the care that they provide. For example,
some plans pay physicians on a "capitated" basis. The physician receives a fixed payment per patient
per year. Out of this capitated stipend, the physician must pay for all necessary medical services,
26 Some IPAs are older, but thet form gained popularity only recently.
33
possibly including hospital services and prescription drugs. The physician's incentives for cost
control become even more significant when all expenditures come out of his own pocket.
In many HMOs, patients can go outside of the network and still receive some reimbursement.
This is termed a Point of Service [POS] option. But reimbursement out-of-network is not as
generous as reimbursement within. Use of non-network services, for example, frequently requires
a deductible followed by a 10 to 40 percent coinsurance payment.
As Figure 4 shows, HMOenrollment of all forms (including POS enrollment) has increased
from 8 percent of the population in 1980 (then predominantly group/staff model enrollment) to
nearly half of the privately insured population today.
This vertical integration in managed care, with insurers and providers linked or united, is
virtually unheard of in insurance of other types. Auto insurance, for example, is an indemnity policy.
People choose what coverage they will have, what deductibles will be in force, etc. When there is
a crash, the insured and the adjuster get together, perhaps at the repair shop, to negotiate the cost of
the repair. The insured or the repair shop, entities having no particular relationship to the insurer,
are paid that amount, less any deductibles, which are the responsibility of the insured. After major
crashes, cost-ineffective repairs are avoided by declaring the car a total loss, giving the wreck to the
insurance company and reimbursing the owner.
But such a contingent claims system could not work with health care. The claims are more
frequent and uncertainties much greater, making costs much harder and more expensive to estimate.
"Scrapping" a human body is rarely an inexpensive or palatable proposition. The burgeoning links
between insurers and providers in health care, we believe, are a response to the a priori difficulty
of writing contingent claims contracts in the medical sector.
34
Vertical integration is also important because it can elicit price discounts. Managed care
partly represents a price club. In exchange for an up-front fee, the patient gets to purchase goods at
a significant discount. The discounts are secured through bulk purchase bargaining, or by directly
hiring the sellers. In exchange for lower prices, patients precommit to receive care from a limited
set of providers, or to pay harshly for the privilege of going elsewhere.
Finally, vertical integration is important because it fundamentally transforms the principal-
agent conflicts in the medical system. Physicians no longer look out for the interests of just their
patients, or perhaps their patients' interests and their own. Now, physicians must watch out for the
insurer as well. And patients must be more attuned to the incentives their physician is under. We
note the integration of insurance and provision as the second lesson of health insurance:
Lesson 2: Integration oflnsurance and Provision. With medical care, unlike other insurance
markets, insurers are often directly involved in the provision of the good in addition to
insuring its cost. The integration of insurance and provision, intended to align incentives,
has increased over time. Managed care, where the fimctions are united, is an extreme
version. Under it, doctors have dual loyalties, to the insurer as well as to the patient.
IV.] Equilibrium Treatment Decisions in Managed Care
One can understand the impacts of managed care using a framework similar in spirit to what
we described for patient cost sharing, only the physician's choices are targeted. A typical physician
payment, for example, is
(15) Payment = R + r Cost.
35
Here, R is the prospective amount and r is the retrospective amount. A fully capitated system sets
r=O and R>O, while a fully retrospective system sets R=O and r� 1. Thus, the capitated system
focuses solely on incentives; the retrospective system removes all risk from the doctor.
Changing to a capitated system might affect treatment decisions in several ways. One effect
is to raise the physician's "shadow price" for providing treatment -- physicians might require a
greater expected health benefit before providing care under managed care than under traditional
indemnity insurance (Frank, Glazer, and McGuire, 1997; Keeler, Carter, and Newhouse, 1998).
This effect is particularly strong when the physician is capitated, and thus bears the marginal cost
for providing additional care.
In addition, managed care might hannonize treatment decisions across patients. Protocols
in managed care, for example, encourage or require physicians to treat patients with the same
condition similarly.
In both of these circumstances, the physician's views about optimal treatment may differ from
the patient's. Doctors may want to limit care while patients may want more. This divergence is
particularly likely if patients pay little at the margin for medical care, as they do in many managed
care plans (at least for in network services). The conflict of incentives between physicians and
patients in managed care contrasts with the situation in traditional indemnity insurance, where the
incentives of patients and physicians are generally aligned (although both differ from the incentives
of insurers).
Figure 5 shows a potential conflict; at the prices each faces, the patient demands much more
36
care (QD) than the physician wants to provide (Q). Which level of care will ultimately be
provided? Knowing how treatment decisions will be made in such an environment is difficult, as
economic analysis of rationed goods in general does not reach uniform conclusions. The situation
is particularly severe in the medical care market because patients do not pay substantial amounts at
the margin for medical care; thus, willingness to pay is not an accurate way of gauging individual
value of services. There are several possible outcomes. One possibility is that the short-side
principle applies, which predicts that the equilibrium quantity will be the lesser of demand and
supply. This is shown as the thickened line in figure 5 and corresponds to a situation where
treatment decisions in managed care are made predominantly by physicians. The short-side principle
underlies much of the work on managed care (see, e.g., Baumgardner, 1991; Ramsey and Pauly,
1997; Pauly and Ramsey, 1998).
But the short-side principle assumes patient wishes play no role when demand exceeds
supply. Treatment decisions may come out of a "bargaining" process that balances the wishes of
physicians and patients (Ellis and McGuire, 1990). One can interpret this bargaining either as an
explicit process between the parties, or as the physician balancing his own self-interest (or the
insurer's profits) with the best interests of the patient.
The actual level of service delivered is likely to vary with the particular medical situation.
Patients with chronic conditions may know a great deal about their treatment options; the outcome
may thus be close to the patient's demand. In emergencysituations, the opposite may be true. The
effectiveness of managed care in limiting medical spending may thus differ across settings.
27 have drawn the physician's supply curve as upward sloping. This needn't be. It couldbe vertical or backward bending. Our point would carry through, nevertheless.
37
IV 2 Evidence on Supply-side Payment and Medical Treatment
A substantial literature examines the role of supply-side payment systems in influencing
medical treatments. A change from retrospective, or cost-based reimbursement, to prospective
reimbursement is typically analyzed.
Table 7 presents studies on this topic. It documents the impact of prospective payment on
five aspects of hospital care: the number of admissions and transfers; average length of stay or other
inputs; hospital profits; and quality of care. Prospective payment might increase ordecrease hospital
admissions. On the one hand, sick people might be less likely to be admitted to a hospital under
prospective payment, since reimbursement for these individuals falls short of expected cost. On the
other hand, hospitals might be more eager to admit healthy patients, for whom reimbursement
exceeds costs. As table 7 shows, admissions generally declined with the implementation of
prospective payment.
While one might worry about whether care for the sick is excessively rationed in such a
system, the literature on whether patients are being "dumped"under prospective payment (e.g., sent
to public hospitals) is not particularly clear. A loose consensus is that there is some dumping of
patients under PPS, but the magnitude is not particularly great (Morrisey,Sloan, and Valvona, 1988;
Newhouse, 1989; Newhouse, 1992).
Studies examining the effect of prospective payment on average lengths of hospital stayand
other inputs find nearly uniformly that average hospital stays fell with the reimbursement change.
This is what theory predicts: hospitals no longer paid for each additional service will cut back on
marginal care, which is expensive relative to health benefits. The effect of prospective payment on
hospitals stays is uniformly strong and impressive; manystudies find reductions of 20 to 25 percent
38
over a period of 5 years or less. These studies provide among the clearest evidence that supply-side
reimbursement changes do affect medical treatments.
Despite the reduction in average lengths of hospital stay, a number of studies find that profit
margins fell under prospective payment. This reduction in profits came largely from a reduction in
revenues. As the reduction in length of stay indicates, costs fell with the introduction of prospective
payment.
In addition to examining the effect of prospective payment on quality, the literature has also
examined how managed care as a whole affects medical spending. Studies of this quetion are
summarized elsewhere, including in this volume (Miller and Luft, 1997; Congressional Budget
Office, 1992; Glied, 1998); we discuss it only cursorily here.
Virtually all studies find that managed care insurance reduces medical spending in
comparison to traditional indemnity insurance. The consensus estimate would be that patientsunder
managed care spend about 10 percent less than patients in indemnity plans, adjusted for differences
in the underlying health of the two groups. The effect is somewhat greater for inpatient hospital
spending, but is offset by some additional outpatient utilization in managed care insurance. Overall,
therefore, incentives on the physician side clearly have an effect on overall utilization.
V. Optimal Mix of Demand and Supply-Side Controls
Given the availability of both demand and supply-side controls, which should be employed?
A first pass suggests that supply-side limitations are preferable, since providers are relatively less
risk averse than are patients. In practice, however, plans with both types of limitations are sold,and
39
indeed most plans available have a mix of demand- and supply-side cost containment features (for
example, capitation with high cost sharing on out-of-network use, or indenmity insurance with
utilization review).28
Both demand- and supply-side controls may be desirable in the presence of the other. First,
patients and providers may control different features of the medical interaction. For example, the
Rand Health Insurance Experiment found that patient cost sharing had a substantially greater impact
on the probability that a patient uses services than on the level of services provided conditional on
use (Newhouse et al., 1993). One can interpret this as saying that cost sharing affects insureds, but
not their physicians. The evidence cited above shows that managed care can limit the level of
services provided, however. An insurer or provider facing this situation might then want to combine
demand- and supply-side cost sharing, the former to limit the initiation of visits and the latter to
control the intensity of treatment provided within visits (Ma and McGuire, 1997).
Combining demand- and supply-side controls can also promote flexibility in types of
treatment. Consider the situation in Figure 6 (Baumgardner, 1991; Ramsey and Pauly, 1997; Pauly
and Ramsey, 1998). There are two types of patients: those who are moderately ill (denoted M), and
those who are more seriously ill (denoted S).29 Moderately ill patients demand less medical care at
any price than severely ill patients. We assume the insurer cannot distinguish the two groups,
however; thus, cost sharing or quantity restrictions must apply equally to the two.
28 The coexisting prevalence of both types of plans may be transitional, since managed careis still relatively new. But managed care plans have increasingly been incorporating more consumerchoice and cost sharing (for example, in out-of-network use). This suggests the combination is notjust transitional.
29 that this may apply conditional on a diagnosis. For example, the conditions could besevere and moderate heart attacks.
40
Given a price of medical care P, the optimal amounts of medical care to receive are QM and
Q respectively for the moderately and severely ill. With a coinsurance policy that requires the
patient to pay c for each unit of care, the equilibrium will be medical care levels of Q'M and Q.
Because of moral hazard, medical care demand will be too high. Insurers might alternately adopt
a fixed quantity constraint, for example Q for each patient.3° At Q, the right amount of medical care
is provided in total, but not for each patient; the moderately ill patient will receive too much medical
care, while the severely ill patient will not receive enough. Thus, neither demand- nor supply-side
cost containment by itself yields an optimal allocation.
Combining demand- and supply-side cost containment can improve the situation, however.
For example, starting from Q, raising coinsurance will discourage utilization by the moderately ill
person before the severely ill person (because the marginal value of care is much lower for the
former). If the coinsurance rate necessary to deter low value utilization is small, the risk spreading
loss from such coinsurance will be small, and the net welfare consequences of deterrence will be
positive. The ability to limit demand by the moderately ill person, in turn, allows an increase in (,
since this constraint applies only to the severely ill person. Indeed, if demand for the moderately ill
person is fully constrained by the cost sharing, Q could be increased to the optimal level of care for
the severely ill person. More generally, coinsurance and constrains can be combined to enable
rationing in more than one dimension whether there is heterogeneity of optimal treatment. A
combination of the two systems may be superior to using either system alone.
A third rationale for combining demand- and supply-side controls is to limit selection
behavior by providers. Providers paid on a capitated basis will have incentives to attract healthy
30 We assume that managed care features this type of restriction.
41
patients and "dump" sick ones, since the provider's payment is the same with the two patients but
the costs are much greater in treating the sick patient. Incorporating patient cost sharing into the
insurance policy can relax the supply-side constraints and thus limit the incentives to dump patients
(Ellis, 1998). We return to this type of adverse selection in the next section.
Theoretical results to date generally suggest a combination of demand- and supply-side
controls may offer significant advantages. Moreover, with so many differing incentives in the
medical care system, optimal reimbursement schemes undoubtedly differ across specialties (for
example, in response to moral hazard propensities) and groups of providers (for example, if the
ability to bear risk differs with group size), which increases the potential for working both sides of
the market. The way demand- and supply-side systems interact with each other, however, is not well
understood; neither is the tradeoff between a fine-tuned system and a system that is simple and
comprehensible. Real world structures suggest simplicity has its virtues. It is noteworthy, for
example, that virtually all coinsurance operates at a flat rate between the deductible and any stop loss
amount.31
VI. Markets for Health Insurance: Plan Choice and Adverse Selection
To this point, we have talked of the design of a single health insurance plan. Most private
insurance in the United States is offered on a menu basis, however, with different insureds selecting
31 Simplicity and transparency may be a handicap. Conceivably insureds and doctors, notunderstanding what they will be respectively charged or paid for something, may behave morereasonably. For example, a low but complex coinsurance rate might be the best way to discourageutilization. It imposes less financial risk than, say, a higher flat rate, but might be just as effectivein controlling use.
42
different plans. Health insurance choice is a natural way to meet differing individual preferences.
Some people will prefer managed care insurance, which limits utilization but costs less, while others
will opt for a more open-ended indemnity-style policy. Within indemnity insurance policies, some
will be willing to bear more financial risk than others. Having these preferences reflected in market
outcomes is beneficial.
In addition, health insurance choice is important to promote efficiency. Customers shopping
for the lowest prices drive costs to their lowest level. Moreover, product characteristics will be
shifted and new produetsintroduced to meet consumer demands. These benefits of competition for
health insurance are analogous to the benefits competition yields in other markets.
But health insurance is fundamentally different from other markets in ways that create
harmful side effects from competition. The key problem is that with health insurance, unlike other
services or commodities, the identity of the buyer can dramatically affect costs. Insuring a 60 year
old costs 3 times as much as insuring a 30 year old, and among 30 year olds, some will have far
higher costs than others. Who one pools with in health insurance dramatically affects what one has
to pay.
Generally, the sick are drawn to more generous plans than the healthy. Those expecting to
use more services will, all else equal, want more generous policies than those expecting to use fewer
services. If plans could charge individuals their expected cost for enrolling in each plan, the market
would efficiently sort people. Such charges are generally not imposed, however, since it is widely
believed that it is not fair to make people pay a lot more just because they are sick. Knowing the
individual-specific prices may also not be technically feasible.
When plans can only charge average prices, generous plans will disproportionately attract
43
sicker people, and more moderate plans will disproportionately attract healthier ones. This
phenomenon is termed adverse selection (Akerlof, 1970; Arrow, 1985). As a result of adverse
selection, generous plans will have to charge premiums above moderate plans not only because they
offer more benefits but also because they attract a worse mix of enrollees. These premium
differentials, if passed on to insureds, will tilt unfairly against generous plans.32
Adverse selection into more generous plans leads to two fundamental difficulties. First,
people will choose to be in less generous plans, so that they can avoid paying for the higher costs of
very sick people. Second, plans will have incentives to distort their offerings to attract the healthy
and repel the sick. Since no plan would like to enroll the sickest people, all plans will find it
profitable to distort their benefits. Indeed, even innovations that improve quality of health care may
be unattractive to plans even if they come without additional cost, if they attract the wrong people.
The distortion in plan provisions resulting from adverse selection is variously termed plan
manipulation, skimping (Ellis, 1998), or stinting (Newhouse, 1997).
The consequences of these undesired side effects of competition are felt in market
equilibrium. The equilibrium with adverse selection may be inefficient; it may not even exist. We
express this as the third lessons of health insurance:
Lesson 3: Competition When Consumer Identity Matters. When consumer identity affects
costs, competition is a mixed blessing. Allowing individuals to choose among competing
health insurance plans can allocate people to appropriate plans and provide incentives for
32 This would happen, for example, if employers make a fixed dollar contribution to thepremiums of each plan offered to their employees. The converse is also true; if employers heavilysubsidize the difference between plan costs, employees will choose the generous plan too often.
44
efficient provision. But it can also bring with it adverse selection --the tendency of the sick
to differentially choose the most generous plans. Adverse selection induces people to enroll
in less generous plans, so they can be in a healthier pool, and gives plans incentives to distort
their offerings to be less generous on care for the sick.
Many models of adverse selection have been developed. We start with simple models and
then present more advanced models.
VI. I Equilibrium with Adverse Selection - The Basics
To understand the patterns in adverse selection, we start with the simplest possible situation
(Rothschild and Stiglitz, 1976; Wilson, 1980). Assume there are two individuals, one HIGH risk
and one LOW risk, and two plans, a generous plan and a moderate plan. Table 8 gives the
hypothetical benefits and costs for the generous and moderate plans. We suppose that the generous
and moderate plans are what HIGH and LOW respectively would design for themselves, assuming
that each had to pay his own costs.33 Note that HIGH costs more in either plan and both people use
more services in the generous plan than in the moderate plan.
Equilibrium. Efficiency requires people to be in the generous plan if the additional benefits
of that plan to them are greater than the additional costs they incur. In this case HIGH should be in
the generous plan, and LOW should be in the moderate plan, since the additional value to HIGH of
the generous plan ($13) is greater than its additional cost ($12),while the converse is true for LOW
(a benefit of $1 compared to an additional cost of $3). The efficient outcome thus separates the
This assumption of respective optimality facilitates exposition, but is not required.
45
insureds.
Were separation to happen, the premiums would be $16 for the generous plan (the cost of
HIGH) and $1 for the moderate plan (the cost of LOW). At these prices, however, HIGH would
select the moderate plan; the $15 savings are greater than the $13 loss. Of course, once HIGH joins
the moderate plan costs escalate, but they are still only $2.50 (the average of 4 and 1). HIGH's cost
savings by enrolling in the moderate plan ($13.50) are still greater than his loss in benefits ($13).
LOW will also prefer the moderate plan.
The market equilibrium will thus have both individuals in the moderate plan. a pooling
equilibrium. This is not efficient, however. The reason this inefficiency arises is that individuals
do not pay their own costs in each plan, but rather the average cost of the plan. Hence, HIGH
mimics LOW so that he can share his costs with LOW.
There are a variety of ways to struggle back towards efficiency. Two logical candidates,
assigning people to plans or charging people on the basis of expected cost, are undesirable because
they respectively override free choice or sacrifice risk spreading.34 Two additional possibilities
would be to cross subsidize the generous plan by the moderate plan (Cave, 1985), or to distort the
plan offerings (Rothschild and Stiglitz, 1976).
Cross Subsidy. Suppose the moderate plan is taxed an additional $1.25 per capita, which is
used to offset the premium of the generous plan. In the separating equilibrium, the premiums in the
two plans will be $14.75 and $2.25, and HIGH will now prefer the generous to the moderate plan.
Both insureds are better off with the subsidy than without. HIGH clearly prefers a subsidy to no
Partial measures are possible. For example, many employers "carve out" mental healthbenefits from all plans and provide those services using one insurer. Adverse selection is onerationale for this (Frank et al., 1998).
46
subsidy. LOW also prefers the subsidy. because he pays only a $1.25 subsidy,compared to an
additional $1.50 premium if he pooled with HIGH in the moderate plan.
Plan manipulation. A second mechanism to induce a separatingequilibrium is to replace the
moderate plan with something stingier. \Vhen faced with a stingierplan, HIGH might choose the
generous plan over pooling with LOW. Making the moderate plan stingier is distasteful to LOW,
but the cost to HIGH is substantially greater. This disparity in costs is what allows "hurting" the plan
to produce separation.
Consider a plan called basic, also detailed in table 8, which gives both HIGH and LOW 70
percent of the benefits and costs they would receive from the moderate plan. Thus, LOW would
receive benefits of $3.50 at a cost of $0.70 were he in the basic plan and HIGH would receive
benefits of$14, incurring a cost of $2.80. If basic and generous were the two plans offered, LOW
would select the basic plan. If HIGH selects the basic plan as well, his premium, i.e., average cost,
would be $1.75. H&d prefer the generous plan, which offers an additional $19 in benefits, but would
cost only $14.25 more. LOW prefers the basic plan to pooling with HIGH in the moderate plan.
Plan manipulation sacrifices efficiency, since LOW generates more net benefits in the moderate plan.
In practice, plan manipulation can take many forms. Aerobicsprograms, for example, will
attract the vigorous healthy while spinal cord injury or high tech cancer care facilities pull in the
costly sick. There are generally more opportunities to trim a high cost-attracting service than to add
aerobics equivalents.35 Thus, we expect plans to be ungenerous with services for conditions that will
predictably have high costs.
However, the Harvard University Group Health Plan -- an option for Harvard faculty --offers a $50 weliness payment, which can be used say for sneakers, as an attractor.
47
Market competition will lead to the manipulated equilibrium. Assume that the moderate and
generous plans were the only offerings. All participants would pool in moderate. Introducing the
basic plan would then attract LOW, HIGH would go off to generous, and the moderate plan would
be abandoned.36
In practice, plan manipulation and cross-subsidy of premiums can be combined to promote
separation. The market equilibrium will have two plans. One will be the optimal plan for HIGH,
given whatever subsidy he is receiving. The other plan, which will enroll LOW, will be the plan as
close as possible to moderate whose combination of subsidy and manipulation just makes HIGH
prefer his optimal plan.
We show this graphically in Figure 7(a), assuming there is a continuous choice of plans.37
We array the plans in Figure 7(a) from least to most generous —inthis case variability among plans
is due to differences in the percent of expenses covered. The figure shows the expected utility of
LOW (the upper two lines) and HIGH (the lower two lines) at each possible level of generosity, and
for both the pooling and separating equilibria. LOW does better than HIGH, since he have a lesser
chance of incurring the cost of sickness. HIGH is better off pooling than separating for it allows him
to shed costs; the opposite is true for LOW. For both LOW and HIGH, their optimal separating
equilibrium offers less than full insurance. This might be because of moral hazard or administrative
36 efficiency costs of separation produced through plan manipulation may be small. Thatis because the moderate plan was designed for LOW. Assuming smoothness, the costs of movingaway from the optimal plan are initially trivial. But the costs to HIGH, who is already far from hisoptimum, may be great. This disparity allows cheap distortion to produce target efficiency (Nicholsand Zeckahuser, 1982).
The classic diagrammatic presentation of plan manipulation (dating from Rothschild andStiglitz) uses indifference curves. We present this in the Appendix.
48
costs; without these factors each in isolation would want the most generous policy. We show HIGH
as wanting full insurance in the pooled equilibrium; in our example. the benefits from the subsidy
in that plan are greater than the moral hazard or administrative cost loss. In the least generous plan
(no insurance), both HIGH and LOW are indifferent between pooling and separating equilibria. In
the most generous plan (full insurance) the two pay the same price and get the same utility in the
pooling equilibrium.
Consider the situation if HIGH and LOW are initially at A, the full insurance pooling
equilibrium. An insurer that offered a plan with generosity G1 would attract LOW, since LOW
prefers G1 to A. HIGH would then move to G1, because E is preferred to C, the separating
equilibrium if only HIGH is in the generous plan. As the pooled policy becomes less generous, its
attractiveness to HIGH falls. Policy G, makes HIGH just indifferent between pooling with LOW
and the separating equilibrium at C. The stable equilibrium will thus have two policies: LOW will
be at point L with policy G2 and HIGH will be at point C.
With slight chnages in the curves, however, the situation at G, may not be stable either.
Consider the situation in Figure 7(b), drawn for the case where the risk difference between HIGH
and LOW is less than in 7(a). Here LOW's preferred pooling equilibrium is superior to his best
sustainable separating plan, SL. Thus, the separating equilibrium at G2 will be broken by the pooling
equilibrium at G1. But the converse is also true; the pooling equilibrium at G1 is broken by a plan
say at G3, with a price just low enough to attract LOW at F, whereas HIGH would prefer to stick with
the premium and coverage at E. Once LOW went to F, however, the premium at E would have to
rise, and HIGH would chase LOW to G3. Thus, there is no stable equilibrium in Figure 7(b).
The model underlying Figure 7 assumes a frictionless world, where individuals shuttle
49
costlessly between plans and there are no costs involved in establishing new plans. If such costs play
a role, they may enable otherwise breakable equilibria to survive. For example, if establishing a plan
entails high fixed costs, but individuals' transit costs remain low, p becomes stable, since breaking
p with G3 is costly but yields only temporary profits. Interestingly, greater transit costs for
individuals may promote instability, since a temporary period for attracting individuals toan unstable
equilibrium may last longer, and therefore be more attractive despite the fixed costs of establishing
a plan. Even in this simple model, the ultimate outcome of markets with adverse selection is
uncertain.
Vi 2 Equilibria with Multiple Individuals in a Risk Group
The simple model of adverse selection had a single HIGH and LOW risk. The lumpiness of
movement implied by this specification is an important limitation of the model. With multiple
individuals of a given risk type, there can also be a third class of equilibria, a "hybrid" equilibrium,
to join the pooling and separating equilibria. We now show this equilibrium.
Imagine that there are now many HIGHs and LOWs, with similar tastes for insurance within
each group.38 Our example uses the parameter values from Table 8, with the $33 benefit for HIGH
under the generous plan changed to $34. Suppose we start in the separating equilibrium, with
HIGHs in the generous plan and LOWs in the basic plan. The expected utility in this equilibrium
is shown by the points A and B in Figure 8. Recall that the LOWs all prefer the moderate plan to
the basic plan. Imagine that they all enroll in that plan. Now suppose that instead of all the HIGHs
38 A more general formulation would allow individuals withina cost class to differ on suchfactors as risk aversion, or in tastes for plans. Then the division of HIGHs between the moderate andgenerous plans would reflect the individuals' preferences.
50
choosing the moderate plan, only a share of them choose it. Figure 8 traces expected utility for
HIGHs and LOWs as a greater share of the HIGHs choose the moderate plan. Once H* of the
HIGHs have enrolled in the moderate plan -- the number is 50 percent for our parameters -- HIGHs
will be indifferent between the two plans. No additional movement of HIGHs will occur.
The LOWs in the moderate plan are worse off pooling with some of the HIGHs than they
would be if they had the moderate plan to themselves. But that does not indicate whether the LOWs
prefer to separate themselves in basic. Indeed, in Figure 8, expected utility for the LOWs with a
share B of HIGHs in the moderate plan (point D) is greater than expected utility in the basic plan
(point C). The equilibrium with all of the LOWs39 and a share H* of the HIGHs in the moderate plan
— what we term the "hybrid equilibrium" —is stable.
The hybrid equilibrium need not be stable, however, If the HIGHs are sufficiently costly, the
LOWs will prefer the separating equilibrium to the hybrid equilibrium (point C will be above point
D) and thus the two groups would separate competely.
VI.3 Continuous Risk Groups
Our two risk types model suggests that at least some high risks will enroll in their most
preferred plan while low risks may be distorted into less generous plans. In situations with more
than two risk groups, however, this situation may be reversed; the low risks may be in their preferred
plans but the high risks may not. We show this using a model developed by Feldman and Dowd
LOWs will never end up split between the basic and moderate plan. Say the basic andmoderate plans were equally attractive with a fraction of the LOWs in the moderate plan. As moreLOWs moved to the moderate plan it would become more attractive. Hence, the equilibrium wouldtip all the LOWs into the moderate plan.
51
(1991), Cutler and Reber (1998), and Cutler and Zeckhauser (1998). The model assumes there are
two pre-established plan types.
Suppose there is a continuous distribution of risks in the population, denoted by s. For
simplicity, we normalize s to be the person's expected spending in the generous policy. There are
two plans, one generous and one moderate. The value of more generous insurance to an individual
is V(s), where V'>O (the sick value generous policies more than the healthy). Figure 9 shows V(s).
At any additional cost for choosing the more generous policy, people will strictly divide into plans.
If s'' is the sickness level of the person indifferent between the two policies, people with s>s will
choose the generous policy, whereas people with s<s* will choose the moderate policy. Average
sickness in the generous policy is SG = E[sls>s*], and average sickness in the moderate policy, is SM
= E[sIs<s*].
Plan premiums, in turn, depend on who enrolls. We assume people in the moderate policy
cost a fraction a (a<1) of what they would cost in the generous policy.40 In a competitive insurance
market, premiums will equal costs: G =s, and M = a SM. The premium difference between the two
plans is therefore:
(15) P(s) = - 'M = (1-a) M + [G - SM]
The first term in the final expression is the cost savings the moderate plan offers to its average
enrollee. The second term is the difference in the average sickness level in the two plans; it is the
consequence of adverse selection.
As marginal people move from the generous to the moderate plan, the average sickness in
40 The literature reviewed above suggests that az.9 for an HMO relative to an indenmity
policy.
52
each of the plans will rise. Depending on the distribution of s, the price difference between plan may
widen or narrow. Because medical spending in practice is significantly right-skewed (Table 2), it
is natural to conjecture that the premium in the generous plan will rise by more than the premium
in the moderate plan. Figure 9 reflects this expectation as an upward sloping P(s) curve.
The guideline for efficiency is that the price differential must be appropriate for the
individual at the margin in choosing between plans. All other people would be appropriate sorted,
with sicker people choosing the generous plan and healthier people choosing the moderate plan.4'
The price for the marginal individual is given by:
(16) prnarg() = (1-a) ,where is the person for whom equation (16) holds. We show this schedule in Figure 9 as lying
below the P(s) line. optimally delineates people in the moderate and generous plans.
Comparing equations (15) and (16) shows that only by coincidence will the equilibrium be
efficient. Suppose that the efficient allocation prevailed. From equation (15), the price difference
between the two policies will differ from this amount for two reasons. The first term in equation
(15) is generally below the efficient differential; it represents the savings from the moderate plan for
the average person in the moderate plan, not the marginal person in the plan, for whom the savings
would be greater. Working in the opposite direction, adverse selection (the second term in equation
(15)) will raise the premium in the generous plan relative to the premium in the moderate plan.
Depending on the distribution of medical expenditures, the market differential could thus be above
or below the efficient level. The right skewness of medical spending suggests that the adverse
'' If preferences as well as sickness level affect the value of the generous plan, then eachindividual must may his personal cost differential, P1(s) = (1 -a) s
53
selection effect will tend to predominate. This is the situation shown in Figure 9 (by virtue of the
fact that the iSP(s) line is above the Pm(s) line). The premium differential for the generous plan
will then be above the efficient differential, and too few people will enroll in the generous plan.
Because of adverse selection, small deviations in price can drive large differences in
allocations, and indeed, the generous plan may fail to survive. Starting from ,suppose the generous
plan is priced too high. Marginal enrollees will depart, driving prices up still further, inducing new
departures, and so on. The final equilibrium may be quite far from the efficient point. Indeed,
Figure 9 also shows the possibility that the entire generous plan is depopulated. If APt(s)described
the cost differential, then V(s) would not intersect that line and the equilibrium would have no
enrollment in the generous plan.42 The disappearance of generous plans as a result of dynamic
processes of adverse selection is termed a "death spiral". In such a situation, high risks end up in
less generous plans than is optimal, while low risks get their preferred policy.
VI. 4 Evidence on the Importance of Biased Enrollment
A substantial literature has examined adverse selection in insurance markets. Table 9
42 Whether a death spiral actually occurs will depend on the distribution of risk levels,andthe strength of the risk-preference interaction. The fatter the upper tail, the stronger the interaction,the more threatening is the possibility of a spiral. A numerical example illustrates this possibility.Suppose that the highest cost person has expected spending of $50,000and that average costs of the
whole population in the moderate policy (with or without this person, if he comprises a small partof the total risk) is $3,000. Suppose further that the high cost person values the generous policy at$20,000 more than the moderate policy, and that he spends only $5,000less in the moderate policy
than with the generous policy (for example, a 10 percent savings if the plans are an indemnity policyand an HMO). Efficiency demands that he should be in the generous policy; theadditional value of
that policy ($20,000) is greater than the additional cost he imposes there ($5,000). If the high cost
person were the only person in the generous policy, however, the cost of that policy would be$47,000 more than the cost of the moderate policy, which would lead him to optfor the moderate
policy.
54
summarizes this literature, breaking selection into three categories: traditional insurance versus
managed care; overall levels of insurance coverage; and high versus low option coverage.
Most empirical work on adverse selection involves data from employers who allow choices
of different health insurance plans of varying generosity; a minority of studies look at the Medicare
market, where choices are also given. Within these contexts, adverse selection can be quantified in
a variety of fashions. Some authors report the difference in premiums or claims generated by
adverse selection after controlling for other relevant factors (for example, Price and Mays, 1985;
Brown et a!., 1993). Other papers examine the likelihood of enrollment in a generous plan
conditional on expected health status (for example, Cutler and Reber, 1998). A third group measure
the predominance of known risk factors among enrollees of more generous health plans compared
to those in less generous plans (for example, Ellis, 1989).
Regardless of the exact measurement strategy, however, the data nearly uniformly suggest
that adverse selection is quantitatively large. Adverse selection is present in the choice between fee-
for-service and managed care plans (8 out of 12 studies, with 2 findings of favorable selection and
3 studies ambiguous), in the choice between being insured and being uninsured (3 out of 4 studies,
with 1 ambiguous finding), and in the choice between high-option and low-option plans within a
given type (14 out of 14 studies).
Figure 10 shows a particularly salient example of adverse selection, taken from experience
at Harvard University.43 The Harvard experience is nice because adverse selection was driven by
a policy change, and thus one can view the beginning of adverse selection and its subsequent effects.
In the early l990s, Harvard University offered its employees two types of health insurance plans: a
' See Cutler and Reber (1998) and Cutler and Zeckhauser (1998).
55
generous PPO and a number of HMOs. The University paid about 90 percent of each plan's
premium; thus, the employee cost of the PPO, shown in Figure 10(a), was a relatively modest $500
per year. To trim costs, Harvard in 1995 moved to a more competitivehealth insurance system.
Under the new system, the University pegged its contribution at a fixed percentage of the lowest cost
plan. Employees paid the entire amount above this for the plan of their choice. The hope was that
competition among plans would drive down premiums and thus save the University money.
When the new system was introduced, the cost of the PPO rose, and PPO enrollment fell.
As Figure 10(a) shows, about 1/4 of PPO enrollees left the PPO between 1994 and 1995. These
enrollees were disproportionately the younger and healthier employees in the PPO, however. As a
result of the biased disenroilment, the PPO lost money in 1995; in 1996, it had to raise its premium
by nearly $1,000. This led to a further decline in PPO enrollment; over half the remainingPPO
enrollees left the plan after 1996. Again, these employees were disproportionately younger and
healthier than those that remained in the PPO. Thus, the PPO premium lost money again in 1997
and would have had to increase premiums substantially in 1998, just to prevent losses. In fact, the
required premium increase would have been too large for the insurer and Harvard tobear. The PPO
was disbanded before that year. Adverse selection thus produced adeath spiral, and did so very
quickly. The disappearance of the PPO is a welfare loss to employees who would have chosen it at
their individual-specific cost. Cutler and Reber estimate the size of the welfare loss at 2 to 4 percent
of baseline premiums.
The importance of adverse selection has had direct impacts on policy. For example, Brown
et al. (1993) found that Medicare enrollees who enroll in a managed care planwould have spent 10
percent below average if they had been in the traditional system. Since Medicare paid only 5 percent
56
less to managed care companies for enrolling these people, Medicare lost money as HMO enrollment
increased. In 1997, Federal legislation reduced payments to HMOs by an additional 5 percent, to
avoid these continuing losses.
VI.5 Evidence on the Importance of Plan Manipulation
There are substantially fewer empirical studies on plan manipulation than on adverse
selection. Plans, of course, differ greatly in their generosity. But it is difficult to know, and plans
do not want to reveal, the extent to which the observed variation in plan benefits reflects
manipulation by the plans to attract healthy risks as opposed to the self-interested choice of insurance
arrangements among people already enrolled in the plans. Adverse selection aside, plans with sicker
enrollees probably should be more generous.
Though evidence on plan structures is ambiguous, the marketing of managed care plans
shows clear efforts to promote favorable selection. Maibach et al. (1998) document the marketing
practices managed care plans use to attract healthy Medicare enrollees, including television ads that
show seniors engaged in physical and social activities and marketing seminars held in buildings that
were not wheelchair accessible. Whether such practices extend to the types of benefits these plans
offer is unknown.
VI. 6 The Tradeoff Between Competition and Selection
In weighting the consequences of competition, losses from adverse selection must be
balanced against the gains, if any, from lower premiums that competition induces. The Harvard
University study discussed above (Cutler and Reber, 1998) shows such a tradeoff. As Figure 10(b)
57
demonstrates, premiums for the HMOs fell by over $1,000 when the University moved to flat-rate
pricing. The savings to Harvard from these lower premiums was estimated at 5 to 8 percent of
baseline health spending. This cost savings is greater than the 2 to 4 percent loss from adverse
selection noted above. Thus. the net effect of competition in the Harvard circumstance appears to
be beneficial, although the adverse selection losses were quite large.
With few exceptions (Wholey et al., 1995; Feldman and Dowd, 1993; Baker and Corts,
1995), few studies have examined how competition affects health insurance premiums. It is often
difficult to gather data on premiums, since most insurers charge different groups different amounts.
In addition, premiums need to be adjusted for differences in the quality of benefits, but the many
dimensions of quality are very difficult to control for. Thus, the tradeoff between cost savings and
adverse selection in other situations is generally unknown.
VI. 7 Risk Adjustment
The fundamental question about health insurance design is how to achieve the benefits of
competition while containing the costs of adverse selection. A natural solution is suggested by the
model above. Suppose that individuals were not charged the full difference in premiumsbetween
plans, but that instead the employer or government entirely running the insurance system offset some
of the difference. For example, if the generous plan has above average risks in the amount E[sIs>s*]
E[s], the government would give the plan a per capita subsidy equal to this amount. The subsidy
would be financed by a tax on the moderate plan, which has below average risks, bythe amount
58
E{ss<s*]E[s. The contribution from the plans would just match,44 so there would be no net cost
to the government.
In a competitive market, plans that receive subsidies (or are forced to pay taxes) would pass
these subsidies on to consumers. Therefore, the premium for the generous plan would fall to G =
s0 - subsidyG E[s], and the premium for the moderate plan would rise to M a SM + taxM E[s] -
(1 -a) SM. The adjusted premium difference between the plans, which individuals would face, would
thus be
l7 iP=P -P =k / G M iMThis quantity is the savings for the average person in the moderate plan. It is closely related to the
optimal price difference in equation (16), which is the savings for the marginal person in the
moderate plan. Plan choices made on the basis of the price difference in equation (17), though not
optimal, are likely to be more efficient than plan choices made on the basis of unadjusted price
differences.
This form of differential payment is termed "risk adjustment" (Ellis and VandeVen, 1998).
Risk adjustment must be carried out by some entity that can require individuals to insure orconvince
them to do so through subsidies. Otherwise, low cost individuals would choose not to participate.
One possibility would be for the government to impose risk adjustment, whoever is the payer. But
employers providing subsidized health insurance can do the job just as well. Employers have an
incentive to risk adjust since it promotes efficiency and thus lowers the overall costof providing
' This is because (E[sls>s*] + E[sls<s*]) I 2 = E[s].
59
health coverage.45
Empirically, risk adjustment can be carried out in four ways. Plans can pay or receive
payments based on: (1) demographic variables (for example, morefor taking on older people); (2)
medical conditions (for example, more for people with diabetes); (3) past medical expenditures,
which help predict future expenditures; or (4) actual experience in a year (for example, $50,000 extra
for each organ transplant patient). The first three approaches attempt to predict experience; the last
is after-the-fact reinsurance.
The tradeoffs between these different forms of risk adjustment is related to the ability of
health plans to manipulate the risk adjustment system. Information about diagnosis, past claims, and
actual use increase the ability to measure differential enrollment, but are susceptible to distortion by
the plans. For example, plans may code borderline people as having diabetes if risk adjustmentis
done on the basis of the number of diabetics. Plans might creatively assign costs to high cost cases,
when such cases are largely reimbursed. Even if risk adjustment is done on a prospective basis,
plans have an incentive to exaggerate current sickness and expenditure levels,since the vast majority
of insureds stick with their plans from year to year. A final, at least theoretical, concernabout risk
adjustment is that it may diminish plans' incentives to maintain their enrollees' health. Keeping
people healthy disqualifies the plan from receiving additional risk adjustment payments, thus
reducing the value of the health investment.
Because so few employers or governments have used formal risk adjustment systems, the
" Some employers have made second best efforts to implement risk adjustment,at times
inadvertently. The heavy subsidy of premiums -- manyemployers pay 85 percent or more -- ineffect
covers 85 percent of cost differentials due to varying mixes of insureds. Alas, heavy subsidies alsosignificantly diminish the incentives of insureds to shop around, henceof health plans to hold down
their costs.
60
relative advantages and drawbacks of different risk adjustment methodologies are unknown. New
efforts may provide some of this information, however, In January 1999, in a major initiative, the
Federal government announced its intention to employ risk adjustment on the basis of past diagnoses
to pay HMOs that enroll individuals in Medicare. Evaluating the impact of this system is a major
research priority.
VII. Person-Specific Pricing, Contract Length, and Premium Uncertainty
Adverse selection is a problem of asymmetric information -- individuals know their likely
medical care utilization but insurers either do not, or are not allowed to use this information.
Increasingly, however, information is becoming equalized. Insurers question individuals or monitor
their past utilization to forecast their future costs. Equipped with such knowledge, insurers may
know more about expected costs for the groups they are insuring than the members of the groups do
themselves.
Insurers can use this information to set premiums. While such "experience rating" is rare at
the individual level, it is common at the group level. Most private health insurance in the United
States is at least partly experience rated. The bigger the group purchasing insurance, the more likely
is experience rating. Hence, older and sicker groups are charged more per capita for the same
coverage.
But experience rating creates its own set of problems, particularly when carried out at the
individual level. When people face premiums that depend on their sickness, they are denied a form
of insurance -- the ability to obtain the same insurance premiums as their peers at the same price.
61
The welfare loss can be significant.
Consider. for example. a situation where individuals are insuring themselves, diabetes is the
only disease, and both people and plans know who is diabetic. Plans would offer full insurance to
everyone but would charge diabetics more than non-diabetics; after all, no one who is not diabetic
would be willing to pay extra to insure the diabetics. Given the distribution of diabetics and non-
diabetics, the higher premiums charged to diabetics create a distributional issue. Diabetics pay more,
and non-diabetics pay less relative to level premiums.
But from an ex ante perspective, before anyone knows who will contract diabetes, the
distributional issue represents an efficiency loss. Suppose that before an individual knew if she
would be diabetic or not --potentially before birth — she was offered insurance against the risk that
she would become diabetic and thus face higher insurance premiums in the future. Full insurance
would guarantee that if she developed diabetes, the policy would give her sufficient income each
year to cover the higher diabetes premium she would then face. The benefitswould be financed by
payments from non-diabetics. Individuals would be willing to purchase this insurance were it sold
at fair odds; they get a reduction in financial risk at no expected cost.
In real-world markets, however, such insurance against falling into a worse risk class is not
offered. Some of the insurance would have to be purchased before birth. People obviously cannot
do this, and even their parents might be unable to buy it for them, if there is a genetic predisposition
towards disease. Other insurance could wait until mid-life for the unpredictable infirmities of old
age. The key is to contract for insurance before therisk is resolved. While long-term anticipatory
insurance is possible, health insurance in actual markets is rarely sold for over one year. People
consequently lose welfare ex ante; there is an insurance policy they want but cannot obtain.
62
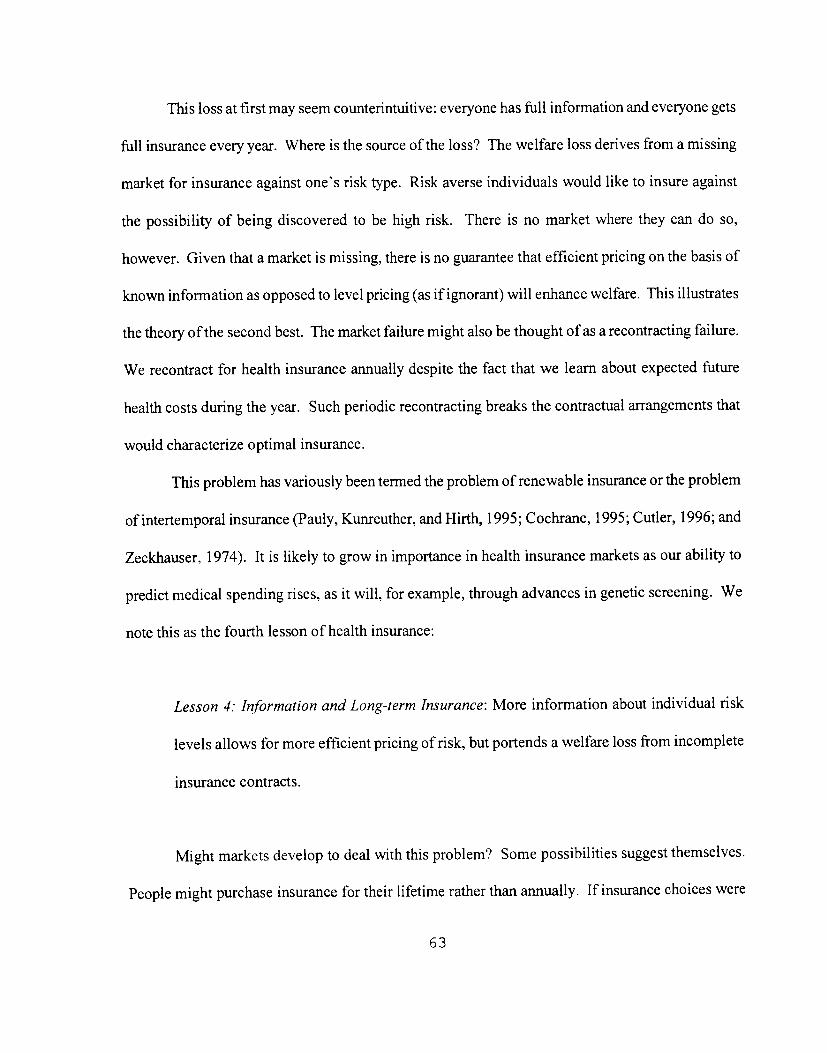
This loss at first may seem counterintuitive: everyone has full information and everyone gets
full insurance every year. Where is the source of the loss? The welfare loss derives from a missing
market for insurance against one's risk type. Risk averse individuals would like to insure against
the possibility of being discovered to be high risk. There is no market where they can do so,
however. Given that a market is missing, there is no guarantee that efficient pricing on the basis of
known information as opposed to level pricing (as if ignorant) will enhance welfare. This illustrates
the theory of the second best. The market failure might also be thought of as a recontracting failure.
We recontract for health insurance annually despite the fact that we learn about expected future
health costs during the year. Such periodic recontracting breaks the contractual arrangements that
would characterize optimal insurance.
This problem has variously been termed the problem of renewable insurance or the problem
of intertemporal insurance (Pauly, Kunreuther, and Hirth, 1995; Cochrane, 1995; Cutler, 1996; and
Zeckhauser, 1974). It is likely to grow in importance in health insurance markets as our ability to
predict medical spending rises, as it will, for example, through advances in genetic screening. We
note this as the fourth lesson of health insurance:
Lesson 4: Information and Long-term Insurance: More information about individual risk
levels allows for more efficient pricing of risk, but portends a welfare loss from incomplete
insurance contracts.
Might markets develop to deal with this problem? Some possibilities suggest themselves.
People might purchase insurance for their lifetime rather than annually. If insurance choices were
63
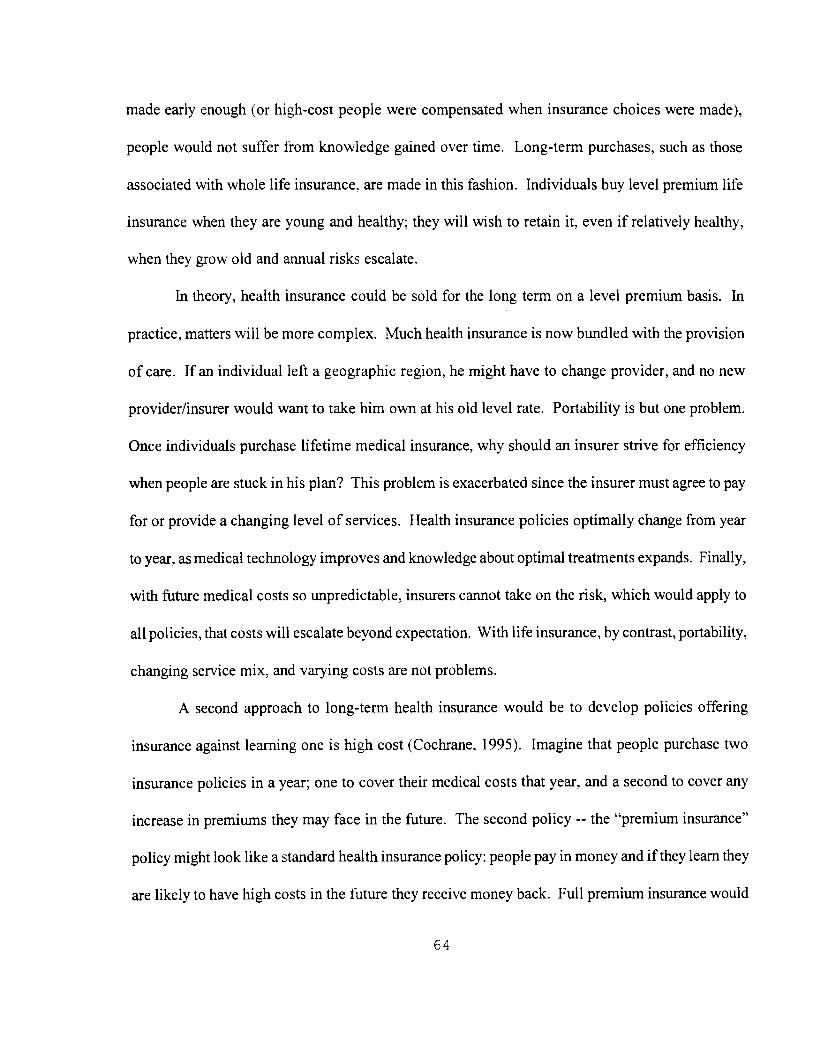
made early enough (or high-cost people were compensated when insurance choices were made),
people would not suffer from knowledge gained over time. Long-term purchases, such as those
associated with whole life insurance, are made in this fashion. Individuals buy level premium life
insurance when they are young and healthy; they will wish to retain it, even if relatively healthy,
when they grow old and annual risks escalate.
In theory, health insurance could be sold for the long term on a level premium basis. In
practice, matters will be more complex. Much health insurance is now bundled with the provision
of care. If an individual left a geographic region, he might have to change provider, and no new
provider/insurer would want to take him own at his old level rate. Portability is but one problem.
Once individuals purchase lifetime medical insurance, why should an insurer strive for efficiency
when people are stuck in his plan? This problem is exacerbated since the insurer must agree to pay
for or provide a changing level of services. Health insurance policies optimally change from year
to year, as medical teclmology improves and knowledge about optimal treatments expands. Finally,
with future medical costs so unpredictable, insurers cannot take on the risk, which would apply to
all policies, that costs will escalate beyond expectation. With life insurance, by contrast, portability,
changing service mix, and varying costs are not problems.
A second approach to long-term health insurance would be to develop policies offering
insurance against learning one is high cost (Cochrane, 1995). Imagine that people purchase two
insurance policies in a year; one to cover their medical costs that year, and a second to cover any
increase in premiums they may face in the future. The second policy -- the "premium insurance"
policy might look like a standard health insurance policy: people pay in money and if they learn they
are likely to have high costs in the future they receive money back. Full premium insurance would
64
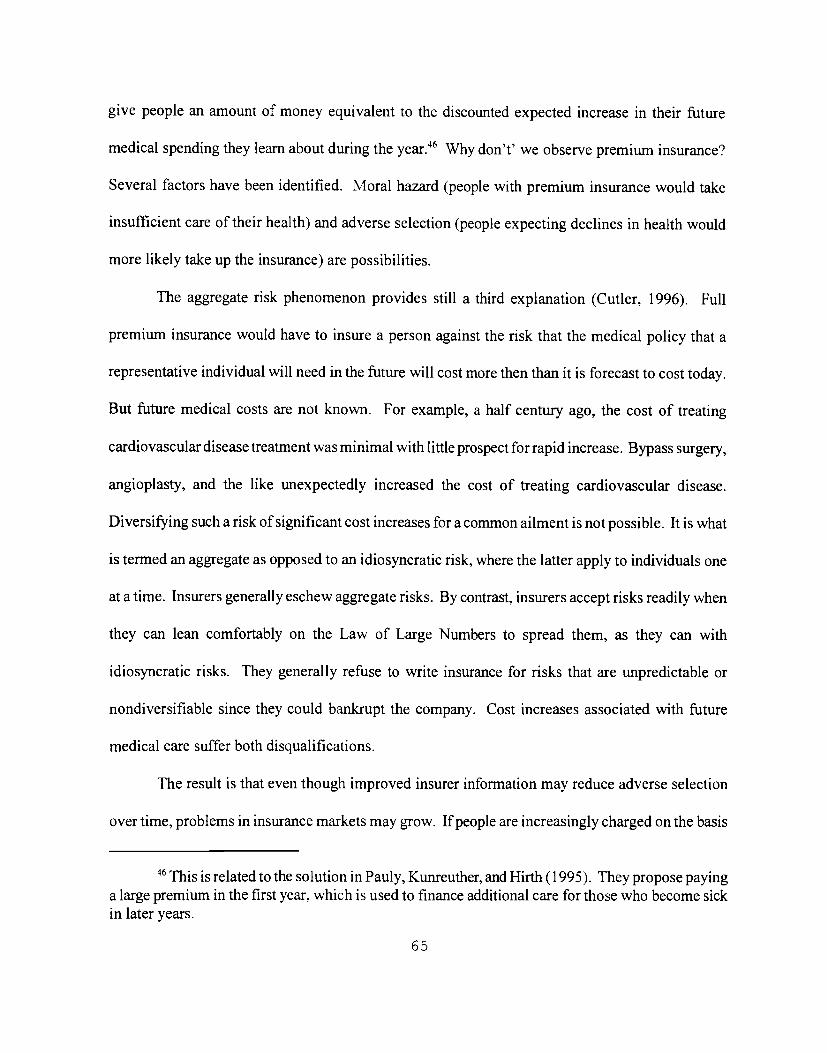
give people an amount of money equivalent to the discounted expected increase in their future
medical spending they learn about during the year.46 Why don't' we observe premium insurance?
Several factors have been identified. Moral hazard (i)eople with premium insurance would take
insufficient care of their health) and adverse selection (people expecting declines in health would
more likely take up the insurance) are possibilities.
The aggregate risk phenomenon provides still a third explanation (Cutler, 1996). Full
premium insurance would have to insure a person against the risk that the medical policy that a
representative individual will need in the future will cost more then than it is forecast to cost today.
But future medical costs are not known. For example, a half century ago, the cost of treating
cardiovascular disease treatment was minimal with little prospect for rapid increase. Bypass surgery,
angioplasty, and the like unexpectedly increased the cost of treating cardiovascular disease.
Diversifying such a risk of significant cost increases for a common ailment is not possible. It is what
is termed an aggregate as opposed to an idiosyncratic risk, where the latter apply to individuals one
at a time. Insurers generally eschew aggregate risks. By contrast, insurers accept risks readily when
they can lean comfortably on the Law of Large Numbers to spread them, as they can with
idiosyncratic risks. They generally refuse to write insurance for risks that are unpredictable or
nondiversifiable since they could bankrupt the company. Cost increases associated with future
medical care suffer both disqualifications.
The result is that even though improved insurer information may reduce adverse selection
overtime, problems in insurance markets may grow. If people are increasingly charged on the basis
46 is related to the solution in Pauly, Kunreuther, and Hirth (1995). They propose payinga large premium in the first year. which is used to finance additional care for those who become sickin later years.
65
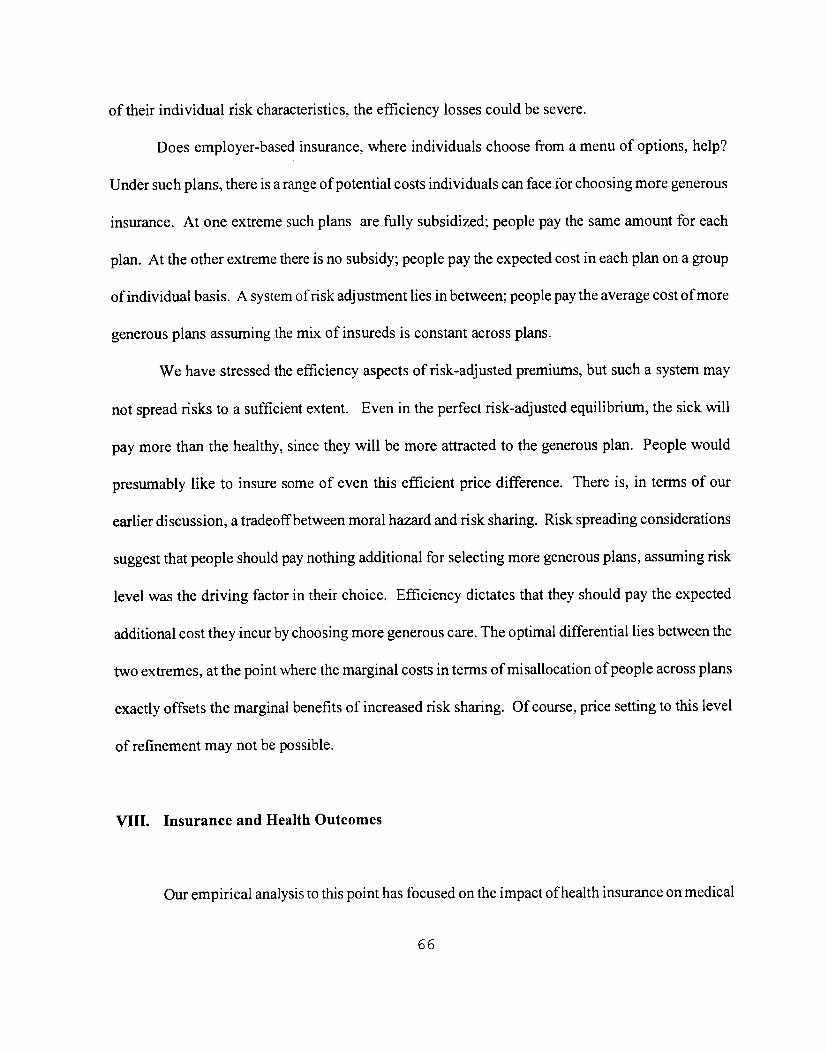
of their individual risk characteristics, the efficiency losses could be severe.
Does employer-based insurance, where individuals choose from a menu of options, help?
Under such plans, there is a range of potential costs individuals can face for choosing more generous
insurance. At one extreme such plans are fully subsidized; people pay the same amount for each
plan. At the other extreme there is no subsidy; people pay the expected cost in each plan on a group
of individual basis. A system of risk adjustment lies in between; people pay the average cost of more
generous plans assuming the mix of insureds is constant across plans.
We have stressed the efficiency aspects of risk-adjusted premiums, but such a system may
not spread risks to a sufficient extent. Even in the perfect risk-adjusted equilibrium, the sick will
pay more than the healthy, since they will be more attracted to the generous plan. People would
presumably like to insure some of even this efficient price difference. There is, in terms of our
earlier discussion, a tradeoff between moral hazard and risk sharing. Risk spreading considerations
suggest that people should pay nothing additional for selecting more generous plans, assuming risk
level was the driving factor in their choice. Efficiency dictates that they should pay the expected
additional cost they incur by choosing more generous care. The optimal differential lies between the
two extremes, at the point where the marginal costs in terms of misallocation of people across plans
exactly offsets the marginal benefits of increased risk sharing. Of course, price setting to this level
of refinement may not be possible.
VIII. Insurance and Health Outcomes
Our empirical analysis to this point has focused on the impact of health insurance on medical
66
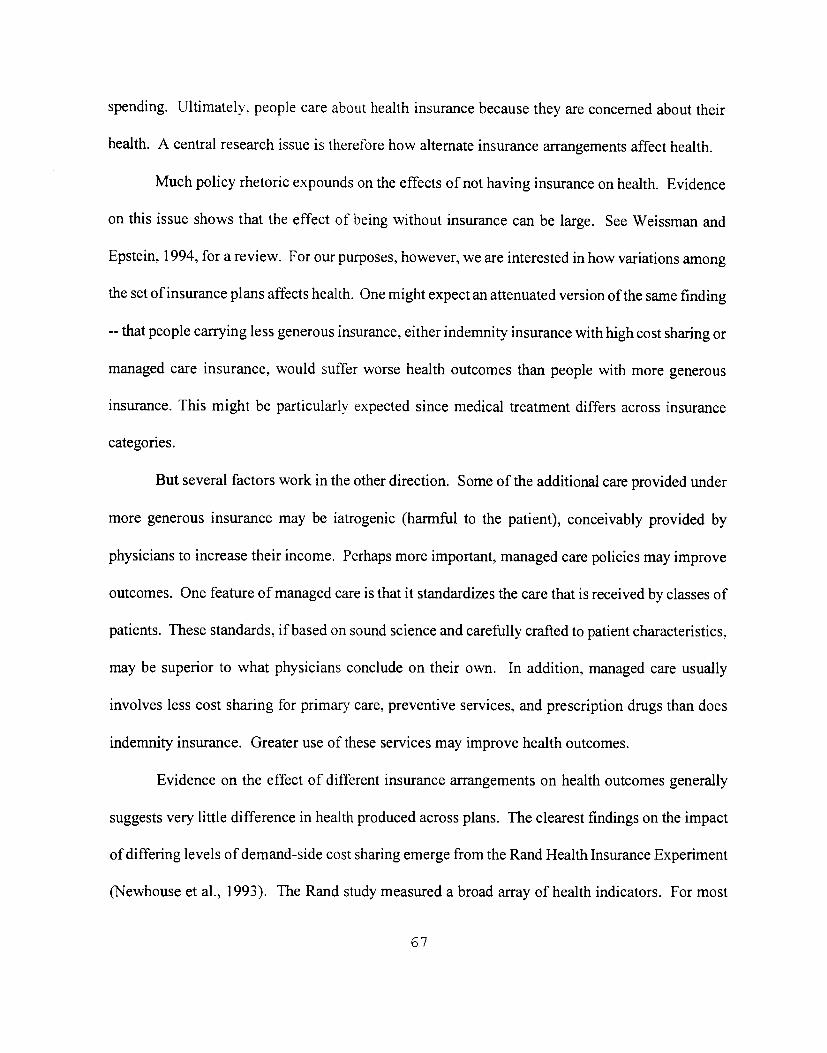
spending. Ultimately, people care about health insurance because they are concerned about their
health. A central research issue is therefore how alternate insurance arrangements affect health.
Much policy rhetoric expounds on the effects of not having insurance on health. Evidence
on this issue shows that the effect of being without insurance can be large. See Weissman and
Epstein, 1994, for a review. For our purposes, however, we are interested in how variations among
the set of insurance plans affects health. One might expect an attenuated version of the same finding
-- that people carrying less generous insurance, either indemnity insurance with high cost sharing or
managed care insurance, would suffer worse health outcomes than people with more generous
insurance. This might be particularly expected since medical treatment differs across insurance
categories.
But several factors work in the other direction. Some of the additional care provided under
more generous insurance may be iatrogenic (harmful to the patient), conceivably provided by
physicians to increase their income. Perhaps more important, managed care policies may improve
outcomes. One feature of managed care is that it standardizes the care that is received by classes of
patients. These standards, if based on sound science and carefully crafted to patient characteristics.
may be superior to what physicians conclude on their own. In addition, managed care usually
involves less cost sharing for primary care, preventive services, and prescription drugs than does
indemnity insurance. Greater use of these services may improve health outcomes.
Evidence on the effect of different insurance arrangements on health outcomes generally
suggests very little difference in health produced across plans. The clearest findings on the impact
of differing levels of demand-side cost sharing emerge from the Rand Health Insurance Experiment
(Newhouse et al., 1993). The Rand study measured a broad array of health indicators. For most
67
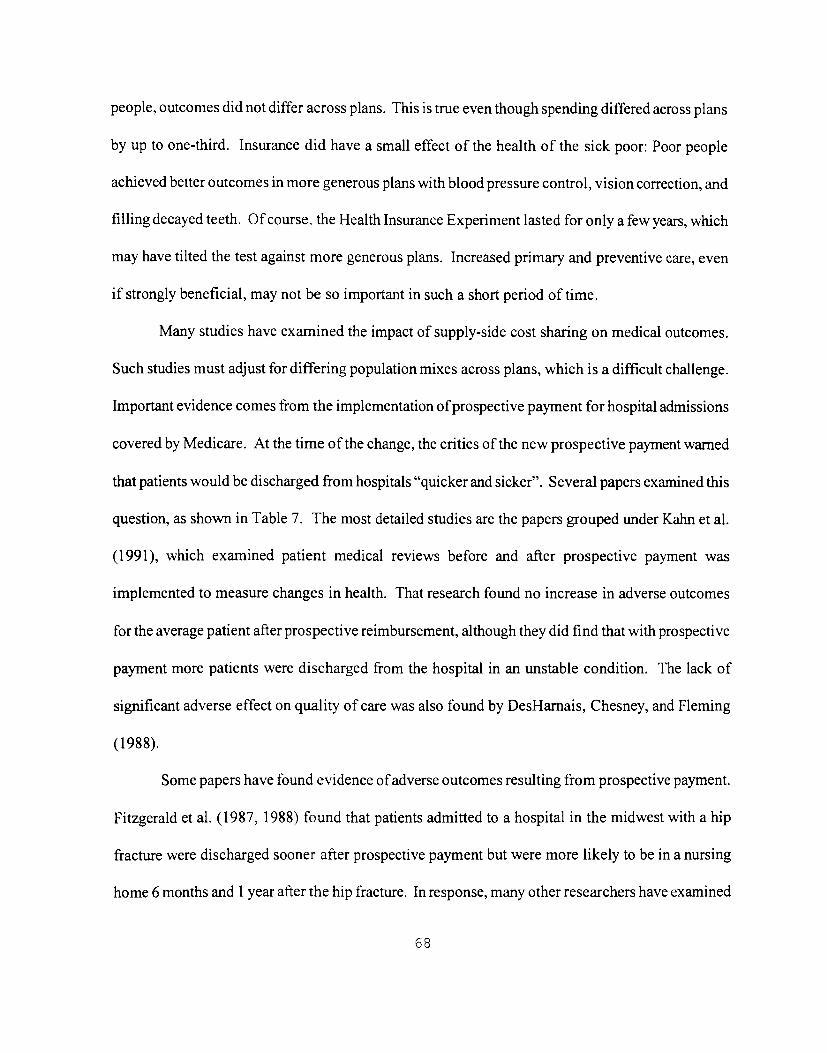
people, outcomes did not differ across plans. This is true even though spending differed across plans
by up to one-third. Insurance did have a small effect of the health of the sick poor: Poor people
achieved better outcomes in more generous plans with blood pressure control, vision correction, and
filling decayed teeth. Of course. the Health Insurance Experiment lasted for only a few years, which
may have tilted the test against more generous plans. Increased primary and preventive care, even
if strongly beneficial, may not be so important in such a short period of time.
Many studies have examined the impact of supply-side cost sharing on medical outcomes.
Such studies must adjust for differing population mixes across plans, which is a difficult challenge.
Important evidence comes from the implementation of prospective payment for hospital admissions
covered by Medicare. At the time of the change, the critics of the new prospective payment warned
that patients would be discharged from hospitals "quicker and sicker". Several papers examined this
question, as shown in Table 7. The most detailed studies are the papers grouped under Kahn et al.
(1991), which examined patient medical reviews before and after prospective payment was
implemented to measure changes in health. That research found no increase in adverse outcomes
for the average patient after prospective reimbursement, although they did find that with prospective
payment more patients were discharged from the hospital in an unstable condition. The lack of
significant adverse effect on quality of care was also found by DesHarnais, Chesney, and Fleming
(1988).
Some papers have found evidence of adverse outcomes resulting from prospective payment.
Fitzgerald et al. (1987, 1988) found that patients admitted to a hospital in the midwest with a hip
fracture were discharged sooner after prospective payment but were more likely to be in a nursing
home 6 months and 1 year after the hip fracture. In response, many other researchers have examined
68
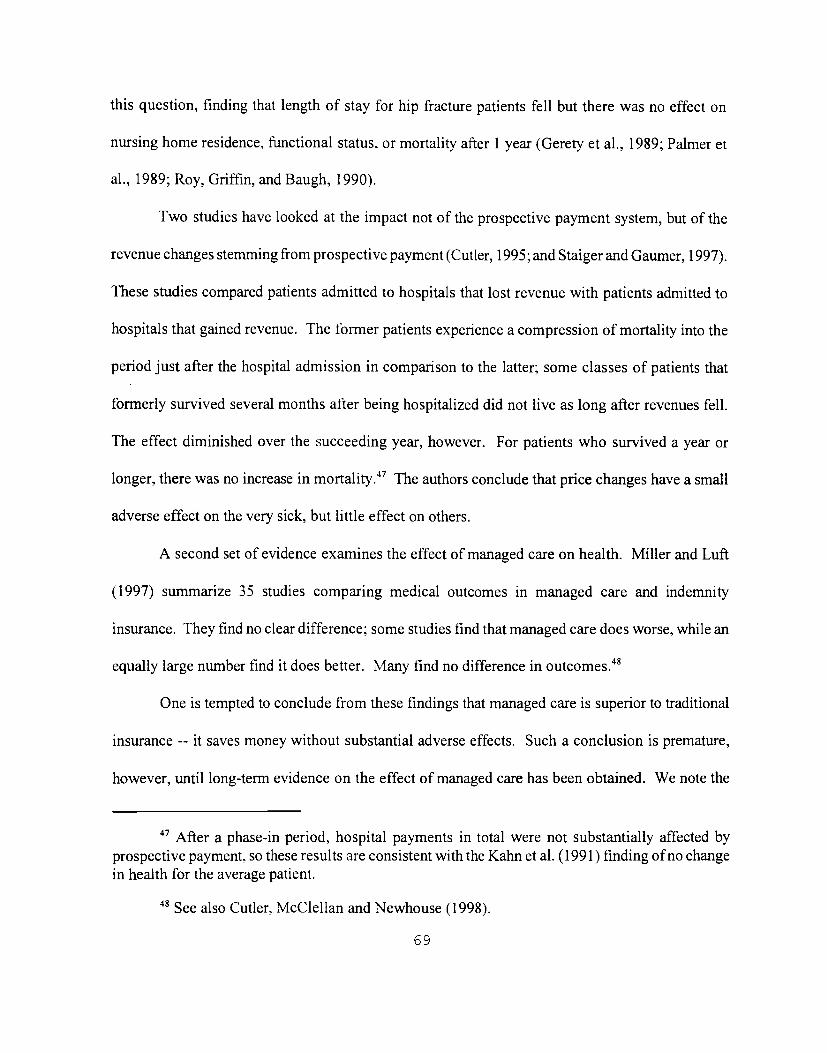
this question, finding that length of stay for hip fracture patients fell but there was no effect on
nursing home residence, functional status. or mortality after 1 year (Gerety et al., 1989; Palmer et
al., 1989; Roy, Griffin, and Baugh, 1990).
Two studies have looked at the impact not of the prospective payment system, but of the
revenue changes stemming from prospective payment (Cutler, 1995; and Staiger and Gaumer, 1997).
These studies compared patients admitted to hospitals that lost revenue with patients admitted to
hospitals that gained revenue. The former patients experience a compression of mortality into the
period just after the hospital admission in comparison to the latter; some classes of patients that
formerly survived several months after being hospitalized did not live as long after revenues fell.
The effect diminished over the succeeding year, however. For patients who survived a year or
longer, there was no increase in mortality.47 The authors conclude that price changes have a small
adverse effect on the very sick, but little effect on others.
A second set of evidence examines the effect of managed care on health. Miller and Luft
(1997) summarize 35 studies comparing medical outcomes in managed care and indemnity
insurance. They find no clear difference; some studies find that managed care does worse, while an
equally large number find it does better. Many find no difference in outcomes.48
One is tempted to conclude from these findings that managed care is superior to traditional
insurance -- it saves money without substantial adverse effects. Such a conclusion is premature,
however, until long-term evidence on the effect of managed care has been obtained. We note the
' After a phase-in period, hospital payments in total were not substantially affected byprospective payment, so these results are consistent with the Kahn et al. (1991) fmding of no changein health for the average patient.
See also Cutler, McClellan and Newhouse (1998).
69
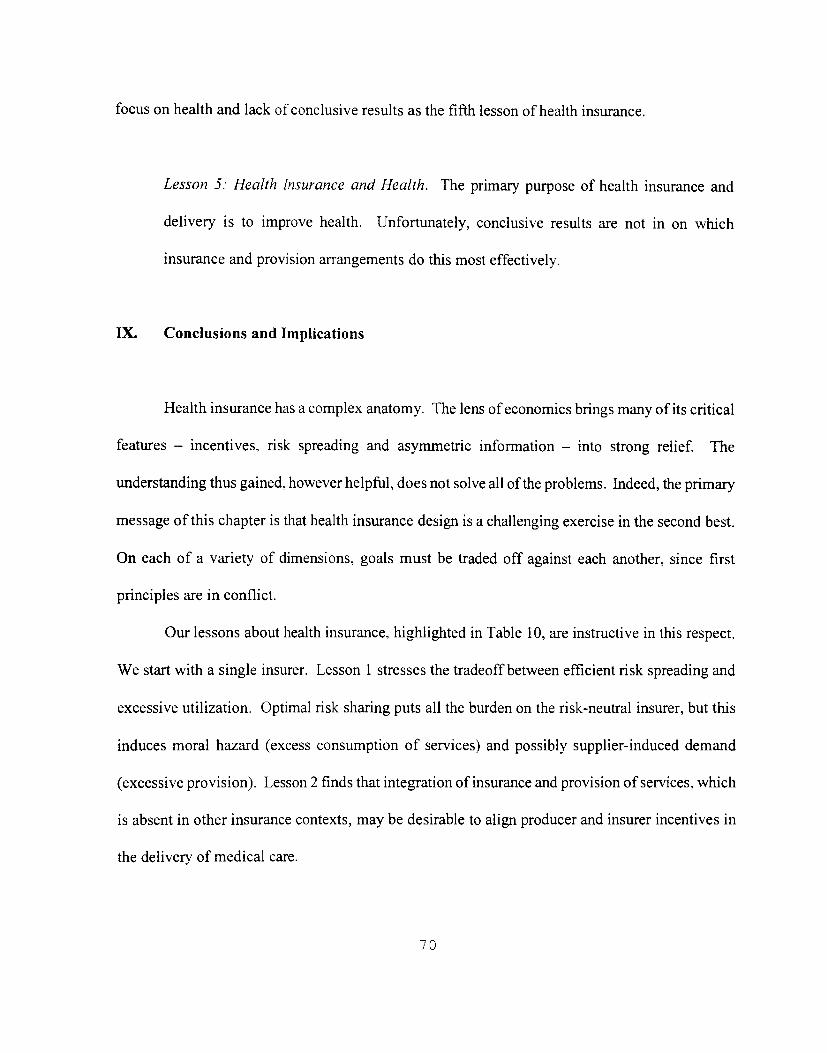
focus on health and lack of conclusive results as the fifih lesson of health insurance.
Lesson 5: Health Insurance and Health. The primary purpose of health insurance and
delivery is to improve health. Unfortunately, conclusive results are not in on which
insurance and provision arrangements do this most effectively.
IX. Conclusions and Implications
Health insurance has a complex anatomy. The lens of economics brings many of its critical
features — incentives, risk spreading and asymmetric information — into strong relief. The
understanding thus gained, however helpful, does not solve all of the problems. Indeed, the primary
message of this chapter is that health insurance design is a challenging exercise in the second best.
On each of a variety of dimensions, goals must be traded off against each another, since first
principles are in conflict.
Our lessons about health insurance, highlighted in Table 10, are instructive in this respect.
We start with a single insurer. Lesson 1 stresses the tradeoff between efficient risk spreading and
excessive utilization. Optimal risk sharing puts all the burden on the risk-neutral insurer, but this
induces moral hazard (excess consumption of services) and possibly supplier-induced demand
(excessive provision). Lesson 2 finds that integration of insurance and provision of services, which
is absent in other insurance contexts, may be desirable to align producer and insurer incentives in
the delivery of medical care.
70
Lessons 3 and 4 highlight second-best problems in the health insurance marketplace. Lesson
3 shows that competitive markets, the traditional lodestar of economics, may have undesirable side
effects in health insurance. Most important, competition induces adverse selection, hence the
misallocation of people to plans and the incentive for insurers to trim their offerings to deter the sick.
In theory at least, risk-adjustment methods, which are just now being tried in practice, can counter
these phenomena. Lesson 4 alerts us, however, that even if we slay the dragons of adverse selection
and plan manipulation, a fierce risk remains. Since insurance is written on an annual basis,
individuals are denied crucial protection against becoming sick and having their premiums escalate
substantially in the future.
Lesson 5 reminds us that the ultimate goal of health insurance does not involve the usual
economic concepts of prices, incentives and costs. Rather, the central objective of health insurance
is to maintain and enhance our health. The payoff question, therefore, is what can we get for
alternative levels of expenditure? The contribution of economics is to enable us to sketch the
production function.
Health insurance is a service in society, like a hair cut or tennis lesson. Why then does health
insurance cause so many more problems than the other two? Both the insurance aspect, and its area
of application, health, produce problems. In any insurance situation, moral hazard and adverse
selection plague outcomes. In the case of health insurance, the problems are magnified, since health-
promoting and care-seeking actions are difficult to monitor, and it is widely believed to be unfair to
charge people more if they contract diseases that are not their fault. Moreover, the payoff from
health insurance, unlike say life insurance, is quite variable, and subject to human choice made after
the contract is written. In addition, for justifiable reasons, health care is written on an annual basis,
71
though today's chance outcomes often have cost implications that stretch for decades. Finally, health
has a privileged position above other goods and services. For a range of philosophical and moral
reasons, societies care deeply that out citizens receive health care, even if that is not what they would
buy were we to give them the money.
These fundamental issues surrounding the equitable and efficient provision of health
insurance make government involvement inevitable, and in many contexts desirable. Therange of
government involvement in health care and health insurance is enormous. At one end, many
governments provide medical care directly; they raise money through taxes, hire doctors and run
public hospitals. Less extreme are countries where the government is the sole insurer, but provision
of services remains private. More market-oriented systems such as the United States have most of
the population in private insurance and most of the provision of medical care done by private
providers. Even there, though, government plays a sizeable role, refereeing the playing field and
insuring those who the market would leave behind. Thus, the Federal government insures people
through Medicare and Medicaid, provides tax subsidies to private insurance, defines permissible
structures for supplementary Medicare insurance, and requires insurers to cover people who recently
lost or changed jobs. Moreover, many states mandate that particular benefits be part of any health
insurance plan.
Discussions of medical care reform in the United States and elsewhere often lead to extreme
positions. Advocates at one end believe that the problems with markets in health care are so severe
that government control, at least of expenditures, is necessary. The Canadian system — tax-
supported, privately provided, but publicly regulated — is held up as an exemplar. The claimed
merits are that one insurer eliminates adverse selection, tight supply restrictions manage costs, and
72
tax financing enables everyone to be insured. Of course, in such a system competition between
insurers plays no role in promoting efficiency.
At the other extreme are free-market advocates, who believe that market institutions, if
guided correctly, would produce a superior outcome. The government should stay out of the
insurance business, but implement a risk adjustment system, directly or at arm's length, so that
people face efficient prices. Moreover, the government should remove the tax subsidy favoring
employer provision of insurance, which would lead to trimmed plan generosity and more cost
sharing by employees. Where necessary, the government should give high cost individuals risk-
related subsidies that enable them to buy health insurance in the marketplace.
The fundamental difference between the public and private approaches to medical care
reform are indicative of the enormous problems in medical care markets and the central role that
health plays in our utility. Can risk adjustment work well enough to deter plan manipulation and
cream skimming? Without subsidies, would employers provide insurance? If they stopped doing
so, how many more people would be uninsured, and how much would their health suffer? These are
questions at the heart of health insurance reform.
And beyond the question about organizing the health insurance system, there remain
questions of how plans should interact with providers. Should providers be paid by capitation or by
fee-for-service, or might there be a happy medium? Will providers respond to a payment schedule
by either skimping on patients or driving up costs? Only experience in the future, coupled with a
delicately balanced wisdom, will enable us to answer these questions.
Economics does not offer robust conclusions about the virtues and liabilities of markets in
second-best situations. Hence, it is not surprising that the debate on who should provide health
73
insurance and how it best should be structured rages on, even among economists. Ultimately, of
course, many of the issues cannot be answered on the basis of first principles, much less the dogma
that is too often brought to the debate. They require empirical investigations.
An impressive array of data has been brought to bear one-to-one on central issues in health
insurance, but the grand synthesis needed for effective prescription awaits us. Which medical system
around the world is best, and what would make it even better? Might the best system for Germany
or Japan differ significantly from that for the United States? To understand the attractiveness of
alternative health insurance structures. not unlike much of medical care itself, many consequences
must be weighed, and many side effects considered. This chapter provided an anatomy to help
organize those investigations.
74
References
Akerlof, George, "The Market for 'Lemons': Qualitative Uncertainty and the Market Mechanism",Quarterly Journal of Economics, 1970, 74: 488-500.
Altman, Daniel, David M. Cutler and Richard J. Zeckhauser, "Adverse selection and adverseretention," American Economic Review, Vol. 88, No. 2 (May, 1998), pp. 122-26.
Arrow, Kenneth, "Uncertainty and the Welfare Economics of Medical Care", American EconomicReview, 1963, 53(5), 941-973.
Arrow, Kenneth, Aspects of the Theory of Risk Bearing, Helsinki: Yrjo Jahnssonin Saatio, 1965.
Arrow, Kenneth, "The Economics of Agency", in John Pratt and Richard Zeckhauser, eds.,Principals andAgents: The Structure ofBusiness, Cambridge, MA: Harvard Business SchoolPress, 1985, 37-5 1.
Baker, Laurence C, and Kenneth S. Corts, "The Effects of HMOs on Conventional InsurancePremiums: Theoiy and Evidence", NBER Working Paper No. 5356, November 1995.
Baumgardner, James, "The Interaction between Forms of Insurance Contract and Types of TechnicalChange in Medical Care", Rand Journal of Economics, Vol. 22 (1), Spring 1991, 36-53.
Beck, R. G., "The effects of co-payment on the poor," Journal of Human Resources, Vol. 9, No. 1(Winter 1974), pp. 129-142.
Berk, Marc L., and Alan C. Monheit, "The Concentration of Health Expenditures: An Update",Health Affairs, Winter 1992, 145-149.
Bhattacharya, Jayanta, William B. Vogt, Aki Yoshikawa and Toshitaka Nakahara, "The utilizationof outpatient medical services in Japan," Journal of Human Resources, Vol. 31, No. 2(Spring 1996), pp. 450-76.
Bice, Thomas W., "Risk vulnerability and enrollment in a prepaid group practice," Medical Care,Vol. 13, No. 8 (August 1975), pp. 698-703.
Blomqvist, Ake G., "Optimal non-linear health insurance," Journal of Health Economics, Vol. 16,No. 3 (June 1997), pp. 303-21.
Brown, Randall S., et al., The Medicare Risk Program for HMOs -- Final Summary Report onFindings from the Evaluation, Final Reprot under HCFA Contract Number 500-88-0006,(Princeton, NJ: Mathematica Policy Research, Inc., 1993).
Buchanan, Joan L.. Emmett B. Keeler. John E. Roiph and Martin R. Holmer, "Simulating healthexpenditures under alternative insurance plans," Management Science, Vol. 37, No. 9(September 1991), PP. 1067-89.
Buchmueller, Thomas C. and Paul J. Feldstein. "The effect of price on switching among healthplans," Journal of Health Economics, Vol. 16, No. 2 (April 1997), pp. 231-47.
Cardon, James and Igal Hendel, "Asymmetric information in health care and health insurancemarkets: Evidence from the National Medical Expenditure Survey," mimeo (July 8, 1996).
Carroll, Norman V. and W. Gary Erwin, "Patient shifting as a response to Medicare prospectivepayment," Medical Care, Vol. 25. No. 12 (December 1987), pp. 1161-67.
Cave, Jonathan, "Subsidy Equilibrium and Multiple-Option Insurance Markets", in RichardScheffler and Louis F. Rossiter. eds., Advances in Health Economics and Health ServicesResearch. Volume 6. Biased Selection in Health Care Markets. Greenwich, CT: JAI Press,1985, 27-45.
Cherkin, Daniel C., Louis Grothaus and Edward H. Wagner, "The effect of office visit copaymentson utilization in a health maintenance organization," Medical Care, Vol. 27, No. 7 (July1989), pp. 669-79.
Cochrane, John, "Time Consistent Health Insurance", Journal of Political Economy, 103(3), June1995, 445-73.
Colle, Ann D. and Michael Grossman, "Determinants of pediatric care utilization," Journal ofHuman Resources, Vol. 13 (Supp. 1978), pp. 115-53.
Conrad, Douglas A.. David Grembowski and Peter Milgrom. "Adverse selection within dentalinsurance markets," Advances in Health Economics and Health Services Research, Vol. 6,Richard M. Scheffler and Louis F. Rossiter, eds. (Greenwich, CT: JAI Press, 1985), pp. 171-90.
Congressional Budget Office, The Effects of Managed Care on Use and Costs of Health Services",mimeo, June 1992.
Cutler, David M., Estimating the Effect of Reimbursement Policy on Medical Outcomes, doctoraldissertation. Massachusetts Institute of Technology, 1991.
________________ "The incidence of adverse medical outcomes under prospective payment,"Econometrica. Vol. 63, No. 1 (January 1995), pp. 29-50.
______________ "Why Don't Markets Insure Long-Term Risk", mimeo, 1996.
Cutler, David M. and Sarah J. Reber, Paying for health insurance: The tradeoff betweencompetition and adverse selection" Quarterly Journal of Economics, Vol. 113, No. 2 (May1998), PP. 433-66.
Cutler, David M. and Richard J. Zeckhauser, "Adverse selection in health insurance," Frontiers inHealth Policy Research, Vol. 1, Alan Garber, ed. (Cambridge, MA: MIT Press, 1998).
Cutler, David M., Mark McClellan, and Joseph P. Newhouse, "What Does Managed Care Do?",mimeo, 1998.
Davis, Karen and Louise B. Russell, "The substitution of hospital outpatient care for inpatient care,"Review of Economics and Statistics, Vol. 54, No. 2 (May 1972), pp. 109-120.
De Meza, David, "Health Insurance and the Demand for Medical Care", Journal of HealthEconomics, Vol. 2 (1), March 1983, 47-54.
Deshamais, Susan I., James Chesney and Steven Fleming, "Trends and regional variations inhospital utilization and quality during the first two years of the prospective payment system,"Inquiry, Vol. 25 (Fall 1988), pp. 374-82.
Desharnais, Susan I., Roger Wroblewski and Dale Schumacher, "How the Medicare prospectivepayment system affects psychiatric patients treated in short-term general hospitals," Inquiry,Vol. 27 (Winter 1990). pp. 3 82-88.
Diamond, Peter, "Optimal Income Taxation: An Example with a U-Shaped Pattern of OptimalMarginal Tax Rates", ;merican Economic Review, 88 (1), March 1998, p 83-95.
Dowd, Bryan and Roger Feldman, 'Biased selection in twin cities health plans," Advances in HealthEconomics and Health Services Research, Vol. 6, Richard M. Scheffler and Louis F.Rossiter, eds. (Greenwich, CT: JAI Press, 1985), pp. 253-7 1.
Eggers, Paul W., "Risk differential between Medicare beneficiaries enrolled and not enrolled in anHMO," Health Care Financing Review, Vol. 1 (1980), pp. 91-99.
Eichner, Matthew J., "Incentives, price expectations and medical expenditures: an analysis of claimsunder employer-provided health insurance," mimeo (July 30, 1998).
Eichner, Matthew J., Mark McClellan, and David Wise, "Insurance or Self-Insurance?: Variation,Persistence, and Individual Health Accounts", in David Wise, ed., Inquiries in the EconomicsofAging, Chicago: University of Chicago Press, 1998.
Ellis, Randall P., 'The effect of prior-year health expenditures on health coverage pian choice,"Advances in Health Economics and Health Services Research, Vol. 6, Richard M. Schefflerand Louis F. Rossiter, eds. (Greenwich, CT: JAI Press, 1985), pp 127-47.
"Employee choice of health insurance." Review ofEconomics and Statistics, Vol.71, No. 2 (May 1989). pp. 215-23.
_______________ "Creaming, Skimping and Dumping: Provider Competition on the Intensive andExtensive Margins", Journal of Health Economics, Vol. 17 (5), October 1998, p 537-55.
Ellis, Randall P. and Andrew Van de Ven, "NEED FINAL TITLE" this volume.
Ellis, Randall P. and Thomas G. McGuire, "Hospital response to prospective payment: Moralhazard, selection, and practice-style effects," Journal of Health Economics, Vol. 15 (1996),pp. 257-77.
Eze, Pius and Barbara Wolfe. "Is dumping socially inefficient? An analysis of the effect ofMedicare's prospective payment system on the utilization of Veterans Affairs inpatientservices," Journal of Public Economics, Vol. 52 (1993), pp. 329-44.
Farley, Pamela J. and Alan C. Monheit. "Selectivity in the demand for health insurance and healthcare," Advances in Health Economics and Health Services Research, Vol. 6, Richard M.Scheffler and Louis F. Rossiter, eds. (Greenwich, CT: JAI Press, 1985), pp. 231-52.
Feder, Judith, Jack Hadley and Stephen Zuckerman, "How did Medicare's prospective paymentsystem affect hospitals?" New England Journal of Medicine, Vol. 317, No. 14 (October 1,1987), pp. 867-73.
Feldman, Roger, Michael Finch, Bryan Dowd and Steven Cassou, "The demand for employment-based health insurance plans," Journal of Human Resources, Vol. 24, No. 1 (Winter 1989),pp. 117-42.
Feldman, Roger and Dowd, Bryan, "Must Adverse Selection Cause Premium Spirals", Journal ofHealth Economics. 10 (October 1991), 350-357.
Feldman, Roger and Bryan Dowd, "The Effectiveness of Managed Competition in Reducing theCosts of Health Insurance", in Robert B. Helms, ed., Health policy reform: Competition andcontrols, Washington. D.C.: AEI Press, 1993, p 176-217.
Feldstein, Paul J., "General report," Report of the Commission on the Cost of Medical Care(Chicago: American Medical Association, 1964), part 1.
Feldstein, Martin S., "The rising price of physicians' services," Review of Economics and Statistics,Vol. 52, No.2 (May 1970), pp. 121-33.
________________ "Hospital cost inflation: A study of nonprofit price dynamics," AmericanEconomic Review, Vol. 60 (1971), pp. 853-72.
Feldstein, Martin S. and Bernard Friedman, "Tax Subsidies, the Rational Demand for Insurance andthe Health Care Crisis," Journal of Public Economics, Vol. 7. No. 2 (April 1977), PP. 155-78.
Fisher, Charles R., "Hospital and Medicare financial performance under PPS, 1985-90," HealthCare Financing Review, Vol. 14. No. 1 (Fall 1992), pp. 171-83.
Fitzgerald, John F., Patricia S. Moore and Robert S. Dittus, "The care of elderly patients with hipfracture: Changes since implementation of the prospective payment system," New EnglandJournal of Medicine. Vol. 319, No. 21 (November 24, 1988), P. 1392-97.
Folland, Sherman and Robert Kleiman, "The effect of prospective payment under DRGs on themarket value of hospitals," Quarterly Review of Economics and Business, Vol. 30, No. 2(Summer 1990), pp. 50-68.
Frank, Richard G. and Judith R. Lave, "The effect of benefit design on the length of stay ofMedicaid psychiatric patients," Journal of Human Resources, Vol.21, No. 3 (Summer 1986),pp. 321-37.
________________ "A comparison of hospital responses to reimbursement policies for Medicaidpsychiatric patients," RAND Journal of Economics, Vol. 20, No. 4 (Winter 1989), pp. 588-600.
Frank, Richard G., and Thomas McGuire, "Economic Functions of Carve-Outs", American Journalof Managed Care, 4(SP), 1998, SP31-SP39.
Fuchs, Victor R. and Marcia J. Kramer, "Determinants of expenditures for physicians' services inthe United States, 1948-68," National Bureau of Economic Research Occasional PaperSeries, No. 117 (1972).
Gaumer, Gary L., Eugene L. Poggio, Craig G. Coelen, Cary S. Sennett and Robert J. Schmitz,"Effects of state prospective reimbursement programs on hospital mortality," Medical Care,Vol. 27, No. 7 (July 1989), pp. 724-36.
Gerety, M. B., V. Soderholm-Difatte and C. H. Winograd, "Impact of prospective payment anddischarge location on the outcome of hip fracture," Journal of General Internal Medicine,Vol. 4, No. 5 (September-October 1989), pp. 388-91.
Glied, Sherry, "Managed Care", this volume.
Goldman, Fred and Michael Grossman, "The demand for pediatric care: An hedonic approach,"Journal of Political Economy, Vol. 86, No. 2 (April 1978), pp. 259-80.
Griffith, Mary Jane, Nicholas Baloff and Edward L. Spitznagel, "Utilization patterns of healthmaintenance organization disenrollees," Medical Care. Vol. 22, No. 9 (September 1984), pp.827-34.
Guterman, Stuart and Allen Dobson, Impact of the Medicare prospective payment system forhospitals," Health Care Financing Review, Vol. 7, No. 3 (Spring 1986), pp. 97-114.
Guterman, Stuart, Stuart H. Altman and Donald A. Young, "Hospitals' financial performance in thefirst five years of PPS," Health Affairs, Vol.9, No. I (Spring 1990), pp. 125-134.
Hadley, Jack, Stephen Zuckerman and Judith Feder, "Profits and fiscal pressure in the prospectivepayment system: Their impacts on hospitals," Inquiry, Vol. 26 (Fall 1989), pp. 354-65.
Hodgkin, Dominic and Thomas G. McGuire, "Payment levels and hospital response to prospectivepayment," Journal of Health Economics, Vol. 13 (1994), pp. 1-29.
Jackson-Beeck, Marilyn and John H. Kleinman, "Evidence for self-selection among healthmaintenance organization enrollees," Journal ofthe american MedicalAssociation, Vol. 250,No. 20 (November 25. 1983), pp. 2826-29.
Juba, David A., Judith R. Lave and Jonathan Shaddy, "An analsyis of the choice of health benefitsplans," Inquiry, Vol. 17 (Spring 1980), pp. 62-71.
Kahn, Katherine L. et al. (series), "The effects of the DRG-based prospective payment system onquality of care for hospitalized Medicare patients," Journal of the American MedicalAssociation, Vol. 264, No. 15 (October 17, 1990), pp. 1953-1994 (eight articles).
Kotowitz, Yehuda, "Moral Hazard", in the New Paigrave Dictionary of Economics, 1987.
Langwell, Katherine M. and James P. Hadley, "Evaluation of the Medicare competitiondemonstrations," Health Care Financing Review, Vol. 11, No. 2 (Winter 1989), pp. 65-80.
Lave, Judith R., Richard G. Frank, Carl Taube, Howard Goldman and Agnes Rupp, "The earlyeffects of Medicare's prospective payment system on psychiatry," Inquiry, Vol. 25 (Fall1988), pp. 354-63.
Long, Stephen H., Russell F. Settle and Charles W. Wrightson, "Employee premiums, availabilityof alternative plans, and HMO disenrollment," Medical Care, Vol. 26, No. 10 (October1988), pp. 927-3 8.
Luft, Harold S., Joan B. Trauner and Susan C. Maerki, "Adverse selection in a large, multiple-optionhealth benefits program: A case study of the California Public Employees' RetirementSystem," Advances in Health Economics and Health Services Research, Vol. 6, Richard M.Scheffler and Louis F. Rossiter, eds. (Greenwich, CT: JAI Press, 1985), pp. 197-229.
Ma, Ching-to Albert. and Thomas McGuire, "Optimal Health Insurance and Provider Payment",American Economic Review, Vol. 87 (4), September, 1997, pp. 685-704.
Maibach, Ed., Katharine Dusenbury. Pamel Zupp, et al., "Marketing HMOs to MedicareBeneficiaries: An Analysis of Four Medicare Markets", Menlo Park, CA: Kaiser FamilyFoundation, 1998.
Manning, Willard G. and M. Susan Marquis, "Health insurance: The tradeoff between risk poolingand moral hazard," Journal of Health Economics, Vol. 15, No. 5 (October 1996),pp. 609-39.
Marquis, M. Susan, Adverse selection with a multiple choice among health insurance plans: Asimulation analysis," Journal of Health Economics, Vol. 11, No. 2 (August 1992), pp. 129-51.
Marquis, M. Susan and Charles E. Phelps, "Price elasticity and adverse selection in the demand forsupplemental health insurance.' Economic Inquiry, Vol. 25, No. 2 (April 1987), pp. 299-313.
McAvinchey, Ian D. and Andreas Yannopoulos, "Elasticity estimates from a dynamic model ofinterrelated demands for private and public acute health care," Journal of Health Economics,Vol. 12 (July 1993), pp. 171-86.
McGuire, Thomas G., "Price and membership in a prepaid group medical practice," Medical Care,Vol. 19, No. 2 (February 1981), pp. 172-83.
Menke, Tern, "Impacts ofPPS on Medicare Part B expenditures and utilization for hospital episodesof care," Inquiry, Vol. 27 (Summer 1990), pp. 114-26.
Merrill, Jeffrey, Catherine Jackson and James Reuter, "Factors that affect the HMO enrollmentdecision: A tale of two cities," Inquiry, Vol. 22 (Winter 1985), pp. 388-95.
Miller, Robert H. and Harold S. Luft. Does Managed Care Lead to Better or Worse Quality ofCare?", Health Affairs. 16(5), September/October 1997, pp. 7-25.
Morrisey, Michael A., Frank A. Sloan and Joseph Valvona, "Medicare prospective payment andposthospital transfers to subacute care," Medical Care, Vol. 26, No. 7 (July 1988), pp. 685-98.
Newhouse, Joseph P., "Do unprofitable patients face access problems?" Health Care FinancingReview, Vol. 11, No. 2 (Winter 1989), pp. 33-42.
Newhouse, Joseph P., "Reimbursing Health Plans and Health Providers: Efficiency in ProductionVersus Selection,' Journal ofEconomic Literature, XXXIV (September 1996), 1236-1263.
Newhouse, Joseph P. and the Insurance Experiment Group, Free for All? Lessons from the RANDHealth Insurance Experiment (Cambridge, MA: Harvard University Press, 1993).
Newhouse, Joseph P. and Daniel J. Byrne, 'Did Medicare's prospective payment system causelength of stay to fall?" Journal of Health Economics, Vol. 7(1988), pp. 413-16.
Newhouse, Joseph P. and Charles E. Phelps, "Price and income elasticities for medical careservices," The Economics of Health and Medical Care, ch. 9 (New York: John Wiley &Sons, 1974), pp. 140-61.
_______________ 'New estimates of price and income elasticities of medical care services," TheRole of Health Insurance in the Health Services Sector, ch. 7 (New York: National Bureauof Economic Research. 1976), pp. 261-313.
Nichols, Albert, and Richard Zeckhauser, "Targeting Transfers through Restrictions on Recipients"American Economic Review, 72 (2), May 1982, p 3 72-77.
Palmer, R. M., R. M. Saywell. Jr.. I. W. Zollinger, B. K. Erner, A. D. LaBov, D. A. Freund, J. E.Garber, G. W. Misamore and F. B. Throop, "The impact of the prospective payment systemon the treatment of hip fractures in the elderly,"Archives of Internal Medicine, Vol. 149, No.10 (October 1989), pp. 2237-41.
Pauly, Mark, "The Economics of Moral Hazard: Comment", American Economic Review, 1968, 58:53 1-53 6.
Pauly, Mark, "Overinsurance and Public Provision of Insurance: The Roles of Moral Hazard andAdverse Selection", Quarterly Journal of Economics, 1974, 88: 44-54.
Pauly, Mark, "Taxation, Health Insurance and Market Failure", Journal of Economic Literature,1986, 24 (6): 629-675.
Pauly, Mark, and Scott Ramsey. Would You Like Suspenders to Go With that Belt? An Analysisof Optimal Combinations of Cost Sharing and Managed Care", mimeo, 1998.
Pauly, Mark, Howard Kunreuther, and Richard Hirth, "Guaranteed Renewability in Insurance",Journal of Risk & Uncertainly. Vol. 10 (2), March 1995, pp. 143-56.
Phelps, Charles E., "The demand for health insurance: A theoretical and empirical investigation,"RAND Research Paper Series, No. R-1054-OEO (July 1973).
Phelps, Charles E. and Joseph P. Newhouse, "Effect of coinsurance: A multivariate analysis," SocialSecurity Bulletin (June 1972), pp. 20-28.
_________________ "Effects on coinsurance on demand for physician services," RAND ResearchPaper Series, No. R-976-OEO (June 1972).
_______________ "Coinsurance, the price of time, and the demand for medical services," Reviewof Economics and Statisiics, Vol. 56, No. 3 (August 1974), pp. 334-42.
Plato, The Republic.
Price, James R. and James \V. Mays, "Biased selection in the Federal Employees Health BenefitsProgram," Inquiry. Vol. 22 (Spring 1985), pp. 67-77.
Ramsey, Scott D. and Mark Pauly, "Structural Incentives and Adoption of Medical Technologies inHMO and Fee-for-Service Health Insurance Plans", Inquiry, 34 (3), Fall 1997, p 228-36.
Ray, W. A., M. R. Griffin and D. K. Baugh, "Mortality following hip fracture before and afterimplementation of the prospective payment system," Archives of Internal Medicine, Vol.150, No. 10 (October 1990), pp. 2 109-14.
Rodgers, Jack and Karen E. Smith, "Is there biased selection in Medicare HMOs?" Health PolicyEconomics Group Report (Washington, DC: Price Waterhouse LLP, May 16, 1996).
Roos, NP, E. Shapiro, and R. Tate, "Does a small minority of elderly account for a majority of healthcare expenditures? A sixteen-year perspective" Milbank Quarterly, 1989 67(3-4):347-69.
Rosenthal, Gerald, "Price elasticity of demand for short-term general hospital services," EmpiricalStudies in Health Economics, Herbert E. Klarman, ed., (Baltimore, MD: Johns HopkinsPress, 1970), pp. 101-117.
Rosett, Richard N. and Lien-fu Huang, "The effect of health insurance on the demand for medicalcare," Journal of Political Economy, Vol. 81 (MarchlApril 1973), pp. 28 1-305.
Rothschild, Michael, and Joseph E. Stiglitz. "Equilibrium in Competitive Insurance Markets: AnEssay on the Economics of Imperfect Information", Quarterly Journal of Economics, 1976,90: 629-650.
Russell, Louise B. and Carrie Lynn Manning, "The effect of prospective payment on Medicareexpenditures," Nei England Jo urnal of Medicine, Vol. 320, No. 7 (1989), pp. 439-44.
Sager, Mark A., Douglas V. Easterling, David A Kindig and Odin W. Anderson, "Changes in thelocation of death after passage of Medicare's prospective payment system," New EnglandJournal of Medicine, Vol. 320, No. 7 (1989), pp. 433-39.
Scitovsky, Anne A. and Nelda McCall, "Coinsurance and the demand for physician services: Fouryears later," Social Security Bulletin (May 1977), pp. 19-27.
Scitovsky, Anne A., Nelda McCall and Lee Benham, "Factors affecting the choice between twoprepaid plans." \Iedical Care. Vol. 16, No. 8 (August 1978), pp. 660-675.
Scitovsky, Anne A. and Nelda M. Snyder, "Effect of coinsurance on use of physician services,"Social Security Bulletin (June 1972), pp. 3-19.
Shaw, George Bernard. The Dociois Dilemma, 1911.
Sheingold, Steven H.. The first three years of PPS: Impact on Medicare costs," Health Affairs, Vol.8, No. 3 (Fall 1989), p. 191-204.
Sheingold, Steven H. and Thomas Buchberger, "Implications of Medicare's prospective paymentsystem for the provision of uncompensated hospital care," Inquiry, Vol. 23 (Winter 1986),pp. 371-81.
Sloan, Frank A., Michael A. Morrisev and Joseph Valvona, "Medicare prospective payment and theuse of medical technologies in hospitals," Medical Care, Vol. 26, No, 9 (September 1988),pp. 837-50.
Smith, Adam, The Wealth of Nations, 1776.
Spence, Michael, and Richard Zeckhauser. "Insurance, Information, and Individual Action",American Economic Revew, Papers and Proceedings, 1971, 61(2): 380-387.
Staiger, Douglas and Gary L. Gaumer, "Price regulation and patient mortality in hospitals," mimeo(August 1995).
van de Ven, Wyn, and P. M. M. and Rene C. J. A. van Vliet, "Consumer surplus and adverseselection in competitive health insurance markets: An empirical study," Journal of HealthEconomics, Vol. 14, No. 2 (June 1995), pp. 149-69.
Welch, W. Pete, "Restructuring the Federal Employees Health Benefits Program: The private sectoroption," Inquiry, Vol. 26 (Fall 1989), pp. 321-34.
Weissman, Joel, and Arnold Epstein, Falling Through the Safety Net: Insurance and Access toMedical Care. Baltimore, MD: Johns Hopkins University Press, 1994.
Wholey, Douglas, Roger Feldman, and Jon B. Christianson, "The Effect of Market Structure onHMO Premiums", Journal of Health Economics, 14 (1), May 1995, pp. 8 1-105.
Wilike, Richard J, William S. Custer, James W. Moser and Robert A. Musacchio, "Collaborativeproduction and resource allocation: The consequences of prospective payment for hospitalcare," Quarterly Review of Economics and Business, Vol. 31, No. 1 (Spring 1991), pp. 28-47.
Wilson, Charles, "The Nature of Equilibrium in Markets with Adverse Selection", The Bell Journalof Economics. 11(1), Spring 1980. pp. 108-30.
Wrightson, William. James Genuardi and Sharman Stephens, "Demographic and utilizationcharacteristics of HMO disenrollees," GHAA Journal (Summer 1987), pp. 23-42.
Zeckhauser, Richard, "Medical Insurance: A Case Study of the Tradeoff Between Risk Spreadingand Appropriate Incentives", Journal of Economic Theory, 1970, 2: 10-26.
Zeckhauser, Richard, "Risk Spreading and Distribution," in Harold M. Hochman and George E.Peterson, eds., Redistribution Through Public Choice, New York: Columbia UniversityPress, 1974, 206-28.
Zweifel, Peter, and Willard G. Manning, "Consumer Incentives in Health Care", this volume.
</ref_section>
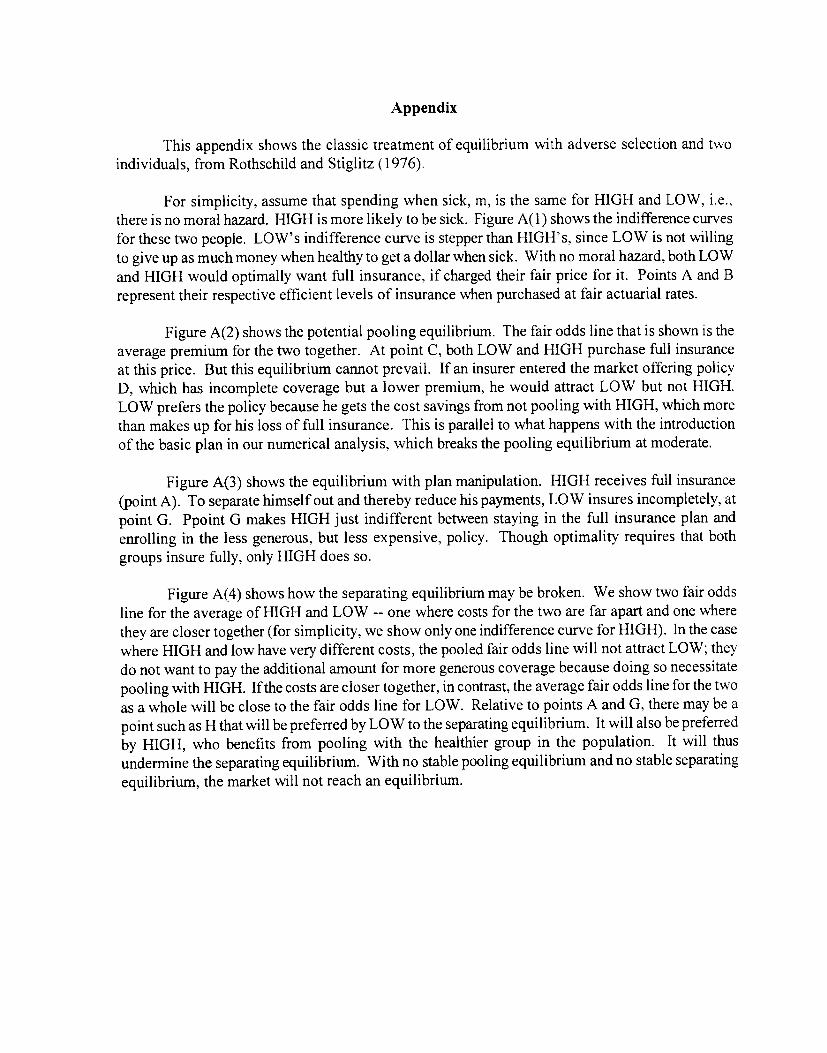
Appendix
This appendix shows the classic treatment of equilibrium with adverse selection and twoindividuals, from Rothschild and Stiglitz (1976).
For simplicity, assume that spending when sick, m, is the same for HIGH and LOW, i.e. *there is no moral hazard. HIGH is more likely to be sick. Figure A( 1) shows the indifference curvesfor these two people. LOW's indifference curve is stepper than HIGH's, since LOW is not willingto give up as much money when healthy to get a dollar when sick. With no moral hazard, both LOWand HIGH would optimally want full insurance, if charged their fair price for it. Points A and Brepresent their respective efficient levels of insurance when purchased at fair actuarial rates.
Figure A(2) shows the potential pooling equilibrium. The fair odds line that is shown is theaverage premium for the two together. At point C, both LOW and HIGH purchase full insuranceat this price. But this equilibrium cannot prevail. If an insurer entered the market offering policyD, which has incomplete coverage but a lower premium, he would attract LOW but not HIGH.LOW prefers the policy because he gets the cost savings from not pooling with HIGH, which morethan makes up for his loss of full insurance. This is parallel to what happens with the introductionof the basic plan in our numerical analysis, which breaks the pooling equilibrium at moderate.
Figure A(3) shows the equilibrium with plan manipulation. HIGH receives full insurance(point A). To separate himself out and thereby reduce his payments, LOW insures incompletely, atpoint G. Ppoint G makes HIGH just indifferent between staying in the full insurance plan andenrolling in the less generous, but less expensive, policy. Though optimality requires that bothgroups insure fully, only HIGH does so.
Figure A(4) shows how the separating equilibrium may be broken. We show two fair oddsline for the average of HIGH and LOW -- one where costs for the two are far apart and one wherethey are closer together (for simplicity, we show only one indifference curve for HIGH). In the casewhere HIGH and low have very different costs, the pooled fair odds line will not attract LOW; theydo not want to pay the additional amount for more generous coverage because doing so necessitatepooling with HIGH. If the costs are closer together, in contrast, the average fair odds line for the twoas a whole will be close to the fair odds line for LOW. Relative to points A and G, there may be apoint such as H that will be preferred by LOW to the separating equilibrium. It will also be preferredby HIGH, who benefits from pooling with the healthier group in the population. It will thusundermine the separating equilibrium. With no stable pooling equilibrium and no stable separatingequilibrium, the market will not reach an equilibrium.
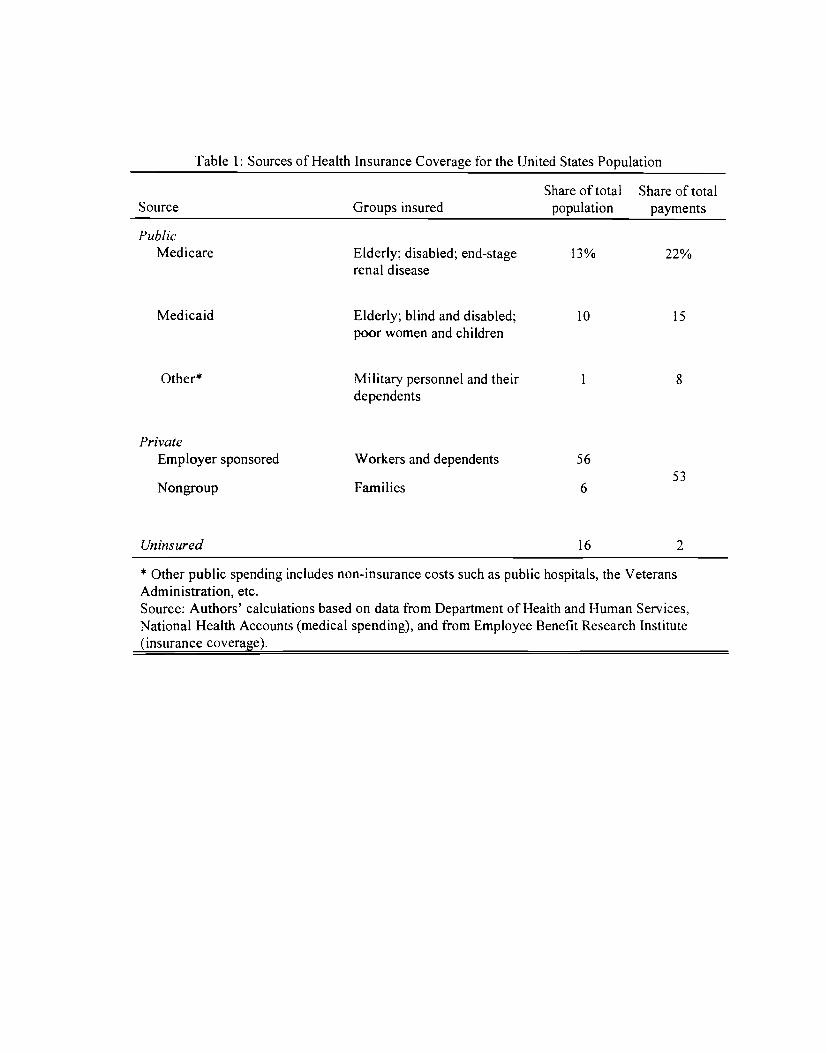
Table 1: Sources of Health Insurance Coverage for the United States Population
Share of total Share of totalSource Groups insured population payments
PublicMedicare Elderly; disabled; end-stage 13% 22%
renal disease
Medicaid Elderly; blind and disabled; 10 15poor women and children
Other* Military personnel and their 1 8
dependents
PrivateEmployer sponsored Workers and dependents 56
53Nongroup Families 6
Uninsured 16 2
* Other public spending includes non-insurance costs such as public hospitals, the VeteransAdministration, etc.Source: Authors' calculations based on data from Department of Health and Human Services,National Health Accounts (medical spending), and from Employee Benefit Research Institute(insurance coverage). ____________________________ --_____________
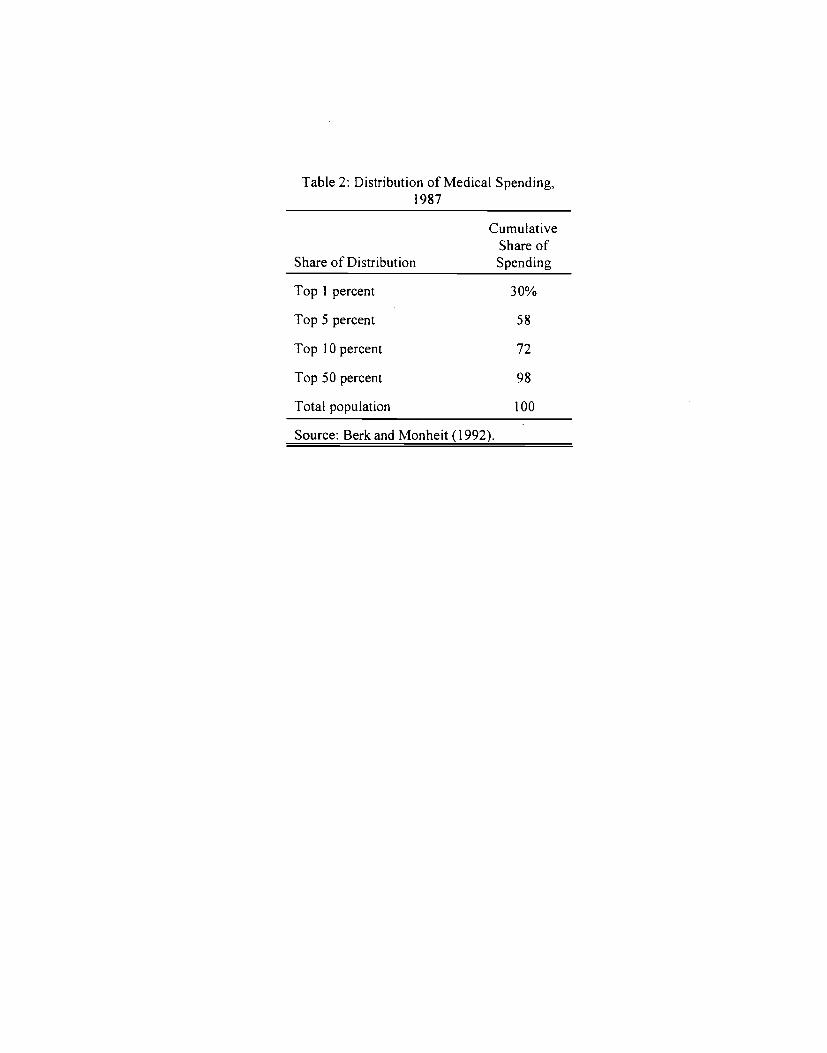
Table 2: Distribution of Medical Spending,1987
CumulativeShare of
Share of Distribution Spending
lop 1 percent 30%
Top 5 percent 58
lop 10 percent 72
Top 50 percent 98
Total population 100
Source: Berk and Monheit (1992).
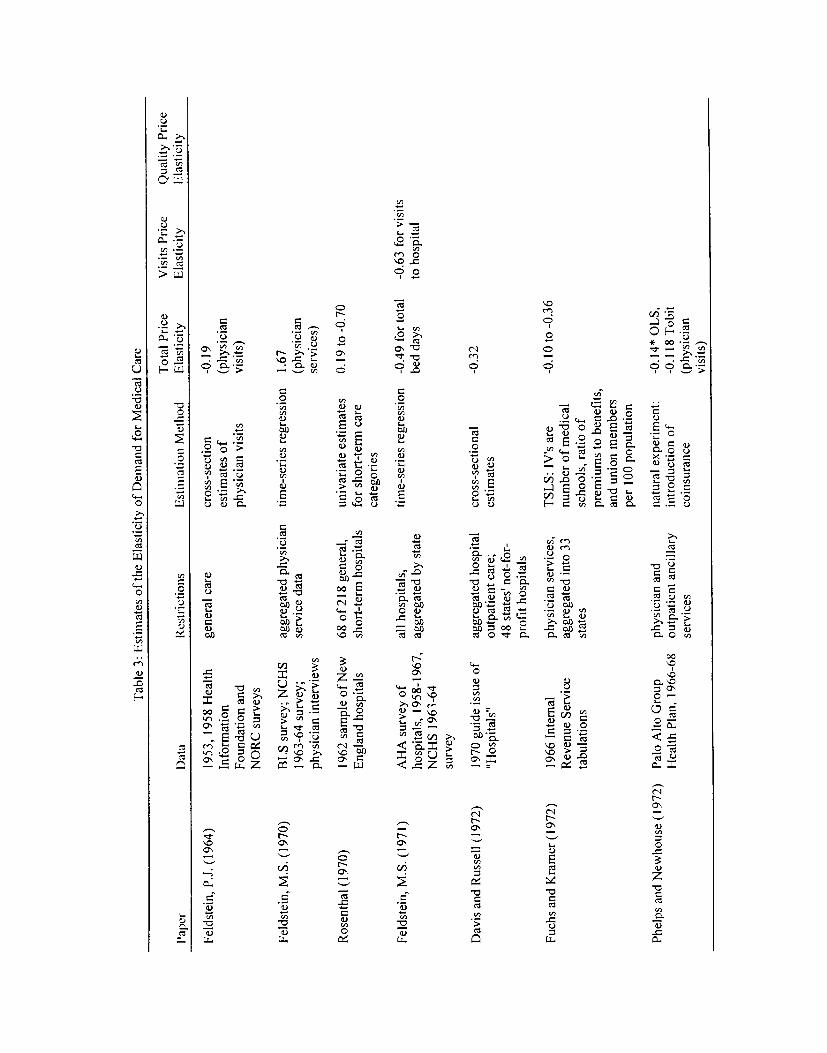
1953
, 195
8 H
ealth
In
form
atio
n Fo
unda
tion
and
NO
RC
sur
veys
BL
S su
rvey
; NC
HS
1963
-64
surv
ey;
phys
icia
n in
terv
iew
s
1962
sam
ple
of N
ew
Eng
land
hos
pita
ls
68 o
f 218
gen
eral
, sh
ort-
term
hos
pita
ls
cros
s-se
ctio
n es
timat
es o
f ph
ysic
ian
visi
ts
Tab
le 3:
Est
imat
es o
f the
Ela
stic
ity o
f Dem
and
for
Med
ical
Car
e
Tot
al P
rice
V
isits
Pri
ce
Qua
lity
Pric
e
Pape
r [)
ata
Res
tric
tions
E
stim
atio
n M
etho
d E
last
icity
E
last
icity
E
last
icity
gene
ral c
are
aggr
egat
ed p
hysi
cian
se
rvic
e da
ta
-0.1
9 (p
hysi
cian
vi
sits
)
Feld
stei
n, P
.J.
(196
4)
Feld
stei
n, M
.S. (
1970
)
Ros
enth
al (1
970)
Feld
stei
n, M
.S. (
1971
)
Dav
is a
nd R
usse
ll (1
972)
Fuch
s an
d K
ram
er (1
972)
Phel
ps a
nd N
ewho
use (
1972
)
time-
seri
es r
egre
ssio
n 1.
67
(phy
sici
an
serv
ices
)
univ
aria
te e
stim
ates
0.
19 to
-0.
70
for
shor
t-te
rm c
are
cate
gori
es
-0.6
3 fo
r vi
sits
to
hos
pita
l A
HA
sur
vey
of
hosp
itals
, 19
58-1
967,
N
CI-
IS 1
963-
64
surv
ey
1970
gui
de i
ssue
of
"Hos
pita
ls"
1966
Inte
rnal
R
even
ue S
ervi
ce
tabu
latio
ns
Palo
Alto
Gro
up
Hea
lth P
lan,
196
6-68
all
hosp
itals
, ag
greg
ated
by
stat
e
aggr
egat
ed h
ospi
tal
outp
atie
nt c
are;
48
sta
tes'
not
-for
-
prof
it ho
spita
ls
phys
icia
n se
rvic
es,
aggr
egat
ed i
nto
33
stat
es
phys
icia
n an
d
outp
atie
nt a
ncill
ary
serv
ices
time-
seri
es r
egre
ssio
n
cros
s-se
ctio
nal
estim
ates
TSL
S: I
V's
are
nu
mbe
r of m
edic
al
scho
ols,
rat
io o
f pr
emiu
ms
to b
enef
its,
and
unio
n m
embe
rs
per
100
popu
latio
n
natu
ral
expe
rim
ent:
intr
oduc
tion
of
coin
sura
nce
-0.4
9 fo
r to
tal
bed
days
-0.3
2
-0.1
0 to
-0.
36
0.l4
* O
LS,
-0
.118
Tob
it
(phy
sici
an
visi
ts)
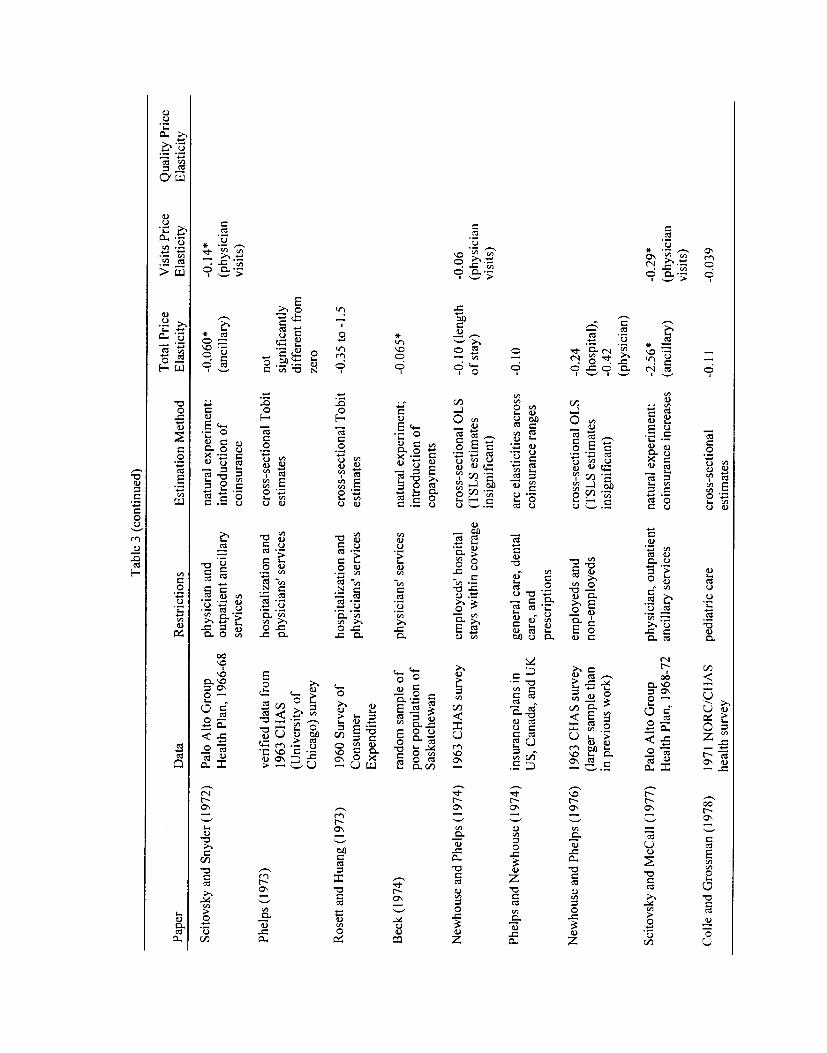
Tab
le 3
(con
tinue
d)
Tot
al P
rice
V
isits
Pri
ce
Qua
lity
Pric
e Pa
per
Dat
a R
estr
ictio
ns
Est
imat
ion
Met
hod
Ela
stic
ity
Ela
stic
ity
Ela
stic
ity
Scito
vsky
and
Sny
der
(197
2)
Palo
Alto
Gro
up
phys
icia
n and
na
tura
l ex
peri
men
t: 0.
060*
0.
l4*
Hea
lth P
lan,
196
6-68
ou
tpat
ient
anci
llary
in
trod
uctio
n of
(anc
illar
y)
(phy
sici
an
serv
ices
co
insu
ranc
e vi
sits
)
Phel
ps (
1973
) ve
rifi
ed d
ata
from
ho
spita
lizat
ion
and
cros
s-se
ctio
nal
Tob
it no
t 19
63 C
HA
S ph
ysic
ians
' se
rvic
es
estim
ates
si
gnif
ican
tly
(Uni
vers
ity o
f di
ffer
ent f
rom
C
hica
go)
surv
ey
zero
Ros
ett a
nd H
uang
(197
3)
1960
Sur
vey
of
hosp
italiz
atio
n an
d cr
oss-
sect
iona
l T
obit
-0.3
5 to
-1.
5 C
onsu
mer
ph
ysic
ians
' ser
vice
s es
timat
es
Exp
endi
ture
Bec
k (1
974)
ra
ndom
sam
ple
of
phys
icia
ns'
serv
ices
na
tura
l ex
peri
men
t; 0.
065*
po
or p
opul
atio
n of
in
trod
uctio
n of
Sa
skat
chew
an
copa
ymen
ts
New
hous
e an
d Ph
elps
(19
74)
1963
CH
AS
surv
ey
empl
oyed
s' h
ospi
tal
cros
s-se
ctio
nal
OL
S -0
.10
(len
gth
-0.0
6 st
ays
with
in c
over
age
(TSL
S es
timat
es
of st
ay)
(phy
sici
an
insi
gnif
ican
t)
visi
ts)
Phel
ps a
nd N
ewho
use (
1974
) in
sura
nce
plan
s in
ge
nera
l ca
re, d
enta
l ar
c el
astic
ities
acr
oss
-0.1
0 U
S, C
anad
a, a
nd U
K
care
, and
co
insu
ranc
e ra
nges
pr
escr
iptio
ns
New
hous
e an
d Ph
elps
(19
76)
1963
CH
AS
surv
ey
empl
oyed
s an
d cr
oss-
sect
iona
l O
LS
-0.2
4 (l
arge
r sam
ple t
han
non-
empl
oyed
s (T
SLS
estim
ates
(h
ospi
tal)
, in
pre
viou
s w
ork)
in
sign
ific
ant)
-0
.42
(phy
sici
an)
Scito
vsky
and
McC
all
(197
7)
Palo
Alto
Gro
up
phys
icia
n, o
utpa
tient
na
tura
l ex
peri
men
t: 2.
56*
0.29
* H
ealth
Pla
n, 1
968-
72
anci
llary
ser
vice
s co
insu
ranc
e in
crea
ses
(anc
illar
y)
(phy
sici
an
visi
ts)
Col
ic a
nd G
ross
man
(19
78)
1971
NO
RC
!CH
AS
pedi
atri
c ca
re
cros
s-se
ctio
nal
-0.1
1 -0
.039
he
alth
sur
vey
estim
ates
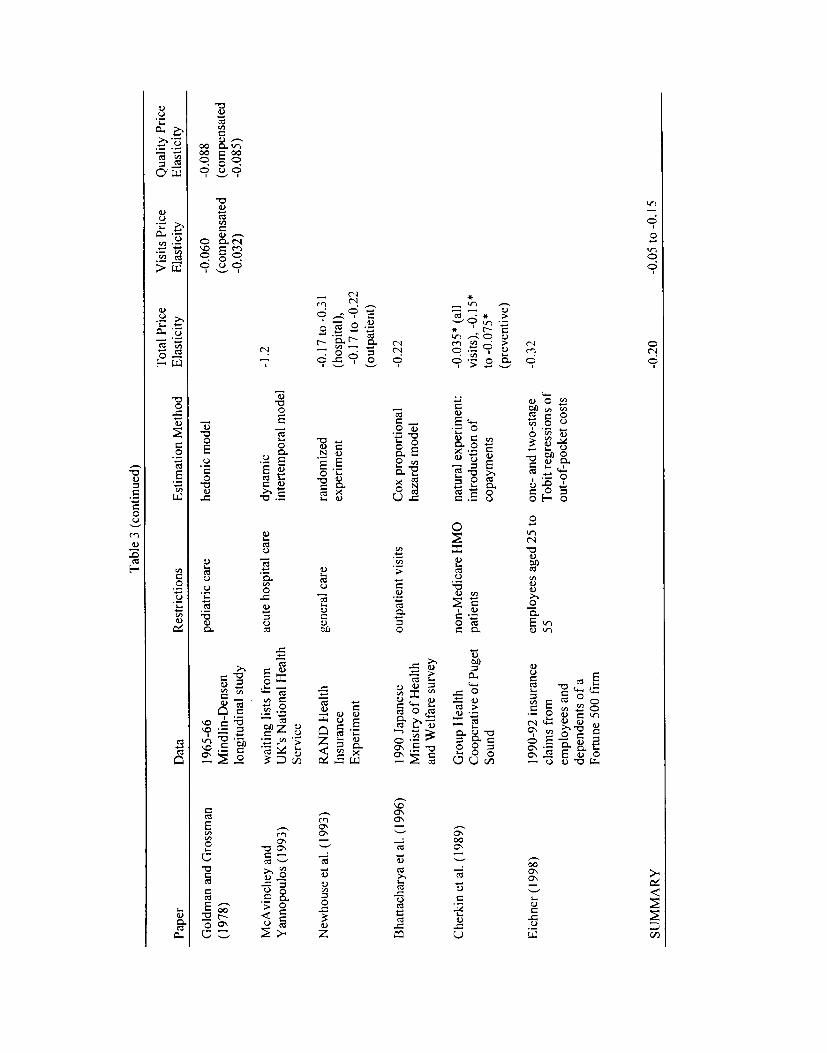
Tab
le 3
(c
ontin
ued)
Tot
al P
rice
V
isits
Pri
ce
Qua
lity
Pric
e
Pap
er
Dat
a R
estr
ictio
ns
Est
imat
ion
Met
hod
Ela
stic
ity
Ela
stic
ity
Ela
stic
ity
Gol
dman
and
Gro
ssm
an
1965
-66
pedi
atri
c ca
re
hedo
nic m
odel
-0
.060
-0
.088
(197
8)
Mm
dl in
-Den
sen
(com
pens
ated
(c
ompe
nsat
ed
long
itudi
nal
stud
y -0
.032
) -0
.085
)
McA
vinc
hey
and
wai
ting
lists
fro
m
acut
e ho
spita
l ca
re
dyna
mic
-1
.2
Yan
nopo
ulos
(19
93)
UK
's N
atio
nal
Hea
lth
inte
rtem
pora
l m
odel
Se
rvic
e
New
hous
e et a
l. (1
993)
R
AN
D H
ealth
ge
nera
l car
e ra
ndom
ized
-0
.17
to -0
.31
Insu
ranc
e ex
peri
men
t (h
ospi
tal)
, E
xper
imen
t -0
.17
to -
0.22
(out
patie
nt)
Bha
ttach
arya
et a
l. (1
996)
19
90 J
apan
ese
outp
atie
nt v
isits
C
ox p
ropo
rtio
nal
-0.2
2
Min
istr
y of H
ealth
ha
zard
s m
odel
an
d W
elfa
re s
urve
y
Che
rkin
et a
l. (1
989)
G
roup
Hea
lth
non-
Med
icar
e H
MO
na
tura
l ex
peri
men
t: 0.
035*
(al
l C
oope
rativ
e of P
uget
pa
tient
s in
trod
uctio
n of
vi
sits
), 0
.15*
So
und
copa
ymen
ts
to 0
.075
* (p
reve
ntiv
e)
Eic
hner
(19
98)
1990
-92
insu
ranc
e em
ploy
ees
aged
25
to
one-
and
two-
stag
e -0
.32
clai
ms
from
55
T
obit
regr
essi
ons
of
empl
oyee
s an
d ou
t-of
-poc
ket
cost
s de
pend
ents
of a
Fort
une 5
00 fi
rm
SUM
MA
RY
-0
.20
-0.0
5 to
-0.1
5
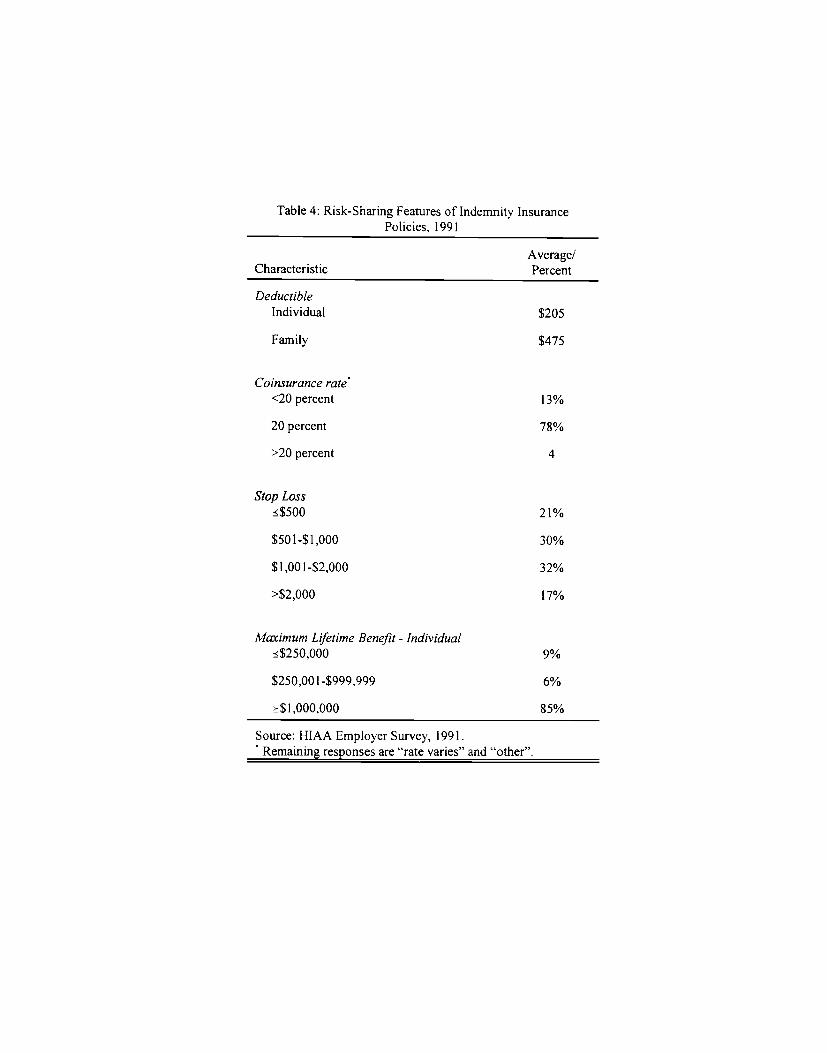
Table 4: Risk-Sharing Features of Indemnity InsurancePolicies, 1991
Average!Characteristic Percent
DeductibleIndividual $205
Family $475
Coinsurance rate<20 percent 13%
20 percent 78%
>20 percent 4
Stop Loss$500 21%
$501-$1,000 30%
S1,001-$2,000 32%
>$2,000 17%
Maximum Lifetime Benefit - Individual$250,000 9%
$250,001-$999.999 6%
$1,000,000 85%
Source: HIAA Employer Survey, 1991.Remaining responses are "rate varies" and "other".
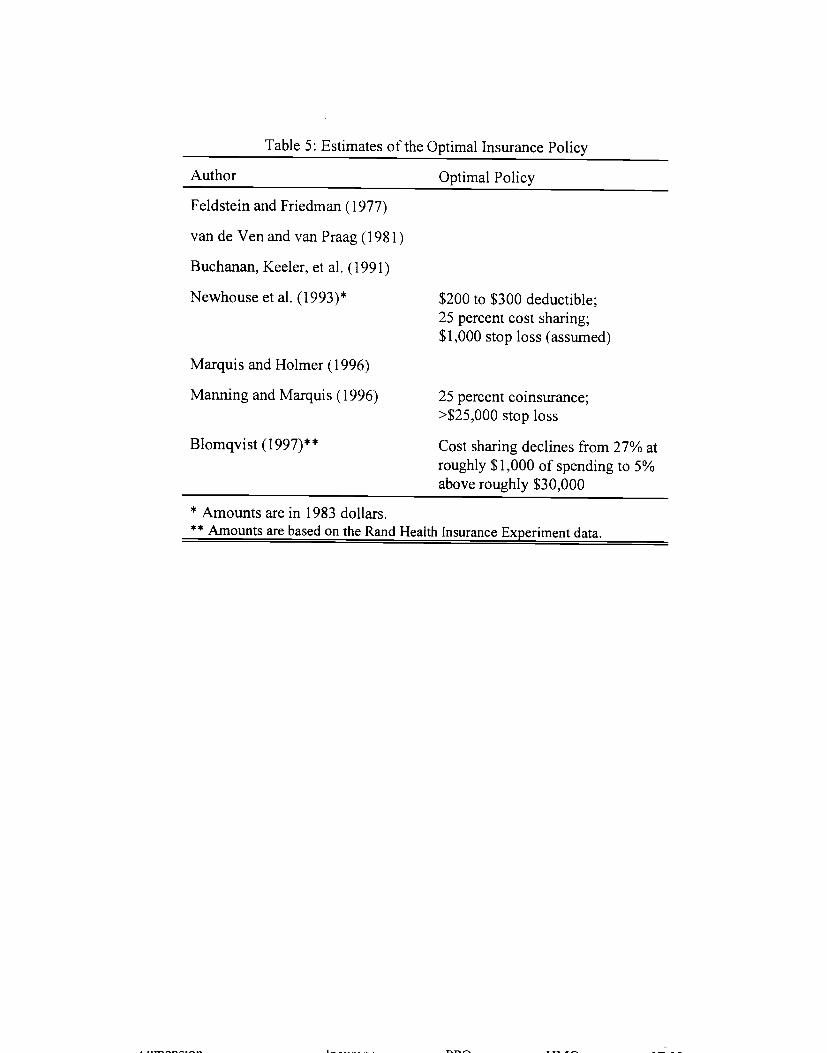
Table 5: Estimates of the Optimal Insurance Policy
Author Optimal Policy
Feldstein and Friedman (1977)
van de Ven and van Praag (1981)
Buchanan, Keeler, et al. (1991)
Newhouse et al. (1993)* $200 to $300 deductible;25 percent cost sharing;$1,000 stop loss (assumed)
Marquis and Holmer (1996)
Manning and Marquis (1996) 25 percent coinsurance;>$25,000 stop loss
Blomqvist (1997)** Cost sharing declines from 27% atroughly $1,000 of spending to 5%above roughly $30,000
* Amounts are in 1983 dollars.** Amounts are based on the Rand Health Insurance Experiment data.
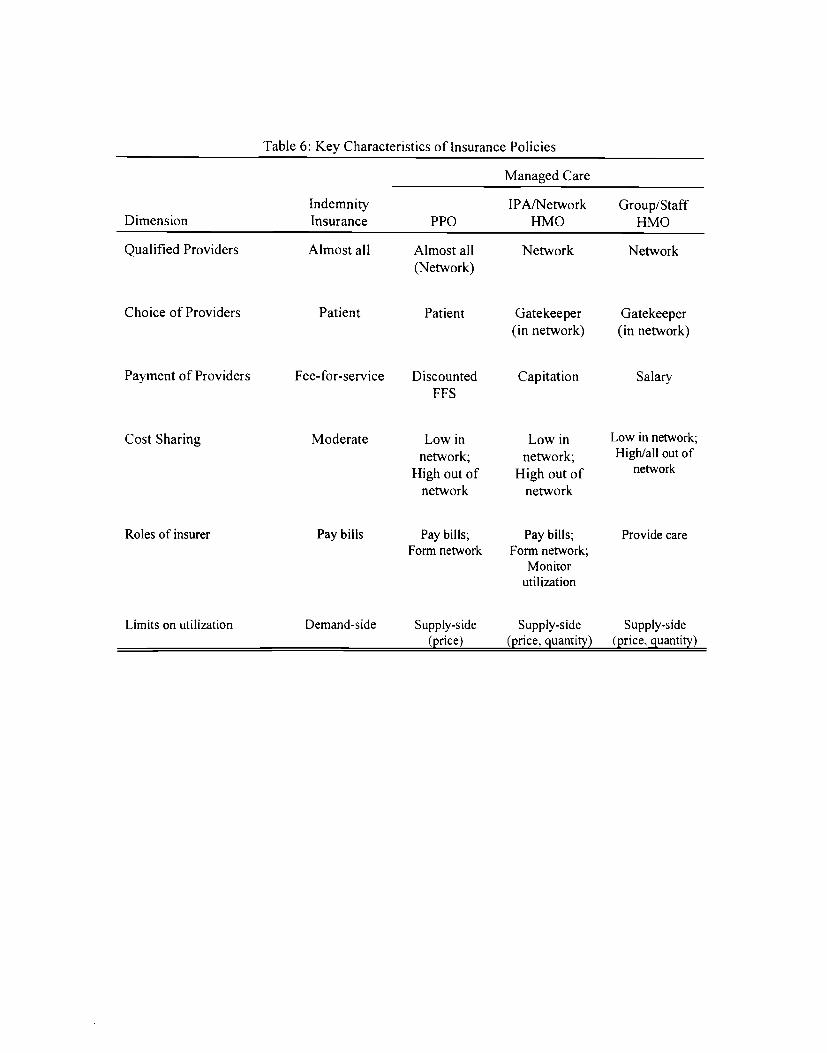
Table 6: Key Characteristics of Insurance Policies
Indemnity
Managed Care
IPA/Network Group/StaffDimension Insurance PPO HMO HMO
Qualified Providers Almost all Almost all Network Network(Network)
Choice of Providers Patient Patient Gatekeeper Gatekeeper(in network) (in network)
Payment of Providers Fee-for-service Discounted Capitation SalaryFFS
Cost Sharing Moderate Low in Low in Low in network;
network; network; High/all out of
High out of High out of network
network network
Roles of insurer Pay bills Pay bills; Pay bills; Provide careForm network Form network;
Monitorutilization
Limits on utilization Demand-side Supply-side Supply-side Supply-side(price) (price, quantity) (price, quantity)
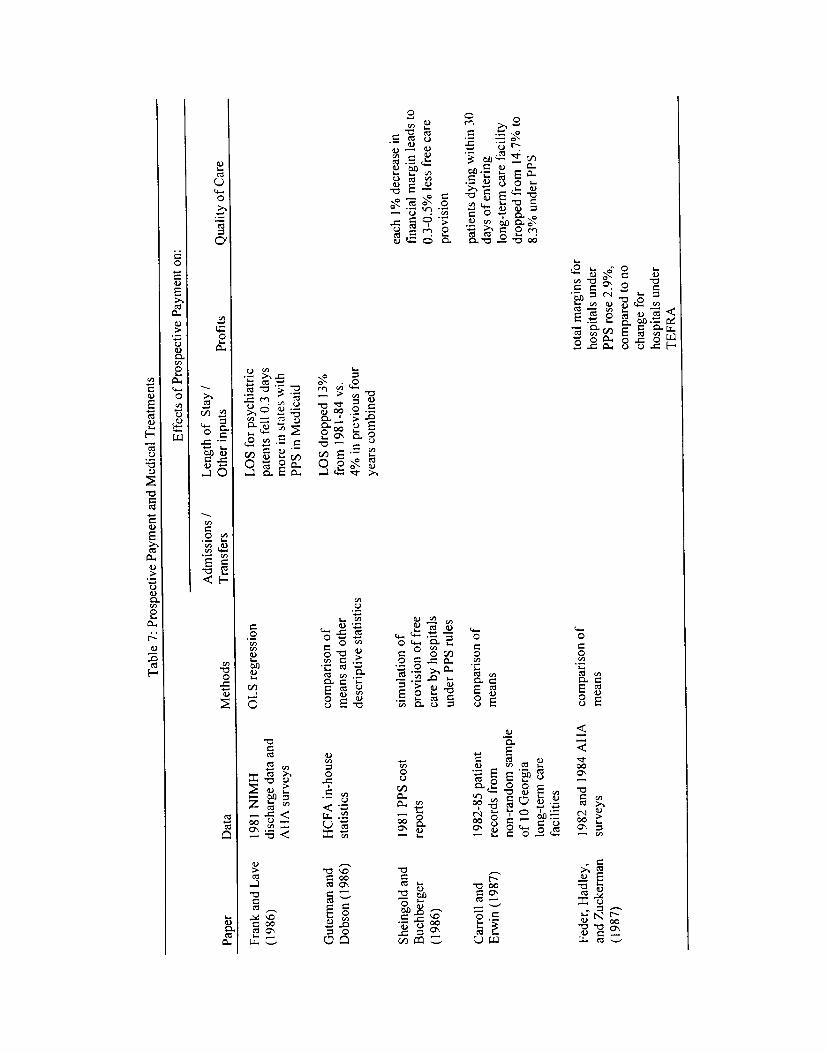
Tab
le 7
: Pr
ospe
ctiv
e Pa
ymen
t an
d M
edic
al T
reat
men
ts
Eff
ects
of P
r osp
ectiv
e Pa
ymen
t on
:
Adm
issi
ons /
Len
gth
of S
tay
/ Pa
per
Dat
a M
etho
ds
Tra
nsfe
rs
Oth
er in
puts
Pr
ofits
Q
ualit
y of
Car
e
Fran
k an
d L
ave
1981
NIM
H
OL
S re
gres
sion
L
OS
for
psyc
hiat
ric
(198
6)
disc
harg
e da
ta a
nd
pate
nts
fell
0.3
days
A
l-IA
sur
veys
m
ore
in s
tate
s w
ith
PPS
in M
edic
aid
Gut
erm
an a
nd
HC
FA i
n-ho
use
com
pari
son
of
LO
S dr
oppe
d 13
%
Dob
son
(198
6)
stat
istic
s m
eans
and
oth
er
from
198
1-84
vs.
desc
ript
ive s
tatis
tics
4% in
pre
viou
s fou
r ye
ars c
ombi
ned
Shei
ngol
d an
d 19
81 P
PS c
ost
sim
ulat
ion o
f ea
ch 1
% d
ecre
ase
in
Buc
hber
ger
repo
rts
prov
isio
n of
free
fi
nanc
ial
mar
gin
lead
s to
(198
6)
care
by
hosp
itals
0.
3-0.
5% l
ess
free
car
e
unde
r PP
S ru
les
prov
isio
n
Car
roll
and
1982
-85
patie
nt
com
pari
son
of
patie
nts
dyin
g w
ithin
30
Erw
in (
1987
) re
cord
s fr
om
mea
ns
days
of e
nter
ing
non-
rand
om s
ampl
e lo
ng-t
erm
car
e fa
cilit
y
of 1
0 G
eorg
ia
drop
ped
from
14.
7% to
long
-ter
m c
are
8.3%
und
er P
PS
faci
litie
s
Fede
r, H
adle
y,
1982
and
198
4 A
HA
co
mpa
riso
n of
to
tal
mar
gins
for
and
Zuc
kerm
an
surv
eys
mea
ns
hosp
itals
unde
r
(198
7)
PPS
rose
2.9
%,
com
pare
d to
no
chan
ge f
or
hosp
itals
unde
r T
EFR
A
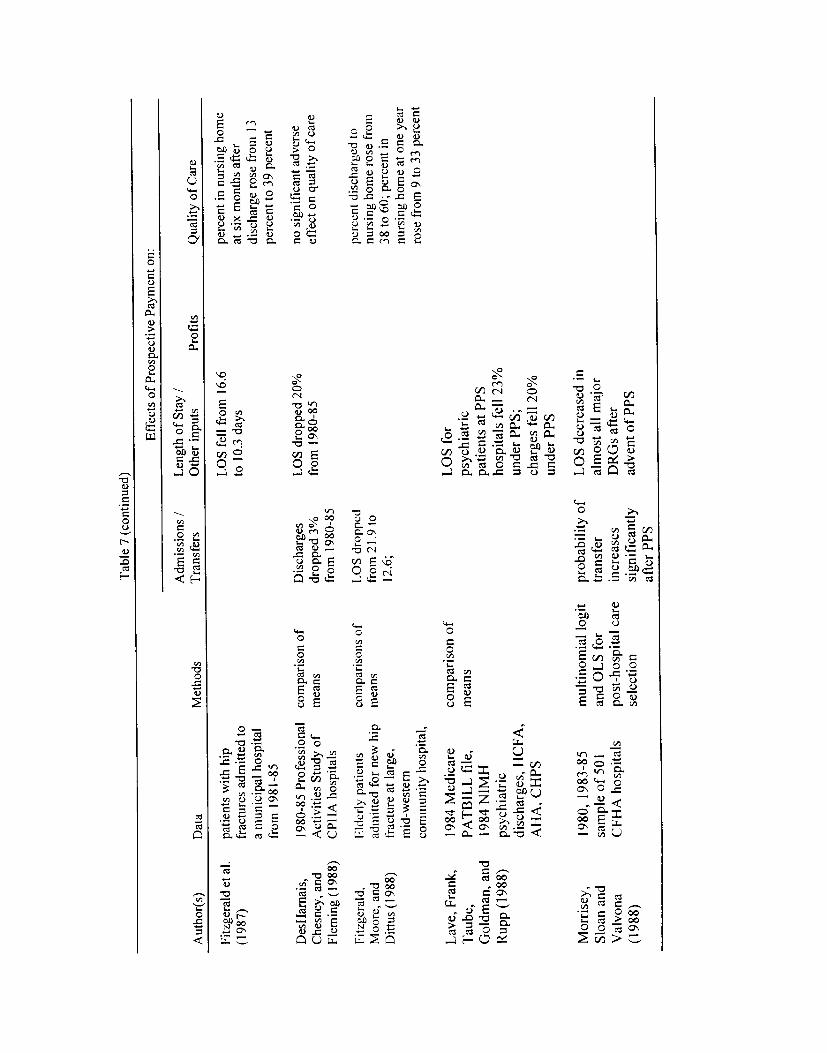
Lav
e, F
rank
, T
aube
, G
oldm
an,
and
Rup
p (1
988)
patie
nts w
ith h
ip
frac
ture
s adm
itted
to
a m
unic
ipal
hos
pita
l fr
om 1
981-
85
1980
-85
Prof
essi
onal
A
ctiv
ities
Stu
dy o
f C
PHA
hos
pita
ls
Eld
erly
pat
ient
s ad
mitt
ed f
or n
ew h
ip
frac
ture
at l
arge
, m
id-w
este
rn
com
mun
ity h
ospi
tal,
1984
Med
icar
e PA
TB
ILL
file
, 19
84 N
IMH
ps
ychi
atri
c di
scha
rges
, H
CFA
, A
l-IA
, C
HPS
com
pari
son
of
mea
ns
com
pari
sons
of
mea
ns
LO
S fe
ll fr
om 1
6.6
to 1
0.3
days
LO
S dr
oppe
d 20
%
from
198
0-85
perc
ent
in n
ursi
ng h
ome
at s
ix m
onth
s af
ter
disc
harg
e ro
se f
rom
13
perc
ent
to 3
9 pe
rcen
t
rio
sign
ific
ant a
dver
se
effe
ct on
qua
lity
of ca
re
perc
ent
disc
harg
ed to
nurs
ing
hom
e ro
se f
rom
38
to
60;
perc
ent i
n
nurs
ing
hom
e at
one
yea
r ro
se f
rom
9 t
o 33
per
cent
Tab
le 7
(con
tinue
d)
Eff
ects
of P
rosp
ectiv
e Pa
ymen
t on
:
Adm
issi
ons
/ L
engt
h of
Stay
/
of C
are
Aut
hor(
s)
Dat
a M
etho
ds
Tra
nsfe
rs
Oth
er in
puts
Pr
ofits
Q
ualit
y
Fitz
gera
ld e
t al.
(198
7)
Des
Ham
ais,
C
hesn
ey, a
nd
Flem
ing
(198
8)
Fitz
gera
ld.
Moore, and
Dittus (1
988)
Dis
char
ges
drop
ped
3%
from
198
0-85
LO
S dr
oppe
d fr
om 21.9 to
12.6;
prob
abili
ty o
f tr
ansf
er
incr
ease
s si
gnif
ican
tly
afte
r PPS
com
pari
son
of
mea
ns
mul
tinom
ial
logi
t an
d O
LS
for
post
-hos
pita
l ca
re
sele
ctio
n
Mor
rise
y,
Sloa
n an
d V
alvo
na
(198
8)
1980
, 198
3-85
sa
mpl
e of
501
C
FHA
hos
pita
ls
LO
S fo
r ps
ychi
atri
c pa
tient
s at
PPS
hosp
itals
fel
l 23
%
unde
r PPS
; ch
arge
s fe
ll 20
%
unde
r PPS
LO
S de
crea
sed
in
alm
ost
all m
ajor
D
RG
s af
ter
adve
nt o
f PPS
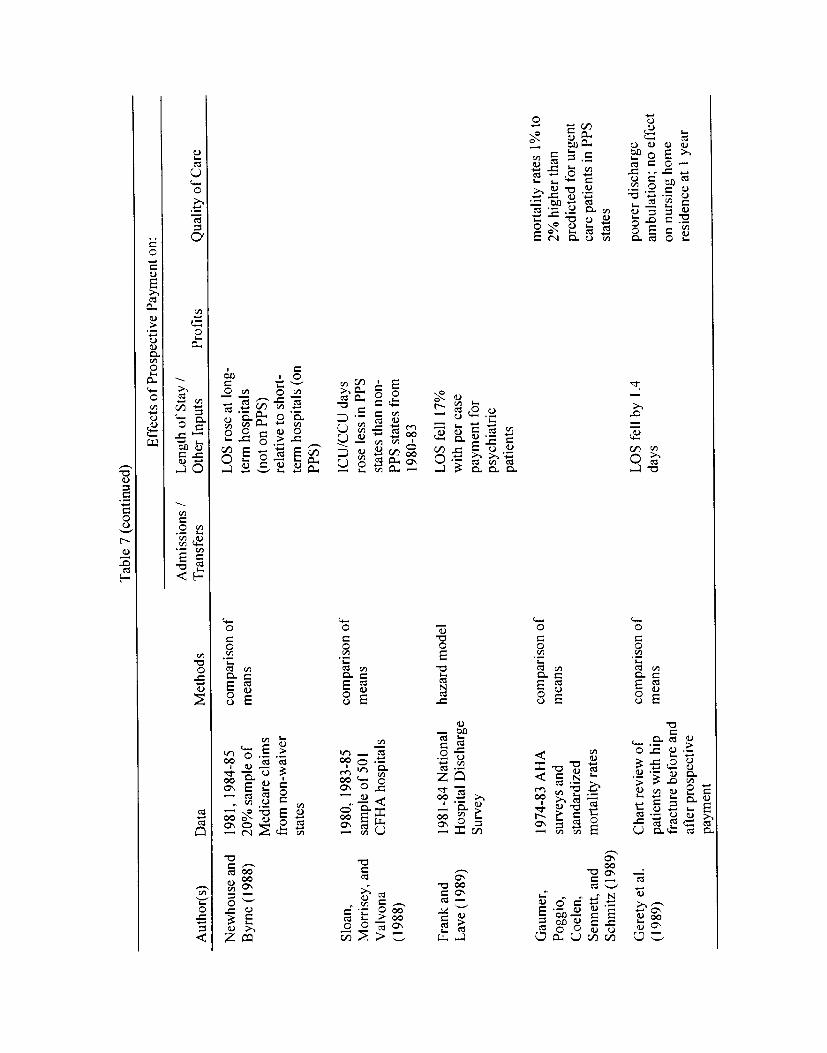
Sloa
n,
Mor
rise
y, a
nd
Val
vona
(1
988)
1981
, 19
84-8
5 20
% s
ampl
e of
M
edic
are
clai
ms
from
non
-wai
ver
stat
es
1980
, 198
3-85
sa
mpl
e of
501
CFH
A h
ospi
tals
com
pari
son
of
mea
ns
com
pari
son
of
mea
ns
LO
S ro
se a
t lon
g-
term
hos
pita
ls
(not
on
PPS)
re
lativ
e to
sho
rt-
term
hos
pita
ls (
on
PPS)
ICU
/CC
U d
ays
rose
less
in
PPS
stat
es t
han
non-
PP
S st
ates
fro
m
1980
-83
Fran
k an
d L
ave
(198
9)
Gau
mer
, Po
ggio
, C
oele
n,
Senn
ett,
and
Schm
itz (
1989
)
Ger
ety
et a
l. (1
989)
1981
-84
Nat
iona
l H
ospi
tal
Dis
char
ge
Surv
ey
1974
-83
AH
A
surv
eys
and
stan
dard
ized
m
orta
lity
rate
s
Cha
rt r
evie
w o
f pa
tient
s w
ith h
ip
frac
ture
bef
ore
and
afte
r pro
spec
tive
paym
ent
haza
rd m
odel
com
pari
son
of
mea
ns
com
pari
son
of
mea
ns
LO
S fe
ll 17
%
with
per
case
pa
ymen
t fo
r
psyc
hiat
ric
patie
nts
LO
S fe
ll by
1.4
days
mor
talit
y ra
tes
1% to
2% h
ighe
r th
an
pred
icte
d fo
r ur
gent
ca
re p
atie
nts i
n PP
S st
ates
poor
er d
isch
arge
am
bula
tion;
no
effe
ct
on n
ursi
ng h
ome
resi
denc
e at
1 ye
ar
Tab
le 7
(con
tinue
d)
New
hous
e an
d B
yrne
(19
88)
Eff
ects
of P
rosp
ectiv
e Pa
ymen
t on:
Adm
issi
ons
/ L
engt
h of
Sta
y /
Aut
hor(
s)
Dat
a M
etho
ds
Tra
nsfe
rs
Oth
er In
puts
Pr
ofits
Q
ualit
y
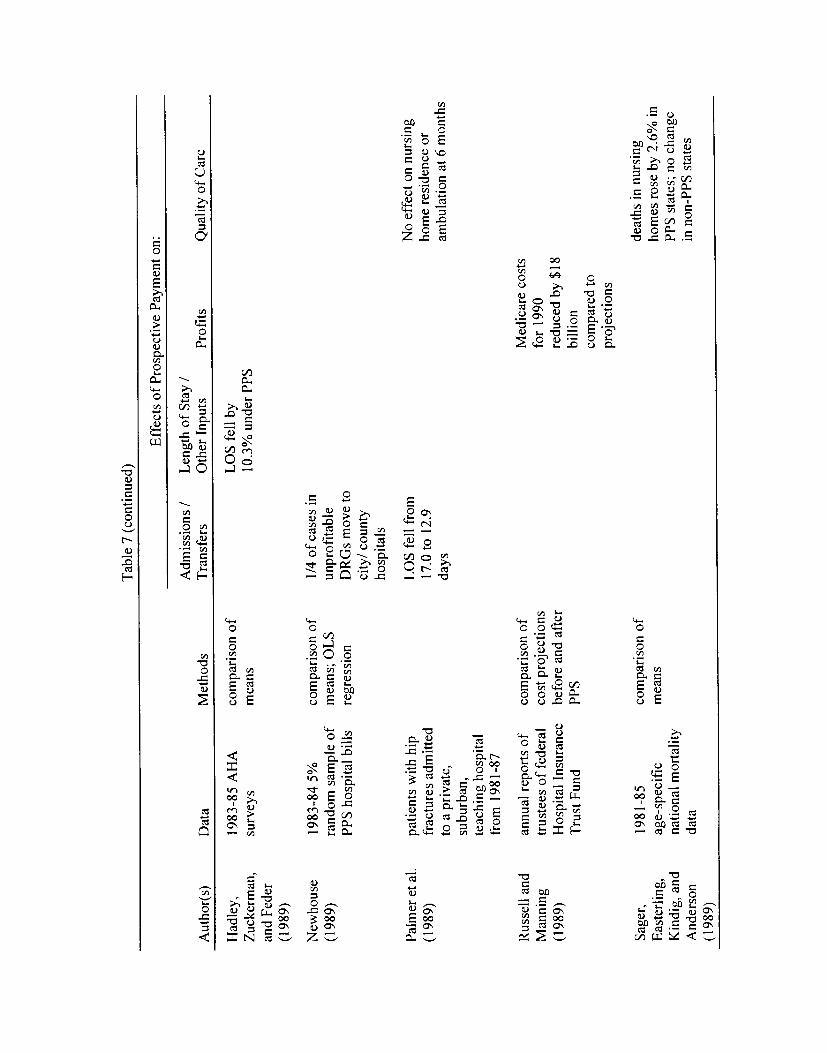
Tab
le 7
(con
tinue
d)
Eff
ects
of P
ro sp
ectiv
e Pa
ym en
t on:
Adm
issi
ons
/ L
engt
h of
Sta
y /
Aut
hor(
s)
Dat
a M
etho
ds
Tra
nsfe
rs
Oth
er In
puts
Pr
ofits
Q
ualit
y of
Car
e
Had
ley,
19
83-8
5 A
HA
co
mpa
riso
n of
L
OS
fell
by
Zuc
kerm
an,
surv
eys
mea
ns
10.3
% u
nder
PPS
and
Fede
r (1
989)
New
hous
e 19
83-8
4 5%
co
mpa
rison
of
1/4 of
case
s in
(198
9)
rand
om s
ampl
e of
m
eans
; O
LS
unpr
ofita
ble
PPS
hosp
ital
bills
re
gres
sion
D
RG
s mov
e to
ci
ty! c
ount
y ho
spita
ls
Palm
er e
t al.
patie
nts
with
hip
L
OS
fell
from
N
o ef
fect
on
nurs
ing
(198
9)
frac
ture
s adm
itted
17
.0 to
12.
9 ho
me
resi
denc
e or
to a
pri
vate
, da
ys
ambu
latio
n at
6 m
onth
s
subu
rban
, te
achi
ng ho
spita
l fr
om 1
981-
87
Rus
sell
and
annu
al r
epor
ts o
f co
mpa
riso
n of
M
edic
are
cost
s
Man
ning
tr
uste
es o
f fed
eral
co
st p
roje
ctio
ns
for
1990
(198
9)
Hos
pita
l In
sura
nce
befo
re a
nd a
fter
re
duce
d by
$18
T
rust
Fun
d PP
S bi
llion
com
pare
d to
proj
ectio
ns
Sage
r,
198 1
-85
com
pari
son
of
deat
hs i
n nu
rsin
g
Eas
terl
ing,
ag
e-sp
ecif
ic
mea
ns
hom
es r
ose b
y 2.
6% in
Kin
dig,
and
na
tiona
l m
orta
lity
PPS
stat
es;
no c
hang
e A
nder
son
data
in
non
-PPS
sta
tes
(198
9)
--
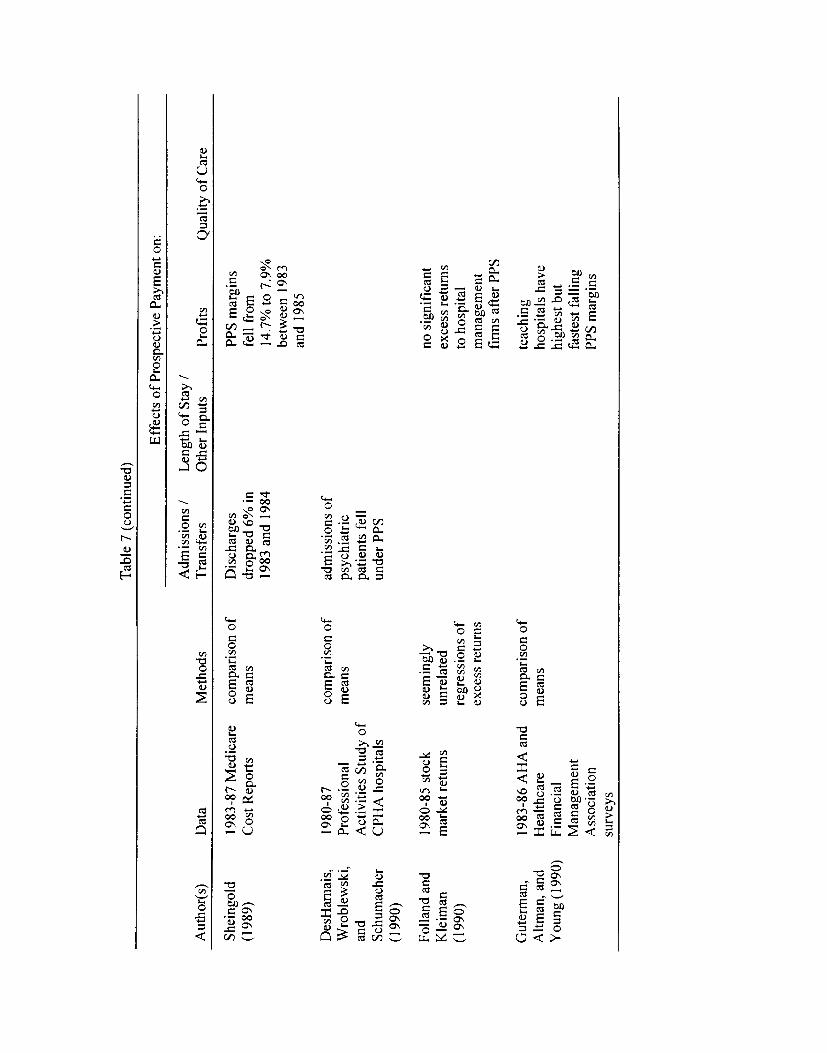
Tab
le 7
(con
tinue
d)
Eff
ects
of P
ro sp
ectiv
e Pa
ym en
t on:
Adm
issi
ons
/ L
engt
h of
Sta
y /
Aut
hor(
s)
Dat
a M
etho
ds
Tra
nsfe
rs
Oth
er In
puts
Pr
ofits
Q
ualit
y of
Car
e
Shei
ngol
d 19
83-8
7 M
edic
are
com
pari
son
of
Dis
char
ges
PPS
mar
gins
(1
989)
C
ost R
epor
ts
mea
ns
drop
ped
6% in
fe
ll fr
om
1983
and
198
4 14
.7%
to 7
.9%
be
twee
n 19
83
and
1985
DesHarnais,
1980
-87
comparison of
admissions of
Wroblewski,
Prof
essi
onal
m
eans
ps
ychi
atri
c an
d A
ctiv
ities
Stu
dy o
f pa
tient
s fe
ll Sc
hum
ache
r C
PHA
hos
pita
ls
unde
r PPS
(1
990)
Folla
nd a
nd
1980
-85
stoc
k se
emin
gly
no si
gnif
ican
t K
leim
an
mar
ket
retu
rns
unre
late
d ex
cess
retu
rns
(199
0)
regr
essi
ons
of
to h
ospi
tal
exce
ss r
etur
ns
man
agem
ent
firm
s af
ter P
PS
Gut
erm
an,
1983
-86
AH
A a
nd
com
pari
son
of
teac
hing
A
ltman
, and
H
ealth
care
m
eans
ho
spita
ls h
ave
You
ng (
1990
) Fi
nanc
ial
high
est b
ut
Man
agem
ent
fast
est f
allin
g A
ssoc
iatio
n PP
S m
argi
ns
____
_---
su
rvey
s
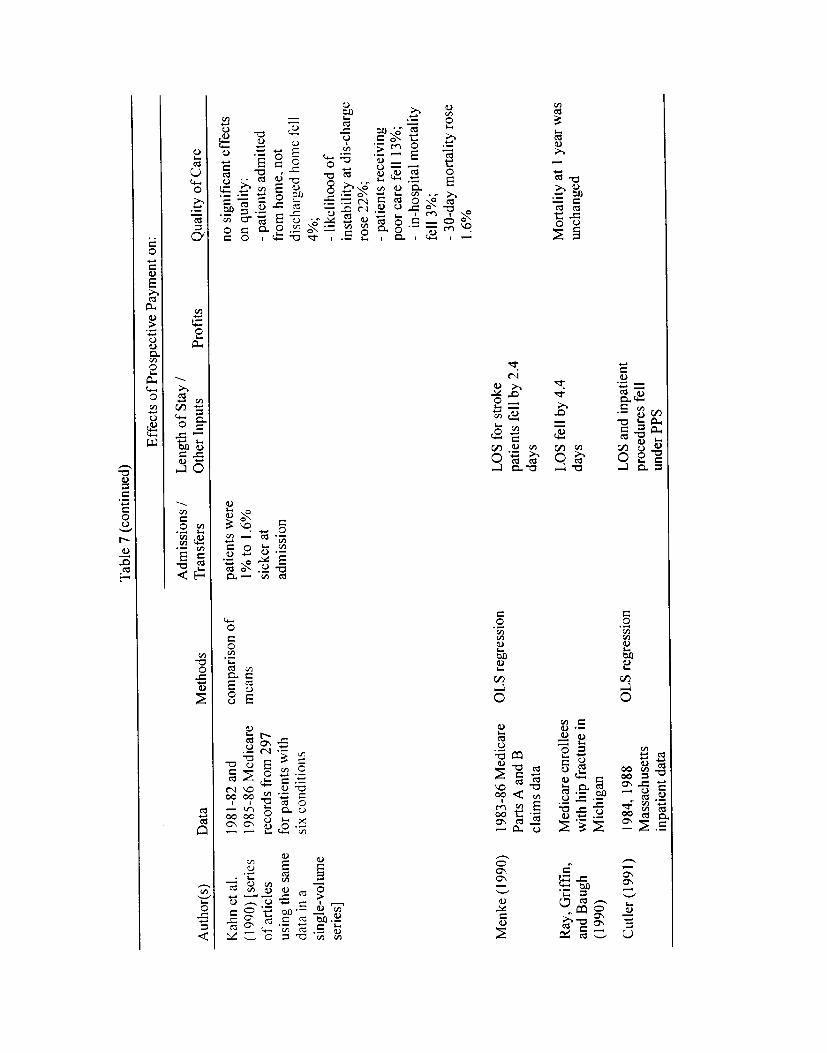
Kah
n et
al.
(199
0) [
seri
es
of ar
ticle
s us
ing
the
sam
e da
ta i
n a
sing
le-v
olum
e se
ries
]
1981
-82
and
1985
-86
Med
icar
e re
cord
s fr
om 2
97
for
patie
nts
with
si
x co
nditi
ons
patie
nts w
ere
1%to
1.6
%
sick
er a
t ad
mis
sion
no s
igni
fica
nt e
ffec
ts
on q
ualit
y:
- pa
tient
s ad
mitt
ed
from
hom
e, n
ot
disc
harg
ed h
ome
fell
4%;
- lik
elih
ood
of
inst
abili
ty a
t dis
-cha
rge
rose
22%
; -
patie
nts
rece
ivin
g po
or c
are f
ell
13%
; -
in-h
ospi
tal m
orta
lity
fell
3%;
- 30
-day
mor
talit
y ro
se
1.6%
Men
ke (
1990
)
Ray
, Gri
ffin
, an
d B
augh
(1
990)
Cut
ler
(199
1)
1983
-86
Med
icar
e Pa
rts A
and
B
clai
ms d
ata
Med
icar
e en
rolle
es
with
hip
frac
ture
in
Mic
higa
n
1984
, 198
8 M
assa
chus
eUs
inpa
tient
dat
a
OL
S re
gres
sion
OL
S re
gres
sion
LO
S fo
r str
oke
patie
nts
fell
by 2
.4
days
LO
S fe
ll by
4.4
da
ys
LO
S an
d in
patie
nt
proc
edur
es f
ell
unde
r PPS
Mor
talit
y at
1 ye
ar w
as
unch
ange
d
Tab
le 7
(con
tinue
d)
Eff
ects
of P
rosp
ectiv
e Pa
ymen
t on
:
Adm
issi
ons /
L
engt
h of
Sta
y /
of C
are
Aut
hor(
s)
Dat
a M
etho
ds
Tra
nsfe
rs
Oth
er In
puts
Pr
ofits
Q
ualit
y
com
pari
son
of
mea
ns
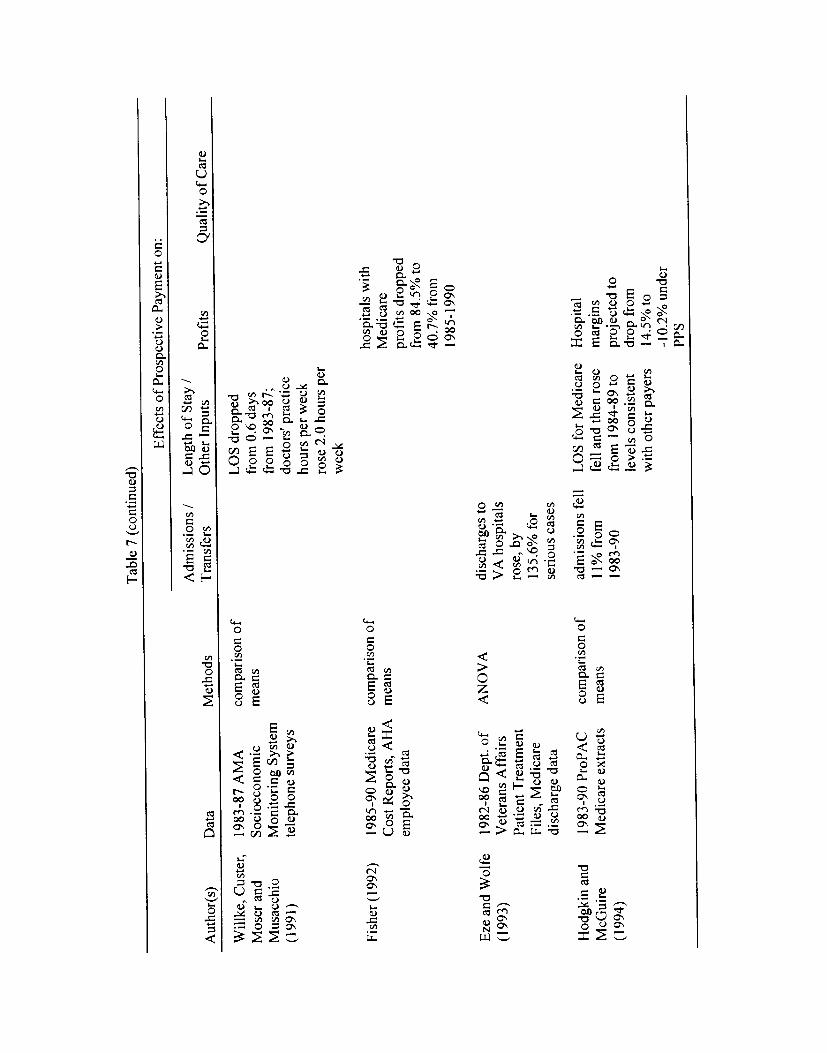
WilI
ke, C
uste
r,
Mos
er a
nd
Mus
acch
io
(199
1)
1983
-87
AM
A
Soci
oeco
nom
ic
Mon
itori
ng S
yste
m
tele
phon
e su
rvey
s
com
pari
son
of
mea
ns
LO
S dr
oppe
d fr
om 0
.6 d
ays
from
198
3-87
; do
ctor
s' p
ract
ice
hour
s pe
r w
eek
rose
2.0
hou
rs p
er
wee
k
Fish
er (
1992
) 19
85-9
0 M
edic
are
Cos
t Rep
orts
, A
HA
empl
oyee
dat
a
com
pari
son
of
mea
ns
hosp
itals
with
M
edic
are
prof
its dr
oppe
d fr
om 8
4.5%
to
40.7
% from
1985
-199
0
Eze
and
Wol
fe
(199
3)
Hod
gkin
and
M
cGui
re
(199
4)
1982
-86
Dep
t. of
V
eter
ans
Aff
airs
Pa
tient
Tre
atm
ent
File
s, M
edic
are
disc
harg
e da
ta
1983
-90
ProP
AC
M
edic
are
extr
acts
co
mpa
riso
n of
m
eans
disc
harg
es t
o V
A h
ospi
tals
ro
se, b
y 13
5.6%
for
seri
ous
case
s
adm
issi
ons f
ell
11%
fro
m
1983
-90
LO
S fo
r Med
icar
e fe
ll an
d th
en ro
se
from
198
4-89
to
leve
ls c
onsi
sten
t w
ith o
ther
pay
ers
Hos
pita
l m
argi
ns
proj
ecte
d to
dr
op fr
om
14.5
% to
- 1
0.2%
und
er
PPS
Tab
le 7
(con
tinue
d)
Eff
ects
of P
rosp
ectiv
e Pa
ymen
t on:
Adm
issi
ons
/ L
engt
h of
Stay
/
Prof
its
Qua
lity
of C
are
Aut
hor(
s)
Dat
a M
etho
ds
Tra
nsfe
rs
Oth
er In
puts
AN
OV
A
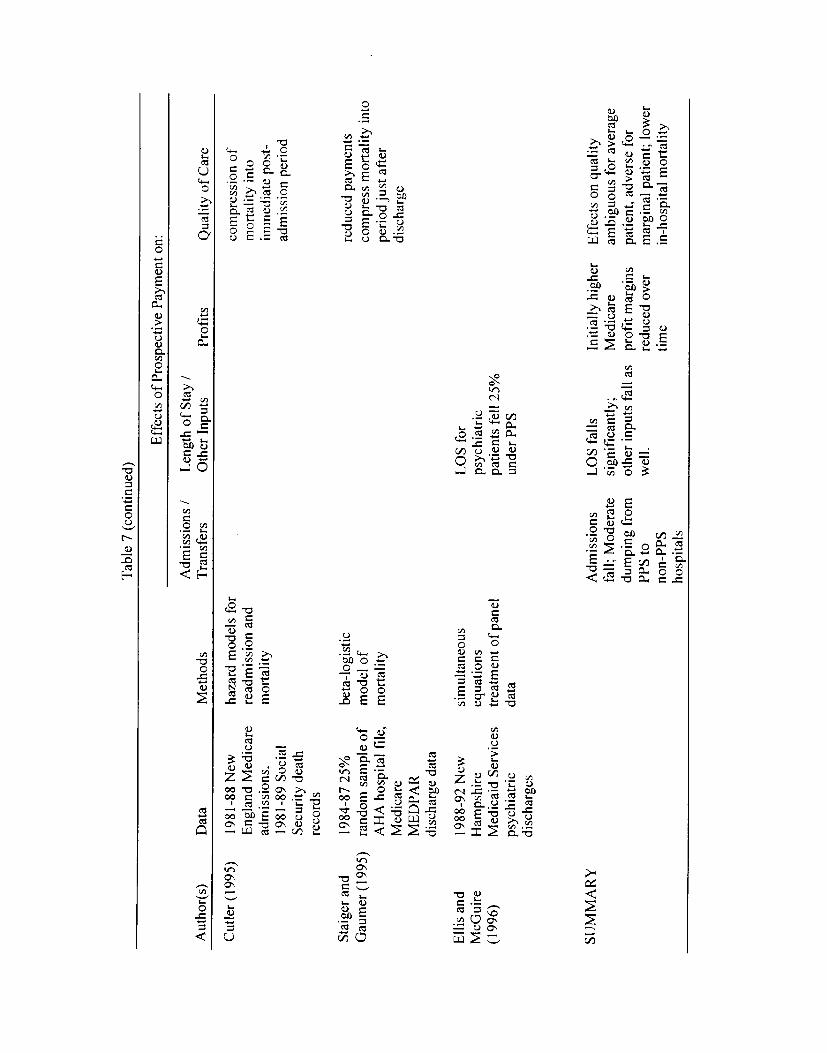
1981
-88
New
E
ngla
nd M
edic
are
adm
issi
ons,
19
8 1-
89 S
ocia
l
Sec
urity
dea
th
reco
rds
haza
rd m
odel
s fo
r re
adm
issi
on a
nd
mor
talit
y
com
pres
sion
of
mor
talit
y in
to
imm
edia
te p
ost-
ad
mis
sion
per
iod
Stai
ger
and
Gau
mer
(19
95)
Elli
s an
d M
cGu
ire
(199
6)
1984
-872
5%
rand
om s
ampl
e of
A
HA
hos
pita
l fi
le,
Med
icar
e M
ED
PAR
di
scha
rge
data
1988
-92
New
H
amps
hire
M
edic
aid
Serv
ices
ps
ychi
atri
c di
scha
rges
beta
-log
istic
m
odel
of
mor
talit
y
sim
ulta
neou
s eq
uatio
ns
trea
tmen
t of
pan
el
data
LO
S fo
r ps
ychi
atri
c pa
tient
s fe
ll 25
%
unde
r PPS
redu
ced
paym
ents
co
mpr
ess
mor
talit
y in
to
peri
od ju
st a
fter
di
scha
rge
SUM
MA
RY
A
dmis
sion
s fa
ll; M
oder
ate
dum
ping
fro
m
PPS
to
non-
PPS
hosp
itals
LO
S fa
lls
sign
ific
antly
; ot
her i
nput
s fa
ll as
w
ell.
Initi
ally
hig
her
Med
icar
e pr
ofit
mar
gins
re
duce
d ov
er
time
Eff
ects
on
qual
ity
ambi
guou
s fo
r av
erag
e pa
tient
, adv
erse
for
mar
gina
l pa
tient
; lo
wer
in
-hos
pita
l m
orta
lity
Tab
le 7
(con
tinue
d)
Cut
ler
(199
5)
Eff
ects
of P
rosp
ectiv
e Pa
ymen
t on
:
Adm
issi
ons
/ L
engt
h of
Sta
y /
Aut
hor(
s)
Dat
a M
etho
ds
Tra
nsfe
rs
Oth
er In
puts
Pr
ofits
Q
ualit
y of
Car
e
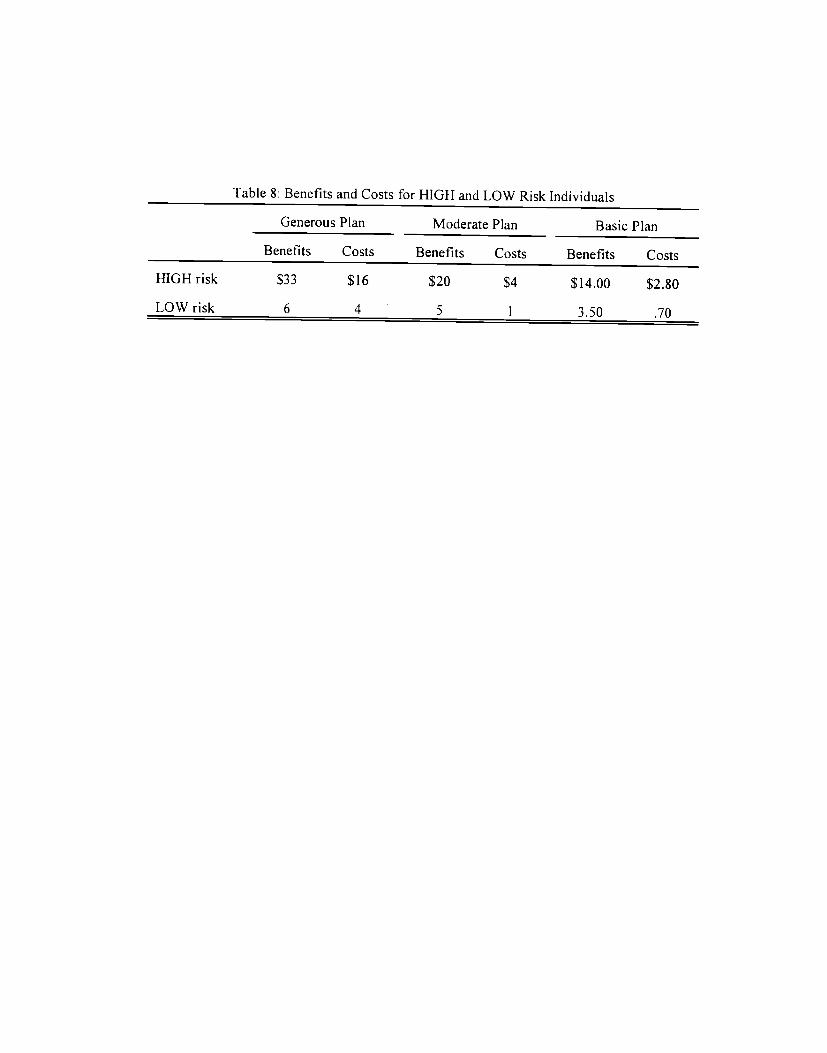
Table 8: Benefits and Costs
Generous Plan
Benefits Costs
$33 $16
for HIGH and LOW Risk Individuals
Moderate Plan Basic Plan
Benefits Costs Benefits Costs
$20 $4 $14.00 $2.80
3.50 70
HIGH risk
LOWrisk 6 4 5
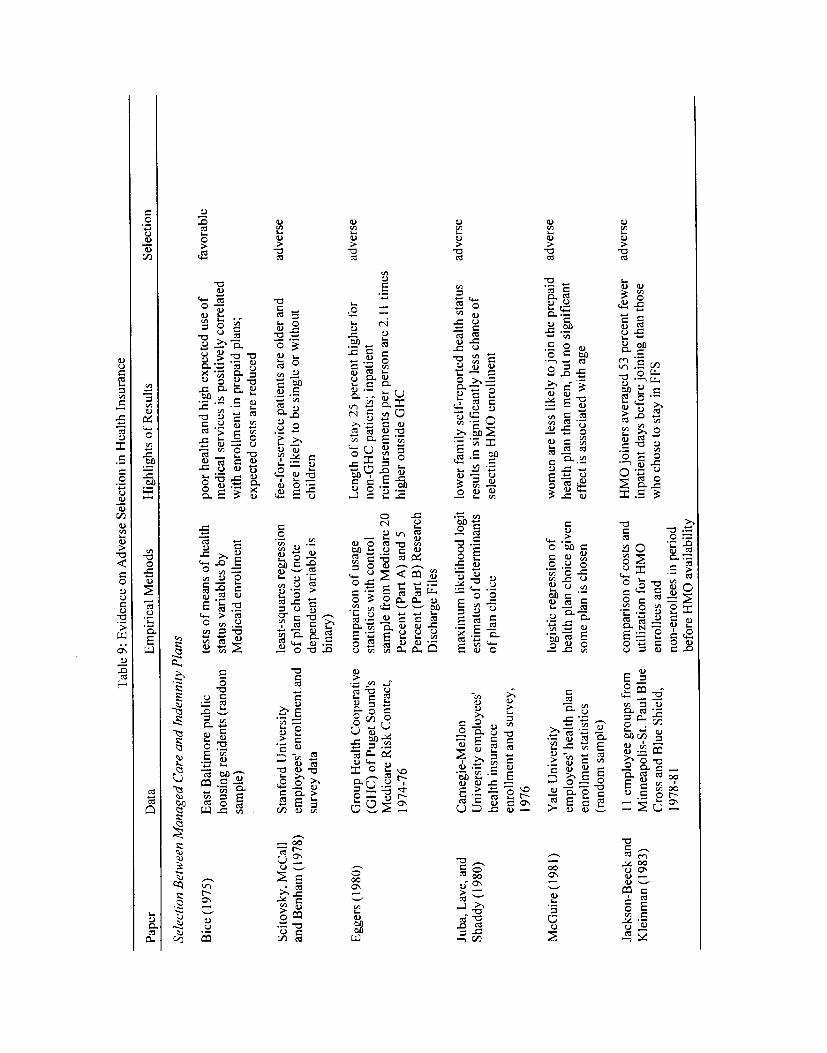
'Fab
le 9
: E
vide
nce
on A
dver
se S
elec
tion
in H
ealth
Ins
uran
ce
Pap
er
Dat
a E
mpi
rical
Met
hods
H
ighl
ight
s of
Res
ults
S
elec
tion
Sele
ctio
n Bet
wee
n M
anag
ed C
are
and I
ndem
nity
Plan
s
Bic
e (1
975)
Sci
tovs
ky,
McC
all
and
Ben
ham
(19
78)
Eas
t B
altim
ore
publ
ic
hous
ing
resi
dent
s (r
ando
m
sam
ple)
Sta
nfor
d Uni
vers
ity
empl
oyee
s' e
nrol
lmen
t and
surv
ey d
ata
test
s of
mea
ns o
f hea
lth
stat
us v
aria
bles
by
Med
icai
d en
rollm
ent
leas
t-sq
uare
s re
gres
sion
of
pla
n ch
oice
(no
te
depe
nden
t var
iabl
e is
bina
ry)
poor
hea
lth an
d hi
gh e
xpec
ted
use
of
med
ical
ser
vice
s is
pos
itive
ly co
rrel
ated
w
ith e
nrol
lmen
t in
prep
aid
plan
s;
expe
cted
cos
ts a
re re
duce
d
fee-
for-
serv
ice
patie
nts
are
olde
r and
m
ore
likel
y to
be
sing
le o
r with
out
child
ren
favo
rabl
e
adve
rse
Egg
ers
(198
0)
Juba
, Lav
e, an
d
Sha
ddy
(198
0)
Gro
up H
ealth
Coo
pera
tive
(GU
C) o
f Pug
et S
ound
's
Med
icar
e R
isk
Con
trac
t, 19
74-7
6
Car
negi
e-M
ello
n U
nive
rsity
em
ploy
ees'
he
alth
ins
uran
ce
enro
llmen
t and
sur
vey,
19
76
com
paris
on o
f usa
ge
stat
istic
s w
ith c
ontr
ol
sam
ple
from
Med
icar
e 20
P
erce
nt (
Par
t A)
and
5 P
erce
nt (
Par
t B
) Res
earc
h
Dis
char
ge F
iles
max
imum
like
lihoo
d lo
git
estim
ates
of d
eter
min
ants
of
pla
n ch
oice
Leng
th o
f sta
y 25
per
cent
hig
her
for
non-
GH
C pa
tient
s; i
npat
ient
re
imbu
rsem
ents
per
per
son
are
2.11
tim
es
high
er o
utsi
de G
HC
low
er fa
mily
sel
f-re
port
ed he
alth
sta
tus
resu
lts i
n si
gnifi
cant
ly le
ss c
hanc
e of
se
lect
ing
HM
O e
nrol
lmen
t
adve
rse
adve
rse
McG
uire
(198
1)
Jack
son-
Bee
ck a
nd
Kle
inm
an (1
983)
Yal
e U
nive
rsity
em
ploy
ees'
hea
lth p
lan
enro
llmen
t sta
tistic
s (r
ando
m sa
mpl
e)
11 e
mpl
oyee
grou
ps fr
om
Min
neap
olis
-St. P
aul B
lue
Cro
ss a
nd B
lue
Shi
eld,
19
78-8
1
logi
stic
regr
essi
on o
f he
alth
pla
n ch
oice
giv
en
som
e pl
an is
cho
sen
com
paris
on o
f cos
ts a
nd
utili
zatio
n fo
r H
MO
en
rolle
es a
nd
non-
enro
llees
in p
erio
d be
fore
HM
O a
vaila
bilit
y
wom
en a
re le
ss li
kely
to jo
in th
e pr
epai
d ad
vers
e he
alth
pla
n th
an m
en,
but n
o si
gnifi
cant
ef
fect
is a
ssoc
iate
d w
ith a
ge
HM
O jo
iner
s av
erag
ed 5
3 pe
rcen
t fe
wer
ad
vers
e
inpa
tient
day
s be
fore
join
ing t
han
thos
e w
ho c
hose
to s
tay
in F
FS
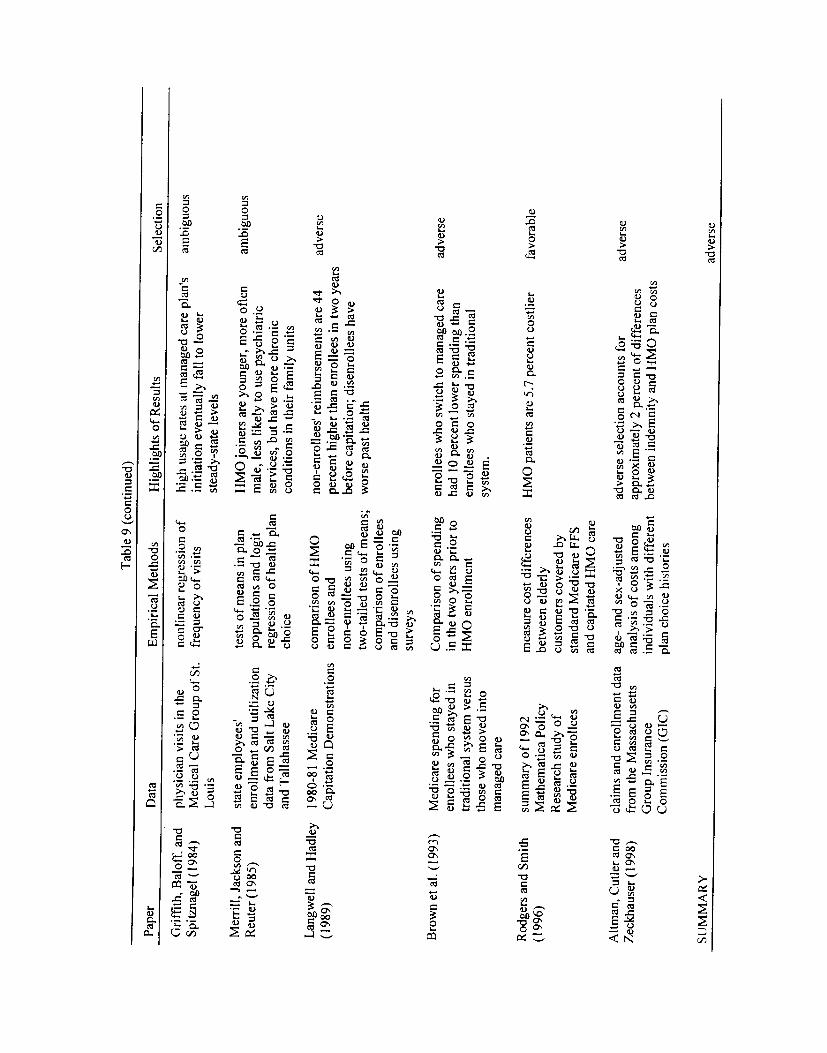
Gri
ffith
, B
alof
f, a
nd
Spitz
nage
l (19
84)
phys
icia
n vi
sits
in t
he
Med
ical
Car
e Gro
up o
f St.
Lou
is
nonl
inea
r re
gres
sion
of
freq
uenc
y of
vis
its
high
usa
ge r
ates
at m
anag
ed c
are
plan
's
initi
atio
n ev
entu
ally
fal
l to
low
er
stea
dy-s
tate
lev
els
Mer
rill,
Jac
kson
and
Reu
ter
(198
5)
stat
e em
ploy
ees'
en
rollm
ent a
nd u
tiliz
atio
n da
ta fr
om S
alt
Lak
e C
ity
and
Tal
laha
ssee
test
s of
mea
ns i
n pl
an
popu
latio
ns a
nd l
ogit
regr
essi
on o
f hea
lth p
lan
choi
ce
HM
O jo
iner
s ar
e yo
unge
r, m
ore
ofte
n m
ale,
less
like
ly to
use
psy
chia
tric
se
rvic
es,
but h
ave
mor
e ch
roni
c co
nditi
ons
in t
heir
fam
ily u
nits
ambi
guou
s
Lan
gwel
l an
d H
adle
y 19
80-8
1 M
edic
are
(198
9)
Cap
itatio
n Dem
onst
ratio
ns
Med
icar
e sp
endi
ng fo
r en
rolle
es w
ho st
ayed
in
trad
ition
al sy
stem
vers
us
thos
e who
mov
ed i
nto
man
aged
car
e
sum
mar
y of
199
2 M
athe
mat
ica
Polic
y R
esea
rch
stud
y of
M
edic
are
enro
llees
com
pari
son
of H
MO
en
rolle
es a
nd
non-
enro
llees
usi
ng
two-
taile
d te
sts of
mea
ns;
com
pari
son
of en
rol l
ees
and
dise
nrol
lees
usi
ng
surv
eys
Com
pari
son
of sp
endi
ng
in th
e tw
o ye
ars p
rior
to
HM
O e
nrol
lmen
t
mea
sure
cos
t dif
fere
nces
be
twee
n el
derl
y cu
stom
ers
cove
red
by
stan
dard
Med
icar
e FF
S an
d ca
pita
ted
HM
O c
are
non-
enro
llees
' rei
mbu
rsem
ents
are
44
perc
ent h
ighe
r tha
n en
rolle
es in
two
year
s be
fore
capi
tatio
n; d
isen
rolle
es h
ave
wor
se p
ast h
ealth
enro
llees
who
switc
h to
man
aged
care
ha
d 10
per
cent
low
er sp
endi
ng th
an
enro
llees
who
stay
ed i
n tr
aditi
onal
sy
stem
.
HM
O p
atie
nts
are
5.7
perc
ent c
ostli
er
Altm
an, C
utle
r an
d Z
eckh
ause
r (19
98)
clai
ms
and
enro
llmen
t da
ta
from
the
Mas
sach
uset
ts
Gro
up I
nsur
ance
C
omm
issi
on (
GIC
)
age-
and
sex
-adj
uste
d an
alys
is o
f cos
ts am
ong
indi
vidu
als
with
dif
fere
nt
plan
cho
ice
hist
orie
s
adve
rse
sele
ctio
n acc
ount
s fo
r ap
prox
imat
ely
2 pe
rcen
t of d
iffe
renc
es
betw
een
inde
mni
ty a
nd H
MO
pla
n co
sts
adve
rse
SUM
MA
RY
ad
vers
e
Tab
le 9
(con
tinue
d)
Pape
r D
ata
Em
piri
cal
Met
hods
H
ighl
ight
s of
Res
ults
Se
lect
ion
ambi
guou
s
Bro
wn
et a
l. (1
993)
Rod
gers
and
Sm
ith
(199
6)
adve
rse
adve
rse
favo
rabl
e
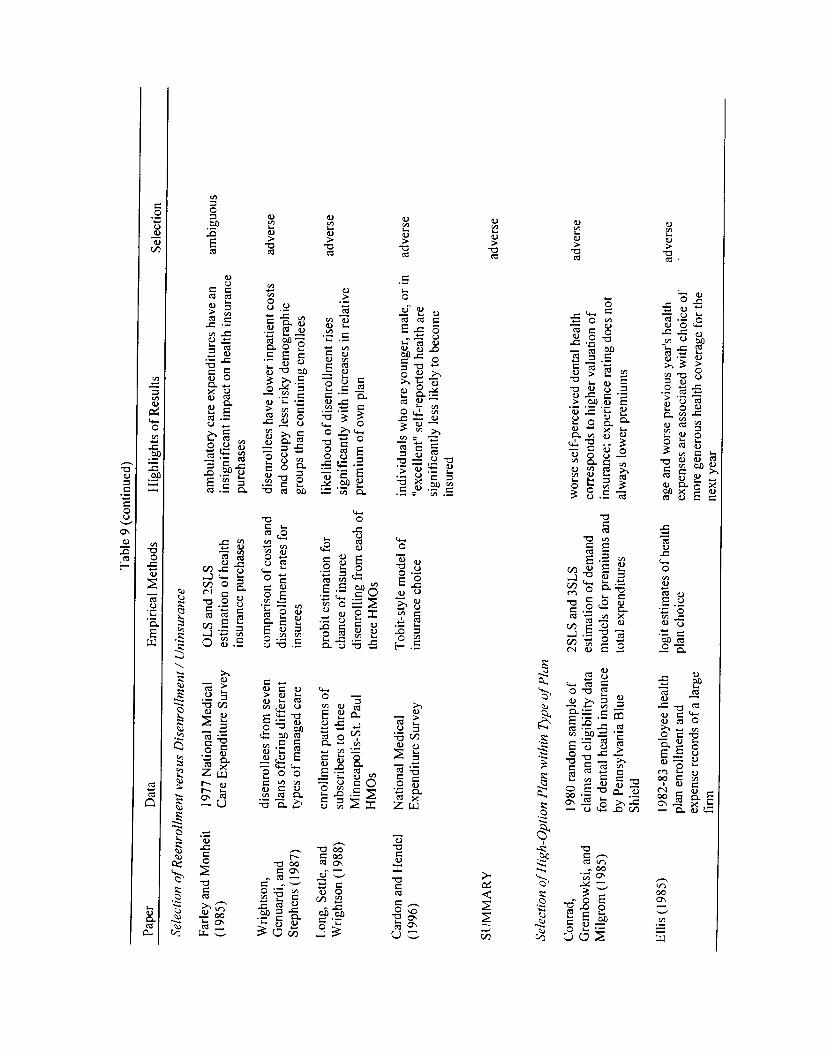
Tab
le 9
(con
tinue
d)
Pape
r D
ata
Em
piri
cal M
etho
ds
Hig
hlig
hts o
f Res
ults
Se
lect
ion
Sele
ctio
n of
Ree
nroi
lmen
t ver
sus
Dis
enro
ilmen
t / U
nins
uran
ce
Farl
ey a
nd M
onhe
it (1
985)
Wri
ghts
on,
Gen
uard
i, an
d St
ephe
ns (
1987
)
Lon
g, S
ettle
, and
Wri
ghts
on (
1988
)
1977
Nat
iona
l M
edic
al
Car
e Exp
endi
ture
Surv
ey
dise
nrol
lees
fro
m s
even
pl
ans
offe
ring
dif
fere
nt
type
s of m
anag
ed c
are
enro
llmen
t pa
ttern
s of
subs
crib
ers
to th
ree
Min
neap
olis
-St.
Paul
H
MO
s
OL
S an
d 2S
LS
estim
atio
n of h
ealth
in
sura
nce
purc
hase
s
com
pari
son
of co
sts
and
dise
nrol
lmen
t ra
tes f
or
i nsu
rees
prob
it es
timat
ion
for
chan
ce o
f ins
uree
dise
nrol
ling
from
eac
h of
th
ree H
MO
s
ambu
lato
ry ca
re e
xpen
ditu
res
have
an
insi
gnif
ican
t im
pact
on
heal
th i
nsur
ance
pu
rcha
ses
dise
nrol
lees
hav
e lo
wer
inp
atie
nt c
osts
an
d oc
cupy
les
s ri
sky
dem
ogra
phic
gr
oups
than
con
tinui
ng e
nrol
lees
likel
ihoo
d of
dise
nrol
lmen
t ri
ses
sign
ific
antly
with
inc
reas
es i
n re
lativ
e pr
emiu
m o
f ow
n pl
an
ambi
guou
s
adve
rse
adve
rse
Car
don
and
Hen
del
(199
6)
Nat
iona
l M
edic
al
Exp
endi
ture
Surv
ey
Tob
it-st
yle
mod
el o
f in
sura
nce
choi
ce
indi
vidu
als
who
are
you
nger
, mal
e, o
r in
"exc
elle
nt"
self
-rep
orte
d he
alth
are
si
gnif
ican
tly l
ess
likel
y to
bec
ome
insu
red
adve
rse
SUM
MA
RY
Sele
ctio
n of
Hig
h-O
ptio
n Pla
n w
ithin
Typ
e of
Plan
adve
rse
Con
rad,
G
rem
bow
ksi,
and
Milg
rom
(198
5)
1980
rand
om s
ampl
e of
cl
aim
s an
d el
igib
ility
dat
a fo
r den
tal h
ealth
insu
ranc
e by
Pen
nsyl
vani
a B
lue
Shie
ld
2SL
S an
d 3S
LS
estim
atio
n of
dem
and
mod
els
for
prem
ium
s an
d to
tal
expe
nditu
res
wor
se se
lf-p
erce
ived
dent
al h
ealth
co
rres
pond
s to
hig
her
valu
atio
n of
in
sura
nce;
exp
erie
nce
ratin
g do
es n
ot
alw
ays l
ower
pre
miu
ms
adve
rse
Elli
s (1
985)
19
82-8
3 em
ploy
ee he
alth
pl
an e
nrol
lmen
t an
d
expe
nse
reco
rds of
a la
rge
firm
logi
t est
imat
es o
f hea
lth
plan
cho
ice
age
and
wor
se p
revi
ous y
ears
hea
lth
expe
nses
are
ass
ocia
ted
with
cho
ice
of
mor
e ge
nero
us he
alth
cov
erag
e fo
r th
e ne
xt y
ear
adve
rse
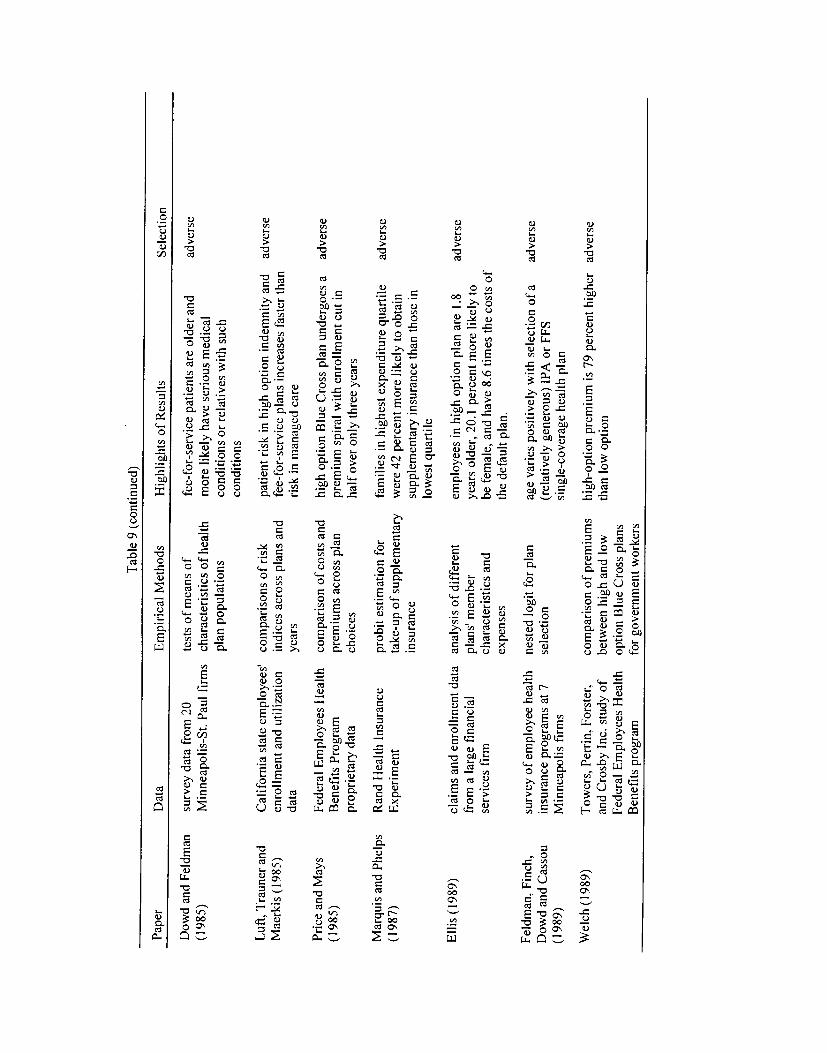
Dow
d an
d Fe
ldm
an
(198
5)
surv
ey d
ata
from
20
Min
neap
olis
-St.
Paul
fir
ms
test
s of
mea
ns o
f ch
arac
teri
stic
s of
hea
lth
plan
pop
ulat
ions
fee-
for-
serv
ice
patie
nts
are
olde
r and
m
ore
likel
y ha
ve s
erio
us m
edic
al
cond
ition
s or
rela
tives
with
suc
h co
nditi
ons
Luf
t, T
raun
er a
nd
Mae
rkis
(19
85)
Cal
ifor
nia
stat
e em
ploy
ees'
en
rollm
ent
and
utili
zatio
n da
ta
com
pari
sons
of ri
sk
indi
ces a
cros
s pla
ns a
nd
year
s
patie
nt r
isk
in h
igh
optio
n in
dem
nity
and
fe
e-fo
r-se
rvic
e pl
ans i
ncre
ases
fas
ter
than
ri
sk in
man
aged
car
e
adve
rse
Pric
e an
d M
ays
(198
5)
Fede
ral
Em
ploy
ees
Hea
lth
Ben
efits
Pro
gram
pr
opri
etar
y dat
a
com
pari
son
of co
sts a
nd
prem
ium
s ac
ross
plan
ch
oice
s
high
opt
ion
Blu
e C
ross
pla
n un
derg
oes
a
prem
ium
spi
ral
with
enr
ollm
ent
cut i
n ha
lf o
ver o
nly
thre
e yea
rs
adve
rse
Mar
quis
and
Phe
lps
(198
7)
Ran
d H
ealth
Ins
uran
ce
Exp
erim
ent
prob
it es
timat
ion
for
take
-up
of su
pple
men
tary
in
sura
nce
fam
ilies
in h
ighe
st e
xpen
ditu
re q
uart
ile
wer
e 42
per
cent
mor
e lik
ely
to ob
tain
su
pple
men
tary
ins
uran
ce th
an th
ose
in
low
est
quar
tile
adve
rse
Elli
s (1
989)
Feld
man
, Fi
nch,
D
owd
and
Cas
sou
(198
9)
clai
ms
and
enro
llmen
t da
ta
from
a la
rge f
inan
cial
se
rvic
es f
irm
surv
ey of
empl
oyee
hea
lth
insu
ranc
e pr
ogra
ms
at 7
M
inne
apol
is f
irm
s
anal
ysis
of d
iffe
rent
pl
ans'
mem
ber
char
acte
rist
ics
and
expe
nses
nest
ed lo
git
for
plan
se
lect
ion
empl
oyee
s in
hig
h op
tion
plan
are
1.8
ye
ars o
lder
, 20.
1 pe
rcen
t m
ore
likel
y to
be
fem
ale,
and
hav
e 8.6
tim
es th
e co
sts
of
the
defa
ult p
lan.
age
vari
es p
ositi
vely
with
sel
ectio
n of
a (r
elat
ivel
y ge
nero
us)
IPA
or F
FS
sing
le-c
over
age
heal
th p
lan
adve
rse
adve
rse
Wel
ch (
1989
) T
ower
s, P
erri
n, F
orst
er,
and
Cro
sby
Inc.
stu
dy o
f Fe
dera
l E
mpl
oyee
s H
ealth
B
enef
its p
rogr
am
com
pari
son
of pr
emiu
ms
betw
een
high
and
low
op
tion
Blu
e C
ross
pla
ns
for
gove
rnm
ent w
orke
rs
high
-opt
ion
prem
ium
is 7
9 pe
rcen
t hig
her
adve
rse
than
low
opt
ion
Tab
le 9
(con
tinue
d)
Pape
r D
ata
Em
piri
cal
Met
hods
H
ighl
ight
s of
Res
ults
Se
lect
ion
adve
rse
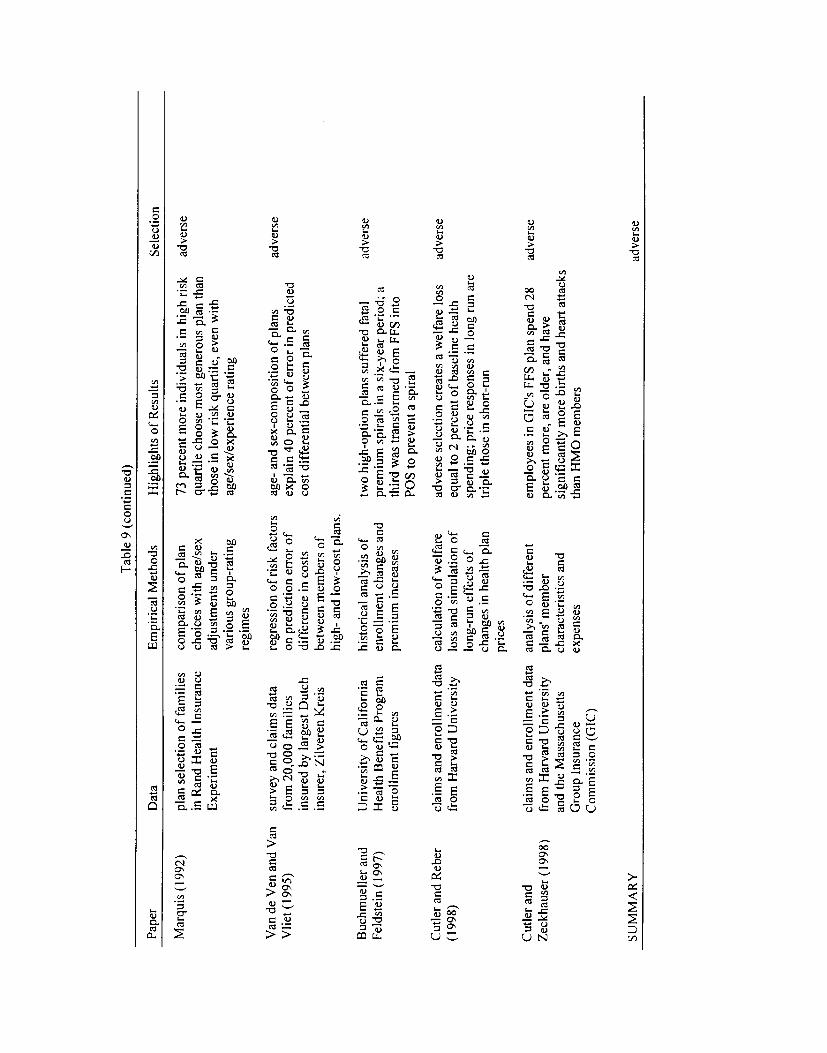
Van
de
Ven
and
Van
V
liet (
1995
) su
rvey
and
cla
ims
data
fr
om 2
0,00
0 fa
mili
es
insu
red
by l
arge
st D
utch
insu
rer,
Zilv
eren
Kre
is
com
pari
son
of pl
an
choi
ces
with
age
/sex
ad
just
men
ts u
nder
va
riou
s gr
oup-
ratin
g re
gim
es
regr
essi
on o
f ris
k fa
ctor
s on
pre
dict
ion
erro
r of
diff
eren
ce i
n co
sts
betw
een
mem
bers
of
high
- and
low
-cos
t pla
ns.
73 p
erce
nt m
ore
indi
vidu
als
in h
igh
risk
quar
tile c
hoos
e m
ost g
ener
ous
plan
than
th
ose
in l
ow r
isk
quar
tile,
eve
n w
ith
age/
sex/
expe
rien
ce r
atin
g
age-
and
sex-
com
posi
tion
of pl
ans
expl
ain 4
0 pe
rcen
t of
erro
r in
pre
dict
ed
cost
dif
fere
ntia
l be
twee
n pl
ans
adve
rse
Buc
hmue
ller
and
Feld
stei
n (1
997)
Cut
ler
and
Reb
er
(199
8)
Uni
vers
ity o
f Cal
ifor
nia
Hea
lth B
enef
its Pr
ogra
m
enro
llmen
t fi
gure
s
clai
ms
and
enro
llmen
t da
ta
from
Har
vard
Uni
vers
ity
hist
oric
al a
naly
sis
of
enro
llmen
t cha
nges
and
pr
emiu
m i
ncre
ases
calc
ulat
ion
of w
elfa
re
loss
and
sim
ulat
ion
of
long
-run
eff
ects
of
chan
ges
in h
ealth
pla
n pr
ices
two
high
-opt
ion
plan
s suf
fere
d fa
tal
prem
ium
spi
rals
in
a si
x-ye
ar p
erio
d; a
th
ird
was
tran
sfor
med
fro
m F
FS i
nto
POS
to p
reve
nt a
spir
al
adve
rse s
elec
tion
crea
tes
a w
elfa
re l
oss
equa
l to
2 p
erce
nt of
base
line
heal
th
spen
ding
; pr
ice
resp
onse
s in
lon
g ru
n ar
e tr
iple
thos
e in
sho
rt-r
un
adve
rse
adve
rse
Cut
ler
and
Zec
khau
ser
(199
8)
clai
ms
and
enro
llmen
t da
ta
from
Har
vard
Uni
vers
ity
and
the
Mas
sach
uset
ts
Gro
up In
sura
nce
Com
mis
sion
(G
IC)
anal
ysis
of d
iffe
rent
pl
ans'
mem
ber
char
acte
rist
ics
and
expe
nses
empl
oyee
s in
GIC
's F
FS p
lan
spen
d 28
pe
rcen
t mor
e, ar
e ol
der,
and
hav
e si
gnif
ican
tly m
ore
birt
hs a
nd h
eart
atta
cks
than
HM
O m
embe
rs
adve
rse
SUM
MA
RY
ad
vers
e
Mar
quis
(19
92)
Tab
le 9
(con
tinue
d)
plan
sel
ectio
n of f
amili
es
in R
and
Hea
lth I
nsur
ance
Exp
erim
ent
Pape
r D
ata
Em
piri
cal
Met
hods
H
ighl
ight
s of
Res
ults
Se
lect
ion
adve
rse
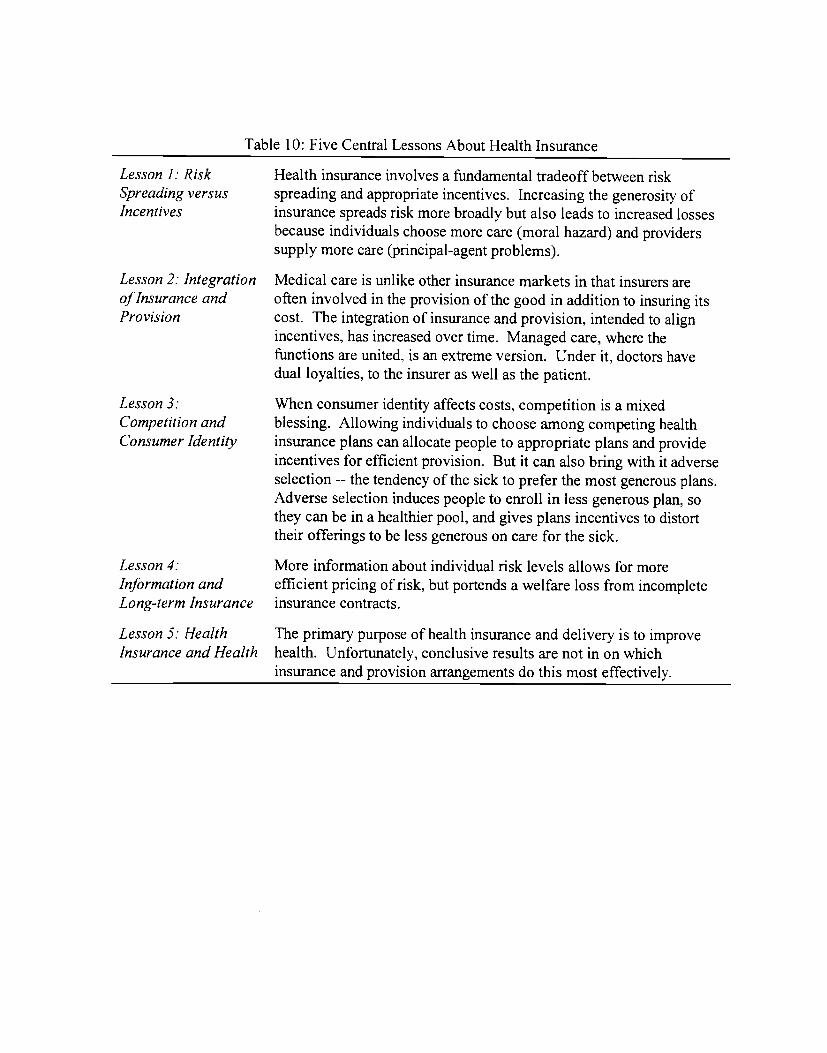
Table 10: Five Central Lessons About Health Insurance
Lesson 1: Risk Health insurance involves a fundamental tradeoff between riskSpreading versus spreading and appropriate incentives. Increasing the generosity ofIncentives insurance spreads risk more broadly but also leads to increased losses
because individuals choose more care (moral hazard) and providerssupply more care (çrincipal-agent problems).
Lesson 2: Integration Medical care is unlike other insurance markets in that insurers areof Insurance and often involved in the provision of the good in addition to insuring itsProvision cost. The integration of insurance and provision, intended to align
incentives, has increased over time. Managed care, where thefunctions are united, is an extreme version. Under it, doctors havedual loyalties, to the insurer as well as the patient.
Lesson 3: When consumer identity affects costs, competition is a mixedCompetition and blessing. Allowing individuals to choose among competing healthConsumer Identity insurance plans can allocate people to appropriate plans and provide
incentives for efficient provision. But it can also bring with it adverseselection -- the tendency of the sick to prefer the most generous plans.Adverse selection induces people to enroll in less generous plan, sothey can be in a healthier pool, and gives plans incentives to distorttheir offerings to be less generous on care for the sick.
Lesson 4: More information about individual risk levels allows for moreInformation and efficient pricing of risk, but portends a welfare loss from incompleteLong-term Insurance insurance contracts.
Lesson 5: Health The primary purpose of health insurance and delivery is to improveInsurance and Health health. Unfortunately, conclusive results are not in on which
insurance and provision arrangements do this most effectively.
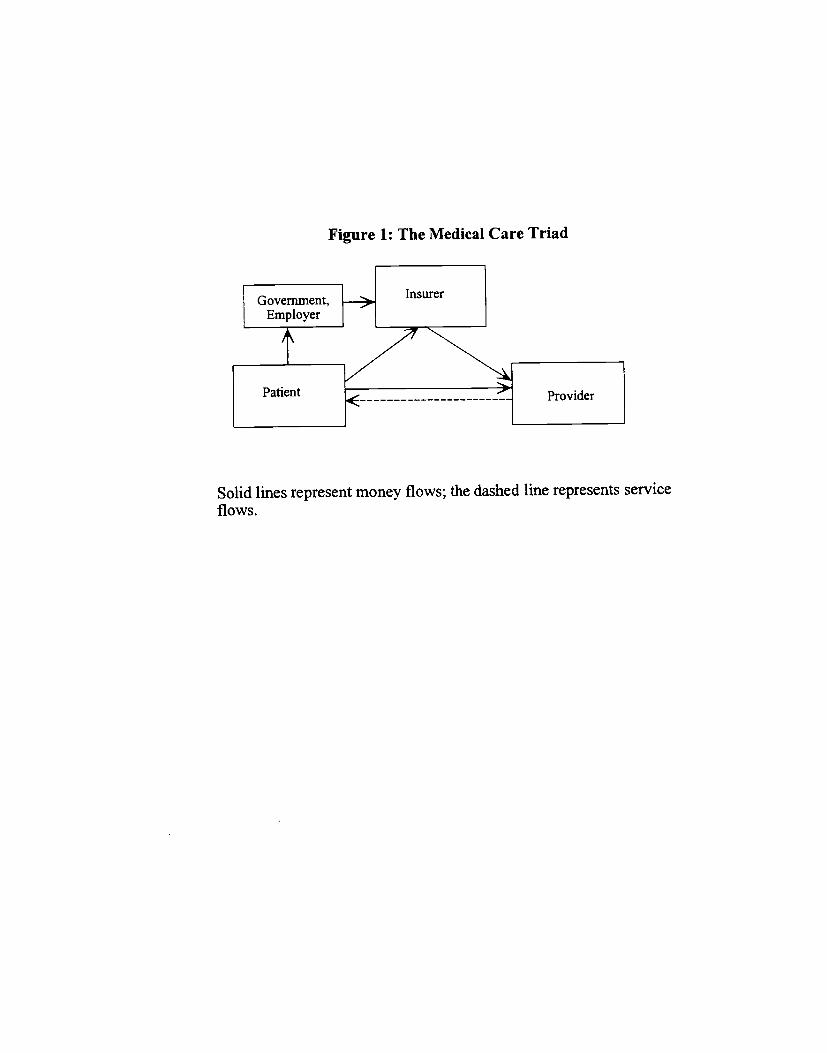
Figure 1: The Medical Care Triad
Solid lines represent money flows; the dashed line represents serviceflows.
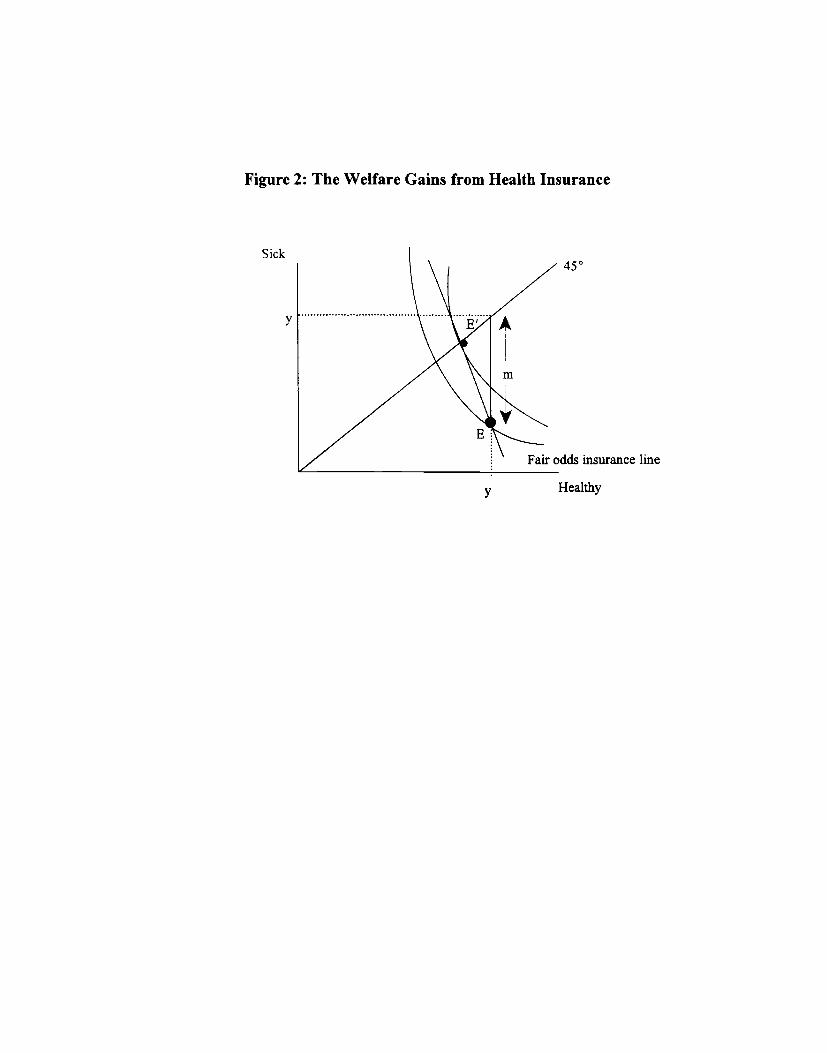
Figure 2: The Welfare Gains from Health Insurance
Sick
y
insurance line
y Healthy
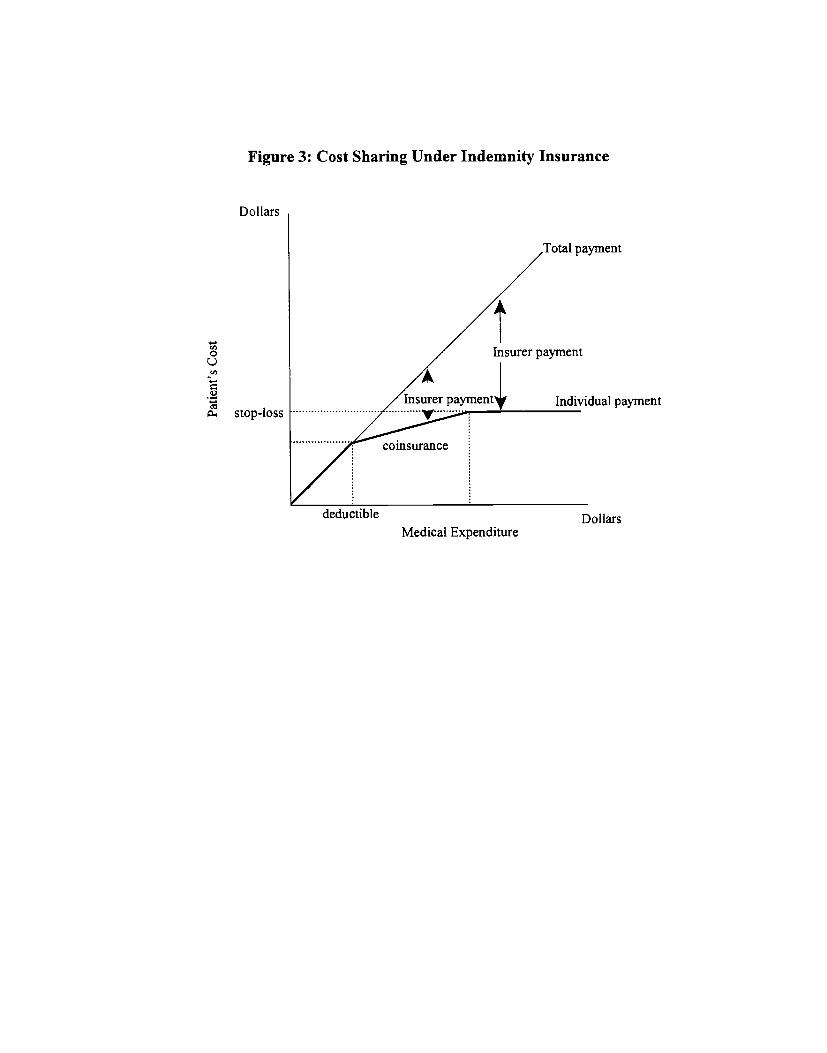
Figure 3: Cost Sharing Under Indemnity Insurance
Dollars
Medical Expenditure
payment
Individual payment
Dollars
Cl)00Cl)
0
stop-loss
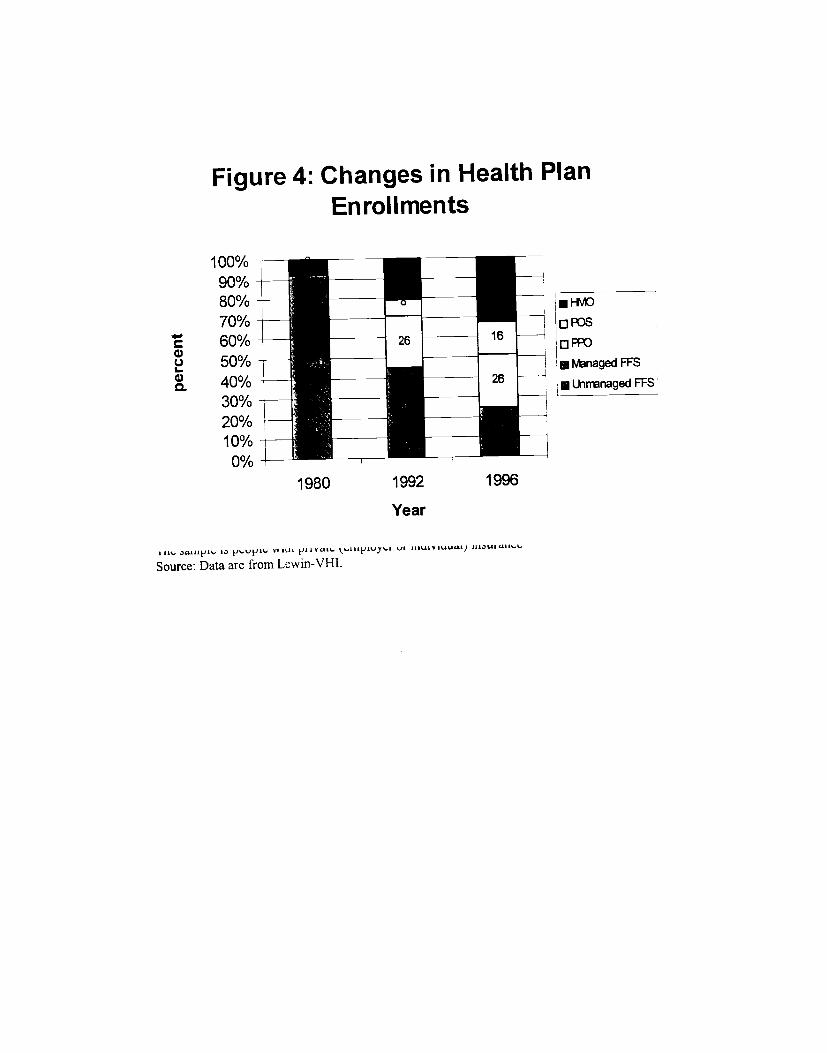
Figure 4: Changes in Health PlanEnrollments
100%90%80%70%
— 0
I30%20%10%
0%
Year
o RDS
naged FFS
Urnanaged FFS
I nfl, 3W111J1¼ 13 I.J1J1¼# VT ILl I jIll V Ut'.. l,l..l1lji1UJL.I lit 11.11 V Iuttan) 1113W a1I'..l..
Source: Data are from Lewin-VHI.
1980 1992 1996
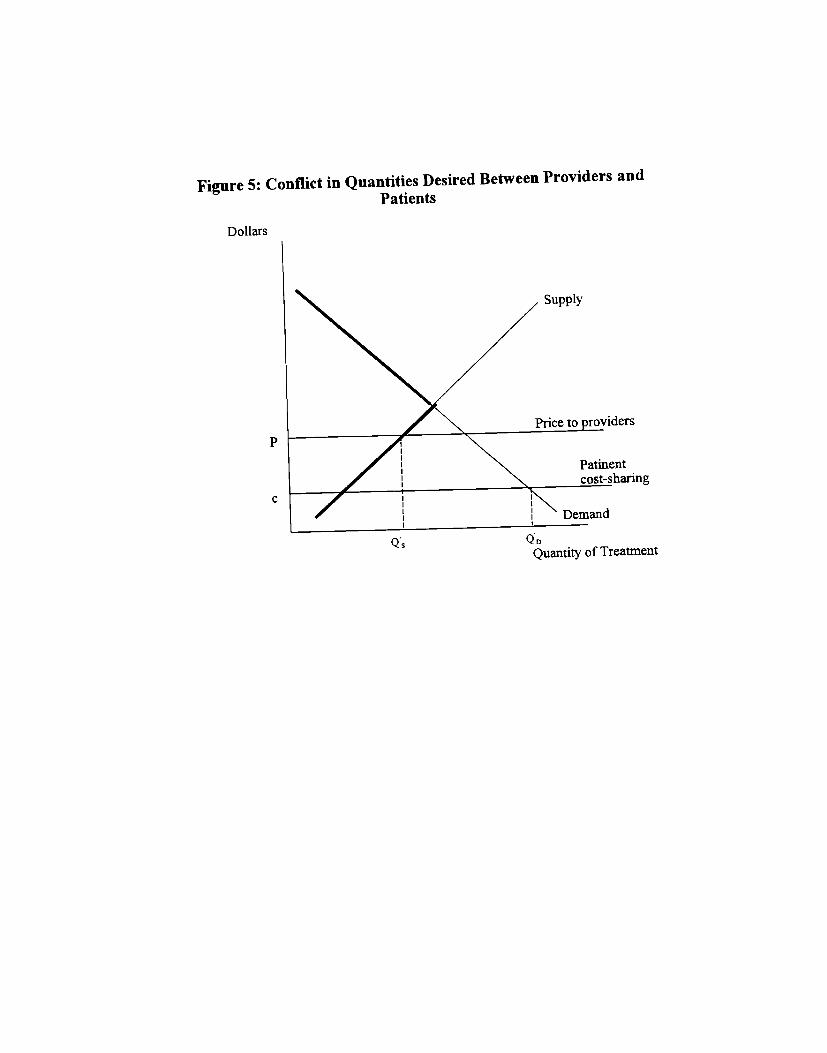
Figure 5: Conflict in QuantitiesDesired Between Providers andPatients
Dollars
P
C
Q
Supply
QD
Quantity of Treatment
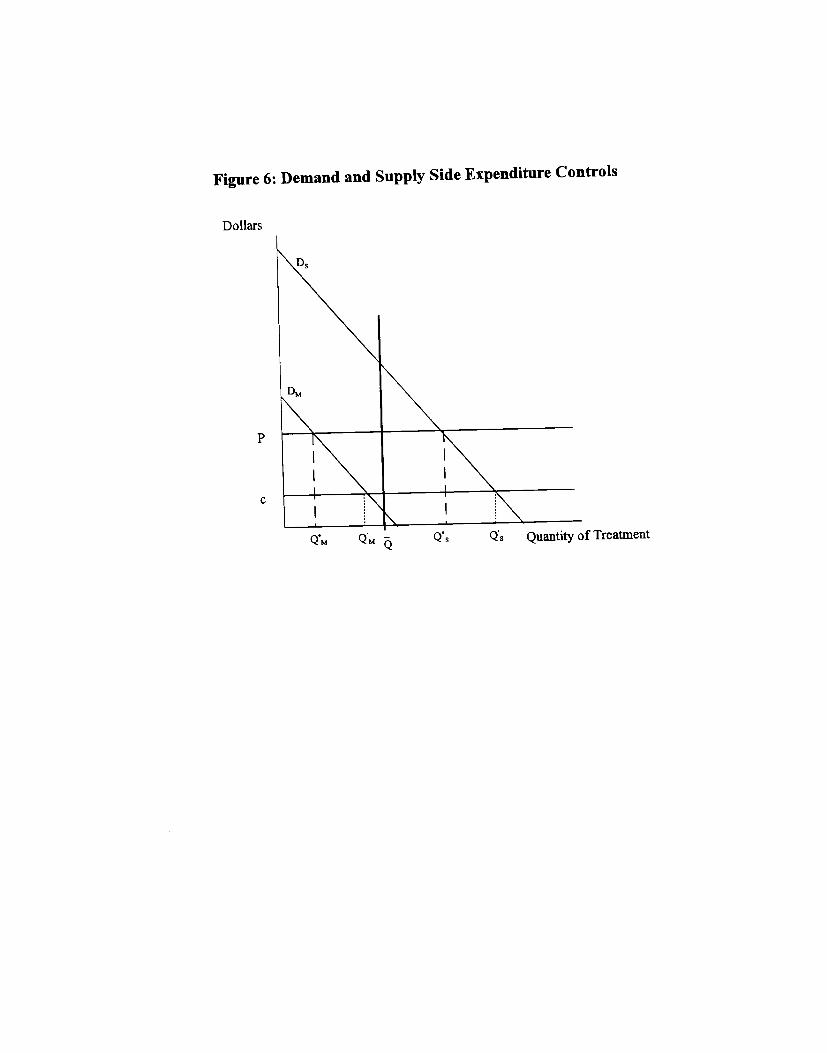
Figure 6: Demand and Supply Side Expenditure Controls
Dollars
P
C
QM QM- Q Q Quantity of TreatmentQ
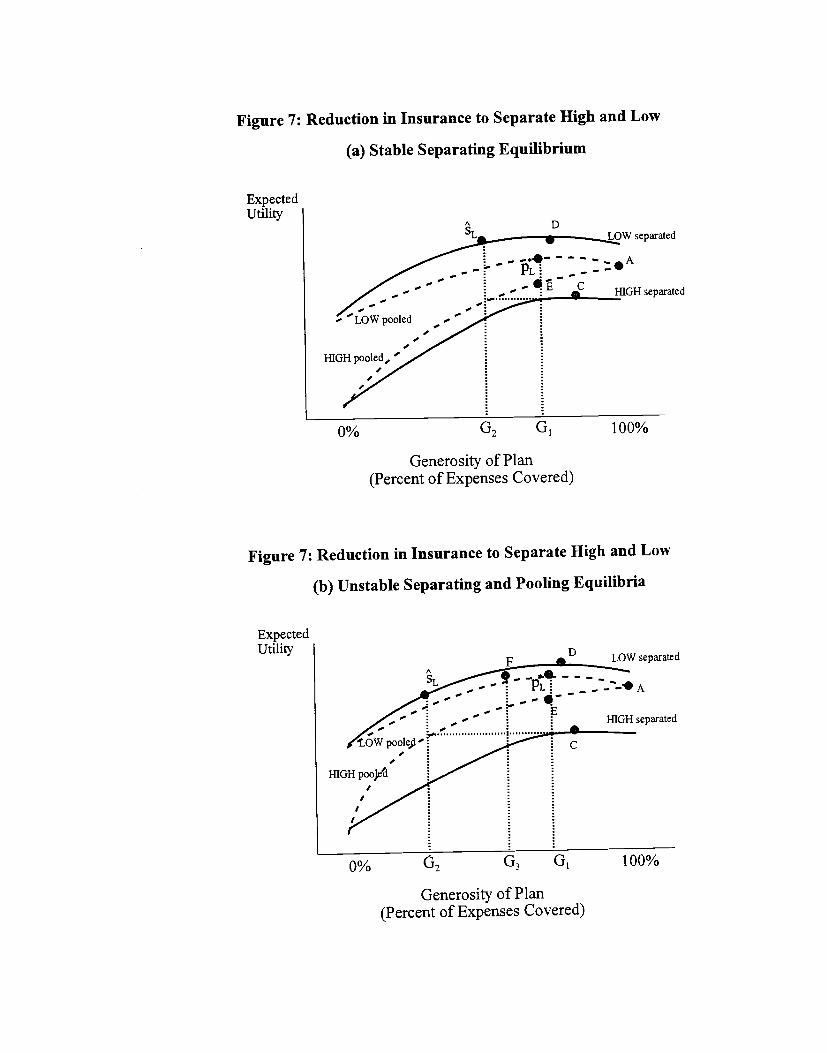
Figure 7: Reduction in Insurance to Separate High andLow
(a) Stable Separating Equilibrium
ExpectedUtility
Figure 7: Reduction in Insurance to Separate High and Low
(b) Unstable Separating and Pooling Equilibria
ExpectedUtility
0% G2 100%
Generosity of Plan(Percent of Expenses Covered)
G3
Generosity of Plan(Percent of Expenses Covered)
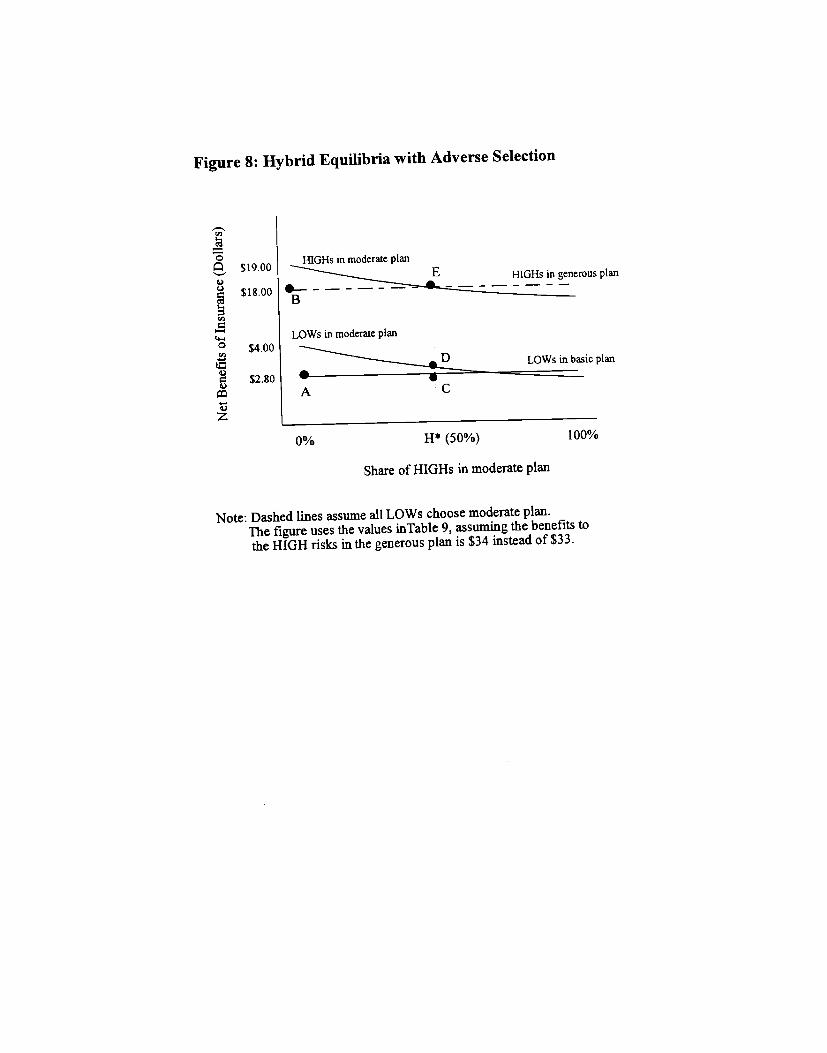
Figure 8: Hybrid Equilibria with Adverse Selection
$19 00HIGHS in moderate plan
$18.00
LOWs in moderate plan° $400
$2.80 uhI __L==_ plan
11* (50%) 100%
Share of HiGHs in moderate plan
Note: Dashed lines assume all LOWs choose moderate plan.The figure uses the values inTable 9, assuming thebenefits to
the HIGH risks in the generous plan is $34 insteadof $33.
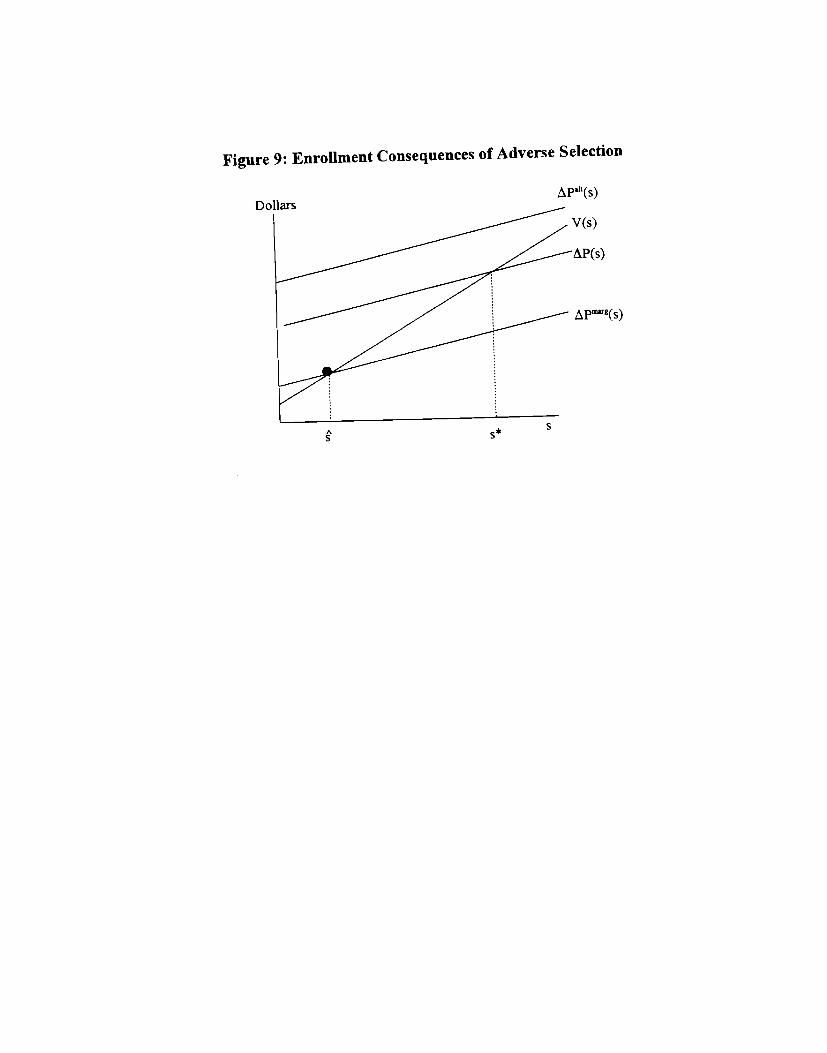
Figure 9: Enrollment Consequences of Adverse Selection
p(s)
AS
S
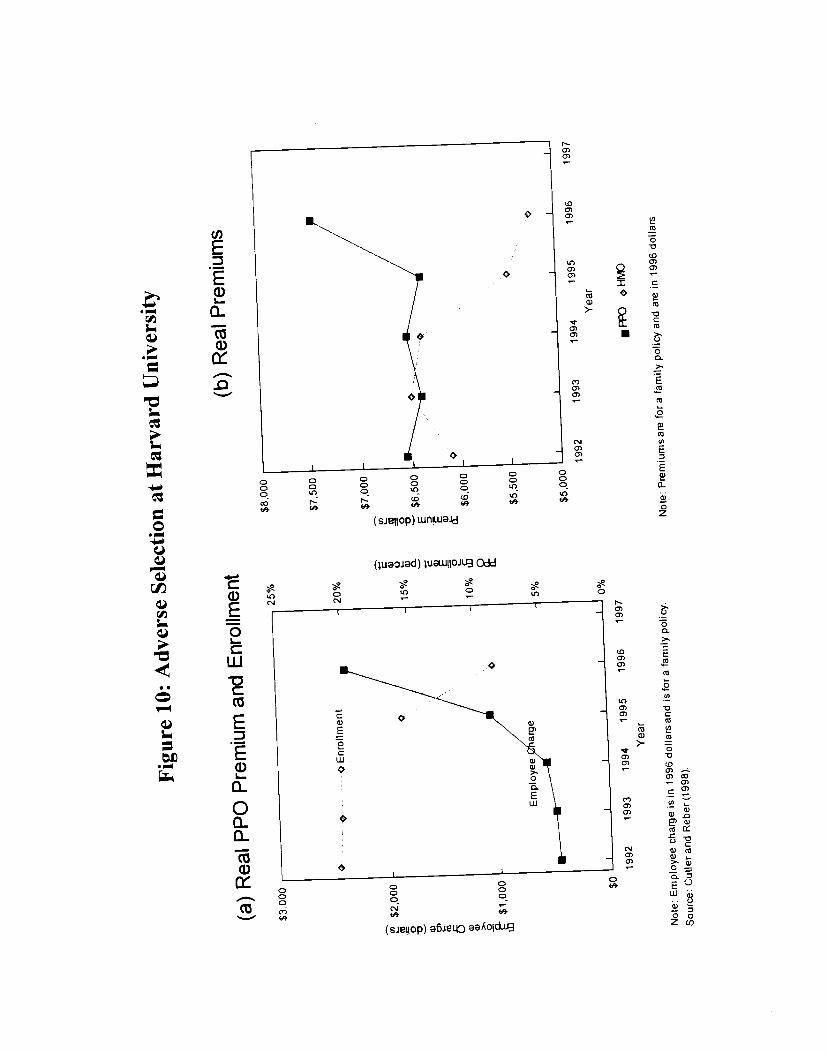
Figu
re 1
0: A
dver
se S
elec
tion
at H
arva
rd U
nive
rsitY
$8 .0
00
$7,5
00
20%
$7,0
00
cn
a)
-
15%
$6,500
10%
$6,000
$5,500
5%
$5,0
00
(b)
Rea
l Pre
miu
ms
(a)
Rea
l PP
O P
rem
ium
and
Enr
ollm
ent
25%
$3
,000
?!
$2,0
00
-5
a)
(0
C-)
ci
) a)
>
2 $1
,000
$0
0%
1992
19
93
1994
19
95
1996
19
97
Yea
r
Note: E
mpl
oyee
cha
rge
SIn
199
6 dollars and isfora fa
mily
pol
icy.
Sou
rce:
Cut
ler
and
Reb
er (
1998
)
1996
19
97
1992
19
93
1994
19
95
Yea
r
.FFO GHD
Note: P
rem
ium
s are fo
ra fa
mily
pol
icy
and
are
in 1
996 dollars
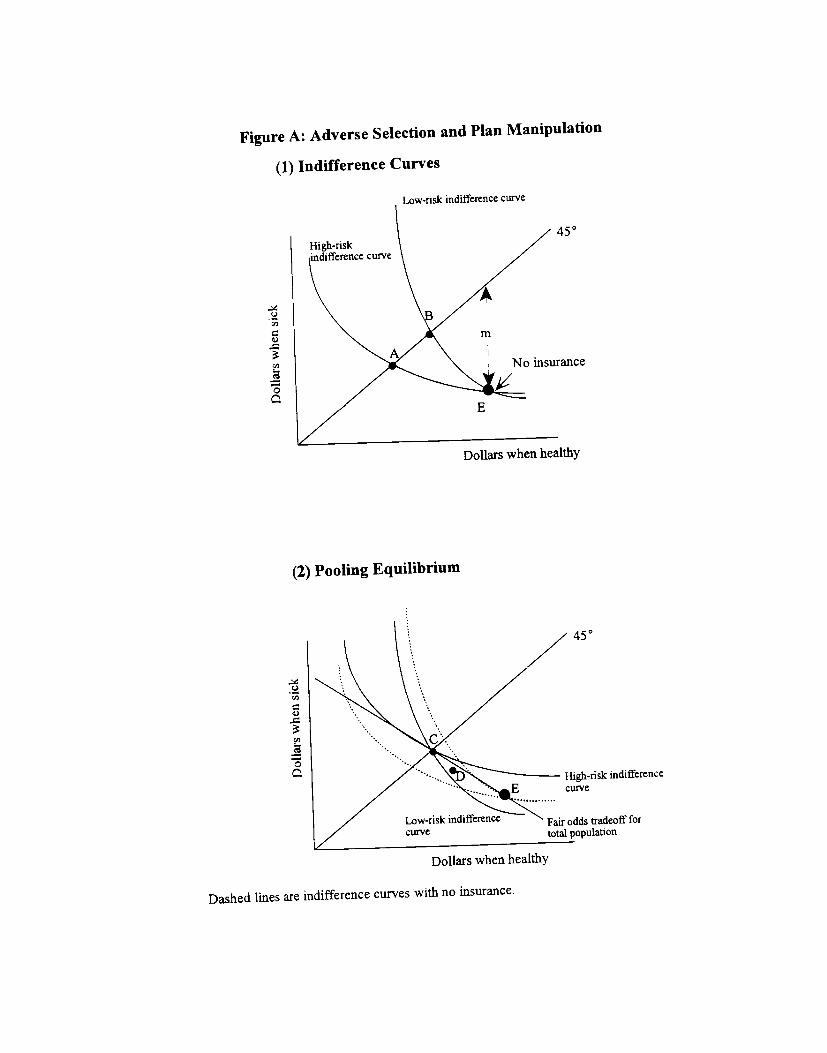
Figure A: Adverse Selection and Plan Manipulation
(1) Indifference Curves
Dollars when healthy
Dashed lines are indifference curves with no insurance.
Low-risk indifference curve
450
c)Cl,
4.)
Cd,
0
insurance
Dollars when healthy
(2) Pooling Equilibrium
C.)
Cd,
4)
U,
0
450
High-risk indifferencecurve
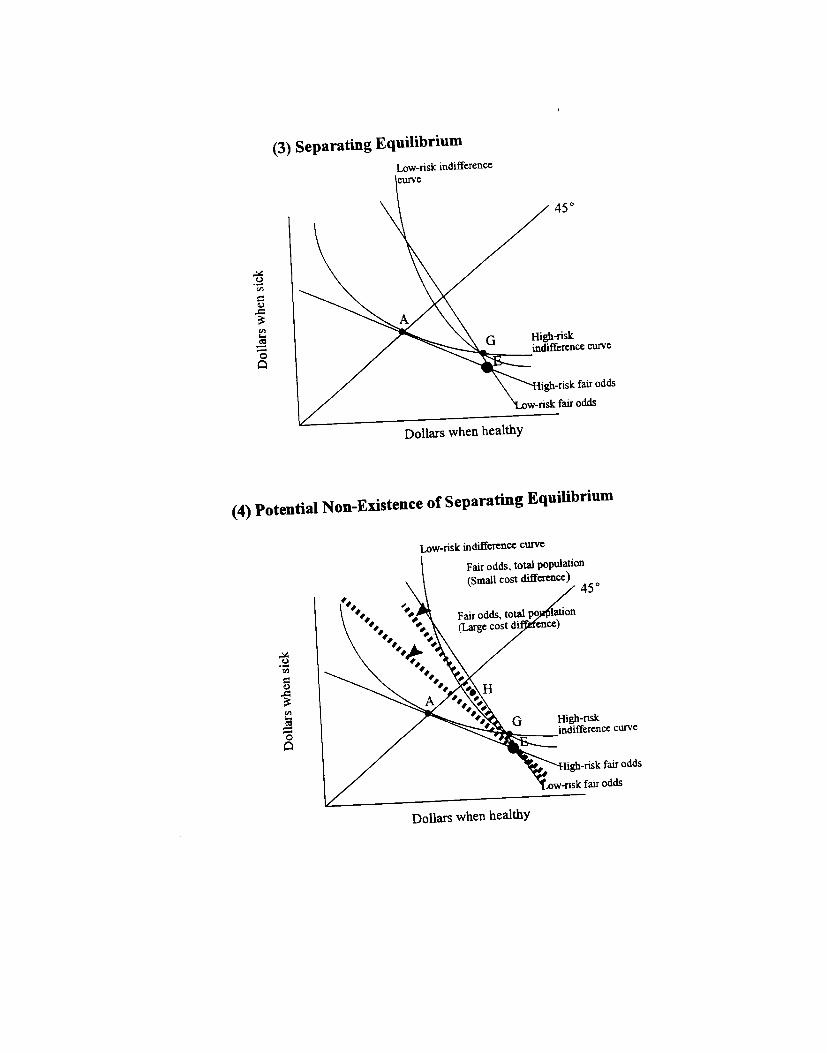
5)
0
(3) Separating EquilibriumLow-riSk indifference
fair odds
(4) Potential NonEXisteflCe of Separating Equilibrium
Dollars when healthy
450
High-riskindifference curve
Dollars when healthy