Embed Size (px)
Citation preview

NBER WORKING PAPER SERIES
LONG-TERM CONSEQUENCES OFSECONDARY SCHOOL VOUCHERS:
EVIDENCE FROM ADMINISTRATIVE RECORDS IN COLOMBIA
Joshua AngristEric Bettinger
Michael Kremer
Working Paper 10713http://www.nber.org/papers/w10713
NATIONAL BUREAU OF ECONOMIC RESEARCH1050 Massachusetts Avenue
Cambridge, MA 02138August 2004
Special thanks goes to Cristina Estrada, Claudia Gonzalez, Marcela Monsalvo, and Ana Gomez for researchassistance. We are also grateful to Jorge Estrada for help interpreting Colombian ID numbers and to the staffat ICFES for providing data. We thank the National Institutes of Health, the World Bank, and Harvard’sDavid Rockefeller Center for Latin American Studies for funding this research and Victor Chernozhukov forhelpful discussions. The views expressed herein are those of the author(s) and not necessarily those of theNational Bureau of Economic Research.
©2004 by Joshua Angrist, Eric Bettinger, and Michael Kremer. All rights reserved. Short sections of text,not to exceed two paragraphs, may be quoted without explicit permission provided that full credit, including© notice, is given to the source.

Long-Term Consequences of Secondary School Vouchers: Evidence from AdministrativeRecords in ColombiaJoshua Angrist, Eric Bettinger, and Michael KremerNBER Working Paper No. 10713August 2004JEL No. I21, J13, I28
ABSTRACT
Colombia's PACES program provided over 125,000 poor children with vouchers that covered half
the cost of private secondary school. The vouchers were renewable annually conditional on adequate
academic progress. Since many vouchers were assigned by lottery, program effects can reliably be
assessed by comparing lottery winners and losers. Estimates using administrative records suggest
the PACES program increased secondary school completion rates by 15-20 percent. Correcting for
the greater percentage of lottery winners taking college admissions tests, the program increased test
scores by two-tenths of a standard deviation in the distribution of potential test scores. Boys, who
have lower scores than girls in this population, show larger test score gains, especially in math.
Joshua AngristMITDepartment of Economics50 Memorial DriveCambridge, MA 02142and [email protected]
Eric BettingerDepartment of EconomicsCase Western Reserve Cleveland, OH 44106-7235and [email protected]
Michael KremerDepartment of EconomicsLittauer Center 207Cambridge, MA 02138and [email protected]

1See, e.g., Rouse (1998); Howell and Peterson (2002), and Krueger and Zhu (2003).
2PACES is an acronym for Programa de Amplicación de Cobertura de la Educación Secundaria.
1
I. Introduction
Demand-side subsidies for education are increasingly common in developing countries. Chile and
Colombia have both offered educational vouchers for private secondary schools, while Brazil, India,
Israel, and Mexico have introduced student stipends that reward attendance and performance. Interest in
demand-side subsidies in developing countries parallels interest in the United States, where publicly-
funded vouchers for private schools have been distributed in a number of cities. Along the same lines in
higher education, merit scholarships for American college students have grown almost 50 percent in the
past five years (College Board 2002).
Previous research on primary and secondary school vouchers typically focuses on the short-run
effects of vouchers on test scores. The results so far suggest that vouchers benefit some groups of
recipients, though the extent of test score gains is disputed.1 Missing from most studies of voucher effects
is an assessment of impacts on longer-term outcomes – such as high school graduation rates – that are
more clearly tied to economic success. Research on school vouchers naturally focuses on short-run
outcomes because participants are young and many programs are recent. Moreover, long-run follow-up
efforts are difficult and costly.
This paper examines the longer-run effects of Colombia’s PACES program, one of the largest
voucher initiatives ever implemented.2 Between 1991 and 1997, PACES awarded nearly 125,000
vouchers to low-income high school students. Since vouchers were renewable annually conditional on
satisfactory academic progress as indicated by scheduled grade promotion, the program provided
incentives for students to work harder as well as widening their schooling options. PACES vouchers may
therefore have effects similar to merit-based college scholarships and test-based achievement awards (see,
e.g. Angrist and Lavy 2003, Kremer, Miguel and Thornton, 2003, Dynarski 2003, Ashworth and
Hardman 2001, Cornwell and Mustard 2002). In common with anti-dropout interventions in the US and
3ICFES is an acronym for Colombia’s college admissions testing service, the Instituto Colombiano Para El FomentoDe La Educacion Superior.
2
UK, however, the PACES program most likely provided achievement incentives for students at risk of
repeating grades or dropping out of school, as opposed to those likely to excel in school.
A key feature of the PACES program for our purposes is that in Bogotá as well as a number of
other large cities, the vouchers were awarded by lottery. The random assignment of vouchers facilitates
a natural-experiment research design in which losers provide a comparison group for winners. In
previous research (Angrist, Bettinger, Bloom, King, and Kremer, 2002), we used the PACES lotteries to
estimate the impact of vouchers on years of school completed between 6th and 8th grade, grade repetition,
test scores, and the probability of working. These results strongly suggest that voucher winners devoted
more time to school and had higher test scores than they otherwise would have had. Most of the results in
our earlier study are for students observed about three years after winning the vouchers but still three
years before high school graduation. While these results support the notion that vouchers had a positive
short-run effect on schooling and test scores, they do not tell us whether vouchers increased high school
graduation rates and achievement at the end of school.
In an effort to close this gap, we turn here to an assessment that exploits administrative data from
Colombia’s centralized college entrance examinations, the ICFES test, taken by most high school
graduates.3 The principal advantage of administrative records over survey methods is that there is no loss
to follow-up and administrative data are much cheaper than surveys.
Since more lottery winners than losers took the ICFES exam, direct comparisons of test scores for
winners and losers are subject to selection bias. We discuss a number of solutions to this selection
problem. On balance, the results of our follow-up study point to lasting benefits for voucher winners,
with substantially higher high school graduation rates and, after adjusting for selection bias, higher test
scores among those who took the ICFES exam. Upper bounds on test-score effects are not as large at
the upper end of the score distribution as at the lower end, though this could be because upper bounds are
tighter higher in the distribution. In any case, the fact that the program increased test scores even fairly

3
high in the score distribution suggests that the program increased learning not only by increasing
incentives for students at risk of repeating grades, but also through other mechanisms, such as increasing
school choice. We also find somewhat larger voucher effects for boys than for girls, especially in math.
Because boys have lower test scores than girls, this implies the program reduced the male-female score
gap.
The next section provides additional background on the PACES program and voucher lotteries.
Section III presents estimates of the effect of PACES vouchers on high school graduation rates, as
measured by ICFES registration rates. Section IV discusses the problem of selection bias in analyses of
test scores and presents estimates of effects on scores using alternative approaches to the selection
problem. Section V concludes the paper.
II. Background
A. The PACES program
The Colombian government established PACES in late 1991. The program targeted low-income
families by offering vouchers to children in neighborhoods classified as falling into the two lowest
socioeconomic strata (out of 6 possible strata). To qualify for a voucher, applicants must have been
entering the Colombian secondary school cycle, which begins with grade 6, and have been aged 15 or
under. Prior to applying, students must already have been admitted to a participating secondary school
(i.e., one that would accept the voucher). Participating schools had to be located in participating towns,
which included all of Colombia’s largest cities. Many elite private schools opted out of the program, so
just under half of private schools in the 10 largest cities accepted PACES vouchers in 1993.
PACES vouchers were worth about 190 US dollars in 1998. Our survey data show matriculation
and monthly fees for private schools attended by voucher applicants in 1998 averaged about $340, so
most voucher recipients supplemented the voucher with private funds. By way of comparison, the
average annual per-pupil public expenditure in Colombia’s public secondary school system in 1995 was

4
just over $350 (DNP, 1999), and public school parents in our sample typically paid tuition or fees of
roughly $58. Per capita GNP in Colombia was then around $2,280 (World Bank, 1999).
Participating schools tended to serve lower-income pupils, and to have lower tuition than non-
participating private schools. Schools with a vocational curriculum were also over-represented among
those in the program. Initially, vouchers could be used at both for-profit and non-profit schools, but after
1996, for-profit schools were excluded. In the peak years of 1994 and 1995 roughly 90,000 students
used vouchers. Almost 40 percent of the approximately 3.1 million secondary school pupils in Colombia
in 1995 attended private schools. In Bogotá, 58 percent of the 567,000 secondary school pupils attended
private school.
Pupil-teacher ratios and facilities were similar in public and participating private schools, and
many of the teachers in the private schools that were most likely to participate in the PACES program
were moonlighting or retired public school teachers. Test score comparisons reported by King, Rawlings,
Gutierrez, Pardo, and Torres (1997) show that achievement levels in participating private schools were
close to levels in public schools, though significantly below achievement levels in non-participating
private schools.
Vouchers were renewed automatically through eleventh grade, when Colombian high school
ends, provided the recipient’s academic performance warranted promotion to the next grade. In practice,
approximately 86 percent of participating 6th graders in our sample were promoted. It therefore seems
likely that the incentive aspects of the PACES program were strongest for the weakest students, since
these students were at greatest risk of failing a grade.
One of our identification strategies is based on the lotteries used to allocate vouchers when
demand exceeded supply for a particular cohort and town. In this study we concentrate on one of the
largest applicant cohorts, students in Bogotá who applied in 1994 to enter private school in 6th grade in
1995. Assuming no grade repetition, students in this cohort would have been in 11th grade, their last year

5
of high school, in 2000. Any 11th grader or high school graduate is eligible take the ICFES exam, which
is required for admission to Colombian colleges and universities.
Our earlier results (Angrist et al, 2002) suggest that three years after entering the lottery, voucher
winners were 16 percentage points more likely to be attending a private school. Fee payments for voucher
winners were $52 higher than for losers, suggesting that some winners may have used their vouchers to
trade up to higher priced schools. Lottery winners and losers did not differ in enrollment rates, but
winners had completed .12 additional years of school, partly because they were 6 percentage points less
likely to have repeated a grade. But winners also appear to have learned more. Among a sub-sample of
lottery applicants who agreed to take a standardized test, winners scored .2 standard deviations more than
losers, the equivalent of a full grade level. However, the sample of test takers was small (only 283), and
hence these differences were only marginally significant at conventional levels, and since only 60 percent
of those asked to take the test did so, selection remained a potential concern.
B. Data and Descriptive Statistics
Table 1 reports descriptive statistics for the 1995 cohort of 4,044 voucher applicants. The
demographic characteristics in the table were derived from the forms completed by applicants. About 59
percent of voucher applicants were awarded vouchers in the 1995 lottery. Applicants were almost 13
years old, on average, and about evenly split between boys and girls. Roughly 88 percent of applicants
came from households with a telephone or access to a telephone.
We matched PACES applicants with records of whether they registered for the ICFES exam and
their score on the exam using the Colombian national ID number, an identification number consisting of
11 digits, the first 6 of which show date of birth. (A detailed description of our matching procedure and
test score database is given in the data appendix.) A final “check digit” in the ID number bears a
mathematical relationship to the other digits. We used the embedded check digit and birth dates to

4Birth dates are considered valid when they imply applicants were aged 9-25.
5The standard errors reported in Table 2 and elsewhere are heteroscedasticity-consistent.6
determine whether ID numbers were valid. About 9.5 percent of applicants had invalid birth dates.4 Of
the 3661 applicants with plausible birth dates, 97 percent reported valid ID numbers.
Voucher winners and losers have similar demographic characteristics, except possibly for a
small age difference (columns 3-6 of Table 1). The age differences by voucher status appear to be driven
by a few outliers, probably due to incorrectly coded ID numbers among losers. The age gap is smaller
when the sample is limited to those with valid ID numbers, though still marginally significant. We
therefore control for age when estimating voucher effects.
The first outcome of interest is a dummy for whether a PACES applicant registered for the ICFES
test. In addition to signaling an interest in higher education, ICFES registration is an excellent proxy for
high school graduation status since 90 percent of high school graduates take the test (The World Bank,
1993), while all of those tested must be in 11th grade or have graduated high school (mostly the former).
One concern is the possibility that any initially incorrect ID numbers were more likely to have been
corrected later among winners than losers and that this could lead to a spurious finding of higher match
rates with ICFES registrations records among lottery winners. Differential correction rates could arise,
for example, as a result of continued bureaucratic interaction between lottery winners and the authorities
administering the PACES program.
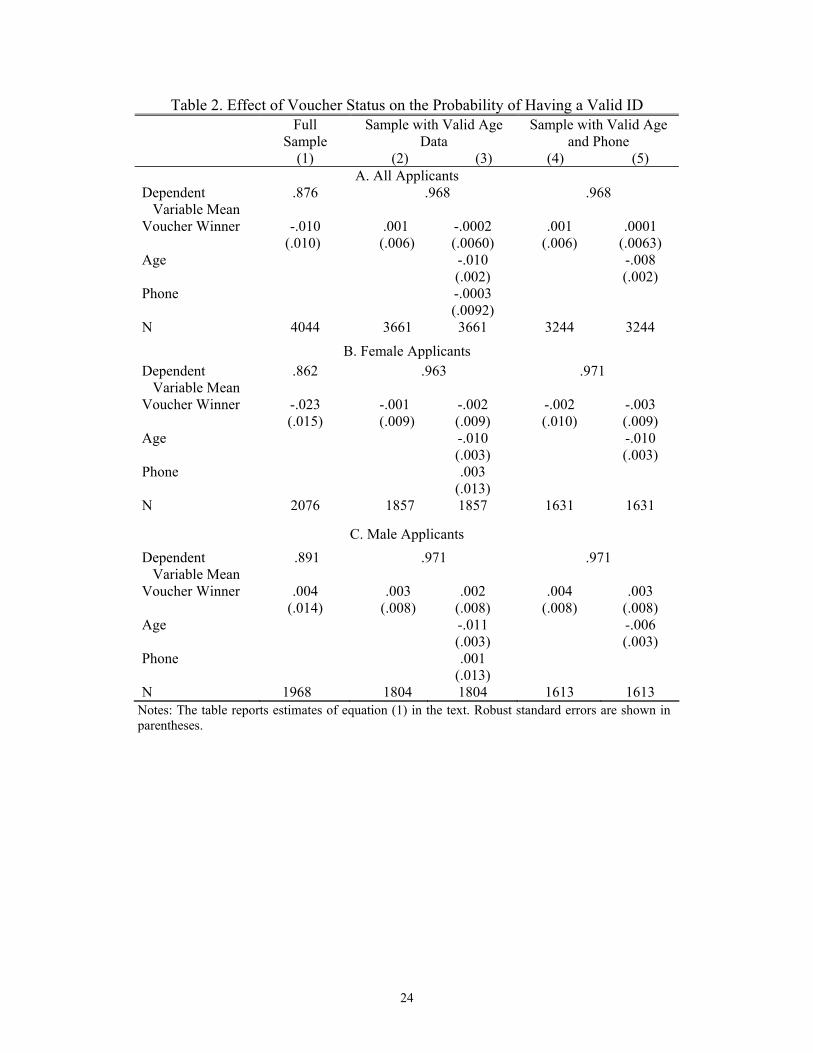
In practice, however, there is little evidence of differential ID-number accuracy by voucher status
in our data. Table 2 shows estimates of "0 in the regression model:
vi = Xi'$0 + "0Di + ,i, (1)
where vi is a dummy for the validity of applicant i’s ID number, Di is an indicator for whether applicant i
won a voucher, and Xi is a vector of controls for age and sex. Also reported are estimates with no
covariates.5

6We found some evidence of differential record-keeping in the first cohort of Bogotá applicants from 1992, beforethe lottery process was computerized. Because of this and other data problems, the 1992 applicant cohort wasomitted from this study.
7An applicant’s city was considered matched if he or she registered for the ICFES test in Bogotá. Of course, inpractice, some Bogotá applicants may have been tested elsewhere. A few apparent matches from 1999 wereincluded as well. See the data appendix for details.
7
Eighty-eight percent of all applicants had a valid ID number (Column 1 of Table 2)). Voucher
winners were 1 percentage point less likely to have a valid ID, but this difference is not significantly
different from zero. Restricting the sample to those with valid birth dates embedded in their ID numbers
results in an even smaller voucher effect, with or without demographic controls. Results are also similar
when estimated separately by sex. These results strongly suggest that voucher winners are not more
likely to be matched solely because they have more accurately recorded ID numbers.6
III. Effects on High School Graduation
Estimates of voucher effects on high school graduation rates were constructed using an equation
like (1), replacing the dependent variable with an indicator for ICFES registration. Students in the 1995
applicant cohort who were promoted on schedule should have registered to take the ICFES exam at one of
two opportunities in the 2000 school year. Because some students may also have advanced or repeated
grades, we searched for applicants in the population of students who registered for any exam offered in
2000 and 2001. If a student was found to have been tested more than once, we retained the first set of test
scores. In addition, we experimented with more restrictive matching strategies using city of residence and
students’ names for validation.7
About 35 percent of PACES applicants were matched to ICFES records using ID numbers, a
result that can be seen in the first row of Table 3. A stricter match definition that requires both ID
numbers and city of residence to line up generates an overall match rate of 34 percent, while matching on
ID numbers and the first 7 letters of students’ last names produces a match rate of 33 percent. Finally,
requiring both city and a 7-letter match generates a match rate of 32 percent.

8
In models with no controls, vouchers are estimated to have raised ICFES registration rates about
7 percentage points. This can be seen in column 1 of Table 3. The voucher effect falls slightly to about 6
percentage points with demographic controls but remains significantly different from zero. The estimated
effects are slightly larger for boys than for girls, and the base rate is lower for boys. Using city of
residence to validate matches leads to slightly smaller treatment effects for girls and overall, but the
change is not substantial. Validation by matching on names as well as ID numbers leads to treatment
effects almost identical to those without validation, and validation using both city and name generates
estimates similar to those using city only. On balance, the estimated effects of voucher status on ICFES
registration are remarkably robust to changes in sample, specification, and the definition of a match.
Thus, it seems fair to say that PACES vouchers increased the likelihood of ICFES registration, and
probably high school graduation, by 5-7 percentage points, with no consistent pattern of differences by
sex. This amounts to an increase of 15-20 percent in the probability students took the ICFES exam.
IV. Effects on College Entrance Exam Scores
A. The Selection Problem
We turn here to an assessment of the effects of PACES vouchers on academic achievement as
measured by ICFES test scores. The principal econometric challenge in an evaluation of effects on test
scores arises from the fact that voucher winners were more likely than losers to take the test. Thus, the
score distributions of winners and losers are no longer directly comparable. To see the likely
consequences of differential test-taking rates for comparisons of scores among test-takers, let y1i be the
ICFES score student i would obtain after winning the voucher and let y0i denote the score student i would
obtain otherwise. We assume that both of these potential outcomes are well-defined for all pupils,
whether they actually took the test or not, and whether they won the lottery or not. The average causal
effect of winning the voucher on the scores of all winners is E[y1i!y0i| Di=1]. Of course, in practice, we

9
only observe scores for those who were tested. Moreover, among tested pupils, we only observe y1i for
winners and y0i for losers.
Using a notation paralleling the notation for potential test scores, let T1i and T0i denote potential
test-taking status. That is, T1i is a dummy for whether a student would have taken the ICFES after
winning the lottery and T0i is a dummy for whether a student would have taken the ICFES after losing the
lottery. By virtue of the random assignment of Di, the vector of all potential outcomes {y1i, y0i, T1i, T0i} is
jointly independent of Di, though the elements of this vector are probably correlated with each other.
Observed test-taking status, the dependent variable in the previous section, is linked to these potential
outcomes by the equation:
Ti = T0i + (T1i!T0i)Di.
Similarly, the latent score variable (i.e., what we would observe if all students were tested) is
yi = y0i + (y1i!y0i)Di.
The observed win/loss contrast in test scores among those who were tested can be now written
E[yi| Ti=1, Di=1] ! E[yi| Ti=1, Di=0] = E[y1i| T1i=1, Di=1] ! E[y0i| T0i=1, Di=0]
= E[y1i| T1i=1] ! E[y0i| T0i=1],
where the second equality is because Di is randomly assigned. This contrast does not have a causal
interpretation, since students with T1i=1 and T0i=1 are not drawn from the same population unless Di has
no effect on the probability of being tested. In fact, we can expand this further to write
E[yi| Ti=1, Di=1] ! E[yi| Ti=1, Di=0] = E[y1i!y0i| T0i =1]
+ {E[y1i| T1i =1] ! E[y1i| T0i =1]}. (2)
Equation (2) shows that the win/loss contrast among test-takers is equal to the average causal effect on
those who would have been tested anyway, E[y1i!y0i| T0i=1], plus a term that captures the selection bias
due to the fact that we are conditioning on ICFES registration status, itself an outcome that is correlated
with potential test scores.

10
The bias term in equation (2) is likely to be negative if PACES vouchers increased test scores.
To illustrate this, suppose that y1i = y0i + ", where ">0, and that students choose to be tested if their
potential scores exceeded a constant threshold, :. Then Tji=1[yji>:] for j=0,1; and the selection bias is
E[y1i| y1i>:] !E[y1i| y1i>:+"],
which is clearly negative. Of course, this example presumes that vouchers are never harmful. If vouchers
were harmful, selection bias could (by the same argument) mask a negative treatment effect.
To provide an empirical basis for the claim that selection bias in the sample of ICFES takers is
likely to be negative, we used test scores from our earlier random sample of Bogota students, the sample
used by Angrist, et al (2002) to assess the effect of vouchers in learning. Although our sample of 259
tested students is somewhat more likely to have taken the ICFES test than the overall average test rate for
the 1995 Bogota cohort (about 44% versus 35% overall), in contrast with the ICFES test, the likelihood of
taking our test is the same for voucher winners and losers. Thus, the earlier sample of test takers is not be
contaminated by self-selection bias of the sort affecting ICFES takers (though there is missing score data
for other reasons).
A regression using stacked math and reading scores from the earlier testing sample generates a
voucher effect of .186, with effects measured in standard deviation units (and with a standard error
adjusted for student clustering of .105). Limiting this sample to the roughly 44% of tested students who
also took the ICFES generates a voucher effect of .044 (s.e.=.157). The pattern of substantial (and
usually marginally significant) positive effects in the full sample and considerably smaller and
insignificant treatment effects when this simple is limited to those who also took the ICFES test appears
for all dependent variables and specifications. This finding illustrates the fact that conditioning on ICFES
testing status almost certainly drives positive treatment effects towards zero.

8This condition need not hold if some students who chose to use vouchers anticipated gains that did not materialize,with a subset ending up having been harmed by voucher use. In practice, however, the “never harmful” assumptionis made more plausible by the fact that vouchers typically did not cover the entire cost of private school. This meansthat students using vouchers presumably expected gains large enough to outweigh the financial costs of attendingprivate school, with a low risk of adverse academic effects.
11
B. Non-Parametric Bounds
This section builds on the discussion above to derive a set of non-parametric bounds on quantile-
specific program impacts on the distribution of test scores. Because selection bias is most likely negative
when treatment effects are positive, selection-contaminated comparisons provide a lower bound on the
likely impact of vouchers on achievement. Here, we also develop an upper bound by adapting a
theoretical result from our earlier paper (Angrist, et al, 2002).
Suppose we are prepared to assume that winning the lottery was never harmful, i.e., that y1i$y0i
for all i. This seems reasonable since lottery winners were free to turn down their vouchers and attend
public school if they felt continued voucher use was harmful.8 It also seems reasonable to assume T1i$T0i
since test-taking status is probably determined by, among other things, expected scores. Finally, it is
useful to define a score variable that equals zero for those not tested:
Yji = Tjiyji for j=0,1. (3)
Note that given our “never harmful” assumptions, we also have Y1i$Y0i for all i, and that
E[Y1i ! Y0i| T0i=1] = E[y1i ! y0i| T0i=1].
The observed outcome, Yi, is linked to potential outcomes by
Yi = Y0i + (Y1i!Y0i)Di = T0iy0i + (T1iy1i!T0iy0i)Di.
To simplify notation, drop subscripts for individuals and let q0(2) be the 2-quantile of the distribution of
Y0 and let q1(2) be the 2-quantile of the distribution of Y1. Assuming that students choose to be tested if
their potential scores exceeded a constant threshold, the quantiles of yji for test-takers are identified from
the quantiles of Yji for 2$2j where qj(2j)=0.
For the development that follows, it’s useful to define a rank-preserving restriction on the joint
distribution of (Y0, Y1):

12
Definition. The random variable Y1 is said to be a 2-quantile-preserving transformation (2-QPT) of the
random variable Y0 if P(Y1 ≥ q1(2) | Y0 ≥ q0(2))=1.
Note that Y1 is a 2-QPT of Y0 if the two potential outcomes are linking by a weakly increasing function,
or if, for any two draws from the joint distributions of Y1 and Y0, the orderings of Y1 and Y0 are the same.
The 2-QPT concept extends this idea of rank-preservation to quantile-specific comparisons.
The following proposition establishes a set of quantile-specific bounds on average treatment
effects in the presence of sample selection bias:
Proposition 1. Suppose that y1$y0 and T1$T0. Choose 2$20 where q0(20)=0. Then
E[Y| D=1, Y>q1(2)] ! E[Y| D=0, Y>q0(2)] $ E[y1!y0| y0>q0(2), T0=1]
$ E[Y| D=1, Y>q0(2)] ! E[Y| D=0, Y>q0(2)].
Furthermore, if Y1 is a 2-quantile-preserving transformation of Y0, then the left inequality is an equality.
Proof. E[Y| D=j, Y>qj(2)] = E[Yj| Yj>qj(2)] by random assignment. Also,
E[Y1| Y1>q1(2)] ! E[Y0| Y0>q0(2)] = E[Y1!Y0| Y0>q0(2)] + {E[Y1| Y1>q1(2)]!E[Y1| Y0>q0(2)]}
$E[y1!y0| y0>q0(2), T0=1] + b0.
If Y1 is a 2-QPT of Y0 then b0=0, so the second part is proved. Otherwise, we need to show that b0 $0.
Note that
b0 = E[Y11(Y1>q1) !Y11(Y0>q0)]/P(Y0>q0) since P(Y1>q1) = P(Y0>q0), so,
b0 $ E[Y1(1(Y1>q1) !Y11(Y0>q0))]
= E[Y1(1(Y1>q1) !1(Y0>q0))] = E[Y1(1(Y1>q1, Y0<q0)!1(Y1<q1, Y0>q0))],
where the second equality above is a consequence of the facts that 1(Y1>q1)=1(Y1>q1, Y0<q0)+1(Y1>q1,
Y0>q0) and 1(Y0>q0)=1(Y1<q1, Y0>q0)+1(Y1>q1, Y0>q0). Further simplifying, we have
E[Y1(1(Y1>q1, Y0<q0)!1(Y1<q1, Y0>q0))] = E[Y1| Y1>q1, Y0<q0]p1 ! E[Y1| Y1<q1,Y0>q0]p0,

9The latter result can also be understood as follows. Angrist (1997) shows that monotonicity in selection status(T1i$T0i), combined with a constant-effects link between y1 and y0, implies that controlling the probability of sampleselection eliminates selection bias. Symmetric truncation is equivalent to fixing the probability of sample selection. The proposition generalizes this result to models with a non-constant but still rank-preserving link between potentialoutcomes. Krueger and Whitmore (2001) used a similar idea to estimate E[y1!y0| T0=1] in a study of class size. Seealso Lee (2002).
13
where p1$Pr[Y1>q1, Y0<q0] and p0$Pr[Y1<q1, Y0>q0]. Clearly E[Y1| Y1>q1, Y0<q0] $E[Y1| Y1<q1, Y0>q0].
Also, p1 = p0 because
P(Y1>q1) = p1 + Pr[Y1>q1, Y0>q0] = 2 = Pr[Y1>q1, Y0>q0] + p0 = P(Y0>q0).
This establishes the upper bound. The lower bound is a consequence of the fact that
E[Y| D=1, Y>q0(2)]!E[Y| D=0, Y>q0(2)] = E[Y1!Y0| Y0>q0(2)] + {E[Y1| Y1>q0(2)]!E[Y1| Y0>q0(2)]}
and E[Y1| Y0>q0(2)] = E[Y1| Y1 $Y0>q0(2)] $E[Y1| Y1>q0(2)].
Note that we can choose a quantile, 20, such that q0(20) = 0, and then drop the lower 20 percent of the Y1
distribution to obtain an upper bound on E[y1!y0| T0=1]. At the same time, the unadjusted conditional-
on-positive contrast in test scores provides a lower bound. Moreover, if Y1 and Y0 are linked by a 2-QPT,
the upper bound provides an estimate of E[y1!y0| T0=1].9 We can use this fact to estimate or bound
average treatment effects at a number of points in the score distribution.
We can also use the proof of the proposition to get a sense of when the upper bound is likely to
be tight. The bias of the upper bound is
b0 /E[Y1| Y1>q1(2)]!E[Y1| Y0>q0(2)],
which is equal to zero when Y1 preserves the 2-quantile of Y0. Since some of the applicants induced to
take the test by winning the lottery presumably scored above the minimum score achieved by applicants
who took the test after losing the lottery, the bound is unlikely to be perfectly tight. However, since few
of these “leap-frogging” applicants are likely to have scored in the upper quantiles of the distribution, the
likelihood that the 2-QPT assumption holds probably increases with 2. We should therefore expect upper
bounds estimated using the proposition to be tighter at the top of the distribution than the bottom.

10These estimates are for the sample with valid ID and age as in Table 3; covariates include age and sex.14
Estimates of non-parametric bounds on treatment effects at different quantiles are reported in
Tables 4a and 4b for language and math scores, for 20 such that q0(20)=0, and for 2=.75, .85., and .95.10
The largest effects are at q0(20)=0, i.e., effects on all pupils who would have been tested even if they had
not won the lottery. The lower bound for effects on language scores in this population is .68 (s.e.=.33),
while the upper bound is 2.8 (s.e.=.31). For 2=.95, the bounds fall to an insignificant .35 on the low end
and still-significant 1.4 (s.e.=.34) on the high end. The pattern of bounds by quantile is consistent with
either a larger shift in scores for pupils with Y0 close to the low end of the test-takers’ score distribution,
or with a tightening of the upper bound at higher quantiles, or both.
The effects on math scores in the sample that includes boys and girls are generally somewhat
smaller than those on language scores. In fact, lower bounds for the estimated effects on math scores are
not significantly different from zero at every cutoff, while the lower bounds for language effects are at
least marginally significant at the lower three cutoffs. Interestingly, most of the effects for boys are larger
than the corresponding effects for girls, especially at the first two cutoffs and for the upper bounds. The
difference in effects by sex is most marked for math scores.
A comparison of the entire distribution of test scores for winners and losers supports the notion
that the voucher led to an increase in achievement by winners. Figures 1a and 1b, which plot kernel
density estimates in the sample of all test takers, show slightly flattened and right-shifted distributions for
winners. As with the comparisons of means, however, this contrast is contaminated by selection bias, in
particular, the likely introduction of low-scorers into the sample of tested winners. Adjusting for sample
selection bias as suggested by Proposition 1 leads to a clearer impression of a shift. This can be seen in
Figures 2a and 2b, which plot score distributions after limiting the distribution of winners to the top 28
percent of the score distribution (including zeros). In other words, Figures 2a and 2b plot scores
conditional on Y0>q0(.72), where q0(.72)=0, and Y1>q1(.72). The adjusted figure shows a clearer
rightward shift in the distribution for winners, especially in the middle of the density.

11An alternative and perhaps more conventional procedure that captures effects on distribution while avoidingselection bias under the same assumptions is quantile regression (QR). In this case, however, quantile regression ismade less attractive by the almost-discrete nature of the test scores. About 80 percent of the mass of the distributionof scores among takers falls into a range of 15 points or less. This near-discreteness causes QR estimates to behavepoorly and invalidates standard asymptotic theory for QR since a regularity assumption for quantile regression iscontinuity of the dependent variable.
15
The density plots and differences in average treatment effects reported for different quantiles in
Tables 4a and 4b suggest the PACES program had an impact on the distribution of test scores beyond a
simple “location shift.” To explore distribution effects further (and quantify the impression left by the
figures), we estimated the impact of winning a voucher at different points in the cumulative distribution
of test scores. In particular, we estimated voucher effects in equations analogous to equation (1), with the
dependent variable given by 1[Yi > c], where c is a quantile in the score distribution among test takers.
This procedure uses a sample where test scores for non-takers are coded as zero. Therefore, assuming
that those not tested would have scored below c, the resulting estimates are unaffected by selection bias.11
Estimates of effects on the distribution of test scores, reported in Table 5, show the largest effects
on the probability test scores exceeded the lowest decile in the score distribution (among test-takers). For
example, the probit marginal effects of the impact of a voucher on the probability of crossing the first
decile are .063 (s.e.=.015) for the language score distribution and .068 (s.e.-.016) for the math score
distribution. These estimates appear in columns 3 and 6 of Table 5. The corresponding estimates fall to a
bit over .04 at the median, and then to around .025 at the 75th percentile. It seems unlikely that many
students at the 75th percentile of the distribution of test scores among test takers were in danger of having
to repeat a grade. The substantial impact of the program on the likelihood of scoring in the upper quartile
among test takers therefore suggests the program operated through channels other than simply reducing
the risk of grade repetition. Moreover, while the estimated distribution shifts at the upper decile in this
specification are only .01 and .003 for language and math, the former effect is still significantly different
from zero.
Another interesting finding that comes out of the distribution analysis, echoing the results in
Tables 4a and 4b, is a reasonably clear pattern of larger voucher effects on the distribution of scores for

16
boys than for girls. For example, the distribution shift at the median of the math score distribution is .059
(s.e.=.015) for boys and .033 (s.e.=.017) for girls. Again, these are probit marginal effects. The
differences in effects by sex are even larger in the corresponding linear probability model and when these
effects are estimated in models without covariates.
C. Parametric strategies
The strategies discussed in the previous section rely on relatively weak functional-form and
distributional assumptions at the cost of a possible reduction in statistical power and, for the first
approach, the need to settle for bounds instead of point identification. Here we briefly explore a
potentially more powerful parametric strategy that codes the latent scores of non-takers as falling below a
particular value or quantile, then censors the score distribution at or above this value and uses Tobit to
correct for censoring. A comparison of Tobit results using different censoring points provides a natural
specification test for this procedure since, if correctly specified, results using different censoring points
should be similar. A key drawback in this case is the need to assume normality of the uncensored latent
score distribution. The quality of the normal approximation may be especially poor given the relatively
discrete nature of the score data.
The idea behind this approach is spelled out in more detail below. We assume that the causal
effect of interest could be estimated by regressing latent scores, yi, on Di and covariates, Xi. That is, the
regression of interest is
yi = Xi'$ + "Di + 0i, (4)
where 0i is a normally distributed error. Now, construct an artificially censored version of Yi using
Yi(J) / 1[Yi > J]Yi, (5)
for some positive threshold, J. Assuming any untested student would have scored at or below this
threshold if they had been tested, the parameters in (4) can be consistently estimated by applying Tobit to
Yi(J).This is not realistic for J=0 but it may be for, say, the 10th percentile of the score distribution among

12The covariates and sample used here are the same as in Tables 3-5. 17
test-takers. Finally, note that if Tobit using Yi(J0) identifies ", then Tobit using Yi(J1) will also work for
any threshold value J1, such that J1>J0.
As a benchmark for this procedure, we again report estimates using the sample of test-takers,
without adjusting for censoring. A simple comparison of winners’ and losers’ test scores in the sample of
test-takers, presented in column 1 of Table 6, shows winners scored about 0.7 points higher on the
language exam, with similar though less precise effects in samples of boys and girls.12 The estimated
effects for math scores are smaller though still positive. Censoring the score distribution at the first
percentile among test-takers, including all students and without adjusting for censoring in the estimation,
generates a voucher effect of 1.1 (s.e.= .24) for language and 0.79 (s.e.=.18) for math. These results are
reported in column 2.
Tobit estimates using data censored at the first and 10th percentiles among test-takers suggest
much larger effects than those that arise without correcting for selection bias. The Tobit estimates,
reported in columns 3 and 4 of Table 6, are on the order of 2-4 points for language and 2-3 points for
math, in all cases significantly different from zero. Effects are at the lower end of this range, around 2
points, when the data are censored at the 10th percentile. Consistent with some of the earlier results, Tobit
estimates separately by sex lead to larger estimates for boys than for girls for both math and language
scores.
Assuming the Tobit model applies to data censored at the first percentile, the Tobit coefficient
estimates should be the same when estimated using data censored at the 10th. The decline in estimates
moving column 3 to column 4 therefore suggests the first percentile is too low a threshold for the model
to apply. On the other hand, Tobit estimates of " are remarkably stable when the distribution is
artificially censored with a cutoff that removes the lower 10-80 percent of scores. This can be seen in
Figures 3a and 3b, which plot the estimated Tobit coefficients and confidence bands for alternative
censoring points. The estimated treatment effects are fairly stable at around 2 points, turning down

13Effect sizes calculated using the distribution of the latent Tobit residual seem like an appropriate standard ofcomparison since, on one hand, the R-squared in the latent equation estimated here is likely to be small and, on theother, the research strategy used in our earlier study can be thought of as providing estimates of the standarddeviation of latent scores since all applicants in the relevant sample were tested (i.e., whether or not they were likelyto later register for ICFES).
18
slightly when the lower 90 percent of scores among takers are censored. It should be noted, however, that
the confidence intervals widen at this point. Moreover, normality may be a poorer approximation for the
score distribution at the upper tail. On balance, the model summarized in (4) and (5) seems to provide
reasonably coherent account of the voucher impact on latent scores. Effects in this range amount to a
score gain of about .2F where F is the standard deviation of the latent residual in equation (4). This is
consistent with our earlier estimates of effects on achievement for a random sample of Bogotá 8th graders
in 1998.13
V. Summary and Conclusions
This paper presents evidence on the impact of PACES vouchers on long-run outcomes for
applicants to the Bogota voucher lottery. The PACES program allowed students to attend private schools,
and was renewable annually, conditional on grade advancement. The random assignment of vouchers
facilitates causal comparisons between those who did and not receive vouchers. Administrative data on
college entrance exams allow us to estimate the impact of vouchers on high school graduation rates and
scholastic achievement. Two potential empirical problems in a study of this sort are the possibility of
higher false match rates for winners than losers and selection bias in comparisons of test scores among
those who were tested. As it turns out, the quality of record-keeping appears to have been similar for
winners and losers, so that false matches are probably not a problem. We used a variety of simple
strategies to adjust for selection bias, with reasonably consistent results coming out of different methods.
The empirical results point to an increase in high school graduation rates of 5-7 percentage
points, relative to a base rate of 25-30 percent. This finding is consistent with our earlier results showing
a 10 percentage point increase in 8th grade completion rates among voucher winners, as well as gains on a
19
standardized test. The magnitude of the test score gains in our follow-up study turn partly on how
selection bias is controlled. Tobit estimates with artificially censored data put the treatment effects at
around 2 points, or roughly .2F relative to the standard deviation of latent scores. Non-parametric bounds
bracket this number, with a lower bound that is significantly different from zero in the full sample. Since
the upper bound is exact under the assumption of a monotone shift, and the Tobit estimates satisfy a
simple over-identification test, something close to the Tobit estimate of 2 points seems like a good
summary estimate.
For the most part, bounds on average treatment effects at higher quantiles of the score distribution
are smaller than those at the lower end. This may be because program effects were actually greatest at the
bottom of the distribution, perhaps due to the incentive effects generated by PACES vouchers. However,
it also seems likely that the upper bounds are tighter higher in the distribution for technical reasons having
to do with the relationship between potential outcomes in the treated and non-treated states. In any case,
the fact that lottery winners were substantially more likely to score in the top quartile on the national
university entrance exam suggests that the program probably improved learning not only by increasing
financial incentives, but also by expanding school choice. A final noteworthy result is that the effects we
estimated for boys, who generally score lower in this population, tend to be somewhat larger than those
estimated for girls. Thus, the voucher program acted to reduce male-female score differentials.
In conclusion, it is worth emphasizing that all of the estimation methods used here point towards
a substantial gain in both high school graduation rates and achievement as a result of the voucher
program. The size and persistence of this impact suggests PACES was a cost-effective intervention.
Although the benefits of achievement gains per se are hard to quantify, there is a substantial economic
return to high school graduation in Colombia. At a minimum this suggests demand-side financing efforts
along the lines of the PACES program warrant further study. Another area for future work is a
reconciliation between our results for Colombia, which consistently show large benefits to voucher
recipients, and results for the U.S., which have been more mixed. One possibility is that gaps between the

20
quality of public and private schools are greater in Colombia than in the U.S. Another is that PACES
features not necessarily shared by other voucher programs, such as incentive effects and the option for
those who would have gone to private school anyway to use vouchers to attend more expensive schools,
played an important role in generating the gains documented here.

21
Data Appendix
ICFES-matching Details
The population to be matched consisted of 4,044 applicants from the 1995 PACES cohort in
Bogotá. Matching was carried out by searching computer files in the ICFES offices in Bogotá. The
search was implemented by our research assistants with assistance from ICFES staff members. ICFES
tests are offered twice a year. We searched for matches among all test-takers in 1999, 2000, and 2001. 27
students with an exact ID match registered but never took the exam. We code this event as a match but
assigned a score of zero. Another 44 had scores recorded from tests offered in 1999, before the ICFES
was a re-designed and a new score scale introduced. We assigned these individuals the mean score for
their age/sex cell among takers in 2000 and 2001. Results are similar when the 1999 matches are treated
as non-matches.
ICFES Subjects and Score Distribution
The ICFES scores used here are from the redesigned scoring system introduced in March 2000.
Our scores are for the Mathematics and Language components of the Common Core of Basic
Competence (Nucleo Comun Competencias Basicas), which includes modules in Biology, Chemistry,
Physics, Mathematics, Language, History, Geography, and a Foreign Language test chosen by the
student. In addition to these required tests, students choose to be tested in up to four areas of
specialization. The ICFES is given over a two-day period with two morning sessions and an afternoon
session on the first day.
The Mathematics and Language components of the Common Core each take one hour and have
35 questions. Test scores are reported on a scale of 0-100, with the score distribution highly concentrated
in the 30-70 range. The distributions of Mathematics and Language scores for all those tested in Bogotá
in March 2000 are shown in the appendix figures (for 6,868 examinees).

22
REFERENCES
Angrist, Joshua D., “Conditional Independence in Sample Selection Models,” Economics Letters 54,February 1997, 103-112.
Angrist, Joshua and Victor Lavy, “The Effect of High School Matriculation Awards: Evidence fromRandomized Trials,” NBER Working paper 9839, 2003.
Angrist, Joshua; Bettinger, Eric; Bloom, Erik; King, Elizabeth and Kremer, Michael, “Vouchers forPrivate Schooling in Colombia: Evidence from a Randomized Natural Experiment,” AmericanEconomic Review 92, December 2002, 1535-1558.
Ashworth, K. and J. Hardman, “Education Maintenance Allowance: The First Year, A QualitativeEvaluation,” Research Report RR257, Department for Education and Employment, 2001.
The College Board, Trends in Student Aid, Washington, D.C., 2002. Cornwell, Christopher and David Mustard, “The Enrollment Effects of Merit-Based Financial Aid:
Evidence from Georgia’s HOPE Scholarship,” Journal of Labor Economics, 2002.Dynarski, Susan, “The Consequences of Merit Aid.” NBER Working Paper 9400, 2003.Howell, William G. and Paul E. Peterson (2002), The Education Gap: Vouchers and Urban Schools,
Washington, DC: The Brookings Institution.King, Elizabeth; Orazem, Peter and Wolgemuth, Darin, “Central Mandates and Local Incentives: The
Colombia Education Voucher Program,” Working Paper No. 6, Series on Impact Evaluation ofEducation Reforms, Development Economics Research Group, The World Bank, February 1998.
King, Elizabeth; Rawlings, Laura; Gutierrez, Marybell; Pardo, Carlos and Torres, Carlos, “Colombia’sTargeted Education Voucher Program: Features, Coverage and Participation,” Working PaperNo. 3, Series on Impact Evaluation of Education Reforms, Development Economics ResearchGroup, The World Bank, September, 1997.
Kremer, Michael, Edward Miguel and Rebecca Thornton, “Incentives to Learn,” Harvard department ofEconomics, mimeo, 2003.
Krueger, Alan and Whitmore, Diane, “The Effect of Attending a Small Class in the Early Gradeson College-Test Taking and Middle School Test Results: Evidence from Project STAR,”Economic Journal, January 2001, 111(468).
Krueger, Alan and Pei Zhu, “Another Look at the New York City School Voucher Experiment,” NBERWorking Paper 9418, January 2003.
Lee, David, “Trimming for Bounds on Treatment Effects with Missing Outcomes,” NBER TechnicalWorking Paper 277, June 2002.
Rouse, Cecilia Elena, “Private School Vouchers and Student Achievement: An Evaluation of theMilwaukee Parental Choice Program,” Quarterly Journal of Economics, May 1998, 13(2), 553-602.
Sanchez, Fabio and Jairo Mendez, “Por que los ninos pobres no van a la escuela? (Determinantes de laasistencia escolar en Colombia).” mimeo, Departmento Nacional de Planeacion Republica deColombia, 1995.
The World Bank, Research Department, Staff Appraisal Report: Colombia, Secondary EducationProject, Human Resources Operations Division, Latin America and the CaribbeanRegion, Report No. 11834-CO, November 19, 1993.
The World Bank, World Development Report 1998/99, New York: Oxford University Press, 1999.

23
Table 1. Characteristics of ICFES Matching Sample by Voucher Status
Means Difference by Voucher Status
(winners vs. losers)
Full Sample
(1)
Sample W/ Valid Age
(2)
Full
Sample (3)
Sample w/ Valid Ages
(4)
Valid ID and Age
(5)
Valid ID and Age and Has
Phone (6)
Won Voucher .588 .585
Valid ID .876 .967
Age at Time of Application
12.7 (1.8)
12.7 (1.3)
-.137 (.064)
-.086 (.045)
-.085 (.044)
-.091 (.047)
Male .487 .493 .004 (.016)
.011 (.017)
.012 (.017)
.008 (.018)
Phone .882 .886 .013 (.010)
.008 (.011)
.008 (.011)
---
N 4044 3661 4044 3661 3542 3139
Notes: Robust standard errors reported in parentheses. Regression estimates of differences by voucher status in column 4 are for sample with valid age data embedded in the National ID number. A valid age must be between 9 and 25. Column 5 limits the sample to those with a valid ID check digit and Column 6 further limits the sample to those with a phone. There are 1520 observations in Column 1 and 3664 in Column 2 for “Age at Time of Application.” Other sample sizes are as shown.
24
Table 2. Effect of Voucher Status on the Probability of Having a Valid ID Full
Sample Sample with Valid Age
Data Sample with Valid Age
and Phone (1) (2) (3) (4) (5)
A. All Applicants Dependent
Variable Mean .876 .968 .968
Voucher Winner -.010 (.010)
.001 (.006)
-.0002 (.0060)
.001 (.006)
.0001 (.0063)
Age
-.010 (.002)
-.008 (.002)
Phone -.0003 (.0092)
N 4044 3661 3661 3244 3244 B. Female Applicants
Dependent Variable Mean
.862 .963 .971
Voucher Winner -.023 (.015)
-.001 (.009)
-.002 (.009)
-.002 (.010)
-.003 (.009)
Age -.010 (.003)
-.010 (.003)
Phone .003 (.013)
N 2076 1857 1857 1631 1631
C. Male Applicants Dependent
Variable Mean .891 .971 .971
Voucher Winner .004 (.014)
.003 (.008)
.002 (.008)
.004 (.008)
.003 (.008)
Age -.011 (.003)
-.006 (.003)
Phone .001 (.013)
N 1968 1804 1804 1613 1613 Notes: The table reports estimates of equation (1) in the text. Robust standard errors are shown in parentheses.

25
Table 3. Voucher Status and the Probability of ICFES Match Exact ID Match ID and City Match ID and 7-letter Name Match ID, City, and 7-letter Match (1) (2) (3) (4) (5) (6) (7) (8)
A. All Applicants (N=3542) Dependent Var. Mean .354 .339 .331 .318 Voucher Winner .072
(.016) .059
(.015)
.069 (.016)
.056 (.014)
.072 (.016)
.059 (.014)
.068 (.016)
.056 (.014)
Male -.052 (.014)
-.053 (.014)
-.043 (.014)
-.045 (.014)
Age -.160 (.005)
-.156 (.005)
-.153 (.005)
-.149 (.005)
B. Female Applicants (N=1789)
Dependent Var. Mean .387 .372 .361 .348 Voucher Winner .067
(.023) .056
(.021)
.069 (.023)
.057 (.021)
.071 (.023)
.060 (.021)
.073 (.023)
.062 (.021)
Age -.168 (.006)
-.164 (.006)
-.160 (.006)
-.156 (.006)
C. Male Applicants (N=1752)
Dependent Var. Mean .320 .304 .302 .288 Voucher Winner .079
(.022) .063
(.020)
.071 (.022)
.055 (.020)
.074 (.022)
.059 (.020)
.065 (.022)
.050 (.020)
Age -.153 (.007)
-.148 (.007)
-.146 (.007)
-.141 (.006)
Notes. Robust standard errors are shown in parentheses. The sample includes all Bogotá 95 applicants with valid ID numbers and valid age data (i.e. ages 9 to 25 at application). The sample is the same as in Table 1, Column 5.

26
Table 4a. Bounds on Voucher Effects on Language Scores, for Applicants Who Would Have Taken the ICFES Exam Anyway
w/o Covs w/ Covs
Loser's Value at Percentile
Percentile of Loser's Distribution
Loser’s Avg Score Above
Quantile (1)
Lower Bound
(2)
Upper Bound
(3)
Lower Bound
(4)
Upper Bound
(5) A. All Applicants
0 72nd Percentile 46.9 (5.5)
.68 (.33)
2.81 (.31)
.70 (.33)
2.80 (.31)
41 75th Percentile 48.7 (3.9)
.46 (.26)
2.47 (.26)
.49 (.26)
2.46 (.26)
47 85th Percentile 51.2 (3.0)
.49 (.27)
2.39 (.28)
.50 (.27)
2.37 (.28)
52 95th Percentile 55.6 (1.7)
.35 (.31)
1.38 (.34)
.36 (.31)
1.39 (.34)
B. Female Applicants
0 67th Percentile 46.6 (5.7)
.65 (.45)
2.29 (.42)
.74 (.45)
2.33 (.42)
43 75th Percentile 49.2 (3.7)
.46 (.35)
1.86 (.35)
.52 (.35)
1.87 (.35)
47 85th Percentile 51.5 (3.1)
.31 (.37)
2.32 (.40)
.32 (.37)
2.31 (.40)
52 95th Percentile 55.7 (1.8)
.11 (.45)
1.32 (.52)
.11 (.45)
1.34 (.53)
C. Male Applicants
0 74th Percentile 47.3 (5.3)
.67 (.48)
3.19 (.45)
.66 (.48)
3.18 (.45)
36 75th Percentile 47.9 (4.6)
.54 (.44)
2.61 (.42)
.54 (.43)
2.62 (.41)
47 85th Percentile 51.6 (2.9)
.69 (.39)
1.36 (.39)
.69 (.38)
1.35 (.38)
51 95th Percentile 54.6 (2.1)
.20 (.44)
2.33 (.46)
.27 (.45)
2.35 (.47)
Notes: The table reports bounds computed using the formulas in Proposition 1 in the text. Means and standard deviations are shown in column 1. Estimated bounds and standard errors are shown in columns 2-5. Columns 4-5 include controls for age and gender.

27
Table 4b. Bounds on Voucher Effects on Math Scores, for Applicants Who Would Have Taken the ICFES Exam Anyway
w/o Covs w/ Covs
Loser's Value at Percentile
Percentile of Loser's Distribution
Loser’s Avg Score Above
Quantile (1)
Lower Bound
(2)
Upper Bound
(3)
Lower Bound
(4)
Upper Bound
(5) A. All Applicants
0 70th Percentile 42.3 (4.8)
.40 (.29)
2.40 (.27)
.40 (.29)
2.41 (.27)
37 75th Percentile 43.7 (3.8)
.35 (.25)
1.76 (.25)
.34 (.25)
1.76 (.25)
42 85th Percentile 46.2 (3.2)
.24 (.28)
1.44 (.28)
.27 (.28)
1.48 (.28)
47 95th Percentile 50.3 (2.4)
-.09 (.39)
1.85 (.42)
-.11 (.39)
1.80 (.43)
B. Female Applicants
0 68th Percentile 42.3 (4.7)
.14 (.38)
1.63 (.36)
.18 (.38)
1.66 (.36)
39 75th Percentile 44.3 (3.3)
.24 (.32)
1.08 (.32)
.27 (.32)
1.09 (.32)
42 85th Percentile 46.2 (2.8)
.28 (.34)
1.53 (.34)
.32 (.34)
1.55 (.34)
47 95th Percentile 49.9 (1.6)
.06 (.40)
2.19 (.42)
.06 (.40)
2.18 (.42)
C. Male Applicants
0 74th Percentile 42.3 (4.9)
.70 (.44)
3.27 (.42)
.70 (.44)
3.28 (.42)
35 75th Percentile 43.2 (4.3)
.66 (.40)
2.39 (.40)
.65 (.40)
2.39 (.39)
42 85th Percentile 46.3 (3.7)
.27 (.46)
1.31 (.47)
.32 (.46)
1.37 (.47)
45 95th Percentile 49.8 (3.2)
-.60 (.60)
2.45 (.70)
-.61 (.60)
2.44 (.71)
Notes: The table reports bounds computed using the formulas in Proposition 1 in the text. Means and standard deviations are shown in column 1. Estimated bounds and standard errors are shown in columns 2-5. Columns 4-5 include controls for age and gender.

28
Table 5. Effects on the Probability of Exceeding Test Score Percentiles
Language Scores Math Scores Test Score
Language Math
Score Threshold
OLS No Covs
(1)
OLS Covs (2)
Probit Covs (3)
OLS No Covs
(4)
OLS Covs (5)
Probit Covs (6)
A. All Applicants (N=3541) 40 35 10th
Percentile .069
(.016) .057
(.014) .063
(.015) .073
(.016) .061
(.014) .068
(.016) 44 39 25th
Percentile .055
(.014) .045
(.013) .047
(.014) .062
(.015) .052
(.014) .054
(.014) 47 42 50th
Percentile .050
(.012) .043
(.012) .041
(.011) .051
(.012) .044
(.012) .044
(.011) 51 45 75th
Percentile .033
(.009) .030
(.008) .025
(.007) .034
(.009) .031
(.009) .027
(.008) 54 48 90th
Percentile .015
(.006) .013
(.006) .010
(.004) .005
(.006) .003
(.006) .003
(.005)
B. Female Applicants (N=1788) 40 35 10th
Percentile .066
(.022) .055
(.020) .065
(.023) .066
(.022) .056
(.020) .065
(.023) 43 39 25th
Percentile .054
(.021) .045
(.020) .051
(.021) .045
(.021) .036
(.020) .041
(.021) 47 42 50th
Percentile .052
(.018) .046
(.017) .044
(.016) .037
(.018) .031
(.017) .033
(.017) 51 45 75th
Percentile .027
(.012) .024
(.012) .021
(.010) .026
(.013) .023
(.013) .022
(.011) 54 48 90th
Percentile .009
(.008) .007
(.008) .005
(.006) -.001
(.008) -.002 (.008)
-.001 (.006)
C. Male Applicants (N=1753)
41 37 10th Percentile
.074 (.021)
.060 (.020)
.061 (.021)
.083 (.021)
.069 (.020)
.070 (.020)
44 40 25th Percentile
.067 (.020)
.055 (.019)
.054 (.019)
.069 (.019)
.059 (.018)
.057 (.018)
48 42 50th Percentile
.050 (.016)
.043 (.015)
.039 (.014)
.070 (.017)
.062 (.016)
.059 (.015)
51 45 75th Percentile
.040 (.012)
.035 (.012)
.028 (.009)
.042 (.012)
.038 (.012)
.032 (.010)
55 48 90th Percentile
.013 (.007)
.011 (.007)
.008 (.005)
.010 (.008)
.008 (.008)
.007 (.006)
Notes: The dependent variable indicates whether students exceeded various percentiles in the relevant score distribution for test-takers. Marginal effects are reported for probit estimates. Standard errors are reported in parentheses.

29
Table 6. OLS and Tobit Estimates of the Effects of the Vouchers on ICFES Scores OLS with
score>0 OLS
censored at 1%
Tobit Censored at
1%
Tobit Censored at
10% (1) (2) (3) (4)
A. Language Scores Full Sample
Dep Var Mean 47.4 (5.6)
37.3 (8.0)
37.3 (8.0)
42.7 (4.7)
Voucher Effect .70 (.33)
1.14 (.24)
3.29 (.70)
2.06 (.46)
Female Applicants
Dep Var Mean 47.0 (5.7)
37.6 (8.1)
37.6 (8.1)
42.8 (4.7)
Voucher Effect .74 (.45)
1.04 (.34)
2.88 (.91)
1.86 (.59)
Male Applicants
Dep Var Mean 47.8 (5.5)
37.0 (7.9)
37.0 (7.9)
42.5 (4.6)
Voucher Effect .66 (.48)
1.25 (.34)
3.77 (1.10)
2.29 (.71)
B. Math Scores
Full Sample Dep Var Mean 42.5
(4.9) 35.7 (5.8)
35.7 (5.8)
37.6 (4.6)
Voucher Effect .40 (.29)
.79 (.18)
2.29 (.51)
1.98 (.45)
Female Applicants
Dep Var Mean 42.3 (4.8)
35.9 (5.8)
35.9 (5.8)
37.8 (4.6)
Voucher Effect .18 (.38)
.62 (.25)
1.84 (.66)
1.60 (.58)
Male Applicants
Dep Var Mean 42.8 (5.0)
34.8 (6.1)
34.8 (6.1)
38.9 (3.8)
Voucher Effect .70 (.44)
1.02 (.27)
3.03 (.85)
2.21 (.62)
Note: Robust standard errors are in parentheses. Censoring point is the indicated percentile of the test score distribution, conditional on taking the exam. Standard deviations are reported for the dependent variable means. Sample sizes in Column 1, Panel A are 1223 for the whole sample, 672 for females, and 551 for males. Sample sizes are similar in Column 1, Panel B with an additional male and female. The samples in the other columns are 3541 overall, 1788 women, and 1753 men. Covariates include age and gender.

30
Figure 1a. Language Scores by Voucher Status (No Correction for Selection Bias)
score
Voucher Winners Voucher Losers
25 35 45 55 650
.025
.05
.075
.1
Figure 1b. Math Scores by Voucher Status (No Correction for Selection Bias)
score
Voucher Winners Voucher Losers
25 35 45 55 65
0
.025
.05
.075
.1

31
Figure 2a. Language Score Distribution by Voucher Status for Equal Proportions of Winners and Losers
score
Voucher Winners Voucher Losers
25 35 45 55 650
.025
.05
.075
.1
Figure 2b. Math Score Distribution by Voucher Status for Equal Proportions of Winners and Losers
score
Voucher Winners Voucher Losers
25 35 45 55 65
0
.025
.05
.075
.1

32
Figure 3a. Tobit Coefficients by Censoring Percentile in Language Score Distribution
Tobi
t Coe
ffici
ents
Percentile0 10 20 30 40 50 60 70 80 90
0
1
2
3
4
5
6
7
8
9
10
11
12
13
Figure 3b. Tobit Coefficients by Censoring Percentile in Math Score Distribution
Tobi
t Coe
ffici
ents
Percentile0 10 20 30 40 50 60 70 80 90
-1
0
1
2
3
4
5
6
7
8
9
10
11
12

33
Appendix Figure Ia. Distribution of Language Scores in Bogota versus PACES Sample
ICFES Score Range0
5
10
15
20
25
30
35 Language Scores in Bogota Language Scores in PACES Sample
0-10 21-30 36-40 46-50 56-60 66-70 81-90
Appendix Figure Ib. Distribution of Math Scores in Bogota versus PACES Sample
ICFES Score Range0
5
10
15
20
25
30
35
40 Math Scores in Bogota Math Scores in PACES Sample
0-10 21-30 36-40 46-50 56-60 66-70 81-90


![The Effects of Compulsory Military Service Exemption on ... · veterans has diminished quickly over time [Angrist and Chen (2011), Angrist, Chen, and Song (2011)]. Angrist and Krueger](https://img.pdfslide.us/doc/110x75/60c1dec32f107f6d86766956/the-eiects-of-compulsory-military-service-exemption-on-veterans-has-diminished.jpg)