Embed Size (px)
Citation preview

NBER WORKING PAPER SERIES
GLOBAL ENGAGEMENT AND THEINNOVATION ACTIVITIES OF FIRMS
Chiara CriscuoloJonathan E. Haskel
Matthew J. Slaughter
Working Paper 11479http://www.nber.org/papers/w11479
NATIONAL BUREAU OF ECONOMIC RESEARCH1050 Massachusetts Avenue
Cambridge, MA 02138June 2005
This work contains statistical data from the Office of National Statistics (ONS), which is Crown copyrightand reproduced with the permission of the controller of HMSO and Queen’s Printer for Scotland. The useof the ONS statistical data in this work does not imply the endorsement of the ONS in relation to theinterpretation or analysis of the statistical data. For helpful comments we thank Andrew Bernard, ChandBown, Lee Branstetter, Luis Cabral, VG Govindarajan, John Haltiwanger, Connie Helfat, Gordon Hanson,Chand Jones, Wolfgang Keller, James Markusen, Steve Nickell, Amil Petrin, John van Reenen, BeataSmarzynsa, Doug Staiger, Alva Taylor, and seminar participants at the International Monetary Fund, the KielInstitute for World Economics, the ITI and Productivity groups at the National Bureau of EconomicResearch, UC-Berkeley, UCLA, University of Nottingham, University of Oregon, and University of Texas.For financial support Haskel thanks the ESRC/ESPRC Advanced Institute of Management Research (Grant#RES-331-25-0030), and Slaughter thanks the National Science Foundation. The views expressed hereinare those of the author(s) and do not necessarily reflect the views of the National Bureau of EconomicResearch.
©2005 by Chiara Criscuolo, Jonathan E. Haskel and Matthew J. Slaughter. All rights reserved. Shortsections of text, not to exceed two paragraphs, may be quoted without explicit permission provided that fullcredit, including © notice, is given to the source.

Global Engagement and the Innovation Activities of FirmsChiara Criscuolo, Jonathan E. Haskel and Matthew J. SlaughterNBER Working Paper No. 11479July 2005JEL No. F1, F2, O3
ABSTRACT
Firms that export or, even more so, are part of a multinational enterprise tend to exhibit higher
productivity than their purely domestic counterparts. To better understand this correlation, we
incorporate the perspective of industrial organization that one of the main drivers of differences in
productivity is differences in knowledge. We examine a new data set of several thousand U.K.
enterprises covering all industries from 1994 through 200. For each enterprise we have multiple
detailed measures of knowledge outputs, knowledge investments, and sources of existing knowledge.
We find that globally engaged firms do innovate more. But this is not just because globally engaged
firms use more researchers. It is also because they learn more from more sources such as suppliers
and customers, universities, and their intra-firm worldwide pool of information. We also find that
the relative importance of knowledge sources varies systematically with the type of innovation.
Chiara CriscuoloDepartment of EconomicsUniversity College LondonGower StreetLondon WC1E 6BTUNITED [email protected]
Jonathan E. HaskelDepartment of EconomicsQueen Mary, University of LondonMile End RoadLondon E1 4NSUNITED [email protected]
Matthew J. SlaughterTuck School of BusinessDartmouth College100 Tuck HallHanover, NH 03755and [email protected]

1
1. Introduction
There is now a large body of evidence for many countries that plants and/or firms exhibit
substantial and persistent heterogeneity in total factor productivity and related performance.1 In
recent years researchers have also documented a robust correlation between productivity and
global engagement: plants and/or firms that export or, even more so, are part of a multinational
enterprise tend to have higher productivity than their purely domestic counterparts.2 A very
active research area is currently attempting to better understand heterogeneous productivity and,
in particular, this correlation between global engagement and productivity.3
Our goal is to contribute to the ongoing effort to better understand these productivity
differences and the productivity advantage of globally engaged firms. We do so not by studying
TFP differences, but rather by studying knowledge differences. This incorporates the
perspective of industrial organization that one of the main drivers of differences in TFP is
differences in knowledge. To do this systematically, we use the “knowledge production
function” (KPF) framework (e.g., Griliches, 1979), which suggests that output of new knowledge
depends on two inputs: (1) investment in discovering new knowledge—e.g., research and
1 In their survey of micro-level studies of productivity, Bartelsman and Doms (2002, p. 578) state that, “Of the basic findings related to productivity and productivity growth uncovered by recent research using micro data, perhaps most significant is the degree of heterogeneity across establishments and firms in productivity in nearly all industries examined.” This heterogeneity in productivity and other characteristics (e.g., size) appears in both developed countries (e.g., Olley and Pakes, 1996, and Syverson, 2004 for the United States) and developing countries as well (e.g., Cabral and Mata, 2003, for Portugal). 2 Superior productivity of exporters is documented in, e.g., Bernard and Jensen (1995). Multinationals exhibit even higher productivity than exporters: e.g., Doms and Jensen (1998) and Criscuolo and Martin (2003) for U.S. and U.K. data, respectively. 3 A variety of new general-equilibrium models assume high productivity leads to global engagement. For example, a now standard trade framework of multinational firms (Markusen, 2002, which builds on Dunning’s “OLI” framework) assumes these firms obtain high-productivity knowledge assets that are transferred from home-country parents to host-country affiliates. Bernard, Eaton, Jensen, and Kortum (2003); Melitz (2003); and Helpman, Melitz, and Yeaple (2004) model heterogeneity in productivity due to exogenous draws. Firms with better draws can cover the costs of entering export markets or, if especially good, the even higher costs of becoming a multinational by establishing a foreign affiliate. The empirical evidence on global engagement and productivity is currently quite mixed. Some studies have asked whether highly productive firms select into export markets or whether exporting boosts productivity through channels such as learning from foreign markets. Examples include Bernard and Jensen (1999) for the United States and Clerides, Lach, and Tybout (1998) for a number of developing countries. There are also many studies of import competition and productivity; Trefler (2004) is a recent example. For many of these issues, see Tybout (2000) for a useful survey. For multinationals, different studies have reached different conclusions about the productivity advantage of globally engaged firms. See, e.g., Aitken and Harrison (1999) and Smarzynska Javorcik (2004), and also case studies in Hanson (2000) and Moran (2001).
2
development, and (2) the flows of ideas from the existing knowledge stock—i.e., the knowledge
base upon which to innovate. A large IO literature has used this framework to ask, e.g., how
firms learn from existing knowledge, either inside or outside the firm and also either via market
transactions or spillovers.4
In this paper we estimate the KPF on a new data set of several thousand U.K. enterprises
across all industries from 1994 through 2000. These come from two U.K. waves of the EU-wide
Community Innovations Survey.5 Each enterprise reports detailed measures of knowledge
outputs, investments in new knowledge, and flows of ideas from the existing knowledge stock.
Thus, these data are very well-suited to the KPF framework. Into the CIS data we have merged
indicators of global engagement, such that we can identify multinationals (U.K. parents and also
U.K. affiliates of foreign parents), non-multinational exporters, and purely domestic firms.
With these data we can answer three questions. First, do globally engaged firms innovate
more than domestic firms do? Second, how do differences in innovation outputs correlate with
R&D effort or learning from the knowledge of others? Third, what are the most important
information flows that firms rely on for innovations—e.g., within firms themselves, up and down
the supply chain, market competitors? Our ultimate goal is to inform work on productivity
dispersion by providing new evidence on knowledge dispersion and, in particular, on the role of
global engagement.
For innovation outputs we have two groups of measures. One is patents, the measure that
predominates in IO studies. In addition, we also have much broader measures of innovation
4 The KPF literature is very deep and broad. Surveys include Griliches (1990); Griliches (1998), including chapter 11 on spillovers; and Jaffe and Trajtenberg (2002). The KPF is also a key ingredient in many macro growth models, where existing knowledge is often assumed to be a public good equally available to all agents worldwide and the rate of steady-state growth in output of goods and services hinges crucially upon the degree of returns to scale of the KPF inputs. For an overview, see Jones (2004). Klette (1996) suggests that the KPF was first formalized by Uzawa (1969).

3
output, such as the value of sales of products new to the firm and also indicators of any process
or product innovation. These broader measures are of interest for two reasons.
One reason is that frontier innovations need not be patented. Many IO studies have
acknowledged both that not all innovations are patentable and also that not all patentable
innovations are chosen to be patented (patenting is just one of many forms of protecting
intellectual property).6 The other reason is that, given the big productivity dispersion that frames
this paper, for nearly all firms innovations are movements towards—not movements of—the
world frontier of knowledge (where patented innovations are more likely to feature).7 Indeed,
for many firms innovation is often described as the adoption of earlier frontier innovations. Our
measures of innovation output can allow insight into the broader set of all innovation activity,
frontier and otherwise.
For innovation inputs, our measures of sources of existing knowledge are also valuable:
enterprises report their use and degree of importance of a wide range of both internal and
external sources: e.g., elsewhere in the broader enterprise group; customers and suppliers; and
universities. Measurement challenges have been noted here as well. Some studies build measures
from patent citations. These involve frontier innovations, by construction, and so like patents
might not capture the full set of innovative activities.8 Other studies try indirect measures where
knowledge flows are assumed, such as industry R&D or business transactions with suppliers,
5 Few studies have used the CIS, versions of which have been carried out in different European countries. Cassiman and Veugelers (2002) examine the determinants of research cooperation among Belgian firms. Mariesse and Mohnen (2002) discuss the value of the multiple knowledge-output measures in CIS surveys. 6 For example, Pakes and Griliches (1980, p. 378) comment that, “patents are flawed measures (of innovations); particularly since not all new innovations are patented and since patents differ greatly in their economic impact.” Additional discussion of the limits of patent data can be found in Griliches (1998) and Jaffe and Trajtenberg (2002, p.3): “There are, of course, important limitations to the use of patent data, the most glaring being the fact that not all inventions are patented … Exploring the extent to which patents are indeed representative of the wider universe of innovations is an important, wide-open area for research.” 7 The importance of non-patented innovations for the large majority of firms is demonstrated by the fact that patent activity is tremendously concentrated in very few firms. For example, Bloom and Van Reenen (2002) report that in their sample of 59,919 U.K. firms, just 12 companies accounted for 72% of all patents. Patenting in our data is similarly skewed.

4
customers, or competitors. Indirect measures may resonate with anecdotal evidence (note 3) but
their assumptions may not be warranted. This problem may be particularly acute for the flow of
ideas within firms, especially multinationals for which such flows are assumed central. Our
measures of sources of existing knowledge can complement these commonly used alternatives.
To fix ideas about our data’s potential value, consider Southwest Airlines. It is widely
regarded as having introduced many frontier innovations, such as boarding passengers by broad
group without assigned seats. Southwest did not patent its frontier innovations, but they have
still driven its success.9 In turn, many airlines have since implemented Southwest’s practices—
innovations for these other airlines, but inside rather than on the frontier of world knowledge.
And many of these non-frontier innovations have come from knowledge flows to other airlines—
ranging from simply watching Southwest across concourse gates to flying on its planes to
attending “best practice” meetings convened by Southwest itself at its Dallas headquarters.10
Our data have been designed to measure just these types of innovations and knowledge
flows. Of course, because these data are self-reported and mainly qualitative, they raise a set of
important measurement and estimation issues that we address in several ways. For example, we
8 Jaffe and Trajtenberg (2002) discuss their research showing that half of all citations do not correspond to any perceived communication or to a perceptible technological relationship between the two inventions. They also report that a sizable share of citations is typically entered by patent-office examiners rather than inventors. 9 Other frontier innovations have included single-class service, frequent-flyer programs, and a single operating platform (i.e., just Boeing 737s). After just two years of losses subsequent to its 1971 founding, Southwest has been profitable every year since 1973, a string unmatched by any other airline. Throughout these decades Southwest has consistently achieved the lowest average cost per seat-mile among all U.S. carriers, often by a sizable gap. Its total stock-market return since founding has been the highest among all S&P 500 companies during that time. This information is drawn from the detailed discussion in Heskett (2003). 10 “In the 1990s other airlines around the world began to model their strategies around Southwest’s, often after a visit by their managements to Dallas. The most successful of these included RyanAir, Easy Jet, and Go in Europe as well as Air Asia in the Far East” (Heskett, 2003, p. 5). McGinn (2004) writes, “Like many start-ups, Ryanair took a few years to get off the ground … That began changing in 1991, when [now-CEO Michael] O’Leary, an accountant, visited Southwest’s headquarters in Dallas … At the time, Southwest was already garnering accolades as the industry’s big innovator … O’Leary liked what he saw … Flying back to Ireland after a few days with Southwest, O’Leary laid plans to replicate the strategy.” Indeed, Southwest’s openness extended to all industries: “management was so proud of its employees’ culture that it periodically hosted ‘best practice’ teams from all industries that wanted to discuss hiring, training, and employee relations” (Heskett, 2003, pp. 4-5). In turn, at key stages Southwest itself developed key innovations by learning from others: “To improve turnaround of its aircraft at airports, Southwest sent observers to the Indianapolis 500 to watch pit crews fuel and service race cars. The airline recognized that pit crews performed, in a different industry and at much faster speeds, the same functions as airplane maintenance crews. New ideas about equipment fittings, materials management, teamwork, and speed subsequently contributed to a 50% reduction in the airline’s turnaround time” (Frei, 2004, p. 2).

5
check our survey data against administrative records and show that our data replicate many
patterns of patenting and R&D activity documented elsewhere.
Our analysis yields the following answers to the three key questions above. First, globally
engaged firms do generate more innovation outputs. Over the 1998-2000 period just 18% of
domestic firms report either product or process innovation, with an average of just 0.10 patents
applied; but 45% of multinational parents report either product or process innovation, with an
average of 10 patents applied for.
Second, this greater creation of new knowledge is not just because globally engaged firms
use more researchers. It is also because they learn more from more sources such as suppliers and
customers, universities, and their intra-firm worldwide pool of information. Our econometric
analysis allows us to calculate that the majority of the innovation-output advantage of globally
engaged firms is accounted for by their greater use of the different inputs in our data, with only a
minority left explained by global engagement per se.
Third, we also find that the relative importance of these knowledge sources varies
systematically with the type of innovation. For patents, information flows from universities are
important, while flows from customers and suppliers are not. For broader process or product
innovations, the reverse is true. Previous case-study literature has studied many different sources
of knowledge; ours is the first study we are aware of to offer econometric evidence linking
different sources with different innovations.
Taken together, our findings also help explain the correlation between productivity and
global engagement. Globally engaged firms generate more of the innovations that feed into
higher productivity, in large part because these firms learn more from a wider range of sources
(rather than they just employ more knowledge workers).

6
Our paper has five additional sections. In section 2 we briefly present the KPF that will
guide our empirical work. Section 3 presents our data and some motivating summary statistics.
Section 4 discusses econometric specifications, Section 5 estimation results. Section 6 concludes.
2. A Theoretical Framework of Knowledge Production
Like a production function for goods and services, the innovation production function relates
inputs into the innovation process to outputs. Following Griliches (1979), Romer (1990), and
others, it can be written as follows (for initial expositional simplicity, in Cobb-Douglas form).
φλ=∆ iii KHK (1)
where ∆A is the change in knowledge stock—i.e., the creation of new ideas; K is the existing
stock of knowledge from which ideas can be gleaned; and H is investment in the process of
knowledge creation—e.g., the human capital of R&D scientists. I is used to index variously
countries, industries, or firms; for our study, it will index firms within the United Kingdom. The
parameters λ and φ indicate the elasticity of new ideas with respect to knowledge investment and
ideas from the stock of existing knowledge.
Equation (1) makes important assumptions about mechanisms and functional form. First,
increases in knowledge depend on the knowledge stock researchers have to work with and also
on the number of researchers. If φ is positive, then scientists are more productive the more has
already been learned: the “standing on shoulders” effect. Alternatively, if φ is negative, then as
new ideas are discovered subsequent ideas are harder to come by. Second, subscripting K in (1)
means that different agents have different access to the existing knowledge stock. As discussed
in the introduction (note 4), some work has instead assumed a single worldwide stock of
knowledge to which all have equal access. Third, equation (1) makes no assumptions about the
degrees of returns to A or H. Many key papers in the growth literature have assumed constant

7
returns to both A and H (i.e., that both λ and φ equal 1). This assumption has been much
debated, because if φ equal 1 then in many models the long-run rate of growth varies with the
number of researchers, which government policy can presumably influence.
Much earlier work using the KPF has distinguished information flows within versus across
firms. To highlight this distinction, we can usefully (and more generally) rewrite (1) as
)K,K,H(fK i_iiiii =∆ (2)
where Kii and Ki_i indicate the flow of ideas to firm i from within and outside that firm,
respectively. Firms can learn from their earlier internal R&D activities; they can also learn from
various external sources. A related issue is that each idea might not be equally important to all
firms. Consider, for example, the stock of knowledge at an industry trade fair. Different firms
learn different ideas from the fair’s exhibition booths, because not all ideas are equally important
to all firms for reasons such as their different innovation histories. Thus, as is well known we
wish to measure not just the flow of existing ideas but also the variance across firms in the
importance of that flow. As will be discussed, we think our data capture both these concepts.
Equation (2) presents us with several alternative specifications that we will estimate. For
example, estimating (2) with just our global-engagement indicators (plus any other appropriate
controls not in (2)—e.g., industry dummies, see below) summarizes whether globally engaged
firms generate more knowledge output than do purely domestic firms. If they do, this might
reflect just greater investments in Hi. Estimating (2) with the global engagement indicators plus
Hi will examine the hypothesis that globally engaged firms enjoy greater flows of ideas from
existing stocks of knowledge. With the richness of our data, we can then add direct measures of
these knowledge flows to see what residual variation, if any, is explained by global engagement.

8
3. Data Description and Summary Statistics
3.1 Data Description
The U.K. CIS is part of an EU-wide survey that asks business enterprises to report innovation
outputs; innovation inputs; and sources of knowledge for innovation efforts. There have been
three waves of U.K. CIS surveys: CIS1 (covering 1991-3), CIS2 (1994-6) and CIS3 (1998-
2000). CIS1 is largely unusable due to a response rate of barely 10%.
The CIS survey covers both the production and the service sectors. CIS3 was in the field
twice: the first wave sampled 13,340 enterprises, and the second covered 6,285 to make the
sample representative at the regional level. Of the total 19,625 enterprises to which the survey
was sent, 8,172 responded (3,605 in services and 4,567 in production), for an overall response
rate of 42%. CIS2 sampled only about one quarter as many firms, and the two contain only 787
firms in common. Despite these limitations of CIS2, we use it with CIS3 as much as possible.11
The CIS measures only one dimension of global engagement: whether and how much firms
exported in 1998 and again 2000. Accordingly, we merged in nationality of ownership data from
the Annual Inquiry into Foreign Direct Investment and the Annual Respondents Database. The
AFDI is an annual survey of the detailed financial flows between UK enterprises and their
overseas parents or subsidiaries. It measures outward FDI by U.K. parents and also FDI into the
U.K. by foreign-owned firms. For the AFDI, ONS uses a variety of sources to maintain a
register on country of ownership of each enterprise and on which U.K. enterprises have foreign
subsidiaries. The ARD provides an alternative source of information on affiliates of foreign-
owned firms; the underlying source is Dun & Bradstreet Global "Who Owns Whom" database.
11 ONS selects survey recipients by creating a stratified sample of firms with more than 10 employees drawn from the Inter-Departmental Business Register by SIC92 two-digit classes and eight employment-size bands. Production includes manufacturing; mining; electricity, gas and water; and construction. Services includes wholesale trade; transport, storage, and communication; and financial intermediation and real estate.

9
By merging AFDI and ARD data into the CIS, we created four categories of global
engagement: Multinational Parent; Multinational Affiliate; non-multinational enterprises that
are Exporters; and purely domestic enterprises that neither export nor are multinational.12
Our CIS survey data are self-reported and mainly qualitative. As such, they raise a set of
measurement issues—administration, non-response, and response accuracy—that will be very
important to address before turning to our summary statistics and estimation results.
One general issue with survey data is the method and quality of administration. The CIS is
an official Department of Trade and Industry (DTI) survey administered by the Office of
National Statistics (ONS), which has a long history of such work. The first page is a letter from
a senior DTI official (plus contact information) requesting data; this explicit government
involvement is likely to raise response quality and quantity. It is also important that this survey
was administered by post, rather than face-to-face or by telephone. Bertrand and Mullainathan
(2001) discuss many well-known problems with survey interviews that do not arise here.13
A second issue is possible non-response bias in our sample. ONS addressed this by sending
two follow-up CIS questionnaires after the initial mailing, and then by telephoning remaining
non-respondents. At the close of the sampling period ONS also conducted a special telephone
sub-survey on a group of non-respondents; ONS found no significant difference in innovative
activity between this group and respondents. We performed an additional check on non-response
12 AFDI and ARD methods differ in two potentially important respects: AFDI tracks nationality of direct owners using a threshold of 10%; ARD tracks nationality of ultimate owners using a threshold of 50%. In principle, these different methods can yield different answers as to whether a U.K. firm is foreign owned, and, if so, by a firm in what country. In practice, our data have very few such discrepancies: only about two dozen firms are classified as foreign owned by AFDI but not by ARD. We chose the AFDI categorization in these cases, both to maximize the number of foreign-owned observations and because the 10% ownership criterion is used by statistical agencies in many countries (e.g., the U.S. Bureau of Economic Analysis). Consistent with cross-border chains of ownership in large multinationals, there was also a very small number of enterprises classified as both U.K. parent in the AFDI data and also U.K. affiliate in the ARD data. To maximize our number of U.K. parents we placed these firms in the U.K.-parent category. Our results below were robust to the alternative of placing them in the U.K.-affiliate group. 13 One is recall bias: in interviews respondents often worry about taking too long and thus in haste recall information incorrectly. Another is embarrassment bias: in interviews respondents often lie to avoid possibly embarrassing responses. These sorts of concerns do not apply to CIS postal surveys insofar as individuals respond without immediate time constraints and arm’s length.

10
using the CIS sampling frames and matching it with Business Register data (see note 13). We
found non-respondents to be larger than respondents, on average. In our regressions below, we
therefore control for size (with employment; results were the same using sales).
In terms of response accuracy, an important issue is that the CIS survey was conducted at the
enterprise level; where enterprise is defined as “the smallest combinations of legal units which
have a certain degree of autonomy within an enterprise group.” Thus, an enterprise is roughly a
firm, where each firm can have more than one business establishment (i.e., legal unit) and can
also be part of a larger multi-enterprise business entity (i.e., group). For our interest in globally
engaged firms, by definition any U.K. enterprise that is part of a multinational firm has at least
one other enterprise somewhere in the world in its enterprise group. One might worry about
reporting error due to respondents not answering at the desired enterprise level. We were able to
identify small numbers of such probable cases through data checking and cleaning; our results
appear to be robust to alternative treatments of this issue.14
3.2 Summary Statistics
Our CIS3 benchmark sample of 7,385 enterprises consists of 577 multinational parents (7.8%
of the sample); 653 multinational affiliates (8.8%); 1,776 non-multinational exporters (24.0%);
and 4,379 purely domestic enterprises (59.3%). In turn, for our summary statistics we split the
domestic enterprises into 778 who were part of a broader enterprise group and 3,601 who were
singletons. This split is to ensure that our findings for multinationals, which by definition are
14 Robustness checks included checking CIS-reported employment against the “true” enterprise employment reported in the underlying business register (though the two sources can differ due to different sampling times in each year, results are robust to deleting observations for a range of divergence criteria such as 50%), and leaving in the sample only single-plant firms (misunderstanding can arise only for multi-plant firms and/or firms that are part of an enterprise group). The CIS questionnaire gave respondents detailed definitions and many examples of “enterprise” and “enterprise group.” More generally, to improve data quality the questionnaire gave similar definitions and examples for many key data items, such as process and product innovations. One check on this was that respondents were asked to report in longhand their “most important product or process”. The long-hand response rates were only about 30%, but our casual sampling of these responses relative to the guidelines provided indicated that enterprises were reporting technological innovations as intended by the survey. We also found very similar estimation results between this 30% sub-sample and the full sample (see Section 4).

11
part of an enterprise group, are particular to their cross-border structure rather than to enterprise
groups of all kinds—both cross-border and domestic.
Consistent with many of the studies cited in the introduction, in our sample there are basic
performance differences across these four groups. For example, mean size (either sales or
employment) and capital intensity are highest for parents, then affiliates, then exporters, and
finally purely domestics. The same ordering also applies for the fraction of enterprises that have
more than one establishment within the U.K. There are also differences in the industry and
regional distribution of firm types. These sorts of performance differences will be accounted for
in our econometric analysis, but not our simple summary statistics.
Table 1 presents means and standard deviations or medians (as reported in the notes) on
innovation outputs, inputs, and flows for our entire sample of enterprises and also our four sub-
samples by global engagement. There are three important messages from Table 1, each of which
appears in one of the panels.
First, globally engaged enterprises create substantially more new ideas than do both groups
of domestic enterprises. Our broadest and thus benchmark measure of knowledge output is
Innovate, an indicator variable equal to one if enterprises undertook any process or product
innovation. The Appendix Table reports the exact survey question for these two parts of
Innovate, as well as for all the other variables in Table 1. Over 40% of all multinationals and
38% of all exporters report having innovated. In contrast, only 21 % and 18% of the two classes
of domestic enterprises report innovating. A similar contrast appears for all other measures of
knowledge output. Column 2 shows a similar pattern for Patent Protect, a binary variable equal
to one if the enterprise either applying for new patents during 1998-2000 or using existing
patents to protect its innovations. In column 3 the knowledge measure is Novel Sales, the value

12
(in thousands of pounds) of enterprise sales in 2000 accounted for by new and improved
products. Column 4 again shows a similar pattern for the number of new patents applied for over
the 1998-2000 period, Patents.15 Many of the two-way differences (for brevity, not reported) we
found to be statistically significant. For example, for all four innovation measures multinational
parents create more knowledge than do domestic enterprises.
We note that for all sub-samples and all knowledge measures, the median enterprise reports
no knowledge output. That said, the distribution of innovation is far less skewed for our broader
measures than for Patents. For example, the number of all enterprises reporting “yes” for
Innovate is nearly twice the number that have some patent protection, and about four and a half
times the number that applied for new patents. As discussed earlier, we think one of the merits
of our study is its span of innovation measures that encompasses not just the frontier innovations
captured by the commonly used counts of patents but also broader non-frontier innovations that
characterize the activity of most firms.
The second important message of Table 1 is that globally engaged enterprises use more
inputs for making new ideas. Column 1 of Table 1b shows this for R&D Personnel, the number
of enterprise workers involved in R&D activities in 2000. Of course, more R&D workers at
globally engaged enterprises may just reflect larger overall scale, which we will control for
econometrically. As a shorthand control, column 2 reports % R&D Personnel, the share of
enterprise employment in 2000 accounted for by R&D workers. The same pattern applies: this
share is three to four times greater for globally engaged enterprises.
Innovative activity is often thought of as the domain of workers in science and engineering
occupations. This may be true for some enterprises and sectors, but is likely false for others in
15 Note that Patent Protect we regard to be a broader output measure than Patents. Given that many enterprises generate patentable innovations infrequently, an enterprise might protect exiting patents—and thus be considered innovative—even if it

13
our data. In particular, innovation in many services sectors such as finance and retail trade is
likely performed by non-science, non-engineering occupations. Despite this preference for using
R&D personnel as our “headcount” measure of innovation inputs, column 3 reports % Scientists,
the share of enterprise employment accounted for by degree-level or above workers in science
and engineering subjects. This is not quite the same as science and engineering occupations (as
workers in these occupations could have different educational backgrounds, and/or workers with
such education need not work in those occupations). That said, the same pattern appears here as
for share of R&D workers: for all three categories of globally engaged enterprises about 10% of
workers have science or engineering degrees, versus just about 4% for domestics.
The last column of Table 1b reports Intramural R&D, the value of R&D performed by the
enterprise in 2000, in thousands of pounds. This measure of knowledge inputs captures not just
expenditures on personnel but also on the complementary capital (see Appendix Table).
Multinational enterprises average well over £1 million, versus under £100,000 for exporters and
purely domestic firms. As with Table 1a, many of the two-way differences (for brevity, not
reported) we found to be statistically significant. For example, for all four measures both
multinational parents and affiliates use more knowledge inputs than do domestic enterprises.
The production-function framework motivating our analysis suggests that some—or perhaps
all?—of the variation in knowledge outputs in Table 1a can be accounted for by variation in
knowledge inputs in Table 1b. Table 1c suggests that this is not the whole story. Here we report
both where enterprises learn information for innovation and how important these sources are.
For each of the information categories across Table 1c, each enterprise was asked to report
whether any information from this source was used in its innovative activities and, if so, whether
the importance of this source was low, medium, or high. We translated these qualitative
did not recently apply for new patents.

14
responses into a categorical variable of values 0, 1/3, 2/3, and 1 going from no information to
information of high importance. Mean (and median) responses are reported.
The first two columns of Table 1c cover information internal to the enterprise itself (Internal
Self) and information internal to the enterprise’s broader enterprise group (Internal Group). By
definition, any enterprise that is part of a multinational has a broader enterprise group elsewhere
in the world. For Internal Self and Internal Group, globally engaged enterprises report much
higher mean (and median) importance. For Internal Group it is also very notable that the mean
value for affiliates is statistically significantly higher than that for parents. This is consistent
with the now-standard knowledge-capital model of multinationals in international trade, which
assumes that knowledge is created predominantly by parents and that intra-firm knowledge flows
are mainly from parents transferring knowledge and related assets to affiliates.
Looking across all columns of Table 1c shows the same pattern of globally engaged
enterprises learning more than do their domestic counterparts. Indeed, the medians across all
columns are striking. The median globally engaged firm learns at least something from five
information sources, whereas the median purely-domestic firm, whether single- or multi-
enterprise, learns nothing from all six.
We conclude from Table 1 that firms differ along all three dimensions of the knowledge
production function: knowledge outputs, knowledge investment, and access to flows from
existing knowledge. This last difference contradicts the assumption of some macro literature
discussed earlier that all firms have equal access to the same flows of knowledge.16 It suggests
that in estimating knowledge production functions, it will be important to include these flows.17
16 With a single world knowledge stock and a Cobb-Douglas formulation for equation (1), all knowledge workers should have the same average labor productivity (adjusted as needed for λ; see Jones, 2004). To examine this in our data, for each of our four groups of globally engaged firms we calculated the average number of patents per R&D worker. This average differs across the four groups, with globally engaged firms having more patents per knowledge worker (e.g., 0.65 for parents vs. 0.18 for domestics). This pattern is inconsistent with all firms having access to the same flows of existing ideas, and it is robust to

15
4. Econometric Strategy and Estimation Issues
The literature on estimating the knowledge production function is deep and broad (see note
4), and as such has considered a number of important estimation issues including measurement
error and endogeneity. Novel features of our data—its many measures of inputs and outputs, and
its self-reported and mainly qualitative nature—raise additional issues. In this section we first
discuss these estimation issues in general, and we then map out specific estimation strategies for
each of our four measures of knowledge output.
4.1 Measurement Issues in Estimating the Knowledge Production Function on Our Data
Griliches and Pakes (1980) first proposed thinking about KPF estimation in measurement-
error form, a framework that has been widely used. We follow this approach, with additional
discussion drawing on Bertrand and Mullainathan’s (2001) insights on measurement and
estimation issues particular to subjective survey data. For expositional simplicity consider a
linearized version of the KPF of equation (2), where stars denote true values of variables.
1 2 2 _* * * *i i i i iK H K Kα α α ε′ ′∆ = + + + (3)
Start with possible measurement error in the regressand of the following general form,
1 1*i i i iK K Xβ ε∆ = ∆ + + (4)
where X is a vector of variables that might influence the relation between observed and true
innovation, ∆Ki and ∆K*i, and ε1i is a random error. In the classical measurement-error model,
alternative methods for calculating each group’s average productivity (summing Patents across all firms and then dividing by the number of firms vs. calculating the productivity per firm and then averaging these productivities across all firms; if λ is assumed to be < 1 then the differences become even larger). 17 One additional summary check was to see if our data were consistent with the stylized facts relating patenting and R&D set out in Klette and Kortum (2004). We replicated several of their stylized facts. Patents vary proportionally with R&D across firms (Stylized Fact #2: a regression of Patents on R&D Personnel (and industry dummies) returned a t-statistics of 55.9). R&D intensity is independent of firm size (Stylized Fact #3: a regression of R&D per worker on total employment (and industry dummies) returned a t-statistic of just over 1). The distribution of R&D intensity is highly skewed (Stylized Fact #4: 74% of our enterprises report doing no R&D).

16
X is null. It has long been recognized that available measures of innovation—in particular,
patents—may be incomplete measures of ∆K*i (see Section 1). If the extent to which
innovations are measured depends on components of X that in theory are also regressors in
equation (3) (e.g., firm size or R&D effort), then regressing (3) using ∆Ki as the regressand will
yield biased estimates for the parameters of interest in (3). Biased estimates on these parameters
will also result from that same specification even if components of X are not regressors in the
KPF but are nevertheless correlated with these regressors.18
For our data, we have four rejoinders to concerns about regressand measurement error. First,
having measures of innovation that are broader than just patents may lessen any gap between ∆Ki
and ∆K*i. As discussed earlier, many researchers have acknowledged that data on patents,
though very valuable, do not capture the full range of innovations—in particular, the many non-
frontier innovations for the large majority of firms inside the productivity frontier.
Second, it is important to note that our Patents variable differs slightly from what is
commonly used: patents applied for by the enterprise, not granted to the enterprise. To check
this, as discussed earlier (e.g., notes 7 and 17) we confirmed that our patents data replicate many
patterns and correlations documented elsewhere. This suggests our measure of patents is not
more prone to measurement-error concerns.
Third, the richness of our data allows us to control for many possible biases from omitting X
from KPF specifications. For example, ∆K*i is in theory disembodied additions to the stock of
knowledge. But in reality, when deciding on responses to Innovate firms might consider whether
they have recently installed new machines with embodied knowledge. In this case, in equation
18 Suppose that X=H*. Then in the first case, an OLS estimate of (3) using ∆Ki as the regressand will yield a coefficient on H* not of α but rather of (α+β). Alternatively, if X does not contain any regressors of (3), this same OLS estimate of (3) using ∆Ki as the regressand will yield a biased coefficient estimate of α on H* unless X is orthogonal to all regressors in (3).

17
(4) X would include new machinery investment, and this regressor should be included in any
KPF estimation using Innovate. Our results reported below are robust to using a wide range of
plausible X controls such as this, firm age, and recent firm transitions (e.g., start-ups).
Fourth, Bertrand and Mullainathan (2001) emphasize that survey data may be so question-
and context-dependent as to be uncorrelated with true underlying quantities of interest (e.g.,
happiness). For our broadest measure of knowledge output, Innovate, this possibility (i.e., that
ε1i predominates) might be a concern. Two data checks allay this concern. One is work finding
that Innovate is correlated with productivity performance, consistent with theory.19 The other
was to separate all positive responders to Innovate into the sub-samples of them that did or did
not comply with the survey request to describe long-hand their most important innovation.
Analyses for these two sub-groups were very similar (e.g., estimating for each the KPF using
Novel Sales), which suggests variation in Innovate is not dominated by survey noise.
We now turn to possible measurement error in our key regressors in equation (3). To address
possible bias from any particular measure of H*, investment in the effort of knowledge creation,
we verified that findings are robust to the many alternatives presented in our data (see Table 1b).
As discussed earlier (e.g., notes 7 and 17) and as will be discussed further in the estimation
results, we also established that our H* measures data display patterns and correlations
documented elsewhere. This suggests our measures of innovation efforts are not unusually prone
to measurement-error concerns.
Possible problems with measuring flows of knowledge are well known. Some studies simply
omit these flows altogether. Others have used indirect measures, many based on the assumption
19 For manufacturing enterprises, Criscuolo (2004) matched the CIS to the U.K. Annual Business Inquiry (the official business survey on outputs and inputs). From the ABI data she calculated TFP growth, which she then correlated with CIS self-reports of innovation. Product innovations were positively and significantly related to TFP performance. Novel process innovations were negatively and significantly related to TFP performance, consistent with the adjustment-costs literature that new process innovations initially lower TFP growth and subsequently raise it only with the appropriate organizational change.

18
that knowledge flows from strong TFP performance in “adjacent” activity—i.e., that of other
parts of a business, or of upstream or downstream businesses. As is well known, however,
problems here include the simple competitive fact that strong TFP performers may actively
discourage the flow of related knowledge to other businesses.
A widely used direct measure of knowledge flows in the patents literature is importance-
weighted patent citations. Error here may arise from omitting non-patent sources of knowledge.
It may also arise from “spurious” citations: Jaffe and Trajtenberg (2002) report that half of all
citations do not correspond to any perceived communication or to a perceptible technological
relationship between the two inventions. Other studies have highlighted a wide range of
mechanisms for knowledge flows other than citations, such as transfers inside multinational
firms (via employee travel, conversation, correspondence) or in the contracting structure
(technical details, quality) between suppliers and customers.20
Our data on knowledge flows have three important virtues: they are direct, not indirect; they
are importance-weighted; and they span a comprehensive set of sources. Against these strengths,
however, may be concerns about measurement error due to their being self-reported surveys.
First, it might be argued that quantitative data would be preferable to our qualitative data.
Again, the case-study literature has documented a vast array of mechanisms by which knowledge
is transferred within and across firms. Quantitative measures of these mechanisms would require
not only choosing metrics (e.g., number and length of phone calls, emails, and contracts;
consultants hired; trade shows attended; industry-periodical subscriptions) but also weighting
these metrics for importance (e.g., to separate high-impact phone calls from mundane ones). We
20 Studies here include examinations of learning and knowledge flows within multinational firms in Blonigen (1997), Branstetter (2001), and Griffith, Harrison, and van Reenen (2004). Mansfield and Romero (1980) and Gupta and Govindarajan (2000) conducted small surveys of multinationals; sampled firms report that transferring knowledge internally is very important for overall firm success. For additional case-study evidence, see Hanson (2000) and Moran (2001).

19
know of no such quantitative data sources, and point out that this weighting is precisely what our
data are designed to capture.
That said, we acknowledge that our measures of knowledge flows are self-reported surveys
and thus inherently subjective. To examine this issue we undertook a number of robustness
checks. First, as discussed in Section 3 we checked that reported values accord with theoretical
priors: e.g., that multinational affiliates report learning more from elsewhere in the enterprise
group than do multinational parents, consistent with the now-standard knowledge-capital model
of multinationals in international trade.21
Second, we verified that our main estimation results are robust to replacing our intensity-of-
knowledge measures with simpler binary measures of whether a particular information flow was
used at all. This should address concern that firms can accurately report whether a given
knowledge source was used or not but that firms cannot accurately gauge its importance (and/or
that we cannot meaningfully compare importance across respondents).
Third, following Cassiman and Veuglers (2002) and earlier work they cite, as an additional
control regressor for KPF estimation we add industry averages of flows of information.
Identifying variation of key parameters in equation (3) is then deviation from industry means,
means which may reflect underlying technological fecundity or norms. Other enterprise-level
control regressors we use, including firm size, age, and start-up status, may similarly control for
differences in information reporting at the enterprise level (e.g., start-ups are by nature more
likely to be aware of learning). For some specifications we also include firm fixed effects, which
can capture any unobserved such differences.
21 More generally, see the data discussion in Section 3.1 on why many of the concerns about survey data raised by Bertrand and Mullainathan (2001) are unlikely to apply to our data.
20
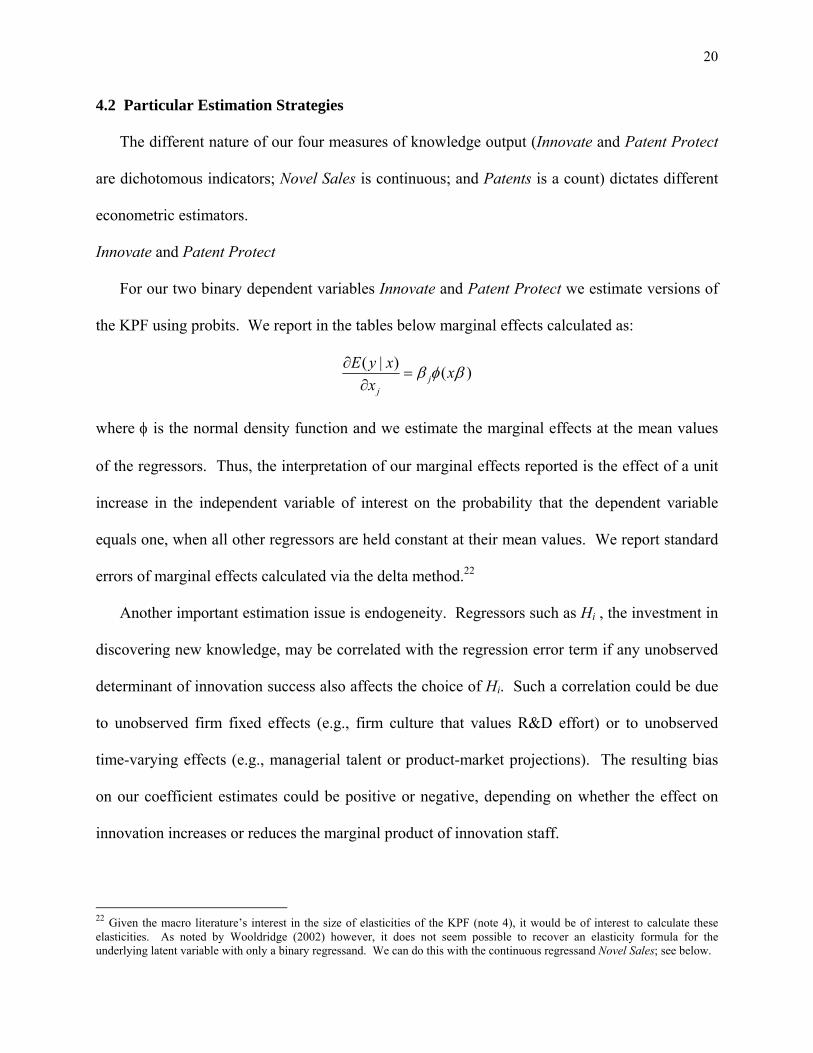
4.2 Particular Estimation Strategies
The different nature of our four measures of knowledge output (Innovate and Patent Protect
are dichotomous indicators; Novel Sales is continuous; and Patents is a count) dictates different
econometric estimators.
Innovate and Patent Protect
For our two binary dependent variables Innovate and Patent Protect we estimate versions of
the KPF using probits. We report in the tables below marginal effects calculated as:
( | ) ( )jj
E y x xx
β φ β∂=
∂
where φ is the normal density function and we estimate the marginal effects at the mean values
of the regressors. Thus, the interpretation of our marginal effects reported is the effect of a unit
increase in the independent variable of interest on the probability that the dependent variable
equals one, when all other regressors are held constant at their mean values. We report standard
errors of marginal effects calculated via the delta method.22
Another important estimation issue is endogeneity. Regressors such as Hi , the investment in
discovering new knowledge, may be correlated with the regression error term if any unobserved
determinant of innovation success also affects the choice of Hi. Such a correlation could be due
to unobserved firm fixed effects (e.g., firm culture that values R&D effort) or to unobserved
time-varying effects (e.g., managerial talent or product-market projections). The resulting bias
on our coefficient estimates could be positive or negative, depending on whether the effect on
innovation increases or reduces the marginal product of innovation staff.
22 Given the macro literature’s interest in the size of elasticities of the KPF (note 4), it would be of interest to calculate these elasticities. As noted by Wooldridge (2002) however, it does not seem possible to recover an elasticity formula for the underlying latent variable with only a binary regressand. We can do this with the continuous regressand Novel Sales; see below.

21
All our regressions are estimated with a common set of controls, in particular industry
dummies that will control for any fixed effects common within industries. Our global-
engagement regressors may also proxy for unobserved firm effects such as managerial talent that
are common to these firm groups, consistent with evidence that globally engaged firms exhibit
higher TFP. Beyond these regressors, we implement two strategies: instrumental variables (IV)
and panel estimation.
Concerning the first, the use of IV with a limited dependent variable (discrete or censored) is
not straightforward. We use the AGLS method as proposed by Amemiya (1974) and
implemented by Newey (1987). Using information from CIS2, we constructed two instruments
for Hi in our CIS3 cross-section: four-digit industry averages of R&D Personnel and % R&D
Personnel, each of which was constructed excluding from CIS2 firms that re-appeared in CIS3.23
Our second approach to endogeneity is to use panel-data methods. We constructed a panel
that resulted in 787 firms included in both CIS2 and CIS3. However, this approach raises its own
econometric issues. One is that firms in the panel are a selected sample of survivors. Suppose
that the true relation between ∆Ki and Hi is positive, and that survival is greater for innovating
firms. Then constructing a group of surviving firms selects, among firms with low ∆Ki and Hi,
only those with a “large” positive shock to ∆Ki. This flattens the expected relation between ∆Ki
and Hi. Thus, the resulting reduction in the effect of Hi due to controlling for fixed effects might
be overstated by the additional reduced effect due to selection.
23 The rationale behind this exclusion is that if endogeneity arises from the correlation between firm fixed effects and the R&D employment variables, then lagged industry-level values of these R&D variables that include own lagged R&D personnel will not be valid instruments. We experimented with alternative instruments: e.g., using three-digit industries, and also taking averages by industry and region. The trade-off was that more-refined cells for instruments generally had higher predictive power but lower overlap of cells across the CIS waves. Ex ante, we expect our instruments to be correlated with each firm’s “normal” demand for knowledge workers, as there is substantial cross-industry variation in this demand, but uncorrelated with firm-specific unobservables that would be correlated with both ∆Ki and Hi. Also, for our estimation results later we note that our instruments are constructed at a lower level of aggregation than the two-digit industry regressors in our benchmark controls.

22
The second set of econometric issues arise from the “incidental parameters problem” in non-
linear models—probits here and tobits below for Novel Sales. Greene (2004) notes that the
fixed-effects maximum-likelihood probit estimator is inconsistent when T is fixed. How serious
this problem is in practice remains to be established; Greene’s (2004) simulations suggest that
for our case of T=2 bias is at least 100% for probit coefficients. Rather than estimate fixed-
effects probit, one recommendation is to use probit on the pooled cross-sections, without random
or fixed effects. Another is the fixed-effects conditional logit model (Chamberlain, 1984), which
allows estimation of parameters of interest without estimating incidental parameters (but at the
cost of not being able to estimate marginal effects). We try both these approaches.24
Novel Sales
Our innovation measure Novel Sales is continuous but, as discussed in Table 1a, equals zero
for many of our firms. Accordingly, we estimate the KPF for Novel Sales using the tobit model.
To calculate marginal effects of interest, we implement the McDonald and Moffitt (1980)
decomposition that splits the marginal effect of Hi on ∆Ki into two parts: the of effect of Hi on
the probability of ∆Ki being non-zero, and the effect of Hi on ∆Ki conditional on the firm having
positive ∆Ki. Our tables below report the latter (former available upon request).
To address possible endogeneity, here as with the earlier probits we use both IV and panel
estimation. Our IV tobit uses the same instruments as before. Panel methods when T=2 are
again problematic in tobit applications; simulations suggest that marginal effects are 50% too big
(Greene, 2004b). Here again, the recommendation is to estimate the pooled cross sections.25
24 We also note that in the conditional logit, identification is provided only by firms that switch innovation status: non-switcher firms drop out of the conditional likelihood function. So the number of useful observations is far smaller for this estimator. 25 Greene (2004b) reports that the source of coefficient inconsistencies derive not from the estimation of the tobit slope coefficients, which do not appear to be affected by the incidental parameters problem, but rather from the estimation of the sigma parameter (i.e., the disturbance standard deviation) that is used to calculate marginal effects.

23
Patents
Because Patents takes only non-negative integer values, here we can estimate the KPF via
count-data models. We chose a negative binomial model (Cameron and Trivedi, 1986), which,
relative to a Poisson model, relaxes the variance-mean equality assumption. In the negative
binomial model the estimated coefficients corresponds to semi-elasticities. Thus, from
coefficient estimates we can derive both marginal effects and elasticities from the estimated
coefficients. For continuous regressor x, [ | ] 1( | )j
j
E y xx E y x
β ∂=
∂, and the marginal effects is
[ | ] exp( ) jj
E y x xx
β β∂=
∂
Elasticities at sample means can be calculated by multiplying coefficient estimates by the means.
To address endogeneity we use our panel to control for fixed effects and so estimated a fixed-
effect negative binomial model as suggested by Hausman, Hall, and Griliches (1984).
5. Estimation Results
Our estimation results of various versions of equation (2) are reported in Tables 2 through 5.
Each table uses a different measure of ∆Ki. We start with the broad qualitative measures,
Innovate and Patent Protect, and then move to the more-narrow quantitative ones, Novel Sales
and Patent. For all tables we measure Hi using R&D Personnel. Each column of each table
corresponds to a different specification of equation (2), with the CIS sample, included regressors,
and estimator used as described in the table notes. Rows report estimates of marginal impacts
(with robust standard errors clustered by enterprise group). All specifications in all tables
include a common set of control regressors (not reported for brevity) to help control for plausibly
important cross-firm sources of innovative heterogeneity: approximately 50 two-digit industry

24
dummies; 13 regional dummies; size (total employment); and a categorical indicator of structural
change (see Appendix Table—e.g., newly born start-up firms may be more likely to innovate).
Table 2 reports estimation results for Innovate. Column 1 runs Innovate on just our three
global-engagement indicators (excluding the purely domestic group) plus benchmark controls.
All three indicators are statistically and economically significant. For example, the coefficient
on Multinational Parent indicates these firms are 22 percentage points more likely to innovate
relative to the omitted domestic firms. In Table 1a this differential in the raw data was 27
percentage points (0.45-0.18), so the large majority of this raw differential was not a function of
just multinationals being larger and in different regions and/or industries. What remains to be
seen is whether these indicators are proxying for superior innovation inputs or something else.
Column 2 adds to Column 1 our Hi indicator. This is positive and statistically significant, as
expected. To get some idea of quantitative significance, the mean gap between R&D Personnel
in domestics and multinational parents is 26.16-0.62=25.54 (Table 1b). Multiplying this by the
coefficient on Hi (0.0073) gives an implied probability difference of 19 percentage points. But
adding Hi reduces only slightly the coefficients on the global-engagement indicators.26
These global engagement indicators may be proxying for superior information flows from
existing knowledge inside and outside the firm, Kii and Ki_i, as suggested by the summary
statistics in Table 1c. Columns 3 through 5 add in a number of our information-flow variables,
first using only internal information from the own enterprise for Kii, then replacing this with
internal information from the entire enterprise group, and finally including both these measures
of Kii. Adding these direct measures of information flows reduces by about two-thirds the
coefficient estimates on our three global-engagement indicators. This is a major finding of our

25
analysis: the majority of the superior innovative output of globally engaged firms is accounted
for by their superior access to information from existing knowledge.
Looking at the particular sources of information shows an important role for information
internal to the enterprise itself: the coefficient estimate of about 0.35 suggests that an enterprise
going from learning nothing from itself for innovation to learning a great deal would enjoy a 35
percentage-point increase in the probability of reporting yes for Innovate. Similarly, the mean
difference between multinationals and purely domestics in the importance of internal information
(0.27=0.50-0.23, from Table 1c) translates into a higher probability of innovating for the
multinationals of about 9.5 percentage points. Information from elsewhere in the enterprise
group is also economically important: when entered alone in Column 4 it suggests a comparable
learning shift would correlate with a probability increase of 14 percentage points. This evidence
on information flows inside firms is consistent with standard trade models of multinational firms.
Important information sources external to the enterprise include customers and suppliers,
whose magnitude is on par with that of internal information. This is consistent with micro-level
productivity studies searching for knowledge spillovers across firms. Finally, the coefficient on
regulatory information is negative, which might be expected, whereas information from
competitors is also negative, which might not be expected. One possibility is that conditional on
other information sources, enterprises learning from competitors might be innovation laggards.
The rest of Table 2 examines the robustness of our results to different estimators and
samples. Column 6 reports our IV estimates of the specification in column 5. The coefficient
26 Note that Column (2) rejects the maintained assumption in some of the macro/growth literature that the global stock of knowledge is equally accessible to all firms. If this were so, then in Column (2) these global-engagement indicators should be individually and jointly insignificantly different from zero, with differences in ∆Ki explained only by differences in Hi.

26
estimate on Hi does not change but is less precise, as might be expected with IV estimation.27
Column 7 estimates the same specification for the CIS2 cross section. The overall coefficient
estimates look very similar, with only one coefficient changing sign (commercial information)
but with generally lower precision (presumably due to the smaller sample size). Column 8 then
pools together CIS2 and CIS3 waves and returns estimates similar to those in column 5.
Finally, column 9 shows the fixed-effects conditional logit model. We report coefficient
estimates, not marginal effects, and so cannot compare to earlier columns. The number of
observations is small and selected, as discussed above; recall that this model relies on enterprises
that answered Innovate differently in the two waves, which in this case is just 247 enterprises
(observed twice making 494 observations). The only statistically significant variable is learning
from one’s own enterprise. The only other coefficient estimates with t-statistics above one are
on Multinational Parent (positive), Vertical Information (positive), and Competitor Information
(negative). We worry that innovation and its inputs are highly serially correlated, such that we
simply have too few observations of switchers to discern statistically significant effects.
Consistent with this, in a pooled regression on this sample without fixed effects we again
obtained only one statistically significant coefficient estimate.28
Table 3 replicates the probit analysis of Table 2, but now for the measure of innovation
output Patent Protect. The pattern of findings is broadly similar. First, the coefficients on the
global-engagement indicators fall substantially once the information-flow variables are included
(compare column 5 to columns 1 and 2). The magnitude of this fall is now slightly less: by about
27 The number of observations drops due to firms for which we cannot construct instruments. In unreported results, we verified that results in Column 5 are qualitatively identical when estimated on the Column 6 sample of 5,999 observations. 28 In terms of our other control regressors, our industry dummies were always jointly significant (with several individually so). Regionally dummies tended to be borderline jointly significant. The indicator for start-up firms had a large positive coefficient estimate, as might be expected; firm size was also significantly positive. The indicator for observations in the CIS3 wave was significantly negative, implying a fall in all measures of ∆K in 1998-2000 relative to 1994-96. This is consistent with the fall in U.K. aggregate TFP growth between the early and late 1990s as documented by Basu, Fernald, Oulton, and Srinivasan (2003).

27
one-half, as opposed to two-thirds in Table 2, especially for multinational affiliates. This might
reflect the endogeneity of the patenting choice—e.g., an important function of affiliates may be
to protect their enterprise groups’ global innovations. As before, coefficient estimates on R&D
Personnel are significantly positive (barring the IV results). In terms of the information-flow
variables, internal information of both the enterprise itself and its enterprise group remain
important. University information now has a significantly positive coefficient, consistent with
existing research on the importance of university-private sector collaborations.
Table 4 moves to one of our two continuous measures of knowledge output, Novel Sales
(measured in thousands of pounds). Here we use a tobit estimator and report marginal effects
conditional on positive Novel Sales. The pattern of findings is broadly similar to Tables 2 and 3.
First, the coefficients on the global-engagement indicators fall by over two-thirds once the
information-flow variables are included. These indicators go from showing a differential of £5-8
million in Novel Sales in column 1 to only about £2 million in column 5. As before, coefficient
estimates on R&D Personnel are significantly positive (barring the IV results, where both the
coefficient and standard are much bigger). Our estimates imply that conditional on Novel Sales
being non-zero, each additional R&D worker is associated with between £6,000 and £10,000 in
additional new and improved sales. This seems reasonable: during the period covered by the
CIS3 survey the national average wage for scientists was about £25,000, and presumably less
than 100% of the time of these workers was allocated to creating new and improved products.
In terms of the information-flow variables, internal information of both the enterprise itself
and its enterprise group remain important. For this measure of innovation output, the other two
important sources of information appear to be vertical information from customers and suppliers
and also “free” information from sources such as conferences and trade fairs.

28
Table 5 reports on our other continuous measure of knowledge output, Patents. Here we use
a negative binomial estimator and report marginal effects. One notable difference from earlier
tables appears in column 1. In the specification with just the global-engagement indicators and
our benchmark controls, here the coefficient estimates on these indicators is far smaller than the
analogous information in the raw summary statistics in Table 1a. There, multinational parents
average 10.02 patents versus just 0.10 for the purely domestic firms. But with the benchmark
controls in column 1, multinational parents now average less than one more patent than domestic
firms. Much of the raw difference in patent output, then, is accounted for by these controls—in
particular, by the industry controls. Indeed, in unreported results where column 1 is re-estimated
without the industry controls we obtain coefficient estimates on the global-engagement
indicators much closer to the raw differentials in Table 1a.
This difference noted, the pattern of findings is broadly similar to earlier tables. The
coefficients on the global-engagement indicators fall substantially once the information-flow
variables are included. As before, most coefficient estimates on R&D Personnel are
significantly positive. And as with results for Patent Protect, here patent output is correlated
significantly with both sources of internal information (for internal to the enterprise itself, even
in the fixed-effects specification) and also with information from universities. The economic
magnitude of these information sources is quite small, however, which accords with the
relatively small size of the global-engagement indicators in column 1 discussed above.
Because much earlier empirical work based on the KPF framework has measured new ideas
as patents, it is instructive to compare our findings for Patents. A common calculation is the
patent elasticity of scientists. Our Column 5 coefficient estimate on R&D Personnel of 0.0005
multiplied by the full-sample mean of R&D workers of 5.35 implies an elasticity of about 0.003.

29
In the industrial-organization literature estimates of this elasticity are generally much bigger:
e.g., about 0.3 in Hausman, Hall, and Griliches (1984).
What explains this difference? Our specifications and theirs contain three important
differences: their sample is for only manufacturing; they include only firms reporting positive
R&D activity; and they do not include any controls for information flows. To explore these
differences, we first estimated a specification as close as possible to theirs: a negative binomial
model of Patents on log R&D expenditure for manufacturing firms reporting positive R&D
(plus, firm size and a science-sector dummy). This gave an elasticity of 0.45 (t=7.56), very
comparable to 0.3. Expanding the sample and/or specification reduced this elasticity towards our
0.003. For example, including firms with zero R&D reduced the elasticity to just 0.07. So it
appears this key elasticity is quite comparable in our results, once like and like are compared.
Robustness Checks
The results in Tables 2 through 5 are robust to a number of measurement and specification
choices. In particular, the impacts of our global-engagement and information-source regressors
generally do not change when we use in equation (2) alternative measures of Hi from Table 1b.
Results also do not change when we vary the set of control regressors: e.g., using firm sales
instead of firm employment for size, or dropping either the industry or region dummies.
We also estimated specifications interacting our global-engagement indicators with other
regressors—in particular, our measures of Hi to see if globally engaged firms enjoy higher
marginal productivity from knowledge inputs. These interactions almost always were
insignificantly different from zero, which reinforces our interpretation that globally engaged
firms innovate more in part because they have access to larger stocks of existing knowledge.
Discussion of Estimation Results

30
We can use our econometric estimates to answer the overall question of how much of the
innovation-output advantage of globally engaged firms is explained by their greater use of
inputs, and how much is left unexplained. In our estimation tables we have shown a statistically
significant relationship between all our measures of knowledge output and many of our measures
of knowledge inputs. To get a sense of the economic significance of these inputs, individually
and jointly, we can perform “innovation accounting” exercises akin to growth accounting often
used to explain output of goods and services.
Table 6 sets out these exercises for two of our measures of innovation, Innovate and Patents.
It reports how much of the knowledge-output differential that each of our three groups of
globally engaged firms displays over purely domestic firms is explained by knowledge-input
differentials, and also how much is attributed to global-engagement status per se. To do this, it
combines coefficient estimates from Tables 2 and 5 with sample means from Table 1.29
There are three sections to Table 6, one for each bilateral comparison of a globally engaged
group of enterprises with their purely domestic counterparts. In each section, the “raw”
differential between the two groups of firms is calculated directly from Table 1a. For example,
the Innovate raw differential between multinational parents and domestics of 0.27 = (0.45 -
0.18). The “adjusted” differential in knowledge output accounts for enterprise variation in
industry, region, size, and status—i.e., it is the coefficient estimate on the indicated global group
from column 1 of Tables 2 and 5 (for Innovate and Patents, respectively). Thus, for Innovate the
adjusted differential between multinational parents and domestics of 0.22 comes from the
coefficient estimate on multinational parents in Table 2, column 1 (strictly speaking, 0.2204).
29 Table 1 reports summary statistics for domestic enterprises separated between singletons and members of enterprise groups. But in the econometric estimates of Tables 2 through 5 these two sub-groups were recombined. Accordingly, for the calculations of Table 6 sample means were used for all domestic enterprises together, which are not reported in Table 1 but which (obviously) fall between the means of the two sub-groups.

31
Beneath each of the adjusted differentials in Table 6, the next seven rows of percentages
report the shares of this adjusted differential that are accounted for by differential use of the
indicated knowledge inputs between the two groups of enterprises. Each percentage is calculated
using relevant coefficient estimates from our preferred KPF specifications in column 5 of Tables
2 and 5 (for Innovate and Patents, respectively) along with relevant sample-mean differentials in
Tables 1b and 1c. For example, the cell in the top R&D Personnel row of the Innovate column is
20.8%. This number indicates the share of the adjusted differential in knowledge output between
multinational parents and domestic firms (0.2204) that is accounted for by the different R&D
intensity of those two groups according to our preferred KPF specification (0.0018 from column
5 of Table 2, multiplied by (26.16-0.62) from Table 1b, equals 0.046, which is 20.8% of 0.2204).
The next six cells below are calculated analogously for the six indicated sources of information.
Finally, the bottom cell reports the share of the adjusted differential in knowledge output left
unexplained by the regressors of our preferred KPF specification. Thus, to finish the Innovate
example comparing multinational parents and domestic firms, 28.0% is 0.0617 from column 5 of
Table 2 divided into 0.2204. This means that of the total innovation edge that had been
attributed to multinational enterprises without any of the KPF inputs, 28.0% of that edge remains
in our preferred KPF specification as attributed to being a multinational parent per se.
Table 6 contains several notable features. First, in none of the six accounting exercises is a
majority of the adjusted innovation differential for global engagement left attributed to global
engagement per se rather than greater intensity of use of knowledge inputs.30 Thus, the
innovation edge of globally engaged companies that appears in the raw data is well explained by
our KPF estimates. The interpretation of the unexplained global engagement dummies in our
30 There were only two exceptions to this for accounting exercises run on our other two innovation measures (not reported for brevity): for Patent Protect for affiliates (53%) and exporters (58%).

32
preferred KPF specifications may well be, just as in conventional production functions, the
superior efficiency with which knowledge inputs are translated into outputs. As discussed in the
introduction, such a dummy is typically statistically and economically significant in production
functions for outputs of goods and services. The same is true here for outputs of knowledge.
Second, of the KPF inputs it is flows of information that seem to matter more than R&D
Personnel in accounting for the output advantage of globally engaged firms. This is true not just
in terms of the sum contribution of all information sources but for many individual information
sources as well. This is not to say that R&D Personnel are not essential inputs to innovation, but
rather to emphasize potential problems from ignoring the role of information flows.
Third, we reiterate that much of the raw variation across firms in Patents is explained by our
benchmark controls, especially industry dummies. Even our most important information source
from our Patents estimates in Table 5, universities, explains only about 3% of the advantage of
globally engaged firms.31
We conclude from Table 6 that for all three of our groups of globally engaged firms, their
greater use of knowledge inputs (both own R&D and, especially, learning from existing
knowledge) accounts for the majority of their greater knowledge output. Much of the knowledge
intensity of globally engaged firms is explained by observable inputs suggested by the KPF.
6. Conclusions
Our goal has been to contribute to the ongoing effort to better understand productivity
dispersion across firms—in particular, the productivity advantage of globally engaged firms. We
31 As noted above Hausman, Hall, and Griliches (1984) regress Patents on R&D spending (and other variables), with an elasticity of 0.3. They report the first and third quartiles of these variables are 1 and 18 and $0.73M and $11.0M respectively. The fraction of the variance of patents (17 patents) explained by R&D in this case is about 5%[=0.3*(log11-log0.73)/(18-1)] (which is not quite right since the logs of the quartiles is likely not the quartile of the logs), which is strikingly similar to the numbers here.

33
have done so not by studying TFP differences, but rather by studying knowledge differences.
Following the long-standing perspective of industrial organization that one of the main drivers of
differences in TFP is differences in knowledge, we estimated knowledge production functions on
a new data set of thousands of U.K. firms for which we have detailed information on knowledge
outputs and inputs. Strengths of the data include measuring innovations not just on but also
inside the frontier, (i.e., the kind for most firms along the productivity distribution), and also
measuring flows of information from a comprehensive set of knowledge stocks.
We found that globally engaged firms—both multinationals and exporters—do generate
more ideas than their purely domestic counterparts. But this is not just because they use more
knowledge inputs in terms of researchers. Importantly, it is also because they have access to a
larger stock of ideas through sources including their upstream and downstream contacts with
suppliers and customers, and, for multinationals, their intra-firm worldwide pool of information.
We also found that the relative importance of these knowledge sources varies systematically with
the type of innovation. Information flows from universities, for example, are important for
patents but not for broader innovation measures, for which business contacts matter more.
Taken together, our findings help explain the correlation between productivity and global
engagement. Globally engaged firms generate more of the innovations that feed into higher
productivity, largely because they learn more from more sources. These results can inform
ongoing research on the productivity dispersion and the role of global linkages.32
32 For example, there is related work on how international trade or FDI may transmit ideas, and in turn how economic openness shapes incentives to innovate. Theory contributions include Grossman and Helpman (1991), Howitt (2000), Rivera-Batiz and Romer (1991), and the theory and empirical studies of Eaton and Kortum (1999, 2001, and 2002). Country empirical studies also include Coe, Helpman, and Hoffmaister (1997); Hall and Jones (1999); and Keller (2002). A recent survey is Keller (2004).

34
References Aitken, Brian J., and Ann E. Harrison. 1999. “Do Domestic Firms Benefit from Foreign Direct Investment? Evidence from Venezuela.” American Economic Review, June, pp. 605-618. Amemiya, T. 1974. “The Nonlinear Two-Stage Least-Squares Estimator.” Journal of Econometrics, 2, pp. 105-110. Bartelsman, Eric J., and Mark Doms. 2000. “Understanding Productivity: Lessons from Longitudinal Microdata.” Journal of Economic Literature, 38, pp. 569-594. Bernard, Andrew B., and J. Bradford Jensen. 1995. “Exporters, Jobs, and Wages in U.S. Manufacturing.” Brookings Papers on Economic Activity: Microeconomics,” pp. 67-119. Bernard, Andrew B., and J. Bradford Jensen. 1999. “Exceptional Exporter Performance: Cause, Effect, or Both? Journal of International Economics, 47(1), pp. 1-25. Bernard, Andrew B., Jonathan Eaton, J. Bradford Jensen, and Samuels Kortum. 2003. “Plants and Productivity in International Trade.” American Economic Review, 93(4), pp. 1268-1290. Bertrand, Marianne, and Sendhil Mullainathan. 2001. “Do People Mean What They Say? Implications for Subjective Survey Data. American Economic Review, 91(2), pp. 67-72. Blonigen, Bruce A. 1997. “Firm-specific Assets and the Link Between Exchange Rates and Foreign Direct Investment.” American Economic Review, 87, pp. 447-465. Bloom, Nicholas and John M. Van Reenen. 2002. “Patents, Real Options, and Firm Performance.” Economic Journal, 112, pp. C97-C116. Branstetter, Lee G. 2001. “Are Knowledge Spillovers International or Intranational in Scope? Microeconometric Evidence from the U.S. and Japan.” Journal of International Economics 53, pp. 53-79. Cabral, Luís M. B., and José Mata. “On the Evolution of the Firm Size Distribution: Facts and Theory.” American Economic Review, 93(4), pp. 1075-1090. Cameron, A.C., and P.K. Trivedi. 1986. “Econometric Models Based on Count Data.” Journal of Applied Econometrics, 1, pp. 29-53. Carr, David L., James R. Markusen, and Keith E. Maskus. 2001. “Estimating the Knowledge-Capital Model of the Multinational Enterprise.” American Economic Review 91, pp. 693-708. Cassiman, Bruno, and Reinhilde Veugelers. 2002. “R&D Cooperation and Spillovers: Some Empirical Evidence from Belgium.” American Economic Review 92 (4), pp. 1169-1184. Clerides, Sofronos, Saul Lach, and James R. Tybout. 1998. “Is Learning-by-Exporting Important: Micro-Dynamic Evidence from Colombia, Mexico, and Morocco.” Quarterly Journal of Economics, 113(3), pp. 903-947.

35
Coe, David, Elhanan Helpman, and Alexander Hoffmaister. 1997. “North-South R&D Spillovers.” Economic Journal, 107, pp. 134-149. Criscuolo, Chiara and Ralf Martin. 2003. “Multinationals and U.S. Productivity Leadership: Evidence from Great Britain.” CeRiBa Discussion Paper. Doms, Mark E., and J. Bradford Jensen. 1998. “Comparing Wages, Skills, and Productivity Between Domestically and Foreign-Owned Manufacturing Establishments in the United States.” In R. Baldwin, R. Lipsey, and J. D. Richardson (eds.), Geography and Ownership as Bases for Economic Accounting. Chicago: University of Chicago Press, pp. 235-255. Eaton, Jonathan, and Samuel Kortum. 2002. “Technology, Geography, and Trade.” Econometrica 70(5), pp. 1741-1779. Eaton, Jonathan, and Samuel Kortum. 2001. “Trade in Capital Goods.” European Economic Review 45(7), pp. 1195-1235. Eaton, Jonathan, and Samuel Kortum. 1999. “International Technology Diffusion: Theory and Measurement.” International Economic Review 40(3), pp. 537-570. Frei, Frances X. 2004. Rapid Rewards at Southwest Airlines. Harvard Business School Case #9-602-065. Greene, William. 2004a. “The Bias of the Fixed Effects Estimator in Nonlinear Models.” The Econometrics Journal, forthcoming. Greene, William. 2004b. “Fixed Effects and Bias Due to the Incidental Parameters Problem in the Tobit Model.” Econometric Reviews, forthcoming. Griffith, Rachel, Rupert Harrison, and John van Reenen. 2004. “How Special is the Special Relationship? Using the Impact of U.S. R&D Spillovers on U.K. Firms as a Test of Technology Sourcing.” CEPR Discussion Paper #4698. Griliches, Zvi. 1998. R&D and Productivity. Chicago: University of Chicago Press. Griliches, Zvi. 1990. “Patent Statistics as Economic Indicators: A Survey.” Journal of Economic Literature 28(4), pp. 1661-1707. Griliches, Zvi. 1979. “Issues in Assessing the Contribution of R&D to Productivity Growth.” Bell Journal of Economics (10), pp. 92-116. Grossman, Gene, and Elhanan Helpman. 1991. Innovation and Growth in the World Economy. Cambridge, MA: MIT Press. Gupta, Anil K., and Vijay Govindarajan. 2000. “Knowledge Flows within Multinational Corporations.” Strategic Management Journal, 21, pp. 473-496.

36
Hall, Robert E., and Charles I. Jones. 1999. “Why Do Some Countries Produce so Much More Output per Worker than Others?” Quarterly Journal of Economics 114(1), pp. 83-116. Hanson, Gordon H. 2000. “Should Countries Promote Foreign Direct Investment?” G24 paper. Howitt, Peter. 2000. “Endogenous Growth and Cross-Country Income Differences.” American Economic Review, 90(4), pp. 829-846. Hausman, Jerry A., Bronwyn H. Hall, and Zvi Griliches. 1984. “Econometric Models for Count Data with an Application to the R&D-Patent Relationship.” Econometrica, 52, pp. 909-938. Helpman, Elhanan, Marc J. Melitz, and Stephen R. Yeaple. 2004. “Export Versus FDI with Heterogeneous Firms.” American Economic Review, 94(1), pp. 300-316. Heskett, James L. 2003. Southwest Airlines 2002: An Industry Under Seige. Harvard Business School Case #9-803-133. Jaffe, Adam, and Manuel Trajtenberg. 2002. Patents, Citations, and Innovations: A Window on the Knowledge Economy. Cambridge, MA: MIT Press. Jones, Charles I. 2004. “Growth and Ideas.” National Bureau of Economic Research Working Paper #10767, forthcoming in Handbook of Economic Growth. Keller, Wolfgang. 2004. “International Technology Diffusion.” Journal of Economic Literature, pp. 752-782. Keller, Wolfgang. 2002. “Geographic Localization of International Technology Diffusion.” American Economic Review, 92(1), pp. 120-142. Klette, Tor Jakob. 1996. “R&D, Scope Economies, and Plant Performance.” RAND Journal of Economics, 27(3), pp. 502-522. Klette, Tor Jakob, and Samuel Kortum. 2004. “Innovating Firms and Aggregate Innovation.” Journal of Political Economy, 112(5), pp. 986-1018. Mansfield, Edwin and Anthony Romeo. 1980. “Technology Transfer to Overseas Subsidiaries by U.S.-Based Firms.” Quarterly Journal of Economics, 95 (4), pp. 737-750. Mairesse, Jacques, and Pierre Mohnen. 2002. “Accounting for Innovation and Measuring Innovativeness: An Illustrative Framework and an Application.” American Economic Review, 92(2), pp. 226-230. Markusen, James R. 2002. Multinational Firms and the Theory of International Trade. Cambridge, MA: MIT Press. McGinn, Daniel. 2004. “Is This Any Way To Run an Airline?” Newsweek, October 4 Issue. McDonald, J.F., and Robert A. Moffitt. 1980. “The Uses of Tobit Analysis.” Review of Economics and Statistics, 62, pp. 318-321.

37
Melitz, Marc J. 2003. “The Impact of Trade on Aggregate Industry Productivity and Intra-Industry Reallocations.” Econometrica, 71(6), pp. 1695-1725. Moran, Theodore H. 2001. Parental Supervision: The New Paradigm for Foreign Direct Investment and Development. Washington, D.C.: Institute for International Economics. Newey, Whitney. 1987. “Efficient Estimation of Limited Dependent Variable Models with Endogenous Explanatory Variables.” Journal of Econometrics, 36, pp. 231-250. Olley, G. Steve, and Ariel Pakes. 1996. “The Dynamics of Productivity in the Telecommunications Equipment Industry.” Econometrica, 64(6), pp. 1263-1297. Pakes, Ariel, and Zvi Griliches. 1980. “Patents and R&D at the Firm Level: A First Report.” Economic Letters, 5(4), pp. 377-381. Rivera-Batiz, Luis, and Paul Romer. 1991. “Economic Integration and Endogenous Growth.” Quarterly Journal of Economics, 106(2), pp. 531-555. Romer, Paul. 1990. “Endogenous Technological Change.” Journal of Political Economy, pp. S71-S102. Smarzynska Javorcik, Beata. 2004. “Does Foreign Direct Investment Increase the Productivity of Domestic Firms? In Search of Spillovers Through Backward Linkages.” American Economic Review, 94(3), pp. 605-627. Trefler, Daniel. 2004. “The Long and Short of the Canada-U.S. Free Trade Agreement.” American Economic Review, 94(4), pp. 870-895. Syverson, Chad. 2004. “Market Structure and Productivity: A Concrete Example.” Journal of Political Economy, 112(6), pp. 1181-1222. Tybout, James R. 2000. “Manufacturing Firms in Developing Countries: How Well Do They Do, and Why?” Journal of Economic Literature, 38, pp. 11-44. Uzawa, H. 1969. “Time Preference and the Penrose Effect in a Two-Class Model of Economic Growth.” Journal of Political Economy, 77, pp. 628-652. Wooldridge, Jeffrey M. 2002. Econometric Analysis of Cross Section and Panel Data. Cambridge, MA: MIT Press.

38
Table 1a: Summary Statistics on Knowledge Outputs
Sub-Sample Innovate Patent
ProtectNovel Sales
Patents
Multinational Parents 0.45 0.32 43,341 10.02
(N = 577) (0.50) (0.47) (797,344) (159.64)
Multinational Affiliates 0.42 0.37 13,469 2.78
(N = 653) (0.49) (0.48) (126,286) (15.54)
Non-Multinational Exporters 0.38 0.23 1,866 0.82
(N = 1,776) (0.49) (0.42) (20,891) (5.58)
Domestics in an Ent. Group 0.18 0.08 1,046 0.25
(N = 778) (0.41) (0.28) (9,322) (3.07)
Domestic Singletons 0.18 0.05 2,499 0.07
(N = 3,601) (0.38) (0.22) (99,611) (1.72)
All Enterprises 0.27 0.15 6,356 1.37
(N = 7,385) (0.45) (0.36) (24,241) (46.64)
Notes: For each cell, indicated summary statistics are means (and standard deviations in parentheses). Innovate is an indicator variable equal to one if enterprises reported any process or product innovation. Patent Protect is an indicator variable equal to one if enterprises reported either applying for new patents 1998-2000 or using existing patents to protect innovations. Novel Sales is the value of enterprise sales in 2000 accounted for by new and improved products, in thousands of pounds. Patents is the number of patents applied for over the 1998-2000 period. The 7,385 total enterprises in this table corresponds to the number of observations in the benchmark regressions in Table 2. See text for data details.

39
Table 1b: Summary Statistics on Knowledge Inputs
Sub-Sample R&D
Personnel% R&D
Personnel% Scientists Intramural
R&DMultinational Parents 26.16 0.04 0.10 1,685
(N = 577) (236.80) (0.10) (0.17) (20,897)
Multinational Affiliates 21.12 0.04 0.12 1,925
(N = 653) (154.61) (0.12) (0.18) (23,502)
Non-Multinational Exporters 4.17 0.03 0.08 94
(N = 1,776) (60.08) (0.08) (0.17) (581)
Domestics in an Ent. Group 0.65 0.01 0.04 21
(N = 778) (2.46) (0.04) (0.11) (139)
Domestic Singletons 0.61 0.01 0.04 19
(N = 3,601) (8.98) (0.07) (0.13) (272)
All Enterprises 5.35 0.02 0.06 337
(N = 7,385) (86.79) (0.08) (0.15) (9,141)
Notes: For each cell, indicated summary statistics are means (and standard deviations in parentheses). R&D Personnel is number of enterprise workers involved in R&D activities in 2000. % R&D Personnel is the share of enterprise employment in 2000 accounted for by R&D workers. % Scientists is the share of enterprise employment accounted for by degree-level or above workers in science and engineering subjects. Intramural R&D is the value of R&D performed by the enterprise in 2000, in thousands of pounds. The 7,385 total enterprises in this table corresponds to the number of observations in the benchmark regressions in Table 2. See text for data details.

40
Table 1c: Summary Statistics on Knowledge Flows
Sub-Sample Internal
SelfInternal Group
Vertical Competitor Free University
Multinational Parents 0.51 0.32 0.50 0.29 0.39 0.19
(N = 577) (0.67) (0.33) (0.67) (0.33) (0.33) (0.00)
Multinational Affiliates 0.49 0.40 0.48 0.29 0.38 0.20
(N = 653) (0.67) (0.33) (0.67) (0.33) (0.33) (0.00)
Non-Multinational Exporters 0.45 0.19 0.46 0.25 0.35 0.13
(N = 1,776) (0.33) (0.00) (0.67) (0.00) (0.33) (0.00)
Domestics in an Ent. Group 0.28 0.16 0.32 0.16 0.25 0.08
(N = 778) (0.00) (0.00) (0.00) (0.00) (0.00) (0.00)
Domestic Singletons 0.22 0.02 0.29 0.15 0.23 0.05
(N = 3,601) (0.00) (0.00) (0.00) (0.00) (0.00) (0.00)
All Enterprises 0.33 0.16 0.37 0.20 0.29 0.10
(N = 7,385) (0.00) (0.00) (0.33) (0.00) (0.00) (0.00)
Notes: For each cell, indicated summary statistics are means (and medians in parentheses). Each variable is a categorical indicator of how important a different knowledge source is to the enterprise’s innovation activities. Each variable takes possible values of 0, 1/3, 2/3, and 1; higher values indicate greater importance for an information source. Internal Self measures knowledge inside the enterprise itself. Internal Group measures knowledge inside the broader business group of affiliated enterprises. Vertical measures knowledge from customers or suppliers. Competitor measures knowledge from competing firms. Free measures knowledge from professional conferences and exhibitions. University measures knowledge from universities. See text for data details.

41
Table 2: Estimates of the Knowledge Production Function for Output Measure Innovate
(1) (2) (3) (4) (5) (6) (7) (8) (9)Exporter 0.1463 0.1455 0.0470 0.0817 0.0461 0.0624 0.0208 0.0472 0.0294
(0.0149)*** (0.0154)*** (0.0140)*** (0.0148)*** (0.0140)*** (0.0174)*** (0.0207) (0.0154)*** (0.5316)Multinational Parent 0.2204 0.1902 0.0706 0.0907 0.0617 0.0766 0.0840 0.0985 1.0433
(0.0248)*** (0.0266)*** (0.0241)*** (0.0250)*** (0.0238)*** (0.0273)*** (0.0244)*** (0.0251)*** (0.6691)Multinational Affiliate 0.1871 0.1496 0.0528 0.0513 0.0365 0.0631 0.0518 0.0589 0.3921
(0.0223)*** (0.0238)*** (0.0209)** (0.0219)** (0.0206)* (0.0256)** (0.0221)** (0.0215)*** (0.6182)R&D Personnel 0.0073 0.0018 0.0026 0.0018 0.0018 0.0009 0.0016 0.0032
(0.0023)*** (0.0006)*** (0.0009)*** (0.0006)*** (0.0009)* (0.0005) (0.0007)** (0.0092)Vertical Info. 0.3173 0.4665 0.3143 0.3306 0.1316 0.4092 0.9092
(0.0217)*** (0.0214)*** (0.0218)*** (0.0252)*** (0.0361)*** (0.0241)*** (0.6236)Competitors' Info. -0.1129 -0.1356 -0.1236 -0.1286 -0.0085 -0.1141 -0.8656
(0.0219)*** (0.0233)*** (0.0222)*** (0.0253)*** (0.0314) (0.0247)*** (0.6671)Commerical Info. 0.0608 0.0898 0.0541 0.0584 -0.0315 0.0530 -0.0921
(0.0221)*** (0.0229)*** (0.0222)** (0.0250)** (0.0314) (0.0245)** (0.6241)Free Info. 0.1295 0.1620 0.1287 0.1410 0.0074 0.1372 0.4548
(0.0225)*** (0.0230)*** (0.0225)*** (0.0257)*** (0.0342) (0.0250)*** (0.6595)Regulatory Info. -0.0436 -0.0019 -0.0473 -0.0644 -0.0268 -0.0394 0.0462
(0.0198)** (0.0201) (0.0197)** (0.0226)*** (0.0269) (0.0214)* (0.5139)University Info. 0.0002 0.0358 -0.0037 0.0121 0.1206 0.0379 0.0640
(0.0270) (0.0288) (0.0270) (0.0400) (0.0356)*** (0.0290) (0.7639)Government Info. 0.0044 -0.0083 0.0004 -0.0101 -0.1053 -0.1045 0.5482
(0.0284) (0.0299) (0.0284) (0.0358) (0.0336)*** (0.0292)*** (0.7417)Internal Info.-- Self 0.3594 0.3489 0.3801 0.2031 0.4092 1.8032
(0.0181)*** (0.0184)*** (0.0216)*** (0.0298)*** (0.0201)*** (0.5136)***Internal Info. -- Group 0.1406 0.0647 0.0781 -0.0015 0.0535 -0.3549
(0.0199)*** (0.0193)*** (0.0250)*** (0.0263) (0.0214)** (0.5983)
CIS Wave 3 3 3 3 3 3 2 2 and 3 2 and 3Enterprise Fixed Effects No No No No No No No No Yes# Observations 7,385 7,385 7,385 7,385 7,385 5,999 1,787 9,172 494
Notes: Innovate is an indicator variable equal to one if enterprises reported any process or product innovation. Each column is a different estimated specification, with each row in columns (1) through (8) reporting the marginal impacts (and robust standard errors, clustered by enterprise group) for the indicated regressor as estimated by probit (IV probit in column (6)). Column (9) reports estimated coefficients (and standard errors) from a conditional logit estimator. *, **, and *** indicate statistical significance at the 10%, 5%, and 1% levels. All specifications include additional control regressors (not reported for brevity): two-digit industry dummies; 13 regional dummies; enterprise total employment; a categorical indicator of structural change (see Appendix Table); and for columns (8) and (9) a CIS Wave indicator.

42
Table 3: Estimates of the Knowledge Production Function for Output Measure Patent Protect
(1) (2) (3) (4) (5) (6) (7) (8) (9)Exporter 0.1225 0.1246 0.0709 0.0834 0.0706 0.0914 0.0902 0.0771 0.0110
(0.0128)*** (0.0130)*** (0.0110)*** (0.0115)*** (0.0110)*** (0.0140)*** (0.0238)*** (0.0100)*** (0.9945)Multinational Parent 0.2394 0.2322 0.1223 0.1309 0.1134 0.1344 0.1323 0.1230 -0.3491
(0.0250)*** (0.0260)*** (0.0205)*** (0.0216)*** (0.0201)*** (0.0243)*** (0.0424)*** (0.0179)*** (1.2815)Multinational Affiliate 0.2862 0.2793 0.1700 0.1598 0.1505 0.1784 0.1517 0.1481 0.2398
(0.0227)*** (0.0233)*** (0.0212)*** (0.0215)*** (0.0210)*** (0.0247)*** (0.0331)*** (0.0172)*** (1.2374)R&D Personnel 0.0014 0.0005 0.0006 0.0005 0.0016 0.0001 0.0001 -0.0168
(0.0005)*** (0.0002)** (0.0002)** (0.0002)** (0.0005)*** (0.0001) (0.0001) (0.0107)Vertical Info. -0.0403 0.0035 -0.0434 -0.0393 -0.0861 -0.0409
(0.0150)*** (0.0142) (0.0151)*** (0.0190)** (0.0314)*** (0.0135)***Competitors' Info. 0.0536 0.0422 0.0442 0.0453 0.0193 0.0389 -0.8390
(0.0141)*** (0.0148)*** (0.0142)*** (0.0178)** (0.0273) (0.0126)*** (1.3003)Commerical Info. 0.0575 0.0649 0.0533 0.0586 -0.0002 0.0456 0.4013
(0.0135)*** (0.0140)*** (0.0135)*** (0.0173)*** (0.0256) (0.0119)*** (1.0117)Free Info. 0.0177 0.0279 0.0168 0.0203 0.0457 0.0279 0.9454
(0.0143) (0.0151)* (0.0144) (0.0185) (0.0287) (0.0128)** (1.1078)Regulatory Info. 0.0340 0.0442 0.0304 0.0325 -0.0050 0.0254 3.2859
(0.0121)*** (0.0126)*** (0.0122)** (0.0157)** (0.0229) (0.0107)** (1.2953)**University Info. 0.1109 0.1224 0.1076 0.0938 0.1566 0.1192 0.3457
(0.0159)*** (0.0166)*** (0.0160)*** (0.0242)*** (0.0278)*** (0.0138)*** (0.8977)Government Info. 0.0249 0.0163 0.0220 -0.0014 -0.0176 0.0038 0.0512
(0.0170) (0.0178) (0.0171) (0.0231) (0.0280) (0.0144) (1.1831)Internal Info.-- Self 0.1128 0.1037 0.1184 0.1210 0.1145 -0.5564
(0.0118)*** (0.0120)*** (0.0154)*** (0.0251)*** (0.0109)*** (1.1496)Internal Info. -- Group 0.0709 0.0508 0.0513 0.0021 0.0407 0.7441
(0.0120)*** (0.0116)*** (0.0156)*** (0.0205) (0.0099)*** (0.8746)
CIS Wave 3 3 3 3 3 3 2 2 and 3 2 and 3Enterprise Fixed Effects No No No No No No No No Yes# Observations 6,832 6,832 6,832 6,832 6,832 5,573 1,755 8,605 240
Notes: Patent Protect is an indicator variable equal to one if enterprises reported either applying for new patents 1998-2000 or using existing patents to protect innovations. Each column is a different estimated specification, with each row in columns (1) through (8) reporting the marginal impacts (and robust standard errors, clustered by enterprise group) for the indicated regressor as estimated by probit (IV probit in column (6)). Column (9) reports estimated coefficients (and standard errors) from a conditional logit estimator. *, **, and *** indicate statistical significance at the 10%, 5%, and 1% levels. All specifications include additional control regressors (not reported for brevity): two-digit industry dummies; 13 regional dummies; enterprise total employment; a categorical indicator of structural change (see Appendix Table); and for columns (8) and (9) a CIS Wave indicator.

43
Table 4: Estimates of the Knowledge Production Function for Output Measure Novel Sales
(1) (2) (3) (4) (5) (6) (7) (8)Exporter 5,412.53 5,358.6603 1,837.4735 2,797.2043 1,827.3897 13,367.7323 8,080.7779 4,196.4680
(618.2136)*** (612.5629)*** (553.7213)*** (560.1390)*** (552.4251)*** (2,986.8320)*** (4,028.2556)** (994.3246)***Multinational Parent 7,889.6999 7,690.3843 2,381.2574 3,197.5997 2,124.6155 13,750.7336 17,407.9423 7,595.2767
(846.5239)*** (839.6221)*** (744.2519)*** (763.5503)*** (746.6252)*** (3,996.6105)*** (5,923.6349)*** (1,377.8407)***Multinational Affiliate 7,619.2463 7,336.1945 2,961.8469 2,824.8010 2,400.6425 15,574.6487 17,603.7155 7,381.5865
(817.7698)*** (811.7966)*** (722.9364)*** (764.2561)*** (742.5405)*** (3,920.2899)*** (4,708.1851)*** (1,270.5392)***R&D Personnel 10.8351 6.2313 6.4789 6.0409 119.8788 72.7749 29.3269
(2.0211)*** (1.6428)*** (1.7100)*** (1.6401)*** (137.0541) (6.8045)*** (2.2572)***Vertical Info. 7,164.4188 11,183.9604 7,012.2731 35,514.2660 4,464.1439 13,898.9149
(892.4960)*** (879.4845)*** (891.8866)*** (4,889.5606)*** (7,240.0364) (1,632.8647)***Competitors' Info. 20.2394 -513.5203 -314.2821 1,365.3067 1,662.6089 -847.3059
(819.7274) (850.6421) (826.4458) (4,487.8838) (5,813.1605) (1,484.0104)Commerical Info. 1,733.9309 2,414.2046 1,540.0656 5,072.4778 10,243.9651 5,082.9029
(807.0196)** (834.4030)*** (808.7128)* (4,437.6847) (5,891.6847)* (1,456.9469)***Free Info. 3,717.5593 4,539.9219 3,679.1749 11,827.4854 -1,846.5098 4,907.0660
(863.5877)*** (888.4043)*** (862.4931)*** (4,671.0952)** (6,334.4517) (1,564.9633)***Regulatory Info. -1,173.3847 -13.7688 -1,318.3366 -4,221.2529 6,792.9163 901.4433
(753.5375) (768.4367) (754.3382)* (4,108.6716) (5,081.6044) (1,314.8235)University Info. 427.6379 1,337.1323 289.7578 6,286.7263 4,286.0210 -626.7453
(946.0150) (976.2421) (946.2756) (6,473.5572) (6,223.2405) (1,648.8389)Government Info. -605.8156 -1,093.5511 -746.9923 -10,390.1774 -12,606.7342 -4,751.3209
(1,033.9278) (1,069.1499) (1,034.1897) (6,139.3859)* (6,179.9336)** (1,724.4292)***Internal Info.-- Self 10,049.3890 9,734.6648 49,898.8318 15,217.0729 16,924.0849
(763.2976)*** (769.4321)*** (4,184.0693)*** (5,294.4455)*** (1,344.3715)***Internal Info. -- Group 3,576.8153 2,046.4884 9,561.2936 6,652.3495 3,526.8231
(716.0315)*** (696.1167)*** (4,275.0342)** (4,661.4664) (1,223.8373)***
CIS Wave 3 3 3 3 3 3 2 2 and 3Enterprise Fixed Effects No No No No No No No No# Observations 6,871 6,871 6,871 6,871 6,871 5,532 1,574 8,445
Notes: Novel Sales is the value of enterprise sales in 2000 accounted for by new and improved products, in thousands of pounds. Each column is a different estimated specification, with each row in columns (1) through (8) reporting the marginal impacts (and robust standard errors, clustered by enterprise group) conditional on non-zero value for Novel Sales for the indicated regressor as estimated by tobit (IV tobit in column (6)). *, **, and *** indicate statistical significance at the 10%, 5%, and 1% levels. All specifications include additional control regressors (not reported for brevity): two-digit industry dummies; 13 regional dummies; enterprise total employment; a categorical indicator of structural change (see Appendix Table); and for column (8) a CIS Wave indicator.

44
Table 5: Estimates of the Knowledge Production Function for Output Measure Patents
(1) (2) (3) (4) (5) (6) (7) (8)Exporter 0.2128 0.2510 0.0639 0.0867 0.0660 0.7895 0.1779 1.1556
(0.0546)*** (0.0593)*** (0.0171)*** (0.0211)*** (0.0176)*** (0.2112)*** (0.0391)*** (0.7444)Multinational Parent 0.7421 0.6004 0.0871 0.1460 0.0857 0.9390 0.2455 0.8776
(0.2698)*** (0.1724)*** (0.0332)*** (0.0555)*** (0.0329)*** (0.4718)** (0.0844)*** (0.7945)Multinational Affiliate 0.5157 0.4815 0.1136 0.0996 0.1054 1.1513 0.2154 1.1902
(0.1840)*** (0.1551)*** (0.0380)*** (0.0372)*** (0.0366)*** (0.4164)*** (0.0680)*** (0.8148)R&D Personnel 0.0038 0.0005 0.0006 0.0005 0.0015 0.0011 0.0062
(0.0019)** (0.0002)** (0.0003)** (0.0003)** (0.0022) (0.0005)** (0.0043)Vertical Info. -0.0039 0.0311 -0.0075 -0.7704 -0.0179 0.8206
(0.0131) (0.0143)** (0.0132) (0.2238)*** (0.0341) (0.6126)Competitors' Info. 0.0231 0.0165 0.0218 0.4410 0.1077 -0.4399
(0.0124)* (0.0151) (0.0126)* (0.1647)*** (0.0344)*** (0.5913)Commerical Info. 0.0493 0.0726 0.0481 -0.2279 0.0785 0.4220
(0.0130)*** (0.0168)*** (0.0130)*** (0.1860) (0.0318)** (0.5149)Free Info. 0.0366 0.0522 0.0384 0.3424 0.1358 0.2938
(0.0145)** (0.0179)*** (0.0147)*** (0.1998)* (0.0392)*** (0.5521)Regulatory Info. 0.0180 0.0312 0.0161 0.0487 0.0337 -0.4588
(0.0099)* (0.0131)** (0.0100) (0.1455) (0.0260) (0.4754)University Info. 0.0928 0.1205 0.0948 1.1069 0.2821 0.1683
(0.0196)*** (0.0238)*** (0.0200)*** (0.2190)*** (0.0446)*** (0.5373)Government Info. -0.0563 -0.0634 -0.0582 -0.0604 -0.1201 0.1444
(0.0168)*** (0.0206)*** (0.0172)*** (0.1748) (0.0381)*** (0.5898)Internal Info.-- Self 0.0836 0.0803 0.8120 0.1879 1.4310
(0.0133)*** (0.0129)*** (0.1673)*** (0.0278)*** (0.5330)***Internal Info. -- Group 0.0430 0.0205 0.0169 0.0579 0.0030
(0.0132)*** (0.0101)** (0.1306) (0.0272)** (0.4533)
CIS Wave 3 3 3 3 3 2 2 and 3 2 and 3Enterprise Fixed Effects No No No No No No No Yes# Observations 4,871 4,871 4,871 4,871 4,871 1,550 6,421 202
Notes: Patents is the number of patents applied for over the 1998-2000 period. Each column is a different estimated specification, with each row in columns (1) through (8) reporting the marginal impacts (and robust standard errors, clustered by enterprise group) for the indicated regressor as estimated by a negative binomial model. *, **, and *** indicate statistical significance at the 10%, 5%, and 1% levels. All specifications include additional control regressors (not reported for brevity): two-digit industry dummies; 13 regional dummies; enterprise total employment; a categorical indicator of structural change (see Appendix Table); and for columns (7) and (8) a CIS Wave indicator.

45
Table 6: Innovation Accounting
Innovate Patents
Raw Parent-Domestic Differential 0.27 9.92 Adjusted Parent-Domestic Differential 0.22 0.74 Fraction of Adjusted Differential Accounted for by: R&D Personnel 20.8% 1.7% Self Information 44.3% 3.0% Group Information 6.6% 0.6% Vertical Information 28.2% -0.2% Competitor Information -7.9% 0.4% Free Information 9.3% 0.8% University Information -0.2% 1.7% Parent Dummy 28.0% 11.5% Raw Affiliate-Domestic Differential 0.24 2.68 Adjusted Affiliate-Domestic Differential 0.19 0.52 Fraction of Adjusted Differential Accounted for by: R&D Personnel 19.7% 2.0% Self Information 48.1% 4.0% Group Information 10.4% 1.2% Vertical Information 30.9% -0.3% Competitor Information -9.2% 0.6% Free Information 10.3% 1.1% University Information -0.3% 2.6% Parent Dummy 19.5% 20.4% Raw Exporter-Domestic Differential 0.20 0.72 Adjusted Exporter-Domestic Differential 0.15 0.21 Fraction of Adjusted Differential Accounted for by: R&D Personnel 4.4% 0.8% Self Information 51.8% 8.2% Group Information 3.9% 0.9% Vertical Information 34.6% -0.6% Competitor Information -8.4% 1.0% Free Information 10.6% 2.2% University Information -0.2% 3.1% Parent Dummy 31.5% 31.0%
Notes: This table combines coefficient estimates from Tables 2 and 5 with sample means from Table 1 to calculate how much of the knowledge-output differential that each of our three groups of globally engaged firms displays over purely domestic firms is explained by the analogous knowledge-input differentials, and also how much of the differential is attributed to global-engagement status per se. In each of the three sections in this table, the “raw” differential in knowledge output is calculated directly from Table 1a. The “adjusted” differential in knowledge output accounts for firm variation in industry, region, size, and status—i.e., it is the coefficient estimate on the indicated global group from column 1 of Tables 2 and 5 (for Innovate and Patents, respectively). The subsequent percentages are the shares of this adjusted differential accounted for by the differential in indicated knowledge inputs, where each percentage is calculated using relevant coefficient estimates from column 5 of Tables 2 and 5 (for Innovate and Patents, respectively) along with relevant sample-mean differentials in Tables 1b and 1c. See text for details.

46
Appendix Table: Survey Questions in CIS3 1. Measures of Knowledge Outputs (∆Ki)
Variable Name Variable Definition Process Innovation During the three year period 1998-2000, did your enterprise introduce any technologically
new or improved processes for producing or supplying products which were new to your firm?
Product Innovation During the three year period 1998-2000, did your enterprise introduce any technologically new or significantly improved products (goods or services) which were new to your firm?
% Turnover due to new and improved products
Please estimate how your turnover in 2000 was distributed between products (goods or services) introduced during the period 1998-2000 which were: New to your firm + Significantly improved (%).
Patent Protection During the period 1998-2000, please indicate the importance to your enterprise of the following methods to protect innovations? Patent Protection.
Number of Patents How many patents, if any, did your enterprise apply for during the period 1998 to 2000? 2. Measures of Knowledge Inputs (Hi) R&D Personnel How many persons were involved in R&D activities within your enterprise in 2000 (in full
time equivalents)? Proportion Scientists and Engineers Approximate proportion [of employees] educated to degree level or above [in the fields of]
science and engineering subjects Intramural R&D Please tick if expenditure in the category [of] Intramural research and experimental
development (R&D); [and if so ticked], please estimate innovative expenditure in 2000, including personnel and related investment expenditures (no depreciation)
3. Measures of Knowledge Flows (Kii and Ki_i) Sources of Information for Innovation Activities
Please indicate the sources of knowledge or information used in your technological innovation activities, and their importance during the period 1998-2000.
Internal Information from Self Within the enterprise Internal Information from Group Other enterprises within the enterprise group Vertical Information from Suppliers and Customers
Suppliers of equipment, materials, components or software + Clients or customers
Information from Competitors Competitors Commercial Information Consultants + Commercial laboratories / R&D enterprises Free Information Professional conferences, meetings + Trade associations +
Technical/trade press, computer databases + Fairs, exhibitions Regulatory Information Technical standards + Environmental standards and regulations +
Health and safety standards and regulations Information from Universities Universities or other higher education institutes + Private research institutes Information from Government Government research organisations + Other public sector (e.g., Government Offices) 4. Other Control Variables Employment Number of employees [at the enterprise] (full time equivalents) Structural Change Did any of the following significant changes occur to your enterprise during the three year
period 1998-2000? Established The enterprise was established.
Merger Turnover increased by at least 10% due to merger with another enterprise or part of it. Sale or Closure Turnover decreased by at least 10% due to sale or closure of part of the enterprise.