Embed Size (px)
Citation preview

NBER WORKING PAPER SERIES
EXPORT AND DOMESTIC PRICES UNDERINFLATION AND EXCHANGE RATE MOVEMENTS
Irving B. KravisNBER and University of Pennsylvania
Robert E. LipseyNBER and Queens College, CUNY
Working Paper No. 176
NATIONAL BUREAU OF ECONOMIC RESEARCH, Inc.261 Madison Avenue
New York, N.Y. 10016
May 1977
Preliminary; Not for Quotation
NBER working papers are distributed Informally and inlimited number for comments only. They should not bequoted without written permission.
This report has not undergone the review accordedofficial NBER publications; in particular, it has not yetbeen submitted for approval by the Board of Directors.

EXPORT AND DOMESTIC PRICES UNDERINFLATION AND EXCHANGE RATE MOVEMENTS*
Irving B. Kravis and Robert E. Lipsey
Introduction
It is almost invariably taken for granted in theoretical descriptions
of the international price mechanism and in the construction of trade
models that a country's export price for a particular product is identical
to its domestic price. Any impact of foreign or domestic events on prices
is expected to fall identically on the export and the domestic price for a
good.
In contrast to these conventional assumptions, the few empirical
studies of international prices have shown that there are fairly substantial
and long—lasting divergences between export and domestic price changes for
the same or closely related products) If that evidence is accepted, the
1
See, for example, "The Economic Situation: Annual Review,"
National Institute Economic Review, National Institute of Economic
and Social Research, No. 27, Feb. 1964, pp. 47—48; Irving B. Kravis
and Robert E. Lipsey [19711, Chapter 8; and [1974].
*The basic data collection and construction of price indexes for this paperwere done under several grants to the National Bureau of Eàonomic Researchfrom the National Science Foundation and extended to recent years under acontract with the U.S. Department of Commerce, Office of Competitive Assess-ment. The views reported here do not necessarily reflect those of eitheragency. Some computer time was provided by the City University of New Yorkand the general funds of the National Bureau. An earlier paper describingsome of these results, entitled tiExport Prices and the Transmission ofInflation," was published in The American Economic Review, Papers andProceedings, February 1977. The indexes included here are in some casesrevisions or extensions of thosein the earlier article.
We are indebted to Mary Boger, Daniel Gottlieb, Marianne Rey, and JudyRosenzweig for data collection and programming and to Eliot Kalter of theUniversity of Pennsylvania for the matching of U.S. export and domestic pricedata for the latter part of the period.

—2—
mechanisms of response and adjustment to changes in foreign and domestic
economic conditions and to exchange rate changes become more complex than
those usually hypothesized.
If there is specialization or if the law of one price does not hold
immediately or exactly, two sets of relative price changes are usually
expected from an inflation or a devaluation. One involves country to
country relative price changes; for example, the prices of a depreciating
country's exportables relative to those of other countries should decrease.
The other involves within—country changes in the prices of tradable goods
(both exportableg and import—type goods) relative to nontraded goods; a
depreciation, for example, should raise the country's tradable goods prices
relative to prices of nontradab].e goods. The first price change should
involve a gain in a country's price competitiveness and therefore in its
share of world markets; the second should involve a shift in production to
exportables from riontraded goods.
If there can be divergences between export and domestic prices,
another type of relative price mechanism may be at work: the depreciating
country should find export prices rising relative to domestic prices of the
same goods. Thus any tendency for exports to increase will reflect not only
the reduction in foreign—currency prices of the country's exports, which
makes its products more attractive to foreign buyers, but also the rise in
own—currency prices of its exports relative to domestic prices of the same
goods, which raises margins on export sales and thus makes exporting a more
profitable activity for its own producers. Even for a small country whose
foreign—currency prices of its exports and imports are fixed by world
markets, the relative rise in profit margins on exports may occur if there
is a sufficient degree of separation between home and foreign markets. Thus

—3—
there is a supply side aspect to the adjustment, operating through changes
in profit margins on export sales relative to domestic sales, as well as
the more familiar demand effects. That is not to say that there will not
also be changes in the domestic prices of exportables relative to home
goods, and shifts in production in response to such relative price changes.
However, since a producer can shift more easily from domestic to export
sales of a product than from production of home goods to production of
export goods we should expect the changes within commodities between
domestic sales and exports to occur more rapidly.
What we expect to find, if export and domestic prices of the same
products need not be identical or move identically, is something like the
following sequence of events from inflation in country A relative to
country B:
1. A's domestic prices rise more than, or sooner than, A's export
prices of the same products.
2. Exporters in A, enjoying an increase in profit margins on
domestic sales relative to exports, tend to shift their sales
to the home market.
3. The rise in A's domestic and export prices relative to B's prices
will mean an increase in demand for B's exports of the same
products and a shift of buyers in A and elsewhere from A's
products to B's products.
4. The increase in export demand will raise B's export prices but
not by as much as the rise in A's prices.
5. The rise in B's export prices relative to its domestic prices
of the same goods will induce a shift by B's producers from home
to foreign markets.

—4--
6. B's domestic prices will rise, as a result of the decrease in
supply, but not by as much as B's export prices did.
A depreciation in country A's exchange rate relative to country B,
arising perhaps from speculative or capital movements, might produce the
following sequence of events:
1'. A's export prices in A's currency rise relative to domestic
prices.
2'. Exporters in A finding export margins higher relative to
domestic margins shift sales from domestic to export markets.
3'. The shift to export markets causes an increase in domestic
prices in A but by less than the increase in export prices.
4'. The decline in A's export prices in foreign currency, relative
to B's prices, produce a shift of buyers from B to A.
5'. The fall in demand for B's exports brings about a decline in
B's export prices, a reduction in export margins relative to
domestic margins, and a shift from export to domestic sales.
6'. The rise in domestic supply causes a decline in B's domestic
price, but not by as much as the decline in B's export price.
Under a system of floating exchange rates both sequences could dIs-
appear if exchange rate changes immediately and completely offset relative
movements of domestic prices. For exanmie, steps 1' and 3' would cancel
step 1 of the first sequence, step 2' would cancel step 2, step 4' would
cancel step 3, etc. As we point out below, that is not what actually
took place: there were substantial fluctuations in relative dollar prices
as well as in domestic currency prices. While some of the domestic price
movements were offset by exchange rate changes, in other cases the exchange
rate changes themselves produced relative domestic price movements that

—5—
were not present in, or smaller in the indexes based on own—currency
prices. Thus we must consider the possibility of treating exchange rate
changes as an independent variable affecting relative prices.
Since the evidence is strong that there are divergences between
export and domestic prices, 'e wish to trace through the effects of
foreign price changes and exchange rate changes on export and domestic
prices and see whether a mechanism of the hypothesized type exists. In
this paper we concentrate our attention on price movements, but offer some
evidence that the response of exports to these price divergences is in the
expected direction.
Data
The origin of this study is in the. data collected for the original
Price Competitiveness study.2 The price indexes published originally for
2
Kravis and Lipsey (1971].
U.S., U.K., German, and Japanese international trade in metals and machinery
for 1953, 1957, and 1961—64 were based on a substantial amount of original
price collection and form the foundation for our later work. These indexes
were interpolated for the Intervening years by whatever data were available3
3
As described for the German indexes in Kravis and Lipsey [1972].

—6—
and those for Germany, Japan, and, partly, the United States extrapolated
to 1975 using publicly available data. In addition, the published data
for Germany and Japan have been used to construct indexes outside the
metals and machinery groups originally covered. For these two countries
our indexes cover all manufactured products except foods and fuel through
1974.
To match the international trade price indexes we constructed
domestic price indexes for the same three countries and the U.K. The
U.S., German, and Japanese domestic price indexes cover all manufactures
for 1953 to 1974, while the U.K. indexes cover all manufactures for
1968—74 and only SITC 67 through 73 before that. For SITC 7, however, the
domestic price indexes for all the countries have been extended through
1975.
In calculating these indexes we have started with the price data
for individual commodities or the most detailed categories for which
indexes were available from the sources cited in the Appendixes. We
constructed unweighted indexes at the 4—digit SITC level,4 assuming
4
United Nations, Standard International Trade Classifications
Revised, Statistical Papers, Series N, No. 34 (United Nations, N.Y.,
1961).

_7_
in effect that all commodities in a 4—digit subgroup were closely
related, and then aggregated these to broader group indexes. Each
4—digit subgroup index was weighted by the particular country's exports
of that subgroup in 1963; this weighting scheme was applied alike in
the aggregation of export price indexes and domestic price indexes and
to the ratios of export to domestic price changes.
Results for U.S. Prices
Our examination of U.S. export and domestic price behavior is
confined to those subgroups of machinery and transport equipment for
which the BLS has published export price indexes covering the years
since 1964. The most recent BLS release5 includes 61 four— and
5
"U.S. Export and Import Price Indexes, Fourth Quarter 1976,"
Bureau of Labor Statistics, February 2, 1977.
five—digit SITC product categories, accounting for 40 per cent of
U.S. exports in 1974, but we are not able to use, in time series analyses,
those commodities for which BLS price collection began only recently.
We were able to extend nine of the BLS series back to 1953 and four
others part of the way back using the Kravis—Lipsey price indexes. In
addition, we have indexes for 1953—64 based on the full set of data
from the Price Competitiveness volume.

—8-
As was clear from some earlier analyses,6 export and domestic prices
6
See footnote 1.
are not identical, do not move identically, and sometimes are not even
very highly correlated. However, the correlation is higher for the
United States than for the other three countries for which comparisons
were made, and high enough that each type of price would usually be
significant in an equation for the other type. Since some part of the
correlation between the two sets of prices may represent not an impact
of one on the other, but the fact that common factors operate on both,
there is some advantage in concentrating on the ratio of export to
domestic prices.
If, as we hypothesized above, export prices are more sensitive,
and/or more quickly sensitive to foreign economic developments than are
domestic prices, we should find that a rise in foreign prices, other
things equal, increases the ratio of export to domestic prices. An
increase in foreign income should have the same effect. Similarly, a
devaluation of the U.S. dollar relative to other currencies should
produce a relative rise in U.S. export prices even if foreign prices,
in foreign currency, do not increase.
The course of the ratio of U.S. export to domestic prices of
machinery and transport equipment (SITC 7) over the period from 1953
through 1975 is described in Chart 1, along with the movement of U.S.


— 10 —
exchange rates. The rise in U.S. exchange rates until 1969 reflects
depreciations in other currencies——France in the late 1950's, Canada in
the early 1960's and the U.K. at the end of the 1960's. 'The fall between
1969 and 1971 reflects currency appreciations, principally that of the
Deutschmark.7 After 1971, of course, the depreciation of the dollar is
7
The change in the effective exchange rate of the U.S. dollar
against other major currencies as a group (see Appendix Table D—l)
during the period of "fixed rates" up to 1971 is not atypical of
major currencies. The constancy of exchange rates under the Bretton—
Woods system may easily be exaggerated.
the main constituent of this average exchange rate movement.
The depreciation of the dollar from the late 1960's to the mid—1970's
(about 17 per cent) was accompanied, or followed, by a substantial upswing
in the rate of U.S. export to domestic prices (amounting to almost 7 per
cent). The earlier long appreciation of the dollar from 1954 to 1968 or
1969, by about 10 per cent, was accompanied by a 2 per cent decline in theprice ratio (or about 5 per cent if the more complete, but less consistentB Series of Appendix Table A—l is used).8 Thus there is some indication
8As can be seen from the columns in Appendix Table A-i showing
unweighted average and median export/domestic price ratios and the
series on the diffusion of relative price changes (the per cent of
increases in tue export/domestic price ratio among four—digit sub-
groups), the movement of the price ratio for SITC 7 did almost always

— 11 —
represent a consensus among the subgroups, with the aggregate price
ratio rising when more than 50 per cent of the subgroup ratios were
rising. There were only three exceptions to this agreement in the
22 years.
here that the export/domestic price ratio may have been influenced by
exchange rate changes, although the relationship is certainly not close.
Aside from questions of causation, it is clear that U.S. export
prices in foreign currency did not fall as much in the 1970's or rise
as much in the 1950's and 1960's as one might have inferred from the
movements of domestic prices and the U.S. exchange rate. In other words,
even if U.S. domestic prices were not affected by depreciations or
appreciations of the dollar, 20 to 50 per cent of the effect of apprecia-
tions up to 1968 and almost half of the effect of the later depreciations
on foreign currency prices of U.S. exports was offset, after a few years,
by declines or rises in U.S. export prices relative to domestic prices.
If U.S. domestic prices were decreased by the appreciation and increased
by the depreciation, the offset was even larger.
The changes in the export/domestic price ratio mean that there
must have been changes in margins on export sales as compared with those
on domestic sales. Producers' margins on export sales must have declined
relative to those on domestic sales for most of the period, particularly
from 1953 to 1957, and 1964 to 1966 or 1968 and then must have risen
substantially after 1972.
We would expect the U.S. export/domestic price ratio to be
affected not only by exchange rates but also by foreign price movements,
if they are different from those in the United States. The relative

— 12 —
price movements are measured in two ways. One is the relative rate of
inflation, which is a comparison of price indexes in each country's own
currency. The second is the index of domestic price competitiveness,
which is the comparison of price indexes translated into a single
currency. For example, to examine effects on the United States, we
translate foreign prices into dollars. The measure of domestic price
competitiveness is intended to reflect domestic rates of inflation and
cyclicaipressures, plus the effects of changes th exchange rates,
rather than the ability of each country to sell abroad in competition
with others. That we measure by a price competitiveness index based on
international prices.
If we were not confining our attention in this paper to the price
movements themselves, an obvious extension would be to substitute, for the
inflation rates, some of the factors that account for the rate of inflation,
such as the growth in the money supply of each country. Except to the
extent that the money supply is itself dependent on the balance of
payments, the use of a money supply variable .'ould avoid the problem that
our "independent" variables, such as foreign prices and exchange rates,
could be thought of as depending to some degree on the home country's prices.
The movements of the U.K. and German relative inflation rates, in
chart 2, appear to offer a possible explanation for some of the fluctua-
tions in the U.S. export/domestic price ratio up to the early 1960's.9
9The strong downward trend of Japanese relative prices seems
to be reflected more strongly in the B Series of Appendix Table A—l
than in the A Series shown in the chart.

CHART 2
U.S. Export/Domestic Price Ratio and Inflation Rates in Germany, Japan, and the U.K.
Relative to the U.S., SITC 7, as Measured by Domestic Prices in DII, Yen, , a
nd $
e .
- on
U.sIt
-
1xpo
rt/
-
-
Pri
-
40
30
I 20
. -
10
_
- -
- . -
. U
-
00
99 --
- —
-
-
- -
90
98
_
—-
- -
- -
. 80
97
- - :
--
- 70
96
53
54
55
56
57
58
59
60
61
62
63
64
65
66
67
68
69
70
71
72
73
74
Source:
Appendix Tables A—i and A—3.

— 14 —
After that, the changes in U.S. domestic price competitiveness, particu-
larly relative to Germany, which reflect the sharp exchange rate changes
of the 1970's, seem more closely related to the price ratio (Chart 3).
Although the timing is not exact, each broad movement in German and
U.K. prices relative to U.S. prices, in their own currencies or translated
into dollars, is matched by a corresponding change in the U.S. export/
domestic price ratio. That is, if we divide the period into phases accord-
ing to relative price movements (Table 1) we find that during each period
of relatively falling German and U.K. prices the export/domestic price
ratio for the United States declined, and during each period of rising
German and U.K. prices the U.S. export/domestic price ratios increased.
The change in Japanese relative prices involved only a long decline through
1971 and then an increase but there was no close match with the U.S. export/
domestic price ratios.
The swings in the export/domestic price ratio appear fairly small
compared with the changes in domestic price competitiveness. However, if
the effect of these changes on the export/domestic price ratio is mainly
via changes in margins on exports compared to those on domestic sales,
even a small swing in the price ratio could strongly influence the supply
of exports. For example, jf the margin on both domestic and export sales
was initially 5 per cent1° and the export price then rose by one per cent
10
For the U.S. domestic corporations roughly approximating SITC 7
the ratio of net income before tax to sales was about 4 per cent in
1970. After tax income was less than 2 per cent of sales (Statistics
of Income, 1970: Corporate Income Tax Returns, p. 18, Industries 25
through 28).

CH
AR
T 3
U.S
. Export/Domestic Price Ratio and U.S. Domestic Price Competitiveness Relative to
Germany, Japan, and the U.K., SITC 7, as Measured by Domestic Prices in $
]-
- __
U.
.i -
- m
es
'Ce
I
160
U.S.
150
Exp
.
-
P ri
104
I 14
0
.
,
130
120
110
. -
. 10
0
99
. -
- --
--
-
- .
90
98
• -
--
- 80
97
.
-- -
70
96
53
54
55
56
57
58
59
60
61
62
63
64
65
66
67
68
69
70
71
72
73
74
75
Sour
ce:
pendixTab1es A—i and A—3.

— 16 —
TABLE 1
Changes in U.S. Export/Domestic Price Ratio Compared withChanges in Relative Rates of Inflation and in U.S. DomesticPrice Competitiveness Relative to Germany and the U.K.
Machinery and Transport Equipment: SITC 7
Per Cent Change in
'U.S.
Period
InflationRelative
U.S.a
Rateto
Domestic Price
CompetitIvenessRelative to
b
U.S.
Export/DomesticPrice Ratio
-
Germany U.K.Germany U.K.
1953_59c —16.8 —5.0 —16.4 —5.0 —1.7
1959—65 +13.5 +6.9 +18.6 +6.3 +1.7
1965—69 —7.5 —4.8 —5.8 —18.5 —1.6
1969—74 +7.2 +22.0 +62.7 +19.4 +4.9
Source: Appendix Tables A—i and A—3.
aMeasured by ratios of German and U.K. domestic price indexes,
in own currency, to the U.S. domestic price index, in dollars.
bMeasured by ratios of German and U.K. domestic price indexes,
in dollars, to U.S. domestic price index.
c1954—59 for the U.K.

— 17 —
relative to the domestic price, the margin on export sales would become
20 per cent higher than that on domestic sales, giving a strong inducement
to producers to shift from domestic to export markets.
The effect of any inducement to U.S. producers to shift to export
markets should be evident in the ratio of exports to domestic shipments.
As can be seen in Chart 4, there were comparatively small swings in this
ratio before the early l970's, but the sharp rise in the export/domestic
price ratio after 1972 was accompanied by a similarly sharp increase in
the ratio of export to domestic sales. Thus the record of these last
years conforms to the hypothesis of a high elasticity of response, on the
supply side, to a change in margins on export relative to domestic sales,
although it presumably also reflects the effects of relative changes in
demand, which could produce a similar relationship.
One problem of the analysis of price and exchange rate changes is
clear from a comparison of Charts 1 and 3. That is that the major swings
in German, and later British prices, expressed in dollars, took place in
the years after 1969, at the same time as the major changes in the exchange
rate of the dollar, and it will therefore be difficult to distinguish
statistically between the two variables. tn fact the depreciation of the
dollar relative to the DM was a significant part of the change in the U.S.
exchange rate vis—a—vis all countries after 1969, plotted in Chart 1.
The effects of exchange rate changes can be seen in a comparison
between the two parts of Appendix Table A—4, summarized in Table 2. Over
the period as a whole, exchange rate changes for the U.K. and Japan tended
to offset relative price changes, almost completely for the U.K. and
partially for Japan. However, in the case of Germany, the rise in the

CH
AR
T 4
U.S. Export/Domestic Price Ratio and Ratio of Exports to Total Manufacturing Shipments
Machinery a
nd Transport Equipment: SITC 7
1963=100
97
53
54
55
56
57
58
59
60
61
67
68
69
99
98
63
64
65
66
80
70
71
72
73
74
75
— 19 —
TABLE 2
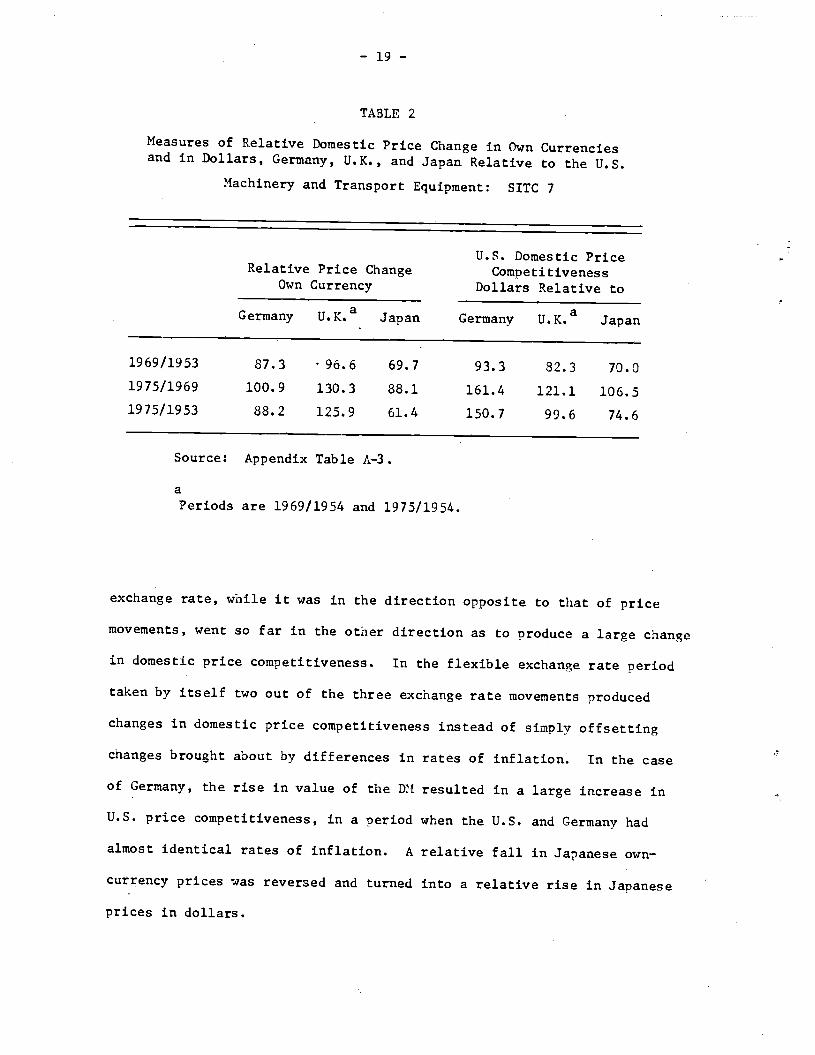
Measures of Relative Domestic Price Change in Own Currenciesand in Dollars, Germany, U.K., and Japan Relative to the U.S.
Machinery and Transport Equipment: SITC 7
RelativeOwn
Price ChangeCurrency
U.S. Domestic PriceCompetitiveness
Dollars Relative to
Germany U.K.a Japan Germany U.K.a Japan
1969/1953 87.3 96.6 69.7 93.3 82.3 70.0
1975/1969 100.9 130.3 88.1 161.4 121.1 106.5
1975/1953 88.2 125.9 61.4 150.7 99.6 74.6
Source: Appendix Table A—3.
a
Periods are 1969/1954 and 1975/1954.
exchange rate, while it was in the direction opposite to that of price
movements, went so far in the other direction as to produce a large change
in domestic price competitiveness. In the flexible exchange rate period
taken by itself two out of the three exchange rate movements produced
changes in domestic price competitiveness instead of simply offsetting
changes brought about by differences in rates of inflation. In the case
of Germany, the rise in value of the DI resulted in a large increase in
U.S. price competitiveness, in a period when the U.S. and Germany had
almost identical rates of inflation. A relative fall in Japanese own—
currency prices was reversed and turned into a relative rise in Japanese
prices in dollars.

— 20 —
We are thus led to suspect that changes in exchange rates play
some partially independent role and are not simply offsets to differences
in inflation rates. For that reason we treat them separately in analyzing
movements in prices and in the export/domestic price ratio.
Since we are looking here for measures of pressure on each country's
domestic economy we also experimented with non—price measures of business
cycle conditions. They proved significant only for Japan, however, andwe therefore reserve discussion of them to the section on factors influ-
encing Japanese prices.
Any analysis of one variable at a time is subject to the difficultythat several, variables are likely to be acting simultaneously on prices.
We have therefore explored several combinations of variables with a few
multiple regressions in which we attempt to explain the movements of
export and domestic prices and the export/domestic price ratio by changesin some of the obvious variables. In particular we wish to consider the
effects of foreign relative inflation rates, U.S. exchange rates, and the
combination of the two: U.S. domestic price competitiveness relative toeach country. We have somewhat biased the results against our hypothesesby taking one country at a time relative to the United States, whenpresumably all have some influence. We were not able to include morethan one foreign country in an equation because we quickly ran short ondegrees of freedom.
Looking first at the movement of the U.S. export/domestic priceratio we examine the influence of relative inflation rates and exchange
rates separately in the first six equations of Table 3 and then theircombined influence as the domestic price competitiveness variable inthe next four equations)''
11The exchange rate variable in the equations is the change in
price of foreign currency, rather than the change in price of the
dollar, as in Chart 1. Thus the effect of a U.S. devaluation in the
equations is in the same direction as that of a rise in foreign prices.

— 21 —
TABLE 3
Regressions of U.S. Export/Domestic Price Ratio on RelativeForeign Prices and Exchange Rates, Current and Laggeda
Machinery and Transport Equipment: SITC 7
Price Variable
Eq. Lagged LaggedNo. Constant Current 1 Year 2 Years
Exchange Rate($/Foreign Currency)
LaggedCurrent 1 Year
Lagged2 Years
—2R DW
Price Variable: Relative Rate of Inflation
Germany (1953—75)
1 —0.1889 —.0440 —.0190 —.0111 .1754 .52 2.21(97)b (.66) (.26) (.30) (4.51)
2 —.1905 .0262 —.0822 .0203 —.0358 .1623 .0584 .51 2.63(.90) (.30) (.81) (.25) (.84) (3.87) (1.22)
U.K. (1954._75)c
3 —.0467 .2996 —.0952 —.0102 —.0438 .27 2.44
(.21) (2.34) (.66) (.17) (.72)
4 —.0273 .3406 —.2643 .2096 .0233 —.0785 .0815 .33 2.58(.12) (2.56) (1.52) (1.34) (.39) (1.27) (1.31)
Japan (1953—75)
5 0.4745 —.0001 .1375 —.0603 .1482 .41 2.05(1.03) (.00) (2.16) (1.13) (1.62)
6 —0.3087 .1030 —.0734 —.1098 —.0035 —.0196 .2379 .57 2.64(.59) (.88) (.59) (.87) (.07) (.19) (2.53)
Price Variable: U.S. Price Competitiveness
Germany (1953—75)
7 .0417 —.0306 .1177 .40 1.87
(.22) (.97) (3.79)
8 .0106 —.0284 .1012 .0306 .38 1.98
(.05) (.86) (2.76) (.95)
U.K. (1954—75)
9 0.2995 .1086 —.0998 .1366 .12 1.69
(1.31) (1.61) (1.30) (2.02)
Japan (1953—75)
10 0.3896 —.0460 .1664 .47 2.15(2.20) (1.30) (4.32)
11 0.4437 —.0321 .1423 .0270 .44 2.19
(2.17) (.62) (2.18) (.45)

— 22 —
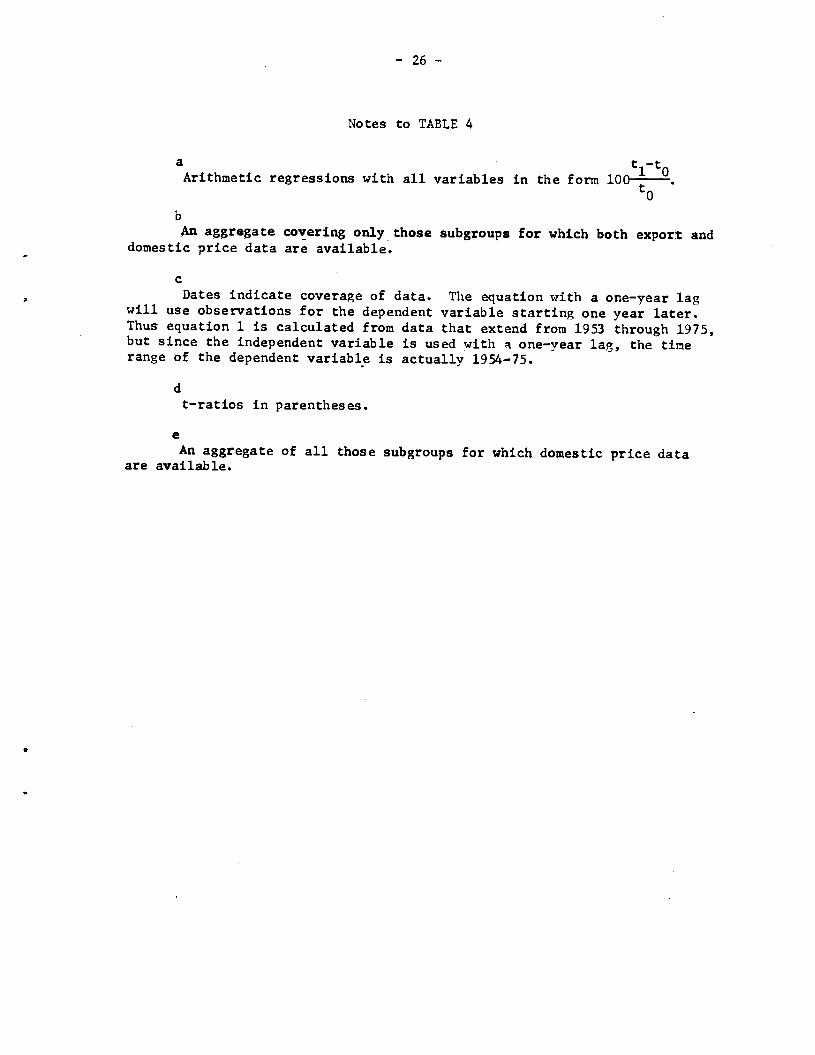
Notes to TABLE 3
a
ti—toArithmetic regressions with all variables in the form 10(10
b
t—ratjos in parentheses.
C
Dates indicate coverage of data. The equation with a one—year lagwill use observations for the dependent variable starting one year later.Thus equation 3 is calculated from data that extend from 1954 through 1975,but since the independent' variable isused with a one—year lag, the time
range of the dependent variable is actually 1955—75.

— 23 —
For Germany it is changes in the exchange rate (the price of the
DM) which affect the U.S. export/domestic price ratio, with a one—year
lag. In the case of the U.K., the only significant influence on the
U.S. price ratio is the expected positive one of relative inflation rates
in the same year. For Japan there is some indication of both price and
exchange rate influences with a one—year lag in equation 5 while the
exchange rate with a two—year lag is the significant variable once it
is entered.
When we combine exchange rates and relative inflation rates for
Germany and Japan the results are quite consistent in showing a signif i—
cant impact of changes in domestic price competitiveness acting with a
one—year lag. Equations 8 through 11 mostly explain less of the varia-
bility in the U.S. export/domestic price ratio than equations 3 through
6, but they are also less affected by serial correlation. In the British
case, however, little relation to U.S. price ratios is visible, perhaps
because there was little overall change in domestic price competitiveness.
On the whole, then, the evidence suggests that the U.S. price ratio
is influenced in the expected direction by foreign price and exchan,e rate
changes, mostly with a lag of about a year. The German influence was
mostly through exchange rate changes, not surprisingly because U.S. price
competitiveness relative to Germany was dominated by exchange rates;
relative inflation rates were similar.
In Tables 4 through 6 we break down the effects of foreign prices
and exchange rates on the U.S. export/domestic price ratio into the
separate influences on U.S. export and domestic prices. The analysis is
crude in several respects. In particular, of the many domestic influences
on prices we have selected only one, unit labor costs, as a way of

— 24 —
summarizing the effects of any domestic monetary and fiscal developments
as well as those of changes in labor productivity. Unfortunately, the
unit labor cost variable applies to manufacturing as a whole rather than
to machinery and transport equipment. Thus the variable is only really
appropriate in the equations for all manufacturing.
The equations for German price and exchange rate influences on U.S.
prices (Table 4) consist of three sets: four equations for an aggregate
of those subgroups of SITC 7 for which both export and domestic prices
are available, two equations for domestic prices of SITC 7 as a whole,
including those commodities for which we have no export price data, and
two equations for all manufactured products, SITC 5 through 8. They sug-
gest some lagged effects of German prices, at least in the machinery and
transport equipment area, and lagged effects of exchange rate changes on
U.S. domestic prices of manufactures as a whole. As we expect from the
results for the export/domestic price ratio, the rate of inflation in
Germany did not affect U.S. export and domestic prices very differently,
although there were significant lagged effects on both of them. The
exchange rate coefficients are unexpectedly negative for the current year,
but again of roughly the same size for U.S. export and domestic prices.
They are also of about the same size as, but opposite in sign to, the
price coefficients, and most of the current year impact therefore washes
out in the equations in which German nrices in dollars are used. In the
case of the exchange rate lagged one year, however, the coefficient for
export prices was positive while that for domestic prices was negative,
although neither was statistically significant. It is this difference
in sign that produces the lagged relationship of foreign prices in

TABLE 4
Regressions of U.S. Export and Domestic Price Indexes on
German Prices and Exchange Rates, Current and Laggedd
Machinery and Transport Equipment:
SITC 7; and All Manufactures: SITC 5—8
U'
Currency
of
Foreign
Eq.
Dependent
Price
No.
Variable
Variable
Constant
U.S.
Unit
Labor
Cost
Price Variable
Exchange Rate ($/DM)
Current Lagged
1 Year
Current
Lagged
1 Year
2
R
DW
Subset of SITC 71.1 (]
g537
5)C
1
XPI
DM
.4500
(.66)d
.7308
(5.31)
.1882
(.72)
.3741
(1.97)
—.1858
(1.76)
.0767
(.56)
.81
1.61
2
DPI
DM
.5615
,
(.89
) .6563
(5.17)
.2578
(1.08)
.3672
(2.10)
—.1604
(1.65)
—.1015
(.81)
.78
1.79
3
XPI
$
1.0812
(1.77)
.7766
(5.79)
—.1029
(1.13)
.2293
(2.29)
.79
1.64
4
DPI
$
Tot
al SITC 7e (195375)
1.3906
(2.24)
.7014
(5.13)
—.0648
(.70)
.1203
(1.18)
.71
1.84
5
DPI
DM
1.3637
(2.10)
.6918
(5.29)
.1434
(.58)
.2476
(1.37)
—.1917
(1.91)
—.0025
(.02)
.76
1.25
6
DPI
$
1.9066
(3.34)
.7327
(5.84)
—.1174
(1.38)
.1326
(1.42)
.75
1.44
SITC 5—8 (1953—74)
7
DPI
DM
1.6449
(3.76)
.4974
(5.06)
.0806
(.42)
—.2249
(1.42)
—.1793
(2.86)
.4431
(3.25)
.89
1.43
8
DPI
$
1.2026
(2.70)
.6347
(5.56)
—.1204
(1.74)
.2592
(3.33)
. .82
1.51
— 26 —
Notes to TABLE 4
ati—toArithmetic regressions with all variables in the form 1000
0An aggregate covering only those subgroups for which both export and
domestic price data are available.
CDates indicate coverage of data. The equation with a one—year lag
will use observations for the dependent variable starting one year later.Thus equation 1 is calculated from data that extend from 1953 through 1975,but since the independent variable is used with a one—year lag, the timerange of the dependent variable is actually 1954-75.
dt—ratios in parentheses.
e
An aggregate of all those subgroups for which domestic price dataare available.

— 27 —
dollars to the export/domestic price ratio. Thus our comparisons of
equations for matched sets of export and domestic prices indicate that
German own—currency prices or rates of inflation affect both U.S. exoort
and U.S. domestic prices by a year later. German prices in dollars
significantly affect only U.S. export prices, also after a year.
The equations for SITC 7 as a whole can only be calculated for
domestic prices but they suggest results fairly similar to those for the
subgroups: a lagged foreign inflation or foreign currency price effect
and a perverse current exchange rate effect. The equations for all manu-
facturing, SITC 5—8, indicate a strong lagged positive effect of exchange
rate changes, more than offsetting the unexpected current year negative
coefficient, and a corresponding strong effect for German domestic prices
in dollars, also lagged one year. For all manufacturing then, the equa-
tions suggest that 10—15 per cent of the effect of, say, a rise in German
domestic prices or exchange rates is offset, after a year, by a corre-
sponding rise in U.S. domestic prices, apart from any additional offsetting
that would occur from a rise in the U.S. export/domestic price ratio, such
as we found for machinery.
British prices (Table 5) also showed a larger impact on U.S. export
prices than on domestic prices over two years, as we would expect. The
impact on export prices was in the current year, as was that on the U.S.
export/domestic price ratio, while that on U.S. domestic prices showed
some tendency to be delayed until the next year. There was no visible
effect of exchange rates and that of U.K. prices measured in dollars was
only marginally significant, although the coefficients were substantial.
We can observe a similar, but even stronger relation of current British

TABLE 5
Regressions of U.S. Export and Domestic Price Indexes on
U.K. Prices and Exchange Rates, Current and Laggeda
Machinery and Transport Equipment:
SITC 7; an
d AU. Manufactures: SITC 5—8
CO
Currency
of
Foreign
Eq.
Dependent
Price
No.
Variable
Variable
Constant
U.S.
Unit
Labor
Cost
Price Variable
—
Lagg
ed
Current
1 Year
Exchange
——
Cur
rent
Rate ($/4)
Lagged
1 Year
—2
R
DW
Subset of SITC 7b (1954_75)C
1 XPI
.1284
(•32)d
.3046
(2.19)
.4543
(3.24)
.1106
(.87)
—.0850
(.97)
.0499
(.56)
.92
1.96
2
DPI
.2562
(.70)
.3190
(2.48)
.2176
(1.68)
.2926
(2.49)
—.1329
(1.64)
—.0144
(.17)
.91
1.40
3
XPI
$
.5990
(1.02)
.7487
(5.52)
.1982
(1.64)
.1031
(.89)
.81
1.77
4
DPI
$
Tot
al SITC 7e (1954—75)
5
DPI
.7892
(1.45)
.6477
(1.53)
.6417
(5.07)
.4689
(3.16)
.1129
(1.00)
.1969
(1.31)
.1622
(1.50)
.1896
(1.39)
—.0858
(.92)
.0239
(.25)
.78
.88
1.83
1.50
6
DPI
$
1.0180
(2.09)
.7092
(6.27)
.0966
(.96)
.1230
(1.27)
.83
2.05
tic__
(195
5—74
)
7
DPI
0.2229
(.46)
.4063
(3.19)
.4298
(3.84)
.0000
(.00)
—.0059
(.65)
.0042
(.51)
.91
1.94
8
DPI
$
.6660
(1.30)
.7480
(6.00)
.1697
(1.69)
.0202
(.11)
.82
2.52

— 29 —
Notes to TABLE 5
ati—toArithietic regressions with all variables in the form 1000
b
An aggregate covering only those subgroups for which both export anddomestic price data are available.
C
Dates indicate coverage of data. The equation with a one—year lagwill use observations for the dependent variable starting one year later.Thus equation 1 is calculated from data that extend from 1954 through 1975,but since the independent variable is used with a one—year lag, the timerange of the dependent variable is actually 1955—75.
dt—ratios in parentheses.
e
An aggregate of all those subgroups for which domestic price dataare available.

— 30 —
inflation to U.S. domestic prices in the equation for all manufactured
products. Again there is little or no effect of exchange rates or of
British prices measured in dollars.
Japanese prices appear to have a somewhat larger impact on U.S.
export prices than on U.S. domestic prices (Table 6). No exchange rate
effects are visible, but the combination of inflation rates with exchange
rates in the dollar price equations produces some very different results
from those in the equations in which the variables are separated. In
the latter case (own—currency prices) there seem to be positive current
and lagged price effects, but in the former case (dollar prices) the
current year coefficients are generally negative, and all the expected
positive price effect is concentrated in the second year. We tend to
discount the equations in yen prices because the coefficients for U.S.
unit labor cost seem suspiciously low. Presumably the current—year
relative inflation effect becomes entangled with the current—year labor
cost effect.
Results for German Prices
For Germany we are able to extend our study beyond machinery and
transport equipment, which has been the focus of our attention until now,
and to examine the behavior of prices of all manufactured goods (SITC 5-8)
except foods and fuel. One advantage of the broadness of the German
coverage is that we can more appropriately use variables for total manu-
facturing, such as unit labor cost. These aggregate variables are still
not ideal for our purposes, since the weighting is generally by the domes-
tic importance of each industry, but they may nevertheless provide some
insights into price behavior.

TABLE 6
Regressions of U.S. Export and Domestic Price Indexes on
Japanese Prices and Exchange Rates, Current and Lagged4
Machinery and Transport Equipment: SITC 7
; and All Manufactures: SITC 5—8
L)
Currency
of
Foreign
Eq.
Dependent
Price
No.
Variable
Variable
Constant
U.S.
Unit
Labor
Cost
Price Variable
Exchange Rate ($/Yen)
Current Lagged
1 Year
Current
Lagged
1 Year
2
R
DW
Subset of SITC
(1953_75)C
1.
xPi
Yen
2.7472
(7.07)d
.1588
(1.13)
.4873
(3.16)
.4270
(4.13)
—.0137
(.13)
.1678
(.94)
.93
1.70
2
DPI
Yen
2.5766
(7.81)
.2115
(1.77)
.4151
(3.25)
.3469
(4.20)
.0806
(1.00)
—.2905
(.14)
.93
2.32
3
xpi
$
1.9318
.5362
—.2352
.4878
.82
2.16
(3.59)
(3.02)
(2.13)
(2.97)
4
DPI
$
1.9432
(3.66)
.5116
(2.92)
—.2251
(2.07)
.3671
(2.27)
.76
2.16
Total SITC 7
e (1953—75)
5
DPI
Yen
2.8516
(6.43)
.2725
(1.70)
.4459
(2.60)
.2330
(2.10)
.0549
(.51)
—.3111
(1.71)
.87
1.06
6
DPI
$
2.1493
(4.04)
.5957
(3.40)
—.1799
(1.65)
.2656
(1.64)
.76
1.70
SITC 5—8 (1953—74)
7
DPI
Yen
1.9979
(4.64)
.2221
(1.25)
.2219
(1.41)
.2321
(1.80)
—.1400
(1.32)
.0107
(.04)
.84
1.49
8
DPI
$
1.7433
(3.98)
.3976
(2.49)
—.0481
(.90)
.2619
(3.12)
.81
1.79

— 32 —
Notes to TABLE 6
ati—toArithmetic regressions with all variables in the form 1000
bAn aggregate covering only those subgroups for which both export and
domestic price data are available.
C
Dates indicate coverage of data. The equation with a one—year lagwill use observations for tne dependent variable starting one year later.Thus equation 1 is calculated from data that extend from 1953 through 1975,but since the independent variable is used with a one—year lag, the timerange of the dependent variable is actually 1954-75.
dt—ratios in parentheses.
e
An aggregate covering all those subgroups for which domestic pricedata are available.

— 33 —
As is true for the United States, there have been substantial move—
merits in the ratio of German export to domestic prices (Chart 5). For all
manufactures the peak ratio, in 1954, was about 8 per cent above the
lowest, in 1972. Between those two years the change in this-ratio offset
roughly 20 per cent of the effect of exchange rate changes on German
export prices in foreign currency. The trend of the ratio was down, just
as the trend in exchange rates was up, and the largest decline in the
ratio was from 1960 to 1962, at the time of and after the 1961 revaluation.12
12The fall in the export/domestic price ratio was quite general
among the classes of German manufactured goods, particularly from 1960
to 1962.
Contrary to our expectations regarding the effect of exchange rates,
however, the ratio rse from 1972 to 1974 despite large upward revaluations
in those years, and it also fell sharply in 1954—57, when the exchange rate
was stable. Clearly, then, the exchange rate was not the sole influence
on the export/domestic price ratio.
The decline in the price ratio in 1960—62 was over 3 per cent, while
the upward revaluation of the DM was 5 per cent. Thus more than 60 per
cent of the effect of the revaluation on export prices in foreign currency
(assuming no effect on domestic prices) was offset by the fall in the
export/domestic price ratio. If domestic prices were reduced by the
revaluation, of course, the offset was even greater. In 1970—72 the
offset was much smaller——only 2 per cent against a revaluation of .7 per
cent, or of 16 per cent if we take the change from 1969 to 1972.

- .
CH
AR
T 5
.
Ger
man
E
xpor
t/Dom
estic
P
rice
Rat
io
and
Ger
man
E
ffect
ive
Exc
hang
e R
ate
All
Man
ufac
ture
s.
SIT
C
5—8
and
Mac
hine
ry
and
Tra
nspo
rt
Equ
ipm
ent,
SIT
C 7
- -
. -
- -W
-H--
1 cb
hnge
:
' ,
Rat
e
'In
-
i__
- --
.
--
00
99
- -
--
-- :
--
-
90
.
--
- -
: -
I 85
53
54
55
56
57
58
59
60
61
62
63
64
65
66
67
68
69
70
71 .
72
73
74
75

— 35 —
In 1972—74 the change in the price ratio reinforced the effect of the
revaluation on German export prices.
The machinery and transport equipment group, which was the one
analyzed for the United States, is shown separately in Chart 5. Here the
relation of exchange rate changes to the price ratio seems stronger, with
the price ratio declining from 1959 to 1962 and 1967 through 1974 while the
price of German currency was rising in both periods. When the currency
price was relatively stable, in the mid—1950's and the mid—1960's, the price
ratio also had a period of stability. The 1959—62 fall in the price ratio
by almost 4 per cent offset almost three quarters of the upward revaluation
of the DM in 1961 (spread over two years in the annual averages shown on
the chart). In 1967—74 the fall in the price ratio, again over 3 per cent,
offset less than 8 per cent of the large upward revaluation of the DM.
Of course, the fact that changes in the export/domestic price ratio
do not go far toward offsetting a more than 40 per cent revaluation is
not surprising. Even a 3 per cent change in the export/domestic price
ratio is large relative to typical sales margins in manufacturing, as was
pointed out earlier. The fact that the ratio for Germany could fall as
much as the 7 per cent shown for all manufacturing or the 5 per cent for
machinery and transport equipment suggests that German manufacturers'
margins on exports nay have been greatly inflated by the undervaluation
of the DM in the late 1950's.
Another possible influence on the German export/domestic price
ratio is, of course, foreign prices, shown in Chart 5•13 The decline in
13These are imperfect measures for a number of reasons, but
particularly because the indexes for different countries are weighted

CU
APT
6
Ger
man
Export/Domestic Price Ratio, SITC 5—8, and Ratio of U.S., U.K., French, and Japanese
to German Domestic Prices of Manufactures, in Own Currencies
10 3
'135
106
--
- -
---
- -
130
•1
, I
.. T
'
125
.-. -'
--a-
-
1 -'
I .
- 12
0
. .
115
- —
--
.
-—
- —
- '
- --
- -
- .b
11
0
-
105
100
.-
- ::'
00
99
- I
- 95
9e
--
--
- -
90
97
- 85
- -
80
53
54
55
56
57
58
59
60
61
62
63
64
65
66
67
68
69
70
71
72
73
74
75
— 37 —
by domestic trade weights, which are different for each country, and
because they differ substantially in coverage.
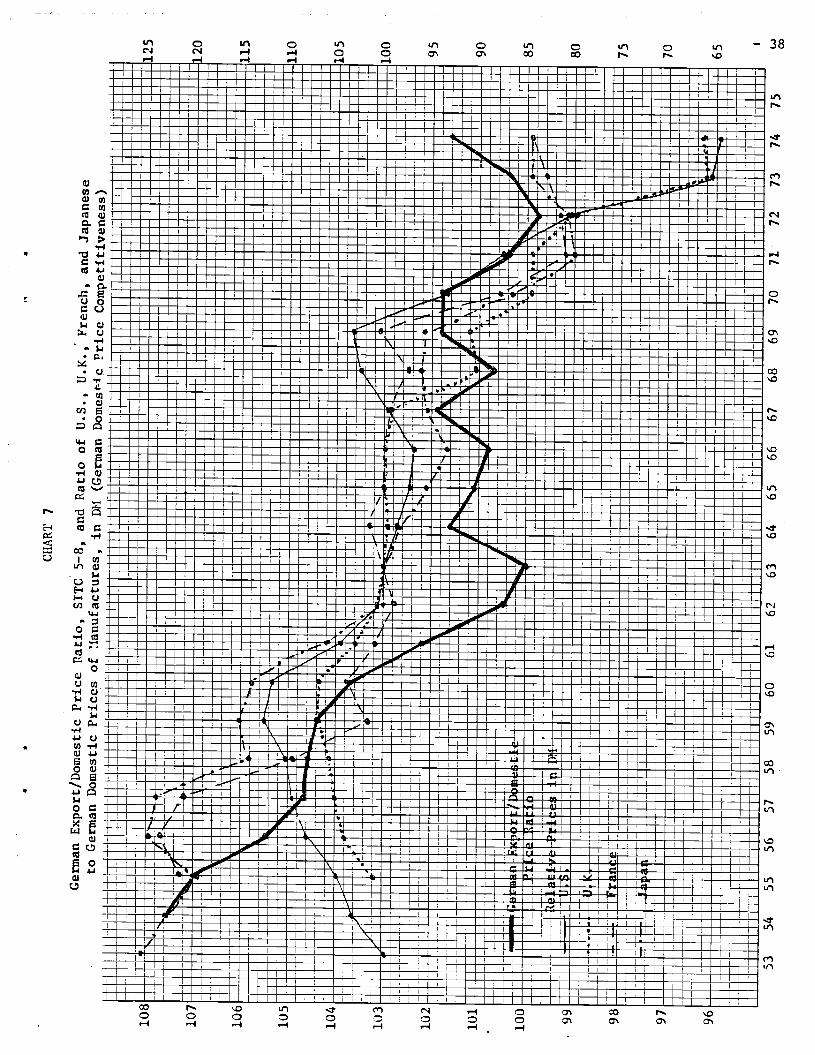
the German export/domestic price ratio before 1963 and some of the fluctua-
tions after that followed fairly well the movements of relative Japanese
prices. The French relative price level, rising from 1971 through 1974
and the sharp increase in British and Japanese prices a year later may
provide a reason for the increase in the German export/domestic price
ratio after 1972, which seemed to be inexplicable in terms of exchange
rate changes. Thus some of the movements in the export/domestic price
ratio seem to be related to inflation in other countries, as we hypothesized.
German domestic price competitiveness relative to the other countries
(relative prices in DM), particularly France and Japan, show a closer
relationship with the export domestic price ratio than the own—currency
indexes (Chart 7). They match in the long decline to the earlier 1960's,
the rough stability through that decade, the sharp decline until 1971
(for prices) or 1972 (for the price ratio), and then the rise after that
date. Thus there is some suggestion here that the German export/domestic
price ratio responds to the combination of relative inflation rates and
exchange rates represented by these measures of domestic price competitive-
ness.
Since we think of the relative inflation rates as indicators of
pressure on domestic economies, we experimented also with measures of
business cycle conditions. We found these less satisfactory than the
relative price measures, however, in explaining changes in the German
export/domestic price ratio.
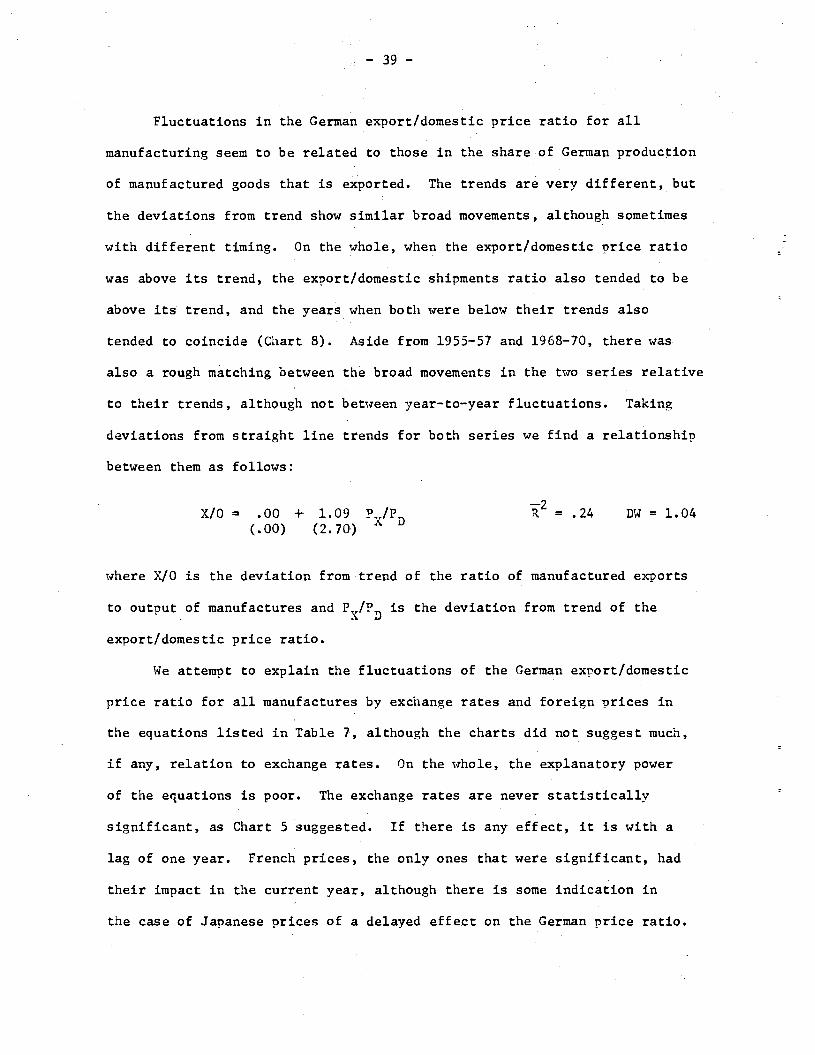
Fluctuations in the German export/domestic price ratio for all
manufacturing seem to be related to those in the share of German production
of manufactured goods that is exported. The trends are very different, but
the deviations from trend show similar broad movements, although sometimes
with different timing. On the whole, when the export/domestic once ratio
was above its trend, the export/domestic shipments ratio also tended to be
above its trend, and the years when both were below their trends also
tended to coincide (Chart 8). Aside from 1955—57 and 1968—70, there was
also a rough matching between the broad movements in the two series relative
to their trends, although not between year—to—year fluctuations. Taking
deviations from straight line trends for both series we find a relationship
between them as follows:
X/O = .00 ÷ 1.09 = .24 DW = 1.04(.00) (2.70)
D
where X/O is the deviation from trend of the ratio of manufactured exports
to output of manufactures and is the deviation from trend of the
export/domestic price ratio.
We attempt to explain the fluctuations of the German exoort/domestic
price ratio for all manufactures by exchange rates and foreign prices in
the equations listed in Table 7, although the charts did not suggest much,
if any, relation to exchange rates. On the whole, the explanatory power
of the equations is poor. The exchange rates are never statistically
significant, as Chart 5 suggested. If there is any effect, it is with a
lag of one year. French prices, the only ones that were significant, had
their impact in the current year, although there is some indication in
the case of Japanese prices of a delayed effect on the German price ratio.


— 41 —
TABLE 7
Regressions of German Export/Domestic Price Ratio onRelative Foreign Prices and Exchange Pates
All Manufactures: SITC 5—8
Eq.No.
Foreign Exchange RatePrice Variable (DM/Foreign Currency)
Foreign Constant LaggedCountry Term Current 1 Year Current
Lagged —21Year R DW
1
Foreign Price Variable: Relative Rate of Inflation
U.S. (1953—74) —.4954 .1563 .0032 —.0392(1.81) (1.15) (.02) (.60)
—.0472 —.07
(.72)
1.87
2 U.K. (1955—74) —.4036 .0361 .0144 .0117(1.23) (.51) (.07) (.23)
—.0416 —.13
(.63)
2.09
3 France (1955—74) —.3142 .1424 .0486 .0251(1.16) (2.63) (.68) (.44)
.0619 .31
(1.31)
1.79
4 Japan (1953—74) —.1804 .0606 .0526 —.0344(.66) (1.07) (.82) (.36)
—.0842 .09
(.82)
2.08
5 Japan (1953—74) —.0864 .0933
(.37) (1.71)
.1236 .08
(1.32)
1.94
6Foreign Price Variable: German Domestic Price Competitiveness
U.s. (1953—74) —.3225 .0121 —.0329(1.30) (.24) (.68)
—.09 1.89
7 U.K. (1955—74) —.3500 .0057 —.0715(1.26) (.11) (1.49)
.01 2.03
8 France (1955—74) .0556 .0603 .0712(.22) (1.20) (1.41)
.10 1.91
9 Japan (1953—74) —.0254 .0505 .0909
(.11) (.96) (1.71).11 1.97
10 Japan (1953—74) —.1003 .0988
(.45) (1.89).12 1.96

— 42 —
The combined effect of relative inflation and exchange rates, as
German price competitiveness, was again weak. As was true for the U.S.
export/domestic price ratio, there is some hint of a delayed impact of
foreign relative prices, but only the coefficient for Japanese prices
is close to significance at the 5 per cent level.
The results for tne machinery and equipment group are a little
stronger (Table 3). Here there are significant exchange rate coefficients
for the U.S. and the U.K.,.with a lag of one year, and several significant
or almost significant price coefficients, current for the U.S. and the
U.K. and lagged for Japan. When we combine the price and exchange rate
effects, the explanatory power of the equations is weaker for the most
part, but there is a bit of a consensus that these domestic price
conpetitiveness effects take a year to work through.
On the whole, then, we have not been able to explain much of the
variation in the German export/domestic price ratio, but what influence
foreign prices and exchange rates had seemed to operate largely with a
lag of one year.
The separate equations for German export and domestic prices of all
manufactures (Table 9) confirm some of our expectations about the mechan-
ism of transmission. In every case German domestic prices are more
strongly influenced by domestic costs, in the form of unit labor cost,
than are export prices. Foreign own—currency prices apear to have a
strong current year impact on both domestic and export prices but in
every case the impact on export prices is larger, as hypothesized
earlier. French and Japanese prices appear to have also a lagged impact
on German prices, even larger than the current year effect in the case
of France, and again the coefficients are larger for export prices than

— 43 —
TABLE 8
Regressions of German Export/Domestic Price Ratio onRelative Foreign Prices and Exchange Rates
Machinery and Transport Equipment: SITC 7
Eq.No.
Foreign Exchange RatePrice Variable (DM/Foreign Currency)
Foreign Constant Lagged LaggedCountry Term Current 1 Year Current 1 Year R DW
1
Foreign Price Variable: Relative Rate of Inflation
U.s. (1953—75) —.1718 .1855 —.0625 —.0703 .1015 .40
(.99) (3.22) (.97) (1.81) (2.49)
2.22
2 U.K. (1955—75) —.0947 .1339 —.0123 .0121 .0941 .19
(.47) (l.9) (.35) (.35) (2.51)
2.27
3 Japan (1953—75) .1980 —.0248 .1155 .0397 .0921 .07
(.68) (.48) (2.14) (.60) (1.35)
2.20
4 Japan (1953—75) .1946 .1016 .1004 .13
(.78) (2.03) (1.60)
2.15
5
Foreign Price Variable: German Domestic Price Competitiveness
u.s. (1953—75) —.0443 .0172 .0468 .08(.25) (.48) (1.34)
2.11
6 U.S. (1953—75) —.0618 .0558 .12(.36) (1.93)
2.02
7 U.K. (1955—75) .0002 .0290 .0659 .10
(.00) (.78) (1.79)1.99
8 U.K. (1955—75) —.0569 .0680 .12(.31) (1.87)
2.03
9 Japan (1953—75) .1701 —.0042 .1042 .12(.61) (.09) (2.16)
2.14
10 Japan (1953—75) .1849 .1038 .16(.83) (2.22)
2.16

TABLE 9
Regressions of German Export and Domestic Price Indexes on
Foreign Prices and Exchange Rates
All Manufactures: SITC 5—8
Eq.
No.
Dependent
Variable
Foreign
Price
German
Unit
Labor
Constant
Cost
Foreign Price
Exchange
——
Lagg
ed
Current
1 Year
Current
Rate
Lagged
1 Year
2
R
DW
1
XPI
Foreign Price Variable: Relative Rate of Inflation
—.2348
(1.36)
.85
2.56
U.S. (1953—74)
—.0094
.1100
(.01)
(.98
) .7392
—.4351
—.1293
(3.79)
(1.5
9)
(1.1
6)
2
DPI
.
U.s
. (1
953—
74)
0.09
54
.369
4 (.
23)
(5.38)
.372
7 —
.297
0 —
.051
2 (3
.12)
(1.77)
(.75)
—.3
164
(2.9
9)
.93
1.82
3
XPI
U.K. (1955—74)
—.0992
.0197
(.15)
(.16)
.5159
—.0641
.0156
(3.84)
(.32)
(.21)
—.2603
(2.30)
.86
1.86
4
DPI
U.K. (1955—74)
—.6379
.3305
(1.51)
(4.36)
.5392
.0342
—.0054
(6.43)
(.28)
(.12)
.0649
(.92)
.93
.97
5
XPI
France (1955—74)
—.2694
.1292
(.55)
(1.16)
.5346
.2013
.2965
(8.20)
(1.30)
(3.71)
.0584
(.70)
.90
1.29
6
DPI
France (1955—74)
—.3601
.3609
(.72)
(3.21)
.2285
.4580
.1853
(3.46)
(2.92)
(2.29)
.1529
(1.80)
.88
1.85
7
XPI
Japan (1953—74)
.8669
.1083
(1.66)
(.87
) .3
385
.249
7 .0
140
(4.2
8)
(2.1
8)
(.07
) —
.163
6 (.
85)
.85
2.26
8
DPI
Japan (1953—74)
0.4878
.3314
(1.24)
(3.5
3)
.1954
.1529
—.0919
(3.26)
(1.7
6)
(.61
) —.3171
(2.17)
.90
1.82
(cont.)
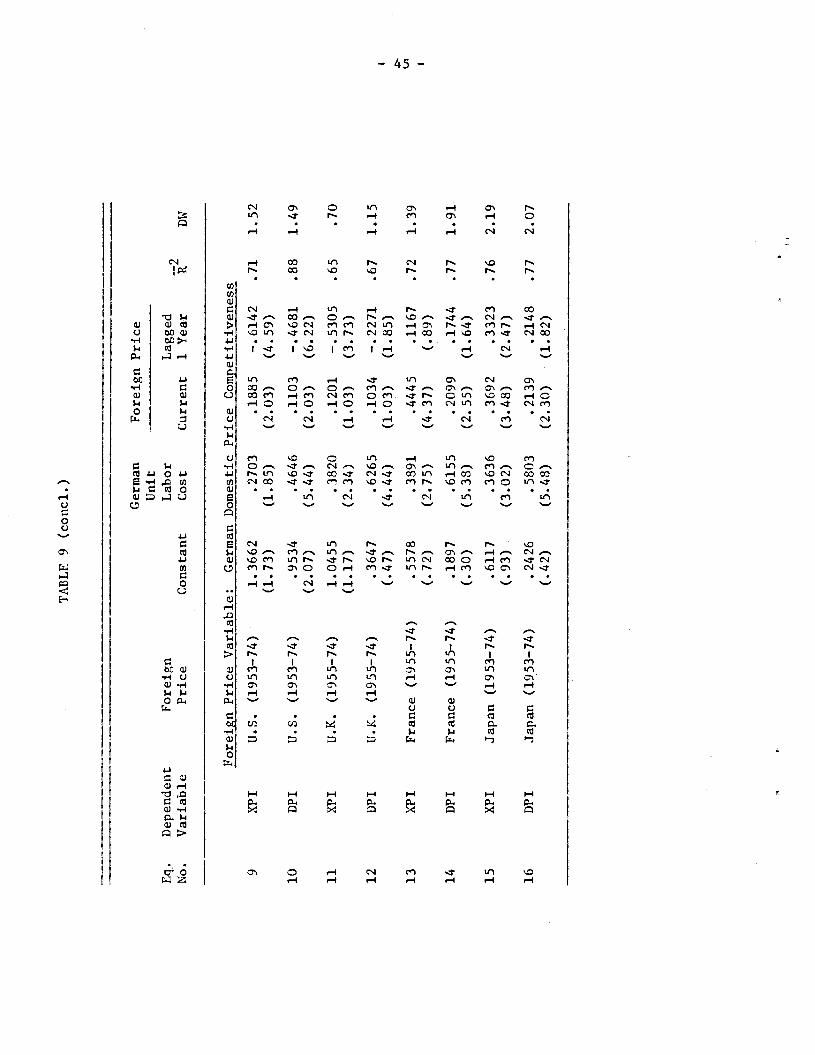
TABLE 9 (conci.)
Eq.
No.
Dependent
Variable
Foreign
Price
Constant
German
Unit
Labor
Cost
Foreign Price —
Lagg
ed
Current
1 Year
—2
R
DW
9
XPI
Forefn Price Variable: German Domestic Price Competitiveness
U.S
. (1
953—
74)
1.36
62
(1.7
3)
.270
3 (1
.85)
.1
885
—.6
142
(2.0
3)
(4.59)
.71
1.52
10
DPI
U.S. (1953—74)
.9534
(2.07)
.4646
(5.44)
.1103
—.4681
(2.03)
(6.22)
.88
1.49
11
XPI
U.K. (1955—74)
1.0455
(1.17)
.3820
(2.34)
.1201
—.5305
(1.03)
(3.73)
.65
.70
12
DPI
U.K. (1955—74)
.3647
(.47)
.6265
(4.44)
.1034
—.2271
(1.03)
(1.8
5)
.67
1.15
13
XP
I France (1955—74)
.5578
(.72)
.3891
(2.75)
.4445
.1167
(4.37)
(.89)
.72
1.39
14
DPI
France (1955—74)
.1897
(.30)
.6155
(5.38)
.2099
.1744
(2.55)
(1.6
4)
.77
1.91
15
XPI
Japan (1953—74)
.6117
(.93)
.3636
(3.02)
.3692
.3323
(3.48)
(2.47)
.76
2.19
16
DPI
Japan (1953—74)
.2426
(.42)
.5803
(5.48)
.2139
.2148
(2.30)
(1.82)
.77
2.07

— 46 —
for domestic prices. The lagged effect of U.S. prices in dollars, on the
other hand, is negative, partly reversing the current year impact.
However, the net result of the two years is still much more strongly
positive on export prices than on domestic prices.
There are fewer significant coefficients for exchange rates, and
only those for France match our expectations, all being positive and at
least slightly larger for export prices than for domestic prices. The
exchange rate coefficients for the United States and Japan are all nega-
tive, although only three of the eight are statistically significant.
They suggest, paradoxically, that a rise in the price of the dollar or
the yen, and thus of U.S. or Japanese exports, tends to reduce German
export and domestic prices. 1ore likely the results reflect our diffi-
culty in distinguishing the effects of foreign price movements from those
of exchange rates.
The equations using German domestic price competitiveness as the
price variable mostly support our expectations but contain a few puzzles.
As expected, German unit labor costs influence domestic prices more than
they do export prices and foreign prices affect German exort prices more
than they do German domestic prices. However, the lagged effect of U.S.
and U.K. prices on German prices is negative and larger than the current
effect, a relationship that is difficult to explain. All the equations
for U.S. and U.K. prices show substantial serial correlation. The equa—
tions that do not, for Japan and France, also do not have the paradoxical
negative price coefficients, and suggest that these countries' prices
influence German prices both currently and with a one—year lag.

— 47 —
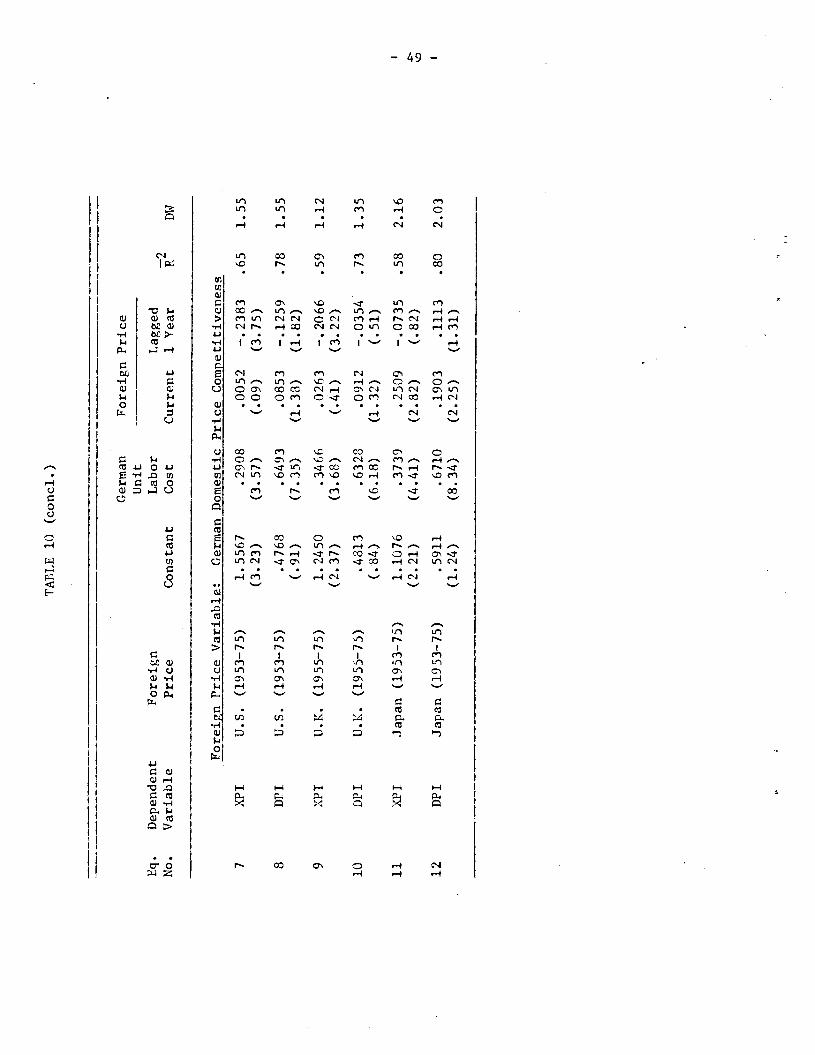
The equations for SITC 7 in Table 10 are of interest partly because
they cover the same range of products as the U.S. equations. They suffer
from the same drawback as the U.S. equations, in the fact that the unit
labor cost variable is not really applicable to the particular commodity
group. On the whole, however, the results conform to those of Table 9,
with German unit labor costs affecting domestic nrjces more than export
prices and some strong Japanese price impacts on German prices, particu-larly export prices (no data are available for French prices). The
relationships of exchange rates to German prices, especially German
domestic prices, are comparatively weak and often perverse.
Results for Japanese Prices
The range of the Japanese export/domestic price ratio f or all
manufactures was 11 per cent: the greatest among the three countries.
Although there were substantial year—to—year fluctuations in the price
ratio there was a clear downward trend through the whole period, and on
the whole an upward trend in the effective exchange rate (Chart 9). The
rise in the exchange rate through the 1950's and 1960's was gradual and
could not account for the sharp fluctuations in price ratios. However,
the jump of over 20 per cent in the exchange rate from 1970 to 1973 and
the following fall were mirrored by a decline of more than 5 per cent in
the export/domestic price ratio and then a rise after 1973, as we would
expect. Thus the major changes in the exchange rate did aprear to
influence the price ratio.
Of the roughly 30 per cent rise in the exchange rate from 1953 to
the peak in 1973 almost a quarter was offset by the reduction in the
price ratio. The degree of offsetting was substantial even in the wide

TABLE 10
Regressions of German Export and Domestic Price Indexes on
Foreign Prices and Exchange Rates
Machinery and Transport Equipment: SITC 7
00
Eq.
No.
liependent
Variable
Foreign
Price
German
Unit
Labor
Constant
Cost
Foreign Price
Exchange Rate
—
Lagg
ed
Lagged
Current 1 Year
Current 1 Year
—2
R
DW
1 X
PI
Foreign Price Variable: Relative Rate of Inflation
—.3242
(2.71)
.67
1.61
U.s
. (1
953—
75)
1.25
04
.211
5 (2
.48)
(2.16)
—.0
140
—.0
932
—.0
299
(.08)
(.50)
(.30)
2
DPI
U.S. (1953—75)
—.0347
.4856
(.08)
(5.69)
.1470
.0350
—.0202
(1.01)
(.21)
(.23)
—.2209
(2.13)
.86
1.59
3
XPI
U.K. (1955—75)
1.0780
.2764
(1.98)
(2.50)
—.0380
—.0676
—.0041
(.28)
(.49)
(.06)
—.2723
(2.98)
.59
1.38
4
DPI
U.K. (1955—75)
.1180
.4593
(.27)
(5.33)
.1865
—.0009
—.0212
(1.73)
(.01)
(.39)
—.0703
(.99)
.86
1.91
5
XPI
Japan (1953—75)
1.1909
.2963
(2.38)
(2.49)
.2391
—.1180
.0541
(2.89)
(1.30)
(.31)
—.0461
(.28)
.59
1.93
6
DPI
Japan (1953—75)
.6925
.4727
(1.92)
(5.51)
.1452
.0322
—.0408
(2.44)
(.49)
(.33)
—.2607
(2.19)
.89
1.74
(cont.)
TA
BL
E
10 (
conci.)
Eq.
No.
Dependent
Foreign
Variable
Price
Constant
German
Unit
Labor
Cost
Foreign Price
——
____
____
__
Lagg
ed
Current
1 Year
2
R
DW
7
Fore
ign
Pric
e Variable: German Domestic Price Competitiveness
XPI
U
.S.
(1953—75)
1.5567
(3.23)
.2908
(3.57)
.0052
—.2383
(.09)
(3.75)
.65
1.55
8
DPI
U.S. (1953—75)
.4768
(.91)
.6493
(7.35)
.0853
—.1259
(1.38)
(1.82)
.78
1.55
9
XPI
U.K. (1955—75)
1.2450
(2.37)
.3466
(3.68)
.0263
—.2066
(.41)
(3.22)
.59
1.12
10
DPI
U.K. (1955—75)
.4813
(.84)
.6328
(6.18)
.0912
—.0354
(1.32)
(.51)
.73
1.35
11
XPI
Ja
pan
(1953—75)
1.1076
(2.21)
.3739
(4.41)
.2509
—.0735
(2.82)
(.82)
.58
2.16
12
DPI
Japan
(195
3—75
) .5
911
(1.24)
.6710
(8.34)
.1903
.1113
(2.25)
(1.31)
.80
2.03

CH
AR
T 9
Japa
nese
Export/Domestic Price Ratio, SITC 5—8, and Effective Exchange Rate, 1963=100
-
- .
ige
105
25
I
- .
I 20
.
II
[:i:::
,: :
..
05
-
00
99
----
- I
- -
- --
95
_I
90
97
94
53
54
55
56
57
58
59
60
61
62
63
64
65
66
67
68
69
70
71
72
73
74
75

— 51 —
swings in the exchange rate that took place between 1970 and 1974. A
quarter of the 1970—73 increase in the price of the yen and about half
of the drop in 1974 were offset by changes in the export/domestic price
ratio.
Changes in relative foreign prices do not appear to have been
related at all to the fluctuations in the Japanese export/domestic price
ratio, as can be seen from the data in Appendix C. The price ratio fell
substantially over the period as a whole while relative foreign prices
rose relative to Japanese prices——the opposite to what we would expect
if foreign prices were influencing the ratio. The same was true of the
shorter fluctuations: they were unrelated to or even in the opposite
direction from foreign price changes instead of the same direction, as
would seem logical. Thus we cannot expect to explain the export/domestic
price ratio well by either exchange rate or relative price variables,
except for the apparent relation of exchange rates to price ratios after
1971.
We are thus left, as far as these variables are concerned, without
any explanation for the wide fluctuations in the Japanese export/domestic
price ratio between 1953 and 1971.
Given the timing of the swings in the price ratio one might guess
that they were related to cyclical fluctuations in countries to which
Japan exports. For U.S. and German prices we found that direct measures
of cyclical conditions did not add substantially to the explanation of
the price ratio. We can test the same possibility for Japan by comparing
the price ratio to a measure of foreign cyclical conditions, as in

— 52 —
Chart The fluctuations do seem related, with almost every swing
14
The measure of cyclical fluctuations in Chart 10 is a
composite of deflated, detrended leading indicators for six
countries: France, Germany, Italy, the U.K., Canada, and Japan.
It would have been preferable, of course, to use an index which
excluded Japan.
in tne cyclical index matched by a corresponding change in the Japanese
price ratio, at least through 1971. The implication of the chart isthat in the rising phase of foreign business cycles Japanese export
prices rise relative to domestic prices while in the downward phase
Japanese export prices tend to fall relatively. While export prices
thus responded to foreign cyclical conditions they also acted as something
of a buffer between foreign economies and the domestic Japanese economy.
The equations relating the Japanese exDort/domestic rrice ratio
for all manufactures to relative foreign prices and exchange rates are
listed in Table 11. As was suggested by a look at the data themselves,
these two variables explain comparatively little of the variation in the
price ratio. Iany of the price coefficients and several of the exchange
rate coefficients are negative. The only reasonable exchange rate coef-
ficient is that for the dollar/yen rate, an outcome that is not
surprising in view of the large importance of the U.S. market for Japanese
exports and the movements of the price ratio and exchange rates in 1970—74.
The results for machinery and transport equipment are again weak,
but not quite as eccentric (Table 12). ost of the current year price


TABLE 11
Regressions of Japanese Export/Domestic Price Ratio on
Foreign Prices and Exchange Rates
All M
anuf
actu
res:
SITC 5—8
U'
Eq.
No.
Foreign Price Variable
Exchange Rate
(Yen/Foreign Currency)
Foreign
Constant
Lagged
Lagged
Country
Term
Current
1 Year
2 Years
Lagged
Current
1 Year
Lagged
2 Years
—2
R
DW
1
Fore
fp P
rice
Variable:
Relative Rate of Inflation
.3462
—.0402
(4.47)
(.34
) .53
2.03
U.S
. (1
953—
74)
—.0168
—.1749
.1201
(.04)
(1.7
4)
(1.2
7)
2 G
erm
any
(195
3—74
) —
.052
3 —
.207
3 —
.100
1 (.
13)
(2.4
5)
(1.0
7)
—.1
227
.231
2 (.
93)
(1.6
2)
.24
1.33
3
Germany (1953—74)
.1119
—.2344
.0315
.0025
(.25)
(2.76)
(.35)
(.02)
—.2104
.2685
(1.79)
(2.31)
—.4670
(2.79)
.52
1.63
4
U.K. (1955—74)
.3145
—.1161
—.1984
(.57)
(1.09)
(1.83)
.0435
.0160
(.53)
(.18)
.14
1.96
5
Fore
ia P
rice
Var
iabl
e:
Japa
nese
Dom
estic
PrI
ce C
otnp
eLtiv
enes
s .0
8 1.
90
U.s. (1953—74)
.234
5 .0
944
—.0
888
(.70
) (1.61)
(1.55)
6 G
erm
any
(195
3—74
) .1
038
—.1
129
—.0
633
(.26
) (1
.35)
(.
81)
.04
1.91
7 G
erm
any
(195
3—74
) .6
176
—.2
154
—.0
300
—.1
891
(1.2
4)
(2.2
4)
(.37
) (1
.83)
.1
7 1.
75
8
U.K. (1955—74)
—.4793
.059
3 —
.169
4 (1
.66)
(1
.64)
(3
.65)
.4
1 1.
64

TABLE 12
Regressions of Japanese Export/Domestic Price Ratio on
Fore
ign
Prices and Exchange Rates
Nachinery and Transport Equipment: SITC 7
(ji
I-Il
Eq.
No.
Foreign Price Variable
Exchange Rate
(Yen/Foreign Currency)
Foreign
Constant
Lagged
Lagged
Country
Term
Current
1 Year
2 Years
Lagged
Current
1 Year
Lagged
2 Years
—2
R
DW
1
Foreign Price V
aria
ble:
R
elat
ive Rate of
Inflation
—.0691
.1429
(.85)
(.99)
.10
1.83
U.s. (1953—75)
.6417
—.0535
—.1811
(.93)
(.33)
(1.88)
2
U.s. (1953—75)
.7341
.1779
—.2560
—.1043
(1.19)
(1.29)
(1.77)
(.74)
.0234
—.0909
(.36)
(.67)
.1642
(1.38)
.30
.
2.28
3
U.S. (1953—75)
.4192
—.1551
(1.22)
(1.77)
.0897
(1.39)
.16
1.75
4
Germany (1953—75)
—. 5
254
.1337
—.0886
(1.12)
(1.5S)
(.44)
.0770
.0519
(.77)
(.50)
.01
1.55
5
U.K. (1955—75)
—.0742
.1329
—.1157
(.16)
(2.42)
(1.30)
.0030
—.0169
(.07)
(.37)
.26
2.09
6
u.i. (1955—75)
.6294
.1543
—.0982
—. 2
369
(1.26)
(2.5
0)
(1.1
1)
(2.4
2)
—.0138
—.0749
(.34)
(1.5
9)
O549
(1.06)
.46
1.70
7
For4gu Price Van ab
le:
Japa
nese
Dom
estic
Pri
ce C
ompetitiveness
—.0
5 1.
62
U.s
. (1
953—
75)
—.1
703
.062
6 —
.026
2 (.
55)
(1.0
1)
(.38
) 8
U.S
. (1
953—
75)
.093
5 .0
315
.058
2 —
.087
7 (.
35)
(.46
) (.
64)
(1.0
5)
' .0
8 2.
42
9 G
erm
any
(195
3—75
) —
.597
9 .1
256
—.0
021
(1.3
9)
(1.9
7)
(.03
) .0
9 1.
56
10
U.K. (1955—75)
—.0218
.0783
—.0224
(.09)
(1.8
7)
(.50
) .07
2.17

— 56 —
coefficients, and all that are close to statistical significance, are
positive, although negative signs prevail among the lagged price coef-
ficients. That is not an unreasonable result, as long as the negative
coefficients do not exceed the positive ones, since it could imply a
return to an earlier relationship between export and domestic prices
after the initial disturbance arising from foreign developments. However,
these equations are too crude to establish a sequence of this sort. None
of the lagged foreign price coefficients are statistically significant.
When we examine the separate effects on the export and domestic
price indexes for all manufactures in Table 13 we find the equations
again unsatisfactory, although they do show large price effects and the
variables included account for a large part of the variation in export
and domestic prices. With only a few exceptions the coefficients for
unit labor Costs are negative in the equations based on relative rates
of inflation and none of them are statistically significant.Probably
because the unit labor cost variable works so poorly the coefficients of
the current year foreign price variables are exaggerated. The lagged
foreign price and exchange rate variables are mostly negative, however.
The equations based on Japanese domestic price competitivenesg are
not quite as outlandish, some containing reasonable coefficients for unit
labor cost and positive coefficients on current price. However, there
are again very large negative coefficients on lagged foreign price and
some serious problems of serial correlation.
The equations for machinery and transport equipment that use
Japanese domestic price competitiveness as the foreign price variable fit
our expectations a little better than those for all manufactured products
(Table 14). The coefficients on unit labor cost are positive and most

TABLE 13
Regressions of Japanese Export and Domestic Price Indexes on
Foreign Prices and Exchange Rates
All Manufactures: SITC 5—8
(cont.)
Eq.
No.
Dependent
Variable
Foreign
Country
Constant
Japanese
Unit
Labor
Cost
Foreign Price
Variable
Exchange Rate
(Yen/Foreign Currency)
Current Lagged
1 Year
Lagged
Current 1 Year
—2
R
DW
1
XPI
Foreign Price Variable: Relative Rate of Inflation
.2338
—1.0458
(.95)
(2.78)
.92 1.64
U.S. (1953—74)
—.9442
(.94)
—.0209
(.18)
1.4123
(3.32)
—1.1195
(2.14)
2
DPI
U.S. (1953—74)
.0282
(.03)
—.1647
(1.63)
1.2766
(3.40)
—1.0916
(2.37)
—.1341 —1.2431
(.62)
(3.75)
.92 2.28
3
XPI
U.K. (1955—74)
—1.5462
(1.07)
—.1503
(.58)
1.7068
(4.48)
—1.1256
(2.45)
—.0787
—.3448
(.44)
(1.51)
.83 1.93
4
DPI
U.K. (1955—74)
—1.5731
(1.00)
—.1792
(.64)
1.3382
(3.23)
—.5904
(1.13)
—.2978
—.3795
(1.52)
(1.53)
.74
1.86
5
XPI
Germany (1953—74)
—2.3014
(1.34)
.4671
(1.24)
.8125
(.88)
—.2494
(.34)
.6380
—.6121
(.91)
(.88)
.58 1.87
6
DPI
Germany (1953—74)
—2.1257
(1.52)
.1876
(.61)
1.2219
(1.62)
.3450
(.58)
.5126 —1.2676
(.89)
(2.23)
.65 1.91

TABLE 13 (concl.)
Ui
Eq.
No.
Dependent
Foreign
Variable
Country
Constant
Foreign Price
Japanese
Variable
Unit
Labor
Lagged
Cost
Current 1 Year
—2
R
DW
Foreign Price Variable: Japanese Domestic Price Competitiveness
7
XPI
U.S. (1953—74)
1.4055
(1.50)
.1084
(.82)
.6229
—1.3292
(5.16)
(5.69)
.87 1.29
8
DPI
U.S. (1953—74)
3.1801
(3.04)
.0240
(.16)
.3479
—1.5306
(2.58)
(5.86)
.79 1.19
9
XPI
U.K. (1955—74)
—.2312
(.16)
.5068
(2.38)
.2770
—.7994
(1.33)
(3.05)
.70 1.99
10
DPI
U.K. (1955—74)
.4389
(.27)
.5547
(2.37)
.0145
—.6884
(.06)
(2.39)
.54
1.95
11
XPI
Germany (1953—74)
—2.0409
(1.44)
.4375
(1.28)
.7157
—.3685
(2.44)
(.96)
.64 1.82
12
DPI
Germany (1953—74)
—.9355
(.71)
.1825
(.58)
.8279
—.3297
(3.04)
(.92)
.61 1.64
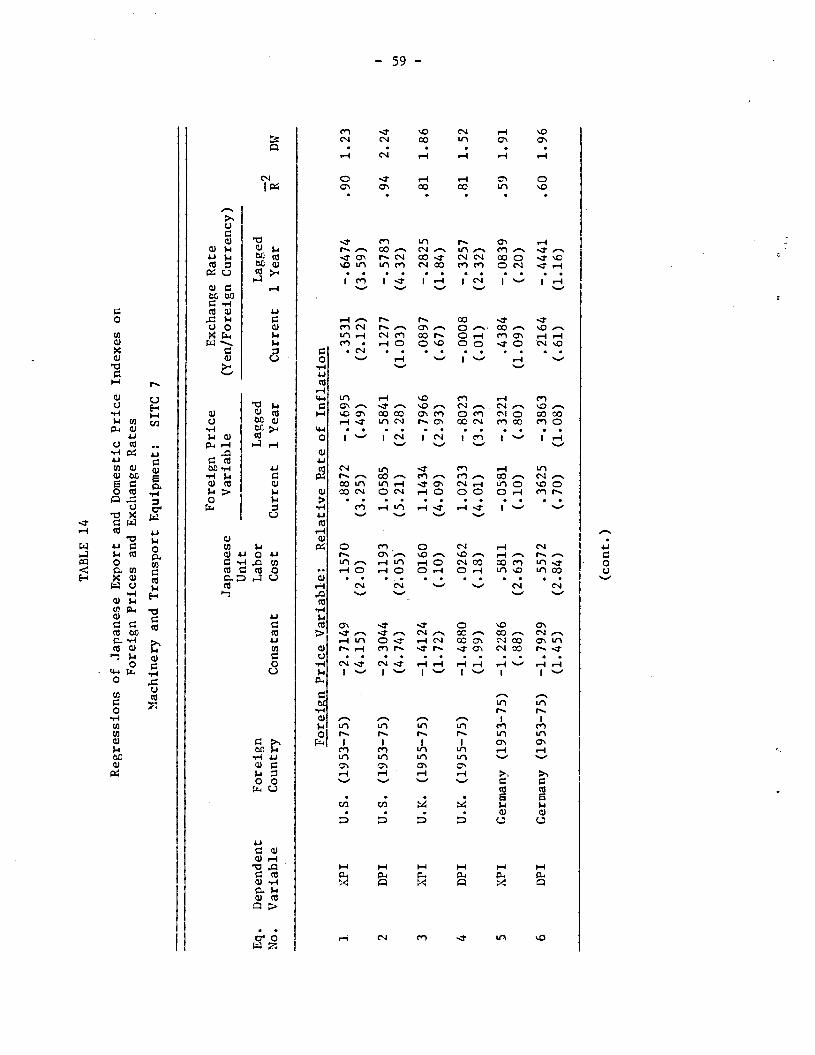
TABLE 14
Regressions of Japanese Export and Domestic Price Indexes on
Foreign Prices and Exchange Rates
1achinery and Transport Equipment: SITC 7
tji
Eq.
No.
Dependent
Variable
Foreign
Country
Foreign Price
Exchange Rate
Japanese
Variable
(Yen/Foreign Currency)
Unit
Labor
Lagged
Lagged
Constant
Cost
Current
1 Year
Current 1 Year
2
R D
I
XPI
Foreign Price Variable: Relative Rate of Inflation
—2.7149
.1570
.8872
—.1695
.3531
—.6474
(4.15)
(2.0)
(3.25)
(.49)
(2.12)
(3.59)
.90 1.23
U.s
. (1
953—
75)
2
DPI
U.S. (1953—75)
—2.3044
.1193
1.0585
—.5841
.1277
—.5783
(4.74)
(2.05)
(5.21)
(2.2
8)
(1.03)
(4.32)
.94
2.24
3
XPI
U.K. (1955—75)
—1.4124
.0160
1.1434
—.7966
.0897
—.2825
(1.72)
(.10)
(4.09)
(2.93)
(.67)
(1.84)
.81 1.86
4
DPI
U.K. (1955—75)
—1.4880
.0262
1.0233
—.8023
—.0008
—.3257
(1.99)
(.18)
(4.01)
(3.23)
(.01)
(2.32)
.81 1.52
5
XPI
Germany (1953—75)
—1.2286
.5811
—.0581
—.3221
.4384
—.0839
(.88)
(2.6
3)
(.10
) (.
80)
(1.0
9)
(.20
) .59 1.91
6
DPI
Germany (1953—75)
—1.7929
.5572
.3625
—.3863
.2164
—.4441
(1.45)
(2.8
4)
(.70
) (1
.08)
(.
61)
(1.1
6)
.60 1.96
(cont.)
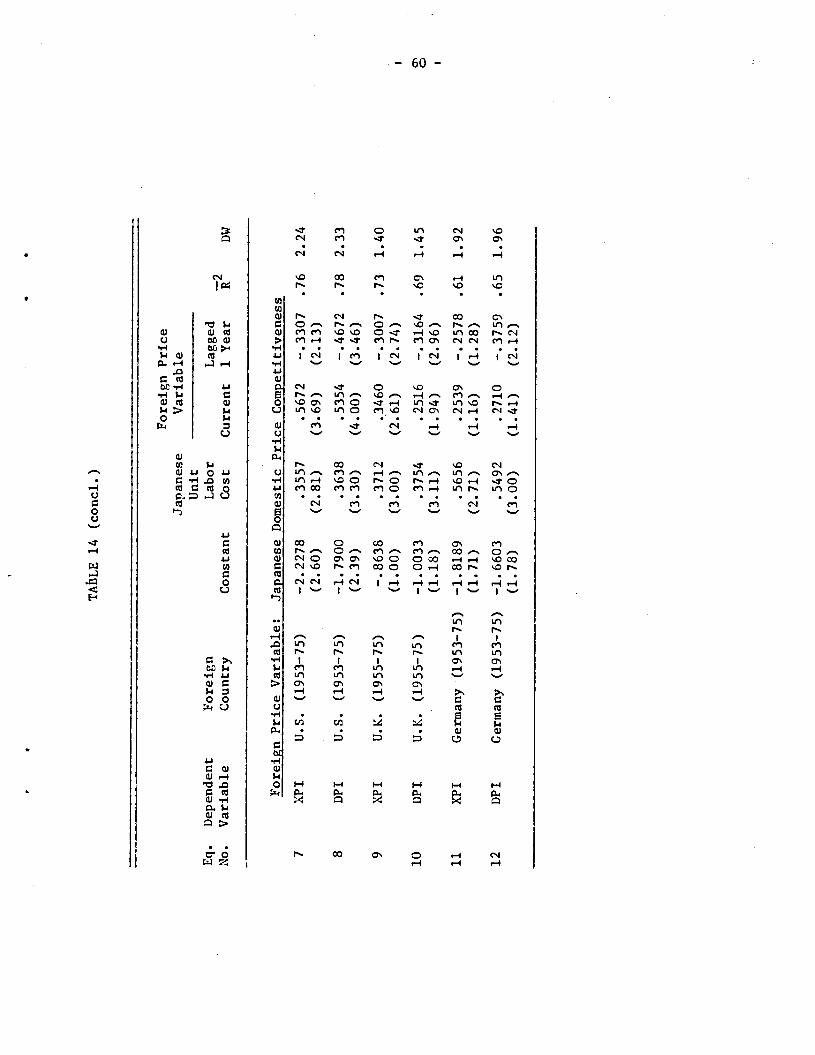
TA1LE 14 (conci.)
0
Foreign Price
Japanese
Variable
Eq.
No.
Dependent
Foreign
Variable
Country
Constant
Unit
Labor
Cost
Lagged
Current
1 Year
—2
R
DW
Foreign Price Variable: Japanese Domestic Price Competitiveness
7
XPI
U.S. (1953—75)
—2.2278
(2.60)
.3557
(2.81)
.5672
—.3307
(3.69)
(2.13)
.76 2.24
8
DPI
U.S. (1953—75)
—1.7900
(2.39)
.3638
(3.30)
.5354
—.4672
(4.00)
(3.46)
.78 2.33
9
XPI
U
.K.
(1955—75)
—.8638
(1.00)
.3712
(3.00)
.3460
—.3007
(2.61)
(2.74)
.73
1.40
10
DPI
U.K.
(195
5—75
) —
1.00
33
.375
4 .2
516
—.3
164
.69
1.45
:
(1.1
8)
(3.1
1)
(1.9
4)
(2.9
6)
11
XPI
Germany (1953—75)
—1.8189
(1.71)
.5656
(2.71)
.2539
—.2578
(1.16)
(1.28)
.61 1.92
12
DPI
Germany (1953—75)
—1.6603
(1.78)
.5492
(3.00)
.2710
—.3759
(1.41)
(2.1
2)
.65 1.96

—61—
are statistically significant, and the same is true, as we expect, of
the current foreign price coefficients. Among the price coefficients
that are statistically significant, those for export prices are larger
than those for domestic prices, as we expect. All the lagged foreign
price coefficients are negative, indicating a reversal of the effect of
foreign prices after a year, and the reversals are larger for domestic
than for export prices.
On the whole, the variables that served to explain U.S. and
German prices to some extent give more erratic results in explaining
Japanese prices. In the few equations that do seem reasonable——those for
SITC 7 based on price competitiveness——the net effect of foreign price
changes is mostly erased after a year.
Since the earlier look at the fluctuations in the export/domestic
price ratio suggested that foreign cyclical fluctuations may have had a
substantial influence, we experimented with a few equations relating the
price ratio to indexes of U.S. and other major countries' business cycle
conditions. The cyclical indicators by themselves did not explain move-
ments in the price ratio at all, as we could have expected from the contrary
fluctuations during the period after 1971. However, when the cyclical
variables were combined with Japanese effective exchange rates, the results
were quite good. The cyclical indicator indexes had positive coefficients,
showing that a foreign expansion raises Japanese. export prices relative
to domestic prices while a foreign contraction leads to a relative reduc-
tion in Japanese export prices. The positive coefficient on current
exchange rate changes indicates that a rise in the price of foreign
exchange increases Japanese export prices relative to domestic price

— 62 —
TABLE 15.
Regressions of Japanese Export/Domestic Price Indexeson Foreign Cyclical Indicators and Japanese Effective Exchange Rates
All Manufactures: SITC 5—8
Eq.No.
U.S.: Index of 12 Japanese EffectiveLeading Indicators Exchange Rate
Constant Lagged Lagged —2Term Current 1 Yeai Current 1 Year R DW Dates
1
Cyclical Indicator: U.S. Index of 12 Leadiri Indicators
—.4775 .1372 .0855 .5168 —.1706 .68(1.94) (3.63) (2.34) (6.50) (2.01)
1.71 1953—74
Cicljca]. Indicator: Six—Country Conmosite Deflated Leading Index
2 —.4010 .1433 —.0187 .4665 —.0539 .65(1.34) (3.56) (.44) (5.60) (.56)
2.22 1953—74

— 63 —
and a decline reduces the Japanese export price ratio, as we expect. The
exchange rate effect seems to be partly offset a year later, but most of
it remains even after two years, judging by other equations not shown
here.
The success of foreign cyclical fluctuations in explaining the
export/domestic price ratio suggests that the same variable might influence
the ratio of exports to manufacturing production. Chart 11 indicates that
there may have been such a connection, at least through the mid—l960's,
although it is not close. The peaks in the U.S. leading indicators in
1955, 1959, and 1966 all had counterparts in the Japanese series, although
the troughs did not match as well.
There were two swings in the Japanese price ratio in the earlier
years but they seemed to lag a year or two behind the movements of the
shipments ratio. Thus it does not seem reasonable to suggest that the
movements of the export/shipments ratio were mainly responses on the supply
side to shifts in the profitability of export as compared with domestic
markets. It seems more likely, from the behavior of both the price ratio
and the shipments ratio, that these short—term fluctuations largely
ef1ected influences on the demand side, which Japanese exports responded
to more actively than did U.S. and German exporters.


— 65 —
Summary
1. Export price movements differ from those of domestic prices for
substantial periods.
In all three countries, the United States, Germany, and Japan,
the divergences between export and domestic price changes were substan-
tial, and some were long—lasting. The range of the U.S. ratio for
machinery and transport equipment (SITC 7) was 7 percentage points,
that of the German and Japanese ratios for all manufactured products
(SITC 5—8) almost 8 points and 11 points. For each country there
were periods of comparative stability, when the ratio moved within a
range of three percentage points or so, but even that range allows
for large changes in relative margins between export and domestic
sales. The major changes in the export/domestic price ratio were,
in the United States, a rise after 1972, in Germany, a decline until
1963, and in Japan, two cycles, a rise from 1953—56 followed by an
equal decline and a fall from 1969 to 1973, followed by a rise.
Over the whole period the U.S. ratio for SITC 7 rose by between 1 1/2
and 4 1/2 per cent, depending on the series used as a measure. The
German ratio fell by 6 per cent, and the Japanese ratio fell by
4 per cent. The long—term changes are compatible with an interpreta-
tion that the DM and the yen were undervalued at the beginning of
the period, in the 1950's, and the dollar was overvalued, and that
the realignment of currencies has reduced or eliminated, or even
reversed these disparities.

— 66 —
2. Changes in export/domestic price ratios offset, to some degree,
changes in exchange rates and in relative domestic prices.
If a country's export prices rise relative to its domestic
prices when foreign inflation is more rapid than home inflation, or
if they rise when the country devalues its currency, some of the
competitive advantage that might otherwise be expected will be lost.
On the other hand, if the price ratio falls in a rapidly inflating
country or in a country revaluing its exchange rate upward, the
decline in price competitiveness will be less than expected. These
effects are in addition to any impact of exchange rate changes or
foreign inflation on a country's domestic prices in general, or
domestic prices of tradable goods, which are more frequently con-
sidered.
In the case of U.S. exports of machinery and transport equip-
ment, 20 to 50 per cent of the appreciation of the dollar through
1968 and almost half of the depreciation after that was offset by
first a decline and later a sharp rise in the export/domestic price
ratio. Of the effects of major swings in the German rate of inflation
relative to the U.S., apart from the effects of currency changes,
between 10 and over 50 per cent were offset, with the larger propor-
tions associated with the smaller differences in relative inflation.
The offsets to relative U.K. inflation ranged between a quarter and
a third.
For Germany, the fall in export/domestic price ratios for all
manufactures was notable in the degree to which it offset the 1961
revaluation of the DM——the offset being about 60 per cent. In 1969
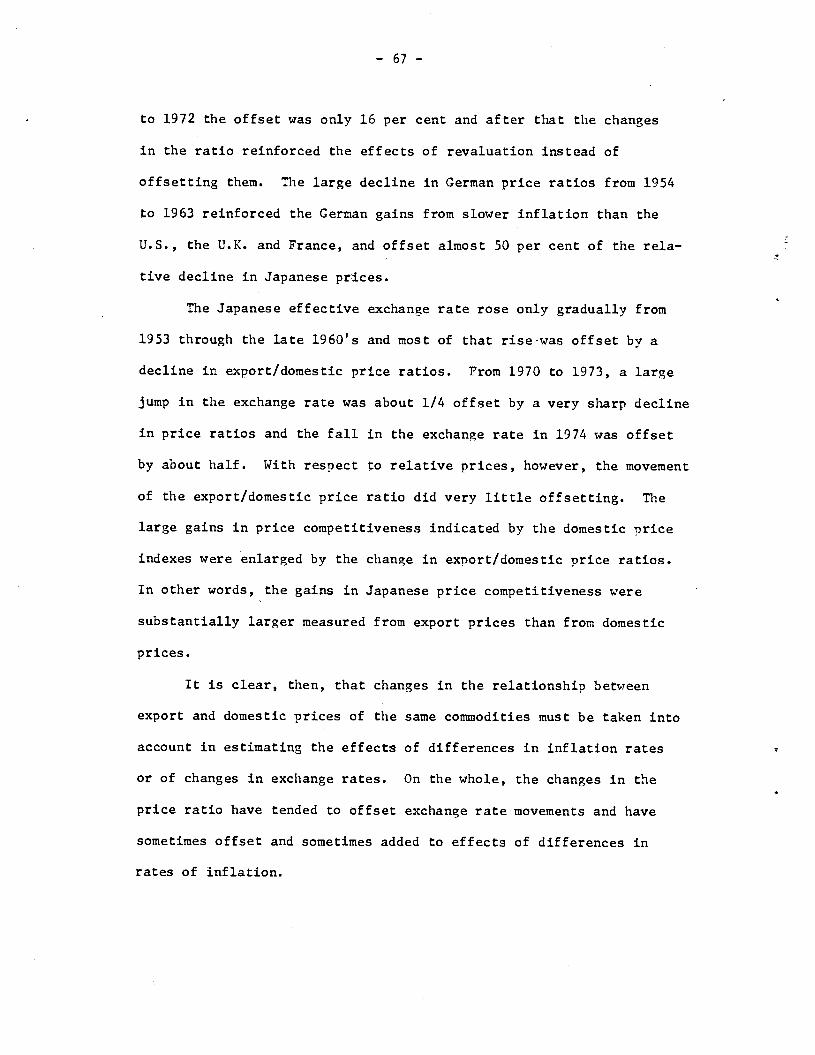
— 67 —
to 1972 the offset was only 16 per cent and after that the changes
in the ratio reinforced the effects of revaluation instead of
offsetting them. The large decline in German price ratios from 1954
to 1963 reinforced the German gains from slower inflation than the
U.S., the U.K. and France, and offset almost 50 per cent of the rela-
tive decline in Japanese prices.
The Japanese effective exchange rate rose only gradually from
1953 through the late 1960's and most of that rise was offset by a
decline it export/domestic price ratios. From 1970 to 1973, a large
jump in the exchange rate was about 1/4 offset by a very sharp decline
in price ratios and the fall in the exchange rate in 1974 was offset
by about half. With respect to relative prices, however, the movement
of the export/domestic price ratio did very little offsetting. The
large gains in price competitiveness indicated by the domestic price
indexes were enlarged by the change in export/domestic price ratios.
In other words, the gains in Japanese price competitiveness were
substantially larger measured from export prices than from domestic
prices.
It is clear, then, that changes in the relationship between
export and domestic prices of the same commodities must be taken into
account in estimating the effects of differences in inflation rates
or of changes in exchange rates. On the whole, the changes in the
price ratio have tended to offset exchange rate movements and have
sometimes offset and sometimes added to effects of differences in
rates of Inflation.

— 68 —
3. Export/domestic price ratios responded to foreign prices and exchange
rates.
Although we are not able to explain all the fluctuations in
export/domestic price ratios in each country we did find evidence
that they responded to the two variables we hypothesized should
affect them; relative rates of inflation in other countries compared
to that of the home country, and changes in the rate of exchange.
Thus we have evidence that the fluctuations in the ratio are not
simply the result of chance or of defects in measurement.
We have separated the relative foreign price in own currency
and the exchange rate on the possibility that they could have differ-
ent effects. One reason might be that sellers would consider relative
price changes less ephemeral than exchange rate fluctuations, or that
the effect of exchange rates would depend on the currency in which
prices are quoted or goods are invoiced. If the response is identical
and foreign relative price and exchange rate changes are independent
of each other we should find positive and equal coefficients or the
two variables. If the price and exchange rate changes tend to offset
each other, however, we will have difficulty senarating their effects
and we may find perverse coefficients as a result. In such a case,
the variable which combines price and exchange rate effects, the
relative price in home country currency, may be the only one we can
relate to the export/domes tic price ratio.
The U.S. price ratio, we found, was affected in the same year by
changes in British prices and a year or more later by changes in
German and Japanese exchange rates, and perhaps by Japanese prices as

— 69 —
well. When we put price and exchange rate effects together by
measuring prices in dollars there was generally a one—year lag in
the effect.
Changes in the German price ratio were less well explained
by the two variables but there was some evidence of current year
effects of U.S., British and French prices and lagged effects of
Japanese prices. Exchange rate influences were slight, and they were
mostly lagged effects.
Almost all the measured price and exchange rate effects for
the United States and Germany were in the directions we originally
hypothesized. A currency devaluation would raise the export/domestic
price ratio and a more rapid rate of inflation than those of trading
partners would tend to reduce it. Thus the first steps in the rela-
tive inflation and currency revaluation sequences described in the
Introduction are confirmed by the U.S. and German data. The
Japanese price ratios were least well explained and as many coef-
ficients contradicted our hypotheses as confirmed them, particularly
coefficients for foreign prices. The Japanese price ratio we found,
at least before the major exchange rate changes, responded mainly to
U.S. and European business cycle developments. The ratio rose in
times of foreign prosperity and declined in times of foreign reces-
sion, a relationship we did not find for the U.S. or German price
ratios. Thus while the U.S. and German price ratios responded to
foreign price developments, the Japanese ratio seemed to respond
to cyclical, probably income developments in other countries.
Once we took account of the foreign cyclical influence on the
Japanese price ratio, changes in exchange rates produced the

— 70 —
expected effects, with the yen's upward revaluation lowering the
ratio and the yen depreciation raising it. The Japanese results
therefore also confirm the first step in the currency revaluation
sequence.
4. Both export and domestic prices responded to changes in foreign
prices and exchange rates, but the export price response was greater.
The coefficient for German price effects on U.S. domestic prices
are mostly in the range of ten per cent to over one third, with a one—
year lag, suggesting that over 10 per cent and probably more of a
change in German domestic prices is transmitted to U.S. domestic
prices by a year later. However, there are some offsetting negative
exchange rate coefficients which suggest that we are mixing up price
and exchange rate effects. When we combine the two and examine changes
in German domestic price competitiveness in dollars we find an effect
of almost 25 per cent on U.S. export prices but only about half that,
and not statistically significant, on U.S. domestic prices after a
year. Combining the current and lagged effects, mostly not signif i—
cant, cuts both estimates in half.
U.K. relative inflation effects are large, more in the current
year than in the following year, and twice as high for U.S. export
as for U.S. domestic prices, where we can make the comparison.
However, the effects are much reduced and not statistically signifi-
cant, although still large, when we take U.K. relative prices in
dollars. Some of the equations suggest the following pattern. The
current year effect of British prices is stronger on U.S. export
prices than on U.S. domestic prices. However, a year later, the

— 71 —
the effect on export prices is small, though still positive, while
the U.K. price effect on U.S. domestic prices is larger than in the
first year. By the end of the second year U.S. domestic prices have
almost caught up with export prices. It is this catching up in the
second year that accounts for the negative lagged coefficients in
the equations for the U.S. export/domestic price ratio.
Japanese prices in yen are shown to have very large impacts on
U.S. prices, in the current year and a year later, to an extent it is
hard to believe. Probably the excessively high estimated effects for
Japanese prices are related to the low coefficients for U.S. unit
labor costs In these equations. Where the comparison can be made, we
find that foreign price and exchange rate effects are greater on U.S.
export prices than on domestic prices.
The response to Japanese prices in dollars Is also large, but
tends to be pushed into the next year, with some coefficients for the
first year price change unexpectedly negative. The combination of
current and lagged coefficients of Japanese prices in dollars ranges
around 10—20 per cent, still surprisingly high.
The German data, which are by far the most complete, give the
clearest and most reasonable results. Foreign prices strongly affect
German export and domestic prices but always the export prices more
than the domestic prices. The same greater effect on export prices
is evident if we net out some negative exchange rate or lagged price
coefficients. As a corollary to the stronger foreign price impact
on German export prices, unit labor cost in every case has a stronger
impact on domestic prices than on export prices. The price effects on

— 72 —
Germany are mostly in the current year, except for French and
Japanese prices, the latter somewhat suspect because there are
substantial negative exchange rate coefficients offsetting the lagged
price effects.
The foreign effects on Japanese prices estimated by the equa-
tions are too large to be believable, all being close to or even
above one. The unit labor cost coefficients, on the other hand, are
extremely low, suggesting that the unit labor cost effects have been
confounded with the price effects.
On the whole, there is strong evidence for Germany and the
United States and some less clear evidence for Japan that foreign
price changes influence both domestic and export prices within each
country. Furthermore, at least for Germany, there is a clear pattern
in which foreign prices have a larger impact on German export prices
than on German domestic prices, as we hypothesized earlier.
5. Changes in the export/domestic price ratio are associated with shifts
between exporting and selling at home.
Another test of the significance of the export/domestic price
ratio, aside from its relation to foreign prices and exchange rates,
is whether it is related to the share of exports in total production.
We hypothesized earlier that a rise in the export/domestic price
ratio should lead to a shift by producers from domestic to export
markets, or, in other words, a rise in the ratio of exports to
production, and a finding that it did would confirm the genuineness
and importance of the movements in the export/domestic price ratio.
In the United States, the export/domestic price ratio for
machinery and transport equipment changes little before the 1970's

— 73 —
but the sharp rise after 1972 was accompanied by a substantial shift
to export markets. In Germany, there were large and unrelated
trends in the two ratios but deviations from these trends seemed to
have the expected relationship. That is, when the export/domestic
price ratio was high relative to its trend, the export/domestic
shipment ratio also tended to be high. For these two countries,
therefore, the evidence supports the validity of the measurement
of the export/domestic price ratio and its role in determining the
division of sales. However, we could find no such relationship
in the Japanese data.
We have not been able to test every link In the sequences of events
resulting from inflation and exchange rate changes that we hypothesized
earlier, and the tests we have made are crude because we are not able to
attempt here a complete explanation of prices and trade. However, the
tests we have been able to run fit well with our expectations in most
cases and rarely contradict them. We thus feel that there is a
substantial case for the existence of differences between export and
domestic prices and for their playing a significant role in the inter-
national adjustment to differences in rates of inflation among trading
countries and to changes in exchange rates.
We find that commodity markets for manufactured goods are sufficiently
tied together so that a rise in one major country's price level tends to
raise prices in other countries but that the reaction sometimes takes
a year or even more and leaves the relation between the two countries'
prices changed to some degree. Neither the links between different
countries' export prices nor those between a country's export and its

— 74 —
domestic prices are perfectly tight, and as a result the connections
between different countries' domestic prices are looser than is often
supposed in theorizing about international monetary disturbances and
adjustments.
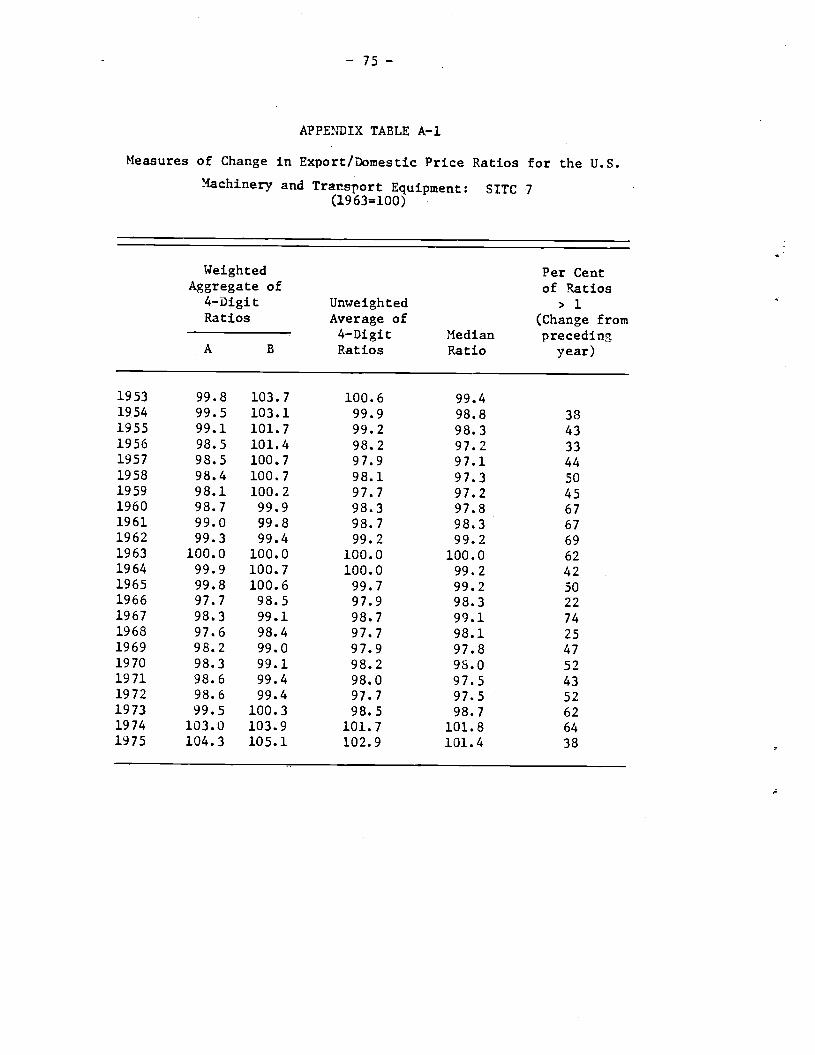
— 75 —
APPENDIX TABLE A-i
Measures of Change in Export/Domestic Price Ratios for the U.S.
Machinery and Transport Equipment: SITC 7(19 63=100)
Weighted Per CentAggregate of of Ratios4—Digit Unweighted > 1Ratios Average of (Change from
. 4—Digit Median precedingA B Ratios Ratio year)
1953 99.8 103.7 100.6 99.41954 99.5 103.1 99.9 98.8 381955 99.1 101.7 99.2 98.3 431956 98.5 101.4 98.2 97.2 331957 98.5 100.7 97.9 97.1 441958 98.4 100.7 98.1 97.3 501959 98.1 100.2 97.7 97.2 451960 98.7 99.9 98.3 97.8 671961 99.0 99.8 98.7 98.3 671962 99.3 99.4 99.2 99.2 691963 100.0 100.0 100.0 100.0 621964 99.9 100.7 100.0 99.2 421965 99.8 100.6 99.7 99.2 501966 97.7 98.5 97.9 98.3 221967 98.3 99.1 98.7 99.1 741968 97.6 98.4 97.7 98.1 251969 98.2 99.0 97.9 97.8 471970 98.3 99.1 98.2 98.0 521971 98.6 99.4 98.0 97.5 431972 98.6 99.4 97.7 97.5 521973 99.5 100.3 98.5 98.7 621974 103.0 103.9 101.7 101.8 641975 104.3 105.1 102.9 101.4 38
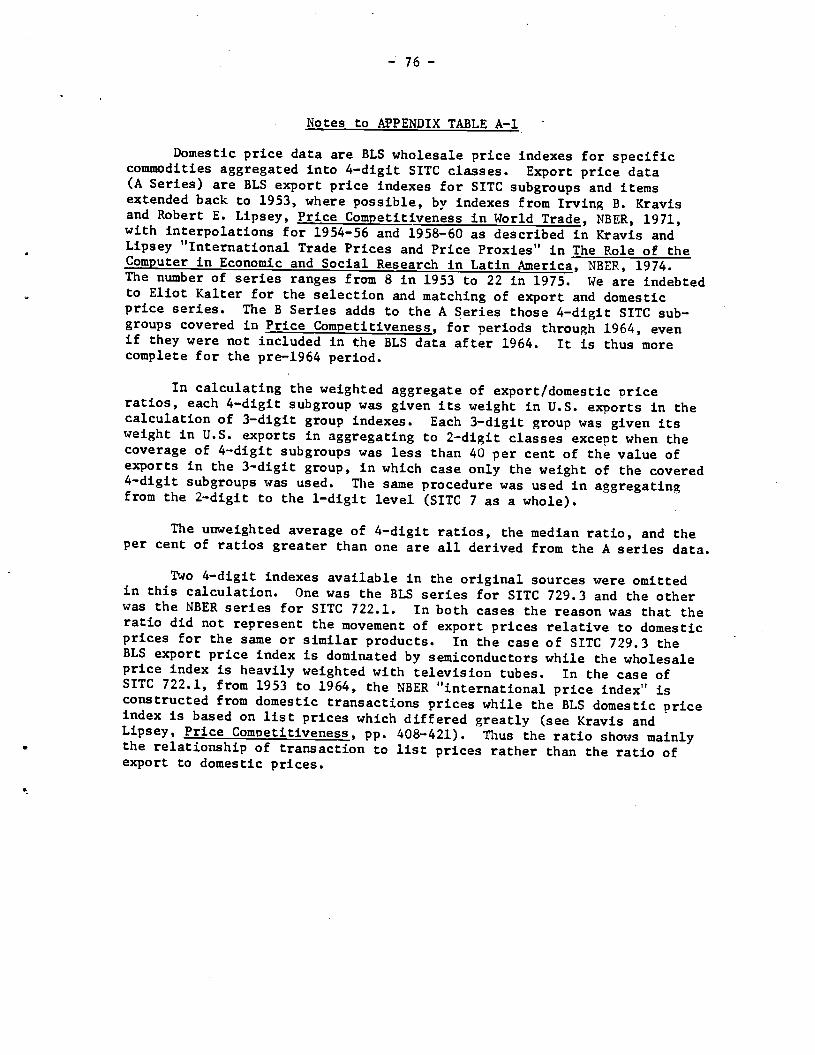
— 76 —
Notes to APPENDIX TABLE A-i
Domestic price data are BLS wholesale price indexes for specificcommodities aggregated into 4—digit SITC classes. Export price data(A Series) are BLS export price indexes for SITC subgroups and itemsextended back to 1953, where possible, by indexes from Irving B. Kravisand Robert E. Lipsey, Price Competitiveness in World Trade, NBER, 1971,with interpolations for 1954—56 and 1958—60 as described in Kravis andLipsey tIInteationaJ. Trade Prices and Price Proxies" in he Role of theComputer in Economic and Social Research in Latin America, NBER, 1974.The number of series ranges from 8 in 1953 to 22 in 1975. We are indebtedto Eliot Kalter for the selection and matching of export and domesticprice series. The B Series adds to the A Series those 4—digit SITC sub-groups covered in Price Competitiveness, for periods through 1964, evenif they were not included in the BLS data after 1964. It is thus morecomplete for the pre—1964 period.
In calculating the weighted aggregate of export/domestic onceratios, each 4—digit subgroup was given its weight in U.S. exports in thecalculation of 3—digit group indexes. Each 3—digit group was given itsweight in U.S. exports in aggregating to 2—digit classes except when thecoverage of 4—digit subgroups was less than 40 per cent of the value ofexports in the 3—digit group, in which case only the weight of the covered4—digit subgroups was used. The same procedure was used in aggregatingfrom the 2—digit to the 1—digit level (SITC 7 as a whole).
The unweighted average of 4—digit ratios, the median ratio, and theper cent of ratios greater than one are all derived from the A series data.
Two 4—digit indexes available in the original sources were omittedin this calculation. One was the BLS series for SITC 729.3 and the otherwas the NBER series for SITC 722.1. In both cases the reason was that theratio did not represent the movement of export prices relative to domesticprices for the same or similar products. In the case of SITC 729.3 theBLS export price index is dominated by semiconductors while the wholesaleprice index is heavily weighted with television tubes. In the case ofSITC 722.1, from 1953 to 1964, the NBER "international price index" isconstructed from domestic transactions prices while the BLS domestic priceindex is based on list prices which differed greatly (see Kravis andLipsey, Price Cournetitiveness, pp. 408—421). Thus the ratio shows mainlythe relationship of transaction to list prices rather than the ratio ofexport to domestic prices.
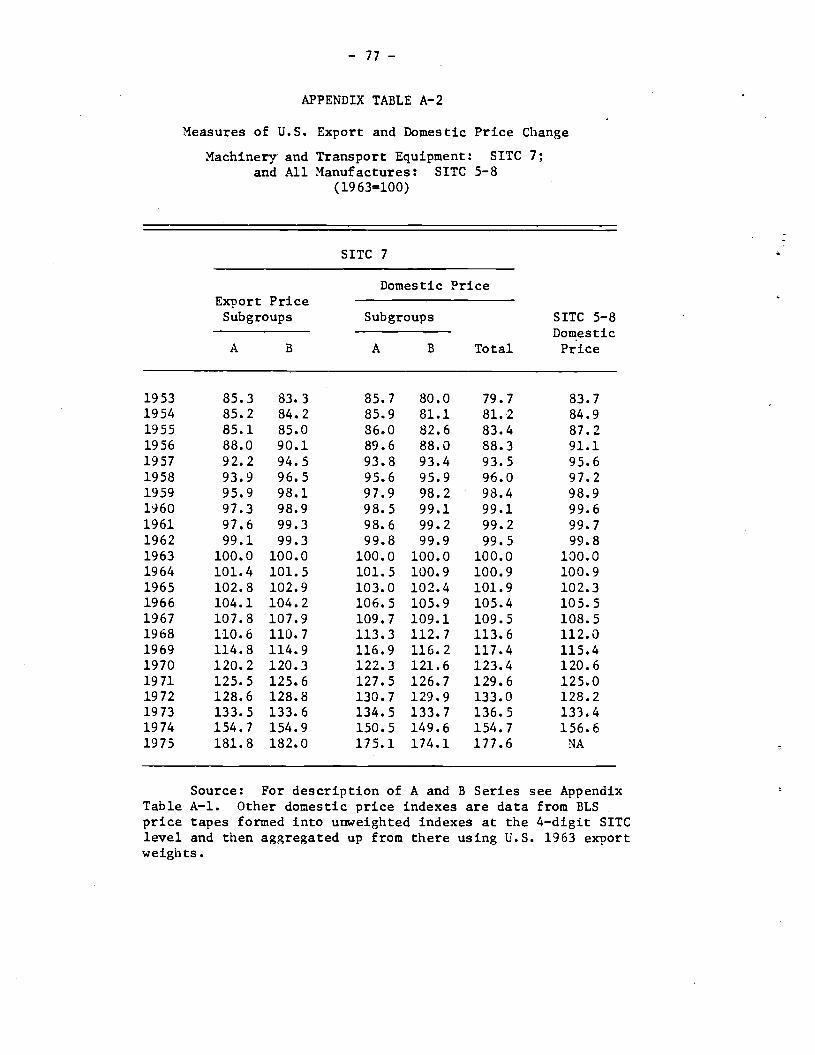
— 77 —
APPENDIX TABLE A-2
Measures of U.S. Export and Domestic Price Change
Machinery and Transport Equipment: SITC 7;and All Manufactures: SITC 5—8
(1963=100)
SITC 7
SITC 5—8Export PriceSubgroups
Domestic Price
SubgroupsDomestic
A B A B Total Price
1953 85.3 83.3 85.7 80.0 79.7 83.71954 85.2 84.2 85.9 81.1 81.2 84.91955 85.1 85.0 86.0 82.6 83.4 87.21956 88.0 90.1 89.6 88.0 88.3 91.11957 92.2 94.5 93.8 93.4 93.5 95.61958 93.9 96.5 95.6 95.9 96.0 97.21959 95.9 98.1 97.9 98.2 98.4 98.91960 97.3 98.9 98.5 99.1 99.1 99.61961 97.6 99.3 98.6 99.2 99.2 99.71962 99.1 99.3 99.8 99.9 99.5 99.81963 100.0 100.0 100.0 100.0 100.0 100.01964 101.4 101.5 101.5 100.9 100.9 100.91965 102.8 102.9 103.0 102.4 101.9 102.31966 104.1 104.2 106.5 105.9 105.4 105.51967 107.8 107.9 109.7 109.1 109.5 108.51968 110.6 110.7 113.3 112.7 113.6 112.01969 114.8 114.9 116.9 116.2 117.4 115.41970 120.2 120.3 122.3 121.6 123.4 120.61971 125.5 125.6 127.5 126.7 129.6 125.01972 128.6 128.8 133.7 129.9 133.0 128.21973 133.5 133.6 134.5 133.7 136.5 133.41974 154.7 154.9 150.5 149.6 154.7 156.61975 181.8 182.0 175.1 174.1 177.6 NA
Source: For description of A and B Series see AppendixTable A—i. Other domestic price indexes are data front BLS
price tapes formed into unweighted indexes at the 4—digit SITClevel and then aggregated up from there using U.S. 1963 exportweights.
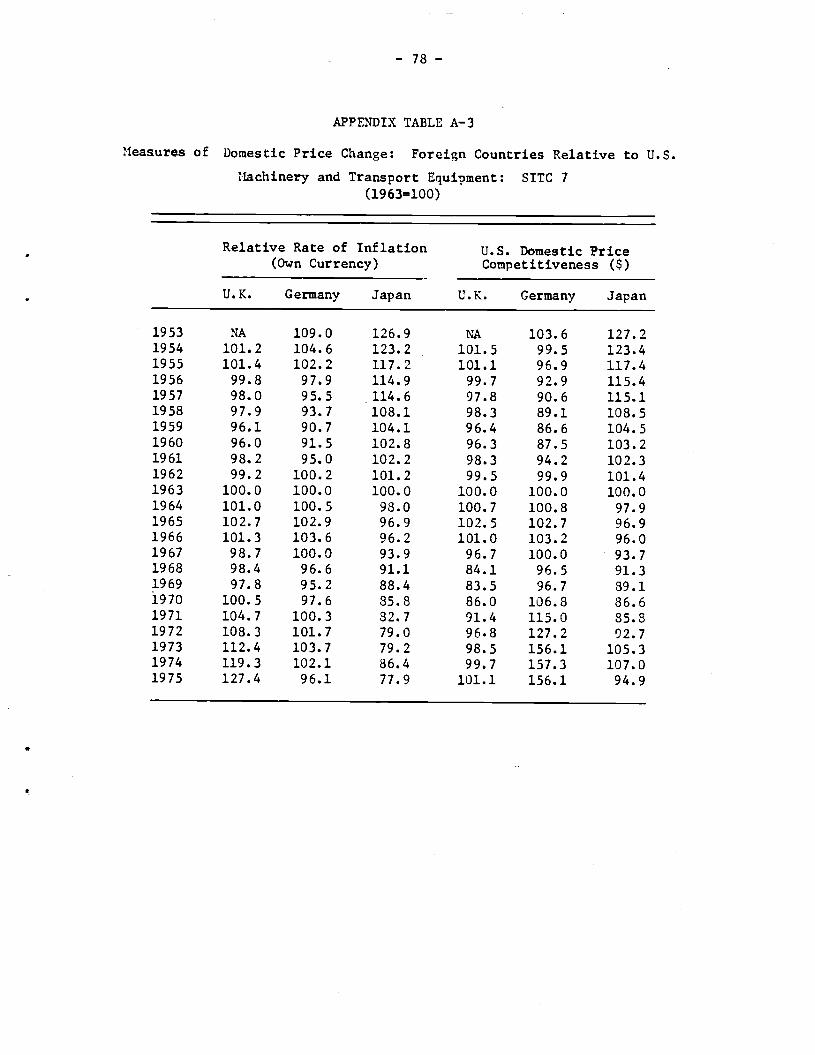
— 78 —
APPENDIX TABLE A-3
Measures of Domestic Price Change: Foreign Countries Relative to U.S.
Uachinery and Transport Equipment: SITC 7(19 63=100)
Relative Rate of Inflation
(Own Currency)U.S. Domestic PriceCompetitiveness ($)
U.K. Germany Japan U.K. Germany Japan
1953 NA 109.0 126.9 NA 103.6 127.21954 101.2 104.6 123.2 101.5 99.5 123.41955 101.4 102.2 117.2 101.1 96.9 117.41956 99.8 97.9 114.9 99.7 92.9 115.41957 98.0 95.5 114.6 97.8 90.6 115.11958 97.9 93.7 108.1 98.3 89.1 108.51959 96.1 90.7 104.1 96.4 86.6 104.51960 96.0 91.5 102.8 96.3 87.5 103.21961 98.2 95.0 102.2 98.3 94.2 102.31962 99.2 100.2 101.2 99.5 99.9 101.41963 100.0 100.0 100.0 100.0 100.0 100.01964 101.0 100.5 98.0 100.7 100.8 97.91965 102.7 102.9 96.9 102.5 102.7 96.91966 101.3 103.6 96.2 101.0 103.2 96.01967 98.7 100.0 93.9 96.7 100.0 93.71968 98.4 96.6 91.1 84.1 96.5 91.31969 97.8 95.2 88.4 83.5 96.7 89.11970 100.5 97.6 85.8 86.0 106.8 86.61971 104.7 100.3 82.7 91.4 113.0 85.81972 108.3 101.7 79.0 96.8 127.2 92.71973 112.4 103.7 79.2 98.5 156.1 105.31974 119.3 102.1 86.4 99.7 157.3 107.01975 127.4 96.1 77.9 101.1 156.1 94.9

— 79 —
Notes to APPENDIX TABLE A—3
The indexes for Germany and Japan through 1974 are aggregates of4—digit relative price indexes. The individual—country 4—digit priceindexes are themselves calculated from individual commodity price dataclassified into SITC subgroups by the NBER. Each German and Japanesedomestic price index at the 4—digit level is divided by the correspondingU.S. index and the resulting relative price indexes are aggregated up to3—digit, 2—digit, and 1—digit levels using as weights total OECD exportsin 1963. The equations using Japanese prices reported in the text tablesare mostly based on a Japan/U.S. relative price index that was constructedby comparing the Japanese price index for SITC 7 with that for the U.S.instead of aggregating up relative price indexes from the 4—digit level.The two methods produced results that were so similar that we did notconsider it worthwhile to recompute the equations on the preferred basis.
The U.K. data were not available at the 4—digit level and weretherefore derived by dividing the U.K. aggregate index for SITC 7 by thatfor the U.S. The U.K. aggregate indexes were provided to the NBER by theDepartment of Industry, Economics and Statistics Division. The indexesthrough 1971 were aggregated from the 4—digit level using 1963 OECDweights, as for the other countries, but those for later years are basedon U.K. export weights for 1973.
For descriptions of the German and Japanese indexes see AppendixTables B—i and C—l. The U.S. extrapolating index for wholesale prices isa weighted average of group indexes for Transportation Equipment (.32805)and Machinery and Equipment (.67195). The weights are based on 1963 U.S.exports. Data for U.S. indexes are from BLS price tapes and the MonthlyLabor Review.
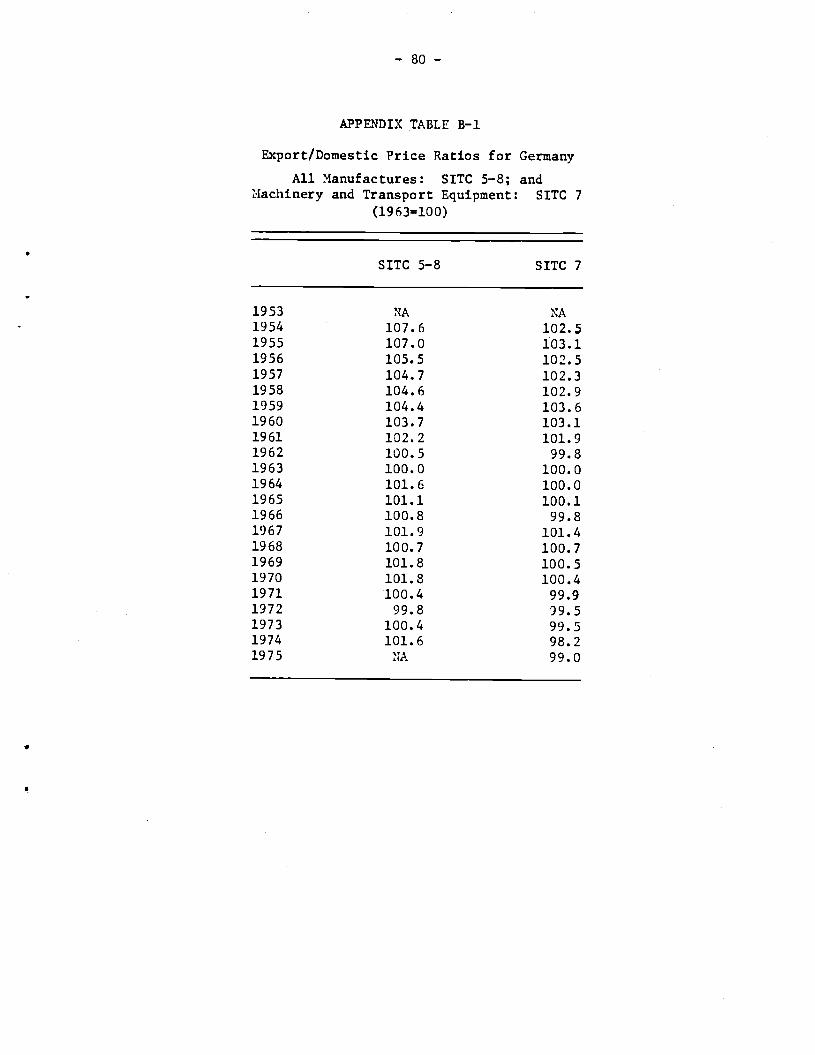
— 80 —
APPENDIX TABLE B—i
Export/Domestic Price Ratios for Germany
All Manufactures: SITC 5—8; andiachinery and Transport Equipment: SITC 7
(1963=100)
SITC 5—8 SITC 7
1953 NA NA1954 107.6 102.51955 107.0 103.11956 105.5 102.51957 104.7 102.31958 104.6 102.91959 104.4 103.61960 103.7 103.11961 102.2 101.91962 100.5 99.81963 100.0 100.01964 101.6 100.01965 101.1 100.11966 100.8 99.81967 101.9 101.41968 100.7 100.71969 101.8 100.51970 101.8 100.41971 100.4 99.91972 99.8 99.51973 100.4 99.51974 101.6 98.21975 NA 99.0

— 81 —
Notes to APPENDIX TABLE B—i
Indexes are aggregations from individual commodity export anddomestic price series, as described for the United States in the Notesto Appendix Table A—i. The discontinuity in the export price indexesat the time of the shift to the value—added tax was treated by assumingno change in price for the month of the shift in the tax system.Extrapolations to 1975 for SITC 7 were based on combinations of publishedgroup indexes as follows:
Domestic price is a weighted index of the followinggroup indexes of the "Index der Erzeugerpreiseindustrielle Produkte"
Maschinenbauer zeugnisse
StrassenfahrzeugeElektrotechnische Erzeugnisse
with weights taken from the export price index.
Export price is a weighted index of the followinggroup indexes of the "Index der Ausfuhrpreise"
Maschinenbauerzeugnisse (einschl. Lokomotivenund Ackerschlepper)
Strassenfahrzeuge (ohne Ackerschlepper)Elektrotechnische Erzeugnisse
with weights of .50637, .29078, and .20286 respectively.•The weights are from the index on 1962=100.
Sources: Preise, LBhne, Wirtschaftsrechnungen, Reihe 1, Preise undPreisindizes fUr Aussenhandelsgilter; Reihe 3, Preise undPreisindizes fUr industrielle Produkte, Index der Erzeugerpreise;Reihe 8, Index der Grosshandelsverkaufspreise (StatistischesBundesamt, Wiesbaden).
Statistisches Jahrbuch fUr die Bundesrepublik Deutsehiand,
1971, pp. 431, 432, 449; 1967, pp. 445, 446, 463 (StatistischesBundesamt, Wiesbaden).
Wirtschaft und Statistik, Nov. 1976.
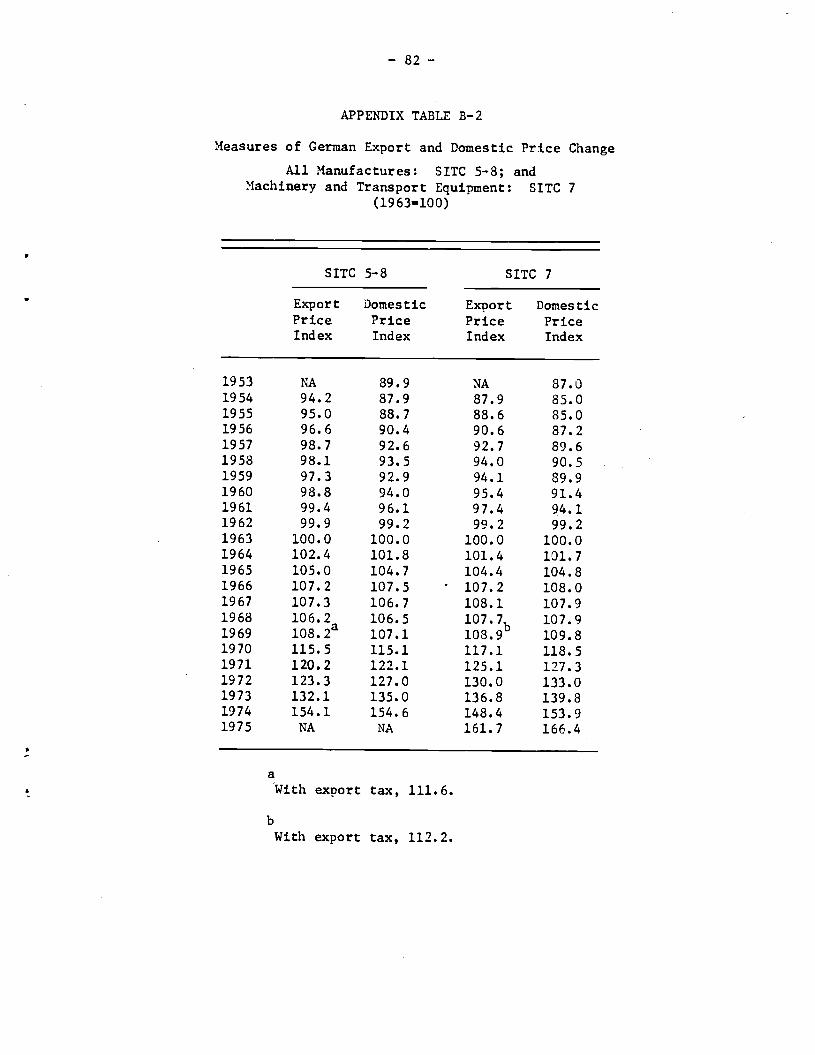
— 82 —
APPENDIX TABLE B—2
Measures of German Export and Domestic Price Change
All Manufactures: SITC 5-8; andMachinery and Transport Equipment: SITC 7
(1963=100)
SITC 5—8 SITC 7
Export Domestic Export DomesticPrice Price Price PriceIndex Index Index Index
1953 NA 89.9 NA 87.01954 94.2 87.9 87.9 85.01955 95.0 88.7 88.6 85.01956 96.6 90.4 90.6 87.21957 98.7 92.6 92.7 89.61958 98.1 93.5 94.0 90.51959 97.3 92.9 94.1 89.91960 98.8 94.0 95.4 91.41961 99.4 96.1 97.4 94.11962 99.9 99.2 99.2 99.21963 100.0 100.0 100.0 100.01964 102.4 101.8 101.4 101.71965 105.0 104.7 104.4 104.81966 107.2 107.5 107.2 108.01967 107.3 106.7 108.1 107.919631969
106.21082a
106.5107.1
'07•7b108.9
107.9109.8
1970 115.5 115.1 117.1 118.51971 120.2 122.1 125.1 127.31972 123.3 127.0 130.0 133.01973 132.1 135.0 136.8 139.81974 154.1 154.6 148.4 153.91975 NA NA 161.7 166.4
a
With export tax, 111.6.
bWith export tax, 112.2.

— 83 —
Notes to APPENDIX TABLE B—2
Indexes are aggregates of indexes for 4—digit SITC subgroups,as described in the Notes to Appendix Table A—i. For sources, see Notesto Appendix Table B—i.
The export tax, introduced at the end of 1968 and removed at theend of 1969, was tried as a variable in a number of equations not shownin the text tables. They did not change the results enough to warrantuse of the equations that included them.
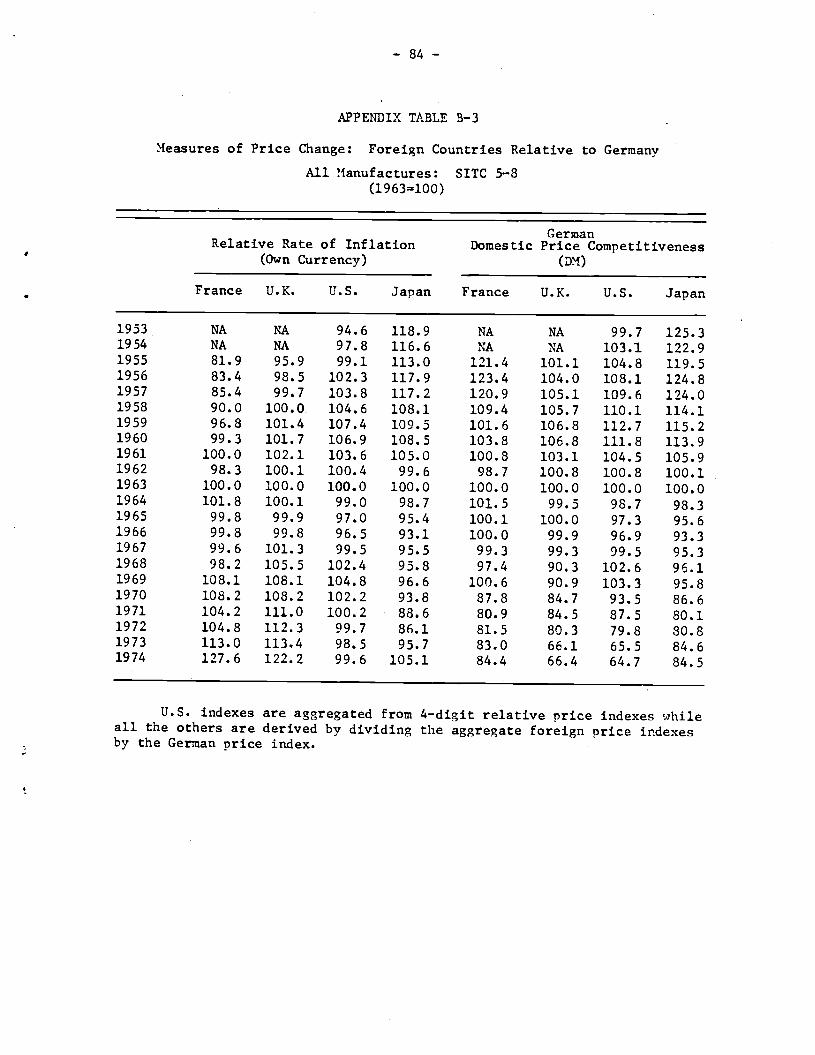
— 84 —
APPENDIX TABLE B—3
Measures of Price Change: Foreign Countries Relative to GermanyAll Manufactures: SITC 5—8
(1963=100)
GermanRelative Rate of Inflation
(Own Currency)Domestic Price Competitiveness
(DM)
France U.K. U.S. Japan France U.K. U.S. Japan
1953 NA NA 94.6 118.9 NA NA 99.7 125.31954 NA NA 97.8 116.6 NA NA 103.1 122.91955 81.9 95.9 99.1 113.0 121.4 101.1 104.8 119.51956 83.4 98.5 102.3 117.9 123.4 104.0 108.1 124.81957 85.4 99.7 103.8 117.2 120.9 105.1 109.6 124.01958 90.0 10O.0 104.6 108.1 109.4 105.7 110.1 114.11959 96.8 101.4 107.4 109.5 101.6 106.8 112.7 115.21960 99.3 101.7 106.9 108.5 103.8 106.8 111.8 113.91961 100.0 102.1 103.6 105.0 100.8 103.1 104.5 105.91962 98.3 100.1 100.4 99.6 98.7 100.8 100.8 100.11963 100.0 100.0 100.0 100.0 100.0 100.0 100.0 100.01964 101.8 100.1 99.0 98.7 101.5 99.5 98.7 98.31965 99.8 99.9 97.0 95.4 100.1 100.0 97.3 95.61966 99.8 99.8 96.5 93.1 100.0 99.9 96.9 93.31967 99.6 101.3 99.5 95.5 99.3 99.3 99.5 95.31968 98.2 105.5 102.4 95.8 97.4 90.3 102.6 96.11969 108.1 108.1 104.8 96.6 100.6 90.9 103.3 95.81970 108.2 108.2 102.2 93.8 87.8 84.7 93.5 86.61971 104.2 111.0 100.2 88.6 80.9 84.5 87.5 80.11972 104.8 112.3 99.7 86.1 81.5 80.3 79.8 30.81973 113.0 113.4 98.5 95.7 33.0 66.1 65.5 84.61974 127.6 122.2 99.6 105.1 84.4 66.4 64.7 34.5
U.S. indexes are aggregated from 4—digit relative price indexes whileall the others are derived by dividing the aggregate foreign price indexesby the German price index.

— 85 —
APPENDIX TABLE B—4
Measures of Price Change: Foreign Countries Relative to Germany
Machinery and Transport Equipment,: SITC 7
(1963=100)
GermanRelative Rate of
Inflation (Own Currency)
Domestic Price
Competitiveness (DM)
U.S. U.K. Japan U.S. U.K. Japan
1953 91.8 NA 131.5 96.5 NA 138.61954 95.6 96.6 132.1 100.5 102.1 139.11955 97.8 99.4 128.4 103.2 104.8 135.71956 102.1 101.1 128.1 107.6 106.7 135.61957 104.7 102.3 128.0 110.4 107.8 135.41958 106.7 103.9 122.5 112.2 109.9 129.41959 110.2 105.3 118.7 115.5 110.9 124.91960 109.3 104.1 115.3 114.3 109.3 121.11961 105.3 103.5 109.4 106.1 104.6 110.31962 99.8 99.5 102.2 100.1 100.2 102.81963 100.0 100.0 100.0 100.0 100.0 100.01964 99.5 100.2 97.9 99.2 99.6 97.51965 97.1 99.9 95.3 97.4 100.0 95.51966 96 6 98.8 93.0 96.9 98.9 93.11967 100.0 100.1 92.4 100.0 98.1 92.21968 103.5 103.6 92.2 103.6 88.7 92.51969 105.1 104.5 90.4 103.4 87.9 89.71970 102.4 104.6 85.1 93.7 81.9 78.51971 99.7 106.6 79.3 87.0 81.2 71.71972 98.3 108.3 75.8 78.6 77.5 71.11973 96.5 109.8 75.2 64.1 64.0 66.4
1974 98.0 119.8 83.3 63.6 65.1 67.0
1975 104.1 135.9 79.9 64.1 66.6 59.9
U.S. indexes are aggregated from 4—digit relativeprice indexes while all the others are derived by dividingthe aggregate foreign price indexes by the German priceindex.

— 86 —
APPENDIX TABLE C—i
Export/Domestic Price Ratios for Japan
All Manufactures: SITC 5—8; andMachinery and Transport Equipment: SITC 7
(1963=100)
SITC 5—8 SITC 7
1953 101.3 108.51954 102.7 105.71955 103.5 102.01956 104.8 101.61957 103.1 99.21958 100.6 100.11959 102.1 99.11960 102.3 98.61961 101.2 99.51962 100.1 99.91963 100.0 100.01964 101.2 101.11965 101.1 101.51966 99.5 101.41967 99.5 102.21968 100.6 102.51969 101.0 103.41970 99.6 103.31971 99.0 104.01972 95.9 103.01973 94.1 102.81974 97.3 101.61975 NA 103.7
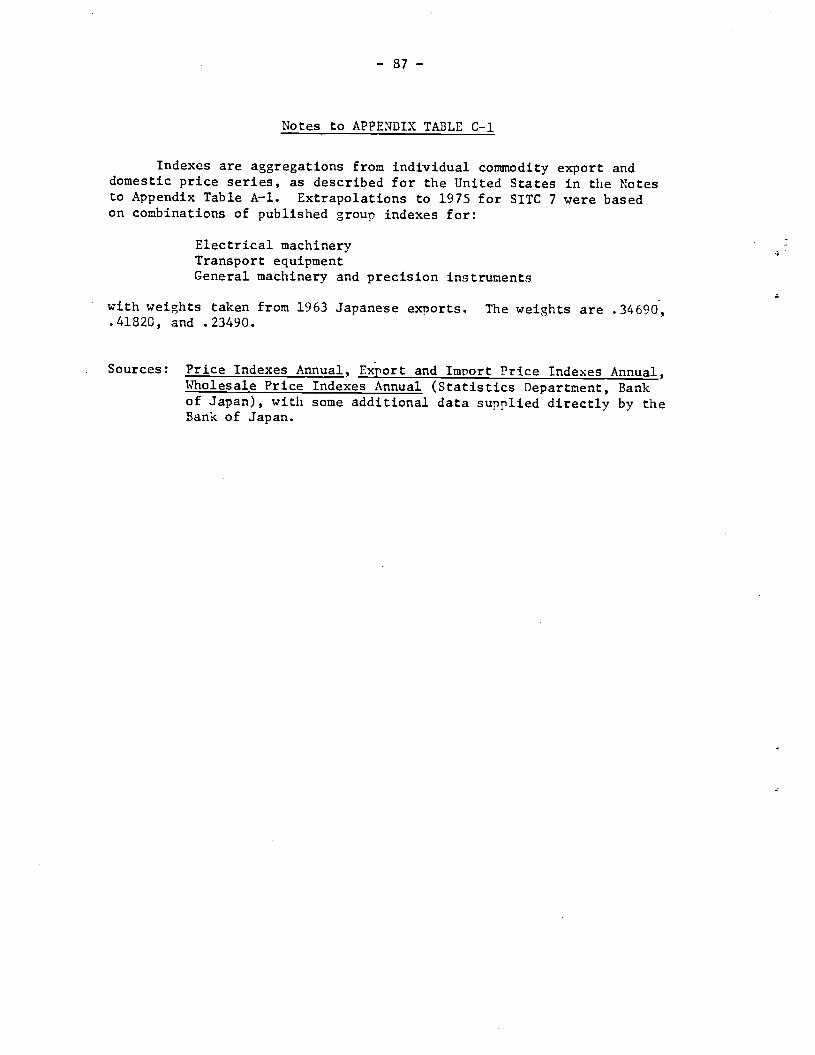
— 87 —
Notes to APPENDIX TABLE C-].
Indexes are aggregations from individual commodity export anddomestic price series, as described for the United States in the Notesto Appendix Table A—i. Extrapolations to 1975 for SITC 7 were basedon combinations of published group indexes for:
Electrical machineryTransport equipmentGeneral machinery and precision instruments
with weights taken from 1963 Japanese exiorts. The weights are .34690,.41820, and .23490.
Sources: Price Indexes Annual, Export and Import Price Indexes Annual,Wholesale Price Indexes Annual (Statistics Department, Bankof Japan), with some additional data supplied directly by theBank of Japan.

— 88 —
APPENDIX TABLE C—2
Measures of Japanese Export and Domestic Price ChangeAll Manufactures: SITC 5—8; and
Machinery and Transport Equipment: SITC 7(1963=100)
SITC 5—3 SITC 7
Export Domestic ExportPrice Price PriceIndex Index Index
PriceIndex
1953 105.0 106.9 118.61954 111.6 102.6 116.6
114.5
1955 108.7 100.3 111.2112.3
1956 111.7 106.6 112.0109.1
1957 110.7 108.5 113.9111.7
1958 103.1 101.0 112.0114.7
1959 105.7 101.6 111.5110.9
1960 106.6 102.0 110.3106.7
1961 102.6 100.9 104.6105.4
1962 98.8 98.8 101.1103.0
1963 100.0 100.0 100.0101.4
1964 101.8 100.5 100.2100.0
1965 100.9 99.899.6
1966 100.1 100.1 101.399.8
1967 100.8 101.9 101.6100.4
1968 101.8 102.0 102.599.7
1969 104.2 103.5 104.099.5
1970 107.8 108.0 107.399.3
1971 108.0 108.2 111.3100.9
1972 105.9 109.3 109.4101.0
1973 117.7 129.2 112.2100.8
1974 156.1 162.5 139.0105.1
1975 NA NA 147.2128.2132.9
Indexes are aggregates of indexes for4—digit SITC subgroups, as described in the Notesto Appendix Table A—i. For sources, see Notes toAppendix Table C—i.

— 89 —
APPENDIX TABLE C—3
Measures of Price Change: Foreign Countries Relative to Japan
All Manufactures: SITC 5—8
(1963=100)
Relative Rate of Inflation
(Own Currency)
JapaneseDomestic Price Competitiv
(Yen)
eness
U.S. France Germany U.K. U.S. France Germany U.K.
1953 78.3 NA 84.1 NA 78.1 NA 79.8 NA
1954 82.8 NA 85.8 NA 32.7 NA 81.4 NA
1955 86.9 72.5 88.5 84.8 86.7 101.3 83.7 84.4
1956 85.4 70.7 84.8 33.6 85.1 98.7 80.1 83.1
1957 88.1 72.9 85.3 85.0 87.8 97.3 80.6 84.5
1958 96.2 83.3 92.5 92.5 95.8 95.7 87.7 92.5
1959 97.3 88.4 91.3 92.6 96.9 88.1 86.8 92.5
1960 97.7 91.5 92.2 93.7 97.3 91.1 87.8 93.6
1961 98.3 95.2 95.2 97.2 98.7 95.0 94.4 97.2
1962 101.0 98.7 100.4 100.5 100.8 98.5 99.9 100.6
1963 100.0 100.0 100.0 100.0 100.0 100.0 100.0 100.0
1964 100.4 103.1 101.3 101.4 100.5 103.2 101.7 101.2
1965 102.5 104.6 104.9 104.8 102.5 104.6 104.6 104.6
1966 105.4 107.2 107.4 107.2 105.6 107.1 107.2 107.1
1967 106.5 104.4 104.7 106.1 106.7 104.2 104.9 104.2
1968 109.8 102.6 104.4 110.1 109.6 101.3 104.1 93.9
1969 111.4 111.9 103.5 111.9 110.6 104.9 104.3 94.8
1970 111.7 115.3 106.6 115.3 110.7 101.4 115.5 97.8
1971 115.6 117.5 112.8 125.2 111.4 100.8 124.8 105.3
1972 117.3 121.7 116.2 130.5 99.9 100.6 123.8 99.4
1973 103.3 113.0 134.5 113.3 77.6 98.0 118.3 78.1
1974 96.4 121.3 95.1 116.2 77.8 99.7 118.3 78.5
U.S. ir,dexes are aggregated from 4—digit relative price indexes, whileall the others are derived by dividing the aggregate foreign price indexes bythe Japanese price indexes.

— 90 —
APPENDIX TABLE C—4
Measures of Price Change: ForeignCountries Relative to Japan
Machinery and Transport Equipment: SITC 7(19 63=100)
Relative Rate ofInflation (Own Currency)
JapaneseDomestic Price
Competitiveness (Yen)
U.S. U.K. Germany U.S. U.K. Germany
1953 69.7 NA1954 72.3 73.1
76.0 69.5 NA 72.2
1955 76.4 77.475.7 72.1 73.2 71.9
1956 79.1 78.977.9 76.2 77.0 73.7
1957 81.5 79.978.1 78.8 78.5 73.8
1958 86.6 84.878.1 81.2 79.5 73.8
1959 92.3 88.781.6 86.2 84.8 77.3
1960 94.0 90.384.2 91.9 38.6 30.1
1961 96.3 94.636.7 93.7 90.2 82.6
1962 98.1 97.391.4 96.3 94.6 90.6
1963 100.0 100.097.8 97.9 97.4 97.3
1964 101.3 102.3100.0 100.0 100.0 100.0
1965 102.1 104.9102.1 101.4 102.1 102.5
1966 105.0 106.3105.0 102.1 104.7 104.7
1967 109.3 108.4107.6 105.2 106.2 107.4
1968108.2
114.2 112.4110.0 106.4 108.4
1969 113.2 115.6108.4 114.0 95.8 108.1
1970 122.3 122.9110.6 117.3 97.9 111.5
1971 126.3 134.3117.5 121.2 104.2 127.3
1972 132.0 143.0126.0 123.7 113.0 139.4
1973 129.9 146.0132.0 112.5 108.8 140.6
1974 120.6 143.8133.0 97.6 96.2 150.5
1975 133.6 170.2120.0125.2
97.3 97.1109.7 111.0
149.3167.0
U.S. indexes are aggregated from 4—digit relativeprice indexes while all the others are derived by dividingthe aggregate foreign price indexes by the Japanese priceindex.

—91—
APPENDIX TABLE D-1
Effective Exchange Rates Against 21 Trading Partners and
U.S. Exchange Rates Against the , DM, French Franc, and Yen
(1963=100)
Effective Exchange Rates—DM
FrenchFranc YenU.S. Germany Japan
1953 93.0 86.9 96.0 95.4 95.1 140.1 100.2100.2
1954 92.8 86.9 95.9 95.2 95.1140.1 100.2
1955 93.3 86.7 96.5 94.6 94.8100.4
1956 93.7 86.9 96.7 94.8 94.9134.0 100.4
1957 93.9 87.8 97.0 94.7 94.9115.4 100.4
1958 95.8 90.7 98.3 100.4 95.1100.4
1959 97.3 93.8 99.3 100.3 95.4100.41960 98.0 94.3 99.7 100.3 95.6
99.9 190.11961 99.0 99.1 99.8 100.1100.0 100.2
1962 99.8 99.6 100.1 100.3 99.7100.0 100.0
1963 100.0 100.0 100.0 100.0 100.099.9
1964 100.1 100.3 99.8 99.7 100.3100.0 100.0
1965 100.2 100.1 100.2 99.8 99.399.7 99.8
1966 100.6 100.5 100.2 99.7 99.799.6 99.8
1967 100.7 101.0 100.4 98.0 100.098.9 100.2
1968 102.3 102.4 102.1 85.5 99.994.5 100.3
1969 102.5 105.3 103.0 35.4 101.6100.9
1970 101.4 114.3 102.5 85.5 109.489.0 103.7
1971 99.0 118.5 104.3 87.3 114.797.2 117.4
1972 92.2 122.4 115.0 89.4 125.1110.4 133.0
1973 84.1 136.6 125.4 87.7 150.5101.9 123.9
1974 86.4 143.3 117.7 33.6 154.1114.6 121.3
1975 85.5 145.8 114.0 79.4 162.4
Data are from the International Monetary Fund.
The effective exchange rates are those derived from the LtF
Multilateral Exchange Rate Model (MEBN), as described in Rudolf R.
Rhomberg, "Indices of Effective Exchange Rates,t' MF Staff Papers,
Vol. XXIII, No. 1, March 1976. The rates against the dollar are
annual averages of daily noon rates in New York.
The bilateral exchange rates for the DM and the yen used in
equations for those countries in this paper are all derived from
these rates against the dollar.

— 92 —
APPENDIX TABLE D-2
Ratios of Exports to Manufacturing Shitments or OutputUnited States, Germany, and Japan, 1953—1974
(196310o)
U.S. Germany Japan
1953 102.0 75.3 83.41954 105.7 82.6 104.71955 93.7. 84.0 121.01956 112.5 92.6 117.11957 107.9 100.5 112.81953 111.7 97.8 115.41959 92.1 99.7 115.51960 102.2 102.6 109.81961 108.6 98.8 94.61962 104.9 94.5 98.41963 100.0 100.0 100.01964 106.8 101.1 104.81965 100.3 100.2 126.81966 100.1 108.4 127.91967 109.8 117.8 114.21968 114.7 119.7 120.11969 123.6 119.9 122.91970 142.4 116.4 124.91971 143.4 117.2 141.31972 139.6 119.9 147.21973 159.9 127.5 152.71974 208.9 157.5 214.81975 247.2
— 93 —
Notes to PIPPENDIX TABLE D—2
U.S.: Value of exports from various issues of the Survey of CurrBusines. (1973 and 1974), Business Statistics: 1973, p. 113(1965—72), Foreign Commerce and Navigation of the U.S.: 5,
p. 15 (1958—64), and Coodity Trade Statistics, United Nations,
(1953—58).
Value of shipments from various issues of the Survey of Current
Business and from Business Statistics: 1973, p. 26.
Germany: Value of exports from various issues of the StatistichesJahrbuch.
Value of manufacturing output from the Yearbook of Nation
Accounts Statistics, United Nations.
Japan: Value of exports from International Economic Indicators, U.S.
Dept. of Commerce (1972—74) and various issues of the Monthly
Statistics of Japan, Bureau of Statistics, Office of the Prime
Ninister.
Value of shipments from Statistical Survey of the Economyci1966, 1970, and 1975, !inistry of Foreign Affairs,
Economic Affairs Bureau.

—94--
APPENDIX TABLE D—3
Indicators of Cyclical Activity:United States and Six Other Countries
(19 63=100)
Six—CountriesComposite Index
U.S. Composite of DeflatedIndex of Leading
12 Leading Indicators,Indicators GNP Weighted
1953 36.2 60.11954 85.7 63.31955 96.7 71.81956 93.6 75.51957 87.3 76.41958 86.0 73.51959 96.5 84.71960 89.3 94.01961 92.6 98.51962 95.7 95.01963 100.0 100.01964 106.8 104.51965 111.9 103.31966 113.5 104.31967 111.5 102.91963 120.0 110.11969 122.3 116.01970 112.2 112.31971 119.7 111.21972 131.7 119.71973 138.2 139.71974 122.7 140.41975 NA 130.0
U.S. index is from Business ConditionsDigest (U.S. Department of Coumerce), May1976, pp. 106—107.
Six—Country Index is an unpublishedseries from the NBER International Economic
Indicator project. The countries includedare Canada, France, Geriiany, Italy, the U.K.,and Japan.

— 95 —
List of References
Germany, Statistisches Bundesamt, Preise LBhne. WirtschaftsrechnungenReihe 1, Preise und Preisindizes für AussenhandeisgliterReihe 3, Preise und Preisindizes für Industrielle ProdukteReihe 8, Index der Grosshnde1sverkaufspreiSe
_______ Statistisches Jahrbuch für die Bundesrepublik Deutschland.
_______ Wirtschaft und Statistik.
Japan, Bank of Japan, Statistics Department, Price Indexes Annual.
_______ Export and Import Price Indexes Annual.
_______ Wholesale Price Indexes Annual.
Japan, Ministry of Foreign Affairs, Economic Affairs Bureau, StatisticalSurvey of the Economy of Japan.
Japan, Office of the Prime Minister, Bureau of Statistics, MonthlyStatistics of Japan.
Kravis, Irving B. and Robert E. Lipsey, Price Competitiveness in World
Trade, NBER, 1971.
_______ "The Elasticity of Substitution as a Variable in World Trade,"in International Comparisons of Prices and Output, Studies in Income
and Wealth, Vol. 37, NBER, 1972.
_______ "International Trade Prices and Price Proxies," in The Role of theComputer in Economic and Social Research in Latin America, NBER, 1974.
_______ "Export Prices and the Transmission of Inflation," American
Economic Review, February 1977.
National Institute of Economic and Social Research, National InstituteEconomic Review, London.
Rhomberg, Rudolf R., "Indices of Effective Exchange Rates," IMP StaffPapers, Vol. XXIII, No. 1, March 1976.
United Nations, Coimnodity Trade Statistics.
_______ Standard International Trade Classification, Revised, Statistical
Papers, Series M, No. 34, 1961.
_______, Yearbook of National Accounts Statistics.

— 96 —
United States, Department of Commerce, sinegs COndjtjos Digest.
, Business Statistics: 1973.
International Economic Indicato.
— , vey of Current Business.
United States, Department of Commerce, Bureau of the Census, ForeignCommerce and Navigatjo of the U.S.: 1965.
United States, Department of Labor, Bureau of Labor Statistics, "u.s.Export and Import Price Indexes."
—, nth1y Labor Review.