Embed Size (px)
Citation preview
NBER WORKING PAPER SERIES
EXPECTATIONS OF EQUITY RISK PREMIA, VOLATILITY ANDASYMMETRY FROM A CORPORATE FINANCE PERSPECTIVE
John R. GrahamCampbell R. Harvey
Working Paper 8678http://www.nber.org/papers/w8678
NATIONAL BUREAU OF ECONOMIC RESEARCH1050 Massachusetts Avenue
Cambridge, MA 02138December 2001
We thank the Financial Executives International (FEI) executives who took the time to fill out the surveys.We thank Alon Brav, Magnus Dahlquist, Ron Gallant, Jim Smith, Paul Soderlind and Bob Winkler for theirhelpful comments and the participants at the NBER Corporate Finance Summer Workshop. KrishnamoorthyNarasimhan provided research assistance. This research is partially sponsored by FEI but the opinionsexpressed in the paper are those of the authors and do not necessarily represent the views of FEI. Grahamacknowledges financial support from the Alfred P. Sloan Research Foundation. The views expressed hereinare those of the authors and not necessarily those of the National Bureau of Economic Research.
© 2001 by John R. Graham and Campbell R. Harvey. All rights reserved. Short sections of text, not toexceed two paragraphs, may be quoted without explicit permission provided that full credit, including ©notice, is given to the source.
Expectations of Equity Risk Premia, Volatility andAsymmetry from a Corporate Finance PerspectiveJohn R. Graham and Campbell R. HarveyNBER Working Paper No. 8678December 2001JEL No. G1, G3
ABSTRACT
We present new evidence on the distribution of the ex ante risk premium based on a multi-year
survey of Chief Financial Officers (CFOs) of U.S. corporations. Currently, we have responses from
surveys conducted from the second quarter of 2000 through the third quarter of 2001. The results in this
paper will be augmented as future surveys become available. We find direct evidence that the one-year
risk premium is highly variable through time and 10-year expected risk premium is stable. In particular,
after periods of negative returns, CFOs significantly reduce their one-year market forecasts, disagreement
(volatility) increases and returns distributions are more skewed to the left. We also examine the relation
between ex ante returns and ex ante volatility. The relation between the one-year expected risk premium
and expected risk is negative. However, our research points to the importance of horizon. We find a
significantly positive relation between expected return and expected risk at the 10-year horizon.
John R. Graham Campbell R. HarveyFuqua School of Business Fuqua School of BusinessDuke University Duke UniversityDurham, NC 27708 Durham, NC 27708
and NBERTel: 919-660-7768Fax: [email protected]
Expectations of Equity Risk Premia 1
1. IntroductionThe current market capitalization of U.S. equities is approximately $10 trillion.
A shift in the equity risk premium by just one percent could add or subtract $1
trillion in market value. In addition, corporate investment decisions hinge on the
expectations of the risk premium (via the cost of capital) as do both U.S. and
international asset allocation decisions. Therefore, it is important for financial
economists to have a thorough understanding of the expected risk premium and
the factors that influence it.
The expected market risk premium has traditionally been estimated using long-
term historical average equity returns. Using this approach, in December 1999,
the arithmetic average return on the S&P 500 over and above the U.S. Treasury
bill was reported by Ibbotson Associates (2000) to be 9.32%. This is an
extraordinarily high risk premium – though it seems to have influenced the views
of a great many academics [Welch (2000)]. Fama and French (2001) conclude
that average realized equity returns are in fact higher than ex ante expected
returns over the past half century because realized returns included “large
unexpected capital gains”. If this is true, then using historical averages to estimate
the risk premium is misleading.
We use a different approach to estimate the expected risk premium and offer a
number of new insights. We base our estimate on a multiyear survey of Chief
Financial Officers (CFOs), designed to measure their expectations of risk premia
over both short and long horizons. Our survey is unique in that we obtain a
measure of the entire risk premium distribution, rather than just the expected
value (mean). That is, our survey captures both market volatility and asymmetries
implicit in the respondents’ probability distributions. In addition, we shed light on
how recent stock market performance impacts the ex ante risk premium, volatility
and asymmetries. We also study the relation between expected risk and expected
return.
Expectations of Equity Risk Premia 2
There are many methods to estimate the equity risk premium and we can not
tell which method is the best – because the variable of interest is fundamentally
unobservable. The average of past returns is the method with the longest tradition.
However, there are other time-series methods that use measures like dividend
yields to forecast and short-horizon premia. These models are difficult to estimate
and often structurally unstable [see Garcia and Ghysels (1999)].
There is considerable recent interest in what might be referred to as the implied
method. There are two streams of this research. The original is based on the work
of Black and Litterman (1990, 1991) and French and Poterba (1991). They argue
that one can use investment weights to determine the equilibrium expected returns
on equities as well as other assets. Graham and Harvey (1996) use a variant of this
method to study the time-series behavior of equity risk premia implicit in the asset
allocation recommendations of investment advisors.
A second approach uses fundamental data to deduce risk premia. Gebhardt, Lee
and Swaminathan (2000) use firm level cash flow forecasts to derive an internal
rate of return, or cost of capital, given the current stock price. Fama and French
(2001) study the risk premia on the S&P 500 from 1872-2000 using fundamental
data. They argue that the ex ante risk premia is much lower than the historical
average, between 2.55% and 4.32% for 1951-2000. Ibbotson and Chen (2001)
estimate a long-term risk premium between 4 and 6%.
The final approach to estimate the equity risk premium category directly
measures investor’s and analyst expectations using survey methods. For example,
Welch (2000) analyzes the views of financial economists. Fraser (2001) and
Harris and Marston (2001) consider the evidence from financial analysts.
We, instead, survey CFOs. We think that this approach has several advantages.
First, one could argue that the financial economists are not directly connected to
the allocation decisions in the economy - either capital allocation (financial
investment decisions) or real allocation (choosing real investment projects).
Expectations of Equity Risk Premia 3
CFOs, in contrast, are directly involved their firms’ financial and real allocation
decisions.
Second, biases in analysts’ earnings expectations are well documented. Claus
and Thomas (2001) use analysts’ earnings expectations to derive an estimated
market risk premium of 3.4%. However, to obtain a risk premium this low they
dampen the analysts’ earnings growth projections for earnings more than five
years in the future. When growth is not dampened, Harris and Marston (2001)
find an implicit risk premium of 9.2% in 1998. More to the point, Brav and
Lehavy (2001) show that analysts’ target stock prices are also biased upward.
Brav and Lehavy find that analysts’ target prices predict a 22% average annual
increase in stock prices from 1997-1999, while realized returns average only 15%.
In contrast, there is no reason to think that CFOs are biased in their view of the
market equity premium.
The CFOs determine the hurdle rate for their firm’s investments, and
presumably, the equity risk premium plays an important role. Indeed, the evidence
in Graham and Harvey (2001) indicates that three-fourths of firms use the capital
asset pricing model (CAPM) of Sharpe (1964) and Lintner (1965) to establish
their cost of capital. The equity risk premium is a critical input into the CAPM.
Our paper offers much more than a survey of CFO’s expectations for the
market. Our survey is multiyear and rich with additional information. We ask
CFOs about their expectations of market performance over both one and 10-year
horizons. We ask questions designed to determine their assessment of market
volatility. These questions allow us to deduce each CFO’s view about the
distribution for the market risk premium, and we can observe how the shape and
location of these distributions vary with market conditions.
The temporal dimension distinguishes our work from most previous survey
work. We are able to address issues such as whether volatility and the risk
premium are positively correlated through time. We are able to determine whether
Expectations of Equity Risk Premia 4
recent stock market performance changes expected returns. The interplay of
recent equity performance and volatility expectations allows us to say something
about asymmetric volatility. Our survey even allows us to deduce a measure of ex
ante skewness.
While the surveys are anonymous, we have information on each respondent’s
industry, size by revenue, number of employees, headquarters location, ownership
and percentage of foreign sales. We use this information to see if there are
systematic differences in expectations based on firm characteristics.
Importantly, this is on-going research. We have conducted surveys representing
over 1,100 total responses, from the second quarter of 2000 through the third
quarter of 2001. We plan to update this paper as new surveys are conducted.
The results indicate that the one-year risk premium averages between 0.1 and
2.5 percent depending on the quarter surveyed. The 10-year premium is much less
variable and ranges between 3.6 and 4.7 percent. We find that the CFOs’
assessment of market volatility is much lower than popular alternative measures,
strongly suggesting that CFOs are very confident in their opinions (i.e., their
individual distributions for the market risk premium are tight).
We also find that the recent performance of the S&P 500 has a significant effect
on the short-term expected risk premium as well as forecasted volatility. Recent
stock market performance also has a pronounced effect on CFO's ex ante
skewness. In general, when recent stock market returns have been low, the
expected risk premium is low, its distribution has a relatively fat left tail, and
expected market volatility is high. Finally, we document a negative ex ante
relation between expected returns and expected volatility at the one-year horizon
and a positive relation at the 10-year horizon. Our results support the notion of a
positive tradeoff between risk and expected return – but only at longer horizons.
Expectations of Equity Risk Premia 5
The paper is organized as follows. The second section details the methodology
and the sampling procedure. The results are presented in the third section. An
analysis conditional on firm characteristics is outlined in the fourth section. Some
concluding remarks are offered in the final section.
2. Methodology2.1 Design
The quarterly survey project is a joint effort with the Financial Executives
International (FEI). FEI has approximately 14,000 members that hold policy-
making positions as CFOs, treasurers, and controllers at 8,000 companies
throughout the U.S. and Canada. Every quarter, Duke University and the FEI poll
these financial officers with a one-page survey on important topical issues
(Graham, 1999). The usual response rate for the quarterly survey is 5%-8%.
The history of the survey instrument appears on the Internet at the address
http://www.duke.edu/~charvey/Research/indexr.htm. Exhibit 1 details the exact
questions that we asked regarding the equity premium.
2.2 Delivery and response
The survey is administered by a third-party data processing firm (Office
Remedies Inc.). FEI faxes out approximately 4,000 surveys to a sample of their
membership. The executives return their completed surveys by fax to the third-
party data vendor. Using a third party ensures that the survey responses are
anonymous. Although we do not know the identity of the survey respondents, as
mentioned previously, we do know a number of firm-specific characteristics, as
discussed below.
The surveys analyzed in this paper were distributed on the following days: June
6, 2000; September 7, 2000; December 4, 2000; March 12, 2001; June 7, 2001
Expectations of Equity Risk Premia 6
and September 10, 2001. In each case, the survey contained information about the
yield on the 10-year Treasury bond at the close of the previous business day, and
the respondents were given approximately five business days to return the survey.
The date and time the survey is received is recorded on the survey. This allows us
to examine if recent equity returns impact the CFOs’ responses when they fill out
the survey. Two-thirds of the surveys are usually returned within two business
days.
We also conducted a survey at the North Carolina CFO Symposium (also
sponsored by FEI) on August 22, 2000. In this case, we were able to obtain a
response from nearly every executive in the room. By comparing these responses
with the faxed quarterly survey responses, we are able to examine whether the
response rate on the quarterly survey affects the CFO predictions about the equity
market risk premium. (For example, perhaps predominantly “optimists” respond
to the quarterly survey.) The North Carolina CFO survey also gathered some
additional information about the 10-year risk premium not found on the quarterly
surveys. We find that the responses for the North Carolina CFO survey are
consistent with those from the quarterly survey. We integrate the responses from
this survey into our main results. In our graphical analysis, we highlight this
particular survey with a different symbol.1
2.3 The survey instrument and summary statistics
The risk premium questions are a subset of a larger set of questions in the
Duke-FEI quarterly survey of CFOs. Copies of the surveys can be found on the
Internet.
We ask respondents for their one- and 10-year forecasts of the S&P500 given
the current 10-year Treasury bond rate (see Exhibit 1). The CFOs also complete
Expectations of Equity Risk Premia 7
the following statement: “During the next year, there is a 1-in-10 chance that the
S&P 500 return will be higher than ___%” as well as the analogous question for
the “lower” equity return. This allows us to examine each respondent's
distribution of expected returns. We can recover a measure of volatility as well as
skewness from each individual’s responses.
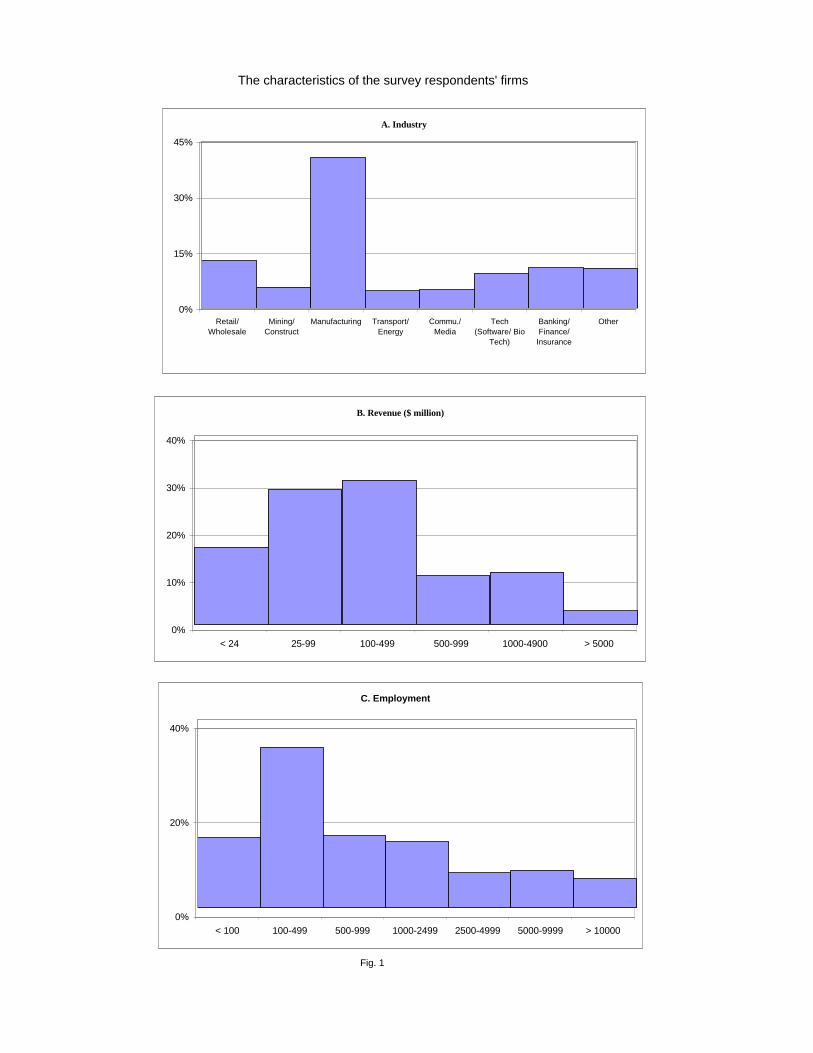
While the survey is anonymous, we ask questions about the firms'
characteristics. Fig. 1 presents summary information about the firms in our
sample. For this figure, we do not include the characteristics of the firms that
participated in the North Carolina CFO Symposium – but concentrate on the
quarterly survey participants. We examine three characteristics: industry, revenue,
and number of employees.
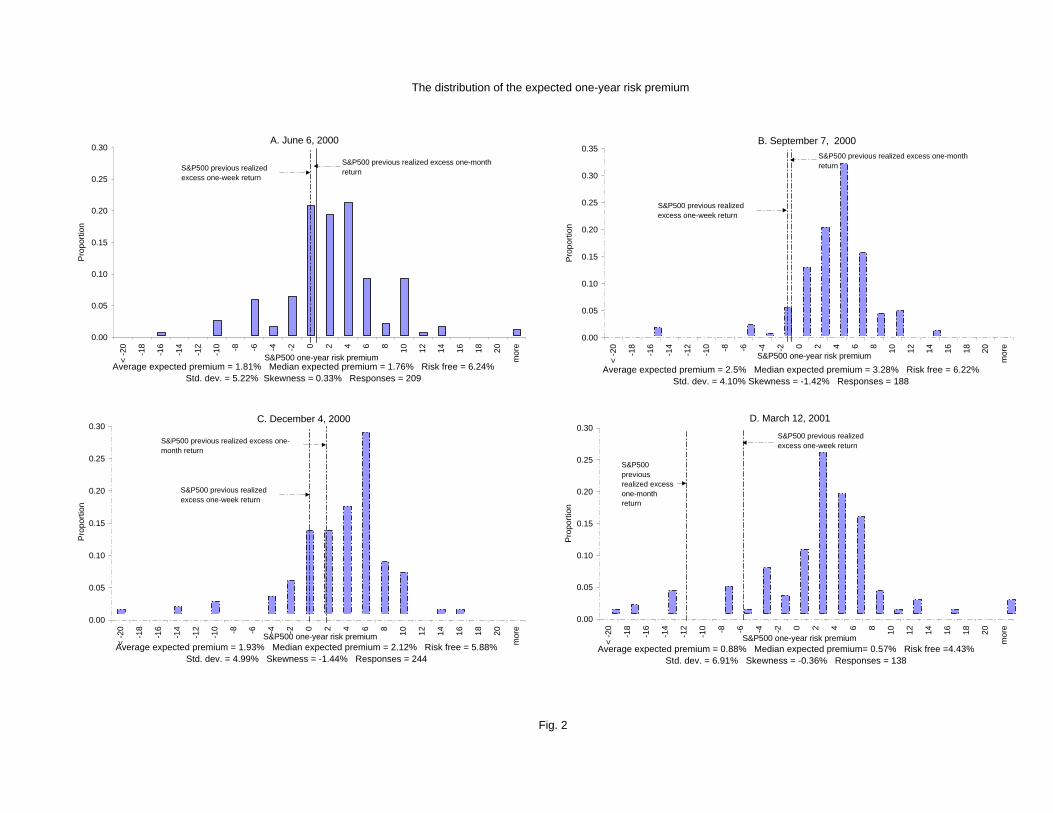
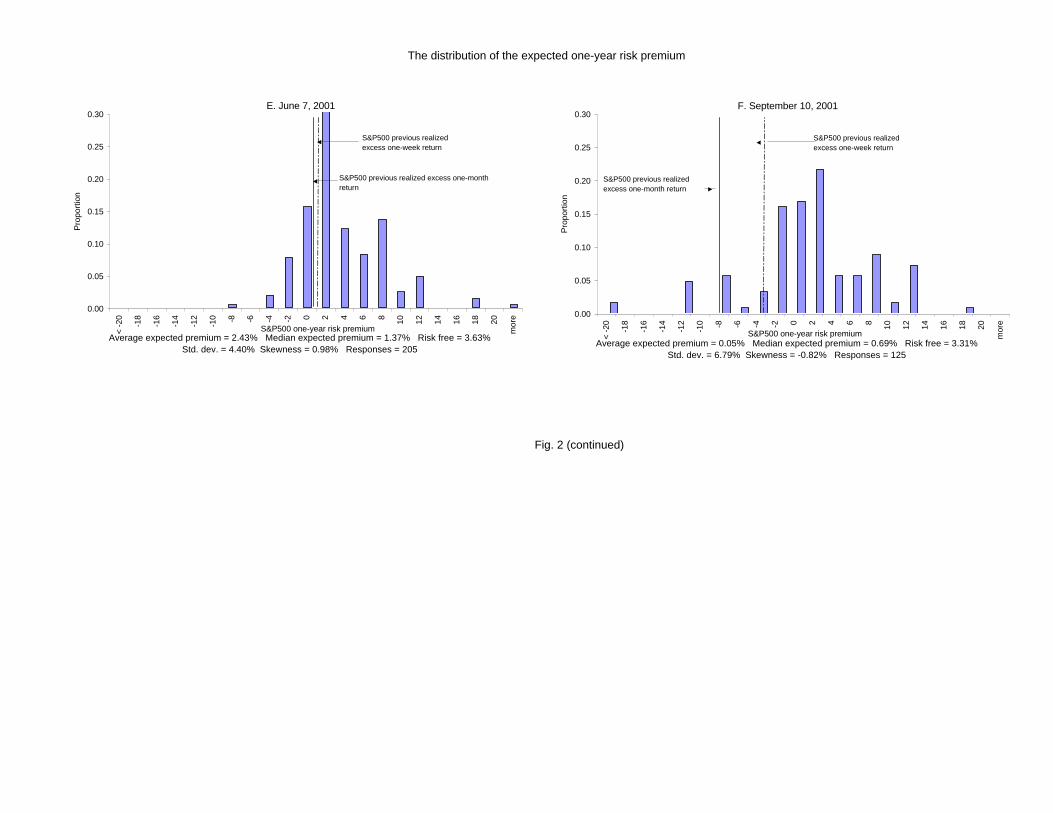
3. The market risk premium and volatility3.1 Risk premium
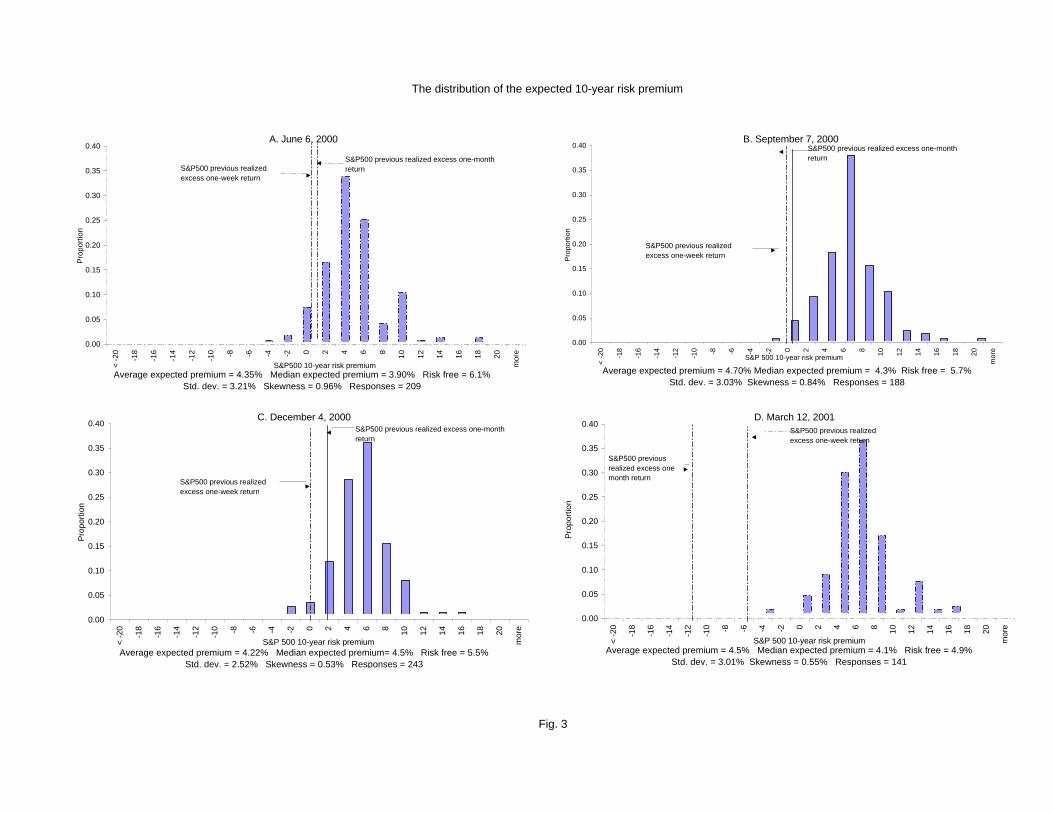
Fig. 2 and 3 present histograms of the ex ante one-year and 10-year risk premia.
In Fig. 2, the average one-year risk premium ranges from 0.1% (September 10,
2001 survey) to 3.0% (December 4, 2000). Each of the graphs contains the
previous week and previous month's S&P 500 return. Note that the market return
was negative preceding the September 10, 2001 survey, and that the average risk
premium is the lowest for this survey, 0.1%. Also, for this survey we only include
observations that faxed before September 11, 2001.
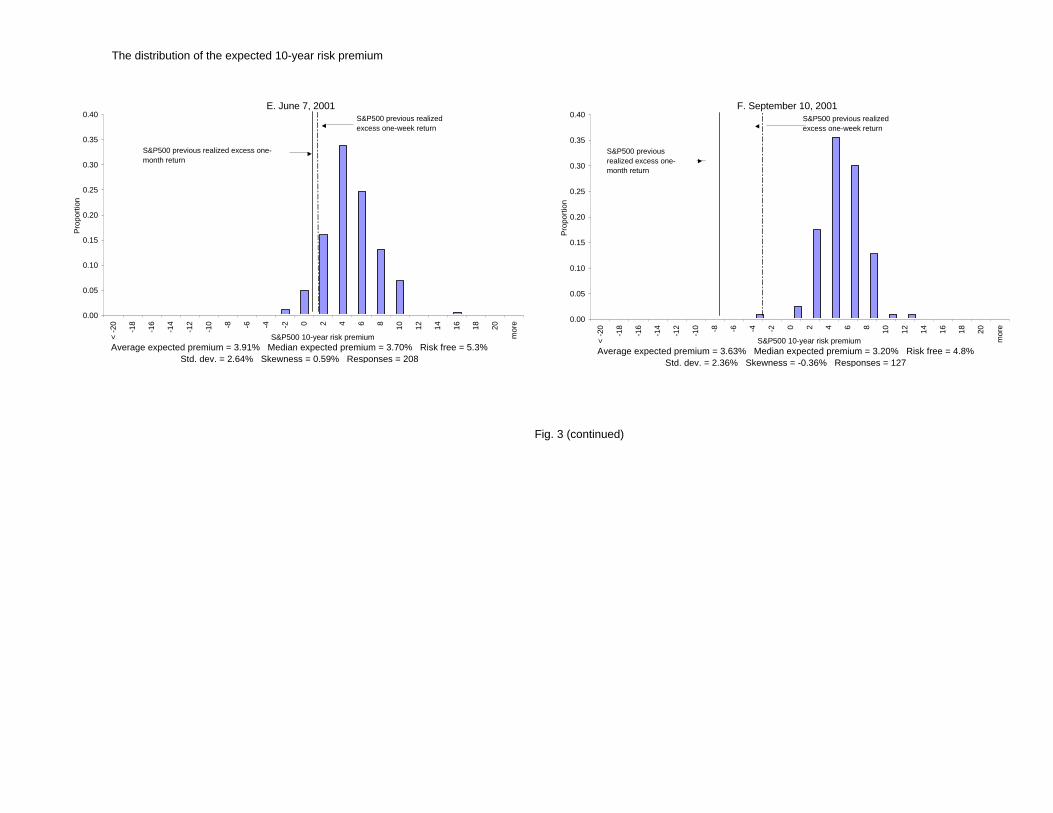
In Fig. 3, the 10-year risk premium is much more stable ranging from 3.6%
(September 10, 2001) to 4.7% (September 7, 2000). Even after the large negative
returns in the first quarter of 2001, the survey for the March 12, 2001 shows a
4.5% risk premium.
1 Later in our analysis, using the non-CFO Symposium data, we test whether headquarters locationexplains variation in the risk premium across respondents. We find no evidence of a headquarterseffect which provides another justification for integrating the CFO Symposium into our results.
Expectations of Equity Risk Premia 8
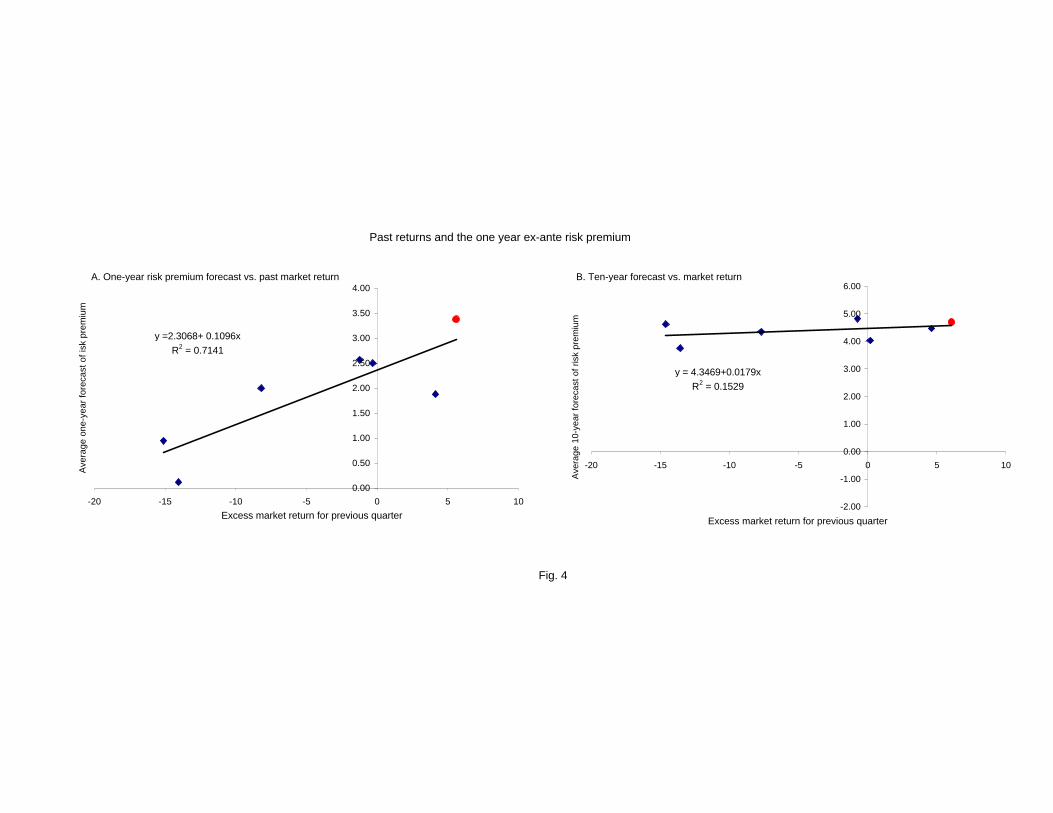
Fig. 4 examines whether the past quarter's market performance affects the
average one-year and ten-year risk premium.2 In panel A of Fig. 4, there is a
significant relation between the average risk premium and the previous quarter's
return. Note that the data for the North Carolina CFO survey is presented with a
different symbol, a circle. The results of this survey do not appear unusual. Panel
B shows that there is no obvious relation between recent quarterly returns and the
10-year risk premium. While CFOs’ assessments of the one-year risk premium
appear strongly influenced by recent returns, there is no impact on the 10-year
premium.3
Table 1 presents regressions that use all of the data (rather than the means of the
surveys which are presented in Fig. 4). We estimate weighted least squares
regressions where the weights are the inverse of each quarter’s variance.
Consistent with the graphical analysis, recent realized returns significantly impact
the respondents’ forecasts of the one-year premium.4 There is an insignificant
relation between the previous return and the 10-year premium. Our one-year
results might be capturing an expectational momentum effect. Momentum occurs
when future returns are related to past returns. We find that expected future
returns are related to past returns.
3.2 Volatility and disagreement
We use Davidson and Cooper’s (1976) method to recover the probability
distribution:
Variance = ([x(0.90)-x(0.10)]/2.65)2
2 We also examined the past month. The results are broadly similar and are available on request.3 Given that we know the day that the survey was returned, we also investigate whether the past
day’s return affects the forecasted risk premium. We find evidence that the past day’s return hasan impact on the one-year forecast and little impact on the 10-year forecast. These results areavailable on request.
Expectations of Equity Risk Premia 9
where x(0.90) and x(0.10) represent the 90th and 10th percentile of the
respondent’s distribution. Keefer and Bodily (1983) show that this simple
approximation is the preferred method of estimating the variance of a probability
distribution of random variables, given information about the 10th and 90th
percentiles. Note that this method allows us to estimate the market variance for
each individual survey response.
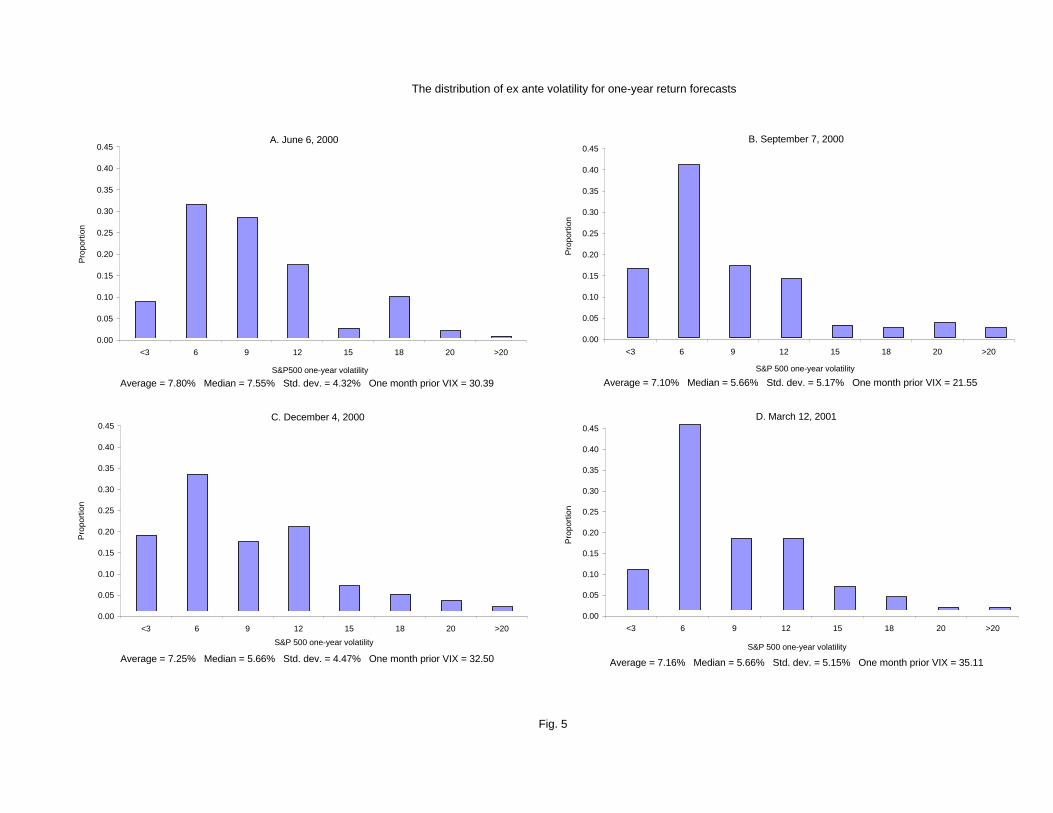
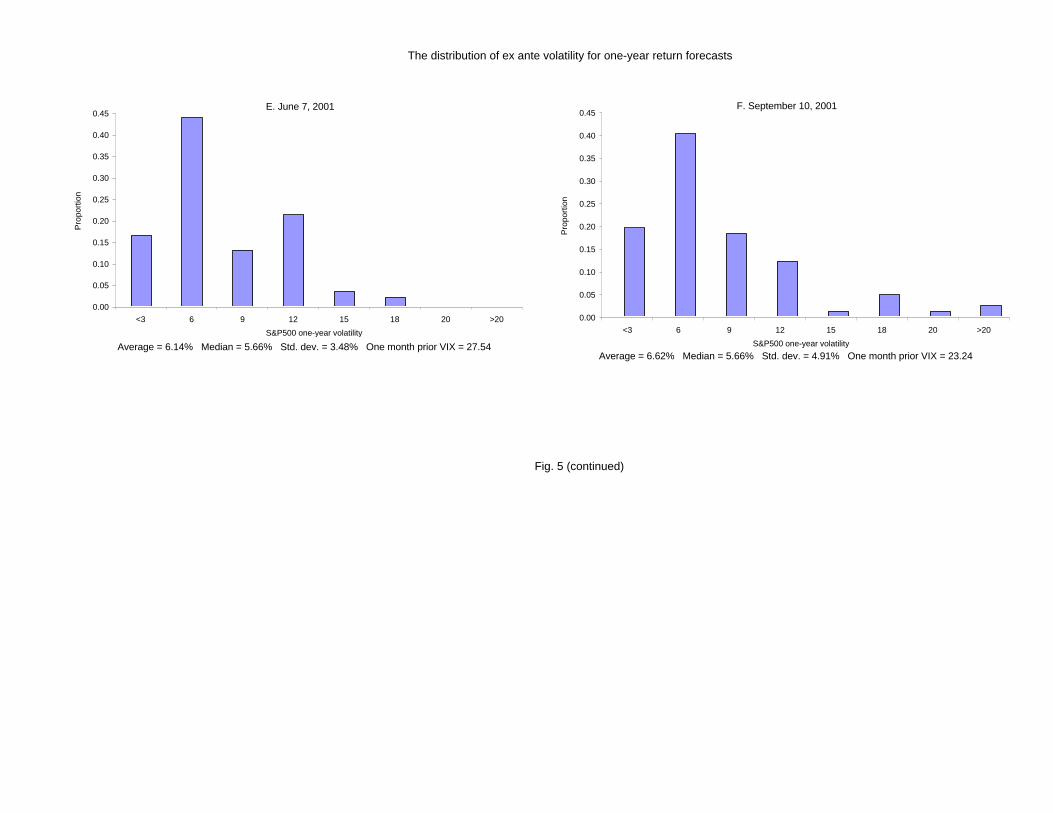
The distribution of the individual volatilities is presented in Fig. 5. In all cases,
the mean volatility is less than seven percent on an annual basis. This is sharply
lower than other benchmark measures of volatility, such as the implied volatility
on S&P100 index options (VIX). During this time period, the VIX trades between
21 and 35%. However, the VIX roughly measures the standard deviation of daily
returns over the next month whereas we are looking for a longer-term volatility.
But even if we examine the historical standard deviation of one-year returns
(13.0% 1980-2000; 20.1% 1926-2000), the difference between this benchmark
and the individual responses suggests that there is a large gap between the
individual and market’s assessments of volatility. Because the CFO’s distributions
are very tight, another interpretation is that the CFOs are very confident in their
risk premium assessments.
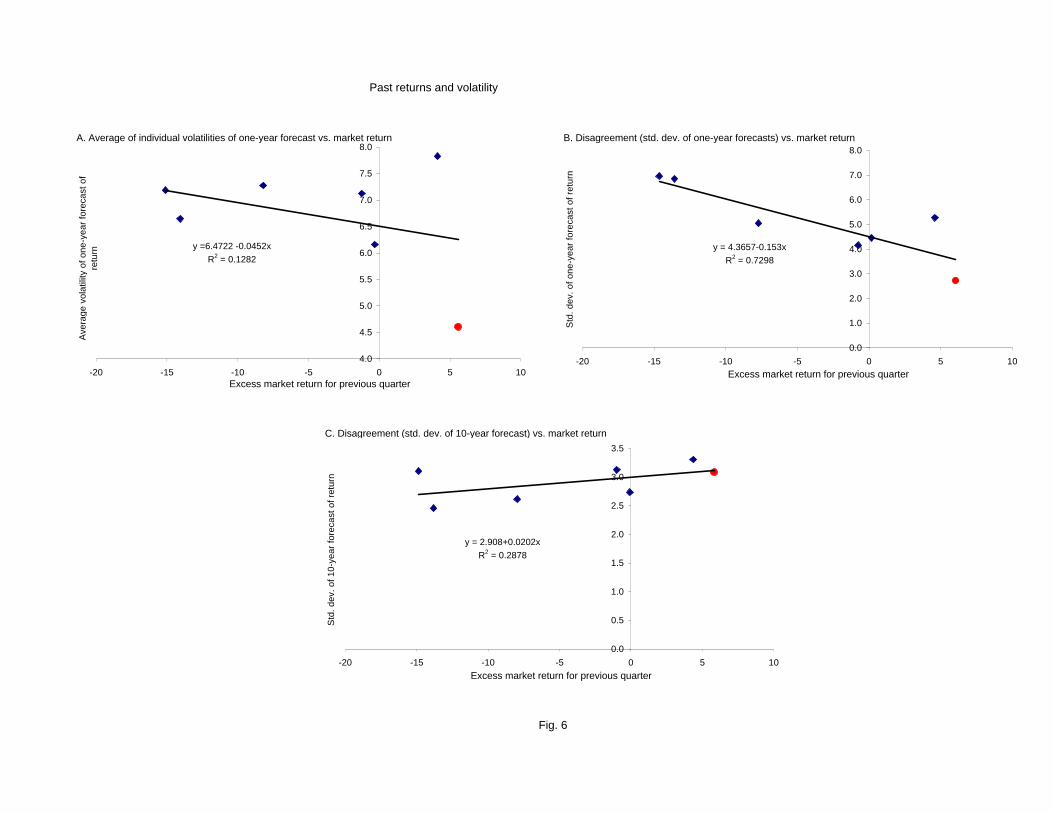
While many studies have econometrically documented a relation between the
past returns and volatility, to the best of our knowledge is the first research to
examine the relation in the context of survey evidence. Panel A of Fig. 6 shows a
somewhat negative relation between the average of the individual ex ante
volatilities and the previous quarter's return. However, the regression evidence in
4 This is also consistent with Welch (2001) who shows in a survey of economists that the meanone-year premium in 1998 was 5.8% (near the peak of the stock market) and only 3.4% in 2001(after a sizable retreat in the market).
Expectations of Equity Risk Premia 10
Table 2 that uses all the observations5 is much weaker. The slope coefficient is
not significantly different from zero.
Importantly, market volatility is not the average of individual volatilities. To
see this, consider the extreme situation in which everybody has highly confident
forecasts (low individual volatility) but considerable disagreement exists across
individuals (high cross-sectional dispersion in the risk premium forecasts).6
Panel B of Fig. 6 explores this second component of market volatility -- the
notion of disagreement. The evidence suggests a sharp negative relation between
disagreement and recent returns. That is, large negative returns are associated
with a lot of disagreement. The effect is robust to using the previous month
instead of the previous quarter's return (unreported).
The final panel in Fig. 6 examines disagreement over the 10-year risk premium
and past returns. With this longer horizon forecast, there is not a strong relation
between disagreement and past returns.
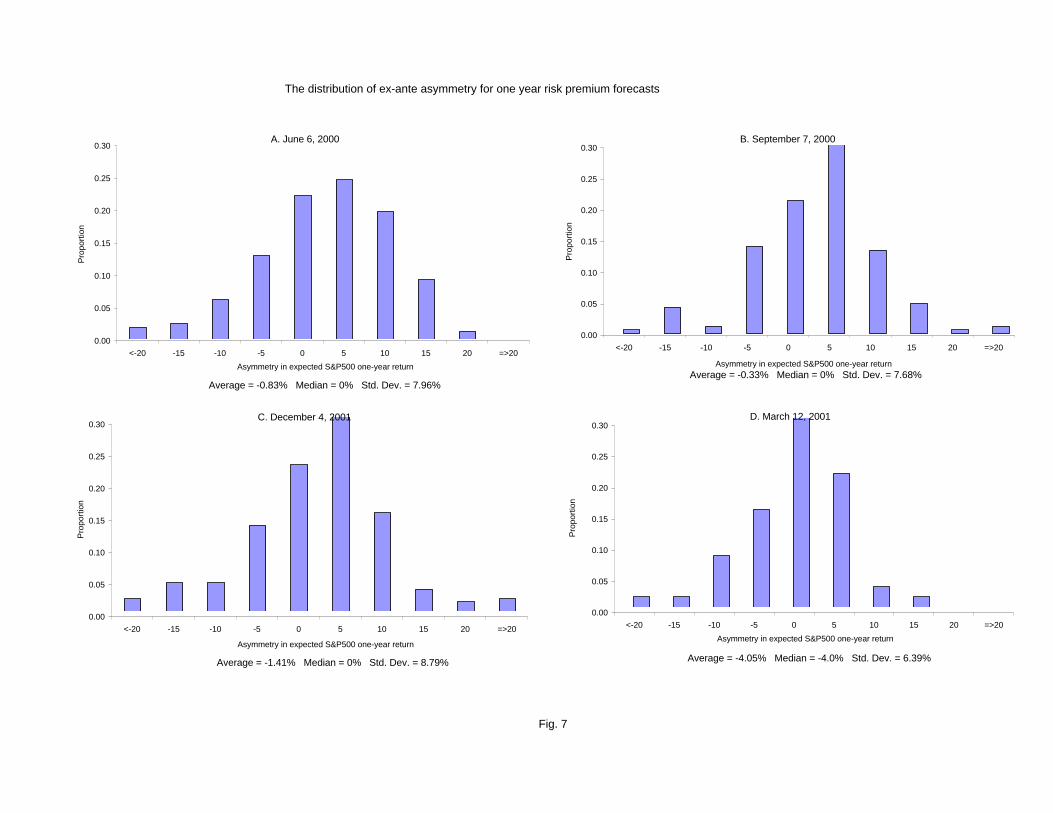
3.3 Asymmetry in distributions
The survey also captures information on skewness in the individual
distributions, which we call asymmetry. We employ a simple metric of
asymmetry. We look at the difference between each individual’s 90% tail and the
mean forecast and the mean minus the 10% tail. Hence, if the respondent's
forecast of the risk premium is 6% and the tails are -8% and +11%, then the
distribution is negatively skewed with a value of -9%.
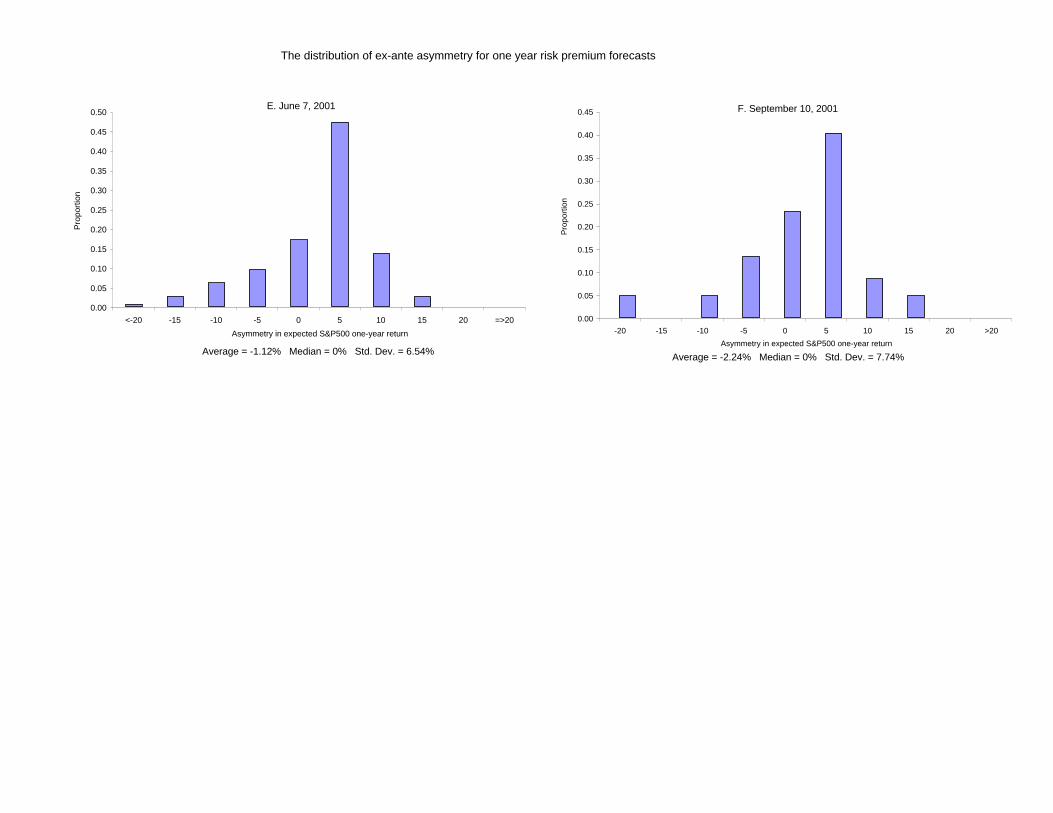
Fig. 7 presents histograms of this asymmetry measure for the quarterly surveys.
There is substantial asymmetry in the expectations of the risk premium. Indeed, 5 There are fewer observations in Tables 2 and 3 than Table 1 because a number of respondentsdid not fill in the range questions.
Expectations of Equity Risk Premia 11
asymmetric distributions are the rule not the exception. The average asymmetry is
generally positive (e.g., panels A, B, C and D). The ex ante asymmetry is quite
negative in both the March 12, 2001 and the September 10, 2001 surveys. These
are the quarters where the previous three months’ stock market returns are very
negative.
Fig. 7 suggests a relation between recent return performance and expected
asymmetry in the returns distribution. Fig. 8 combines the information from all
the surveys and finds a strong positive relation between recent returns and
asymmetry. Large negative returns are associated with negative asymmetry in the
respondents’ distribution of the ex ante risk premium.
Table 3 confirms the highly significant positive relation. Both the lagged one-
month and one-quarter returns significantly positively influence the measure of
asymmetry. All the coefficients are more than four standard errors from zero.
3.4 The relation between expected returns and volatility
Our results offer some new insights on the modeling of volatility. We have
already demonstrated that low or negative realized returns are associated with
higher expected volatility and more negative asymmetry in the ex ante returns
distributions. This is consistent with the statistical evidence of asymmetry in
GARCH modeling (e.g., Nelson (1992) and Glosten, Jagannathan and Runkle
(1994)). The statistical evidence usually relies on the leverage hypothesis of Black
(1976) and Christie (1982). We refer to this work as statistical evidence because
the volatility is measured statistically from past returns data.7 We offer
corroboration by linking past returns to a survey-based ex ante measure of
volatility.
6 The variance of returns is the sum of the average of the forecasters’ variances and the variance ofthe forecasters’ means. In terms of conditional expectations, Var[r]= E[Var(r|Z)] + Var(E[r|Z)],where r represents returns and Z is the conditioning information that forecasters use.
Expectations of Equity Risk Premia 12
Given that we have new measures of expected (rather than realized) returns and
the ex ante volatility, we can say something about the link between expected
returns to expected risk – a fundamental component of asset pricing theory.
Indeed, there is a considerable research on this topic which exclusively relies on
statistical measures of both the mean and volatility based on historical data.
However, the literature is evenly split on whether there is a positive relation or a
negative relation between the mean and volatility.
For example, using a GARCH framework, French, Schwert and Stambaugh
(1987) and Campbell and Hentshel (1992) estimate a positive relation while
Campbell (1987), Breen, Glosten, and Jagannathan (1989), Nelson (1991) and
Glosten, Jagannathan and Runkle (1993) find a negative relation between the
realized mean and volatility. Harrison and Zhang (1999) use a semi-
nonparametric method and find a positive relation. Brandt and Kang (2001) use a
latent VAR technique and document a strong negative correlation. Harvey (2001)
uses a combination of nonparametric density estimation and GARCH models and
finds that the relation depends on the instrumental variables chosen. Both Harvey
(2001) and Brandt and Kang (2001) document a distinct counter-cyclical variation
in the ratio of mean to volatility.
While our sample is limited in size, we are able to document the relation
between a survey-based ex-ante mean and volatility over our surveys. Fig. 9
presents the evidence for three different measures of volatility: the average the
respondents’ volatilities, disagreement (standard deviation of risk premium
forecasts) and a combined measure. The combined measure considers the
variation in the location of the individual distributions in addition to considering
7 Figlewski and Wang (2001) re-examine the leverage effect using options implied volatility as
an alternative to volatility estimated from past returns.
Expectations of Equity Risk Premia 13
the volatility of each distribution (aggregate volatility is the mean of the variances
plus the variance of the means).8
There is a mildly negative relation between the one-year mean and the average
volatility in panel A of Fig. 9. In comparison, there is a sharp negative relation
between the one-year mean and disagreement in panel B. While R-squares with so
few data points can be misleading, the fit here is extraordinary, 93%. The
combined measure of volatility also shows a very strong negative relation (panel
C in Fig. 9).
Almost all of the past research focuses on short-horizon forecasts of the risk
premium and volatility. Our results link well to this past research. However, we
also offer some insights on longer-term forecasts. While we only have a measure
of disagreement for the one-year forecasts (we do not ask respondents about the
10th and 90th percentiles of the 10-year distribution and, therefore, cannot deduce
10-year volatility), our evidence suggests a strongly significant positive relation
between the mean and volatility (panel D). That is, the ex ante relation between
mean and volatility appears to be sensitive to the time horizon.
It is possible that the difference between the short-horizon and long-horizon
provides some resolution to the conflicting findings in the literature. It seems
reasonable that short-horizon expected returns could move around substantially
producing either a positive or negative expected returns. Longer horizon returns,
on the other hand, are more stable, as we document.
Pástor and Stambaugh have recently presented a Bayesian analysis of long-
horizon risk premia. They find that the risk premium in the 1990s is 4.8% which
is consistent with our results. However, a critical component of their analysis is
the tying of their prior to a positive relation between the premium and volatility. If
Pástor and Stambaugh instead chose a diffuse prior relation between volatility and
8 We appreciate the insights of Bob Winkler on this particular point.
Expectations of Equity Risk Premia 14
the premium, their estimate of the risk premium in June 1999 rises dramatically to
27.7%. The lower risk premium in the 1990s in the face of high ex post average
returns is a result of lower volatility in the market.9 Our results support the prior
they impose.
As a robustness check, we obtain data from the Federal Reserve Board of
Philadelphia’s Survey of Professional Forecasters. Once a year, the quarterly
survey asks a question about the respondent’s expected 10-year return on the S&P
500 index. The analysis of this relation is contained in panel E of Fig. 9. We
present the risk premium and disagreement for ten surveys beginning in 1992.
Consistent with panel D, there is a positive relation between the expected
premium and the expected volatility using these alternative data. There are also
differences. There is a much greater variation in disagreement and the risk
premium tends to be smaller in the Fed survey. However, these surveys were
obtained over a 10-year period where as panel D represents a shorter sample.
Nevertheless, the positive relation using long-horizon returns appears to be robust
to at least one additional survey.
3.5 Do firm characteristics impact expectations?
Our survey collects information on six firm characteristics: industry, revenue,
number of employees, headquarters location, ownership and percentage of sales
from foreign sources. It is possible that expectations of market-wide measures
like the risk premium might depend on firm characteristics. For example, we have
established that the one-year premium depends on past market returns. Is the
premium significantly different across the respondents’ industries? Given that a
9 Pastor and Stambaugh show the volatility is 12.8% in the 1990s compared to 17.0% in their
full sample.
Expectations of Equity Risk Premia 15
market-wide measure is being forecasted, our null hypothesis is that there are no
significant differences across firm characteristics.
In unreported results, we estimate six regression models (one for each of the
characteristics). We regress the risk premium on a series of indicator variables
representing fixed effects for each firm characteristic. We also include an
indicator variable for each survey date. In all six regressions, the coefficients on
the characteristic indicators are not significant at the usual levels of confidence.
As a result, we do not reject the null hypothesis that firms’ characteristics have no
impact on market-wide expectations.
3.6 The September 11, 2001 crisis
Our survey was faxed to CFOs at 8:00am on September 10, 2001. The results
in the tables and figures only include data through September 10. However, we
have responses that were returned after the crisis. Although the post-crisis sample
is small, it is interesting to examine the impact of what we consider a shock to
systematic risk because terrorism is undiversifiable in world markets.
Table 4 presents summary statistics for both the September 10 and the post-
September 11 sample. We exclude September 11 because some of the surveys we
received may have been completed the day before.
The first panel examines the one-year premium which decreases from 0.05% to
–0.70% even though both measures of volatility increase substantially. The
second panel shows a sharp increase in the 10-year premium from 3.63% to
4.82%. Consistent with the one-year analysis, the volatility increases. While these
differences are economically interesting, they are not significantly different
because of the small number of observations in the post-September 11 sample.
The differences between the one-year premium and the 10-year premium are
consistent with our other analysis. The responses to the one-year premium are
likely what the CFOs think will happen near-term in the market – not necessarily
Expectations of Equity Risk Premia 16
what they would require to make a capital investment. However, the 10-year
premium more likely represents both expected returns and required returns. In this
case, what appears to be a shock to systematic risk, has led to perceptions of
higher required returns in equity markets.
6. ConclusionsWhile surveys of the risk premium are not new, we provide a number of new
insights. First, we survey Chief Financial Officers of U.S. corporations and argue
that they are uniquely well suited to assess the risk premium given that they
routinely use this input in their capital allocation decisions. In addition, we are not
particularly concerned that the CFOs are biased in their assessment of the
premium – a concern that we have for surveys of financial analysts.
Our survey is designed to look at different horizons (one-year versus 10-year)
and, most importantly, to recover the distribution of the risk premium through
time. Our survey evidence finds that the one-year premium varies between 0.1
and 2.5% and the 10-year premium falls in the 3.6 to 4.7% range. We find that
recent past stock market performance has a large effect on the expected one-year
premium and only a small effect on the 10-year premium.
We find that past returns significantly impact volatility as well as the degree of
asymmetry in the respondents’ distributions. Indeed, we find convincing evidence
that recent low returns are associated with higher volatility and more negative
asymmetry (i.e., relatively large left tails in the distributions of the expected risk
premium). Our evidence supports the statistical evidence that negative return
shocks increase volatility.
We have also attempted to shed some light on the relation between the mean
and volatility. All previous research has relied on historic data to statistically
measure the mean and the variance and this research is split on whether there is a
positive relation or negative relation between reward and risk. Our evidence
Expectations of Equity Risk Premia 17
suggests that at the one-year horizon there is a negative relation between the mean
and the variance. This poses a challenge to asset pricing theory which implies a
positive tradeoff between risk and expected returns. However, at the 10-year
horizon, there is evidence of a significantly positive relation. As a robustness
experiment, we examine the relation between the ten-year risk premium and
dispersion from a Federal Reserve Bank of Philadelphia survey from 1992-2001
and confirm the positive relation between mean and volatility.
Finally, let us emphasize that our work is ongoing. While we have over 1,100
survey responses, much of the analysis presented relies on seven aggregated
observations. Indeed, this is the reason that we have mainly presented the data
graphically. By viewing these data, each reader can judge the influence of
particular observations. Our goal is to continue the survey and dynamically
augment this research as new results arrive.
References
Asness, C. S., 2000, Stocks vs. bonds: Explaining the equity risk premium, Financial AnalystsJourna,l May/June.
Black, F. and R. Litterman, 1990, Asset allocation: Combining investors’ views on marketequilibrium, Goldman Sachs Fixed Income Research, September.
Black, F. and R. Litterman, 1991, Global asset allocation with equities, bonds and currencies,Goldman Sachs Fixed Income Research, October.
Brandt, M. W. And Q. Kang, 2001, On the relation between the conditional mean and volatility ofstock returns: A latent VAR approach, Unpublished working paper, University ofPennsylvania, Philadelphia, PA.
Brav, A., and R. Lehavy, 2001, An empirical analysis of analysts’ target prices: Short-terminformativeness and long term dynamics, Unpublished working paper, Duke University.
Breen, W., L. R. Glosten and R. Jagannathan, 1989, Economic significance of predictablevariation in stock index returns, Journal of Finance 44, 1177-1189.
Campbell, J. Y. and L. Hentschel, 1992, No news is good news: An asymmetric model ofchanging volatility in stock returns, Journal of Financial Economics 31, 281-318.
Campbell, J. Y., 1987, Stock returns and the term structure, Journal of Financial Economics 18,373-400.
Chen, N.-f., R. Roll, and S. A. Ross, 1986. Economic forces and the stock market. Journal ofBusiness 59, 383-404.
Expectations of Equity Risk Premia 18
Claus, J. and J. Thomas, 2001, Equity premia as low as three percent: Evidence from analysts’earnings forecasts for domestic and international stock markets, Journal of Finance 56, 1629-1666.
Christie, A. A., 1982, The stochastic behavior of common stock variances: Value, leverage, andinterest rate effects, Journal of Financial Economics 10, 407-432.
Davidson, L. B., and D. O. Cooper, 1976, A simple way of developing a probability distribution ofpresent value, Journal of Petroleum Technology, September, 1069-1078.
Fama, E. F. and French, K. R., 1992. The cross-section of expected stock returns. Journal ofFinance 47, 427-465.
Fama, E. F. and French, K. R., 2001, The equity premium, Unpublished working paper, Universityof Chicago, Chicago, IL.
Ferson, W. E. and Harvey, C. R., 1991. The variation of economic risk premiums. Journal ofPolitical Economy 99, 285-315.
Ferson, W. E. and Harvey, C. R., 1993. The risk and predictability of international equity returns.Review of Financial Studies 6, 527-566.
Figlewski, S. and X. Wang, 2001, Is the 'leverage effect' a leverage effect?, Unpublished workingpaper, New York University, New York, NY.
French, K. R. and J. Poterba, 1991, Investor diversification and international equity markets,American Economic Review 81, 222-226.
French, K. R., G. W. Schwert and R. F. Stambaugh, 1987, Expected stock returns and volatility,Journal of Financial Economics 19, 3-30.
Fraser, P., 2001, How do U.S. and Japanese investors process information and how do they formtheir expectations of the future? Evidence from quantitative survey based data, Unpublishedworking paper, University of Aberdeen.
Gebhardt, W. R., C. M. C. Lee, and B. Swaminathan, 2000, Toward an implied cost of capital,Unpublished working paper, Cornell University, Ithaca, NY.
Giordani, P., and P. Soderlind, 2000, Inflation forecast uncertainty, Unpublished working paper,Stockholm School of Economics, Sweden.
Glosten, L. R., R. Jagannathan and D. Runkle, 1993, On the relation between the expected valueand the volatility of the nominal excess returns on stocks, Journal of Finance 48, 1779-1802.
Goyal, A. and I. Welch, 1999, Predicting the risk premium, Unpublished working paper,University of California at Los Angeles, Los Angeles, CA.
Graham, J. R., 1999b. Quarter 2, 1999 FEI Survey. http://www.duke.edu/~jgraham.Graham, J. R. and C. R. Harvey, 1996, Market timing ability and volatility implied in investment
newsletters' asset allocation recommendations, Journal of Financial Economics, 397-422.Graham, J. R. and C. R. Harvey, 2001, Theory and practice of corporate finance: Evidence from
the field, Journal of Financial Economics, 60, 187-243.Harris, R. S. and F. C. Marston, The market risk premium: Expectational estimates using analysts’
forecasts, Unpublished working paper, University of Virginia, Charlottesville, VAHarrison, P. and H. Zhang, 1999, An investigation of the risk and return relation at long horizon,
Review of Economics and Statistics 81, 399-408.Harvey, C. R., 2001, The specification of conditional expectations, Journal of Empirical Finance,
forthcoming.Heaton, J. and D. Lucas, 2000, Stock prices and fundamentals, in Ben S. Bernanke and Julio
Rotemberg, Eds., NBER Macroeconomics Annual 1999, The MIT Press.
Expectations of Equity Risk Premia 19
Heaton, J. B., 2000, Managerial optimism and corporate finance. Unpublished working paper,University of Chicago.
Ibbotson, R. G. and P. Chen, 2001, The supply of stock returns, Unpublished working paper, YaleUniversity.
Ibbotson Associates, 1998 Stocks, bonds, bills and inflation, 1998 yearbook, Chicago, IL.Jagannathan, R. and Meier, I., 2001, Do we need CAPM for capital budgeting? Unpublished
working paper, Northwestern University, Evanston, IL.Jagannathan, R. and Wang, Z., 1996. The conditional CAPM and the cross-section of expected
returns. Journal of Finance, 51, 3-53.Jagannathan, R., E. R. McGrattan and A. Scherbina, 2001, The declining U.S. equity premium,
Quarterly Review, Federal Reserve Bank of Mineapolis.Keefer, D. L. and S. E. Bodily, 1983, Three-point approximations for continuous random
variables, Management Science 29, 5 595-609.Lamont, O. Earnings and expected returns, Journal of Finance 53, 1563-1587.Lintner, J., 1965, The valuation of risky assets and the selection of risk investments in stock
portfolios and capital budgets, Review of Economics and Statistics 9, 1033-1059.Nelson, D. B., 1991, Conditional heteroskedasticity in asset returns: A new approach,
Econometrica 59, 347-370.Pástor, L. And R. Stambaugh, 2001, The equity premium and structural breaks, Journal of
Finance, 56, 1207-1239.Poterba, J. M. and Summers, L. H., 1995, A CEO sruvey of U.S. companies’ time horizons and
hurdle rates, Sloan Management Review, Fall, 43-53.Sharpe, W., 1964, Capital asset prices: A theory of market equilibrium under conditions of risk,
Journal of Finance 19, 425-442.Siegel, J. J., 1999, The shrinking equity premium, Journal of Portfolio Management, 10-17.Welch, I., 2000, Views of financial economists on the equity premium and other issues, Journal of
Business 73 (October): 501-37.Welch, I., 2001, The equity premium consensus forecast revisited, Unpublished working paper,
Cowles Foundation for Research in Economics, Yale University, New Haven, CT.
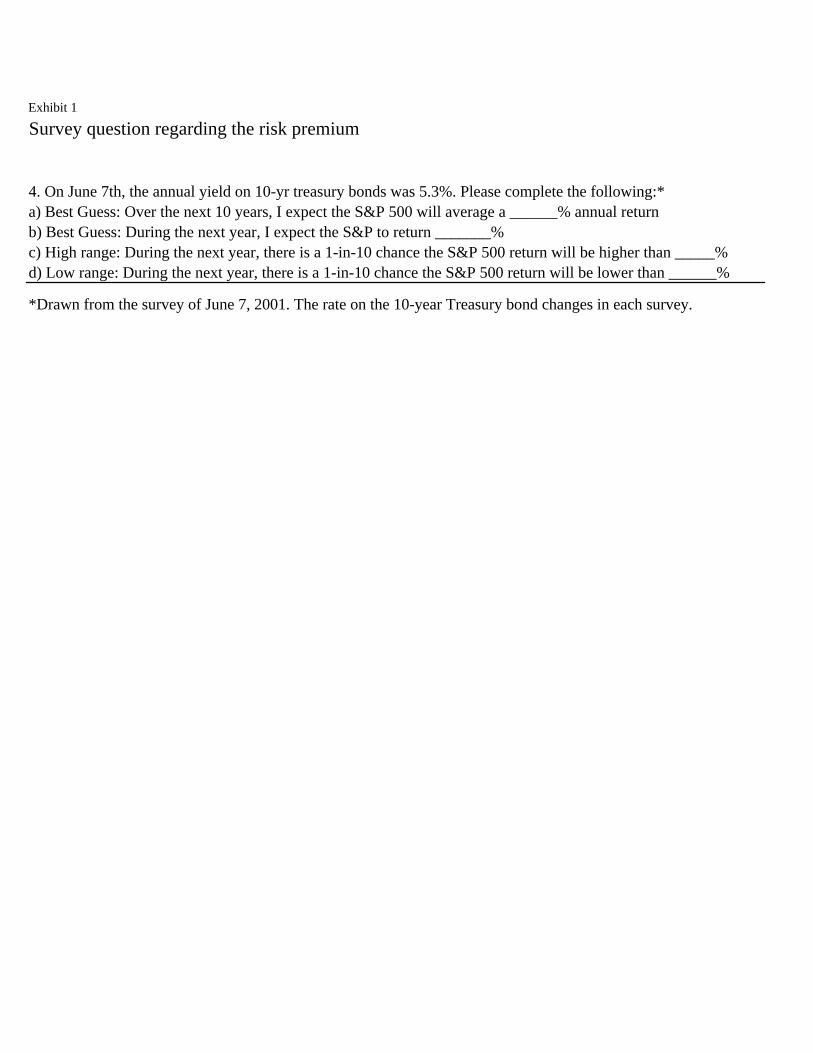
Exhibit 1
Survey question regarding the risk premium
4. On June 7th, the annual yield on 10-yr treasury bonds was 5.3%. Please complete the following:*a) Best Guess: Over the next 10 years, I expect the S&P 500 will average a ______% annual returnb) Best Guess: During the next year, I expect the S&P to return _______%c) High range: During the next year, there is a 1-in-10 chance the S&P 500 return will be higher than _____%d) Low range: During the next year, there is a 1-in-10 chance the S&P 500 return will be lower than ______%
*Drawn from the survey of June 7, 2001. The rate on the 10-year Treasury bond changes in each survey.
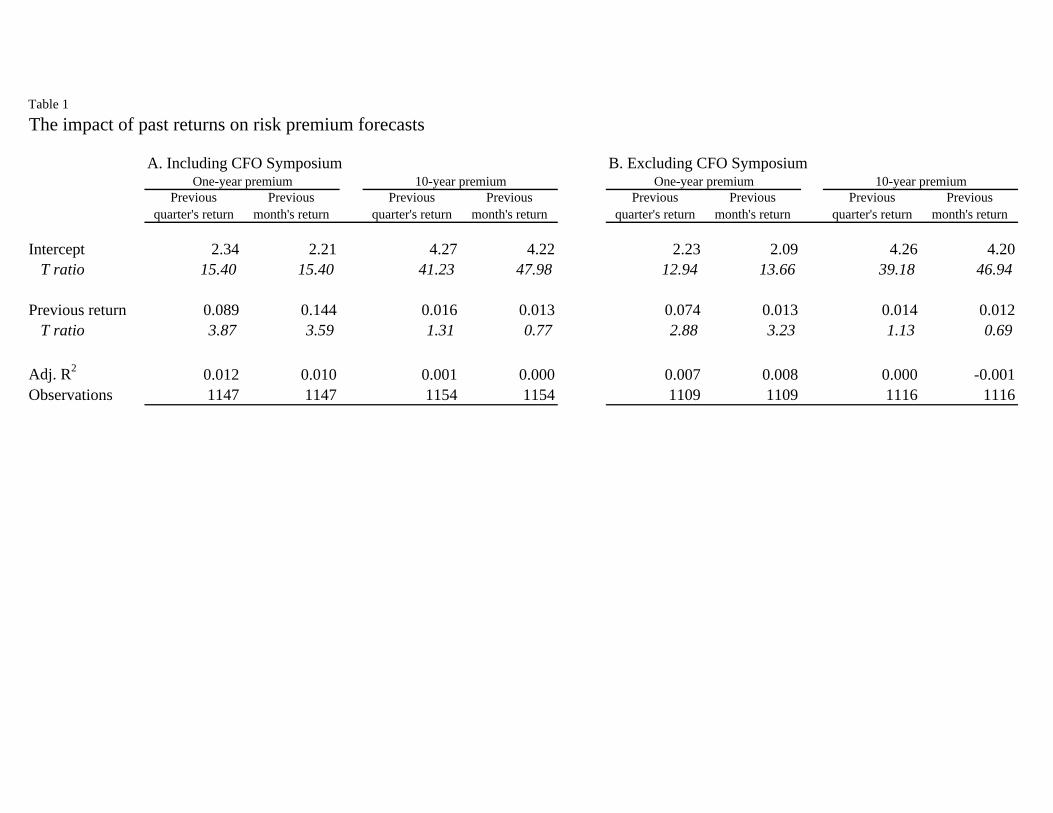
Table 1
The impact of past returns on risk premium forecasts
A. Including CFO Symposium B. Excluding CFO Symposium
Previous quarter's return
Previous month's return
Previous quarter's return
Previous month's return
Previous quarter's return
Previous month's return
Previous quarter's return
Previous month's return
Intercept 2.34 2.21 4.27 4.22 2.23 2.09 4.26 4.20 T ratio 15.40 15.40 41.23 47.98 12.94 13.66 39.18 46.94
Previous return 0.089 0.144 0.016 0.013 0.074 0.013 0.014 0.012 T ratio 3.87 3.59 1.31 0.77 2.88 3.23 1.13 0.69
Adj. R2 0.012 0.010 0.001 0.000 0.007 0.008 0.000 -0.001Observations 1147 1147 1154 1154 1109 1109 1116 1116
One-year premium 10-year premium One-year premium 10-year premium
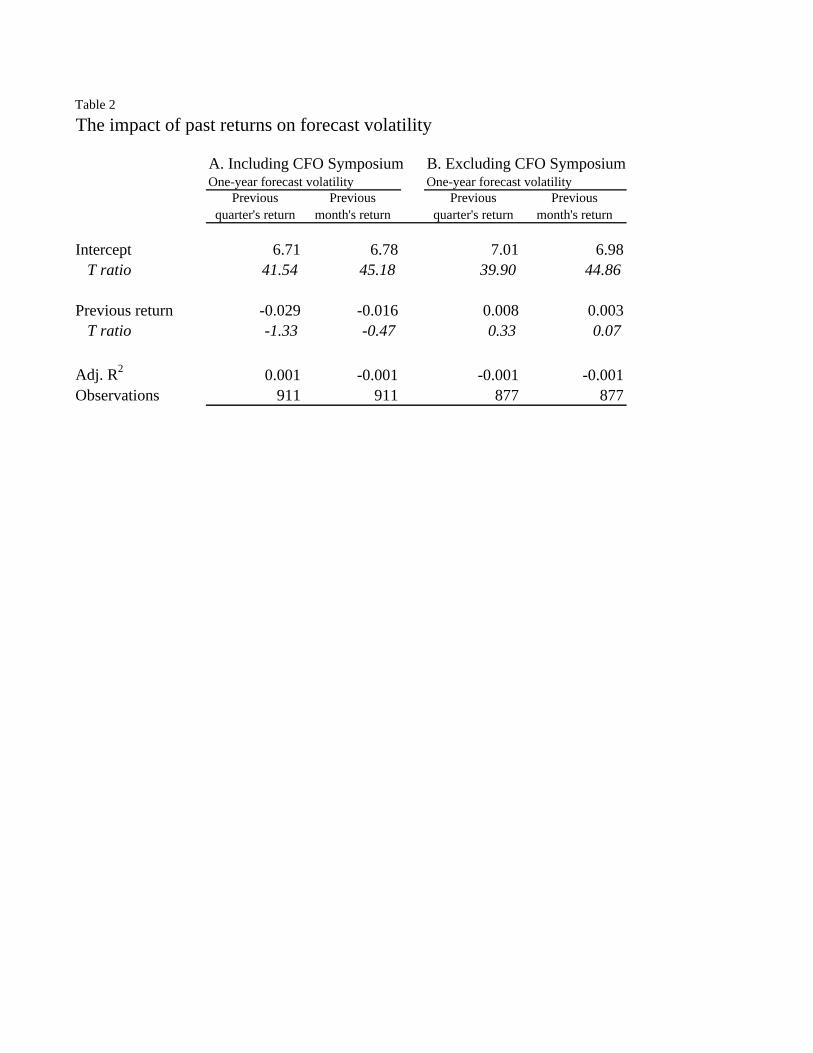
Table 2
The impact of past returns on forecast volatility
A. Including CFO Symposium B. Excluding CFO SymposiumOne-year forecast volatility One-year forecast volatility
Previous quarter's return
Previous month's return
Previous quarter's return
Previous month's return
Intercept 6.71 6.78 7.01 6.98 T ratio 41.54 45.18 39.90 44.86
Previous return -0.029 -0.016 0.008 0.003 T ratio -1.33 -0.47 0.33 0.07
Adj. R2 0.001 -0.001 -0.001 -0.001Observations 911 911 877 877
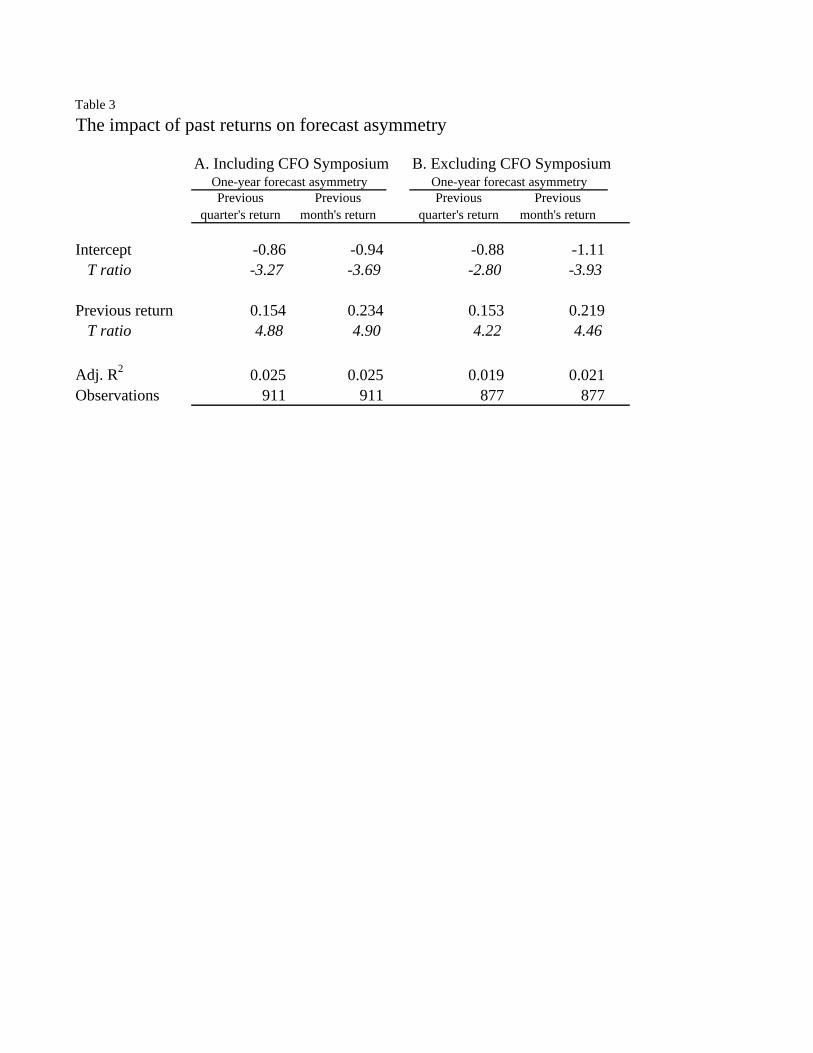
Table 3
The impact of past returns on forecast asymmetry
A. Including CFO Symposium B. Excluding CFO Symposium
Previous quarter's return
Previous month's return
Previous quarter's return
Previous month's return
Intercept -0.86 -0.94 -0.88 -1.11 T ratio -3.27 -3.69 -2.80 -3.93
Previous return 0.154 0.234 0.153 0.219 T ratio 4.88 4.90 4.22 4.46
Adj. R2 0.025 0.025 0.019 0.021Observations 911 911 877 877
One-year forecast asymmetry One-year forecast asymmetry
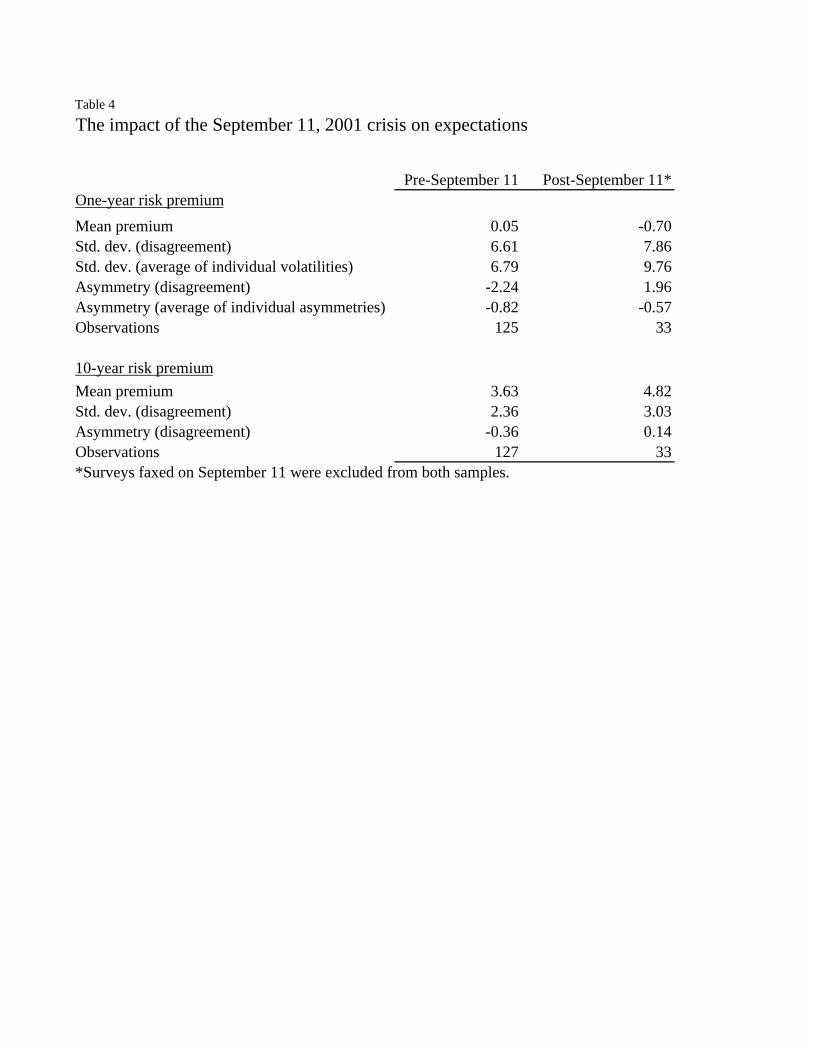
Table 4
The impact of the September 11, 2001 crisis on expectations
Pre-September 11 Post-September 11*One-year risk premium
Mean premium 0.05 -0.70Std. dev. (disagreement) 6.61 7.86Std. dev. (average of individual volatilities) 6.79 9.76Asymmetry (disagreement) -2.24 1.96Asymmetry (average of individual asymmetries) -0.82 -0.57Observations 125 33
10-year risk premiumMean premium 3.63 4.82Std. dev. (disagreement) 2.36 3.03Asymmetry (disagreement) -0.36 0.14Observations 127 33*Surveys faxed on September 11 were excluded from both samples.
The characteristics of the survey respondents' firms
Fig. 1
A. Industry
0%
15%
30%
45%
Retail/Wholesale
Mining/Construct
Manufacturing Transport/Energy
Commu./Media
Tech(Software/ Bio
Tech)
Banking/Finance/
Insurance
Other
B. Revenue ($ million)
0%
10%
20%
30%
40%
< 24 25-99 100-499 500-999 1000-4900 > 5000
C. Employment
0%
20%
40%
< 100 100-499 500-999 1000-2499 2500-4999 5000-9999 > 10000
The distribution of the expected one-year risk premium
Fig. 2
A. June 6, 2000
0.00
0.05
0.10
0.15
0.20
0.25
0.30
< -2
0
-18
-16
-14
-12
-10 -8 -6 -4 -2 0 2 4 6 8 10 12 14 16 18 20
mor
e
S&P500 one-year risk premium
Pro
port
ion
Average expected premium = 1.81% Median expected premium = 1.76% Risk free = 6.24% Std. dev. = 5.22% Skewness = 0.33% Responses = 209
S&P500 previous realized excess one-month returnS&P500 previous realized
excess one-week return
D. March 12, 2001
0.00
0.05
0.10
0.15
0.20
0.25
0.30
< -2
0
-18
-16
-14
-12
-10 -8 -6 -4 -2 0 2 4 6 8 10 12 14 16 18 20
mor
e
S&P500 one-year risk premium
Pro
port
ion
Average expected premium = 0.88% Median expected premium= 0.57% Risk free =4.43% Std. dev. = 6.91% Skewness = -0.36% Responses = 138
S&P500 previous realized excess one-week return
S&P500 previous realized excess one-month return
C. December 4, 2000
0.00
0.05
0.10
0.15
0.20
0.25
0.30
< -2
0
-18
-16
-14
-12
-10 -8 -6 -4 -2 0 2 4 6 8 10 12 14 16 18 20
mor
e
S&P500 one-year risk premium
Pro
port
ion
Average expected premium = 1.93% Median expected premium = 2.12% Risk free = 5.88% Std. dev. = 4.99% Skewness = -1.44% Responses = 244
S&P500 previous realized excess one-week return
S&P500 previous realized excess one-month return
B. September 7, 2000
0.00
0.05
0.10
0.15
0.20
0.25
0.30
0.35
< -2
0
-18
-16
-14
-12
-10 -8 -6 -4 -2 0 2 4 6 8 10 12 14 16 18 20
mor
e
S&P500 one-year risk premium
Pro
port
ion
Average expected premium = 2.5% Median expected premium = 3.28% Risk free = 6.22% Std. dev. = 4.10% Skewness = -1.42% Responses = 188
S&P500 previous realized excess one-week return
S&P500 previous realized excess one-month return
The distribution of the expected one-year risk premium
Fig. 2 (continued)
E. June 7, 2001
0.00
0.05
0.10
0.15
0.20
0.25
0.30<
-20
-18
-16
-14
-12
-10 -8 -6 -4 -2 0 2 4 6 8 10 12 14 16 18 20
mor
e
S&P500 one-year risk premium
Pro
port
ion
Average expected premium = 2.43% Median expected premium = 1.37% Risk free = 3.63% Std. dev. = 4.40% Skewness = 0.98% Responses = 205
S&P500 previous realized excess one-week return
S&P500 previous realized excess one-month return
F. September 10, 2001
0.00
0.05
0.10
0.15
0.20
0.25
0.30
< -2
0
-18
-16
-14
-12
-10 -8 -6 -4 -2 0 2 4 6 8 10 12 14 16 18 20
mor
e
S&P500 one-year risk premium
Pro
port
ion
Average expected premium = 0.05% Median expected premium = 0.69% Risk free = 3.31% Std. dev. = 6.79% Skewness = -0.82% Responses = 125
S&P500 previous realized excess one-week return
S&P500 previous realized excess one-month return
The distribution of the expected 10-year risk premium
Fig. 3
B. September 7, 2000
0.00
0.05
0.10
0.15
0.20
0.25
0.30
0.35
0.40
< -2
0
-18
-16
-14
-12
-10 -8 -6 -4 -2 0 2 4 6 8 10 12 14 16 18 20
mor
e
S&P 500 10-year risk premium
Pro
port
ion
Average expected premium = 4.70% Median expected premium = 4.3% Risk free = 5.7% Std. dev. = 3.03% Skewness = 0.84% Responses = 188
S&P500 previous realized excess one-week return
S&P500 previous realized excess one-month return
C. December 4, 2000
0.00
0.05
0.10
0.15
0.20
0.25
0.30
0.35
0.40
< -2
0
-18
-16
-14
-12
-10 -8 -6 -4 -2 0 2 4 6 8 10 12 14 16 18 20
mor
e
S&P 500 10-year risk premium
Pro
port
ion
Average expected premium = 4.22% Median expected premium= 4.5% Risk free = 5.5% Std. dev. = 2.52% Skewness = 0.53% Responses = 243
S&P500 previous realized excess one-week return
S&P500 previous realized excess one-month return
D. March 12, 2001
0.00
0.05
0.10
0.15
0.20
0.25
0.30
0.35
0.40
< -2
0
-18
-16
-14
-12
-10 -8 -6 -4 -2 0 2 4 6 8 10 12 14 16 18 20
mor
e
S&P 500 10-year risk premium
Pro
port
ion
Average expected premium = 4.5% Median expected premium = 4.1% Risk free = 4.9% Std. dev. = 3.01% Skewness = 0.55% Responses = 141
S&P500 previous realized excess one-week return
S&P500 previous realized excess one-month return
A. June 6, 2000
0.00
0.05
0.10
0.15
0.20
0.25
0.30
0.35
0.40
< -2
0
-18
-16
-14
-12
-10 -8 -6 -4 -2 0 2 4 6 8 10 12 14 16 18 20
mor
e
S&P500 10-year risk premium
Pro
port
ion
Average expected premium = 4.35% Median expected premium = 3.90% Risk free = 6.1% Std. dev. = 3.21% Skewness = 0.96% Responses = 209
S&P500 previous realized excess one-week return
S&P500 previous realized excess one-month return
The distribution of the expected 10-year risk premium
Fig. 3 (continued)
E. June 7, 2001
0.00
0.05
0.10
0.15
0.20
0.25
0.30
0.35
0.40<
-20
-18
-16
-14
-12
-10 -8 -6 -4 -2 0 2 4 6 8 10 12 14 16 18 20
mor
e
S&P500 10-year risk premium
Pro
port
ion
Average expected premium = 3.91% Median expected premium = 3.70% Risk free = 5.3% Std. dev. = 2.64% Skewness = 0.59% Responses = 208
S&P500 previous realized excess one-week return
S&P500 previous realized excess one-month return
F. September 10, 2001
0.00
0.05
0.10
0.15
0.20
0.25
0.30
0.35
0.40
< -2
0
-18
-16
-14
-12
-10 -8 -6 -4 -2 0 2 4 6 8 10 12 14 16 18 20
mor
e
S&P500 10-year risk premium
Pro
port
ion
Average expected premium = 3.63% Median expected premium = 3.20% Risk free = 4.8% Std. dev. = 2.36% Skewness = -0.36% Responses = 127
S&P500 previous realized excess one-week return
S&P500 previous realized excess one-month return
Past returns and the one year ex-ante risk premium
Fig. 4
A. One-year risk premium forecast vs. past market return
y =2.3068+ 0.1096x R2 = 0.7141
0.00
0.50
1.00
1.50
2.00
2.50
3.00
3.50
4.00
-20 -15 -10 -5 0 5 10
Ave
rage
one
-yea
r fo
reca
st o
f isk
pre
miu
m
Excess market return for previous quarter
B. Ten-year forecast vs. market return
y = 4.3469+0.0179x R2 = 0.1529
-2.00
-1.00
0.00
1.00
2.00
3.00
4.00
5.00
6.00
-20 -15 -10 -5 0 5 10
Excess market return for previous quarter
Ave
rage
10-
year
fore
cast
of r
isk
prem
ium
The distribution of ex ante volatility for one-year return forecasts
Fig. 5
A. June 6, 2000
0.00
0.05
0.10
0.15
0.20
0.25
0.30
0.35
0.40
0.45
<3 6 9 12 15 18 20 >20
S&P500 one-year volatility
Pro
port
ion
Average = 7.80% Median = 7.55% Std. dev. = 4.32% One month prior VIX = 30.39
B. September 7, 2000
0.00
0.05
0.10
0.15
0.20
0.25
0.30
0.35
0.40
0.45
<3 6 9 12 15 18 20 >20
S&P 500 one-year volatility
Pro
port
ion
Average = 7.10% Median = 5.66% Std. dev. = 5.17% One month prior VIX = 21.55
C. December 4, 2000
0.00
0.05
0.10
0.15
0.20
0.25
0.30
0.35
0.40
0.45
<3 6 9 12 15 18 20 >20
S&P 500 one-year volatility
Pro
port
ion
Average = 7.25% Median = 5.66% Std. dev. = 4.47% One month prior VIX = 32.50
D. March 12, 2001
0.00
0.05
0.10
0.15
0.20
0.25
0.30
0.35
0.40
0.45
<3 6 9 12 15 18 20 >20
S&P 500 one-year volatility
Pro
port
ion
Average = 7.16% Median = 5.66% Std. dev. = 5.15% One month prior VIX = 35.11
The distribution of ex ante volatility for one-year return forecasts
Fig. 5 (continued)
E. June 7, 2001
0.00
0.05
0.10
0.15
0.20
0.25
0.30
0.35
0.40
0.45
<3 6 9 12 15 18 20 >20
S&P500 one-year volatility
Pro
port
ion
Average = 6.14% Median = 5.66% Std. dev. = 3.48% One month prior VIX = 27.54
F. September 10, 2001
0.00
0.05
0.10
0.15
0.20
0.25
0.30
0.35
0.40
0.45
<3 6 9 12 15 18 20 >20
S&P500 one-year volatility
Pro
port
ion
Average = 6.62% Median = 5.66% Std. dev. = 4.91% One month prior VIX = 23.24
Past returns and volatility
Fig. 6
A. Average of individual volatilities of one-year forecast vs. market return
y =6.4722 -0.0452x R2 = 0.1282
4.0
4.5
5.0
5.5
6.0
6.5
7.0
7.5
8.0
-20 -15 -10 -5 0 5 10Excess market return for previous quarter
Ave
rage
vol
atili
ty o
f one
-yea
r fo
reca
st o
f re
turn
B. Disagreement (std. dev. of one-year forecasts) vs. market return
y = 4.3657-0.153x R2 = 0.7298
0.0
1.0
2.0
3.0
4.0
5.0
6.0
7.0
8.0
-20 -15 -10 -5 0 5 10Excess market return for previous quarter
Std
. dev
. of o
ne-y
ear
fore
cast
of r
etur
n
C. Disagreement (std. dev. of 10-year forecast) vs. market return
y = 2.908+0.0202x R2 = 0.2878
0.0
0.5
1.0
1.5
2.0
2.5
3.0
3.5
-20 -15 -10 -5 0 5 10Excess market return for previous quarter
Std
. dev
. of 1
0-ye
ar fo
reca
st o
f ret
urn
The distribution of ex-ante asymmetry for one year risk premium forecasts
Fig. 7
B. September 7, 2000
0.00
0.05
0.10
0.15
0.20
0.25
0.30
<-20 -15 -10 -5 0 5 10 15 20 =>20
Asymmetry in expected S&P500 one-year return
Pro
port
ion
Average = -0.33% Median = 0% Std. Dev. = 7.68%
A. June 6, 2000
0.00
0.05
0.10
0.15
0.20
0.25
0.30
<-20 -15 -10 -5 0 5 10 15 20 =>20
Asymmetry in expected S&P500 one-year return
Pro
port
ion
Average = -0.83% Median = 0% Std. Dev. = 7.96%
C. December 4, 2001
0.00
0.05
0.10
0.15
0.20
0.25
0.30
<-20 -15 -10 -5 0 5 10 15 20 =>20
Asymmetry in expected S&P500 one-year return
Pro
port
ion
Average = -1.41% Median = 0% Std. Dev. = 8.79%
D. March 12, 2001
0.00
0.05
0.10
0.15
0.20
0.25
0.30
<-20 -15 -10 -5 0 5 10 15 20 =>20
Asymmetry in expected S&P500 one-year return
Pro
port
ion
Average = -4.05% Median = -4.0% Std. Dev. = 6.39%
The distribution of ex-ante asymmetry for one year risk premium forecasts
E. June 7, 2001
0.00
0.05
0.10
0.15
0.20
0.25
0.30
0.35
0.40
0.45
0.50
<-20 -15 -10 -5 0 5 10 15 20 =>20
Asymmetry in expected S&P500 one-year return
Pro
port
ion
Average = -1.12% Median = 0% Std. Dev. = 6.54%
F. September 10, 2001
0.00
0.05
0.10
0.15
0.20
0.25
0.30
0.35
0.40
0.45
-20 -15 -10 -5 0 5 10 15 20 >20
Asymmetry in expected S&P500 one-year return
Pro
port
ion
Average = -2.24% Median = 0% Std. Dev. = 7.74%
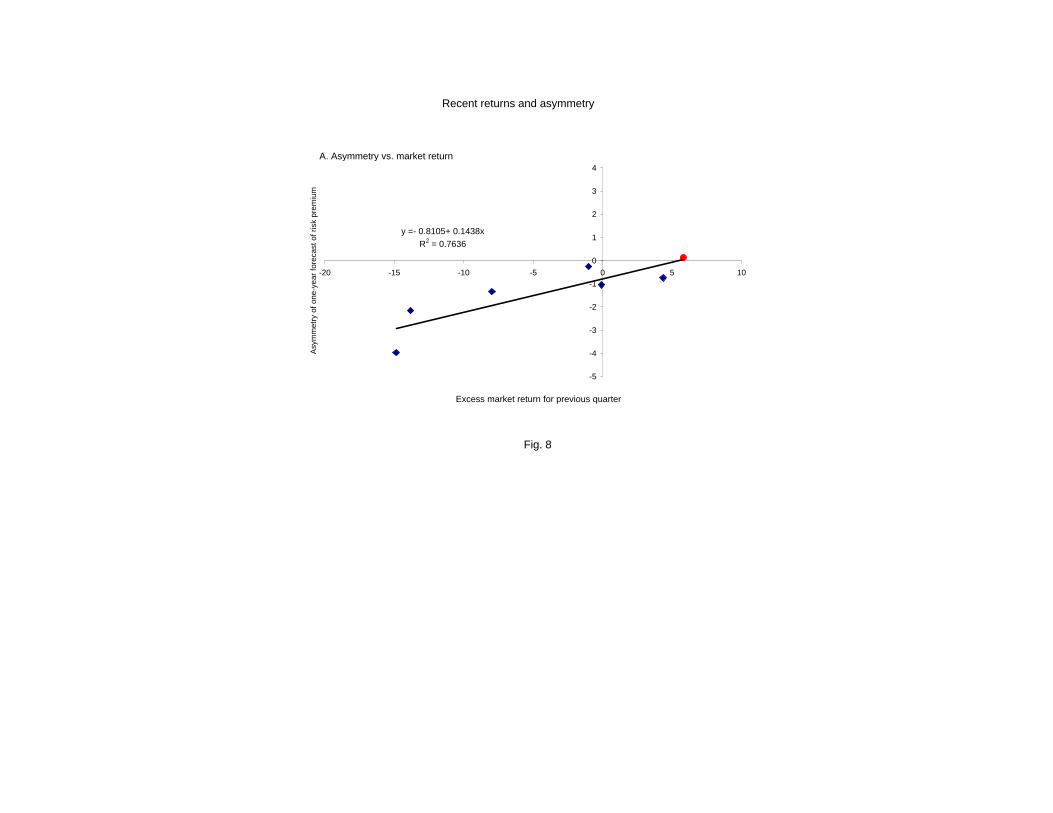
Recent returns and asymmetry
Fig. 8
A. Asymmetry vs. market return
y =- 0.8105+ 0.1438x R2 = 0.7636
-5
-4
-3
-2
-1
0
1
2
3
4
-20 -15 -10 -5 0 5 10
Excess market return for previous quarter
Asy
mm
etry
of o
ne-y
ear
fore
cast
of r
isk
prem
ium
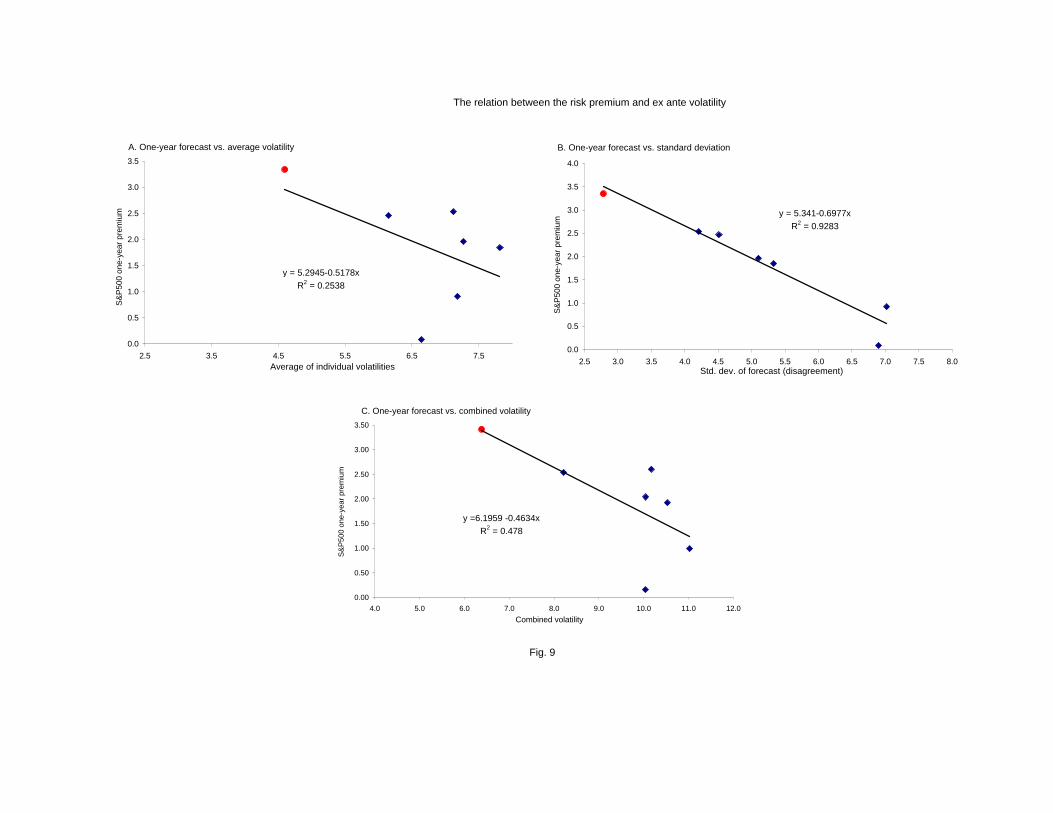
The relation between the risk premium and ex ante volatility
Fig. 9
A. One-year forecast vs. average volatility
y = 5.2945-0.5178x R2 = 0.2538
0.0
0.5
1.0
1.5
2.0
2.5
3.0
3.5
2.5 3.5 4.5 5.5 6.5 7.5Average of individual volatilities
S&
P50
0 on
e-ye
ar p
rem
ium
B. One-year forecast vs. standard deviation
y = 5.341-0.6977x R2 = 0.9283
0.0
0.5
1.0
1.5
2.0
2.5
3.0
3.5
4.0
2.5 3.0 3.5 4.0 4.5 5.0 5.5 6.0 6.5 7.0 7.5 8.0Std. dev. of forecast (disagreement)
S&
P50
0 on
e-ye
ar p
rem
ium
C. One-year forecast vs. combined volatility
y =6.1959 -0.4634x R2 = 0.478
0.00
0.50
1.00
1.50
2.00
2.50
3.00
3.50
4.0 5.0 6.0 7.0 8.0 9.0 10.0 11.0 12.0Combined volatility
S&
P50
0 on
e-ye
ar p
rem
ium
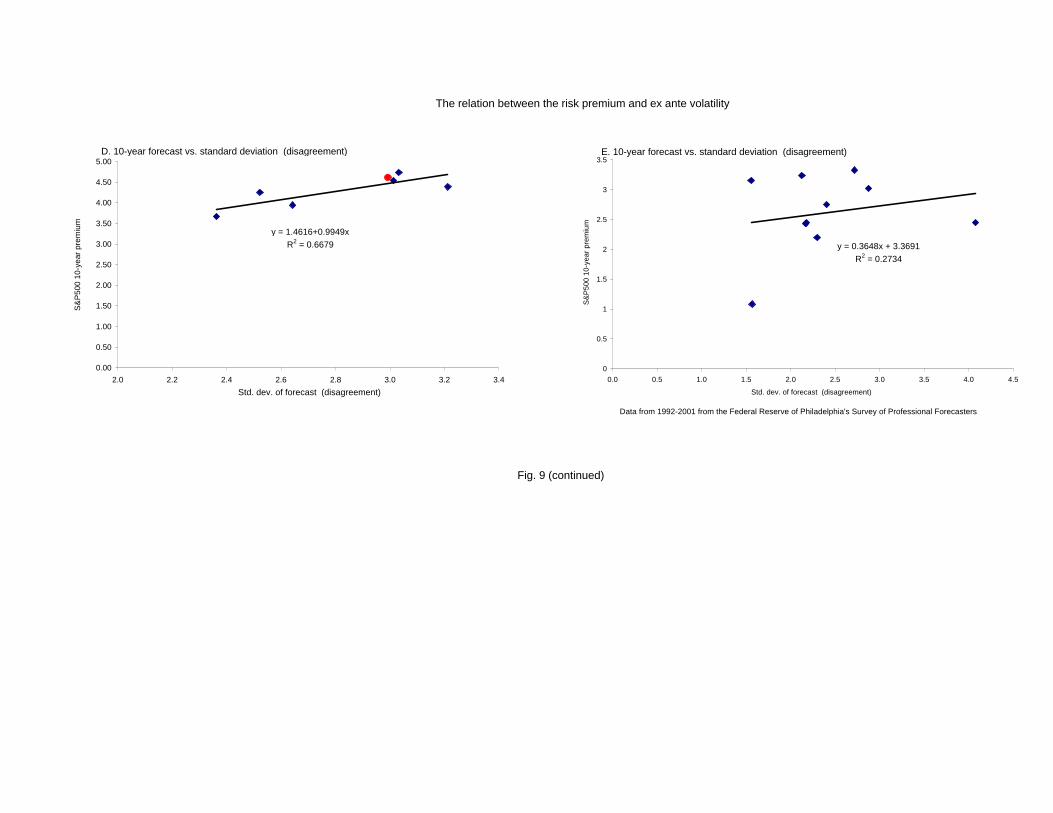
The relation between the risk premium and ex ante volatility
Data from 1992-2001 from the Federal Reserve of Philadelphia's Survey of Professional Forecasters
Fig. 9 (continued)
D. 10-year forecast vs. standard deviation (disagreement)
y = 1.4616+0.9949x R2 = 0.6679
0.00
0.50
1.00
1.50
2.00
2.50
3.00
3.50
4.00
4.50
5.00
2.0 2.2 2.4 2.6 2.8 3.0 3.2 3.4
Std. dev. of forecast (disagreement)
S&
P50
0 10
-yea
r pr
emiu
m
E. 10-year forecast vs. standard deviation (disagreement)
y = 0.3648x + 3.3691R2 = 0.2734
0
0.5
1
1.5
2
2.5
3
3.5
0.0 0.5 1.0 1.5 2.0 2.5 3.0 3.5 4.0 4.5
Std. dev. of forecast (disagreement)
S&
P50
0 10
-yea
r pr
emiu
m