Embed Size (px)
Citation preview

NBER WORKING PAPER SERIES
EVALUATING POST-SECONDARY AID:ENROLLMENT, PERSISTENCE, AND PROJECTED COMPLETION EFFECTS
Joshua AngristDavid AutorSally Hudson
Amanda Pallais
Working Paper 23015http://www.nber.org/papers/w23015
NATIONAL BUREAU OF ECONOMIC RESEARCH1050 Massachusetts Avenue
Cambridge, MA 02138December 2016
We are grateful to the staff of the Susan Thompson Buffett Foundation for their expert assistance in implementing this evaluation. We also thank the Provost’s Office at the University of Nebraska, the Nebraska State College System, and Nebraska’s community colleges for supporting this effort and sharing their data. Nick Gebbia, Tyler Hoppenfeld, Sookyo Jeong, and Olivia Kim provided outstanding research assistance with this paper. Sydnee Caldwell, Enrico Cantoni, Annice Correia, Eryn Heying, Brendan Malone, and Karen Scott were instrumental in the project’s early stages. We thank Raj Chetty, Amy Finkelstein, Nathan Hendren, Lisa Kahn, Lawrence Katz, Danielle Li and seminar participants at the Advances in Field Experiments Conference, ASSA Meetings, Econometric Society Meeting, NBER Summer Institute, Robert LaLonde Festschrift Conference, Columbia, Harvard, IIES MIT, Stanford, University of Virginia, and Yale for their many helpful comments and suggestions. We acknowledge financial support from the Susan Thompson Buffett Foundation, the MIT SEII seed fund, and the National Science Foundation Graduate Research Fellowship No. 1122374 (Hudson) and CAREER Grant No. 1454476 (Pallais). The views expressed here are those of the authors alone and do not necessarily reflect those of the institutions or funders involved with this work. This RCT was registered with the American Economic Association under trial number AEARCTR-0000125. The views expressed here are those of the authors alone and do not necessarily reflect those of the institutions or funders involved with this work.
NBER working papers are circulated for discussion and comment purposes. They have not been peer-reviewed or been subject to the review by the NBER Board of Directors that accompanies official NBER publications.
© 2016 by Joshua Angrist, David Autor, Sally Hudson, and Amanda Pallais. All rights reserved. Short sections of text, not to exceed two paragraphs, may be quoted without explicit permission provided that full credit, including © notice, is given to the source.
Evaluating Post-Secondary Aid: Enrollment, Persistence, and Projected Completion EffectsJoshua Angrist, David Autor, Sally Hudson, and Amanda PallaisNBER Working Paper No. 23015December 2016JEL No. I21,I22,I23,I24,I28,J24
ABSTRACT
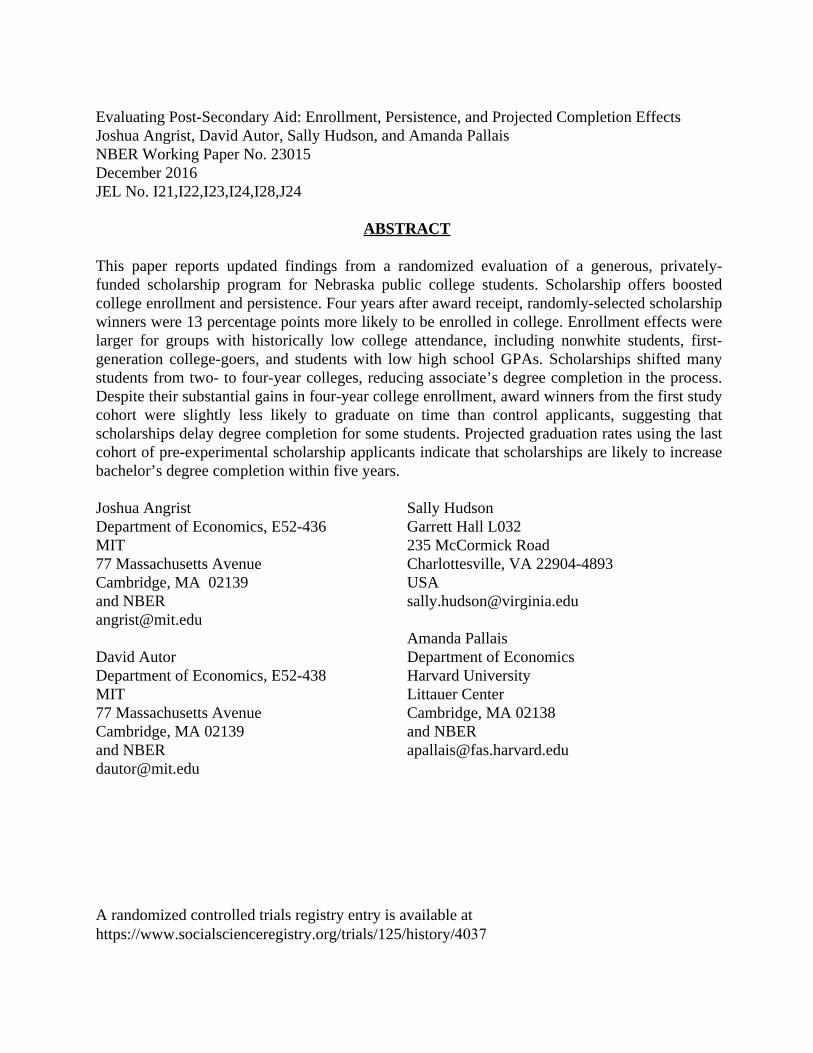
This paper reports updated findings from a randomized evaluation of a generous, privately-funded scholarship program for Nebraska public college students. Scholarship offers boosted college enrollment and persistence. Four years after award receipt, randomly-selected scholarship winners were 13 percentage points more likely to be enrolled in college. Enrollment effects were larger for groups with historically low college attendance, including nonwhite students, first-generation college-goers, and students with low high school GPAs. Scholarships shifted many students from two- to four-year colleges, reducing associate’s degree completion in the process. Despite their substantial gains in four-year college enrollment, award winners from the first study cohort were slightly less likely to graduate on time than control applicants, suggesting that scholarships delay degree completion for some students. Projected graduation rates using the last cohort of pre-experimental scholarship applicants indicate that scholarships are likely to increase bachelor’s degree completion within five years.
Joshua AngristDepartment of Economics, E52-436MIT77 Massachusetts AvenueCambridge, MA 02139and [email protected]
David AutorDepartment of Economics, E52-438MIT77 Massachusetts AvenueCambridge, MA 02139and [email protected]
Sally HudsonGarrett Hall L032235 McCormick RoadCharlottesville, VA [email protected]
Amanda PallaisDepartment of EconomicsHarvard UniversityLittauer CenterCambridge, MA 02138and [email protected]
A randomized controlled trials registry entry is available at https://www.socialscienceregistry.org/trials/125/history/4037
4037

1 Introduction
The Susan Thompson Bu↵ett Foundation (STBF) o↵ers scholarships to Nebraska high school
graduates who attend the state’s public colleges and universities. STBF is one of the largest private
grant providers in the country, funding more than 4,000 students with $36 million in aid every year.
Its awards are generous: the largest STBF awards provide more than $70,000 toward five years
of study at Nebraska public institutions. The Foundation selects award winners on the basis of
financial need, high school GPA, and a review of personal statements and reference letters. STBF
aid recipients, known as Bu↵ett Scholars, can use their awards to cover costs at any University of
Nebraska (NU) or State College campus, along with any of the state’s six community colleges. Buf-
fett Scholars who attend one of the three NU campuses also participate in Learning Communities
(LCs), a Foundation-supported academic services intervention similar to other Learning Communi-
ties programs around the country.1
To measure the impacts of grant aid and Learning Community services, we implemented a large
randomized evaluation of the STBF program. Between 2012 and 2016, STBF awarded more than
3,700 of its scholarships via random assignment. Our earlier working paper (Angrist et al. 2014)
reports award e↵ects on college enrollment and sophomore persistence for the first two experimental
cohorts of students, who started college in the fall of 2012 and 2013. The results reported here add
two new cohorts (2014 and 2015) and follow the 2012 applicants through their fourth post-award
academic year. The latest data allow us to measure initial college completion e↵ects and investigate
enrollment and persistence with much greater precision.
The new results reinforce our earlier findings that STBF scholarships alter students’ enrollment
behavior. Awards o↵ered to high school seniors who planned to attend community colleges boosted
initial enrollment by five percentage points and dramatically increased transfers to bachelor’s degree-
granting institutions over time. Four years after award receipt, community college scholarship
winners from the first cohort were 50 percent more likely to be enrolled at post-secondary institutions
than students not o↵ered Bu↵ett aid. Awards o↵ered to students who aspired to attend four-year
colleges had smaller e↵ects on initial enrollment since 96 percent of control students in this group
1See Weiss et al. (2015) for a review of research on LC impacts.
1

enrolled in college. Still scholarships boosted their initial enrollment by three points, a gain that
increased to 13 points by the end of senior year.
The large and heterogeneous STBF applicant pool reveals important variation in aid e↵ects
across subgroups. Retention increased most among groups with high expected dropout rates in the
absence of treatment: nonwhite applicants, first-generation college-goers, and students with low
high school GPAs. On the whole, STBF scholarships substantially reduced persistence gaps across
demographic groups.
To distinguish the e↵ects of STBF’s financial aid from those of LC services, we randomly o↵ered
some applicants an aid-only treatment that excluded access to LCs. This treatment, known to
applicants as the College Opportunity Scholarship (COS), o↵ered financial support to NU applicants
in the same amounts and under the same conditions as full STBF awards but without o↵ering seats
in the Foundation-sponsored LC programs at NU campuses. Aid-only awards generated average
enrollment gains on par with the combination aid and LC treatment. However, the combination
treatment — aid plus Learning Community support — appears more e↵ective than aid alone for
students with lower high school GPAs.
Although STBF awards generated clear and impressive enrollment gains, the picture for degree
completion remains unclear. Awards shifted community-college-bound students to four-year schools
without increasing associate’s degrees in the process. Roughly half of all control applicants in the
2012 community-college-bound group earned associate’s degrees within four years of high school
graduation. The associate’s degree completion rate was 12 points lower among scholarship recipients
in this group, an imprecisely estimated e↵ect. Scholarship winners who targeted four-year schools
were also less likely to complete bachelor’s degrees within four years than were control students.
Though on-time graduation rates were low — less than 30 percent — for both groups, scholarship
support further delayed completion. A likely explanation for this pattern is that STBF scholarships
fund up to five years of study, thereby decreasing financial pressure for on-time completion. Despite
the initial delays, we project that scholarships will ultimately increase bachelor’s degree completion
using data from an earlier cohort of non-randomized scholarship applicants.
The next section briefly reviews STBF program parameters and the design of our ongoing
experiment. Section 3 discusses the scholarships’ e↵ects on students’ financial aid packages. Section
4 reports reduced-form estimates of award e↵ects on enrollment for students targeting two- and four-
2

year colleges, including e↵ects in key demographic subgroups. Section 5 presents provisional results
from the aid-only treatment arm, and Section 6 discusses preliminary e↵ects on degree completion.
Section 7 concludes by summarizing the findings to date and briefly discussing our work in progress.
2 Background
2.1 The STBF Scholarship Program
The Susan Thompson Bu↵ett Foundation is the largest private grant provider in Nebraska and
among the largest in the country, supporting more than 4,000 students with $36 million each year.
STBF scholarships are available to Nebraska-resident high school seniors and graduates of in-state
high schools who have not yet been to college. The program is widely known in Nebraska and
well-publicized to potential applicants. More than half of all Pell-eligible Nebraska seniors who file
for federal aid also apply for Bu↵ett grants.2
STBF award criteria combine the academic standards of many state aid programs with the
means testing of federal student aid. Eligible applicants must attain a 2.5 high school GPA and
document financial need using the Free Application for Federal Student Aid (FAFSA). STBF gauges
financial need using FAFSA’s Expected Family Contribution (EFC) metric, which depends chiefly
on family size and income.3 The maximum Bu↵ett-eligible EFC— $15,000 in 2012 and $10,000
thereafter4 — exceeds the federal Pell Grant cuto↵, which ranged from $5,000 to $5,300 between
2012 and 2015. Bu↵ett awards are therefore available to many students who do not qualify for
federal grants or other state-funded programs tied to Pell receipt.
Within the pool of eligible applicants, STBF’s merit assessment is more fine-grained than most
state programs, incorporating transcripts, essays, and reference letters. Students submit their
application materials online between November 1 and February 1, with FAFSA records due by
March 15. Reviewers then evaluate eligible applicants using a rubric that emphasizes academic
achievement, financial need, and leadership skills. STBF notifies award winners in mid-April, and
more than 94 percent of scholarship winners accept their awards.
2Authors’ calculations from data obtained by request from the Federal Student Aid o�ce.3Dynarski and Scott-Clayton (2007) provide further detail on the FAFSA and EFC formula.4Less than eight percent of the 2012 randomized sample had EFCs greater than $10,000, so the 2013 change in
eligibility requirements had little impact on the EFC distribution across cohorts.
3

Bu↵ett awards can be used to cover expenses at any public undergraduate institution in Ne-
braska, including two- and four-year colleges. Award amounts vary by campus but are calibrated
to match the cost of tuition and fees for a full-time student plus a $500 allotment for books. In
2015, for example, awards provided up to $8,700 per academic year for full-time students at the
University of Nebraska-Lincoln, where full-time resident tuition and fees were $8,382 (University
of Nebraska-Lincoln 2015). STBF provides an additional semester’s worth of funding for summer
enrollment so that the maximum 2015 award was $13,050 at the University of Nebraska and $5,700
at community colleges. Though tuition levels determine the value of Bu↵ett grants, the funds can
be used to cover any of the federally-defined components of cost-of-attendance (COA), including
room, board, books, and supplies. This flexibility boosts STBF’s scholarship value relative to aid
programs that cover only tuition and fees. Because most Bu↵ett Scholars also qualify for state and
federal tuition grants, STBF aid often covers the remaining balance of COA, eliminating the need
for loans and out-of-pocket contributions to college costs. Bu↵ett awards are renewable for up to
five years provided students meet minimal academic requirements, though no more than three years
of funding can be paid toward community college expenses. Students enrolled for fewer than nine
credits per semester or with cumulative GPAs below 2.0 risk losing their scholarships.
Bu↵ett Scholars who attend one of NU’s three campuses—Lincoln (UNL), Omaha (UNO), or
Kearney (UNK)—are required to participate in STBF-funded Learning Community (LC) programs
during their first and second years.5 These programs are designed to promote academic success
and social engagement. While the LC programs di↵er somewhat by campus, they all include
special classes for Bu↵ett Scholars, a collection of academic and social activities, peer mentoring,
and academic advising services from LC faculty and sta↵. Most participants in the LC programs
at UNK and UNL live in dedicated dorm space. Bu↵ett Scholars who fail to participate in LC
activities may also lose their scholarships.
2.2 Research Design and Sample Construction
From 2012 to 2015, STBF awarded the majority of its scholarships via stratified random as-
signment. The Foundation divided students into strata by their “target college,” the institution
5The STBF-sponsored Thompson Learning Community program is named in honor of William H. Thompson, thefather of Susan T. Bu↵ett, who served as Professor of Psychology and Dean of the College of Arts and Sciences atOmaha University, now known as the University of Nebraska Omaha (UNO).
4

where applicants indicated they would enroll if o↵ered awards. Award winners were not required
to follow their stated plans, but 87 percent of aid recipients did indeed attend their target schools.
Within each target college stratum, STBF further divided students into three groups by application
score. Students in the highest-scoring group received guaranteed awards, the middle group was
subject to random assignment, and the lowest-scoring students were disqualified. Score thresholds
and award rates for the randomized group were determined by STBF preferences for award counts
at each campus.6 Appendix Table A1 reports award counts for each target college and cohort. The
Foundation o↵ered roughly 300 guaranteed awards each year, with a relatively stable distribution
of awards across campuses from year to year. Due to increased Foundation outreach, the number of
eligible applicants grew over time and with it the randomized sample, from 999 in the first experi-
mental cohort to 1,878 by the fourth study year.7 In total, 6,183 applicants were subject to random
assignment between 2012 and 2015.8
To distinguish the e↵ects of STBF’s financial aid from those of LC services, we randomly o↵ered
some applicants the aid-only College Opportunity Scholarship (COS). These aid-only awards match
traditional STBF scholarships in financial support but omit access to Bu↵ett LCs. COS awards were
made only to applicants in the NU strata of the randomized sample. Because the COS treatment
arm did not commence until the second year of our study and is smaller than the other experimental
groups, our COS impact estimates are less precise than results for full STBF awards. We exclude
COS recipients from our analysis except in Section 5 where we explicitly analyze the COS treatment.
The earlier experimental cohorts naturally provide a longer follow-up horizon than more recent
cohorts. We report initial enrollment e↵ects for the 2012-2015 cohorts; year two results for the
2012-2014 cohorts; year three impacts for the 2012 and 2013 cohorts; and year four results for the
2012 cohort. E↵ects di↵er little from one cohort to another and cohort pooling increases precision.
Estimated pooled impacts come from regressions that control for a full set of strata dummies to
reflect the di↵erential award rates across target colleges and cohorts. Appendix Table A2 reports
sample sizes for each follow-up period.
6The primary considerations are historic precedent and physical capacity constraints at the NU Learning Commu-nities.
7Starting in 2013, STBF advertised the scholarship by sending e-mail and print letters to Nebraska ACT test-takers who reported family incomes less than $100,000. In addition, the Foundation worked with high school guidancecounselors to identify eligible students who were not submitting applications.
8Here and throughout our analysis, we exclude fewer than 25 students who were less than 17 years old when theyapplied for STBF aid.
5

2.3 Data and Descriptive Statistics
Data for this project come primarily from the STBF scholarship application, the administrative
records of Nebraska’s public colleges, and the National Student Clearinghouse (NSC). The STBF
scholarship application provides a rich set of baseline characteristics, including high school tran-
scripts, ACT scores, and detailed demographic and financial information from federal Student Aid
Reports. Prior to 2014, the application did not ask students to report race, so we obtained race
data from state driver’s license records. We supplement the driver’s license data with self-reported
race in later cohorts.
More than 90 percent of applicants who enrolled in college attended Nebraska public institutions.
These colleges and universities provided information on their students’ enrollment, financial aid
packages, and academic outcomes. To capture enrollment at private and out-of-state colleges,
we supplement school-provided records with data from the NSC, which captures 92 percent of
enrollment nationwide (Dynarski, Hemelt and Hyman 2015). The data appendix provides additional
information about data sources and processing.
STBF applicants are substantially poorer than the general population of Nebraska high school
seniors. This can be seen in the first two columns of Table 1, which compare descriptive statistics
for eligible scholarship applicants and 12th grade students statewide. Bu↵ett applicants are also
disproportionately female and nonwhite. Applicants’ ACT scores mirror the average among ACT
test-takers in Nebraska, though test-taking rates among STBF’s college-bound applicants exceed
the state average.
Consistent with STBF’s scoring criteria, the guaranteed award winners have higher grades and
ACT scores and lower family incomes than the rest of the applicant pool, results that can be seen
in column 3 of Table 1. Nearly half are nonwhite, and half are first-generation college students. At
the other end of the rankings, students disqualified before random assignment had lower academic
achievement but otherwise look similar to the eligible sample.
Randomized students had average annual family incomes near $47,000 and Expected Family
Contributions just under $3,000. They are slightly over two-thirds white, 62 percent female, and
averaged B+ grades in high school. Just over one in three had a parent with a bachelor’s degree
at the time of application. Random assignment successfully balanced the characteristics of treated
6

and control applicants in the experimental sample, as Table 1 confirms. Column 6 reports strata-
adjusted di↵erences in treated and control means with standard errors in parentheses.
Our analysis reports results separately for students targeting two- and four-year colleges. These
target college strata are an important feature of the research design and a strong predictor of
enrollment outcomes. As shown in Appendix Table A3, students who target community colleges
have lower grades and test scores and are less likely to have college-educated parents than students
targeting four-year colleges.
3 How Awards A↵ected Aid
We begin by reviewing award e↵ects on students’ financial aid packages. This analysis is limited
to students who attended Nebraska public colleges because our administrative aid data come from
those institutions. Since STBF awards a↵ect where students enroll and, by extension, their inclusion
in this sample, the analysis here is potentially subject to selection bias. In practice, however, the
e↵ect of awards on enrollment at in-state public colleges is small while the e↵ects on financial aid
packages are large.9 Though the picture painted here is, in principle, more descriptive than causal,
it still provides a useful gauge of the scholarships’ impact on financial aid packages.
As a benchmark, the first column of Table 2 describes the first-year financial aid packages of
control group students who attended Nebraska public colleges. They incurred almost $17,000 in
college costs and received about $12,350 in total aid, on average. Even without STBF support,
these low-income students collected nearly $7,800 in grant aid, primarily from need-based public
programs. They also accepted roughly $3,700 in federal loans and $830 in work study wages. These
calculations omit private loans, which are underreported in our data. Subsidized public loans are
the primary source of borrowed funds for this low-income population.
We estimate the e↵ects of scholarship o↵ers on aid packages using regression models of the form:
Ai = �Si +X
s,c
�scdisc +⇧
0Xi + "i, (1)
9Less than eight percent of control students enrolled at out-of-state or private institutions. Scholarship o↵ersdiverted 3.6 percentage points to Nebraska public colleges. These estimates appear in Table 3, which we discuss ingreater detail in Section 4.
7

where Ai is the dollar amount of aid that student i received, and Si is an indicator for whether
student i was (randomly) o↵ered an STBF scholarship. Since a few students in each cohort turn
down Bu↵ett grants for other merit aid, these estimates capture intent-to-treat contrasts between
treated and control subjects. The dummies disc indicate whether applicant i from cohort c listed
school s as her target college. These strata e↵ects adjust for di↵erential award rates by target college
and application year. The covariate vector Xi includes GPA, EFC, gender, race, and parental
education. To the extent that selection into Nebraska public colleges varies with these traits,
including Xi mitigates the resulting selection bias. In practice, however, controlling for covariates
has little e↵ect on the estimates.
STBF award winners received $7,156 in Bu↵ett grants, on average, during their first post-award
year, as shown in column 2 of Table 2, which reports estimates controlling only for strata dummies,
disc. On net, total grants increased by slightly less ($6,209). The less than one-for-one pass-through
reflects a $951 decline in institutional awards and private grants with little change in state or federal
grants.10
STBF aid substantially reduced students’ reliance on federal loans and work study wages. Av-
erage federal loans fell by $2,292, and the share of students accruing any federal debt dropped from
57 to 30 percent. Less than one in five award winners received Federal Work Study, compared with
one in three control students. In total, Bu↵ett Scholarship o↵ers increased first-year aid packages
by $3,497. Column 3 confirms that adding baseline covariates has little impact on these estimates,
bolstering the case that these results capture causal e↵ects despite our data limitations.
To estimate the dollar-for-dollar impact of STBF aid on other funding sources, we replace Si
in equation (1) with the dollar amount of Bu↵ett aid received. The estimates in column 5 of
Table 2 show that each dollar of STBF grant aid increased students’ total grants by $0.85, while
reducing loans by $0.29 and work study by $0.05, for a net gain of $0.51 per dollar awarded. These
results capture two countervailing forces. At any given college, scholarship money crowds out aid
from other sources, reducing award e↵ects on total aid disbursed. But awards also change where
students enroll. In particular, as we explore in detail in Section 4, STBF awards caused many
applicants to attend four-year schools instead of less costly community colleges. The first row of
10Schools must apply federal grants toward aid packages before all other sources, so federal grants do not typicallyrespond to variation in private aid received.
8

Table 2 documents this shift: every dollar of Bu↵ett aid increased average costs of attendance by
$0.29. Though four-year colleges cost more, they also provide more grant aid. Control students
attending four-year colleges received $9,114 in grants, on average, more than double the average
grant aid among control students at two-year schools. Scholarship money therefore “crowds in” aid
by shifting students to more expensive schools that o↵er more financial aid.
To disentangle the crowd-out and crowd-in e↵ects, columns 4 and 6 of Table 2 (labeled “campus
adjusted”) report estimates from a version of equation (1) that includes campus controls, a set of
variables which count the number of full-time semesters attended at each campus in the first post-
award year. These campus-adjusted regressions measure the extent to which Bu↵ett aid crowds out
other funding at a given school. Holding enrollment behavior constant, Bu↵ett aid has no e↵ect
on year one costs incurred, and yet each Bu↵ett dollar reduces other grant aid by $0.29, an e↵ect
that’s nearly twice as large as the crowd out estimated without campus controls.11 These results
should be interpreted cautiously, since campus-adjusted regressions combine causal e↵ects on aid
packages for students whose enrollment is invariant to award o↵ers with compositional e↵ects that
result from treatment-induced changes in college attended. Nevertheless, the observable covariates
have little e↵ect on these estimates. The campus-controlled estimates therefore provide reasonable
evidence that Bu↵ett awards dramatically increase students’ financial resources.
4 Enrollment E↵ects
Because students targeting two- and four-year colleges have such distinct paths through college,
we analyze the scholarships’ e↵ects on these groups separately, in Sections 4.1 and 4.2. After
presenting the aggregate award impacts by target college, we analyze the di↵erential e↵ects of
awards across demographic subgroups in Section 4.3.
4.1 Enrollment E↵ects in the Two-Year College Strata
Almost all STBF applicants attend college in the first year after high school whether or not they
win Bu↵ett awards. This fact is apparent in Figure 1, which plots enrollment rates by treatment
11The crowd-out rate for total grants was similar in year two ($0.25) and year three ($0.24), which indicates thatSTBF scholarships maintain their value as students progress in school. Other aid programs often shift students fromgrant aid to loans after the freshman year (Sharpe 2016).
9

status and target college. Even without Bu↵ett aid, 90 percent of control applicants who targeted
community colleges enrolled at some institution in the fall of year one,12 as the grey line in Panel
A indicates. STBF awards increased initial enrollment in this group by a statistically significant
five percentage points. This estimate and others in Figure 1 come from regressions of binary
enrollment indicators on the award o↵er and strata dummies described in equation (1), though
unlike the financial aid analysis, these regressions include all randomized applicants in the two-year
college strata, not just those who enrolled at Nebraska public colleges. Whiskers indicate 95 percent
confidence intervals for the estimated treatment e↵ects.
Although students in the two-year strata indicated that they aspired to attend community
colleges, some opted to enroll at four-year schools after receiving scholarship support. Table 3 doc-
uments this shift across institutions. Nearly all of the five point increase in total enrollment, shown
in the first row of column 4, comes from increased enrollment at four-year colleges. Admissions
records from the University of Nebraska reveal that many of the students who altered their stated
college plans didn’t apply to four-year schools until after receiving Bu↵ett aid. Award o↵ers boosted
applications to UNO, for example, from eight to 13 percent in the two-year strata, as Appendix
Table A4 reports. Scholarship winners were no more likely to be admitted conditional on applying,
however; UNO admitted 77 percent of both treated and control applicants from the two-year college
strata.13 The mechanism that motivates some Bu↵ett Scholars to alter their college plans is yet un-
known. Award winners may interpret scholarship o↵ers as positive signals of their college aptitude
and revise their enrollment goals. Another explanation is financial: STBF’s award scheme implicitly
subsidizes shifting from two- to four-year schools since awards cover tuition at any Nebraska public
college, and four-year schools are more expensive — both in total and on a per-credit basis.
Like many state aid programs, Bu↵ett awards diverted some enrollment from out-of-state and
private schools into Nebraska public colleges, though there was little scope for shifting on this
margin in the two-year strata. Just four percent of control students enrolled outside the Nebraska
12In keeping with the the Federal Student Aid year, we define post-award years to run from July 1 through June30. We divide each post-award year into fall and spring periods, where fall runs from July through December, andspring runs from January through June.
13It’s unlikely that scholarship applicants who intend to enroll at UNO misreport their college plans to increasetheir chances of winning Bu↵ett awards. The average award rate was 47 percent for the two-year strata and 54 percentfor UNO, as the sample counts in Appendix Table A1 indicate. We are still working to collect admissions recordsfrom UNL, the most selective NU campus. However, the vast majority of two-year strata students who matriculate atfour-year schools attend UNO, owing, perhaps, to its rolling admission deadlines and proximity to Nebraska’s largestcommunity college.
10

public college system, and awards reduced that rate to two percent, as shown in Panel B of Table
3.
Both treatment and control group enrollment declined modestly during the second follow-up
year, but thereafter these groups’ enrollment paths diverged. Many control students left school
during year three, and by year four fall, just 28 percent were still enrolled in college. Though
dropout also accelerated in the treated pool, Bu↵ett awardees were nearly twice as likely to extend
their studies beyond three years: more than half enrolled in the fall of year four. Panel A of Figure
1 plots these trends, and Table 4 reports the corresponding estimates.14
Award winners’ extended enrollment came at the expense of associate’s degree completion. This
result appears in the last two columns of Table 4, which disaggregates year-four enrollment by degree
status. The top row reports the total enrollment rate: 28 percent of control applicants enrolled in
the fall of year four, and 72 percent did not. Roughly half of those not enrolled earned associate’s
degrees before leaving school. Treated students, in contrast, were 21 points less likely to complete
terminal associate’s degrees. Instead, many treated applicants transferred to four-year schools
without first earning two-year credentials: award o↵ers increased the share of students attending
four-year institutions without any degree from 8.5 to 20 points. STBF’s continuation requirements
may encourage these transfers because awards only cover three years of study at community colleges.
Students who wish to maintain their scholarships must therefore transfer to four-year colleges by the
fall of year four. The point estimate indicates that scholarships may have decreased the number of
students who dropped out before completing any degree (by 5.4 percentage points), but this figure
is imprecisely estimated.
4.2 Enrollment E↵ects in the Four-Year Strata
STBF applicants who targeted four-year schools were even more likely to enroll in college than
their two-year strata counterparts, even without Foundation support. More than 96 percent of
control applicants attended college in the fall of year one, and awards boosted this rate by a
statistically significant three percentage points. Panel B of Figure 1 plots these enrollment rates.
14Because the results for initial enrollment pool data from all four cohorts, they are more precisely estimated thanthe impacts on longer-run enrollment. Appendix Table A5 shows that the underlying cohort-specific enrollment ratesare not significantly di↵erent from the pooled estimates in Figure 1.
11

Students in the four-year strata also applied to a wider range of institutions than their com-
munity college-bound peers, so awards had more scope to influence these students’ college choice.
Scholarship o↵ers decreased the fraction of students attending out-of-state or private schools from
eight to four percent, as columns 5 and 6 of Table 3 report. Importantly, however, and in contrast
with other state merit aid programs (see Cohodes and Goodman 2014), the shift to Nebraska public
schools was concomitant with a shift toward more-selective institutions. Specifically, STBF awards
increased the proportion of students attending selective colleges (with admission rates below 75
percent) by four points. The fraction of students attending moderately-selective four-year schools
(with admissions rates between 75 and 90 percent) increased by a similar amount. At the same
time, awards reduced the share attending community colleges from nine to three percent.15
Though scholarships had only modest e↵ects on initial enrollment in the four-year strata, awards
substantially reduced dropout in the critical transition between freshman and sophomore years.
Nearly half of all dropout from bachelor’s degree programs occurs at this juncture (Kena et al.
2015).16 In STBF’s relatively high-achieving applicant pool, scholarship o↵ers boosted sophomore
enrollment by seven points, ensuring that 96 percent of treated students enrolled in year two. The
impact on four-year college going was even larger: STBF awards increased four-year enrollment
by 13 points in year two fall. These results appear in column 4 of Table 5, which documents
institutional shifting in the four-year strata in a format similar to Table 4.
Importantly, while many interventions produce short-lived gains, STBF award impacts appear
to be cumulative. By the fall of year four, awards increased total enrollment by 14 points, from
74 to 88 percent. Nearly all students were attending bachelor’s degree-granting institutions by the
fourth follow-up year. Less than 10 percent of both treated and control students were still enrolled
at two-year institutions.
15Most STBF applicants who enrolled outside the Nebraska public college system attended private schools in theMidwest. The top five schools attended outside the Nebraska public college system were Nebraska Wesleyan University,Creighton University, Hastings College, Concordia University, and Midland University, all religiously-a�liated privateinstitutions in Nebraska.
16Just 80 percent of all first-time, full-time undergraduates at bachelor’s degree-granting institutions return for asecond year, while 60 percent complete bachelor’s degrees within six years. Freshman retention rates at the Universityof Nebraska hover near the national average, ranging from 77 percent at UNO to 84 percent at UNL in 2014 (U.S.Department of Education 2014).
12

4.3 Subgroup Impacts: Race, Family Background, and College-Preparedness
Within the four-year strata, STBF awards generated especially large enrollment gains for demo-
graphic groups with high expected dropout rates in the absence of treatment.17 Figure 2 documents
this variation in program impacts by race and parental education, both strong predictors of enroll-
ment and retention. Nonwhites in the control group were less likely to attend college than were
their white peers. More than 98 percent of white applicants enrolled without Foundation support
compared with 94 percent of nonwhite students. Award o↵ers equalized their initial enrollment so
that more than 99 percent of award winners from both groups attended college in year one. Four
years out, awards narrowed the race gap in enrollment from twelve points to just seven. Panels C
and D document a similar pattern by parental education.
Figure 3 reveals even more striking patterns in program impacts by academic preparation.
The dots in Panels A and B show estimated impacts on year-two fall enrollment for deciles of
high school GPA, and the solid lines plot fitted values from regressions that estimate the linear
interaction between award status and GPA. Dashed lines plot 95 percent confidence intervals for
the linear fitted values. Panel A shows that award o↵ers boosted year-two enrollment by 23 points
in the bottom decile, from 74 to 97 percent. These students, with average high school GPAs of 2.7,
would be ineligible for many state merit aid programs, which often require GPAs of 3.0 (Fitzpatrick
and Jones 2016). At the same time, scholarships had almost no measurable impact on persistence
for the top-performing students who receive most merit aid. Among students with high school
GPAs above 3.5—fully half the randomized sample—awards increased year-two fall enrollment by
just three points.18 The GPA gradient for award impacts on four-year college enrollment was even
more pronounced, as Panel B illustrates. Scholarships increased the share of bottom-decile students
attending four-year schools in sophomore year by a whopping 40 points, with no e↵ect at the top
end of the grade distribution. Appendix Figure A1 documents similar patterns using ACT scores to
measure college readiness in lieu of high school GPA. These results are consistent with Dynarski’s
17We restrict our subgroup analyses to students who targeted four-year colleges since the community college sampleis currently too small to support precise comparisons across subgroups. In time, additional cohorts will facilitatesimilar investigations in the two-year strata.
18Appendix Table A6 compares OLS and logit estimates of e↵ects in subgroups. Logit marginal e↵ects are virtuallyindistinguishable from the corresponding OLS estimates.
13

(2004) argument that state aid programs with more stringent academic standards may exclude
many of the students who respond most to financial aid.
Though award impacts vary by race, parental education, and academic achievement, we see less
evidence of di↵erential impacts by financial need. Panels C and D of Figure 3 plot award e↵ects by
Expected Family Contribution (EFC), the metric that determines eligibility for STBF grants and
federal aid programs. There is no clear gradient in award impacts by financial need.19 Appendix
Figure A1 documents similar patterns using family income to gauge financial need.
We summarize the variation in award impacts by showing how treatment e↵ects vary with a
single index of expected college enrollment. Such “endogenous stratification” estimates are best
computed using leave-out fitted values, as Abadie, Chingos and West (2013) detail. (Otherwise,
enrollment outcomes are mechanically correlated with predicted enrollment, which may bias esti-
mates of causal e↵ects.) In this case, we use the control group data to estimate the relationship
between outcome Yj and covariates Xj in leave-out samples that omit each observation i:
Yj = ⇡0(�i)Xj + "j ; j 6= i. (2)
The vector Xj contains gender, race, parental education, EFC, and high school GPA — all strong
predictors of enrollment and persistence. The resulting leave-out fitted values are given by
Yi = ⇡0(�i)Xi. (3)
Estimates of STBF award e↵ects conditional on expected enrollment, Yi, appear in Figure 4.
As in the previous graphs, each dot represents a decile of expected enrollment, and the solid lines
plot the corresponding linear fitted values. Since nearly all control applicants in the four-year strata
enroll in year one, the deciles of expected enrollment range from just .89 to 1. Even so, award o↵ers
increased initial enrollment in the bottom decile by more than 10 points, ensuring that nearly all
scholarship recipients enrolled in college. By year two, baseline covariates predict that roughly one
in four students in the bottom decile would not be enrolled in college absent scholarship support.
Scholarships boosted their enrollment rate by more than 20 points. Award impacts in years three
and four exhibit similar patterns, with enrollment impacts of over 40 percentage points for the
lowest decile by year four.
19Among applicants with EFCs low enough to qualify for Bu↵ett aid, those with EFCs above $6,000 qualify forfewer forms of other need-based aid, including federal Pell grants and institutional grants.
14
Together, these subgroup analyses highlight the challenging trade-o↵ between rewarding stu-
dents’ past achievement and increasing program impacts. Students who appear most meritorious
based on grades and test scores are also those most likely to persist in college absent scholarship
support. Conversely, applicants who appear more likely to struggle in college respond more dra-
matically to merit aid when they are fortunate enough to receive it.
5 Distinguishing Financial Aid and Learning Community E↵ects
Roughly 80 percent of scholarship winners in the four-year strata enroll at University of Ne-
braska campuses, where Bu↵ett Scholars participate in STBF Learning Communities (LCs) during
freshman and sophomore years. Award impacts in the four-year strata therefore combine the ef-
fects of financial support with the e↵ects of LC services.20 An aid-only treatment arm, known to
applicants as the College Opportunity Scholarship (COS), allows us to estimate the marginal e↵ect
of LC participation. COS awards o↵er the same grant support as STBF scholarships but exclude
access to LC services.21 COS awards were introduced in the second experimental cohort and were
only o↵ered in the NU strata; guaranteed award winners and those in the state and community
college strata received full STBF scholarships throughout the study. The COS sample is therefore
much smaller than the sample for the main treatment arm.
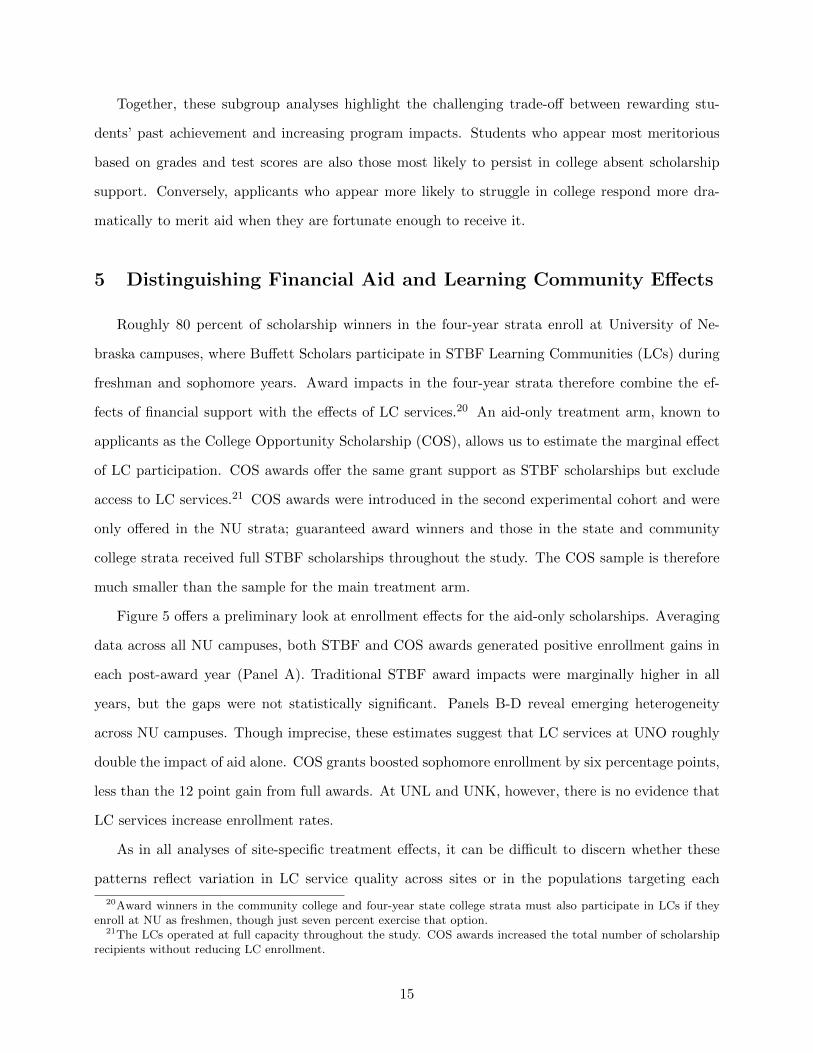
Figure 5 o↵ers a preliminary look at enrollment e↵ects for the aid-only scholarships. Averaging
data across all NU campuses, both STBF and COS awards generated positive enrollment gains in
each post-award year (Panel A). Traditional STBF award impacts were marginally higher in all
years, but the gaps were not statistically significant. Panels B-D reveal emerging heterogeneity
across NU campuses. Though imprecise, these estimates suggest that LC services at UNO roughly
double the impact of aid alone. COS grants boosted sophomore enrollment by six percentage points,
less than the 12 point gain from full awards. At UNL and UNK, however, there is no evidence that
LC services increase enrollment rates.
As in all analyses of site-specific treatment e↵ects, it can be di�cult to discern whether these
patterns reflect variation in LC service quality across sites or in the populations targeting each
20Award winners in the community college and four-year state college strata must also participate in LCs if theyenroll at NU as freshmen, though just seven percent exercise that option.
21The LCs operated at full capacity throughout the study. COS awards increased the total number of scholarshiprecipients without reducing LC enrollment.
15

campus. As Appendix Table A3 details, UNO serves a disproportionate fraction of students with
the biggest documented gains from full awards: racial minorities, first-generation college-goers, and
students with lower grades and test scores. UNL and UNK, in contrast, attract students with higher
expected retention in the absence of treatment. The variation in Figure 5 may therefore capture
heterogeneity across students rather than across campuses. Indeed, Figure 6 shows that splitting the
sample by high school GPA instead of campus shows no di↵erential impacts for students with GPAs
at or above the sample median (3.5), but markedly di↵erent, albeit noisy, impacts on students with
below median GPAs. These findings suggest that LC services may boost persistence for students
with lower GPAs despite their small aggregate e↵ects. With additional follow-up data, these results
will become more precise and conclusive.
6 Preliminary and Projected Completion E↵ects
A complete picture of award impacts on bachelor’s degree completion is still one or two years
away. In keeping with nationwide trends, less than one in three students at Nebraska’s four-year
public colleges graduates within four years. After six years, however, graduation rates more than
double, ranging from 37 to 67 percent across Nebraska public institutions. (U.S. Department of
Education 2015).
Like their peers, many Bu↵ett applicants in the oldest randomized cohort were still enrolled
but did not earn bachelor’s degrees by the end of year four. Table 6 summarizes their year-four
graduation rates. In the community college strata, slightly more than half (52 percent) of control
group students earned associate’s degrees by the end of year four. Scholarships decreased this rate
by an insignificant but economically meaningful 12 percentage points. This reduction in associate’s
degrees may ultimately be o↵set by an increase in bachelor’s degrees. Although few students in
the two-year strata have earned bachelor’s degrees to date (5.6 percent in the control group), our
estimates, while imprecise, suggest that scholarships have roughly doubled this number to 11.0
percentage points. Scholarships also increased the share of students enrolled in four-year colleges
who have not yet earned bachelor’s degrees from 15 to 23 percentage points. The total e↵ect
of scholarships on degree completion for this group will depend on how many of these students
eventually complete BAs.
16

Scholarships also decreased degree completion in the four-year strata by the end of year four.
While only five percent of control students earned associate’s degrees by the end of year four, 28
percent completed bachelor’s degrees, as shown in Table 6. Scholarships reduced these completion
rates by 2.4 and 5.9 points, respectively. Bu↵ett Scholars’ lower on-time graduation rates may
reflect the scholarship’s terms. STBF provides up to five years of funding, so award winners likely
face less financial pressure to graduate in four years than other students do. In keeping with this
reasoning, scholarship winners were much more likely to be enrolled in four-year colleges without
earning degrees by the end of year four (57 vs. 39 percentage points).
Results from the 2012 cohort to date show that scholarships have increased the share of students
who are on track to earn bachelor’s degrees while simultaneously depressing the number of degrees
completed in four years. It remains to be seen which of these countervailing forces will dominate
in the long run. To provide a statistical preview of future graduation results, we use data from
the STBF’s 2011 application cohort, the last cohort of students who applied before the experiment
began.22 Though these students were not subject to random assignment, outcomes for successful
and unsuccessful scholarship applicants from this cohort may, in conjunction with our experimental
estimates, be informative about the trajectory of experimental cohorts.
We use Kline’s (2011) selection-correction procedure to adjust for non-random assignment of
award o↵ers in the non-experimental cohort. The Kline method relies on a linear model for potential
outcomes given baseline covariates,
Y di = X0
i�d + "di
for d 2 {0, 1}. Under a mean independence assumption,
Eh"di | Xi, Di
i= 0,
an ordinary least squares (OLS) regression among the controls identifies �0:
�0 = E⇥XiX
0i | Di = 0
⇤�1 ⇥ E [XiYi | Di = 0] ,
which captures the relationship between covariates and potential outcomes absent scholarship sup-
port. If the same mapping from covariates to untreated outcomes holds among award winners, then
22As with the subgroup analysis, we restrict the projection estimates to the four-year strata due to power limitationsin the community college strata.
17

the average e↵ect of treatment on the treated (TOT) is
E⇥Y 1i � Y 0
i | Di = 1⇤
= E⇥Y 1i | Di = 1
⇤� E [Xi | Di = 1]0 �0.
Kline shows that this hybrid procedure outperforms regression in replicating the experimental e↵ects
of federal job training programs in LaLonde’s (1986) classic analysis.
We find support for the hypothesis that scholarships will ultimately boost bachelor’s degree
completion among students who were randomly assigned scholarships. The top panel of Figure
7 compares estimated e↵ects on bachelor’s degree completion for the 2012 experimental sample
with estimates for the non-randomized 2011 cohort. As in Kline’s replication exercise, selection-
corrected estimates from the non-experimental data faithfully replicate the experimental findings.
The experimental and non-experimental estimates in Panel A are similar through the end of year
four, where both samples show a five to seven point deficit in graduation rates for award winners.
By the end of year five, however, 2011 award winners were eight percentage points more likely to
complete bachelor’s degrees than control applicants. The plotted estimates control for high school
GPA, EFC, gender, race, and parental education, but more parsimonious models produce similar
results.23
To adjust for potential di↵erences in sample composition across cohorts, we reweight the 2011
Kline estimates by the distribution of covariates in the randomized sample and plot the resulting
projections in Panel B. Reweighting leaves the bottom line unchanged. These graphs suggest that
Bu↵ett Scholars eventually convert enrollment gains into bachelor’s degrees even though awards
increase time to completion for some. Experimental estimates of award impacts on five-year grad-
uation rates will be available in the summer of 2017.
7 Summary and Conclusions
STBF scholarships generated large gains in college enrollment four years after award receipt.
Modest e↵ects on initial enrollment have grown as the scholarship increased college persistence.
Though apparent in our earlier working paper, these patterns have become clearer as the follow-
up window has lengthened and more cohorts have boosted precision. Estimated enrollment gains
23Appendix Table A7 explores the robustness of these results to alternative control functions.
18

remain largest for nonwhite applicants, first-generation college-goers, and students with the lowest
grades and test scores in the eligible applicant pool. These findings highlight the paradox of merit
aid: awards based on past achievement are likely to generate smaller gains than awards made to
applicants who appear less college-ready.
Awards have also shifted students from two- to four-year schools, reducing associate’s degree
completion in the process. The long-run e↵ects of reductions in two-year credentials on terminal
degree completion will likely depend on whether scholarship recipients convert their extended en-
rollment at four-year institutions into bachelor’s degrees. In the short run, Bu↵ett scholarships
appear to have reduced on-time graduation rates at four-year colleges, likely because these scholar-
ships provide up to five years of funding. Analysis of outcome data from a pre-experimental cohort
suggests that this e↵ect is likely to be transitory: we project that scholarships will raise degree
completion after five years.
Our results are preliminary and limited to the outcomes available within the first four years of
award receipt. As the current cohorts age and new cohorts enter the study, we expect to examine
e↵ects on college completion and sharpen our estimates of di↵erential e↵ects across subgroups.
Evidence on the relative contribution of financial support and Learning Community services should
also grow more conclusive. Ultimately, we expect to measure how award e↵ects on retention and
degree completion influence long-run labor market outcomes.
19

References
Abadie, Alberto, Matthew M. Chingos, and Martin R. West. 2013. “Endogenous Strat-
ification in Randomized Experiments.” National Bureau of Economic Research Working Paper
19742, December.
ACT. 2012. “The Condition of College & Career Readiness 2012.”
http://www.act.org/content/dam/act/unsecured/documents/CCCR12-
NationalReadinessRpt.pdf (accessed December 14, 2016).
Angrist, Joshua D., David H. Autor, Sally Hudson, and Amanda Pallais. 2014. “Leveling
Up: Early Results from a Randomized Evaluation of Post-Secondary Aid.” National Bureau of
Economic Research Working Paper 20800, December.
Cohodes, Sarah R., and Joshua S. Goodman. 2014. “Merit Aid, College Quality, and College
Completion: Massachusetts’ Adams Scholarship as an In-Kind Subsidy.” American Economic
Journal: Applied Economics, 6(4): 251–285.
Dynarski, Susan M. 2004. “The New Merit Aid.” In College Choices: The Economics of Where to
Go, When to Go, and How to Pay For It. Vol. I, eds. Caroline M Hoxby, 67–93. Chicago: University
of Chicago Press.
Dynarski, Susan M., and Judith Scott-Clayton. 2007. “College Grants on a Postcard: A
Proposal for Simple and Predictable Federal Student Aid.” The Hamilton Project Discussion
Paper 2007-01, March.
Dynarski, Susan M., Steven W. Hemelt, and Joshua M. Hyman. 2015. “The Missing Man-
ual: Using National Student Clearinghouse Data to Track Postsecondary Outcomes.” Educational
Evaluation and Policy Analysis, 37: 53S–79S.
Fitzpatrick, Maria D., and Damon Jones. 2016. “Higher Education, Merit-Based Scholarships
and Post-Baccalaureate Migration.” Economics of Education Review, 54(October): 155–172.
Kena, Grace, Lauren Musu-Gillette, Jennifer Robinson, Xiaolei Wang, Amy Rathbun,
Jijun Zhang, Sidney Wilkinson-Flicker, Amy Barmer, and Erin Dunlop Velez. 2015.
20

“Institutional Retention and Graduation Rates for Undergraduate Students.” U.S. Department of
Education, Institute of Education Sciences, National Center for Education Statistics, Washington
D.C.
Kline, Patrick. 2011. “Oaxaca-Blinder as a Reweighting Estimator.” American Economic Review:
Papers & Proceedings, 101(3): 532–537.
Lalonde, Robert J. 1986. “Evaluating the Econometric Evaluations of Training Programs with
Experimental Data.” American Economic Review, 76(4): 604–620.
National Cancer Institute. 2015. “U.S. Population Data - 1990-2015 Expanded Races
(White, Black, American Indian/Alaska Native, Asian/Pacific Islander) by Origin (His-
panic, Non-Hispanic).” Surveillance, Epidemiology and End Results (SEER) Program
https://seer.cancer.gov/popdata/download.html (accessed January 5, 2017).
Sharpe, Rochelle. 2016. “Why Upperclassmen Lose Financial Aid.” New York Times, April 6.
University of Nebraska-Lincoln. 2015. “Budgets for 2015-2016.”
http://financialaid.unl.edu/budget.html (accessed October 21, 2015).
U.S. Census Bureau. 2014. “American Community Survey (ACS), One-Year Public Use Micro-
data Sample (PUMS), 2014.” (accessed via ftp March 1, 2016).
U.S. Department of Education. 2010a. “Common Core of Data.” Institute of Education Sci-
ences, National Center for Education Statistics https://nces.ed.gov/ccd/ (accessed February 4,
2016).
U.S. Department of Education. 2010b. “Private Schools Universe Survey.” Institute of Edu-
cation Sciences, National Center for Education Statistics https://nces.ed.gov/surveys/pss/ (ac-
cessed February 4, 2016).
U.S. Department of Education. 2014. “Integrated Postsecondary Education Data Sys-
tem (IPEDS).” Institute of Education Sciences, National Center for Education Statistics
https://nces.ed.gov/ipeds/datacenter (accessed March 1, 2015).
21

U.S. Department of Education, Institute of Education Sciences, and National Cen-
ter for Education Stastics. 2015. “College Navegator.” https://nces.ed.gov/collegenavigator/
(accessed December 20, 2016).
Weiss, Michael J., Mary G. Visher, Evan Weissman, and Heather D. Wathington. 2015.
“The Impact of Learning Communities for Students in Developmental Education: A Synthesis of
Findings from Randomized Trials at Six Community Colleges.” Education Evaluation and Policy
Analysis, 37(4): 520–541.
22

Figure 1Award E↵ects on College Enrollment
A. Two-Year College Strata
.90
.95
.87
.94
.83
.88
.77
.83
.61
.70
.51
.64
.28
.56
.31
.47
0.1
.2.3
.4.5
.6.7
.8.9
1
0.1
.2.3
.4.5
.6.7
.8.9
1
frac
tion e
nro
lled
in
any p
ost
−se
condar
y i
nst
ituti
on
fall
Year 1
spring fall
Year 2
spring fall
Year 3
spring fall
Year 4
spring
years since high school graduation
B. Four-Year College Strata
.96
.99
.94
.99
.90
.96
.87
.94
.85
.91
.82
.90
.74
.88
.69
.82
0.1
.2.3
.4.5
.6.7
.8.9
1
0.1
.2.3
.4.5
.6.7
.8.9
1
frac
tion e
nro
lled
in
any p
ost
−se
condar
y i
nst
ituti
on
fall
Year 1
spring fall
Year 2
spring fall
Year 3
spring fall
Year 4
spring
years since high school graduation
years since high school graduation
STBF Treated Control
Notes: Panel A presents enrollment rates by treatment status for students who targeted two-year colleges. The greyline plots the enrollment rate for control applicants, and the blue line plots the sum of the control mean and strata-adjusted treatment e↵ect for traditional STBF scholarship winners. Whiskers indicate 95 percent confidence intervals.Panel B plots enrollment rates for students who targeted four-year colleges. Samples for each time horizon use datafrom all available applicant cohorts: 2012-2015 for year one; 2012-2014 through year two; 2012-2013 through yearthree; and 2012 only for year four. Fall includes any enrollment that occurs between July 1 and December 31, andspring runs from January 1 through June 30.
23

Figure 2College Enrollment Rates by Race and Parental Education
in the Four-Year College Strata
A. White(68%)
.98
.99
.91
.97
.88
.92
.78
.90
.5.6
.7.8
.91
.5.6
.7.8
.91
frac
tion e
nro
lled
in
any p
ost
−se
condar
y i
nst
ituti
on
fall
Year 1
spring fall
Year 2
spring fall
Year 3
spring fall
Year 4
spring
years since high school graduation
B. Nonwhite(32%)
.94
1.00
.86
.95
.76
.88
.66
.83
.5.6
.7.8
.91
.5.6
.7.8
.91
frac
tion e
nro
lled
in
any p
ost
−se
condar
y i
nst
ituti
on
fall
Year 1
spring fall
Year 2
spring fall
Year 3
spring fall
Year 4
spring
years since high school graduation
C. At Least One ParentEarned a Bachelor’s Degree
(35%)
.98
.99
.92
.97
.90
.93
.84
.93
.5.6
.7.8
.91
.5.6
.7.8
.91
frac
tion e
nro
lled
in
any p
ost
−se
condar
y i
nst
ituti
on
fall
Year 1
spring fall
Year 2
spring fall
Year 3
spring fall
Year 4
spring
years since high school graduation
D. Neither ParentEarned a Bachelor’s Degree
(65%)
.96
.99
.88
.96
.82
.90
.69
.85
.5.6
.7.8
.91
.5.6
.7.8
.91
frac
tion e
nro
lled
in
any p
ost
−se
condar
y i
nst
ituti
on
fall
Year 1
spring fall
Year 2
spring fall
Year 3
spring fall
Year 4
spring
years since high school graduation
years since high school graduation
STBF Treated Control
Notes: These graphs summarize how award e↵ects on enrollment di↵er by race and parental education of scholarship
applicants. Grey lines plot enrollment rates for control applicants, and blue lines plot the sum of control means and
strata-adjusted treatment e↵ects for traditional STBF scholarship o↵ers. Whiskers indicate 95 percent confidence
intervals. Samples vary across time horizons as defined in Figure 1. Roughly 42 percent of white applicants had at
least one parent with a bachelor’s degree, compared with just 19 percent of nonwhite students.
24

Figure 3E↵ects on Year-Two Fall Enrollment by GPA and EFC
in the Four-Year College Strata
A. Any College Enrollmentby GPA
−.1
0.1
.2.3
.4.5
effe
ct o
n y
ear
two f
all
enro
llm
ent
at a
ny p
ost
−se
condar
y i
nst
ituti
on
2.50 2.65 2.80 2.95 3.10 3.25 3.40 3.55 3.70 3.85 4.00
high school GPA
B. Four-Year College Enrollmentby GPA
−.1
0.1
.2.3
.4.5
effe
ct o
n y
ear
two f
all
enro
llm
ent
at f
our−
yea
r in
stit
uti
on
2.50 2.65 2.80 2.95 3.10 3.25 3.40 3.55 3.70 3.85 4.00
high school GPA
C. Any College Enrollmentby EFC
−.1
0.1
.2.3
.4.5
effe
ct o
n y
ear
two f
all
enro
llm
ent
at a
ny p
ost
−se
condar
y i
nst
ituti
on
0 2,000 4,000 6,000 8,000 10,000
EFC ($)
D. Four-Year College Enrollmentby EFC
−.1
0.1
.2.3
.4.5
effe
ct o
n y
ear
two f
all
enro
llm
ent
at f
our−
yea
r in
stit
uti
on
0 2,000 4,000 6,000 8,000 10,000
EFC ($)
Notes: These graphs document how award e↵ects vary with applicants’ high school GPA and Expected FamilyContribution (EFC). The outcome in each panel is year-two fall enrollment. The sample includes applicant cohorts2012-2014. Dots plot treatment e↵ects of traditional STBF scholarship o↵ers for deciles of the given trait. Solid linesplot fitted values from a regression model that estimates the linear interaction between award status and the giventrait. Dotted lines plot 95 percent confidence intervals for the linear fitted values.
25

Figure 4E↵ects on Enrollment in the Four-Year College Strata
by Estimated Propensity to Enroll
A. Year One Fall(N = 4,560)
−.1
0.1
.2.3
.4.5
effe
ct o
n y
ear
one
fall
enro
llm
ent
at a
ny p
ost
−se
condar
y i
nst
ituti
on
0.85 0.90 0.95 1.00
propensity to enroll in year one fall
B. Year Two Fall(N = 3,219)
−.1
0.1
.2.3
.4.5
effe
ct o
n y
ear
two f
all
enro
llm
ent
at a
ny p
ost
−se
condar
y i
nst
ituti
on
0.70 0.75 0.80 0.85 0.90 0.95 1.00
propensity to enroll in year two fall
C. Year Three Fall(N = 2,024)
−.1
0.1
.2.3
.4.5
effe
ct o
n y
ear
thre
e fa
ll e
nro
llm
ent
at a
ny p
ost
−se
condar
y i
nst
ituti
on
0.60 0.70 0.80 0.90 1.00
propensity to enroll in year three fall
D. Year Four Fall(N = 855)
−.1
0.1
.2.3
.4.5
effe
ct o
n y
ear
four
fall
enro
llm
ent
at a
ny p
ost
−se
condar
y i
nst
ituti
on
0.40 0.50 0.60 0.70 0.80 0.90 1.00
propensity to enroll in year four fall
Notes: These graphs summarize how award e↵ects on enrollment vary with applicants’ baseline characteristics. Thehorizontal axis in each plot is propensity to enroll in the given year as a function of gender, race, parental education,EFC, and high school GPA, estimated using the leave-one-out fitted values proposed by Abadie, Chingos and West(2013). Dots plot treatment e↵ect estimates for each decile of expected enrollment, and solid lines plot fitted valuesfrom a regression model that estimates the linear interaction between award status and expected enrollment. Dottedlines plot 95 percent confidence intervals for the linear fitted values. Samples vary across time horizons as defined inFigure 1.
26

Figure 5Comparing Financial Aid E↵ects With and Without Learning Community Services
by Intended University of Nebraska Campus
A. All Campuses
.96
.99
.99
.89
.95
.97
.85
.90
.91
.73
.89
.5.6
.7.8
.91
.5.6
.7.8
.91
frac
tion e
nro
lled
in
any p
ost
−se
condar
y i
nst
ituti
on
fall
Year 1
spring fall
Year 2
spring fall
Year 3
spring fall
Year 4
spring
years since high school graduation
B. Omaha
.93
.98
.98
.85
.91
.96
.79
.84
.91
.57
.84
.5.6
.7.8
.91
.5.6
.7.8
.91
frac
tion e
nro
lled
in
any p
ost
−se
condar
y i
nst
ituti
on
fall
Year 1
spring fall
Year 2
spring fall
Year 3
spring fall
Year 4
spring
years since high school graduation
C. Lincoln
.97
.99 .99
.91
.96
.97
.88
.91
.91
.83
.91
.5.6
.7.8
.91
.5.6
.7.8
.91
frac
tion e
nro
lled
in
any p
ost
−se
condar
y i
nst
ituti
on
fall
Year 1
spring fall
Year 2
spring fall
Year 3
spring fall
Year 4
spring
years since high school graduation
D. Kearney
.98
1.00
.99
.90
.97
.95
.90
.97
.93
.81
.94
.5.6
.7.8
.91
.5.6
.7.8
.91
frac
tion e
nro
lled
in
any p
ost
−se
condar
y i
nst
ituti
on
fall
Year 1
spring fall
Year 2
spring fall
Year 3
spring fall
Year 4
spring
years since high school graduation
STBF Treated COS Treated Control
Notes: These graphs compare STBF and COS award e↵ects for applicants who targeted University of Nebraskacampuses. Panel A pools all NU randomized applicants, and Panels B-D disaggregate results by target campus.Grey lines plot enrollment rates for control applicants, blue lines plot the sum of control means and strata-adjustedtreatment e↵ects for traditional STBF scholarship o↵ers, and red lines plot corresponding e↵ects for aid-only COSawards. Whiskers indicate 95 percent confidence intervals. Samples vary across time horizons as defined in Figure 1.COS awards were introduced in the second study cohort, so data on COS award winners are only available throughyear three.
27

Figure 6Comparing Financial Aid E↵ects With and Without Learning Community Services
by High School GPA
A. GPA � 3.5(above sample median)
.97
1.00
.99
.95
.98
.98
.92
.95
.95
.84
.96
.5.6
.7.8
.91
.5.6
.7.8
.91
frac
tion e
nro
lled
in
any p
ost
−se
condar
y i
nst
ituti
on
fall
Year 1
spring fall
Year 2
spring fall
Year 3
spring fall
Year 4
spring
years since high school graduation
B. GPA < 3.5(below sample median)
.95
.98
.99
.83
.91
.95
.77
.80
.86
.62
.81
.5.6
.7.8
.91
.5.6
.7.8
.91
frac
tion e
nro
lled
in
any p
ost
−se
condar
y i
nst
ituti
on
fall
Year 1
spring fall
Year 2
spring fall
Year 3
spring fall
Year 4
spring
years since high school graduation
STBF Treated COS Treated Control
Notes: These graphs compare STBF and COS award e↵ects by high school GPA for applicants who targeted Universityof Nebraska campuses. Grey lines plot enrollment rates for control applicants, blue lines plot the sum of control meansand strata-adjusted treatment e↵ects for traditional STBF scholarship o↵ers, and red lines plot corresponding e↵ectsfor aid-only COS awards. Whiskers indicate 95 percent confidence intervals. Samples vary across time horizons asspecified in Figure 1. COS awards were introduced in the second study cohort, so data on COS award winners areonly available through year three.
28

Figure 7Projecting Award E↵ects on Bachelor’s Degree Completion
in the Four-Year College Strata
A. Unweighted Estimates
−.1
5−
.1−
.05
0.0
5.1
.15
ST
BF
eff
ect
on b
achel
or’
s deg
ree
com
ple
tion f
or
awar
d w
inner
s
fall
Year 1
spring fall
Year 2
spring fall
Year 3
spring fall
Year 4
spring fall
Year 5
spring
years since high school graduation
Experimental Estimate(2012)
Non−Experimental Estimate(2011)
B. Reweighted Projections
−.1
5−
.1−
.05
0.0
5.1
.15
ST
BF
eff
ect
on b
achel
or’
s deg
ree
com
ple
tion f
or
awar
d w
inner
s
fall
Year 1
spring fall
Year 2
spring fall
Year 3
spring fall
Year 4
spring fall
Year 5
spring
years since high school graduation
Experimental Estimate(2012)
Experimental Projection
Notes: The light green lines plot estimated e↵ects of award o↵ers on bachelor’s degree completion in the four-yearcollege strata for the 2012 experimental cohort. The dark green line in Panel A presents corresponding estimatesfrom the 2011 non-experimental cohort, the last application cohort before the experiment began. The estimates inPanel A control for target college, high school GPA, EFC, gender, race, and parental education using Kline’s (2011)Oaxaca-Blinder procedure. In Panel B, we project graduation rates for the experimental sample by reweighting thenon-experimental Kline estimates using the distribution of covariates in the experimental sample. Whiskers indicate95 percent confidence intervals.
29
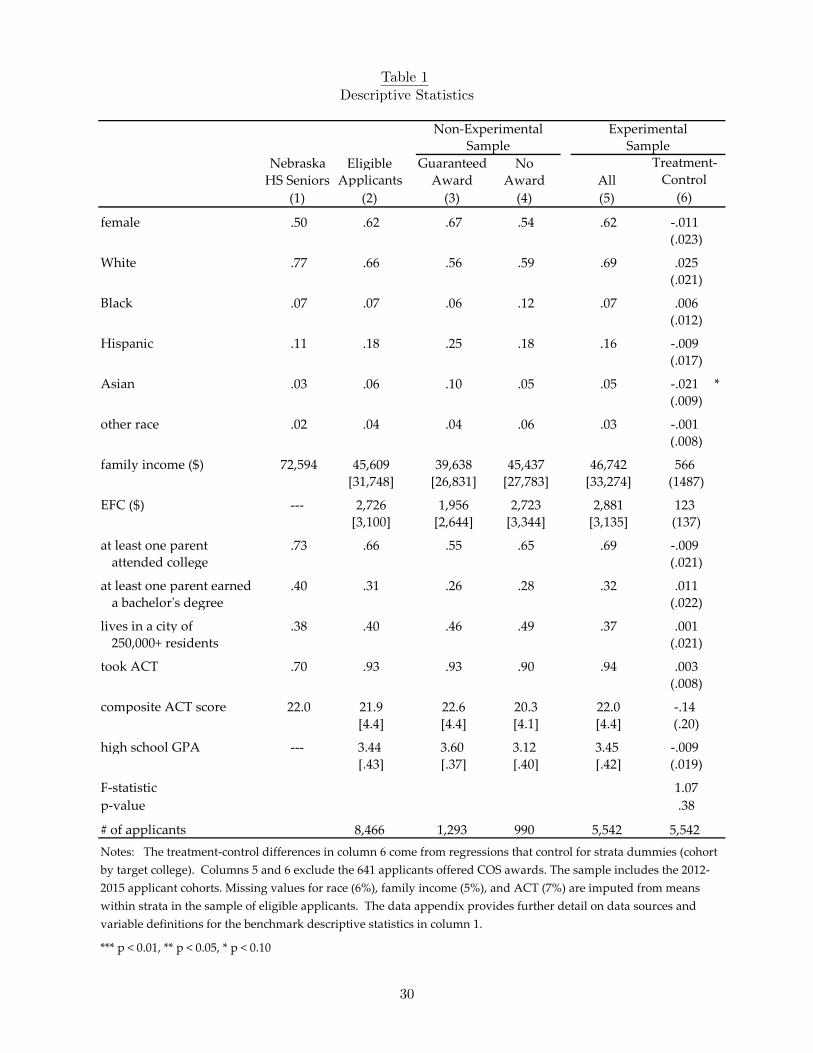
Table 1Descriptive Statistics
Nebraska Eligible Guaranteed No
HS Seniors Applicants Award Award All
(1) (2) (3) (4) (5)
female .50 .62 .67 .54 .62 -.011
(.023)
White .77 .66 .56 .59 .69 .025
(.021)
Black .07 .07 .06 .12 .07 .006
(.012)
Hispanic .11 .18 .25 .18 .16 -.009
(.017)
Asian .03 .06 .10 .05 .05 -.021 *
(.009)
other race .02 .04 .04 .06 .03 -.001
(.008)
family income ($) 72,594 45,609 39,638 45,437 46,742 566
[31,748] [26,831] [27,783] [33,274] (1487)
EFC ($) --- 2,726 1,956 2,723 2,881 123
[3,100] [2,644] [3,344] [3,135] (137)
at least one parent .73 .66 .55 .65 .69 -.009
attended college (.021)
at least one parent earned .40 .31 .26 .28 .32 .011
a bachelor's degree (.022)
lives in a city of .38 .40 .46 .49 .37 .001
250,000+ residents (.021)
took ACT .70 .93 .93 .90 .94 .003
(.008)
composite ACT score 22.0 21.9 22.6 20.3 22.0 -.14
[4.4] [4.4] [4.1] [4.4] (.20)
high school GPA --- 3.44 3.60 3.12 3.45 -.009
[.43] [.37] [.40] [.42] (.019)
F-statistic 1.07
p-value .38
# of applicants 8,466 1,293 990 5,542 5,542
(6)
Notes: The treatment-control differences in column 6 come from regressions that control for strata dummies (cohort
by target college). Columns 5 and 6 exclude the 641 applicants offered COS awards. The sample includes the 2012-
2015 applicant cohorts. Missing values for race (6%), family income (5%), and ACT (7%) are imputed from means
within strata in the sample of eligible applicants. The data appendix provides further detail on data sources and
variable definitions for the benchmark descriptive statistics in column 1.
*** p < 0.01, ** p < 0.05, * p < 0.10
Non-Experimental
Sample
Treatment-
Control
Experimental
Sample
30

Table 2E↵ects on Year One Financial Aid Packages
for Nebraska Public College Students
Control
Mean
(1)
16,987 1,499 *** 1,516 *** 84 .29 *** .01
(187) (184) (125) (.02) (.02)
12,344 3,497 *** 3,498 *** 2,287 *** .51 *** .28 ***
(197) (189) (159) (.02) (.02)
7,792 6,209 *** 6,204 *** 5,374 *** .85 *** .71 ***
(178) (160) (145) (.02) (.02)
3,378 67 58 -165 ** .02 ** -.02 **
(108) (73) (70) (.01) (.01)
3,508 -790 *** -788 *** -1,132 *** -.13 *** -.21 ***
(126) (121) (122) (.02) (.02)
0 7,156 *** 7,159 *** 6,985 *** 1.00 *** 1.00 ***
(63) (63) (64) (.00) (.00)
906 -161 *** -162 *** -244 *** -.03 *** -.04 ***
(58) (57) (58) (.01) (.01)
3,721 -2,292 *** -2,281 *** -2,574 *** -.29 *** -.36 ***
(122) (117) (121) (.02) (.02)
2,008 -1,497 *** -1,495 *** -1,653 *** -.19 *** -.23 ***
(56) (56) (58) (.01) (.01)
1,713 -795 *** -786 *** -921 *** -.10 *** -.13 ***
(91) (86) (89) (.01) (.01)
831 -419 *** -426 *** -513 *** -.05 *** -.07 ***
(36) (36) (37) (.00) (.01)
baseline covariates no yes yes yes yes
campus controls no no yes no yes
# of applicants 1,765 3,063 3,063 3,063 3,063 3,063
Strata Covariate Covariate
Per Award Per Dollar Awarded
STBF Effect STBF Effect
Campus Campus
*** p < 0.01, ** p < 0.05, * p < 0.10
Adjusted
(2) (3)
Adjusted Adjusted
(5)
Adjusted
government grants
cost of attendance
total aid
institutional grants
Federal Work Study
STBF grant
other private grants
total government loans
total grants
Adjusted
(4) (6)
Notes: This table reports effects of STBF scholarship offers on students' financial aid packages. The sample is
restricted to students in the 2012-2014 applicant cohorts enrolled in Nebraska public colleges. Aid data are currently
unavailable for the 519 students at state colleges and Mid-Plains Community College. Columns 2-4 report results
from regressions of the financial aid awarded in each category on a dummy for winning a scholarship, while columns
5 and 6 report results from regressions of the same dependent variables on the dollar value of STBF scholarships
awarded. The baseline covariates in columns 3-6 are GPA, EFC, gender, race, and parental education. Columns 4 and
6 also control for cumulative enrollment at each campus. Government grants include federal and state grants.
Subsidized government loans are the sum of Perkins and subsidized Stafford loans; unsubsidized government loans
are the sum of PLUS and unsubsidized Stafford loans.
subsidized govt. loans
unsubsidized govt. loans
31
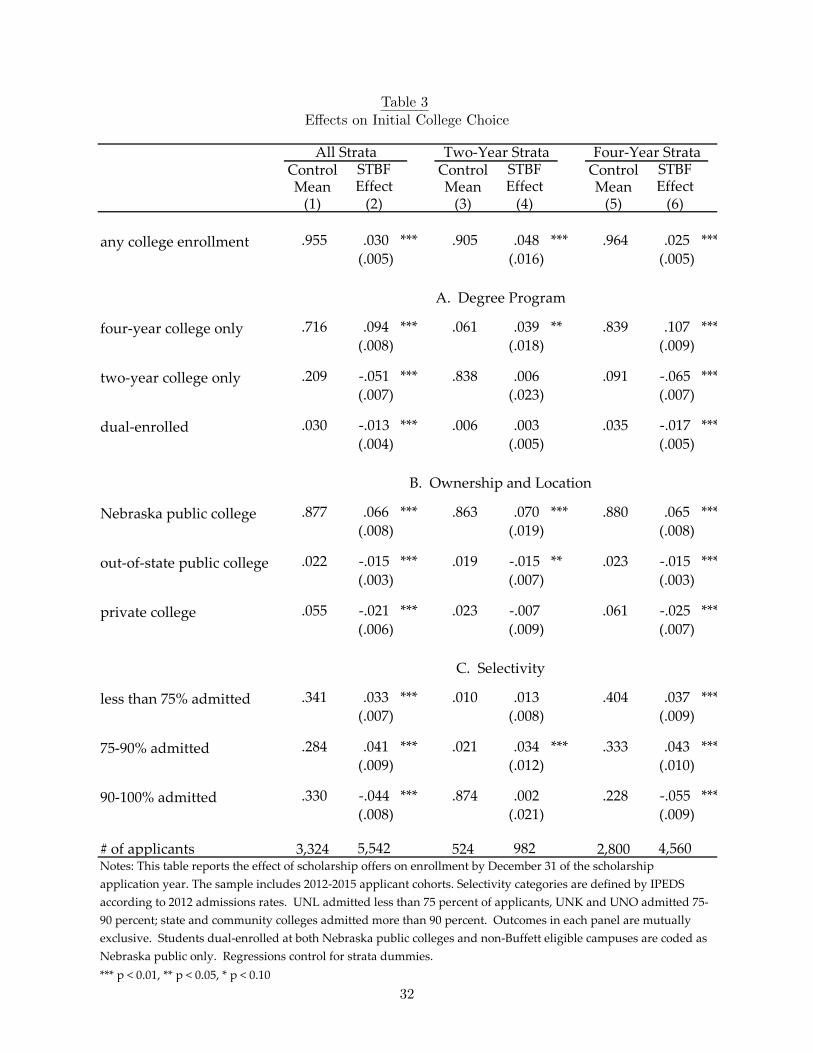
Table 3E↵ects on Initial College Choice
Control Control ControlMean Mean Mean
(1) (2) (3) (4) (5) (6)
.955 .030 *** .905 .048 *** .964 .025 ***
(.005) (.016) (.005)
.716 .094 *** .061 .039 ** .839 .107 ***
(.008) (.018) (.009)
.209 -.051 *** .838 .006 .091 -.065 ***
(.007) (.023) (.007)
.030 -.013 *** .006 .003 .035 -.017 ***
(.004) (.005) (.005)
.877 .066 *** .863 .070 *** .880 .065 ***
(.008) (.019) (.008)
.022 -.015 *** .019 -.015 ** .023 -.015 ***
(.003) (.007) (.003)
.055 -.021 *** .023 -.007 .061 -.025 ***
(.006) (.009) (.007)
.341 .033 *** .010 .013 .404 .037 ***
(.007) (.008) (.009)
.284 .041 *** .021 .034 *** .333 .043 ***
(.009) (.012) (.010)
.330 -.044 *** .874 .002 .228 -.055 ***
(.008) (.021) (.009)
# of applicants 3,324 524 2,800
C. Selectivity
B. Ownership and Location
A. Degree Program
Effect Effect Effect
All Strata Two-Year Strata Four-Year StrataSTBF STBF STBF
*** p < 0.01, ** p < 0.05, * p < 0.10
Notes: This table reports the effect of scholarship offers on enrollment by December 31 of the scholarship
application year. The sample includes 2012-2015 applicant cohorts. Selectivity categories are defined by IPEDS
according to 2012 admissions rates. UNL admitted less than 75 percent of applicants, UNK and UNO admitted 75-
90 percent; state and community colleges admitted more than 90 percent. Outcomes in each panel are mutually
exclusive. Students dual-enrolled at both Nebraska public colleges and non-Buffett eligible campuses are coded as
Nebraska public only. Regressions control for strata dummies.
5,542 982 4,560
90-100% admitted
any college enrollment
four-year college only
two-year college only
Nebraska public college
out-of-state public college
dual-enrolled
less than 75% admitted
75-90% admitted
private college
32

Tab
le4
E↵ects
onEnrollmentan
dDegreeStatus
intheTwo-YearCollege
Strata
Con
trol
Con
trol
Con
trol
Con
trol
Mea
nM
ean
Mea
nM
ean
(1)
(2)
(3)
(4)
(5)
(6)
(7)
(8)
enro
lled
any
whe
re.9
05 .0
48**
*.8
31 .0
51.6
05 .0
93.2
82 .2
80**
* (.
016)
(.02
7) (.
050)
(.08
0)
at a
two-
year
col
lege
.838
.006
.703
-.032
.318
.010
.085
.064
and
no
deg
ree
(.02
3) (.
036)
(.04
7) (.
054)
at a
four
-yea
r co
llege
.0
67 .0
43.0
71 .0
84**
*.1
03 .0
53.0
85 .1
20**
and
no
deg
ree
(.01
8) (.
025)
(.03
5) (.
058)
at tw
o-ye
ar c
olle
ge
.054
.002
.060
-.037
**.0
14 .0
28an
d a
ssoc
iate
's d
egre
e (.
015)
(.01
9) (.
027)
at fo
ur-y
ear
colle
ge
.003
-.003
.124
.067
.099
.068
and
ass
ocia
te's
deg
ree
(.00
3) (.
036)
(.05
6)
not e
nrol
led
.095
-.048
***
.169
-.051
.395
-.093
.718
-.280
***
(.01
6) (.
027)
(.05
0) (.
080)
and
no
deg
ree
.095
-.048
***
.163
-.050
.245
-.032
.324
-.054
(.01
6) (.
026)
(.04
3) (.
074)
and
ass
ocia
te's
deg
ree
.005
-.001
.150
-.061
.380
-.212
***
(.00
5) (.
034)
(.07
0)
and
bac
helo
r's
deg
ree
.014
-.014
(.01
4)
# of
ap
plic
ants
524
367
233
7114
4
***
p <
0.0
1, *
* p
< 0
.05,
* p
< 0
.10
Not
es:
Eac
h fa
ll en
rollm
ent p
erio
d r
uns
from
July
1 to
Dec
embe
r 31
wit
h d
egre
e st
atu
s m
easu
red
on
July
1. S
amp
les
vary
acr
oss
tim
e ho
rizo
ns, a
s d
escr
ibed
in F
igu
re 1
. T
hese
ou
tcom
es p
arti
tion
the
sam
ple
in e
ach
per
iod
; stu
den
ts w
ho d
ual
-enr
olle
d in
bot
h tw
o an
d fo
ur-
year
col
lege
s d
uri
ng th
e sa
me
per
iod
are
cod
ed a
s at
tend
ing
fou
r-ye
ar c
olle
ges
only
. St
ud
ents
who
ear
ned
bot
h as
soci
ate'
s an
d b
ache
lor'
s d
egre
es a
re c
oded
as
bach
elor
's d
egre
e ho
lder
s.
Reg
ress
ions
con
trol
for
stra
ta d
um
mie
s.
Yea
r O
ne F
all
Yea
r T
wo
Fall
Yea
r T
hree
Fal
lY
ear
Four
Fal
lST
BF
STB
FST
BF
STB
FE
ffec
tE
ffec
t
982
---
---
666
395
Eff
ect
Eff
ect
**
**
---
---
---
---
* ***
33

Tab
le5
E↵ects
onEnrollmentan
dDegreeStatus
intheFou
r-YearCollege
Strata
Co
ntr
ol
Co
ntr
ol
Co
ntr
ol
Co
ntr
ol
Mea
nM
ean
Mea
nM
ean
(1)
(2)
(3)
(4)
(5)
(6)
(7)
(8)
enro
lled
an
yw
her
e.9
64 .0
25**
*.8
96 .0
67**
*.8
49 .0
65**
*.7
38 .1
38**
*
(.0
05)
(.0
09)
(.0
15)
(.0
26)
at a
tw
o-y
ear
coll
ege
.091
-.06
5**
*.1
29-.
067
***
.116
-.04
9**
*.0
75-.
015
and
no
deg
ree
(.0
07)
(.0
11)
(.0
13)
(.0
17)
at a
fo
ur-
yea
r co
lleg
e .8
73 .0
90**
*.7
66 .1
34**
*.7
20 .1
24**
*.6
39 .1
64**
*
and
no
deg
ree
(.0
08)
(.0
13)
(.0
19)
(.0
30)
at a
ny
co
lleg
e.0
00 .0
00.0
01-.
000
.012
-.00
8.0
21-.
007
and
ass
oci
ate'
s d
egre
e (
.001
) (
.001
) (
.004
) (
.009
)
at a
ny
co
lleg
e.0
01-.
001
.002
-.00
2
and
bac
hel
or'
s d
egre
e (
.001
) (
.002
)
no
t en
roll
ed.0
36-.
025
***
.104
-.06
7**
*.1
51-.
065
***
.262
-.13
8**
*
(.0
05)
(.0
09)
(.0
15)
(.0
26)
and
no
deg
ree
.036
-.02
5**
*.1
04-.
067
***
.148
-.06
8**
*.2
29-.
110
***
(.0
05)
(.0
09)
(.0
15)
(.0
25)
and
ass
oci
ate'
s d
egre
e.0
03 .0
02.0
21-.
019
**
(.0
03)
(.0
07)
and
bac
hel
or'
s d
egre
e.0
12-.
009
(.0
06)
# o
f ap
pli
can
ts2,
800
1,92
41,
198
424
Yea
r O
ne
Fal
lY
ear
Tw
o F
all
Yea
r T
hre
e F
all
Yea
r F
ou
r F
all
ST
BF
ST
BF
ST
BF
ST
BF
Eff
ect
Eff
ect
Eff
ect
Eff
ect
855
---
---
**
No
tes:
Eac
h f
all
enro
llm
ent
per
iod
ru
ns
fro
m J
uly
1 t
o D
ecem
ber
31
wit
h d
egre
e st
atu
s m
easu
red
on
Ju
ly 1
. Sam
ple
s v
ary
acr
oss
tim
e h
ori
zon
s, a
s d
escr
ibed
in F
igu
re 1
. T
hes
e o
utc
om
es p
arti
tio
n t
he
sam
ple
in
eac
h p
erio
d; s
tud
ents
wh
o d
ual
-en
roll
ed i
n b
oth
tw
o a
nd
fo
ur-
yea
r co
lleg
es d
uri
ng
th
e sa
me
per
iod
are
cod
ed a
s at
ten
din
g f
ou
r-y
ear
coll
eges
on
ly.
Stu
den
ts w
ho
ear
ned
bo
th a
sso
ciat
e's
and
bac
hel
or'
s d
egre
es a
re c
od
ed a
s b
ach
elo
r's
deg
ree
ho
lder
s.
Reg
ress
ion
s co
ntr
ol
for
stra
ta d
um
mie
s.
***
p <
0.0
1, *
* p
< 0
.05,
* p
< 0
.10
---
---
---
4,56
03,
219
2,02
4
---
---
34

Table 6E↵ects on Degree Completion by the End of Year Four
(1) (2) (3) (4)
bachelor's degree earned .056 .054 .281 -.059 **
(.047) (.029)
associate's degree earned .521 -.119 .050 -.024 *
(.079) (.013)
enrolled at four-year college .099 .040 .019 -.005
(.053) (.009)
no degree earned .423 .065 .670 .083 ***
(.078) (.030)
enrolled at four-year college .056 .038 .370 .188 ***
(.044) (.033)
# of applicants 71 144 424 855
*** p < 0.01, ** p < 0.05, * p < 0.10
Notes: This table reports effects on degree completion by the end of year four for the 2012 applicant
cohort. Students who earned both associate's and bachelor's degrees are coded as bachelor's degree
holders. Regressions control for strata dummies.
Two-Year Strata Four-Year Strata
Control
Mean
STBF
Effect
Control
Mean
STBF
Effect
35

8 Data Appendix
Application Data
The STBF scholarship application provides detailed data on applicants’ baseline characteristics.
The academic measures come primarily from high school transcripts, which report GPA and ACT
scores. We standardize GPAs to a 4.0 scale using grade conversion formulae provided by the
University of Nebraska-Lincoln. Since not all high schools report ACT scores on their transcripts,
we supplement transcript data with self-reported scores from the scholarship application for 50
percent of the experimental sample.
Most of our financial and demographic data come from applicants’ Student Aid Reports (SARs).
These reports are available for STBF applicants who filed the Free Application for Federal Student
Aid (FAFSA). SARs contain responses to more than 100 FAFSA questions regarding students’
financial resources and family structure, including family income, parental marital status, and
education. Roughly three percent of scholarship applicants are undocumented immigrants, who are
ineligible for federal financial aid and therefore cannot file the FAFSA. STBF permits these students
to submit an alternate form called the College Funding Estimator (CFE). The CFE is published by
the EducationQuest Foundation, a non-profit organization in Nebraska, and gathers similar though
less detailed information.
Neither SARs nor CFEs report students’ race, and the scholarship application did not collect
this variable until 2014. We obtained race data for all cohorts from the Nebraska Department of
Motor Vehicles (DMV). After combining the DMV and self-reported data, we observe race for 89
percent of randomized applicants before 2014 and over 99 percent from 2014 onward. We impute
race where missing using means within application strata.
Enrollment Data
More than 90 percent of experimental subjects enrolled in Nebraska public colleges, which
provide administrative records for this research. We match applicants to these data using name,
gender, date of birth, and the last four digits of Social Security Numbers. To measure enrollment
at out-of-state and private institutions, we match applicants to National Student Clearinghouse
36

(NSC) data using name and date of birth. Though the NSC captures more than 91 percent of
enrollment nationwide (and more than 99 percent at four-year public institutions), its name-based
match has limitations, as Dynarski, Hemelt and Hyman (2015) detail. Roughly two percent of
experimental applicants have enrollment spells at Nebraska public colleges that do not appear in
our NSC-matched sample.
We define post-award years to match the federal financial aid year, which runs from July 1 to
June 30, and divide each year into fall and spring halves. Within each fall and spring term, we
require binary enrollment outcomes to be mutually exclusive. Students who enroll at both two- and
four-year institutions are coded as four-year college students. Likewise, those who enroll at in-state
public colleges do not contribute to the out-of-state or private categories, and selectivity outcomes
are defined by the most-selective institution attended.
Financial Aid Data
Nebraska’s public colleges also provide detailed information on their students’ financial aid
packages, which we analyze in Table 2. These data report costs of attendance, grants, loans, and
Federal Work Study aid. While all schools report federal loans, most do not report private loans,
which may be obtained directly from lenders without involving financial aid o�cers. We therefore
exclude private loans from our analysis. For most students in our sample, federal loans o↵er the
lowest available interest rate and therefore account for the vast majority of borrowing.
Other Descriptive Statistics
Table 1 compares STBF applicants to the broader population of Nebraska high school seniors.
We estimate the race and sex composition of Nebraska seniors using 18-year-old Nebraskans in the
2012 sample of the Surveillance, Epidemiology, and End Results population data (SEER, 2015).
Parental education and family income figures come from 12th-grade Nebraska residents in the 2012
wave of the American Community Survey (U.S. Census Bureau 2014). There are two Nebraska
cities with more than 250,000 residents: Lincoln and Omaha. We estimate the share of high school
seniors who live in Lincoln and Omaha using enrollment figures from the Common Core of Data
and Private School Survey (US DOE, 2010a; 2010b). ACT provides data on Nebraska test takers
(ACT 2012).
37

Figure A1E↵ects on Year-Two Fall Enrollment by ACT and Family Income
in the Four-Year College Strata
A. Any College Enrollmentby ACT
−.1
0.1
.2.3
.4.5
effe
ct o
n y
ear
two f
all
enro
llm
ent
at a
ny p
ost
−se
condar
y i
nst
ituti
on
0 10 20 30 40 50 60 70 80 90 100
percentile of ACT composite score
B. Four-Year College Enrollmentby ACT
−.1
0.1
.2.3
.4.5
effe
ct o
n y
ear
two f
all
enro
llm
ent
at f
our−
yea
r in
stit
uti
on
0 10 20 30 40 50 60 70 80 90 100
percentile of ACT composite score
C. Any College Enrollmentby Family Income
−.1
0.1
.2.3
.4.5
effe
ct o
n y
ear
two f
all
enro
llm
ent
at a
ny p
ost
−se
condar
y i
nst
ituti
on
0 20,000 40,000 60,000 80,000 100,000
family income ($)
D. Four-Year College Enrollmentby Family Income
−.1
0.1
.2.3
.4.5
effe
ct o
n y
ear
two f
all
enro
llm
ent
at f
our−
yea
r in
stit
uti
on
0 20,000 40,000 60,000 80,000 100,000
family income ($)
Bin-Specific Effect Linear Effect
Notes: These graphs document how award e↵ects vary with ACT composite score and family income. The outcomein each panel is year-two fall enrollment. The sample includes applicant cohorts 2012-2014. Dots plot treatmente↵ects of traditional STBF scholarship o↵ers for deciles of the given trait. Solid lines plot fitted values from regressionmodels that estimate the linear interaction between award status and the given trait. Dotted lines plot 95 percentconfidence intervals for the linear fitted values. ACT scores have been converted to percentiles in the distribution ofNebraska ACT test takers.
38
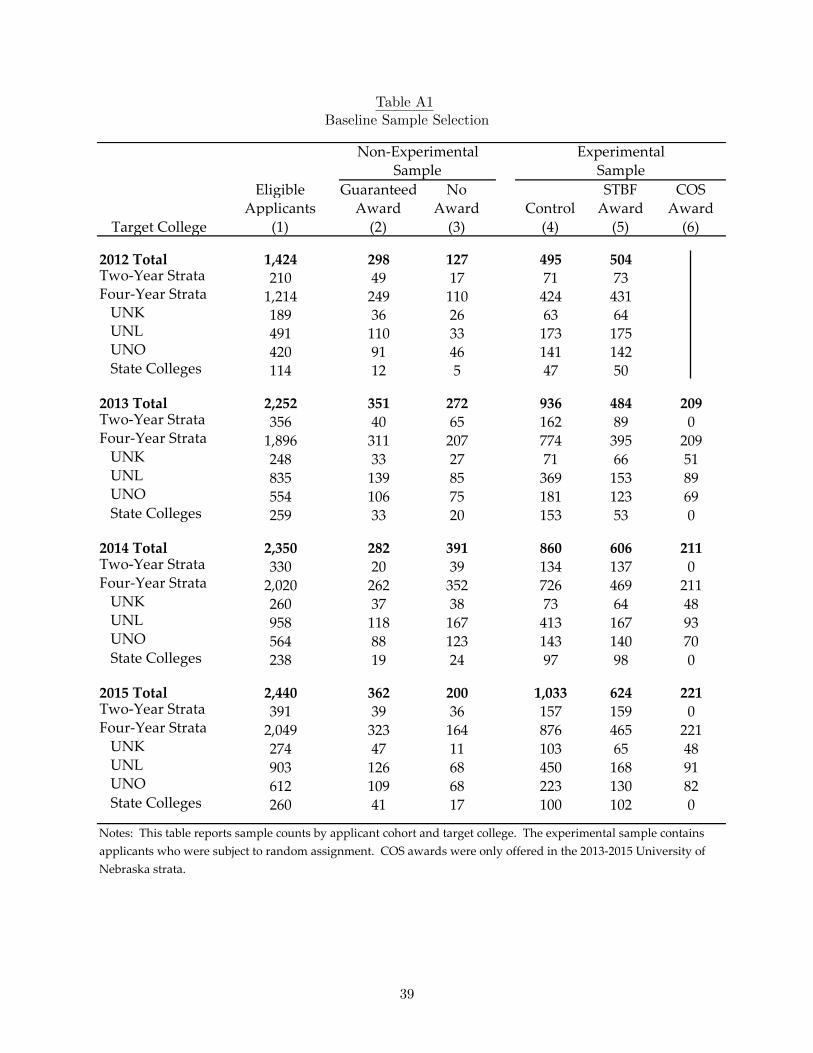
Table A1Baseline Sample Selection
Eligible Guaranteed No STBF COSApplicants Award Award Control Award Award
Target College (1) (2) (3) (4) (5) (6)
2012 Total 1,424 298 127 495 504Two-Year Strata 210 49 17 71 73Four-Year Strata 1,214 249 110 424 431
UNK 189 36 26 63 64UNL 491 110 33 173 175UNO 420 91 46 141 142State Colleges 114 12 5 47 50
2013 Total 2,252 351 272 936 484 209Two-Year Strata 356 40 65 162 89 0Four-Year Strata 1,896 311 207 774 395 209
UNK 248 33 27 71 66 51UNL 835 139 85 369 153 89UNO 554 106 75 181 123 69State Colleges 259 33 20 153 53 0
2014 Total 2,350 282 391 860 606 211Two-Year Strata 330 20 39 134 137 0Four-Year Strata 2,020 262 352 726 469 211
UNK 260 37 38 73 64 48UNL 958 118 167 413 167 93UNO 564 88 123 143 140 70State Colleges 238 19 24 97 98 0
2015 Total 2,440 362 200 1,033 624 221Two-Year Strata 391 39 36 157 159 0Four-Year Strata 2,049 323 164 876 465 221
UNK 274 47 11 103 65 48UNL 903 126 68 450 168 91UNO 612 109 68 223 130 82State Colleges 260 41 17 100 102 0
Notes: This table reports sample counts by applicant cohort and target college. The experimental sample contains applicants who were subject to random assignment. COS awards were only offered in the 2013-2015 University of Nebraska strata.
Non-Experimental ExperimentalSample Sample
39

Table A2Outcomes Sample Construction
STBF COS STBF COS
Control Award Award Sample Sample
Sample (1) (2) (3) (4) (5)
Year One Total 3,324 2,218 641 5,542 4,501Two-Year Strata 524 458 0 982 0Four-Year Strata 2,800 1,760 641 4,560 4,501
UNK 310 259 147 569 716UNL 1,405 663 273 2,068 2,341UNO 688 535 221 1,223 1,444State Colleges 397 303 0 700 0
Year Two Total 2,291 1,594 420 3,885 3,141Two-Year Strata 367 299 0 666 0Four-Year Strata 1,924 1,295 420 3,219 3,141
UNK 207 194 99 401 500UNL 955 495 182 1,450 1,632UNO 465 405 139 870 1,009State Colleges 297 201 0 498 0
Year Three Total 1,431 988 209 2,419 1,930Two-Year Strata 233 162 0 395 0Four-Year Strata 1,198 826 209 2,024 1,930
UNK 134 130 51 264 315UNL 542 328 89 870 959UNO 322 265 69 587 656State Colleges 200 103 0 303 0
Year Four Total 495 504 999Two-Year Strata 71 73 144Four-Year Strata 424 431 855
UNK 63 64 127UNL 173 175 348UNO 141 142 283State Colleges 47 50 97
Notes: This table reports sample counts for each enrollment time horizon. Each sample draws on data
from available applicant cohorts: 2012-2015 for year one; 2012-2014 through year two; 2013-2014
through year three; and 2012 only for year four. Column 4 describes the primary analysis sample,
which includes control applicants and STBF award winners. Column 5 includes control applicants,
STBF recipients, and COS award winners from the University of Nebraska strata. COS awards were
not offered in 2012, so year four outcomes in the COS sample are not yet available.
Total
40

Tab
leA3
Descriptive
Statisticsby
TargetCollege
All
A
ll
All
A
ll
All
(1)
(3)
(5)
(7)
(9)
fem
ale
.61
.040
.57
.030
.64
.016
.69
.007
.67
-.01
1
(.0
31)
(.0
24)
(.0
28)
(.0
39)
(.0
37)
Wh
ite
.72
.040
.70
-.00
9.4
9-.
004
.80
.031
.87
.045
*
(.0
27)
(.0
21)
(.0
28)
(.0
32)
(.0
25)
Bla
ck.0
3 .0
03.0
8-.
000
.11
.001
.01
-.02
0**
.03
-.00
4
(.0
10)
(.0
13)
(.0
18)
(.0
10)
(.0
13)
His
pan
ic.1
7-.
013
.13
.012
.27
.020
.16
.009
.07
-.01
4
(.0
24)
(.0
16)
(.0
25)
(.0
30)
(.0
18)
oth
er r
ace
.09
-.03
0.0
9-.
002
.13
-.01
7.0
2-.
020
**.0
4-.
027
(
.017
) (
.014
) (
.019
) (
.011
) (
.014
)
fam
ily
in
com
e ($
) 4
3,53
527
6 4
8,64
3-1
67 4
3,71
137
6 5
0,34
1-1
67 4
7,99
73,
664
[31
,646
] (
2,09
8) [
33,9
80]
(1,
693)
[26
,915
] (
1,52
5) [
43,9
60]
(3,
638)
[32
,660
] (
2,54
5)
at l
east
on
e p
aren
t.6
0 .0
37.7
5-.
006
.59
-.02
1.7
3 .0
01.7
6 .0
24at
ten
ded
co
lleg
e (
.031
) (
.021
) (
.029
) (
.037
) (
.034
)
at l
east
on
e p
aren
t ea
rned
.19
.037
.40
-.02
4.2
6 .0
11.3
4 .0
00.3
5-.
016
a b
ach
elo
r's
deg
ree
(.0
25)
(.0
23)
(.0
26)
(.0
40)
(.0
37)
too
k A
CT
.80
.025
.98
-.00
2 .9
5-.
005
.98
-.00
0 .9
7 .0
08
(.0
26)
(.0
08)
(.0
13)
(.0
13)
(.0
11)
com
po
site
AC
T s
core
19.1
.32
23.8
-.18
21.2
-.34
22.3
-.35
21.7
-.03
[3.
4] (
.21)
[4.
2] (
.20)
[4.
6] (
.26)
[3.
8] (
.32)
[3
.9]
(.3
0)
hig
h s
cho
ol
GP
A3.
28 .0
52**
3.57
-.01
23.
34-.
020
3.57
.048
3.47
.012
[.4
1] (
.026
) [
.39]
(.0
19)
[.4
1] (
.023
) [
.40]
(.0
33)
[.4
2] (
.033
)
F-s
tati
stic
1.00
.68
.50
1.44
.78
p-v
alu
e.4
4.7
5.8
9.1
6.6
5
# o
f ap
pli
can
ts98
298
22,
068
2,06
81,
223
1,22
356
956
970
070
0
Fo
ur-
Yea
r S
trat
a
UN
KT
reat
men
t
- C
on
tro
l
Tre
atm
ent
- C
on
tro
l -
Co
ntr
ol
UN
OT
reat
men
t
- C
on
tro
l
(8)
***
p <
0.0
1, *
* p
< 0
.05,
* p
< 0
.10
UN
LT
reat
men
t
(2)
(4)
(6)
No
tes:
T
his
tab
le r
epo
rts
des
crip
tiv
e st
atis
tics
by
tar
get
co
lleg
e, p
oo
lin
g a
ll f
ou
r co
ho
rts.
Tab
le 1
det
ails
var
iab
le d
efin
itio
ns
and
sp
ecif
icat
ion
s.
Sta
te C
oll
eges
Tre
atm
ent
- C
on
tro
l
(10)
Tw
o-Y
ear
Str
ata
41
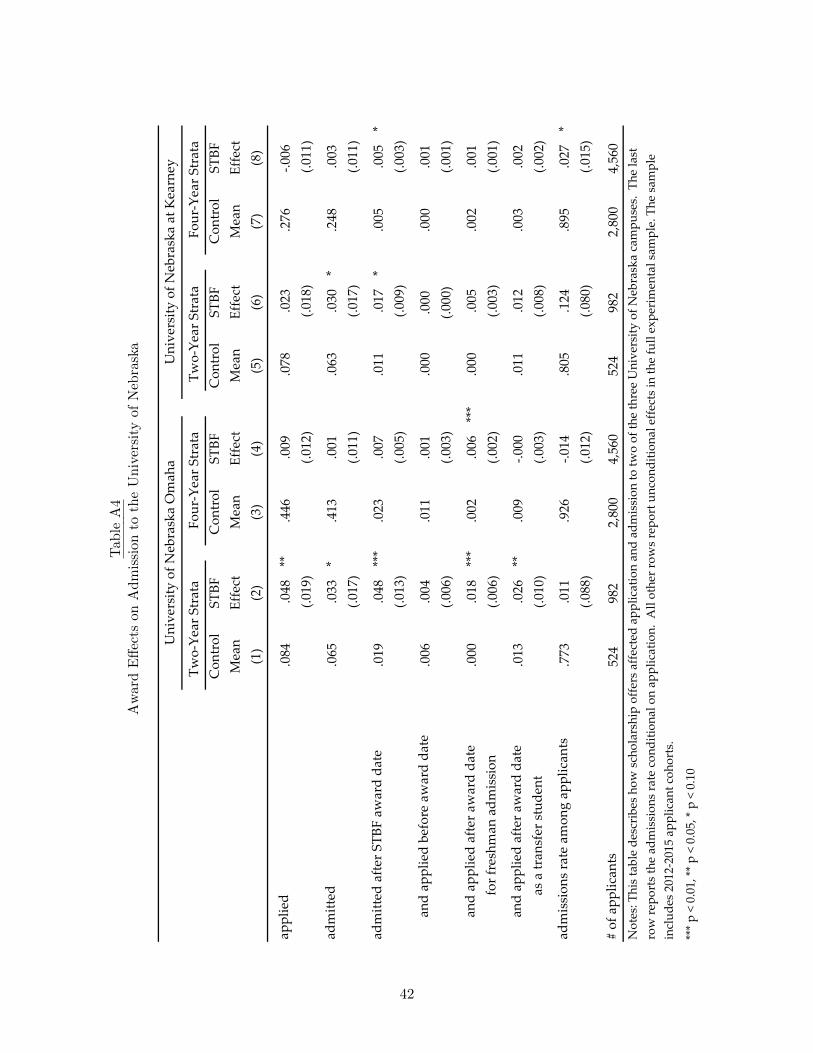
Tab
leA4
AwardE↵ects
onAdmission
totheUniversity
ofNebraska
Con
trol
STBF
Con
trol
STBF
Con
trol
STBF
Con
trol
STBF
Mea
nEf
fect
Mea
nEf
fect
Mea
nEf
fect
Mea
nEf
fect
(1)
(2)
(3)
(4)
(5)
(6)
(7)
(8)
appl
ied
.084
.048
.446
.009
.078
.023
.276
-.006
(.01
9) (.
012)
(.01
8) (.
011)
adm
itted
.065
.033
.413
.001
.063
.030
.248
.003
(.01
7) (.
011)
(.01
7) (.
011)
adm
itted
aft
er S
TBF
awar
d da
te .0
19 .0
48 .0
23 .0
07 .0
11 .0
17 .0
05 .0
05 (.
013)
(.00
5) (.
009)
(.00
3)
and
appl
ied
befo
re a
war
d da
te .0
06 .0
04 .0
11 .0
01 .0
00.0
00 .0
00 .0
01 (.
006)
(.00
3)(.0
00)
(.00
1)
and
appl
ied
afte
r aw
ard
date
.000
.018
.002
.006
.000
.005
.002
.001
for
fres
hman
adm
issi
on (.
006)
(.00
2) (.
003)
(.00
1)
and
appl
ied
afte
r aw
ard
date
.013
.026
.009
-.000
.011
.012
.003
.002
as a
tran
sfer
stu
dent
(.01
0) (.
003)
(.00
8) (.
002)
adm
issi
ons
rate
am
ong
appl
ican
ts .7
73 .0
11 .9
26-.0
14 .8
05 .1
24 .8
95 .0
27 (.
088)
(.01
2) (.
080)
(.01
5)
# of
app
lican
ts52
498
22,
800
4,56
052
498
22,
800
4,56
0
***
p <
0.01
, **
p <
0.05
, * p
< 0
.10
Four
-Yea
r St
rata
Uni
vers
ity o
f Neb
rask
a O
mah
a
Two-
Yea
r St
rata
** * ***
***
**
***
Not
es: T
his
tabl
e de
scri
bes
how
sch
olar
ship
off
ers
affe
cted
app
licat
ion
and
adm
issi
on to
two
of th
e th
ree
Uni
vers
ity o
f Neb
rask
a ca
mpu
ses.
The
last
ro
w r
epor
ts th
e ad
mis
sion
s ra
te c
ondi
tiona
l on
appl
icat
ion.
All
othe
r ro
ws
repo
rt u
ncon
ditio
nal e
ffec
ts in
the
full
expe
rim
enta
l sam
ple.
The
sam
ple
incl
udes
201
2-20
15 a
pplic
ant c
ohor
ts.
*
Uni
vers
ity o
f Neb
rask
a at
Kea
rney
* *
Four
-Yea
r St
rata
*
Two-
Yea
r St
rata
42

Tab
leA5
Disag
gregatingAwardE↵ects
onEnrollmentby
Application
Coh
ort
(1)
(2)
(3)
(4)
(5)
(6)
(7)
(8)
.048
***
.051
* .0
93*
.280
***
.025
***
.067
***
.065
***
.138
***
(.0
16)
(.0
28)
(.0
50)
(.0
80)
(.0
05)
(.0
10)
(.0
15)
(.0
26)
{98
2} {
666}
{39
5} {
144}
{85
5}
2012
co
ho
rt-.
011
-.05
1 .1
79 .2
80**
* .0
33**
* .0
95**
* .0
79**
* .1
38**
* (
.035
) (
.058
) (
.080
) (
.080
) (
.011
) (
.019
) (
.023
) (
.026
) {
144}
{14
4} {
144}
{14
4} {
855}
{85
5} {
855}
{85
5}
2013
co
ho
rt .0
25 .0
92*
.039
.016
* .0
45**
* .0
53**
* (
.038
) (
.049
) (
.063
) (
.009
) (
.015
) (
.020
) {
251}
{25
1} {
251}
2014
co
ho
rt .0
46*
.069
* .0
21**
.066
***
(.0
27)
(.0
40)
(.0
10)
(.0
17)
{27
1} {
271}
2015
co
ho
rt .0
95**
* .0
31**
* (
.030
) (
.010
) {
316}
F-s
tati
stic
1.4
4 1
.42
.98
.65
1.5
1 .3
8p
-val
ue
.22
.24
.38
.63
.2
1 .6
8
Tw
o-Y
ear
Str
ata
Fo
ur-
Yea
r S
trat
a
No
tes:
Th
e to
p r
ow
rep
ort
s es
tim
ate
d e
nro
llm
ent
effe
cts
tha
t p
oo
l d
ata
fro
m a
ll a
va
ila
ble
ap
pli
can
t co
ho
rts
at
each
tim
e h
ori
zo
n.
Co
ho
rt-s
pec
ific
esti
ma
tes
ap
pea
r in
th
e su
bse
qu
ent
row
s, a
lon
g w
ith
F-s
tati
stic
s a
nd
p-v
alu
es f
rom
tes
ts o
f th
e jo
int
hy
po
thes
is t
ha
t co
ho
rt-s
pec
ific
est
ima
tes
equ
al
the
corr
esp
on
din
g p
oo
led
sa
mp
le e
stim
ate
. S
tan
da
rd e
rro
rs a
pp
ear
in p
are
nth
eses
an
d s
am
ple
siz
es i
n b
race
s.
{4,
560}
{3,
219}
{2,
024}
{1,
169}
po
ole
d s
amp
le
Yea
r T
hre
e
Fal
l
Yea
r T
hre
e
Fal
l
---
Yea
r O
ne
Fal
l
Yea
r T
wo
Fal
l
Yea
r F
ou
r
Fal
l
---
---
***
p <
0.0
1,
** p
< 0
.05
, *
p <
0.1
0
---
---
---
---
---
{1,
195}
{1,
341}
---
---
---
---
{1,
195}
{1,
169}
{1,
169}
---
---
Yea
r O
ne
Fal
l
Yea
r T
wo
Fal
l
Yea
r F
ou
r
Fal
l
**
43
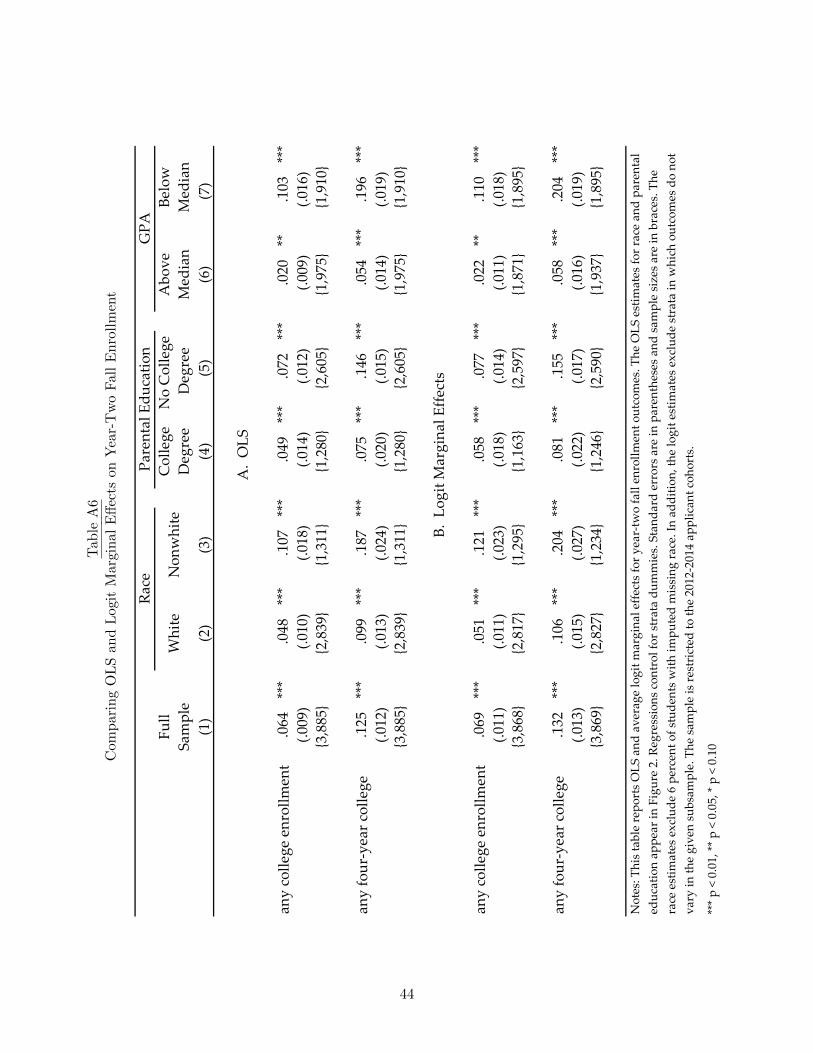
Tab
leA6
Com
paringOLSan
dLog
itMarginal
E↵ects
onYear-TwoFallEnrollment
(1)
(2)
(3)
(4)
(5)
(6)
(7)
.064
***
.048
***
.107
***
.049
***
.072
***
.020
** .1
03**
* (.
009)
(.01
0) (.
018)
(.01
4) (.
012)
(.00
9) (.
016)
.125
***
.099
***
.187
***
.075
***
.146
***
.054
***
.196
***
(.01
2) (.
013)
(.02
4) (.
020)
(.01
5) (.
014)
(.01
9)
.069
***
.051
***
.121
***
.058
***
.077
***
.022
** .1
10**
* (.
011)
(.01
1) (.
023)
(.01
8) (.
014)
(.01
1) (.
018)
.132
***
.106
***
.204
***
.081
***
.155
***
.058
***
.204
***
(.01
3) (.
015)
(.02
7) (.
022)
(.01
7) (.
016)
(.01
9){1
,937
}{1
,895
}{3
,869
}{2
,827
}{1
,234
}{1
,246
}{2
,590
}
{1,9
10}
{3,8
85}
{1,9
10}
{1,8
71}
{1,8
95}
{2,8
39}
{1,3
11}
{1,2
80}
{2,6
05}
{1,9
75}
B. L
ogit
Mar
gina
l Eff
ects
{3,8
68}
{2,8
17}
{1,2
95}
{1,1
63}
{2,5
97}
{2,8
39}
{1,3
11}
{1,2
80}
{2,6
05}
{1,9
75}
Rac
eG
PA
any
four
-yea
r co
llege
Not
es: T
his
tabl
e re
port
s O
LS a
nd a
vera
ge lo
git m
argi
nal e
ffec
ts fo
r ye
ar-t
wo
fall
enro
llmen
t out
com
es. T
he O
LS e
stim
ates
for
race
and
par
enta
l ed
ucat
ion
appe
ar in
Fig
ure
2. R
egre
ssio
ns c
ontr
ol fo
r st
rata
dum
mie
s. S
tand
ard
erro
rs a
re in
par
enth
eses
and
sam
ple
size
s ar
e in
bra
ces.
The
ra
ce e
stim
ates
exc
lude
6 p
erce
nt o
f stu
dent
s w
ith im
pute
d m
issi
ng r
ace.
In a
dditi
on, t
he lo
git e
stim
ates
exc
lude
str
ata
in w
hich
out
com
es d
o no
t va
ry in
the
give
n su
bsam
ple.
The
sam
ple
is r
estr
icte
d to
the
2012
-201
4 ap
plic
ant c
ohor
ts.
***
p <
0.01
, **
p <
0.05
, * p
< 0
.10
Belo
wSa
mpl
eM
edia
nM
edia
n
A.
OLS
any
colle
ge e
nrol
lmen
t
Full
Whi
teN
onw
hite
Abo
ve
any
four
-yea
r co
llege
any
colle
ge e
nrol
lmen
t
{3,8
85}
Col
lege
Deg
ree
Pare
ntal
Edu
catio
nN
o C
olle
ge D
egre
e
44

Table A7Projecting Award E↵ects on Bachelor’s Degree Completion
in the Four-Year College Strata
covariatesstrata only -.059 ** -.059 ** -.043 -.048 * -.042
(.029) (.029)
GPA and EFC -.062 ** -.063 ** -.044 -.035 -.076 **
(.028) (.030)
GPA, EFC, and -.065 ** -.070 ** -.049 * -.045 -.076 **demographics (.031)
control mean .281 .281 .297 .297 .294
(.029)
(.031)
(.031)
(.029)
(.027)
(.028)
(.029)
(.027)
(.027)
{855} {855} {921} {921} {921}
OLS Kline OLS Kline Kline
Experimental Cohort Non-Experimental CohortUnweighted Unweighted Reweighted
(1) (2) (3) (4) (5)
Notes: This table reports estimated effects of STBF award offers on bachelor's degree completion by the
end of year four. Columns 1 and 2 present estimates for the 2012 randomized sample using OLS
regression and Kline's reweighting procedure. Columns 3 and 4 report corresponding estimates for the
2011 applicant cohort, which was not subject to random assignment. Column 5 reweights the 2011 Kline
estimates in column 4 by the distribution of covariates in the 2012 randomized sample. Estimates control
for strata dummies. Demographic controls are gender, race, and parental education.
*** p < 0.01, ** p < 0.05, * p < 0.10
{855} {855} {921} {921} {921}
{855} {855} {921} {921} {921} (.029)
45