Embed Size (px)
Citation preview
NBER WORKING PAPER SERIES
CONSUMPTION DURING RETIREMENT: THE MISSINGLINK IN THE LIFE CYCLE
Daniel S. Hamerrnesh
Working Paper No. 930
NATIONAL BUREAU OF ECONOMIC RESEARCH1050 Massachusetts Avenue
Cambridge MA 02138
July 1982
Professor of Economics, Michigan State University and researchassociate, NBER. Research reported in this paper was supported byNational Science Foundation grant DAR—8008458. Helpful comments onan earlier draft from participants at seminars at the NBER,
Harvard, Michigan State, Oregon and Wisconsin, and discussion withMartin Feldstein and Paul Menchik aided in the work. The researchreported here is part of the NBER's research program in LaborStudies. Any opinions expressed are those of the author and notthose of the National Bureau of Economic Research.

NBER Working Paper #930July 1982
CONSUMPTION DURING RETIREMENT:THE MISSING LINK IN THE LIFE CYCLE
AB STRACT
This study presents the first evidence on the relation of consumption
to lifetime wealth, based on data from the 1973 and 1975 Retirement History
Survey that have been linked to Social Security earnings records.
Nearly 500 white, married, fully retired couples ages 62—69 form the basis
of the analysis. On average their consumption early in retirement exceeds
by 14 percent the income that their financial, pension and Social Security
wealth can generate. This implies that their saving, both private and
through Social Security, is insufficient to sustain consumption throughout
the rest of their lives. Additional evidence based on changes in spending
between 1973 and 1975 shows that these households respond by reducing their
real consumption at a rate sufficient to generate positive changes in net
financial worth within a few years after retirement. These two pieces of
evidence can be rationalized by a rate of time preference much higher than
the interest rate, coupled with either a bequest motive or uncertainty about
the length of life. They also imply that, even when combined with private
pensions and savings, Social Security in the United States today does not
enable most recipients to maintain their living standard at the levels they
enjoyed before they retired.
Daniel S. Hamermesh
Michigan State UniversityEast Lansing, Michigan 48824(517) 355—7349
I. Introduction
An immense amount of recent empirical research has examined how
wealth accumulation changes with age. The purpose of most of this work is
to test the theory of life—cycle utility maximization in which consumption
is the choice variable. Despite the focus of the theory on life—cycle
consumption, though, empircal work using longitudinal data has been based
exclusively on data on wealth and earnp. Cross—section data, on the
other hand, have been used exclusively to examine the relation of consumption
to income across age groups. Here I try to rectify this imbalance by con-
sidering longitudinal data on consumption and wealth late in the life cycle.
By considering the issues from a different empirical perspective, this
examination should enable us to sort out explanations for observed
behavior in a way not possible in the work that had to infer consumption
profiles from the data on assets, or that looked at "snapshots" of
consumption—income relations.
Studying actual consumption among the elderly allows the direct
estimation of how well Social Security retirement benefits meet one of the
program's main goals——the maintenance of consumption (see Hamermesh, 1982a).
While this largest of transfer programs has accreted a number of redistri—
butive aspects (both within and across cohorts) over its life in most
Western countries, its original stated purpose, at least in the United States,
was to prevent economic hardship (reduced consumption, independent of a
household's place in the distribution of lifetime income).-1 By examining
the sources of income available to finance consumption in old age, we can,
under alternative assumptions about what private saving would be in the absence
of enforced saving for Social Security, discover whether Social Security
benefits are sufficient to sustain consumption, and how much consumption
1

2
would have to be reduced without these transfers.
II. Life—Cycle Issues and Patterns in Consumption
In the presence of certainty about earnings trends and the length
of life, no bequest motive, a fixed retirement date and perfect capital
markets, the life cycle pattern of consumption depends solely on the
relationship between the rate of interest (r) and the rate of time
preference (p). To the extent that r exceeds (is less than) p consumption
will be observed to increase (decrease) with age. The less perfect are
capital markets, assuming the observed inverse J—shaped age—earnings profile,
the more likely it is that consumption will increase with age, and the less
likely that it will decrease monotonically with age from time zero. If
r < p, we may observe consumption increasing with age until some point in
the life cycle, though it decreases with age after that. Given the assuinp-
tions made here, savings will be positive up to some age at or before
retirement, and consumption will exceed income and be on a trajectory that
will exhaust wealth on the date of death. Wealth——all physical capital and
financial wealth including the value of pensions——will decline with age
during retirement.
Modifying this scenario to allow for planned bequests does not
change the implications for the rate of change of consumption with age.
This still depends on the possibilities for borrowing and the relation
between time preference and the rate of interest. But the requirement
that wealth be positive on the date of death does entail a lower level of
consumption at each age during retirement. Thus the ratio of consumption
to wealth or to an annuity out of wealth will be lower during retirement

3
the greater is the bequest motive; and the ratio will, if this motive exists,
be low enough to imply positive net worth at the (certain) date of death.
Unfortunately, information on consumption during retirement does not
allow us to distinguish between a bequest motive and risk averse behavior
in the face of uncertainty about the date of death. Uncertainty about
survival produces two opposite effects (Levhari—Mirman, 1977) —— increasing
consumption to enjoy what one may not be around to enjoy later, decreasing
consumption to provide for a horizon that may be quite distant. Whether
the profile of consumption rises or falls during retirement depends, as
in the standard case, on the relationship between time preference and the
rate of interest, but also on whether the extent of uncertainty and/or the
degree of risk aversion change systematically with age.
Some empirical evidence has been adduced on a number of the
implications of life—cycle theory for wealth accumulation. Physical and
financial wealth——the value of non—pension assets——may not increase with
age (although Hirer, 1979, suggests it does), but it surely diminishes far
more slowly than simple life—cycle theory predicts. (See King——Dicks——
Nireaux, 1982; and Blinder et al, 1981, for cross—section and Hurd—Shoven,
1982, for longitudinal evidence.) The more recent of these studies point
out that wealth, defined as physical and financial wealth plus the discounted
value of pension benefits, declines quite rapidly with age.
The evidence on age—wealth profiles is clearly inconsistent with
the simple life—cycle model of Modigliani—Brumberg (1954). The very slow
decline in wealth during retirement cannot be reconciled by a model that
postulates a certain date of death and no planned bequests. Davies (1981)
rationalizes this evidence by showing that the paths of noninvestment income
and actuarial survival probabilities by age are consistent with consumption
that could be generated by highly risk—averse utility—maximizing consumer
4
facing uncertainty about the date of death.-' There is evidence (David—
Menchik, 1981) that bequests form a sizable fraction of lifetime earnings.
That being the case, the evidence on the age—wealth profile can also be
rationalized by a planned bequest of the principal of the (bequeathable
financial) wealth accumulated at retirement, with consumption being financed
by non—bequeathable pension benefits and real interest on the principal of
the physical wealth.
This discussion rests on evidence on age—wealth profiles. Wealth,
however, may be measured with substantial error in the microeconomic
data sets that form the bases for most of the studies. Even if not,
because the theory is designed to predict life—cycle consumption, it
would seem sensible to concentrate on what that theory is most concerned
with, namely the pattern of consumption.
III. Data and Methods
To examine the relation of consumption among older workers and
their ability to finance it I use the linked Retirement History Survey
——Social Security Administration data. The Retirement History Survey
(R}IS) contains records on over 11,000 subjects, ages 58—63 in 1969, who
were interviewed biennially for a decade. In this study I concentrate
on information from the 1973 and 1975 interview waves. The RHS is one
of the few data sets, and the only one containing only older people,
that has information on the spending of a substantial fraction of each
household's income. Social Security earnings records for 1951—1974
have been linked to the RES, enabling one to derive the current or
prospective entitlement of members of each household in the RHS.
To remove outliers from the sample and concentrate on behavior
among otherwise similar households, I exclude all households other than:
1) White male—headed households in which the head was married to the

5
same wife from 1969—1975; and 2) From among these, households containing
persons whose current or most recent job was not in the farm or Federal
sectors and who was not currently or recently self—employed.
These disqualifications, and the requirement that information be available
on all the spending flows in the survey instrument, reduced the samples
to 1797 households ages 62—67 in 1973, and 1422 households ages 64—69 in
1975. In the discussion I analyze the spending of those households with
no earnings in the previous year and in which neither spouse is currently
working (retired households). There are 426 of these, ages 62—67, in 1973,
and 494, ages 65—69, in 1975.
Since the RHS data on spending are the main focus of this study,
and since they are not exhaustive of all spending, some consideration of
the validity of using them as a proxy for total spending is in order. In
the 1973 wave of the RHS spending on the following items is reported:
Food consumed at home; food consumed away from home; nonfood groceries;
transportation; vacations; and cost of owned or rented dwellings
(including utilities, interest and real estate taxes). Also included is
an imputation for the implicit rental value of owned housing. ifl the
1975 wave data on spending are similar, except there are no data on
spending for transportation, but spending on miscellaneous items,
including gifts, charity, dues to organizations and several others is
included.
Are these spending flows representative of total spending? The
first row of Table 1 lists the ratio of spending to after—tax income for
the complete subsamples in each of the two waves of the RHS (most
observations of which had at least one working member). Though the
spending data are not complete, they do account for the disposition of
roughly half of income flows in each year. More insight into their
validity can be gotten by examining spending in comparable categories

6
TABLE 1
Comparison of RIiS Consumption and Income to Values for Families
with Head Age 62—69, 1972—73 Consumer Expenditure Survey (CEX)
RI-IS Consumption Categories in: 1973 1975
RHS:
Consumption/After—tax Income .501 .528N = 1797 1422
CEX:Consumption in RHS .551 .503
Categories/After—tax Income
Consumption in RHS .628 .572
Categories/Total Consumption
Estimates of (1):1. All persons:
a .024 —.045
(2.48) (6.65)
b .633 .640
(151.71) (215.40)
R2 .919 .958
2021
2. Persons with ConsumptionLess than Income
a —.009 .022
(—1.01) (1.94)
b .666 .578
(46.40) (36.88)
R2 .632 .520
N= 1254

7
in the 1972—73 Consumer Expenditure Survey (CEX) by households in which
the head is between ages 62 and 69. Comparing the first and second rows
of the table, it is clear that the ratio of spending in these categories
to after—tax income is quite close to what it is among households in the
Moreover, as the third row shows, spending in these categories
accounts for a majority of total spending in the CEX.
Is the sample variation in spending in the RIIS categories also like
that of total spending? The equation:
CRHS/Y = a + b dY , (1)
where CRHS/Y is spending in the RHS categories, Y is after—tax income,
and C is total spending, was estimated using households with older heads
from the CEX. The bottom part of Table 1 presents the results: When
the entire sample is included, variation in the ratio of spending in
RI-IS categories to income is nearly fully explained by variation in the
ratio of total spending to income. Even if one excludes households
whose spending exceeds their incomes (a large fraction in this older
population consisting partly of households that may be drawing down their
financial assets), the coefficient of determination exceeds .5 for both the
1973 and 1975 sets of spending categories on which the RHS presents
4,data.—
Based on the 1972—73 CEX data this check of the BBS' ability to
represent total spending shows quite strongly that the BBS measures
spending well in those categories that it covers. Therefore, to
compare spending in the RI-IS to available resources and account for
incomplete reporting, I inflate BBS spending by the inverse of the

8
ratio of spending on RIiS categories to total spending in the CEX. This
means inflating in the 1973 RHS by 1/.628 (in 1975 by 1/.572) to derive
5/total spending, C.—
The spending measures are compared to available resources, both
currently and in the future. Among retired households I have data on
three sources of wealth: Physical and financial, pension and Social
Security. Assuming there is a market in actuarially fair annuities, I
annuitize physical and financial wealth (two—thirds of which is the
owner's share of owner—occupied housing), I assume a 2 percent real rate
of interest, use the 1969—71 life tables for whites, and assume the
household is buying a joint annuity. (In this age group letting .03 equal
the real interest rate raises the annuity income by about ten percent.)
I treat the resources currently available from Social Security
as the benefits generated by the household's earnings history, as
reported in the linked SSA data. This stream of benefits was assumed to
remain constant in real terms over the household's life. Available
pension benefits are based on actual or expected benefits and the
characteristics of the plan's provisions for benefits for spouses.
Since few pensions are indexed, I assume these benefits would decline
in real terms at 6 percent per year. The available resources measure,
*, thus consists of the annuitized real value of financial wealth,
indexed Social Security benefits, and pension benefits fixed nominally.
I assume these are the only resources available to these older house-
holds; if this is incorrect, I overestimate C*/Y*.-' I also assume
that the income flows are untaxed; if this is wrong, I underestimate
7/this ratio.—

9
IV. Can The Elderly Sustain Consumption?
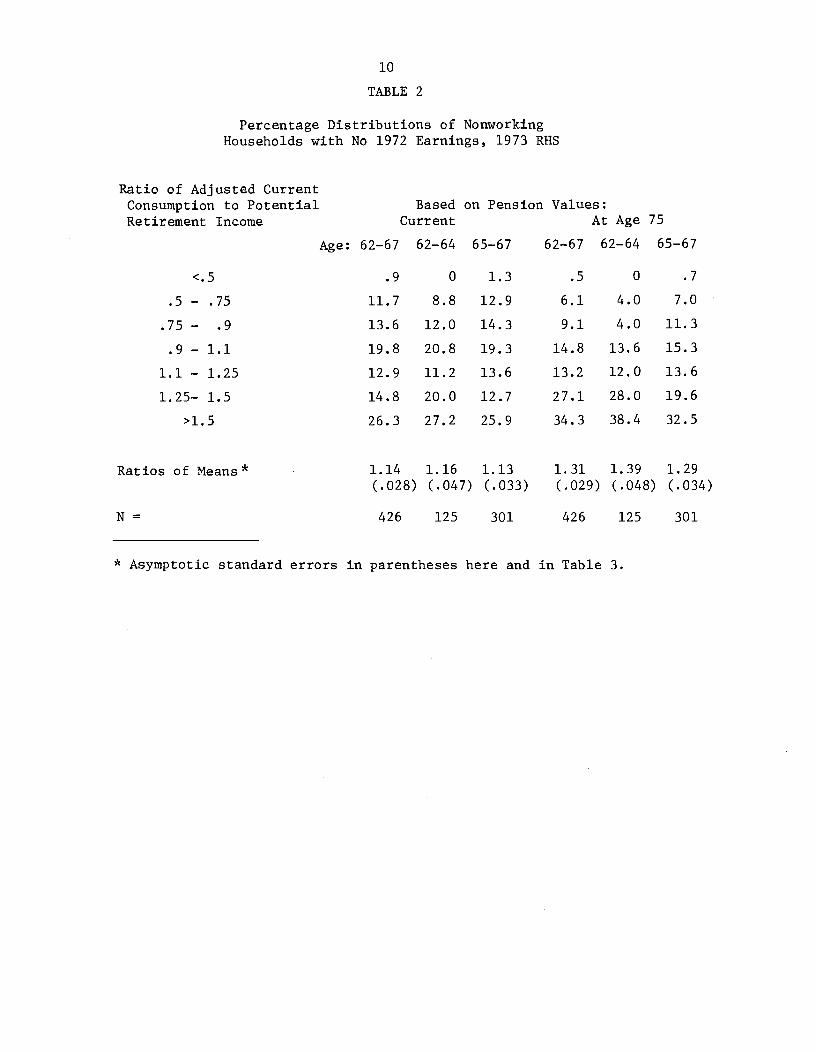
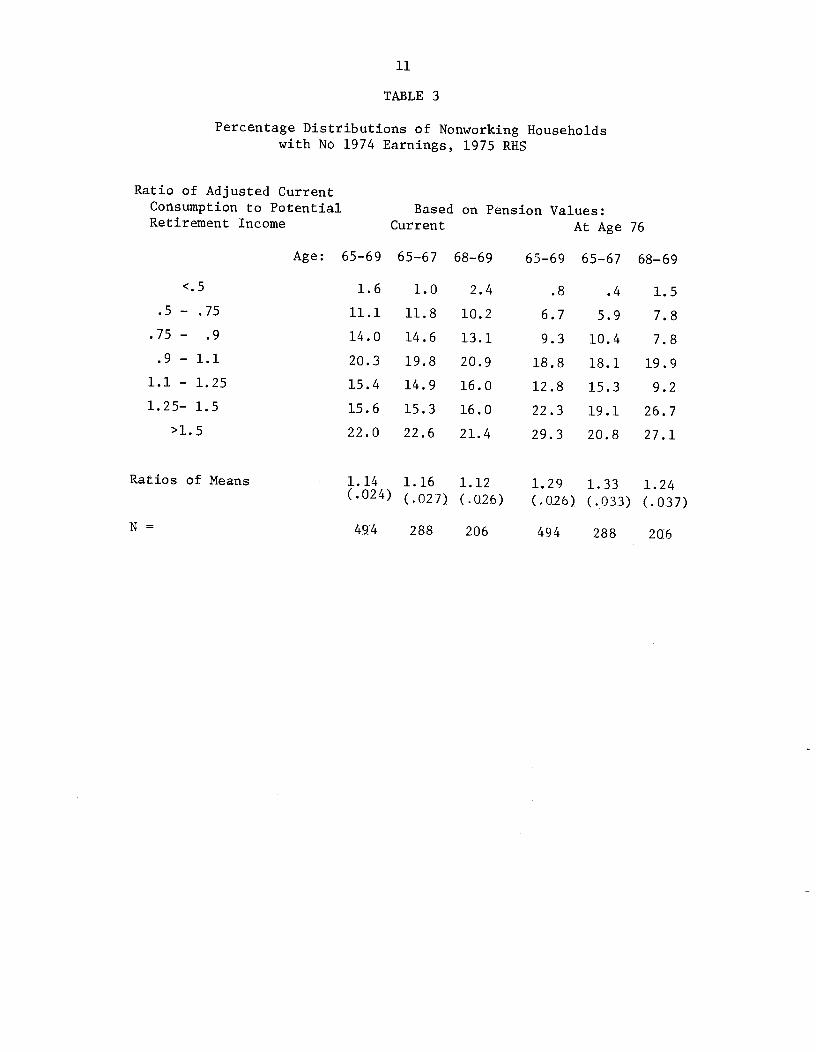
The first three columns of Tables 2 and 3 present information on
the ratio of current consumption to income currently available from
annuitized physical and financial wealth, and from pension and Social
Security benefits. In addition to the frequency distributions of these
ratios, I show the ratios of average consumption to average income for eacii
of the two samples, and for each divided into two age groups. The asymptotic
standard errors of these ratios of means are also shown. The final three
columns present the same information based on current consumption and on
resources available at age 75 for the 1973 sample (76 for the 1975 sample).
(These ages are those at which half the couples can expect both partners still
to be alive.) These differ from the first three columns because of the pro-
jected decline in the real value of pensions as the household ages.
The most striking finding in the information from Tables 2 and 3
on non—working households is the very high value of C*IY* early in
retirement. Current consumption is not sustainable given the financial
resources that are on average available to the retired couples in the
RHS samples.1 Moreover, this finding does not result from a few
outliers with unusually high consumption or very low income: 54 percent
of the retired households in the 1973 RHS, and 53 percent in the 1975
RITS, have values of C*/Y* greater than 1.1.
Pensions make up a sufficiently large proportion of retirement
income in these samples, and the projected decline in real pension values
is sufficiently rapid, that current consumption quickly becomes even more
difficult to sustain. Roughly two—thirds of the households in each sample
would have C*/Y* > 1.1 at age 75 (76 in the 1975 sample) if they maintained
10
TABLE 2
Percentage Distributions of NonworkingHouseholds with No 1972 Earnings, 1973 RHS
Ratios of Means* 1.14 1.16 1.13
(.028) (.047) (.033)
1.31 1.39 1.29
(.029) (.048) (.034)
N= 426 125 301 426 125 301
* Asymptotic standard errors in parentheses here and in Table 3.
on Pension Values:At Age 75
Ratio of Adjusted CurrentConsumption to Potential BasedRetirement Income Current
Age: 62—67 62—64
<.5 .9 0
.5 — .75 11.7 8.8
.75 — .9 13.6 12.0
.9 — 1.1 19.8 20.8
1.1 — 1.25 12.9 11.2
1.25— 1.5 14.8 20.0
>1.5 26.3 27.2
62—67 62—64 65—6765—67
1.3
12.9
14. 3
19. 3
13.6
12.7
25. 9
.5
6.1
9.1
14.8
13.2
27.1
34.3
0
4.0
4.0
13.6
12.0
28.0
38.4
.7
7.0
11.3
15.3
13.6
19.6
32.5
11
TABLE 3
Percentage Distributions of Nonworking Householdswith No 1974 Earnings, 1975 RHS
Ratio of Adjusted CurrentConsumption to Potential Based on Pension Values:Retirement Income Current At Age 76
Age: 65—69 65—67 68—69 65—69 65—67 68—69
<.5 1.6 1.0 2.4 .8 .4 1.5.5 — .75 11.1 11.8 10.2 6.7 5.9 7.8
.75 — .9 14.0 14.6 13.1 9.3 10.4 7.8.9 — 1.1 20.3 19.8 20.9 18.8 18.1 19.9
1.1 — 1.25 15.4 14.9 16.0 12.8 15.3 9.2
1.25— 1.5 15.6 15.3 16.0 22.3 19.1 26.7
>1.5 22.0 22.6 21.4 29.3 20.8 27.1
Ratios of Means 1.14 1.16 1.12 1.29 1.33 1.24(.024) (.027) (.026) (.026) (.033) (.037)
494 288 206 494 288 2G6

12
consumption at its current level. Clearly, current consumption is
inconsistent with the resources available; further, if people in the
sample intend to maintain consumption, the evidence in other studies
of assets that rise with age is clearly inconsistent with this
evidence on consumption.
As the penultimate row of Table 4 shows, Social Security benefits
form nearly half of retirement income in this samp1e.---" Even if
one makes a liberal estimate and assumes that Social Security displaces
half of the private saving that would otherwise occur, one finds (row
(1) of Table 4) that the ratios of average C to average * would be
far greater than the actual large, unsustainable values presented in
10 /Tables 2 and 3.— Assuming Social Security benefits displace no private
saving just reinforces this conclusion: The averages in row (2) of the
Table are even more outlandishly high. Indeed, in the majority of
households in the sample, spending on items reported in the RHS exceeds
the resources available from sources other than Social Security benefits.
Looking at the issue somewhat differently, 58 percent of the households
in the 1973 sample (58 percent also in 1975) for which C*/Y* < 1.1 would
have C*/Y* > 1.1 if there were no Social Security (assuming 50 percent
displacement of other wealth).
Social Security benefits clearly are very important in maintaining
consumption among retirees, even under the strong assumption that they
displace private savings on a one—for—two basis. They may also
(Kotlikof f—Summers, 1982) be sufficient to allow households to achieve
a rate of real consumption during retirement equal to the average
sustainable during their working lives. They are not, however, sufficient
for most households to maintain real consumption throughout retirement

13
Table 4
Means from 1973 and 1975 BBS Under Varying Assumptions
About Social Security's Effects on Saving
1973 1975
AGE 62—67 62—64 65—67 65—69 65—67 68—69
if 1.51 1.54 1.50 1.53 1.57 1.48
WLTH/SS* = 5
* if 2.25 2.29 2.24 2.33 2.43 2.20
WLTH/SS* = 1
.495 .494 .496 .509 .521 .493
*PEN
.313 .331 .307 .286 .284 .288*Y

14
equal to its rate early in the retirement years. The evidence suggests
(see, e.g., Ghez—Becker, 1975, P. 60) that consumption during the work
life follows the inverse J—shaped age—earnings profile quite closely.
It may thus be more sensible to evaluate the adequacy of Social Security
by comparing its ability to sustain consumption during retirement to
consumption observed around the time of retirement than to the average
of consumption throughout a household's working life.
V. Responses to Insufficient Savings
Real consumption early in retirement cannot be sustained, given
the level of assets possessed by most households and the stream of
pension and Social Security benefits available to them. It certainly
cannot be sustained if there is a bequest motive, and it is inconsistent
with the mounting evidence on the slow rate of decumulation of assets
in old age. How do households respond to the nonsustainability of
real consumption? One possible response is for one or more household
members to reenter the labor force (even though they had been out of
the labor force for at least one year). Of the households in the 1973
sample, though, only 9 percent chose this route (had positive earnings
in 1974). The mean 1974 earnings (in 1973 dollars) among all households
in the 1973 sample was $93; this would have added only 1.3 percent to
*, hardly affecting C*/Y*. Clearly, either most of the human capital
this sample possesses is fully depreciated, or their leisure has a very
high value.
The other response is to change C*. Comparing columns (2) and (3)
within Tables 2 and 3, we see that households with older heads in each
subsample have a lower ratio C*/Y* than households with younger heads.'

15
However, the rate of decline in this ratio with age is not rapid, roughly
.01 per year of age in the 1973 RRS, slightly less than two percent per
year in the 1975 RHS. The former is not quite consistent with a
consumption profile that is sustainable under the actuarial survival
probabilities facing households in the sample; the latter is consistent
with such a profile.
The comparison of C*/Y* across cohorts provides some evidence that
retired households cut their real consumption as they age, but its
magnitude is too small to explain planned bequests or reductions in
consumption consistent with risk—averse behavior in the face of uncertain
lifetime. Because the evidence in Tables 2 and 3 is based on different
cohorts, and thus possibly tainted by sample heterogeneity, I examine
the issue further using a subsample consisting of all 171 households
that: 1) Were in the RHS nonworking subsamples in both 1973 and 1975,
and thus had no earnings either in 1972 or 1974 and neither spouse
working at the time of the interview in 1973 and 1975; and 2) Reported
the same size household in both years. Because thespending components
differ in the two samples, I redefine consumption to exclude those
items that are not reported in both years)---" Information on changes
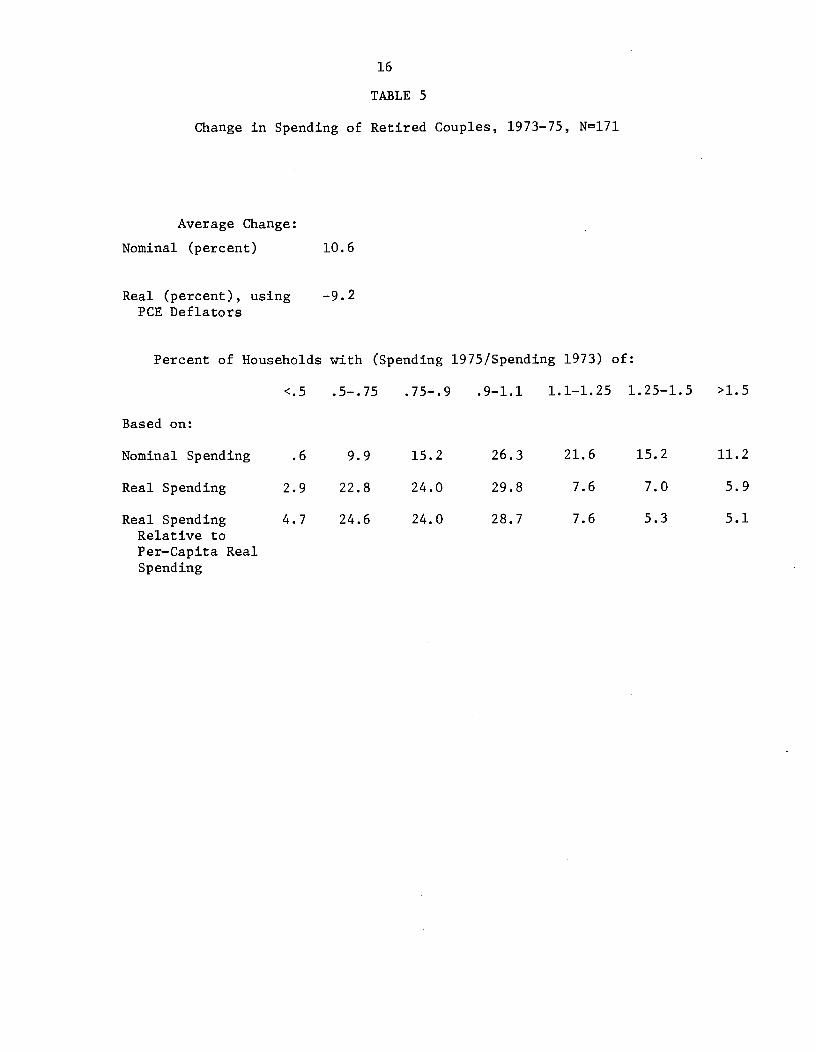
in spending by these households between 1973 and 1975 is reported in
Table 5. Spending in current dollars in these categories increased in
these households by over 10 percent; less than one—fourth of the house-
holds decreased nominal spending by more than 10 percent. If we
deflate each spending flow by the appropriate change in the most closely
related component of the personal consumption expenditure deflator, the
story is completely different: Real spending in these categories in this
16
TABLE 5
Change in Spending of Retired Couples, 1973—75, N171
Average Change:
Nominal (percent) 10.6
Real (percent), using —9.2PCE Deflators
Percent of Households with (Spending 1975/Spending 1973) of:
<.5 .5—.75 .75—.9 .9—1.1 1.1—1.25 1.25—1.5 >1.5
Based on:
Nominal Spending .6 9.9 15.2 26.3 21.6 15.2 11.2
Real Spending 2.9 22.8 24.0 29.8 7.6 7.0 5.9
Real Spending 4.7 24.6 24.0 28.7 7.6 5.3 5.1Relative toPer—Capita RealSpending

17
longitudinal data set declined by over 9 percent, and almost half the
households cut real spending by more than 10 percent.UI
The decrease in real spending was not merely a reflection of the
general slowdown in the growth of real incomes that occurred after 1973.
Real consumption spending per capita on a weighted average of the
commodities I have included grew by three percent during this two—year
period. If we adjust real spending by these households to make it
relative to per—capita spending in the U.S., the decreases in consumption
are even more pronounced: 53 percent of the households reduced spending
by more than 10 percent relative to the average change in real spending.
People in this sample appear to know they cannot sustain real
consumption, and they respond by reducing spending by 5 percent per year
on the items covered in the RHS samples. While too much should not be
made of evidence based only on two years of data, the findings lend
strong support to the notion that retired households' age—consumption
profile is negatively sloped. The size of the decline in consumption
is consistent with a profile of real physical and financial wealth
that increases during most of the retirement years.
VI. Explanations and Conclusions
This study has demonstrated two hitherto undiscovered phenomena
describing life—cycle behavior. First, I have shown that the resources
available to retirees are insufficient to allow them to sustain the level
of real consumption enjoyed early in their retirement. Second, both
cross—section and longitudinal data demonstrate they respond to this
insufficjcy by reducing their real consumption as they age. There
18
are three sets of explanations possible for these findings: 1) Problems
of mismeasurement or misspecification in the empirical results 2) An
inability to plan optimally for consumption during retirement because
of imperfections in the information available for planning; and 3) Perfect
information, with a consumption path either arising from bad planning,
from optimal planning under uncertainty, or from a bequest motive.
A number of data problems could be confounding the results.
First, the apparent inability of savings to sustain consumption may
reflect income sources excluded from Y*. This seems unlikely: Income
other than from pensions, Social Security benefits and assets is a tiny
fraction of total income of retirees in data gathered by the Social
Security Administration (see footnote 6); and data on older households
in the CEX suggest the same thing.-' Future earnings may be
expected by these apparently retired households; but that hardly seems
likley among the 171 households with no earnings in either 1972 or 1974, and
with no workers at the times of the interview in 1973 or 1975, whose
spending was shown in Table 5 to decline so sharply. Missing income sources
are not a problem. Second, wealth holdings may be underreported. The
annuitized value of reported financial wealth in the samples is only 7
percent of Y*; and a weighted average of the amount of underreporting of
financial assets in a similar survey (Lebergott, 1976, p. 218) suggests
3/4 of such assets are reported. If that is true in the sample used here,
Y* is understated on average by less than 2 percent. Moreover, to explain
the decline in C*/Y* with age, one would have to argue that underreporting
decreases with age, which severely strains credulity. Third, spending
may be mismeasured. For example, the people may be "house poor". This
is refuted by the calculations shown in footnote 8. Alternatively, C
19
may contain some work—related consumption. This too seems unlikely, for
the couples had not been working for at least one year before most of the
spending data were recorded. Fourth, even though I have shown real
spending falls during retirement, real consumption may not. This is also
improbable, partly because I have included consumption of housing services
in my measure, partly because it is hard to believe that consumption is
rising while spending is falling as rapidly as the data indicate.
One data issue that may have a major effect on the results is a
sample selection problem: The retired households may have much shorter
horizons than the average household, so that resources are in fact
adequate to maintain consumption. There is some evidence (Wolfe, 1982)
suggesting that people likely to die early retire early. The bias,
though, must be small: It affects only the annuity income from financial
and physical wealth, and this represents less than 20 percent of
available resources (see Table 4). Even with the effect Wolfe suggests,
and thus a higher annuity from assets, consumption cannot be maintained.''
That households in the sample do reduce consumption is further evidence
that this bias is minor.
Another possibility is that the 1973—75 period was atypical and
that the cuts in spending I observe reflect that. One could argue that
households had extrapolated the real increases in Social Security benefits,
and were forced to cut back spending in 1974 when they realized that
real benefits were to remain constant. A similar argument might be made
about the effect of the unanticipated inflation during this period on pension
and financial wealth. Tests of these possibilities must rely on additional
data from different times.
One source of imperfect information is about life expectancy: The
households in the sample may have planned badly because information about

20
their horizons was poor. It is true that longevity increased very
rapidly during the lifetimes of households in the RHS sample. However,
I have shown (Hamermesh, l982b) that people are aware of their current
life expectancy, and they even extrapolate secular changes in longevity.
This means that the rapid rise in longevity has not had a negative impact
on their ability to reach an ex post utility—maximizing choice of the path
of consumption. People may also not have expected the unprecedented
growth in real incomes that occurred during the years of peak earnings
in the RHS cohorts. But if they did not expect this rapid growth to be
permanent, they would have saved a disproportionate fraction of their
earnings. They clearly did not, suggesting they were not maximizing
lifetime consumption according to a plan dictated by a small absolute
value of p — r.Assuming information about income flows and horizons is sufficient
to allow life—cycle planning, how can we reconcile previous findings
of slow or no decumulation of financial wealth with my findings of
insufficient savings to finance constant consumption, and declining real
consumption during retirement? The results could be rationalized by an
ad hoc claim that the bequest motive increases in importance as the
household's horizon shortens. The rapid rate of decrease in consumption
during retirement could also be rationalized in a model of relative
risk aversion and uncertainty about length of life in a world of perfect
annuities. Unless relative risk aversion increases with age, though,
declining consumption during retirement requires that uncertainty about
longevity increase with age. I have shown (Hamermesh, l982b) that this
form of uncertainty decreases with age. Thus, in the absence of

21
evidence on the relation of relative risk aversion to age, uncertainty
about lifetimes alone is not a promising candidate to rationalize the
findings. Another serious possibility recognizes that there is no perfect
market for annuities. To the extent that the change in survival probabilities
increases with age, even if p — r is small we would observe consumption
decreasing with age. This may be important in late old age, but the
percentage change in the probability of survival is small in the age
bracket 62—69; also 80 percent of Y in the samples is actually annuity
income——Social Security and pension benefits.
The findings can be rationalized by a combination of a bequest
motive, or uncertainty about length of lifetime, coupled with a rate
of time preference far greater than the real rate of interest. There is
substantial independent evidence that real rates of time preference are
very high, at least 10 percent (Heckman, 1976; Hamermesh—Soss, 1974;
Kurz et al, 1973). We should not be surprised that, with a fixed amount
of financial and physical assets, virtually certain real Social Security
benefits up to any horizon, and pension benefits that are known (and
expected to decrease in real terms), retired households consume beyond
their means early in retirement and rapidly reduce consumption as they age.11
The implications for the adequacy of Social Security benefits
depend on one's views about the ability of people to plan for their
future. The benefits are adequate to allow retired households that
plan under uncertainty, or wish to leave a bequest, and have a high
rate of time preference to realize their consumption plans. One might
also, though, take the view, inconsistent with utility—maximizing
life—cycle behavior, that many households cannot save sufficiently for
retirement, and that Social Security benefits partly offset this

22
insufficiency)' My evidence suggests this offset is only partial; it is
not enough to enable older households to maintain their consumption.

REFERENCES
A. Blinder, R. Gordon and D. Wise, "SocialSecurity, Bequests and the
Life—Cycle Theory of Saving: Cross—Sectional Tests," NBER WorkingPaper No. 619, January 1981.
M. David and P. Menchik, "The Effect of Social Security on Bequests,"Econometrics Workshop Paper No. 8007, April 1981.
J. Davies, "Uncertain Lifetime, Consumption and Dissaving in Retirement,"Journal of Political Economy, 89, (June 1981), 561—577.
M. Feldstein, "Social Security Benefits and the Accumulation of Preretire—ment Wealth," NBER Working Paper No. 477, May 1980.
G. Ghez and G. Becker The Allocation of Time and Goods Over the Life Cycle,New York, Columbia University Press, 1975.
D. Hamermesh, "Social Insurance and Consumption," American Economic Review,72 (March 1982), lOl—ll3,a
"Expectations, Life Expectancy and Economic Behavior," NBERWorking Paper No. 835, January 1982,b
_______ and N. Soss, "An Economic Theory of Suicide," Journal of PoliticalEconomy, 82 (January/February 1974), 83—98.
J. Heckman, "A Theory of Life Earnings," Journal of Political Econy, 84(August 1976), Sll—S44.
M. Hurd and J. Shoven, "The Economic Status of the Elderly," UnpublishedPaper, NBER, March 1982.
M.A. King and L. Dicks—Mireaux, "Asset Holdings and the Life Cycle,"Economic Journal, (June 1982), forthcoming.
L. Kotlikoff and L. Summers, "TheAdequacy of Savings," American Economic
Review, forthcoming, 1982.
M. Kurz, R. Spiegelman and R. West, "The Experimental Horizon and theRate of Time Preference for the Seattle and Denver IncomeMaintenance Experiments," Research Memorandum No. 21, StanfordResearch Institute, November 1973.
S. Lebergott, The American Economy: Income, Wealth and Want, Princeton,Princeton University Press, 1976.
D. Levhari and L. Mirman, "Savings and Consumption with an UncertainHorizon," Journal of Political Economy, 85 (April 1977), 265—281.
T. Mirer, "The Wealth—Age Relationship Among the Aged," American EconomicReview, 69 (June 1979), 435—443.
23

24
F. Modigliani and R. Brumberg, "Utility Analysis and the ConsumptionFunction: An Interpretation of Cross—Section Data," in K. Kurihara,ed., Post—Keynesian Economics. New Brunswick: Rutgers University
Press, 1954.
J. Skinner, "Consumption When Earnings and Lifetime are Uncertain,"Unpublished Paper, University of Virginia, 1981.
M. Sobol, tiFactors Influencing Private Capital Accumulation on the 'Eveof Retirement,'" Review of Economics and Statistics, 61 (November
1979), 585—593.
J. Wolfe, "The Role of Perceived Longevity in the Social Security EarlyRetirement Decision," Unpublished Paper, Michigan State University,1982.

FOOTNOT ES
1As two of many examples, the Committee on Economic Security,set up by President Roosevelt to design a social insurance system, statedin its Report (Washington, GPO, 1935, p. 2), "Old age. ..is a misfortuneonly if there is insufficient income to provide for the remaining yearsof life." The House Report on the bill that became the Social Security
Act of 1935 (U.S. Congress, 74:1, Report No. 615, April 5, 1935, p. 5)said, "To assure support for the aged as a right rather than as publiccharity, and in amounts which will insure not merely subsistence butsome of the comforts of life,.. .the bill establishes a system of old—agebenefits."
2kinner (1981) shows that uncertainty about length of life willaffect the responsiveness of savings (consumption) to changes in realrates of interest. One may infer from his work that it is difficultempirically to extricate the effects of uncertainty from those ofchanges in p — r.
3Among the 31 categories of spending into which Hamerinesh (1982a)grouped the CEX data, I use food at home and away from home; rent andspending on owner—occupied housing; utilities and telephone; owned vehicles,other transportation and vehicle operations, and vacations to correspondto the categories of spending included in the 1973 1UiS. The correspondenceto the 1975 RHS dropped owned vehicles, other transportation and vehicleoperations, but added admissions to spectator events, televisions andradios purchases, photography, other recreation, reading materials, andgifts.
4If (1) is reestimated on only those households in which the head
is a white married male who is not working and whose wife is not working,the R2 is .989 for the 1973 spending categories, .992 for the 1975categories. Deleting households for which dY > 1, the R2 are .598 and.548 for the two definitions of spending, CR1-IS.
5The goods on which spending is reported in the RHS may have an
average income elasticity different from one. The procedure of inflatingspending in the R}iS by the ratio 1/.628 will not bias the ratio of theestimate of average spending in the sample to average resources, ft willcreate a systematic bias in these ratios, C*/Y*, by income class, though,if the average elasticity is not one. (The bias will be positive forlow—income, negative for high—income households if the elasticity is belowunity, vice—versa if it is above unity.) Since in fact the incomeelasticity of commodities included in the 1973 EBS sample is only 1.01times the average for all commodities in the CEX (1.12 for the 1975 RHS),this potential difficulty seems unimportant empirically.
25

26
6This bias is likely very small. Among married couples 65 or overin 1976, income from sources other than earnings, Social Security,pensions and assets was only 2 percent of the total. (Social SecurityAdministration, Office of Research and Statistics, Income and Resourcesof the Aged, 1980.)
7Even assuming that all the pension income is subject to taxation,
the average couple in the 1973 sample with a head above age 64 would havepaid no Federal tax on its 1972 income. A household with average SocialSecurity benefits, but other income twice that of the average, and withonly two exemptions (no children, and both spouses under 65) would havepaid Federal income taxes equal only to 6 percent of *• This bias toois likely to be small.
8Excluding the annuitized value of the owned portion of owner—occupied housing from * and the imputed rent from C*, and inflating C*
accordingly corresponding to spending in the CEX, I find the recalculatedratio of average C to average Y* to be 1.12 in both samples. This isonly slightly below ratios listed in Tables 2 and 3.
This is slightly above the share of Social Security in the incomesof couples 65+ from Social Security Administration, op. cit., footnote 6,once earnings are excluded from the calculation. PEN*/Y* is somewhatabove the share of pension income reported in that source. Since Iexclude the self—employed and ax—government employees, who receive smallSocial Security income at most, and since my sample includes people earlyin retirement, before their real pension income has eroded, the estimatesin Table 4 seem remarkably close to the estimates covering a much broader
sample.
10Feldstein's (1980) most completely specified and carefully
estimated model based on micro data yields an estimate of displacementquite close to .5.
11This is not because of some strange difference in the ages of the
wives in the subsamples: Husbands in the younger subsample in the 1973R}IS are 2.9 years younger than those in the older subsample; their wivesare 2.0 years younger than their counterparts. Comparable differencesfor the 1975 RHS are 2.4 and 2.2 years for husbands and wives respectively.
12Transportation is excluded from C* in this comparison from the
1973 RHS for this group, while miscellaneous expenses are excluded fromthe 1975 RRS.
13The correspondence between RI-IS spending categories and components
of the PCE deflator is: Vacations, recreation; imputed rent; owner—occupied dwellings; rent, renter—occupied dwellings; utilities, householdutilities; food, off—premise food consumption; nonfood groceries, toiletarticles; and food away from home, purchased meals and beverages. Becausethe RI-IS data on spending in the various categories are based on differentpoints up to one year before the interview date, the observations onthe deflators are chosen to correspond to the quarters when the RI{Sspending is measured.

27
14lncome from sources other than assets, pensions and SocialSecurity, and earnings constituted only 8 percent of the total among allhouseholds with a head age 65 or over in the 1972—73 CEX (BLS, ConsumerExpenditure Series: Interview Survey, 1972—73, Report No. 455—4, 1977).Half of this small fraction was composed of rental income and income fromroyalties and roomers, which presumably also stem from physical assetsthat are included in the RHS measures of assets.
15Wolfe estimates that men who retire on Social Security at age62 have a mortality rate roughly one—third above that of men who retireat 65. His estimated differential for women is somewhat below this.Taking a one—third higher mortality rate for both spouses, and recomputingthe value of an annuity using these higher rates raises the payout on ajoint annuity starting at ages 65 and 62 for husband and wife only by 11percent. For the average household in the RHS this would increase Y*by only 2 percent.
16An argument based on declining ability to consume goods becauseof sharply decreasing efficiency in household production early inretirement is inconsistent with data from the National Health Survey in1975. Among persons age 55—64 the number of days of restricted activityper year were 28.0; days of bed disability were 9.3 per year. Comparablefigures for persons 65—74 were 34.0 and 10.3. Only among persons 75+do these statistics increase substantially,, to 46.2 and 17.4 respectively.(National Center for Health Statistics, Vital Statistics, Series 10, No.118, p. 20.)
17Sobol's (1979) results suggest that blacks' accumulation ofphysical and financial assets up to the point shortly before retirementis far less relative to their lifetime earnings than that of whites. Tothe extent they were in covered employment and earned less than whites,progressive Social Security benefit formulae willy though, offset some ofthis greater inadequacy among blacks than among the whites I examine here.