Embed Size (px)
Citation preview
NB-IRDT CHRONIC OBSTRUCTIVE
PULMONARY DISEASE RESEARCH PROGRAM
REPORT ONE: INVESTIGATION OF STATISTICS CANADA PUBLIC USE MICRODATA FILES
Ted McDonald, PhD Kyle Rogers, MSc
Bethany Daigle, PhD Anat Ziv, PhD

Page 2
PROJECT TITLE NB-IRDT Chronic Obstructive Pulmonary Disease research program – Report one: investigation of Statistics Canada Public Use Microdata Files
PRINCIPAL INVESTIGATOR Ted McDonald, Director, NB-IRDT
RESEARCH TEAM Kyle Rogers, Data Analyst, NB-IRDT Bethany Daigle, Scientific Writer, NB-IRDT
Anat Ziv, Postdoctoral Fellow, UNB
ACKNOWLEDGEMENTS This study was supported by the Maritime SPOR SUPPORT Unit (MSSU), which receives financial
support from the Canadian Institutes of Health Research (CIHR), the New Brunswick Department of Health, the Nova Scotia Department of Health and Wellness, the Prince Edward Island
Department of Health and Wellness, the New Brunswick Health Research Foundation (NBHRF)
and Research NS. The opinions, results and conclusions reported in this paper are those of the authors and are independent from the funding sources. No endorsement by the MSSU or the
named funding partners is intended or should be inferred.
Support for this work was also provided by the New Brunswick Health Research Foundation.
HOW TO CITE THIS REPORT McDonald, T., Rogers, K., Daigle, B., & Ziv, A. (2020). NB-IRDT Chronic Obstructive Pulmonary
Disease research program – Report one: investigation of Statistics Canada Public Use Microdata
Files. Fredericton, NB: New Brunswick Institute for Research, Data and Training.

Page 3
Table of Contents
Executive Summary ..................................................................................................................................... 4
Introduction .................................................................................................................................................. 5
Methods ........................................................................................................................................................ 8
Results ............................................................................................................................................................ 9
Demographic Information.......................................................................................................................... 9
Sex .............................................................................................................................................................. 9
Age .......................................................................................................................................................... 10
Marital Status .......................................................................................................................................... 12
Education ................................................................................................................................................ 13
Quality of Life Information ........................................................................................................................ 15
Self-Perceived Health ............................................................................................................................ 15
Life Stress ................................................................................................................................................. 16
Difficulty with Activities .......................................................................................................................... 17
Needed Help with Instrumental Activities of Daily Living (IADL) ...................................................... 18
Working Status Last Week ..................................................................................................................... 19
Health Behaviours ...................................................................................................................................... 20
Type of Smoker ....................................................................................................................................... 20
Physical Inactivity ................................................................................................................................... 21
Health Conditions ...................................................................................................................................... 22
Body Mass Index..................................................................................................................................... 22
Blood Pressure......................................................................................................................................... 23
Asthma .................................................................................................................................................... 24
Heart Disease .......................................................................................................................................... 25
Diabetes .................................................................................................................................................. 26
Cancer .................................................................................................................................................... 27
Summary of Select Results ........................................................................................................................ 28
CCHS PUMF Limitations ............................................................................................................................. 30
CCHS Research Data Centre Access ................................................................................................. 30
Conclusion .................................................................................................................................................. 31
References ................................................................................................................................................. 32

Page 4
Executive Summary This report examines the utility of existing and easy-to-access data in the form of Statistics
Canada’s Canadian Community Health Survey public use microdata files (CCHS PUMF).
These data sources allow for easy presentation of Chronic Obstructive Pulmonary Disease
(COPD) at the New Brunswick level, as well as partial presentation at the health zone level. Because the CCHS is an annual national product, we will be able to continually update the
data presented herein following the trends over time and can compare NB values against other
Canadian jurisdictions for benchmarking. Further, the CCHS PUMF data include a variety of items for examination rarely available in administrative data sources—items like:
• Blood Pressure
• Body Mass Index
• Difficulty with Activities
• Education
• Life Stress
• Needed Help with Instrumental Activities of Daily Living
• Physical Inactivity
• Self-Perceived Health
• Type of Smoker
• Working Status
However, while the breadth of data available via the CCHS PUMF is impressive and allows insights into a variety of topics, these data lack depth. Statistics Canada removes identifying
information from the CCHS PUMF data before release. As such, we cannot link CCHS data to
other data sources such as census responses, records of health service use, etc.
Further, the survey nature of the CCHS leads to sample size issues that present difficulties when
there is interest in presenting values at smaller geographies—in many cases, it simply isn’t possible. Finally, due to the nature of self-reporting, the CCHS data run the risk of biases typically
associated with survey data (such as social desirability bias), potentially leading to lower counts
of COPD cases when self-report estimates are compared to administrative data case identification estimates. For example, research that linked self-report data to administrative data
in Ontario demonstrated this trend in several chronic health conditions (including COPD1), a
finding consistent with research from the US.2, 3
The self-report data contained in the CCHS PUMF may be imperfect, but they nonetheless
represent one avenue for obtaining useful insights into COPD in New Brunswick. Alongside the Public Health Agency of Canada’s administrative data approach in the Canadian Chronic
Disease Surveillance System, and NB-CHIP, they will help us develop better understanding of COPD in New Brunswick. These insights will ultimately allow the New Brunswick health system and
care providers to provide improved care to New Brunswickers living with COPD while
simultaneously striving to prevent future cases of COPD.

Page 5
Introduction
“Breathing is something many people take for granted. However, in Canada, 3.8 million people over the age of one are living with asthma
and 2.0 million are living with chronic obstructive pulmonary disease (COPD), both of which can affect a person's ability to breathe.
Individuals living with asthma or COPD may experience impaired participation in daily life, school, work, and social activities.”4
In 2016, the New Brunswick Department of Health utilized the Canadian Chronic Disease
Surveillance system (CCDSS) to estimate that approximately 57,000 New Brunswickers over the age of 35 had been diagnosed with COPD.5 In contrast, Statistics Canada’s estimates for the
same year show only 24,800 prevalent cases.6 This sizable discrepancy is due to the different
methodologies used in each case; and it highlights not only the existence of alternative methods for identifying cases of COPD, but also the impact methodological approaches can
have on study outcomes.
Developed by the Public Health Agency of Canada (PHAC),5 the Canadian Chronic Disease
Surveillance System (CCDSS) uses disease case definition algorithms applied to government
administrative health databases.4 Meanwhile, Statistics Canada (StatCan) uses self-report surveys to identify cases. The difference between the two results is considerable, and it highlights
how different methodological approaches affect the development of population health
indicators, and, subsequently, governmental responses. From the lens of a healthcare system planner, the strategy for ensuring care for 24,800 New Brunswickers with COPD is likely different
than the strategy for caring for 57,000. Understanding how and why these methodologies differ
will allow New Brunswick to better plan health promotion and healthcare provision in the future, and more accurate/precise estimates allow for better plans.
The CCDSS and survey methodologies mentioned above are not the only approaches for identifying COPD. In New Brunswick, a third COPD case identification approach exists: the New
Brunswick COPD Health Information Platform (NB-CHIP). When used in conjunction with the
CCDSS and survey methodologies, an independent third case identification method allows researchers and policy makers to more accurately triangulate the true extent of COPD in NB
and plan accordingly.
NB-CHIP is a collaboration between the New Brunswick Institute for Research, Data and Training
(NB-IRDT), the province’s Regional Health Authorities (Horizon and Vitalité), and the Government of New Brunswick’s (GNB) Department of Health. Developed with funding from the New
Brunswick Health Research Foundation (NBHRF) and AstraZeneca, NB-CHIP contains pulmonary
function testing (PFT) data from RHA-administered PFT labs throughout the province. PFT is a key component in the diagnosis of both COPD and asthma. As such, one use of the province-wide
PFT results contained in NB-CHIP is to identify any records that meet the clinical criteria for the
COPD, providing a third method of case identification that can be partnered with StatCan’s surveys and PHAC’s administrative data algorithms, giving us a clearer picture of the extent of
COPD in NB.
The various case identification methodologies: surveys (StatCan), physician/hospital claims,
administrative data (PHAC), and provincially collated clinical data are distinct but
complementary methods with unique strengths and weaknesses outlined in Table 1. One nuanced but important distinction worth exploring here is the sample universe to which the
estimate from each case identification methodology applies. The sample universe each

Page 6
methodology aspires to describe is a count of individuals in New Brunswick living with COPD. However, the seeming simplicity of the task of identifying and counting COPD cases belies the
underlying complexity of the task: multiple practicalities can prevent that perfect value from
being discerned (or ever even actually existing).
For example, when does a COPD case actually begin?
1. When a patient reports COPD symptoms to their physician? [CCDSS]1 2. When a PFT indicates COPD? [NB-CHIP]
3. After a patient has learned they have COPD? [StatCan surveys]
The case identification methods described above answer the different questions above to serve
as imperfect proxies of the perfect value. However, each in fact has a slightly different sample
universe:
• CCDSS: All individuals in NB who visit a physician with COPD-related symptoms
• NB-CHIP: All individuals who meet the clinical PFT criteria for COPD in NB
• Surveys: All individuals who report a COPD diagnosis in NB
The CCDSS requires an individual visit their physician once within a single year7 with symptoms
that align with COPD, and have their physician bill the healthcare system for both services associated with the visit, while noting COPD symptoms in their physician notes. NB-CHIP requires
an individual to have received a pulmonary function test and meet the clinical criteria of COPD
according to that test. Finally, the CCHS requires individuals diagnosed with COPD to report it when surveyed.
The current report focuses on survey data as the first step in describing the COPD data ecosystem in New Brunswick, and on defining the ways in which we can harness data sources
available here to provide a better understanding of the strengths and limitations of each approach (self-report, NB-CHIP, CCDSS) for describing COPD in New Brunswick.
This report focuses on StatCan PUMF data for several reasons. First, it is the most readily accessible of the various data sources and allows researchers to access the data with minimal
wait time. Second, StatCan survey data is annually and nationally consistent. As such, any
estimates generated from the PUMF data are comparable with other Canadian jurisdictions over time. Third, the survey data have an extensive list of information (personal history, symptom
information, health behaviours, etc.) not available in administrative data sources like NB-CHIP
and the CCDSS. Finally, of the three approaches, the survey approach is the only approach that is explicitly and exclusively made up of New Brunswick residents. When StatCan designs
these surveys, the sampling frame they use ensures that only New Brunswickers contribute to
New Brunswick data. The structure of both the CCDSS and NB-CHIP include anyone receiving treatment at an NB hospital or facility as data. For example, Campbellton facilities often treat
Quebec patients, and those individuals may contribute to any NB values generated from the
CCDSS/NB-CHIP.

Page 7
Table 1. Comparison of data sources available for COPD case identification
Source
StatCan surveys (CCHS) CCDSS NB-CHIP
Self-report Physician and hospital
billing claims
Pulmonary function test
lab results
Estimate
describes
All individuals who report a COPD diagnosis in NB
All individuals with a
physician diagnosis of COPD in NB.
All individuals who
meet the clinical PFT criteria for COPD in NB.
Source
strengths
1. Annually updated
2. Rigorous data
collection,
standardization, and quality
3. Nationally consistent,
allowing for inter-
provincial comparisons
4. Describes multiple
factors of interest such as
personal history,
symptom information, health behaviours, etc.
5. Linkable to other data
in Statistics Canada
Research Centres
1. Annually updated
2. Rigorous data
collection,
standardization, and quality
3. Nationally consistent,
allowing for inter-
provincial comparisons
4. System-generated
data, minimal effort
required for data
collation
5. Large amount of NB
data allows small area comparisons
1. Annually updated
2. Describes multiple
factors of interest such
as personal history, symptom information,
health behaviours, etc.
3. In depth descriptions
of symptoms and clinical data
4. Large amount of NB
data allows small area
comparisons
Source
weaknesses
1. Vulnerable to social
desirability biases
2. Vulnerable to
individual reporting errors
3. Small NB sample sizes
prevent small area
comparisons
1. Lacks important
information such as
personal history, symptom
information, health behaviours, etc.
2. Draws from health
service use for definition,
as such does not necessarily describe ALL
cases at time of estimate
generation
1. Not nationally
consistent, preventing
inter-provincial
comparisons
2. Draws from health
service use for
definition, as such does
not necessarily describe ALL cases at time of
estimate generation
3. Data collected for
clinical purposes are
difficult to translate into meaningful research or
population health info

Page 8
Methods The current report utilizes data from the Canadian Community Health Survey (CCHS) public use
microdata files (PUMF).8, 9 The CCHS is a cross-sectional survey from StatCan that provides self-
reported estimates of health determinants, health status, and health care utilization. The CCHS comprises two types of surveys: an annual component on general health and a component
that focuses on different health topics with each new iteration. The CCHS covers approximately 98% of the Canadian population aged 12 or older living in the ten provinces and three territories,
excluding those living on First Nations reserves or Crown land, full-time members of the Canadian
Forces, institutional residents, and some residents of remote areas of Canada.
We accessed the CCHS PUMF data via the University of New Brunswick’s Data Liberation
subscription10, 11 and pooled data from the CCHS PUMF12 for the years 2000 through 2013/2014 to create a sample of 154,395 respondents aged 35 and over when surveyed. Finally, we utilized
StatCan weighting schemes to ensure the sample reflected the New Brunswick population.
However, several issues prevent the CCHS from providing complete cov13erage of the time period of interest. First, the CCHS PUMF data is not annual: following 2006, StatCan completed
the CCHS on a biennial basis. Hence, the CCHS combines the years 2007-2008, 2009-2010, 2011-
2012, and 2013-2014. Second, the 2002 data did not include health zones, so we excluded it from analysis. Finally, StatCan did not release a large component of the data from 2004, or any
of the 2006 CCHS, as PUMF. As such, this report does not include 2002, 2004, or 2006 CCHS data.
The CCHS PUMF contains hundreds of items, many of which may not have an immediate
relevance to understanding COPD in New Brunswick. Thus, the research team selected 17
measures believed to be of particular relevance. We present the measures below in graph form at the New Brunswick level and at the health zone level for the seven health zones in the
province (shown in Figure 1). We aggregated zones 4/5 and 6/7 into larger geographies to
address sample size issues.
Figure 1. New Brunswick health zones

Page 9
Results This section contains graphs describing the basic descriptive statistics generated from the
available StatCan PUMF. We separated the 17 items into four categories:
1. Demographic information (Sex, Age, Marital Status, Education)
2. Quality of life (Self-Perceived Health, Life Stress, Difficulties with Activities,
Needed Help with Instrumental Activities of Daily Living,
Work Status)
3. Health behaviours (Smoker Type, Physical Inactivity)
4. Health conditions (BMI, Blood Pressure, Asthma Dx,2 Diabetes Dx, Heart Failure Dx, Cancer DX)
Demographic Information
The demographic information reported below presents the sex, age, marital status, and
education levels of individuals with COPD compared to the New Brunswick population more generally.
Sex
Figures 2 and 3 depict the relationship between sex and COPD. At the provincial level, women represent a greater proportion (57%) of individuals who reported a diagnosis of COPD than they
do the New Brunswick population (52%). This trend is continued, and often more pronounced,
when we disaggregate the statistics to show health zone trends (Figure 3). However, the trend is not universal across the smaller geographies, as health zone 6/7 demonstrates the reverse trend,
with men over-represented among individuals who report a COPD diagnosis.
Figure 2. Provincial presentation of sex among individuals with COPD vs. sex among all
individuals over the age of 353
2 Dx = diagnosis 3 NB Pop = NB Population throughout the graphs in this report.
57% 52%
43% 48%
0%
10%
20%
30%
40%
50%
60%
70%
80%
90%
100%
COPD Dx NB Pop
Women Men

Page 10
Figure 3. NB health zone breakdown of men and women with COPD vs. the distribution of sex for
all individuals over the age of 35
Age
Figure 4 describes the relationship between COPD and age distribution in New Brunswick. A
primary trend to note is that individuals with COPD are over-represented in the 60-69 (25% vs. 19%) and 70-79 (20% vs. 11%) age categories and are correspondingly under-represented in the
40-49 (17% vs. 28%) category. Figure 5 breaks down the age distribution in the health zone
geographies, but there exist no obvious differences from the provincial values.
Figure 4. Provincial presentation of age distribution (35+) among individuals with COPD vs. the
age distribution among all individuals over the age of 35
60%52%
60% 53% 59% 53% 56% 51% 47% 51%
40%48%
40% 47% 41% 47% 44% 49% 53% 49%
COPDDx
HZPop
COPDDx
HZPop
COPDDx
HZPop
COPDDx
HZPop
COPDDx
HZPop
Health Zone 1 Health Zone 2 Health Zone 3 Health Zone 4/5 Health Zone 6/7
Women Men
4%
17%
27% 25%20%
8%10%
28% 26%
19%
11%5%
0%
10%
20%
30%
40%
50%
60%
70%
80%
90%
100%
35-39 40-49 50-59 60-69 70-79 80+
COPD Full Pop

Page 11
Figure 5. Health zone breakdown of age distribution (35+) among individuals with COPD vs. the
age distribution (35+) among the health zone population
5%
11%
4%
10%
2%
10%
4%
10%
2%
9%
14%
28%
16%
28%
20%
28%
17%
29%
17%
25%
32%
26%
24%
27%
24%
26%
25%
26%
29%
28%
25%
19%
28%
18%
23%
19%
23%
19%
26%
22%
17%
11%
21%
11%
22%
12%
23%
11%
16%
11%
7%5% 7% 6%
9%5%
8%5%
9%5%
0%
10%
20%
30%
40%
50%
60%
70%
80%
90%
100%
COPDDx
HZPop
COPDDx
HZPop
COPDDx
HZPop
COPDDx
HZPop
COPDDx
HZPop
Health Zone 1 Health Zone 2 Health Zone 3 Health Zone 4/5 Health Zone 6/7
35-39 40-49 50-59 60-69 70-79 80+
Page 12
Marital Status
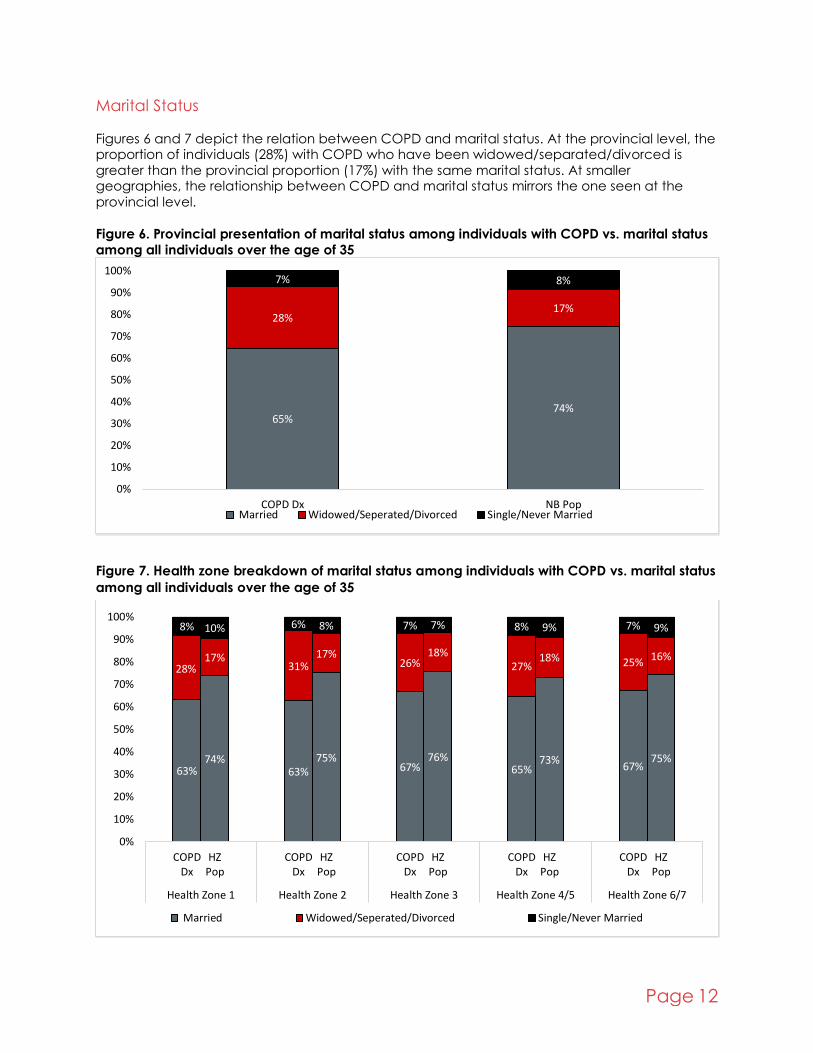
Figures 6 and 7 depict the relation between COPD and marital status. At the provincial level, the proportion of individuals (28%) with COPD who have been widowed/separated/divorced is
greater than the provincial proportion (17%) with the same marital status. At smaller geographies, the relationship between COPD and marital status mirrors the one seen at the
provincial level.
Figure 6. Provincial presentation of marital status among individuals with COPD vs. marital status
among all individuals over the age of 35
Figure 7. Health zone breakdown of marital status among individuals with COPD vs. marital status
among all individuals over the age of 35
65%74%
28%17%
7% 8%
0%
10%
20%
30%
40%
50%
60%
70%
80%
90%
100%
COPD Dx NB Pop Married Widowed/Seperated/Divorced Single/Never Married
63%74%
63%75%
67%76%
65%73%
67%75%
28%17%
31%17%
26%18%
27%18% 25% 16%
8% 10% 6% 8% 7% 7% 8% 9% 7% 9%
0%
10%
20%
30%
40%
50%
60%
70%
80%
90%
100%
COPDDx
HZPop
COPDDx
HZPop
COPDDx
HZPop
COPDDx
HZPop
COPDDx
HZPop
Health Zone 1 Health Zone 2 Health Zone 3 Health Zone 4/5 Health Zone 6/7
Married Widowed/Seperated/Divorced Single/Never Married
Page 13
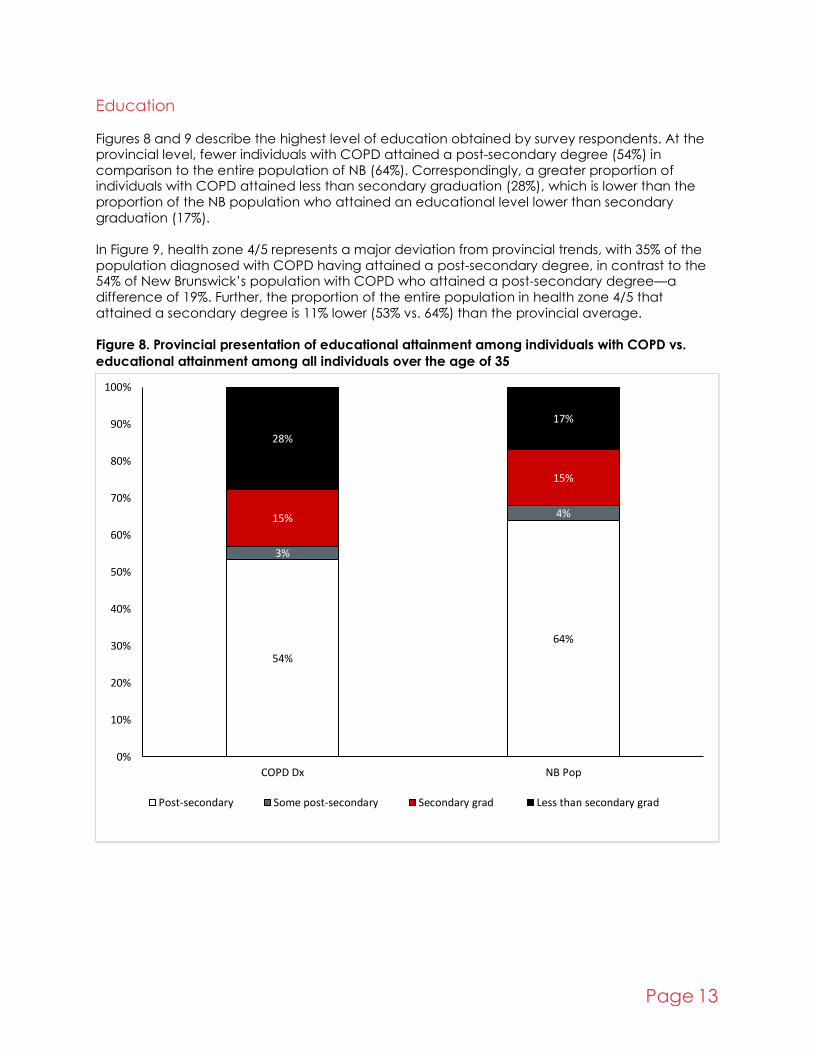
Education
Figures 8 and 9 describe the highest level of education obtained by survey respondents. At the provincial level, fewer individuals with COPD attained a post-secondary degree (54%) in
comparison to the entire population of NB (64%). Correspondingly, a greater proportion of individuals with COPD attained less than secondary graduation (28%), which is lower than the
proportion of the NB population who attained an educational level lower than secondary
graduation (17%).
In Figure 9, health zone 4/5 represents a major deviation from provincial trends, with 35% of the
population diagnosed with COPD having attained a post-secondary degree, in contrast to the 54% of New Brunswick’s population with COPD who attained a post-secondary degree—a
difference of 19%. Further, the proportion of the entire population in health zone 4/5 that
attained a secondary degree is 11% lower (53% vs. 64%) than the provincial average.
Figure 8. Provincial presentation of educational attainment among individuals with COPD vs.
educational attainment among all individuals over the age of 35
54%
64%
3%
4%15%
15%
28%
17%
0%
10%
20%
30%
40%
50%
60%
70%
80%
90%
100%
COPD Dx NB Pop
Post-secondary Some post-secondary Secondary grad Less than secondary grad

Page 14
Figure 9. Health zone breakdown of educational attainment among individuals with COPD vs. the
educational attainment among all individuals over the age of 35
54%
66%
57%
68%
59%
66%
35%
53%
58%63%
5%
4%
2%
4%
2%
4%
5%
4%
3%
4%
17%
15%
15%
17%
19%
16%
13%
15%
12%
14%
23%
15%
26%
12%
20%
14%
47%
28% 27%
20%
0%
10%
20%
30%
40%
50%
60%
70%
80%
90%
100%
COPDDx
HZPop
COPDDx
HZPop
COPDDx
HZPop
COPDDx
HZPop
COPDDx
HZPop
Health Zone 1 Health Zone 2 Health Zone 3 Health Zone 4/5 Health Zone 6/7
Post-secondary Some post-secondary Secondary grad Less than secondary grad

Page 15
Quality of Life Information
Quality of life items reported here include self-perceived health, life stress, difficulty with
activities, needing help with instrumental activities of daily living, work status in the previous week, and type of work.
Self-Perceived Health
Figures 10 and 11 describe self-perceived health. At the provincial level, 80% of the general respondents in NB reported excellent/very good/good self-perceived health, while only 47% of
individuals in NB diagnosed with COPD reported excellent/very good/good self-perceived health.
At the health zone level, two areas deviated observably from provincial values. In health zone 4/5, fewer individuals diagnosed with COPD (41%) reported excellent/very good/good self-
perceived health in comparison to the average reporting (47%) of New Brunswickers. Health
zone 3 demonstrated the opposite trend, with a higher number of individuals with COPD reporting excellent/very good/good self-perceived health (53% vs. 47%).
Figure 10. Provincial presentation of poor self-perceived health among individuals with COPD vs.
poor self-perceived health among all individuals over the age of 35
Figure 11. Health zone breakdown of poor self-perceived health among individuals with COPD
vs. poor self-perceived health of individuals over the age of 35 in each health zone
53%
20%0%
20%
40%
60%
80%
100%
COPD Dx NB PopFair/Poor
50%
20%
55%
18%
47%
17%
59%
25%
53%
23%
0%
10%
20%
30%
40%
50%
60%
70%
80%
90%
100%
COPDDx
HZPop
COPDDx
HZPop
COPDDx
HZPop
COPDDx
HZPop
COPDDx
HZPop
Health Zone 1 Health Zone 2 Health Zone 3 Health Zone 4/5 Health Zone 6/7Fair/Poor

Page 16
Life Stress
Figures 12 and 13 present the relation between COPD and life stress. At the provincial level, more individuals living with COPD (29%) report quite a bit/extreme levels of life stress than seen in the
general population (21%). This trend is generally replicated at the health zone level, though health zone 6/7 differs, as more individuals who reported COPD (36%) reported quite a
bit/extreme levels of life stress in comparison to the provincial value (29%).
Figure 12. Provincial presentation of the proportion of NBers with COPD reporting quite a
bit/extreme levels of life stress vs. the proportion of individuals over the age of 35 reporting quite
a bit/extreme levels of life stress
Figure 13. Health zone breakdown of the proportion of individuals with COPD reporting quite a
bit/extreme levels of life stress vs. the proportion of individuals over the age of 35 reporting quite
a bit/extreme levels of life stress
29%21%
0%
10%
20%
30%
40%
50%
60%
70%
80%
90%
100%
COPD Dx NB Pop
Quite a bit/Extreme
28%20% 26% 21% 27%
20%29% 26%
36%
18%
0%
10%
20%
30%
40%
50%
60%
70%
80%
90%
100%
COPDDx
HZPop
COPDDx
HZPop
COPDDx
HZPop
COPDDx
HZPop
COPDDx
HZPop
Health Zone 1 Health Zone 2 Health Zone 3 Health Zone 4/5 Health Zone 6/7
Quite a bit/Extreme

Page 17
Difficulty with Activities
Figures 14 and 15 describe the breakdown of individuals having difficulties performing activities. Among all NBers, 67% of individuals reported never having difficulty with activities. In contrast,
36% of individuals who reported a COPD diagnosis reported never having difficulty with activities. Correspondingly, while 16% of individuals in NB reported often having difficulties with
activities, 38% of individuals who reported a COPD diagnosis described often having difficulties.
These trends were repeated at the lower geographies generally, with health zone 6/7 having a greater proportion (42%) of individuals living with COPD who reported often having difficulties in
comparison to the provincial response (36%).
Figure 14. Proportion of individuals with COPD who report sometimes/often having difficulty with
activities vs. the proportion of all individuals over the age of 35 who report sometimes/often
having difficulty with activities
Figure 15. Health zone breakdown of the proportion of individuals with COPD who report
sometimes/often having difficulty with activities vs. the proportion of all individuals over the age
of 35 who report sometimes/often having difficulty with activities
26%17%
38%
16%0%
10%
20%
30%
40%
50%
60%
70%
80%
90%
100%
COPD Dx NB pop
Sometimes has difficulties Often has difficulties
0%
10%
20%
30%
40%
50%
60%
70%
80%
90%
100%
COPD Dx HZ Pop COPD Dx HZ Pop COPD Dx HZ Pop COPD Dx HZ Pop COPD Dx HZ Pop
Health Zone 1 Health Zone 2 Health Zone 3 Health Zone 4/5 Health Zone 6/7Sometimes has difficulties Often has difficulties

Page 18
Needed Help with Instrumental Activities of Daily Living (IADL)
Figures 16 and 17 describe whether individuals needed help with instrumental activities of daily living (IADL). IADLs include activities like preparing meals, getting to and from appointments,
doing housework, personal care, moving about inside the house, and looking after finances. Among the entire population surveyed, only 17% of individuals reported needing help with IADLs.
In contrast, 41% of individuals with COPD reported needing help. This trend continues in the
health zone geographies, though zone 6/7 shows some discrepancy from provincial values.
Figure 16. Proportion of individuals with COPD who reported needing help with instrumental
activities of daily living vs. the proportion of all individuals over the age of 35 who reported
needing help with instrumental activities of daily living
Figure 17. Health zone breakdown of the proportion of individuals with COPD who reported
needing help with instrumental activities of daily living vs. the proportion of all individuals over
the age of 35 who reported needing help with instrumental activities of daily living
41%
17%
0%
10%
20%
30%
40%
50%
60%
70%
80%
90%
100%
COPD Dx NB Pop
Needed help
42%
13%
41%
13%
40%
12%
46%
15%
37%
13%0%
10%
20%
30%
40%
50%
60%
70%
80%
90%
100%
COPD POP COPD POP COPD POP COPD POP COPD POP
Health Zone 1 Health Zone 2 Health Zone 3 Health Zone 4/5 Health Zone 6/7
Needed help

Page 19
Working Status Last Week
Figures 18 and 19 describe survey respondents’ work status during the week prior to their completion of the survey. Across NB, more individuals who reported COPD reported being
unable to work/being on permanent disability (16%) compared to the proportion of NBers who reported being unable to work (5%). At the health zone level, few of the health zones had
numbers that matched provincial values. In particular, in health zone 4/5, a larger proportion of
individuals with COPD (24%) indicated they were unable to work, in contrast to 8% of all NBers in the region.
Figure 18. Proportion of individuals with COPD who reported being unable to work/being on
permanent disability vs. the proportion of all individuals over the age of 35 who reported being
unable to work/being on permanent disability
Figure 19. Health zone breakdown of the proportion of individuals with COPD who reported being
unable to work/being on permanent disability vs. the proportion of all individuals over the age of
35 who reported being unable to work/being on permanent disability
16%5%0%
20%
40%
60%
80%
100%
COPD Dx NB PopUnable to work
14%
3%
15%6%
14%4%
24%
8%15%
5%
-10%
10%
30%
50%
COPD POP COPD POP COPD POP COPD POP COPD POP
Health Zone 1 Health Zone 2 Health Zone 3 Health Zone 4/5 Health Zone 6/7
Unable to work

Page 20
Health Behaviours Health behaviour items included below account for the relation between COPD and type of
smoker and degree of physical activity.
Type of Smoker
Figures 20 and 21 describe the smoking activity of survey respondents. At the provincial level,
daily and former daily (31% vs. 20%) smoking patterns are over-represented among individuals who reported COPD, with never smoking patterns making up a smaller proportion (26% vs. 34%).
Similar trends occur at the health zone level.
Figure 20. Proportion of individuals with COPD by reported smoker type vs. proportion of all
individuals over the age of 35 by reported smoker type
Note: values will not sum to 100%. We suppressed the “always occasional”, “former occasional”, and “occasional” smoker categories to facilitate graph legibility.
Figure 21. Health zone breakdown of the proportion of individuals with COPD by reported smoker
type vs. proportion of all individuals over the age of 35 by reported smoker type
Note: values will not sum to 100%. We suppressed the “always occasional,” “former occasional,” and “occasional” smoker categories to facilitate graph legibility.
31%20%
33%
30%
26%34%
COPD Dx NB Pop
DAILY FORMER DAILY NEVER SMOKED
0%
10%
20%
30%
40%
50%
60%
70%
80%
90%
100%
COPD Dx HZ Pop COPD Dx HZ Pop COPD Dx HZ Pop COPD Dx HZ Pop COPD Dx HZ Pop
Health Zone 1 Health Zone 2 Health Zone 3 Health Zone 4/5 Health Zone 6/7
DAILY FORMER DAILY NEVER SMOKED

Page 21
Physical Inactivity
Figures 22 and 23 describe physical activity levels. At the provincial level, there was a greater proportion (70%) of individuals who reported COPD and reported being inactive (average daily
physical activity over the previous three months) compared to the proportion of the general population who reported being inactive (58%). Among the health zones, only 6/7 showed a
strong deviation from the provincial values: 63% of the individuals who reported COPD reported
being inactive, compared to the provincial value of 70%.
Figure 22. Proportion of individuals with COPD who reported being inactive vs. proportion of all
individuals over the age of 35 who reported being inactive
Figure 23. Health zone breakdown of the proportion of individuals with COPD who reported being
inactive vs. proportion of all individuals over the age of 35 who reported being inactive
70%58%
0%
10%
20%
30%
40%
50%
60%
70%
80%
90%
100%
COPD Dx NB PopInactive
69%56%
73%
56%71%
61%73%
60% 63% 58%
0%
10%
20%
30%
40%
50%
60%
70%
80%
90%
100%
COPDDx
HZPop
COPDDx
HZPop
COPDDx
HZPop
COPDDx
HZPop
COPDDx
HZPop
Health Zone 1 Health Zone 2 Health Zone 3 Health Zone 4/5 Health Zone 6/7
Inactive

Page 22
Health Conditions The health condition items discussed below in relation to COPD include body mass index (BMI),
blood pressure, asthma, heart disease, diabetes, and cancer.
Body Mass Index
Figures 24 and 25 describe the distribution of reported BMI. At the provincial level, a greater proportion (51%) of individuals living with COPD reported BMI values that would classify them as
overweight or obese, while only 44% of individuals in NB reported BMI values that would classify
them as overweight or obese. Among the health zones, while most show similar trends as those observed at the provincial level, health zone 3 has an interesting trend. The proportion of
individuals with a BMI that classifies them as overweight or obese is lower than the provincial average among individuals with a diagnosis of COPD (both are 46%) and shows parity to both
the health zone and provincial proportions of the entire population.
Figure 24. Provincial presentation of BMI for individuals with COPD vs. BMI for all individuals over
the age of 35
3% 2%
45%54%
51%
44%
0%
10%
20%
30%
40%
50%
60%
70%
80%
90%
100%
COPD Dx NB Pop
Underweight Normal weight Overweight/Obese
Page 23
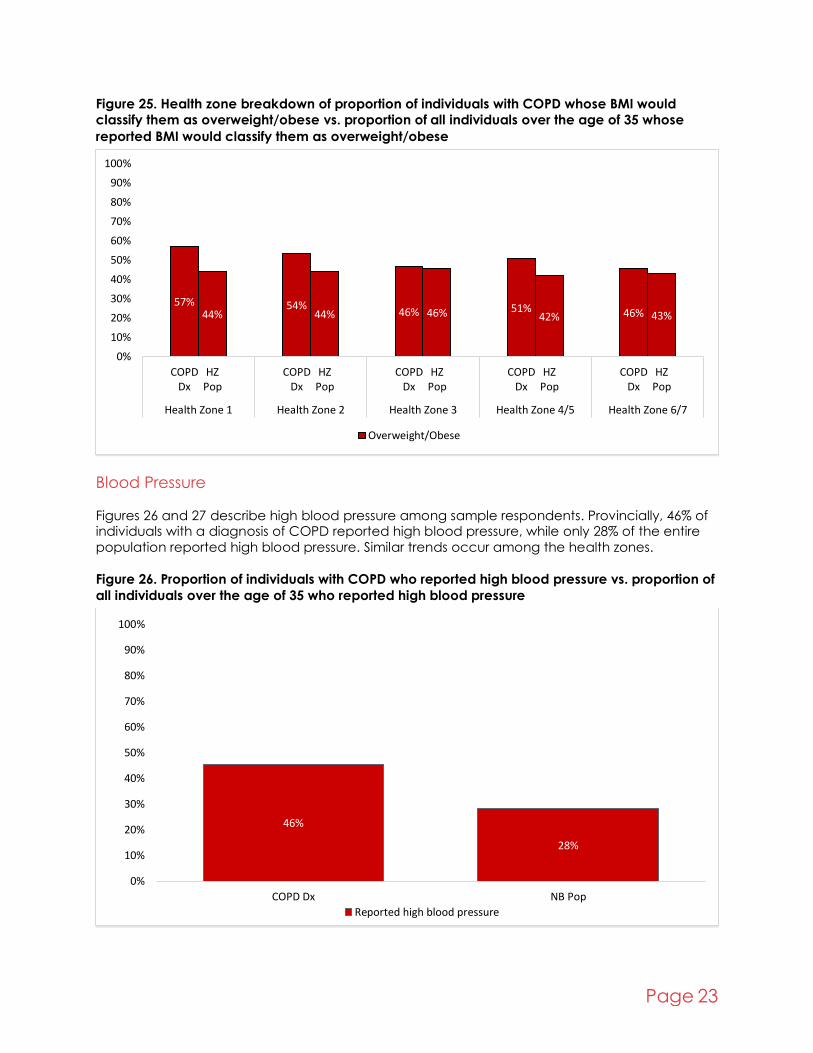
Figure 25. Health zone breakdown of proportion of individuals with COPD whose BMI would
classify them as overweight/obese vs. proportion of all individuals over the age of 35 whose
reported BMI would classify them as overweight/obese
Blood Pressure
Figures 26 and 27 describe high blood pressure among sample respondents. Provincially, 46% of individuals with a diagnosis of COPD reported high blood pressure, while only 28% of the entire
population reported high blood pressure. Similar trends occur among the health zones.
Figure 26. Proportion of individuals with COPD who reported high blood pressure vs. proportion of
all individuals over the age of 35 who reported high blood pressure
57%44%
54%44% 46% 46% 51%
42% 46% 43%
0%
10%
20%
30%
40%
50%
60%
70%
80%
90%
100%
COPDDx
HZPop
COPDDx
HZPop
COPDDx
HZPop
COPDDx
HZPop
COPDDx
HZPop
Health Zone 1 Health Zone 2 Health Zone 3 Health Zone 4/5 Health Zone 6/7
Overweight/Obese
46%
28%
0%
10%
20%
30%
40%
50%
60%
70%
80%
90%
100%
COPD Dx NB Pop
Reported high blood pressure

Page 24
Figure 27. Health zone breakdown of the proportion of individuals with COPD who reported high
blood pressure vs. proportion of all individuals over the age of 35 who reported high blood
pressure
Asthma Figures 28 and 29 describe the prevalence of asthma diagnoses. Provincially, 34% of individuals
with a diagnosis of COPD also had a diagnosis of asthma, while only 7% of individuals in the full population had a diagnosis of asthma. The health zone geographies demonstrated a great deal
of variation from the provincial values. In particular, COPD/asthma comorbidity was higher than
the provincial value (34%) in health zones 1 (38%), 4/5 (39%), and 6/7 (40%). Conversely, it was lower in health zone 2 (26%).
Figure 28. Proportion of individuals with COPD who reported an asthma diagnosis vs. proportion
of individuals over the age of 35 who reported an asthma diagnosis
48%
27%
48%
29%44%
27%42%
28%
45%31%
0%
10%
20%
30%
40%
50%
60%
70%
80%
90%
100%
COPDDx
HZPop
COPDDx
HZPop
COPDDx
HZPop
COPDDx
HZPop
COPDDx
HZPop
Zone 1 Zone 2 Zone 3 Zone 4/5 Zone 6/7
Reported high blood pressure
34%
7%0%
10%
20%
30%
40%
50%
60%
70%
80%
90%
100%
COPD Dx NB Pop
Reported having asthma

Page 25
Figure 29. Health zone breakdown of the proportion of individuals with COPD who reported an
asthma diagnosis vs. proportion of individuals over the age of 35 who reported an asthma
diagnosis
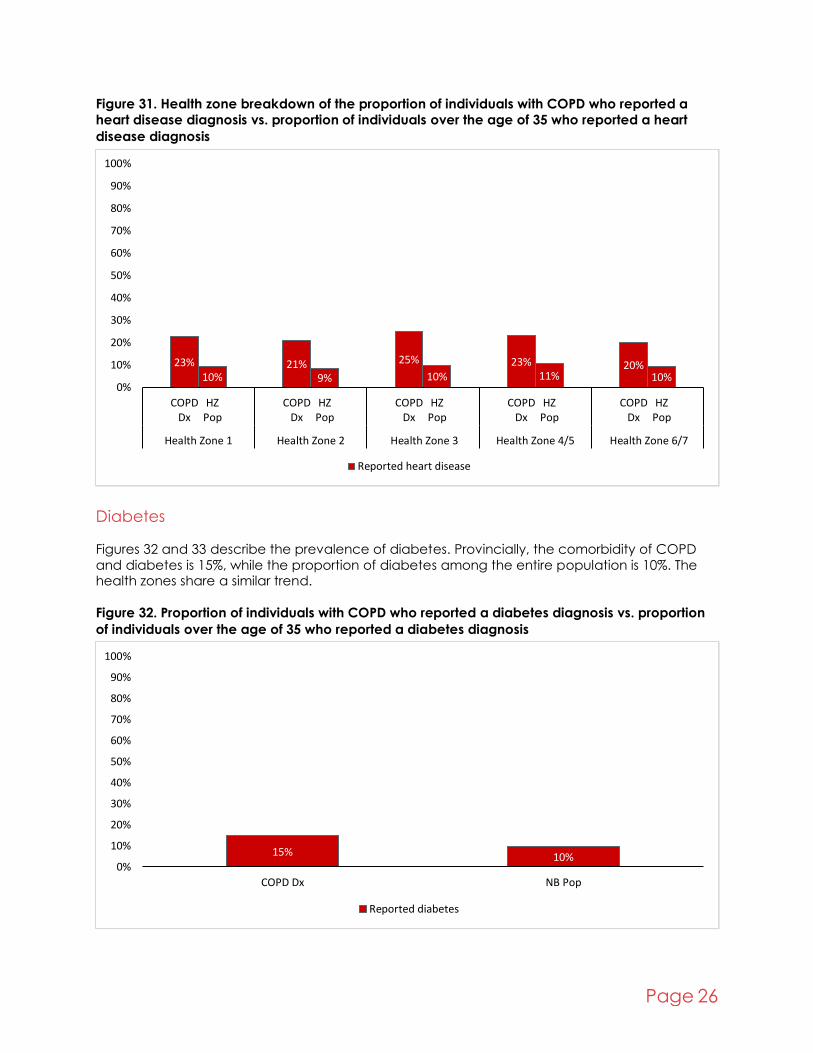
Heart Disease
Figures 30 and 31 describe the prevalence of heart disease diagnoses. Provincially, the comorbidity of COPD and heart disease was 22%. In contrast, the proportion of heart disease
diagnoses among the entire population was 10%. The health zones share a similar trend.
Figure 30. Proportion of individuals with COPD who reported a heart disease diagnosis vs.
proportion of individuals over the age of 35 who reported a heart disease diagnosis
38%
8%
26%
7%
33%
7%
39%
7%
40%
8%0%
10%
20%
30%
40%
50%
60%
70%
80%
90%
100%
COPDDx
HZPop
COPDDx
HZPop
COPDDx
HZPop
COPDDx
HZPop
COPDDx
HZPop
Health Zone 1 Health Zone 2 Health Zone 3 Health Zone 4/5 Health Zone 6/7
Reported having asthma
22%10%
0%
10%
20%
30%
40%
50%
60%
70%
80%
90%
100%
COPD Dx NB Pop
Reported heart disease
Page 26
Figure 31. Health zone breakdown of the proportion of individuals with COPD who reported a
heart disease diagnosis vs. proportion of individuals over the age of 35 who reported a heart
disease diagnosis
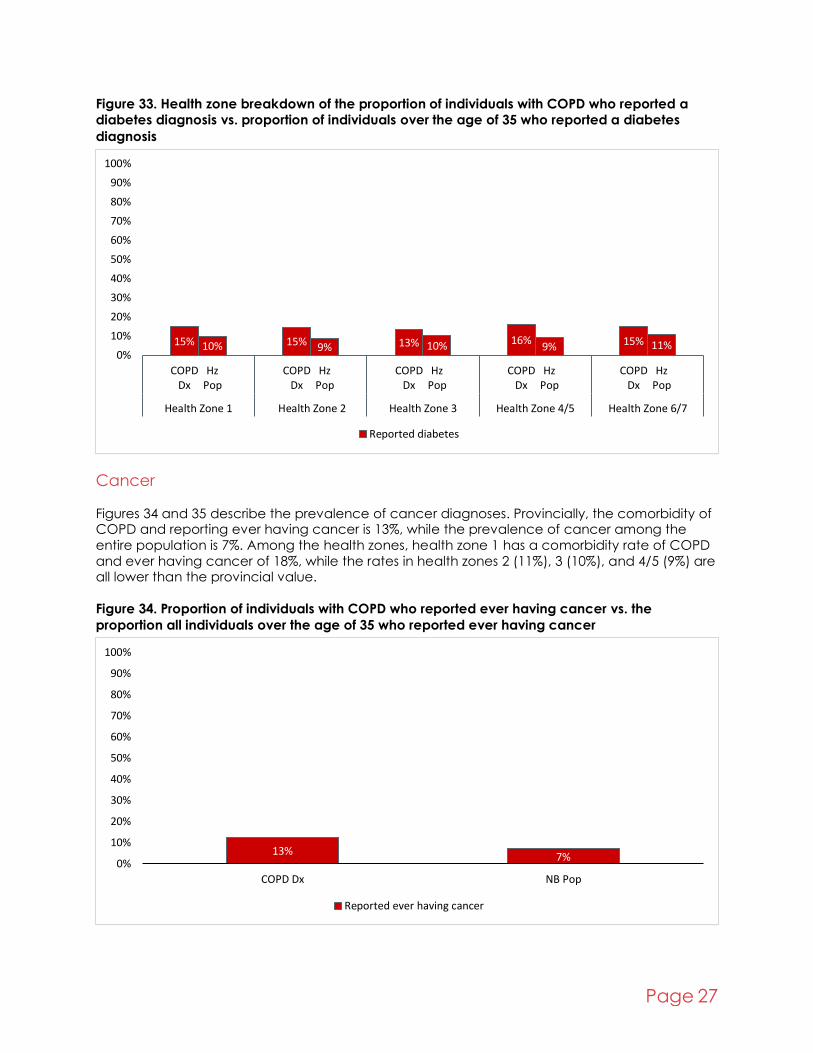
Diabetes Figures 32 and 33 describe the prevalence of diabetes. Provincially, the comorbidity of COPD
and diabetes is 15%, while the proportion of diabetes among the entire population is 10%. The health zones share a similar trend.
Figure 32. Proportion of individuals with COPD who reported a diabetes diagnosis vs. proportion
of individuals over the age of 35 who reported a diabetes diagnosis
23%10%
21%9%
25%
10%23%
11%20%
10%0%
10%
20%
30%
40%
50%
60%
70%
80%
90%
100%
COPDDx
HZPop
COPDDx
HZPop
COPDDx
HZPop
COPDDx
HZPop
COPDDx
HZPop
Health Zone 1 Health Zone 2 Health Zone 3 Health Zone 4/5 Health Zone 6/7
Reported heart disease
15% 10%0%
10%
20%
30%
40%
50%
60%
70%
80%
90%
100%
COPD Dx NB Pop
Reported diabetes
Page 27
Figure 33. Health zone breakdown of the proportion of individuals with COPD who reported a
diabetes diagnosis vs. proportion of individuals over the age of 35 who reported a diabetes
diagnosis
Cancer
Figures 34 and 35 describe the prevalence of cancer diagnoses. Provincially, the comorbidity of COPD and reporting ever having cancer is 13%, while the prevalence of cancer among the
entire population is 7%. Among the health zones, health zone 1 has a comorbidity rate of COPD
and ever having cancer of 18%, while the rates in health zones 2 (11%), 3 (10%), and 4/5 (9%) are all lower than the provincial value.
Figure 34. Proportion of individuals with COPD who reported ever having cancer vs. the
proportion all individuals over the age of 35 who reported ever having cancer
15% 10% 15% 9% 13% 10% 16%9% 15% 11%
0%
10%
20%
30%
40%
50%
60%
70%
80%
90%
100%
COPDDx
HzPop
COPDDx
HzPop
COPDDx
HzPop
COPDDx
HzPop
COPDDx
HzPop
Health Zone 1 Health Zone 2 Health Zone 3 Health Zone 4/5 Health Zone 6/7
Reported diabetes
13% 7%0%
10%
20%
30%
40%
50%
60%
70%
80%
90%
100%
COPD Dx NB Pop
Reported ever having cancer

Page 28
Figure 35. Health zone breakdown of the proportion of individuals with COPD who reported ever
having cancer vs. the proportion all individuals over the age of 35 who reported ever having
cancer
Summary of Select Results
The findings in this report demonstrate the efficacy of the CCHS, and in particular the CCHS PUMFs for exploring aspects of everyday life often not captured in administrative data systems
such the CCDSS and NB-CHIP—such as social determinants of health, health behaviours, and
health status. Broadly, quality of life and health conditions are universally worse among NBers living with COPD, provincially and regionally. Further, specific social determinants of health
(marital status of separated/divorced/ widowed, low education, job loss) often associated with
poor health outcomes are strongly associated with a COPD diagnosis in New Brunswick.
Table 2 describes a select set of results from the previous section, including both provincial and
health zone level findings. Finally, the availability of both provincial and health zone level geographical information allows us to identify the instances when observed health zone level
trends deviate from the provincial level trends. These comparisons can allow for more detailed
planning and targeted interventions where possible and necessary.
Table 2. Select findings from provincial and health zone comparisons between individuals with a
COPD diagnosis and the full population of the area
Covariate NB level Health zone level
Marital status 28% of NBers with a COPD diagnosis are “widowed/
separated/divorced,” in contrast to 17% of all NBers
Trend also observed in all health zones
Education 28% of NBers with a COPD
diagnosis are “less than secondary grad,” in contrast
to 17% of all NBers
Trend observed in HZs as well,
but health zone 4/5 has a
much larger proportion of
adults over the age of 35
reporting an education level “less than secondary grad”:
18%
6%11%
7% 10% 7% 9% 7%14%
7%
0%
10%
20%
30%
40%
50%
60%
70%
80%
90%
100%
COPDDx
HZPop
COPDDx
HZPop
COPDDx
HZPop
COPDDx
HZPop
COPDDx
HZPop
Health Zone 1 Health Zone 2 Health Zone 3 Health Zone 4/5 Health Zone 6/7Reported ever having cancer

Page 29
28% (in contrast to 17% across NB) for residents of the health
zone.
The high proportion of adults
reporting lower levels of
education extends to the population living with COPD,
where 47% of individuals
reported having an education level “less than
secondary grad”
Quality of life 54% of NBers with COPD indicate their “quality of life is
poor,” while only 20% of all
NBers said the same
Similar trend observed in the health zones
Life stress 29% of NBers with COPD
indicate experiencing “quite a bit/ a lot of life stress”, in
contrast to 1/5 of all NBers
Similar trends observed in
health zones, except health
zone 6/7, where 36% of
residents reporting “quite a bit of life stress,” compared to
only 18% of all residents of
that zone
Difficulties with activities 64% of NBers with COPD
indicate they “sometimes/
often have difficulties with activities,” in comparison to
33% of all NBers
Similar trend observed in all
the health zones, with health
zone 6/7 appearing
particularly affected
Needed help with IADLs 41% of NBers living with COPD “needed help with activities,”
in contrast to 17% of the full
population
Similar trend observed in the health zones
Working status 16% of NBers with COPD and
5% of the full population
indicate they were unable to work
Similar trends in the health
zones, except for health zone
4/5, where almost a quarter
of individuals living with
COPD were unable to work
Type of smoker 71% of NBers with COPD
smoked at some point in their
lives, compared to 63% of all NBers
Similar trends in health zones
Blood pressure 46% of NBers living with COPD
had high blood pressure, compared to 28% of all NBers
Similar health zone trends
Asthma 37% of NBers living with COPD
had asthma, compared to 7% of all NBers
Similar health zone trends
Heart disease 22% of NBers living with COPD
had heart disease, compared to 10% of all NBers
Similar health zone trends

Page 30
CCHS PUMF Limitations The PUMF data have several limitations worth noting. First, privacy concerns limit the detail of the
data available in the PUMF. Often, StatCan aggregates their microdata into larger geographies
and categories to address privacy and sample size issues. While we could easily analyze and communicate New Brunswick trends, disaggregating to any lower geography requires
compromises in data analysis and presentation.
For example, to present the health zone information included in this report, we had to combine
health zones 4 and 5 and 6 and 7 into single units (4/5 and 6/7) to be able to meet the disclosure requirements to report relevant results. While smaller than the province, health zones are still fairly
large geographies and, as such, have a greater risk of succumbing to the ecological fallacy—
the risk of attributing area-level effects to individuals within an area.
Unfortunately, due to sample size issues and privacy concerns in the PUMF, it was not possible to
look at smaller geographies. The collapsing of detail within the PUMF data also prevents us from undertaking complex statistical approaches. For example, to reduce identifiability of the data as
described above, the PUMF presents age as a pre-existing categorical variable of ten-year age
groupings. This prevents us from fully controlling for age as a confounding variable when looking at the relationship between COPD and other variables.
Another issue associated with CCHS PUMF data is that the data are not complete over the course of the time period we are considering. As noted in the methodology section, this report
does not include CCHS PUMF data for 2002, 2004, and 2006. The major issue with this is that it
prevents researchers from fully describing the annual incidence of COPD in NB. Finally, due to the cross-sectional nature of the CCHS, it is not possible to follow the experiences of individual
respondents over time. Every survey implemented is done with a new cohort of individuals not
associated with respondents from previous survey iterations.
CCHS Research Data Centre Access
There are multiple ways to access StatCan data. PUMF is more accessible but has several restrictions in place to protect respondent confidentiality. In instances when CCHS PUMF
limitations prove too restrictive to answer research questions, another option is available.
StatCan makes available the CCHS microdata files to researchers through their Research Data Centre program. Data available in the RDC have different restrictions in place to protect the
confidentiality of respondents. For example, unlike its PUMF counterpart, CCHS data in the RDC
can be looked at in much smaller geographies. Further, there are more opportunities for more complex statistical investigation—unlike the PUMF data, where levels variables are collapsed to
protect respondent confidentiality, the RDC CCHS permits detailed examination of variables.
For example, age can be examined as a continuous variable, rather than as age categories. Further, within the RDC environment, StatCan has linked the CCHS with various other data
products such as the Census, Vital Statistics, Taxfiler information, and multiple health service use
datasets, allowing even more complex questions to be answered.
The RDC data centres provide increased analytical opportunities at the expense of ease of use,
immediate and timely access, and administrative processes associated with accessing the data. Since PUMF data have several built-in methods of protecting confidentiality, they are more
readily and immediately available without any administrative requirements. By contrast,
accessing data in the RDC requires that interested parties complete an application process and undergo a screening process to increase the safety of the less confidential data.

Page 31
Conclusion While the CCHS PUMF data have several limitations, they prove useful in developing a basic
understanding of COPD trends in NB, allowing us to examine the relationship between a variety
of variables and COPD at both the provincial and health zone levels. Further, the CCHS PUMF has a large number of items to choose from to explore their role in COPD, many of which are not
available in other data sources. Finally, the CCHS is a nationally weighted representative sample with relative ease of access compared to other data sources. These strengths allow us to create
a detailed report of COPD trends in NB, while the identified limitations provide us with a starting
point for future iterations of research.
In particular, the CCHS data allow us to understand how COPD is associated with an individual’s
quality of life. These are important elements of the burden of COPD that are rarely captured in administrative data sources, and they describe in detail the devastating effects COPD can have
on an individual beyond their immediate health. For example, the fact that a much higher
proportion of individuals with COPD (Figures 18/19) reports an inability to work in comparison to the general population suggests they may represent a good population to target with some sort
of financial aid. It is insights like this that demonstrate the value of the CCHS data.

Page 32
References
1. Muggah E, Graves E, Bennett C, Manuel DG. Ascertainment of chronic diseases using
population health data: a comparison of health administrative data and patient self-report. BMC Public Health. 2013;13:16.
2. Singh JA. Accuracy of Veterans Affairs databases for diagnoses of chronic diseases. Prev
Chronic Dis. 2009;6(4):A126. 3. Lix LM, Yogendran MS, Shaw SY, Burchill C, Metge C, Bond R. Population-based data
sources for chronic disease surveillance. Chronic Dis Can. 2008;29(1):31-8.
4. Public Health Agency of Canada. Report from the Canadian Chronic Disease Surveillance System: Asthma and Chronic Obstructive Pulmonary Disease (COPD) in Canada,
2018. 2018.
5. Government of New Brunswick Department of Health. Profiles on Health: Chronic obstructive pulmonary disease (COPD) in New Brunswick. 2016.
6. Statistics Canada. Health characteristics, annual estimates 2018 [Available from:
https://www150.statcan.gc.ca/t1/tbl1/en/cv.action?pid=1310009601 7. Public Health Infobase. Summary Table: Chronic obstructive pulmonary disease, age-
standardized incidence rate, per 100,000, age 35 years and older, Canada. In:
PHAC_Infobase_CCDSS_-8585885357273050366, editor. Excel: Public Health Agency of Canada,; 2018.
8. Statistics Canada. Canadian Community Health Survey - Annual Component (CCHS)
2020 [Available from: https://www23.statcan.gc.ca/imdb/p2SV.pl?Function=getSurvey&SDDS=3226.
9. Statistics Canada. Public Use Microdata File (PUMF) Collection 2011 [Available from: https://www150.statcan.gc.ca/n1/pub/11-625-x/11-625-x2010000-eng.htm.
10. University of New Brunswick. Data Services [Available from:
https://lib.unb.ca/gddm/data. 11. Statistics Canada. Data Liberation Initiatve: Nestar.
12. Statistics Canada. Canadian Community Health Survey: Public Use Microdata File.
Government of Canada; 2020. 13. Patterns and health effects of caring for people with dementia: the impact of changing
cognitive and residential status. Gerontologist. 2002;42(5):643-52.


![Downloaded from ijal.khu.ac.ir at 14:45 IRDT on Thursday ... · Downloaded from ijal.khu.ac.ir at 14:45 IRDT on Thursday July 30th 2020 [ DOI: 10.18869/acadpub.ijal.18.1.29 ] IJAL,](https://img.pdfslide.us/doc/110x75/5fb1891b6d89856f7c0039b3/downloaded-from-ijalkhuacir-at-1445-irdt-on-thursday-downloaded-from-ijalkhuacir.jpg)