Embed Size (px)
Citation preview

SFVegas 2021 - Investor Presentation
October 2021
2© 2021 Navient Solutions, LLC. All rights reserved.
Forward-Looking Statements; Non-GAAP Financial
MeasuresThe following information is current as of June 30, 2021 (unless otherwise noted) and should be read in connection with Navient Corporation’s “Navient” Annual Report on Form 10-K for the year ended December 31, 2020 (the “2020 Form 10-K”), filed by Navient with the Securities and Exchange Commission (the “SEC”) on February 26, 2021 and subsequent reports filed by Navient with the SEC. Definitions for capitalized terms in this presentation not defined herein can be found in the 2020 Form 10-K. This presentation contains “forward-looking statements”, within the meaning of the federal securities laws, about our business, and other information that is based on management’s current expectations as of the date of this presentation. Statements that are not historical facts, including statements about the company’s beliefs, opinions or expectations and statements that assume or are dependent upon future events, are forward-looking statements and often contain words such as “expect,” “anticipate,” “intend,” “plan,” “believe,” “seek,” “see,” “will,” “would,” “may,” “could,” “should,” “goal,” or “target.” Forward-looking statements are subject to risks, uncertainties, assumptions and other factors that may cause actual results to be materially different from those reflected in such forward-looking statements.
For Navient, these factors include, among others, the risks and uncertainties associated with:• the severity, magnitude and duration of the COVID-19 pandemic, including changes in the macroeconomic environment, restrictions on business, individual or travel activities intended to slow the spread of the pandemic and volatility in market conditions resulting from the pandemic including interest rates, the value of equities and other financial assets;• the risks and uncertainties associated with increases in financing costs;• unanticipated increases in costs associated with compliance with federal, state or local laws and regulations;• changes in the demand for asset management and business processing solutions or other changes in marketplaces in which we compete (including increased competition);• changes in accounting standards including but not limited to changes pertaining to loan loss reserves and estimates or other accounting standards that may impact our operations;• adverse outcomes in any significant litigation to which the company is a party;• credit risk associated with the company’s underwriting standards or exposure to third parties, including counterparties to hedging transactions; and• changes in the terms of education loans and the educational credit marketplace (including changes resulting from the CARES Act or other new laws and the implementation of existing laws).
The company could also be affected by, among other things:• unanticipated repayment trends on loans including prepayments or deferrals in our securitization trusts that could accelerateor delay repayment of the bonds;• reductions to our credit ratings, the credit ratings of asset-backed securitizations we sponsor or the credit ratings of the United States of America;• failures of our operating systems or infrastructure or those of third-party vendors;• risks related to cybersecurity including the potential disruption of our systems or those of our third-party vendors or customers or potential disclosure of confidential customer information;• damage to our reputation resulting from cyber-breaches, litigation, the politicization of student loan servicing or other actions or factors;• failure to successfully implement cost-cutting initiatives and adverse effects of such initiatives on our business;• failure to adequately integrate acquisitions or realize anticipated benefits from acquisitions including delays or errors in converting portfolio acquisitions to our servicing platform;• changes in law and regulations whether new laws or regulations or new interpretations of existing laws and regulations applicable to any of our businesses or activities or those of our vendors, suppliers or customers;• changes in the general interest rate environment, including the availability of any relevant money-market index rate, including LIBOR, or the relationship between the relevant money-market index rate and the rate at which our assets are priced;• our ability to successfully effectuate any acquisitions and other strategic initiatives;• activities by shareholder activists, including a proxy contest or any unsolicited takeover proposal;• changes in general economic conditions; and• the other factors that are described in the “Risk Factors” section of the 2020 Form 10-K and in our other reports filed with the Securities and Exchange Commission.
The preparation of the company’s consolidated financial statements also requires management to make certain estimates and assumptions including estimates and assumptions about future events. These estimates or assumptions may prove to be incorrect and actual results could differ materially. All forward-looking statements contained in this release are qualified by these cautionary statements and are made only as of the date of this release. The company does not undertake any obligation to update or revise these forward-looking statements except as required by law.
Navient reports financial results on a GAAP basis and also provides certain non-GAAP performance measures, including Core Earnings, Adjusted Tangible Equity Ratio, and various other non-GAAP financial measures derived from Core Earnings. When compared to GAAP results, Core Earnings exclude the impact of: (1) mark-to-market gains/losses on derivatives; and (2) goodwill and acquired intangible asset amortization and impairment. Navient provides Core Earnings measures because this is what management uses when making management decisions regarding Navient’s performance and the allocation of corporate resources. Navient Core Earnings are not defined terms within GAAP and may not be comparable to similarly titled measures reported by other companies. For additional information, see Core Earnings in Navient’s second quarter earnings release and pages 28 - 30 of this presentation for a further discussion and a complete reconciliation between GAAP net income and Core Earnings.
3© 2021 Navient Solutions, LLC. All rights reserved.
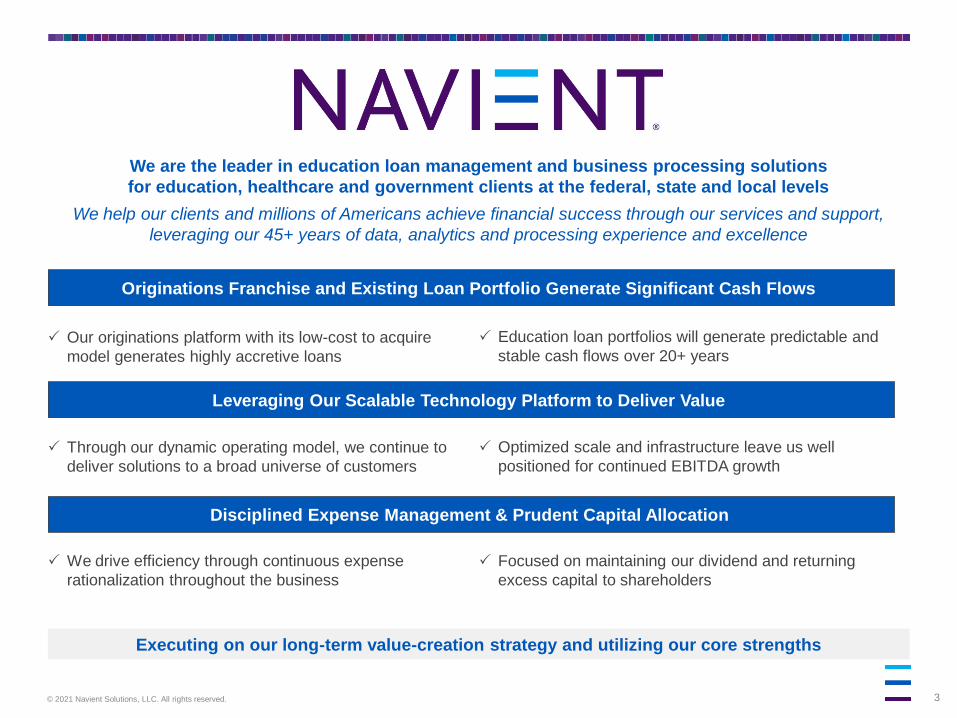
We are the leader in education loan management and business processing solutions
for education, healthcare and government clients at the federal, state and local levels
We help our clients and millions of Americans achieve financial success through our services and support,
leveraging our 45+ years of data, analytics and processing experience and excellence
Executing on our long-term value-creation strategy and utilizing our core strengths
Education loan portfolios will generate predictable and
stable cash flows over 20+ years Our originations platform with its low-cost to acquire
model generates highly accretive loans
Originations Franchise and Existing Loan Portfolio Generate Significant Cash Flows
Optimized scale and infrastructure leave us well
positioned for continued EBITDA growth
Leveraging Our Scalable Technology Platform to Deliver Value
Through our dynamic operating model, we continue to
deliver solutions to a broad universe of customers
Disciplined Expense Management & Prudent Capital Allocation
We drive efficiency through continuous expense
rationalization throughout the business
Focused on maintaining our dividend and returning
excess capital to shareholders
4© 2021 Navient Solutions, LLC. All rights reserved.
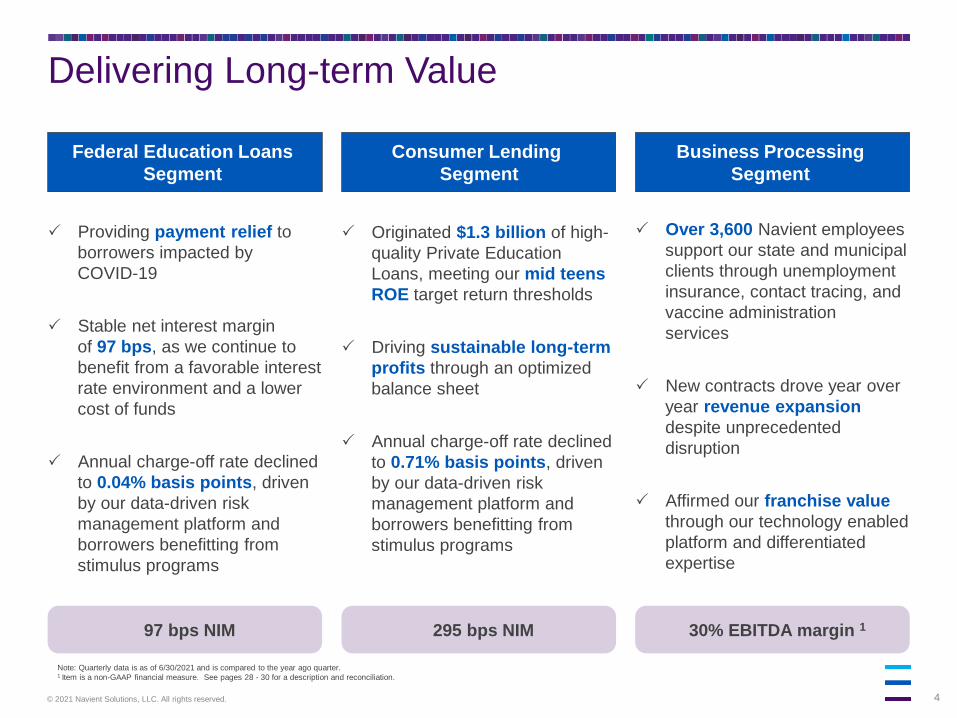
Federal Education Loans
Segment
Consumer Lending
Segment
Business Processing
Segment
Providing payment relief to
borrowers impacted by
COVID-19
Stable net interest margin
of 97 bps, as we continue to
benefit from a favorable interest
rate environment and a lower
cost of funds
Annual charge-off rate declined
to 0.04% basis points, driven
by our data-driven risk
management platform and
borrowers benefitting from
stimulus programs
Originated $1.3 billion of high-
quality Private Education
Loans, meeting our mid teens
ROE target return thresholds
Driving sustainable long-term
profits through an optimized
balance sheet
Annual charge-off rate declined
to 0.71% basis points, driven
by our data-driven risk
management platform and
borrowers benefitting from
stimulus programs
Over 3,600 Navient employees
support our state and municipal
clients through unemployment
insurance, contact tracing, and
vaccine administration
services
New contracts drove year over
year revenue expansion
despite unprecedented
disruption
Affirmed our franchise value
through our technology enabled
platform and differentiated
expertise
97 bps NIM 295 bps NIM 30% EBITDA margin 1
Note: Quarterly data is as of 6/30/2021 and is compared to the year ago quarter.1 Item is a non-GAAP financial measure. See pages 28 - 30 for a description and reconciliation.
Delivering Long-term Value
5© 2021 Navient Solutions, LLC. All rights reserved.
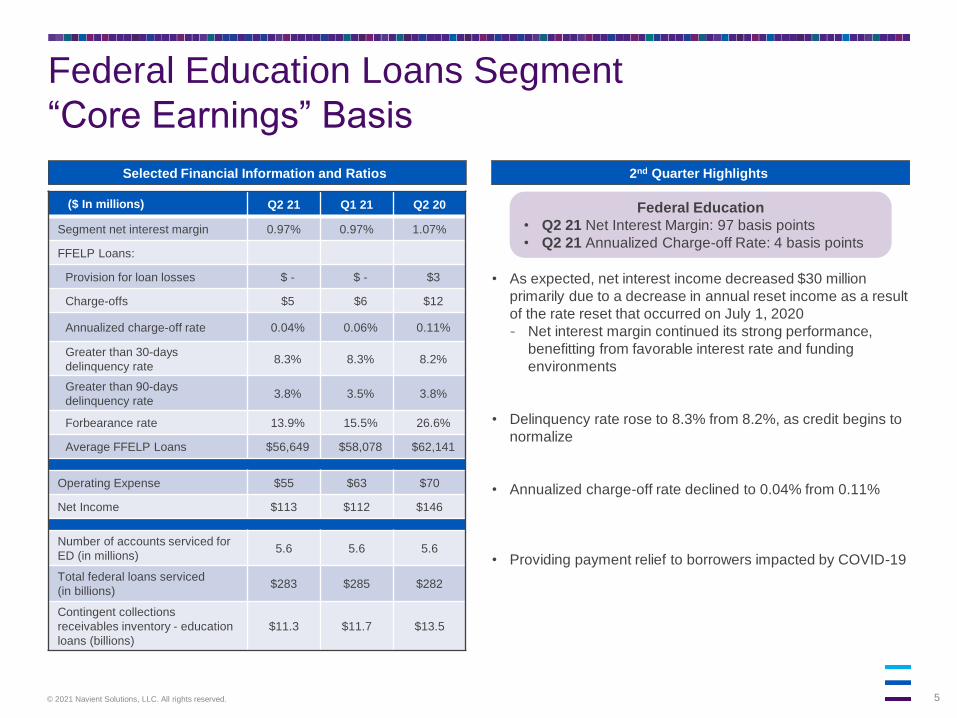
• As expected, net interest income decreased $30 million
primarily due to a decrease in annual reset income as a result
of the rate reset that occurred on July 1, 2020
- Net interest margin continued its strong performance,
benefitting from favorable interest rate and funding
environments
• Delinquency rate rose to 8.3% from 8.2%, as credit begins to
normalize
• Annualized charge-off rate declined to 0.04% from 0.11%
• Providing payment relief to borrowers impacted by COVID-19
Selected Financial Information and Ratios 2nd Quarter Highlights
Federal Education Loans Segment
“Core Earnings” Basis
($ In millions) Q2 21 Q1 21 Q2 20
Segment net interest margin 0.97% 0.97% 1.07%
FFELP Loans:
Provision for loan losses $ - $ - $3
Charge-offs $5 $6 $12
Annualized charge-off rate 0.04% 0.06% 0.11%
Greater than 30-days
delinquency rate8.3% 8.3% 8.2%
Greater than 90-days
delinquency rate3.8% 3.5% 3.8%
Forbearance rate 13.9% 15.5% 26.6%
Average FFELP Loans $56,649 $58,078 $62,141
Operating Expense $55 $63 $70
Net Income $113 $112 $146
Number of accounts serviced for
ED (in millions)5.6 5.6 5.6
Total federal loans serviced
(in billions)$283 $285 $282
Contingent collections
receivables inventory - education
loans (billions)
$11.3 $11.7 $13.5
Federal Education
• Q2 21 Net Interest Margin: 97 basis points
• Q2 21 Annualized Charge-off Rate: 4 basis points
6© 2021 Navient Solutions, LLC. All rights reserved.
Consumer Lending Segment
“Core Earnings” Basis
($ In millions) Q2 21 Q1 21 Q2 20
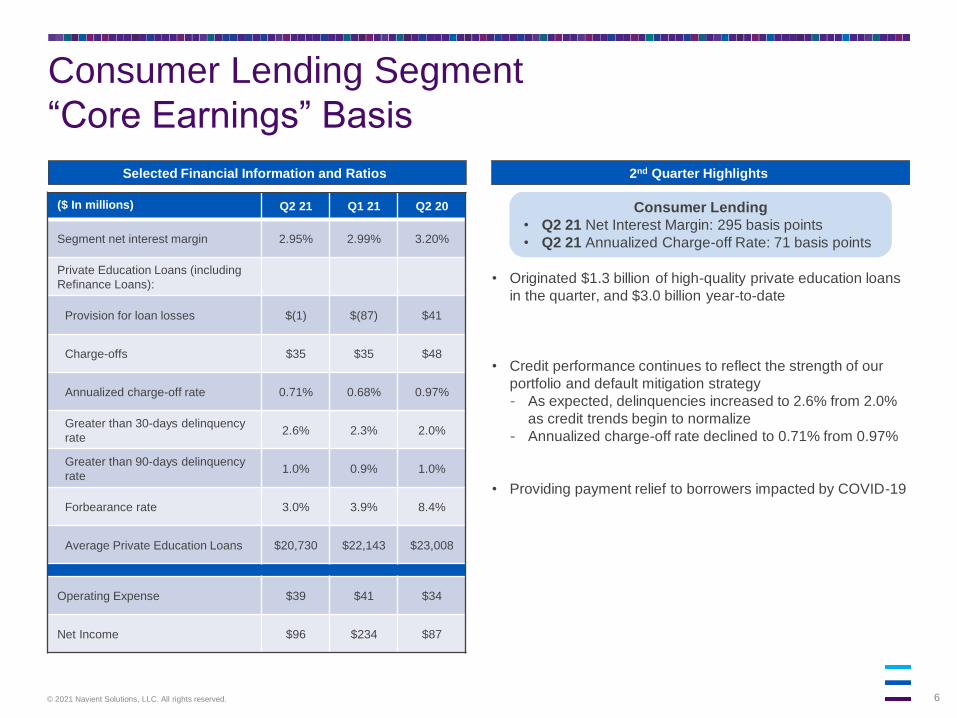
Segment net interest margin 2.95% 2.99% 3.20%
Private Education Loans (including
Refinance Loans):
Provision for loan losses $(1) $(87) $41
Charge-offs $35 $35 $48
Annualized charge-off rate 0.71% 0.68% 0.97%
Greater than 30-days delinquency
rate2.6% 2.3% 2.0%
Greater than 90-days delinquency
rate1.0% 0.9% 1.0%
Forbearance rate 3.0% 3.9% 8.4%
Average Private Education Loans $20,730 $22,143 $23,008
Operating Expense $39 $41 $34
Net Income $96 $234 $87
• Originated $1.3 billion of high-quality private education loans
in the quarter, and $3.0 billion year-to-date
• Credit performance continues to reflect the strength of our
portfolio and default mitigation strategy
- As expected, delinquencies increased to 2.6% from 2.0%
as credit trends begin to normalize
- Annualized charge-off rate declined to 0.71% from 0.97%
• Providing payment relief to borrowers impacted by COVID-19
Consumer Lending
• Q2 21 Net Interest Margin: 295 basis points
• Q2 21 Annualized Charge-off Rate: 71 basis points
Selected Financial Information and Ratios 2nd Quarter Highlights

7© 2021 Navient Solutions, LLC. All rights reserved.
Originating Education Loans is An Attractive
Opportunity
• Private Education Refinance Loans:
- Using our data and expertise to deploy capital
at mid-teens ROE
- Life of loan loss expectation of 1.25% 2
- Weighted average life of ~3.5 years
Leveraging Our Existing Infrastructure to Generate Value
• In-School Private Education Loans:
- Using our data and expertise to deploy capital
at high-teens ROE
- Life of loan loss expectations of 6% 2
- Weighted average life of ~8 years
1 Source: Navient estimates for total originations based on “Jennifer Ma, Matea Pender, and CJ Libassi (2020), Trends in
Student Aid 2020, New York: The College Board”; Navient estimates for average yields based on FSA Data Center and
third-party company filings.
Sizable Market With Attractive Yields1
Typical Refi Borrower Profile 3
Borrower Age 32
Months since Graduation 72
Education 60% advanced degrees
FICO 765
Income $130,994
Monthly Real Free Cash Flow $4,263
Original Loan Amount $69,304
Estimated Total Market Annual Originations and Yields ($’s in billions)
$11$10
$15
Estimated 2020 Originations
Grad PLUSIn-School Private Education LoansPrivate Education Refinance Loans
~5%
~8%
~4%
Estimated Average Yield
2 Life of loan loss expectations are on a gross basis.3 Weighted average.
8© 2021 Navient Solutions, LLC. All rights reserved.
Business Processing Segment
“Core Earnings” Basis
Selected Financial Information and Ratios 2nd Quarter Highlights
($ In millions) Q2 21 Q1 21 Q2 20
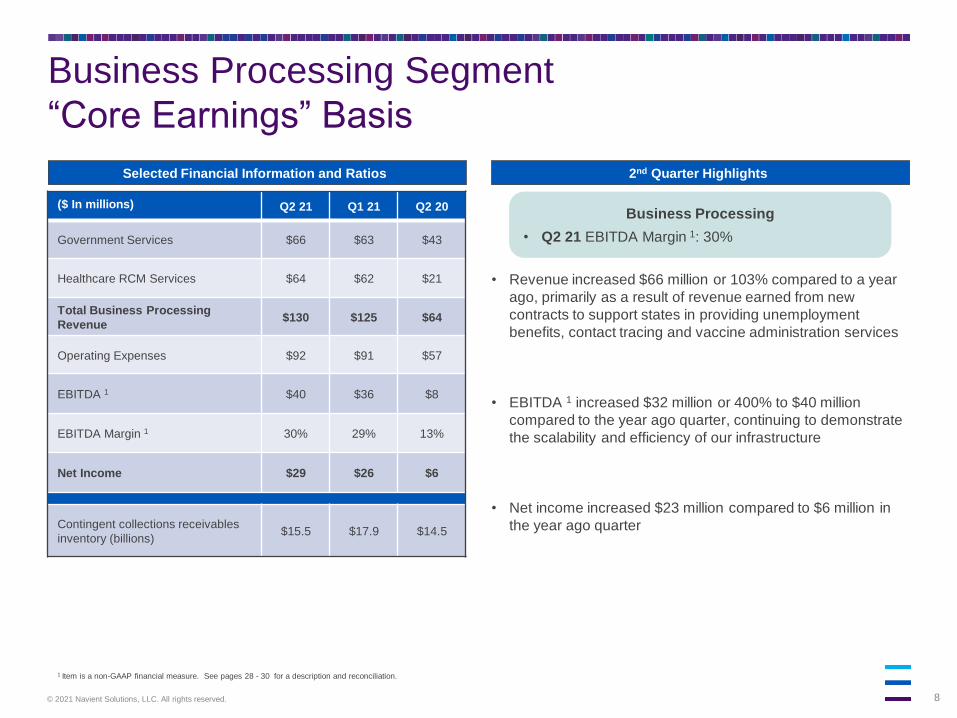
Government Services $66 $63 $43
Healthcare RCM Services $64 $62 $21
Total Business Processing
Revenue$130 $125 $64
Operating Expenses $92 $91 $57
EBITDA 1 $40 $36 $8
EBITDA Margin 1 30% 29% 13%
Net Income $29 $26 $6
Contingent collections receivables
inventory (billions)$15.5 $17.9 $14.5
1 Item is a non-GAAP financial measure. See pages 28 - 30 for a description and reconciliation.
Business Processing
• Q2 21 EBITDA Margin 1: 30%
• Revenue increased $66 million or 103% compared to a year
ago, primarily as a result of revenue earned from new
contracts to support states in providing unemployment
benefits, contact tracing and vaccine administration services
• EBITDA 1 increased $32 million or 400% to $40 million
compared to the year ago quarter, continuing to demonstrate
the scalability and efficiency of our infrastructure
• Net income increased $23 million compared to $6 million in
the year ago quarter

9© 2021 Navient Solutions, LLC. All rights reserved.
Funding &
Liquidity
10© 2021 Navient Solutions, LLC. All rights reserved.
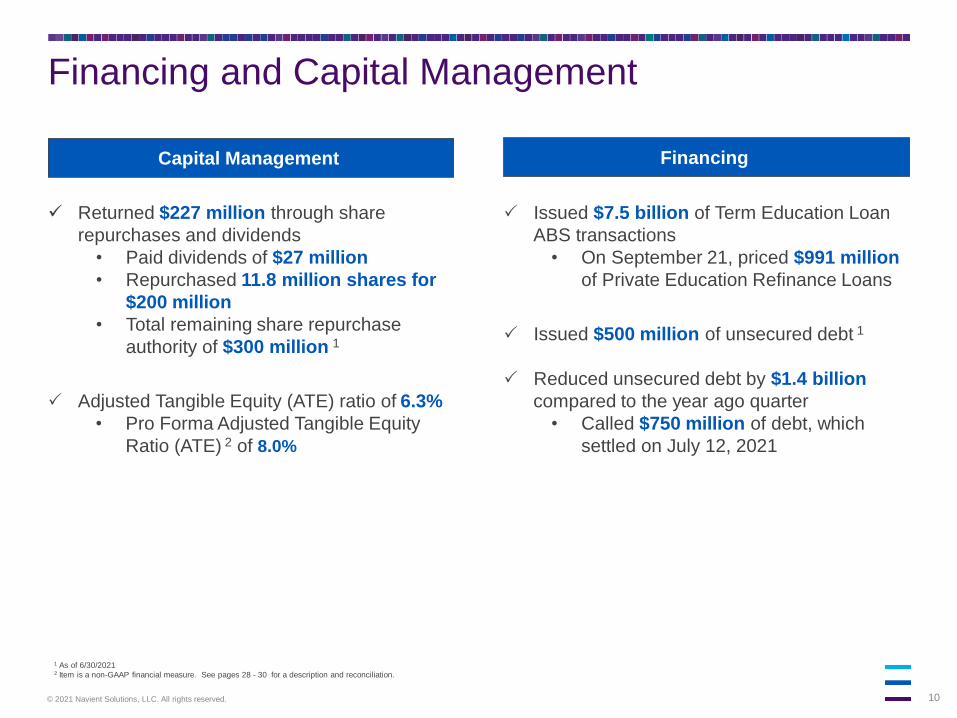
Financing and Capital Management
Issued $7.5 billion of Term Education Loan
ABS transactions
• On September 21, priced $991 million
of Private Education Refinance Loans
Issued $500 million of unsecured debt 1
Reduced unsecured debt by $1.4 billion
compared to the year ago quarter
• Called $750 million of debt, which
settled on July 12, 2021
1 As of 6/30/20212 Item is a non-GAAP financial measure. See pages 28 - 30 for a description and reconciliation.
Capital Management Financing
✓ Returned $227 million through share
repurchases and dividends
• Paid dividends of $27 million
• Repurchased 11.8 million shares for
$200 million
• Total remaining share repurchase
authority of $300 million 1
Adjusted Tangible Equity (ATE) ratio of 6.3%
• Pro Forma Adjusted Tangible Equity
Ratio (ATE) 2 of 8.0%
11© 2021 Navient Solutions, LLC. All rights reserved.
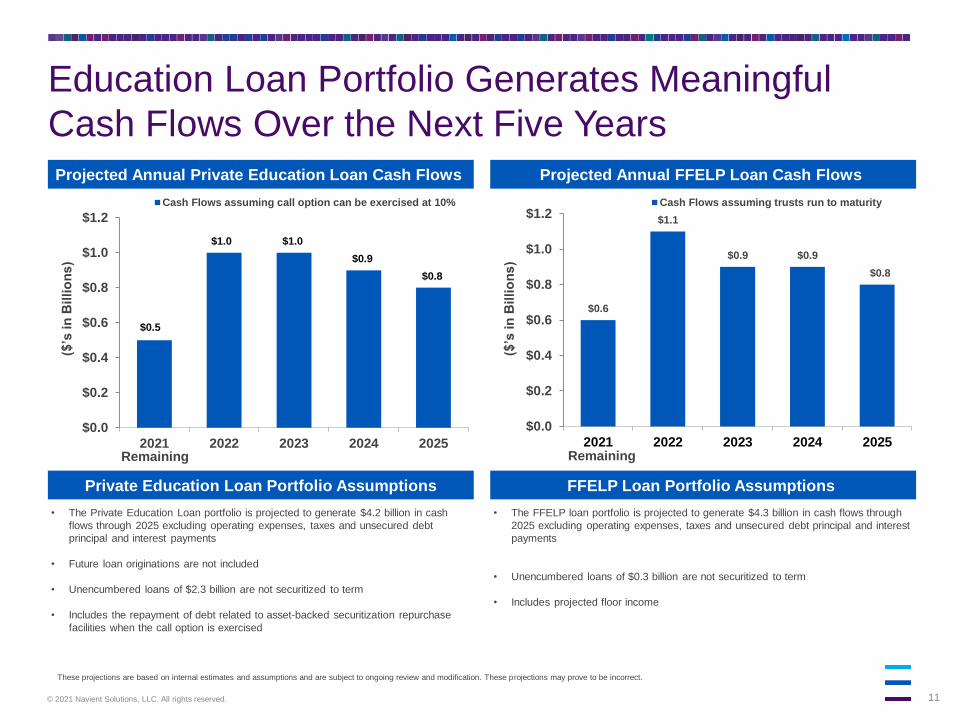
Education Loan Portfolio Generates Meaningful
Cash Flows Over the Next Five Years
These projections are based on internal estimates and assumptions and are subject to ongoing review and modification. These projections may prove to be incorrect.
$0.5
$1.0 $1.0
$0.9
$0.8
$0.0
$0.2
$0.4
$0.6
$0.8
$1.0
$1.2
2021 2022 2023 2024 2025
($’s
in
Bil
lio
ns
)
Cash Flows assuming call option can be exercised at 10%
• The Private Education Loan portfolio is projected to generate $4.2 billion in cash
flows through 2025 excluding operating expenses, taxes and unsecured debt
principal and interest payments
• Future loan originations are not included
• Unencumbered loans of $2.3 billion are not securitized to term
• Includes the repayment of debt related to asset-backed securitization repurchase
facilities when the call option is exercised
Projected Annual FFELP Loan Cash FlowsProjected Annual Private Education Loan Cash Flows
$0.6
$1.1
$0.9 $0.9
$0.8
$0.0
$0.2
$0.4
$0.6
$0.8
$1.0
$1.2
2021 2022 2023 2024 2025
($’s
in
Bil
lio
ns
)
Cash Flows assuming trusts run to maturity
Private Education Loan Portfolio Assumptions
• The FFELP loan portfolio is projected to generate $4.3 billion in cash flows through
2025 excluding operating expenses, taxes and unsecured debt principal and interest
payments
• Unencumbered loans of $0.3 billion are not securitized to term
• Includes projected floor income
FFELP Loan Portfolio Assumptions
Remaining Remaining
12© 2021 Navient Solutions, LLC. All rights reserved.
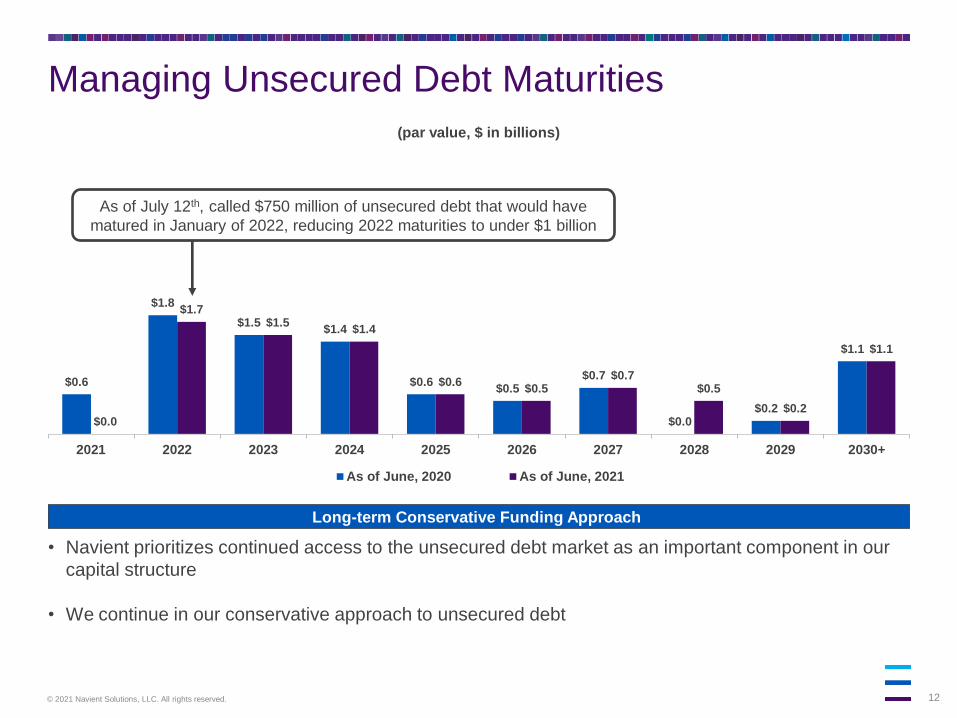
Managing Unsecured Debt Maturities
• Navient prioritizes continued access to the unsecured debt market as an important component in our
capital structure
• We continue in our conservative approach to unsecured debt
$0.6
$1.8
$1.5$1.4
$0.6$0.5
$0.7
$0.0$0.2
$1.1
$0.0
$1.7$1.5
$1.4
$0.6$0.5
$0.7$0.5
$0.2
$1.1
2021 2022 2023 2024 2025 2026 2027 2028 2029 2030+
(par value, $ in billions)
As of June, 2020 As of June, 2021
Long-term Conservative Funding Approach
As of July 12th, called $750 million of unsecured debt that would have
matured in January of 2022, reducing 2022 maturities to under $1 billion
13© 2021 Navient Solutions, LLC. All rights reserved.
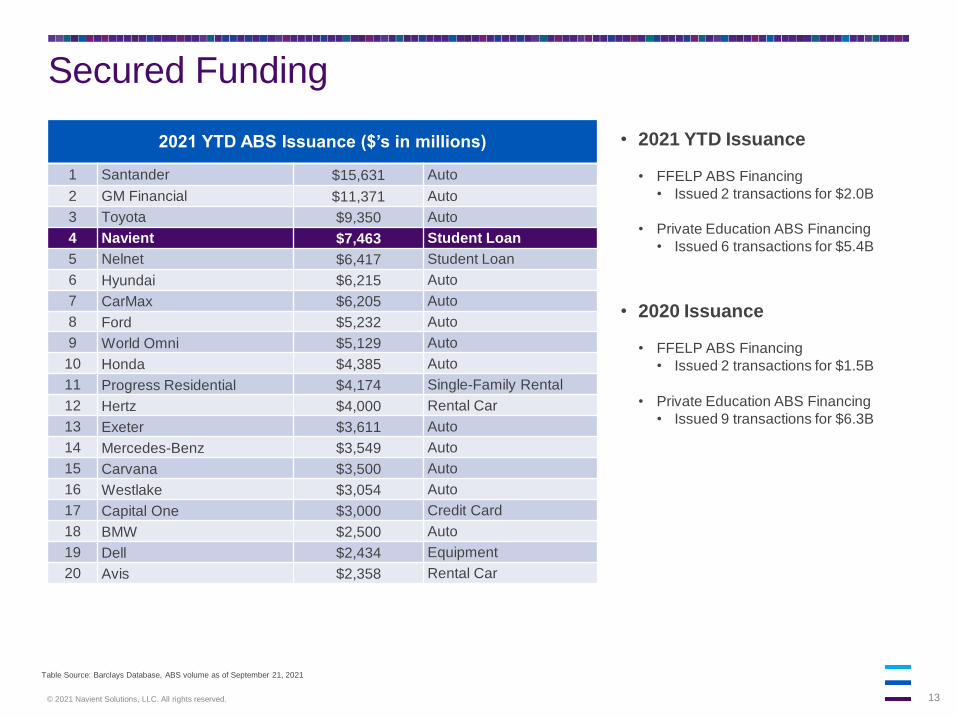
2021 YTD ABS Issuance ($’s in millions)
1 Santander $15,631 Auto
2 GM Financial $11,371 Auto
3 Toyota $9,350 Auto
4 Navient $7,463 Student Loan
5 Nelnet $6,417 Student Loan
6 Hyundai $6,215 Auto
7 CarMax $6,205 Auto
8 Ford $5,232 Auto
9 World Omni $5,129 Auto
10 Honda $4,385 Auto
11 Progress Residential $4,174 Single-Family Rental
12 Hertz $4,000 Rental Car
13 Exeter $3,611 Auto
14 Mercedes-Benz $3,549 Auto
15 Carvana $3,500 Auto
16 Westlake $3,054 Auto
17 Capital One $3,000 Credit Card
18 BMW $2,500 Auto
19 Dell $2,434 Equipment
20 Avis $2,358 Rental Car
Secured Funding
• 2021 YTD Issuance
• FFELP ABS Financing
• Issued 2 transactions for $2.0B
• Private Education ABS Financing
• Issued 6 transactions for $5.4B
• 2020 Issuance
• FFELP ABS Financing
• Issued 2 transactions for $1.5B
• Private Education ABS Financing
• Issued 9 transactions for $6.3B
Table Source: Barclays Database, ABS volume as of September 21, 2021
14© 2021 Navient Solutions, LLC. All rights reserved.
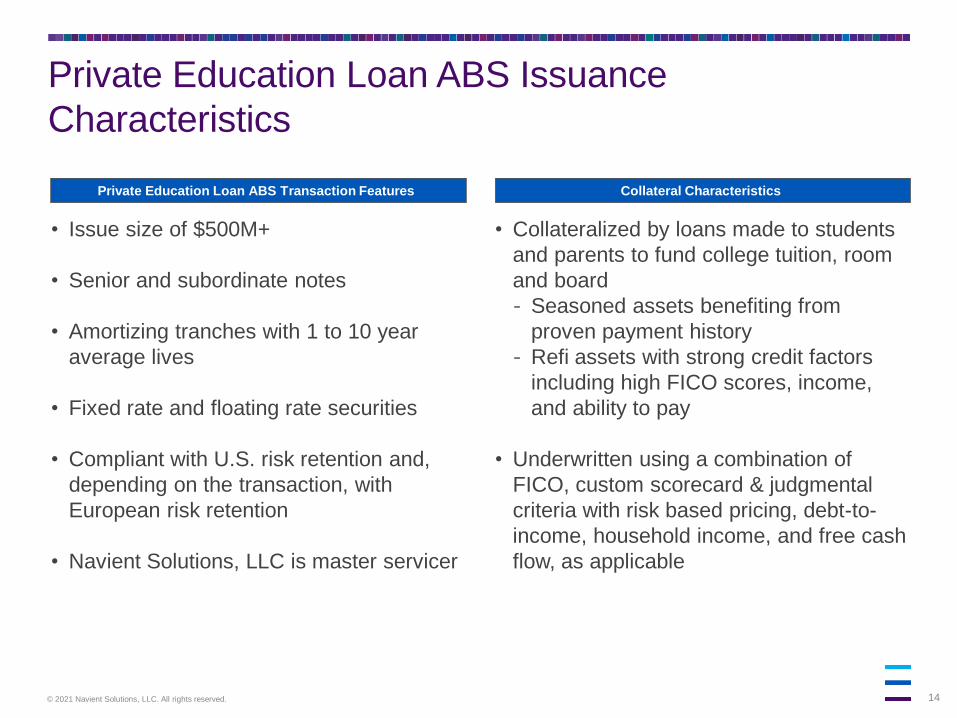
Private Education Loan ABS Transaction Features Collateral Characteristics
• Issue size of $500M+
• Senior and subordinate notes
• Amortizing tranches with 1 to 10 year
average lives
• Fixed rate and floating rate securities
• Compliant with U.S. risk retention and,
depending on the transaction, with
European risk retention
• Navient Solutions, LLC is master servicer
• Collateralized by loans made to students
and parents to fund college tuition, room
and board
- Seasoned assets benefiting from
proven payment history
- Refi assets with strong credit factors
including high FICO scores, income,
and ability to pay
• Underwritten using a combination of
FICO, custom scorecard & judgmental
criteria with risk based pricing, debt-to-
income, household income, and free cash
flow, as applicable
Private Education Loan ABS Issuance
Characteristics
15© 2021 Navient Solutions, LLC. All rights reserved.
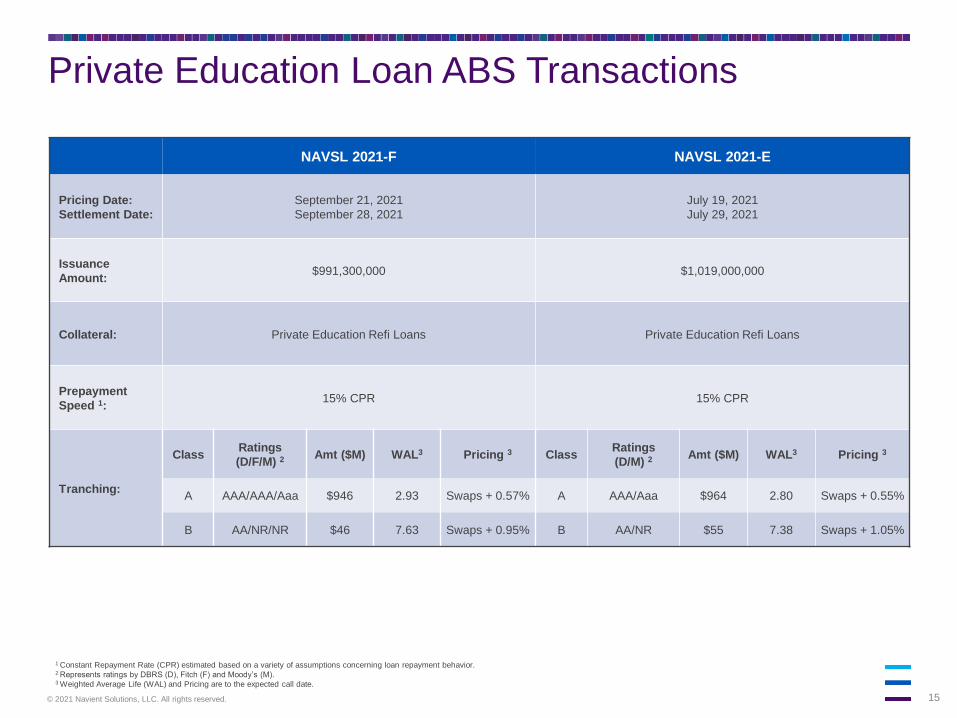
Private Education Loan ABS Transactions
1 Constant Repayment Rate (CPR) estimated based on a variety of assumptions concerning loan repayment behavior. 2 Represents ratings by DBRS (D), Fitch (F) and Moody’s (M).3 Weighted Average Life (WAL) and Pricing are to the expected call date.
NAVSL 2021-F NAVSL 2021-E
Pricing Date:
Settlement Date:
September 21, 2021
September 28, 2021
July 19, 2021
July 29, 2021
Issuance
Amount:$991,300,000 $1,019,000,000
Collateral: Private Education Refi Loans Private Education Refi Loans
Prepayment
Speed 1:15% CPR 15% CPR
Tranching:
ClassRatings
(D/F/M) 2Amt ($M) WAL3 Pricing 3 Class
Ratings
(D/M) 2Amt ($M) WAL3 Pricing 3
A AAA/AAA/Aaa $946 2.93 Swaps + 0.57% A AAA/Aaa $964 2.80 Swaps + 0.55%
B AA/NR/NR $46 7.63 Swaps + 0.95% B AA/NR $55 7.38 Swaps + 1.05%
16© 2021 Navient Solutions, LLC. All rights reserved.
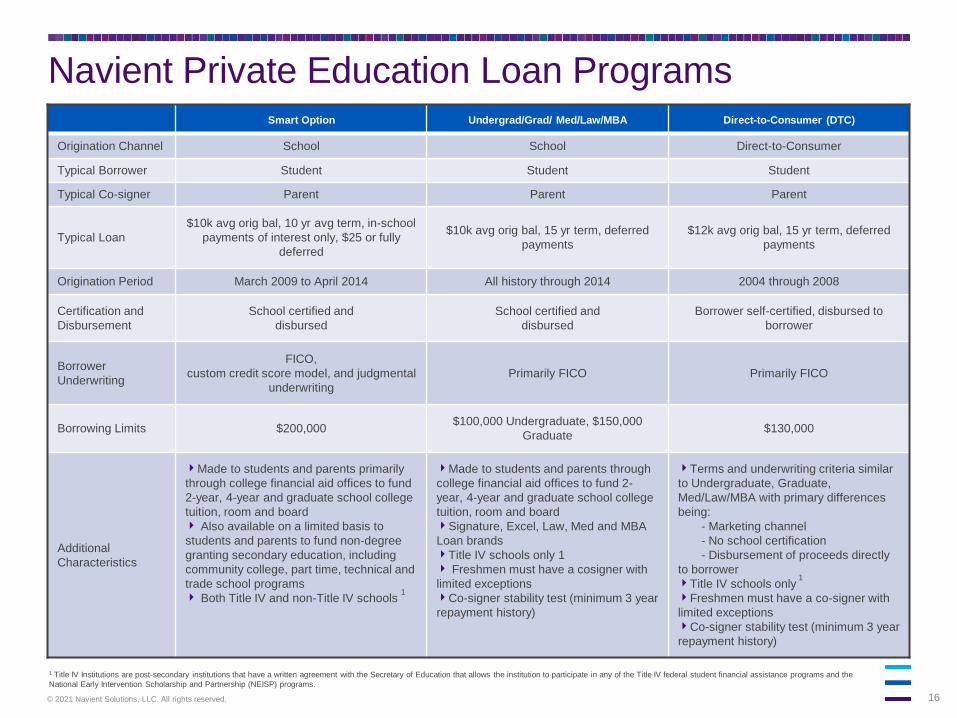
1 Title IV Institutions are post-secondary institutions that have a written agreement with the Secretary of Education that allows the institution to participate in any of the Title IV federal student financial assistance programs and the
National Early Intervention Scholarship and Partnership (NEISP) programs.
Navient Private Education Loan Programs Smart Option Undergrad/Grad/ Med/Law/MBA Direct-to-Consumer (DTC)
Origination Channel School School Direct-to-Consumer
Typical Borrower Student Student Student
Typical Co-signer Parent Parent Parent
Typical Loan
$10k avg orig bal, 10 yr avg term, in-school
payments of interest only, $25 or fully
deferred
$10k avg orig bal, 15 yr term, deferred
payments
$12k avg orig bal, 15 yr term, deferred
payments
Origination Period March 2009 to April 2014 All history through 2014 2004 through 2008
Certification and
Disbursement
School certified and
disbursed
School certified and
disbursed
Borrower self-certified, disbursed to
borrower
Borrower
Underwriting
FICO,
custom credit score model, and judgmental
underwriting
Primarily FICO Primarily FICO
Borrowing Limits $200,000$100,000 Undergraduate, $150,000
Graduate$130,000
Additional
Characteristics
Made to students and parents primarily
through college financial aid offices to fund
2-year, 4-year and graduate school college
tuition, room and board Also available on a limited basis to
students and parents to fund non-degree
granting secondary education, including
community college, part time, technical and
trade school programs Both Title IV and non-Title IV schools
1
Made to students and parents through
college financial aid offices to fund 2-
year, 4-year and graduate school college
tuition, room and boardSignature, Excel, Law, Med and MBA
Loan brandsTitle IV schools only 1 Freshmen must have a cosigner with
limited exceptionsCo-signer stability test (minimum 3 year
repayment history)
Terms and underwriting criteria similar
to Undergraduate, Graduate,
Med/Law/MBA with primary differences
being:
- Marketing channel
- No school certification
- Disbursement of proceeds directly
to borrowerTitle IV schools only
1
Freshmen must have a co-signer with
limited exceptionsCo-signer stability test (minimum 3 year
repayment history)
17© 2021 Navient Solutions, LLC. All rights reserved.
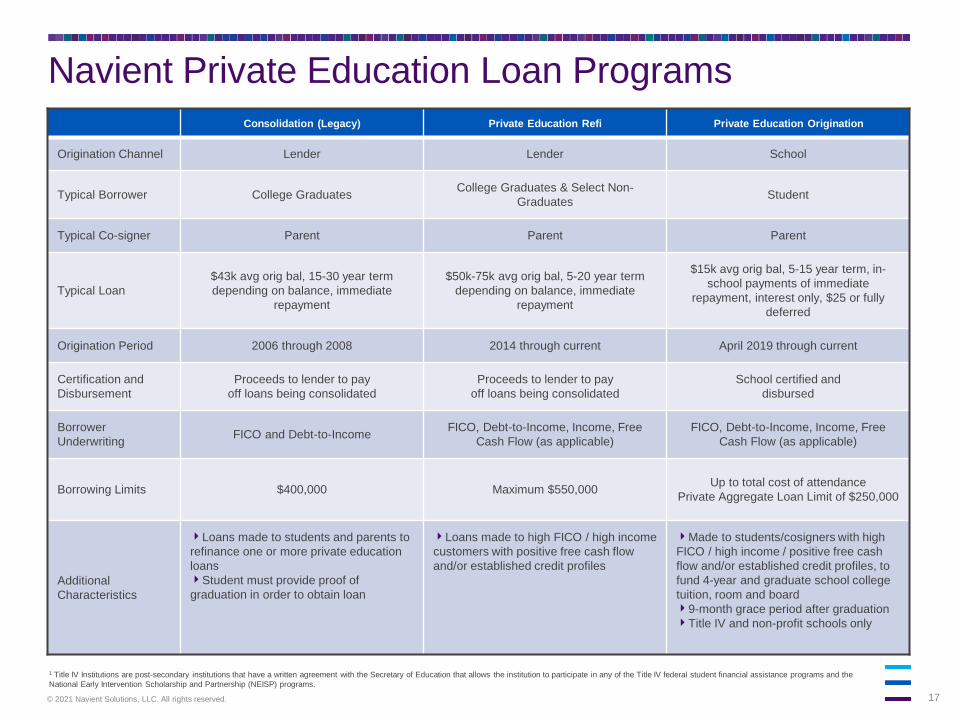
1 Title IV Institutions are post-secondary institutions that have a written agreement with the Secretary of Education that allows the institution to participate in any of the Title IV federal student financial assistance programs and the
National Early Intervention Scholarship and Partnership (NEISP) programs.
Navient Private Education Loan Programs
Consolidation (Legacy) Private Education Refi Private Education Origination
Origination Channel Lender Lender School
Typical Borrower College GraduatesCollege Graduates & Select Non-
GraduatesStudent
Typical Co-signer Parent Parent Parent
Typical Loan
$43k avg orig bal, 15-30 year term
depending on balance, immediate
repayment
$50k-75k avg orig bal, 5-20 year term
depending on balance, immediate
repayment
$15k avg orig bal, 5-15 year term, in-
school payments of immediate
repayment, interest only, $25 or fully
deferred
Origination Period 2006 through 2008 2014 through current April 2019 through current
Certification and
Disbursement
Proceeds to lender to pay
off loans being consolidated
Proceeds to lender to pay
off loans being consolidated
School certified and
disbursed
Borrower
UnderwritingFICO and Debt-to-Income
FICO, Debt-to-Income, Income, Free
Cash Flow (as applicable)
FICO, Debt-to-Income, Income, Free
Cash Flow (as applicable)
Borrowing Limits $400,000 Maximum $550,000Up to total cost of attendance
Private Aggregate Loan Limit of $250,000
Additional
Characteristics
Loans made to students and parents to
refinance one or more private education
loansStudent must provide proof of
graduation in order to obtain loan
Loans made to high FICO / high income
customers with positive free cash flow
and/or established credit profiles
Made to students/cosigners with high
FICO / high income / positive free cash
flow and/or established credit profiles, to
fund 4-year and graduate school college
tuition, room and board9-month grace period after graduationTitle IV and non-profit schools only
18© 2021 Navient Solutions, LLC. All rights reserved.
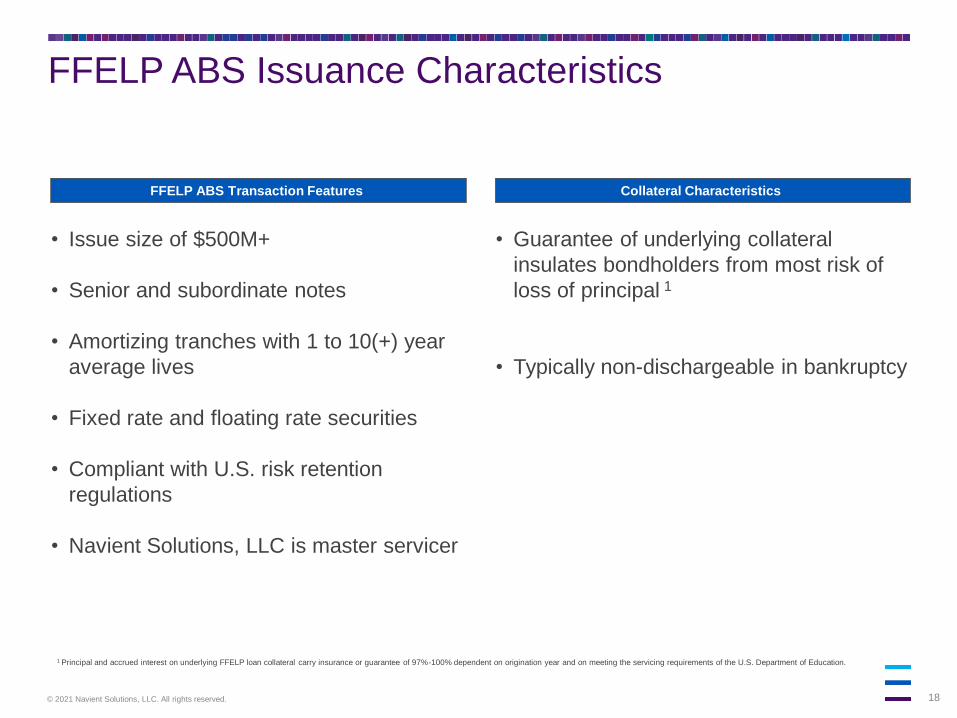
FFELP ABS Issuance Characteristics
• Issue size of $500M+
• Senior and subordinate notes
• Amortizing tranches with 1 to 10(+) year
average lives
• Fixed rate and floating rate securities
• Compliant with U.S. risk retention
regulations
• Navient Solutions, LLC is master servicer
FFELP ABS Transaction Features Collateral Characteristics
1 Principal and accrued interest on underlying FFELP loan collateral carry insurance or guarantee of 97%-100% dependent on origination year and on meeting the servicing requirements of the U.S. Department of Education.
• Guarantee of underlying collateral
insulates bondholders from most risk of
loss of principal 1
• Typically non-dischargeable in bankruptcy
19© 2021 Navient Solutions, LLC. All rights reserved.
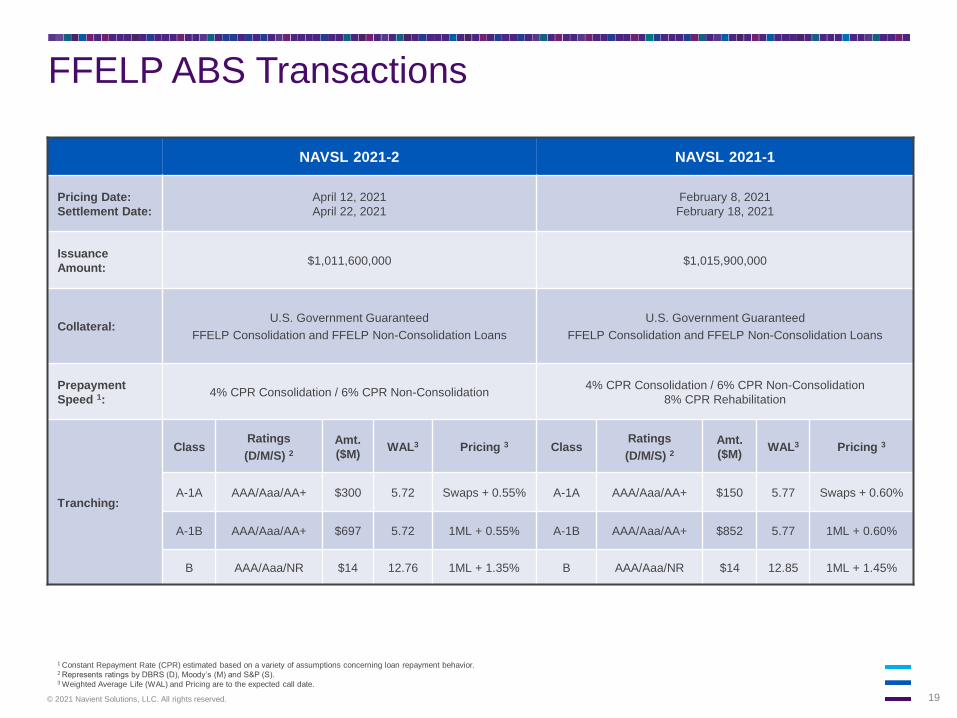
FFELP ABS Transactions
NAVSL 2021-2 NAVSL 2021-1
Pricing Date:
Settlement Date:
April 12, 2021
April 22, 2021
February 8, 2021
February 18, 2021
Issuance
Amount:$1,011,600,000 $1,015,900,000
Collateral:U.S. Government Guaranteed
FFELP Consolidation and FFELP Non-Consolidation Loans
U.S. Government Guaranteed
FFELP Consolidation and FFELP Non-Consolidation Loans
Prepayment
Speed 1:4% CPR Consolidation / 6% CPR Non-Consolidation
4% CPR Consolidation / 6% CPR Non-Consolidation
8% CPR Rehabilitation
Tranching:
ClassRatings
(D/M/S) 2Amt.
($M)WAL3 Pricing 3 Class
Ratings
(D/M/S) 2Amt.
($M)WAL3 Pricing 3
A-1A AAA/Aaa/AA+ $300 5.72 Swaps + 0.55% A-1A AAA/Aaa/AA+ $150 5.77 Swaps + 0.60%
A-1B AAA/Aaa/AA+ $697 5.72 1ML + 0.55% A-1B AAA/Aaa/AA+ $852 5.77 1ML + 0.60%
B AAA/Aaa/NR $14 12.76 1ML + 1.35% B AAA/Aaa/NR $14 12.85 1ML + 1.45%
1 Constant Repayment Rate (CPR) estimated based on a variety of assumptions concerning loan repayment behavior. 2 Represents ratings by DBRS (D), Moody’s (M) and S&P (S).3 Weighted Average Life (WAL) and Pricing are to the expected call date.
20© 2021 Navient Solutions, LLC. All rights reserved.
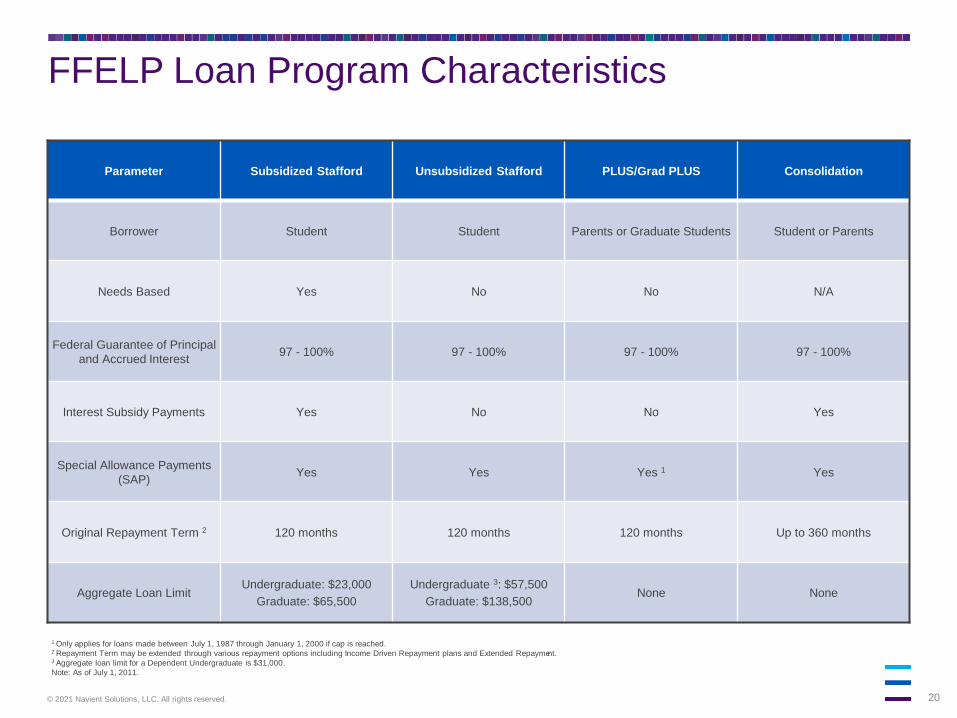
FFELP Loan Program Characteristics
1 Only applies for loans made between July 1, 1987 through January 1, 2000 if cap is reached.2 Repayment Term may be extended through various repayment options including Income Driven Repayment plans and Extended Repayment.3 Aggregate loan limit for a Dependent Undergraduate is $31,000.
Note: As of July 1, 2011.
Parameter Subsidized Stafford Unsubsidized Stafford PLUS/Grad PLUS Consolidation
Borrower Student Student Parents or Graduate Students Student or Parents
Needs Based Yes No No N/A
Federal Guarantee of Principal
and Accrued Interest97 - 100% 97 - 100% 97 - 100% 97 - 100%
Interest Subsidy Payments Yes No No Yes
Special Allowance Payments
(SAP)Yes Yes Yes 1 Yes
Original Repayment Term 2 120 months 120 months 120 months Up to 360 months
Aggregate Loan LimitUndergraduate: $23,000
Graduate: $65,500
Undergraduate 3: $57,500
Graduate: $138,500None None
21© 2021 Navient Solutions, LLC. All rights reserved.
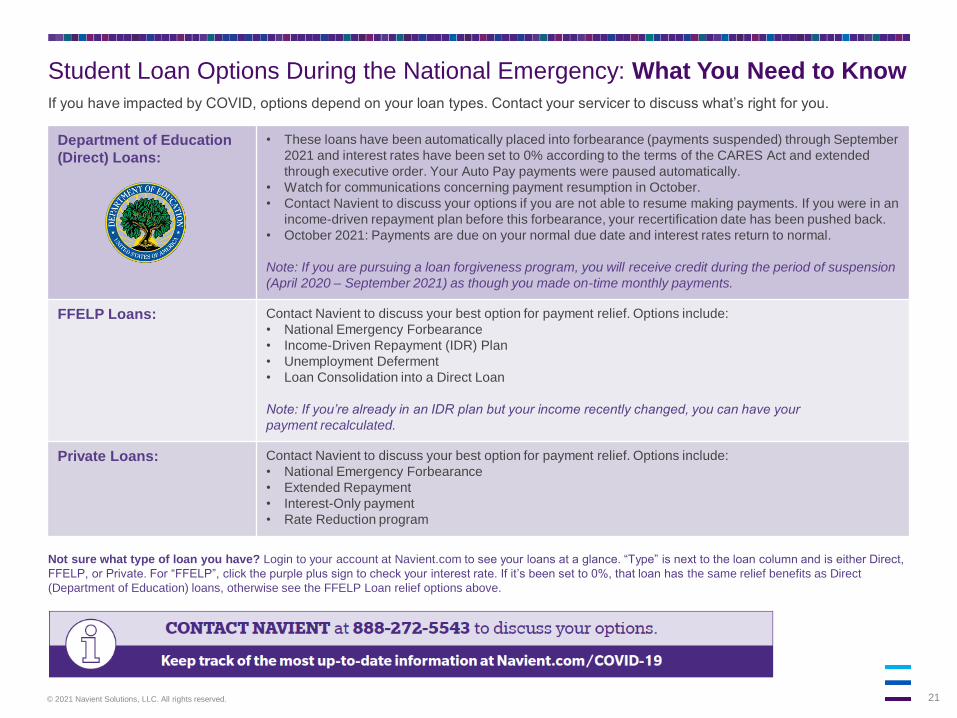
Student Loan Options During the National Emergency: What You Need to Know
Department of Education
(Direct) Loans:
• These loans have been automatically placed into forbearance (payments suspended) through September
2021 and interest rates have been set to 0% according to the terms of the CARES Act and extended
through executive order. Your Auto Pay payments were paused automatically.
• Watch for communications concerning payment resumption in October.
• Contact Navient to discuss your options if you are not able to resume making payments. If you were in an
income-driven repayment plan before this forbearance, your recertification date has been pushed back.
• October 2021: Payments are due on your normal due date and interest rates return to normal.
Note: If you are pursuing a loan forgiveness program, you will receive credit during the period of suspension
(April 2020 – September 2021) as though you made on-time monthly payments.
FFELP Loans: Contact Navient to discuss your best option for payment relief. Options include:
• National Emergency Forbearance
• Income-Driven Repayment (IDR) Plan
• Unemployment Deferment
• Loan Consolidation into a Direct Loan
Note: If you’re already in an IDR plan but your income recently changed, you can have your
payment recalculated.
Private Loans: Contact Navient to discuss your best option for payment relief. Options include:
• National Emergency Forbearance
• Extended Repayment
• Interest-Only payment
• Rate Reduction program
If you have impacted by COVID, options depend on your loan types. Contact your servicer to discuss what’s right for you.
Not sure what type of loan you have? Login to your account at Navient.com to see your loans at a glance. “Type” is next to the loan column and is either Direct,
FFELP, or Private. For “FFELP”, click the purple plus sign to check your interest rate. If it’s been set to 0%, that loan has the same relief benefits as Direct
(Department of Education) loans, otherwise see the FFELP Loan relief options above.

22© 2021 Navient Solutions, LLC. All rights reserved.
Higher Education
Industry
23© 2021 Navient Solutions, LLC. All rights reserved.
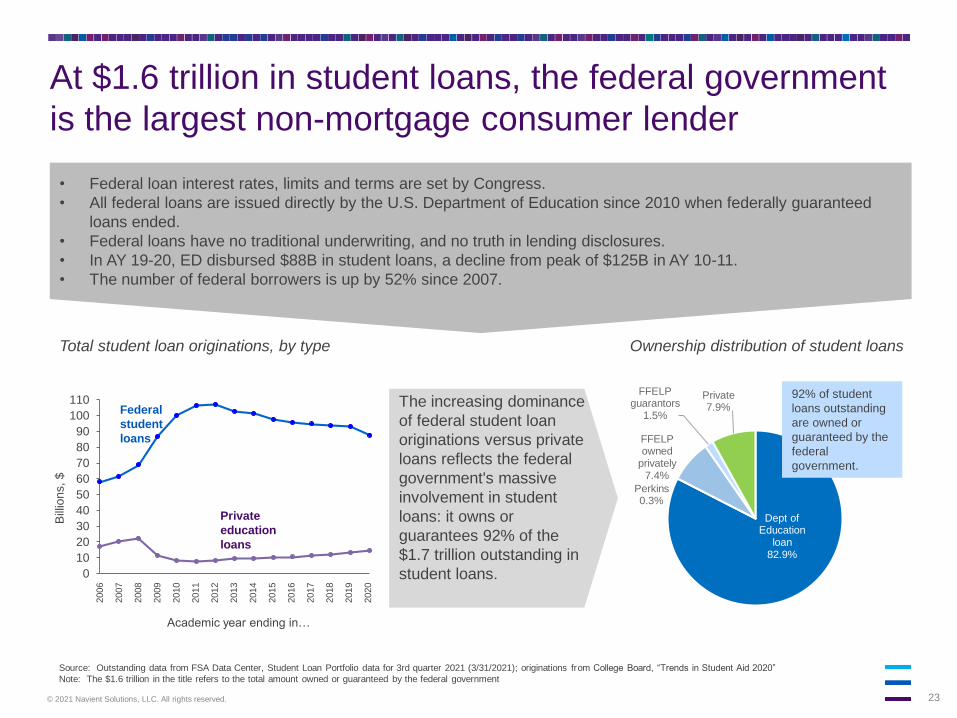
At $1.6 trillion in student loans, the federal government
is the largest non-mortgage consumer lender
Source: Outstanding data from FSA Data Center, Student Loan Portfolio data for 3rd quarter 2021 (3/31/2021); originations from College Board, “Trends in Student Aid 2020”
Note: The $1.6 trillion in the title refers to the total amount owned or guaranteed by the federal government
0
10
20
30
40
50
60
70
80
90
100
110
Academic year ending in…
Bill
ions, $
Dept of Education
loan82.9%
Perkins0.3%
FFELP owned
privately7.4%
FFELP guarantors
1.5%
Private7.9%Federal
student
loans
Private
education
loans
92% of student
loans outstanding
are owned or
guaranteed by the
federal
government.
• Federal loan interest rates, limits and terms are set by Congress.
• All federal loans are issued directly by the U.S. Department of Education since 2010 when federally guaranteed
loans ended.
• Federal loans have no traditional underwriting, and no truth in lending disclosures.
• In AY 19-20, ED disbursed $88B in student loans, a decline from peak of $125B in AY 10-11.
• The number of federal borrowers is up by 52% since 2007.
Ownership distribution of student loansTotal student loan originations, by type
The increasing dominance
of federal student loan
originations versus private
loans reflects the federal
government's massive
involvement in student
loans: it owns or
guarantees 92% of the
$1.7 trillion outstanding in
student loans.
2006
2007
2008
2009
2010
2011
2012
2013
2014
2015
2016
2017
2018
2019
2020
24© 2021 Navient Solutions, LLC. All rights reserved.
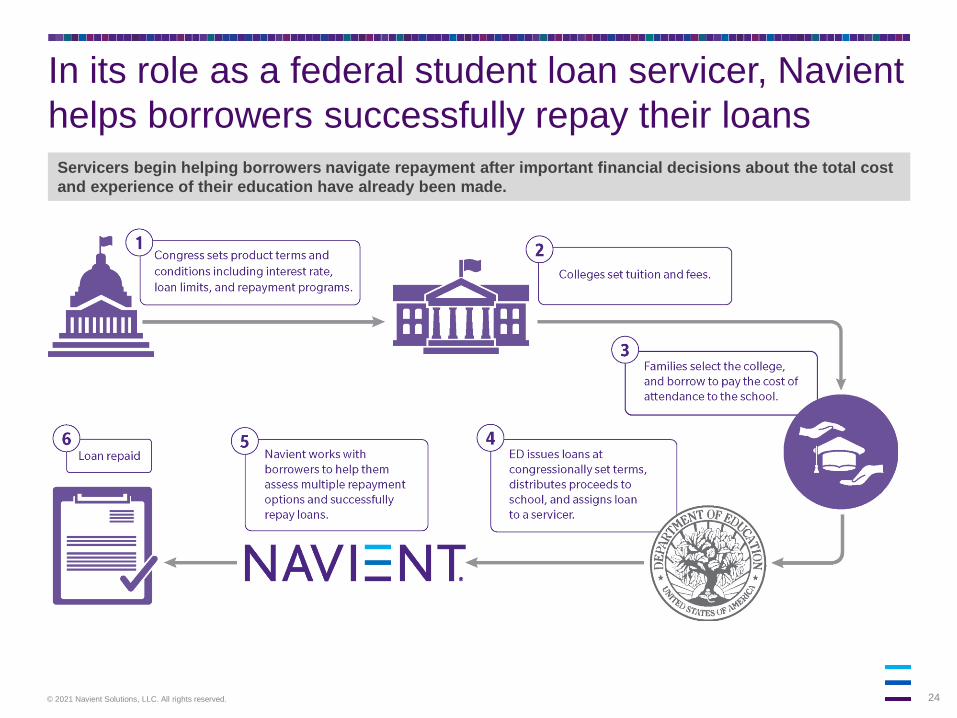
In its role as a federal student loan servicer, Navient
helps borrowers successfully repay their loans
Servicers begin helping borrowers navigate repayment after important financial decisions about the total cost
and experience of their education have already been made.
25© 2021 Navient Solutions, LLC. All rights reserved.
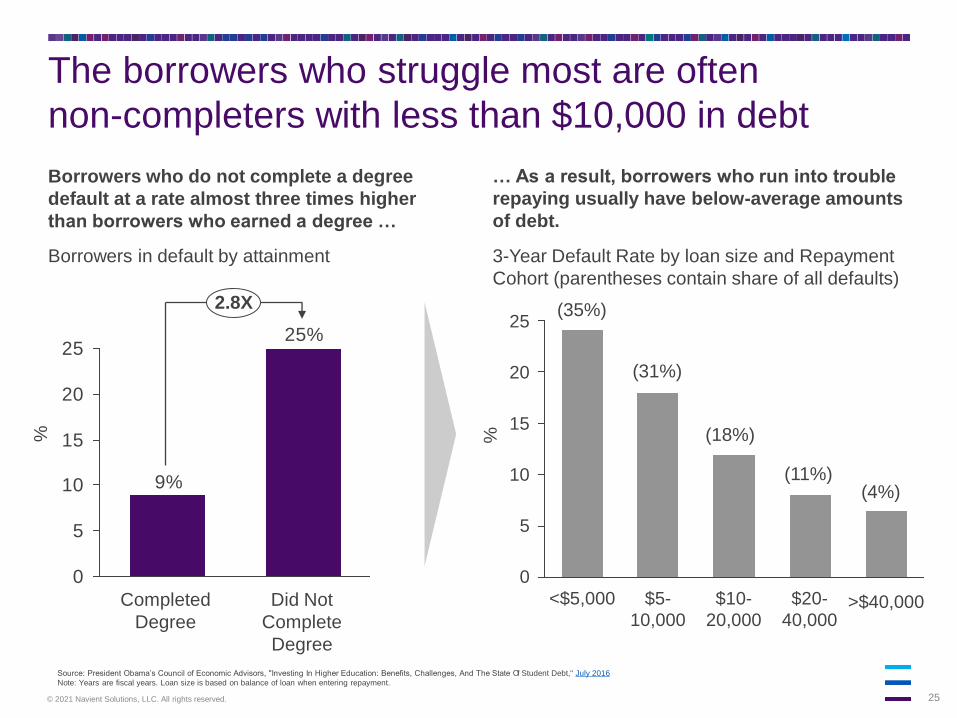
The borrowers who struggle most are often
non-completers with less than $10,000 in debt
Source: President Obama’s Council of Economic Advisors, "Investing In Higher Education: Benefits, Challenges, And The State Of Student Debt," July 2016
Note: Years are fiscal years. Loan size is based on balance of loan when entering repayment.
Borrowers in default by attainment
Borrowers who do not complete a degree
default at a rate almost three times higher
than borrowers who earned a degree …
… As a result, borrowers who run into trouble
repaying usually have below-average amounts
of debt.
3-Year Default Rate by loan size and Repayment
Cohort (parentheses contain share of all defaults)
25%
9%
0
5
10
15
20
25
Completed
Degree
2.8X
Did Not
Complete
Degree
25
20
15
10
5
0
<$5,000 $20-
40,000
$10-
20,000
$5-
10,000
(35%)
(31%)
(18%)
(11%)(4%)
%
>$40,000
%
26© 2021 Navient Solutions, LLC. All rights reserved.
Navient
Corporation
Appendix
27© 2021 Navient Solutions, LLC. All rights reserved.
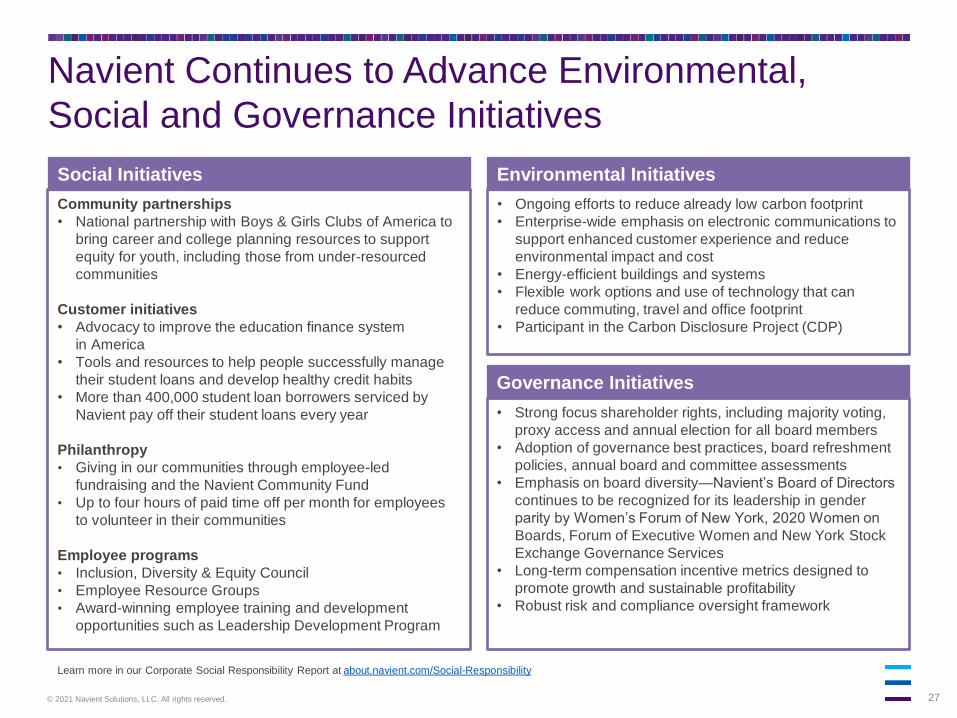
Navient Continues to Advance Environmental,
Social and Governance Initiatives
• Ongoing efforts to reduce already low carbon footprint
• Enterprise-wide emphasis on electronic communications to
support enhanced customer experience and reduce
environmental impact and cost
• Energy-efficient buildings and systems
• Flexible work options and use of technology that can
reduce commuting, travel and office footprint
• Participant in the Carbon Disclosure Project (CDP)
Environmental Initiatives
• Strong focus shareholder rights, including majority voting,
proxy access and annual election for all board members
• Adoption of governance best practices, board refreshment
policies, annual board and committee assessments
• Emphasis on board diversity—Navient’s Board of Directors
continues to be recognized for its leadership in gender
parity by Women’s Forum of New York, 2020 Women on
Boards, Forum of Executive Women and New York Stock
Exchange Governance Services
• Long-term compensation incentive metrics designed to
promote growth and sustainable profitability
• Robust risk and compliance oversight framework
Governance Initiatives
Community partnerships
• National partnership with Boys & Girls Clubs of America to
bring career and college planning resources to support
equity for youth, including those from under-resourced
communities
Customer initiatives
• Advocacy to improve the education finance system
in America
• Tools and resources to help people successfully manage
their student loans and develop healthy credit habits
• More than 400,000 student loan borrowers serviced by
Navient pay off their student loans every year
Philanthropy
• Giving in our communities through employee-led
fundraising and the Navient Community Fund
• Up to four hours of paid time off per month for employees
to volunteer in their communities
Employee programs
• Inclusion, Diversity & Equity Council
• Employee Resource Groups
• Award-winning employee training and development
opportunities such as Leadership Development Program
Social Initiatives
Learn more in our Corporate Social Responsibility Report at about.navient.com/Social-Responsibility
28© 2021 Navient Solutions, LLC. All rights reserved.
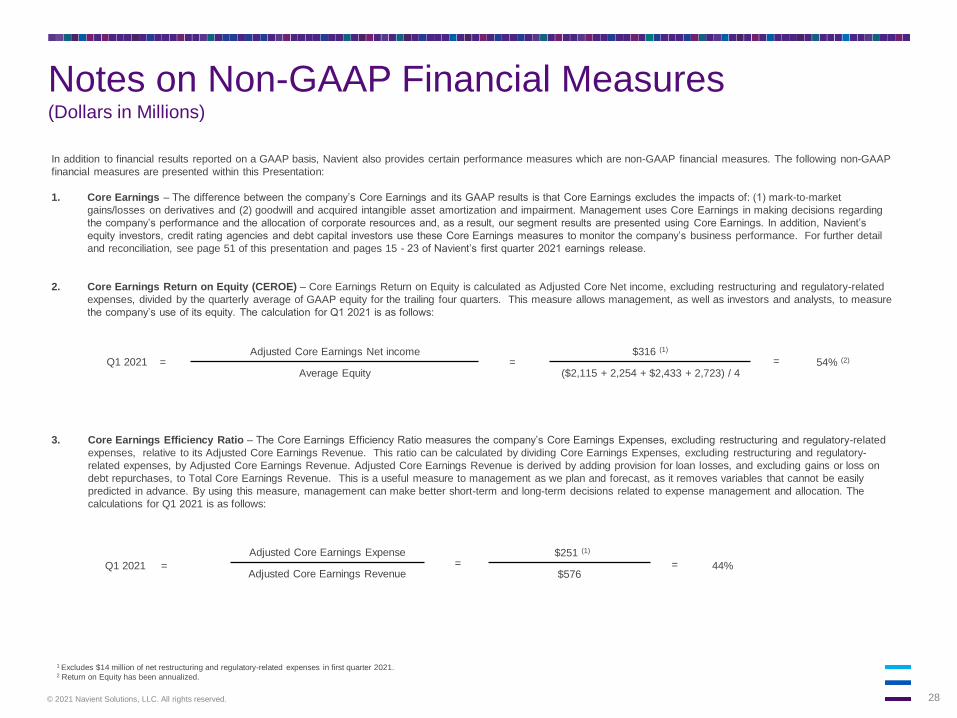
Notes on Non-GAAP Financial Measures(Dollars in Millions)
In addition to financial results reported on a GAAP basis, Navient also provides certain performance measures which are non-GAAP financial measures. The following non-GAAP
financial measures are presented within this Presentation:
1. Core Earnings – The difference between the company’s Core Earnings and its GAAP results is that Core Earnings excludes the impacts of: (1) mark-to-market
gains/losses on derivatives and (2) goodwill and acquired intangible asset amortization and impairment. Management uses Core Earnings in making decisions regarding
the company’s performance and the allocation of corporate resources and, as a result, our segment results are presented using Core Earnings. In addition, Navient’s
equity investors, credit rating agencies and debt capital investors use these Core Earnings measures to monitor the company’s business performance. For further detail
and reconciliation, see page 51 of this presentation and pages 15 - 23 of Navient’s first quarter 2021 earnings release.
2. Core Earnings Return on Equity (CEROE) – Core Earnings Return on Equity is calculated as Adjusted Core Net income, excluding restructuring and regulatory-related
expenses, divided by the quarterly average of GAAP equity for the trailing four quarters. This measure allows management, as well as investors and analysts, to measure
the company’s use of its equity. The calculation for Q1 2021 is as follows:
3. Core Earnings Efficiency Ratio – The Core Earnings Efficiency Ratio measures the company’s Core Earnings Expenses, excluding restructuring and regulatory-related
expenses, relative to its Adjusted Core Earnings Revenue. This ratio can be calculated by dividing Core Earnings Expenses, excluding restructuring and regulatory-
related expenses, by Adjusted Core Earnings Revenue. Adjusted Core Earnings Revenue is derived by adding provision for loan losses, and excluding gains or loss on
debt repurchases, to Total Core Earnings Revenue. This is a useful measure to management as we plan and forecast, as it removes variables that cannot be easily
predicted in advance. By using this measure, management can make better short-term and long-term decisions related to expense management and allocation. The
calculations for Q1 2021 is as follows:
Adjusted Core Earnings Net income
Average Equity
Adjusted Core Earnings Expense
Adjusted Core Earnings Revenue
$316 (1)
($2,115 + 2,254 + $2,433 + 2,723) / 4= = 54% (2)
=$251 (1)
$576= 44%
1 Excludes $14 million of net restructuring and regulatory-related expenses in first quarter 2021.2 Return on Equity has been annualized.
Q1 2021 =
Q1 2021 =
29© 2021 Navient Solutions, LLC. All rights reserved.
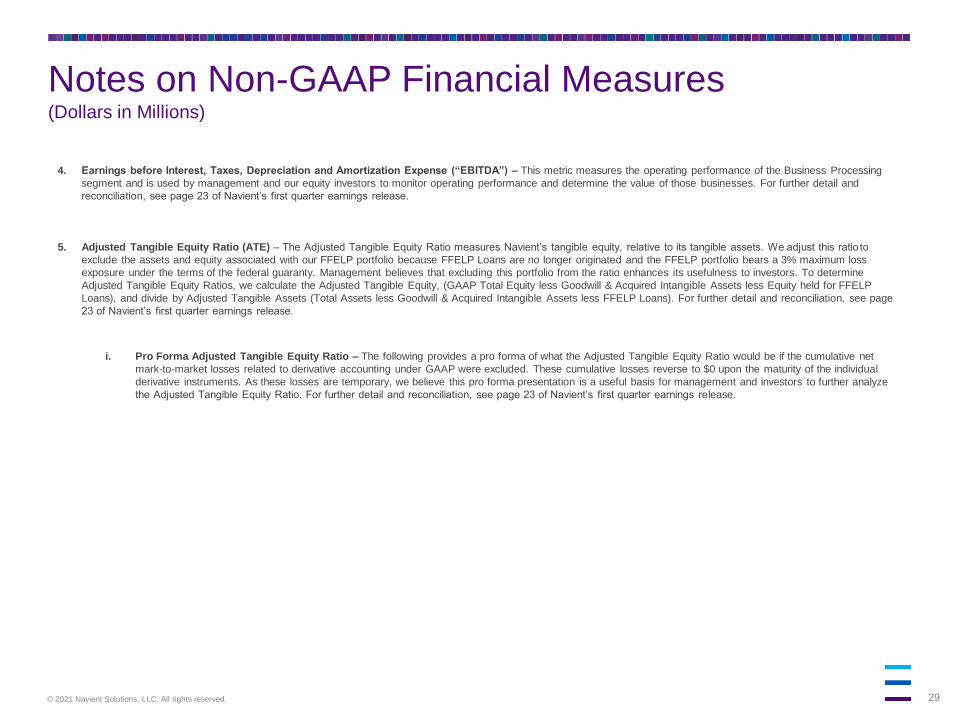
Notes on Non-GAAP Financial Measures(Dollars in Millions)
4. Earnings before Interest, Taxes, Depreciation and Amortization Expense (“EBITDA”) – This metric measures the operating performance of the Business Processing
segment and is used by management and our equity investors to monitor operating performance and determine the value of those businesses. For further detail and
reconciliation, see page 23 of Navient’s first quarter earnings release.
5. Adjusted Tangible Equity Ratio (ATE) – The Adjusted Tangible Equity Ratio measures Navient’s tangible equity, relative to its tangible assets. We adjust this ratio to
exclude the assets and equity associated with our FFELP portfolio because FFELP Loans are no longer originated and the FFELP portfolio bears a 3% maximum loss
exposure under the terms of the federal guaranty. Management believes that excluding this portfolio from the ratio enhances its usefulness to investors. To determine
Adjusted Tangible Equity Ratios, we calculate the Adjusted Tangible Equity, (GAAP Total Equity less Goodwill & Acquired Intangible Assets less Equity held for FFELP
Loans), and divide by Adjusted Tangible Assets (Total Assets less Goodwill & Acquired Intangible Assets less FFELP Loans). For further detail and reconciliation, see page
23 of Navient’s first quarter earnings release.
i. Pro Forma Adjusted Tangible Equity Ratio – The following provides a pro forma of what the Adjusted Tangible Equity Ratio would be if the cumulative net
mark-to-market losses related to derivative accounting under GAAP were excluded. These cumulative losses reverse to $0 upon the maturity of the individual
derivative instruments. As these losses are temporary, we believe this pro forma presentation is a useful basis for management and investors to further analyze
the Adjusted Tangible Equity Ratio. For further detail and reconciliation, see page 23 of Navient’s first quarter earnings release.
30© 2021 Navient Solutions, LLC. All rights reserved.
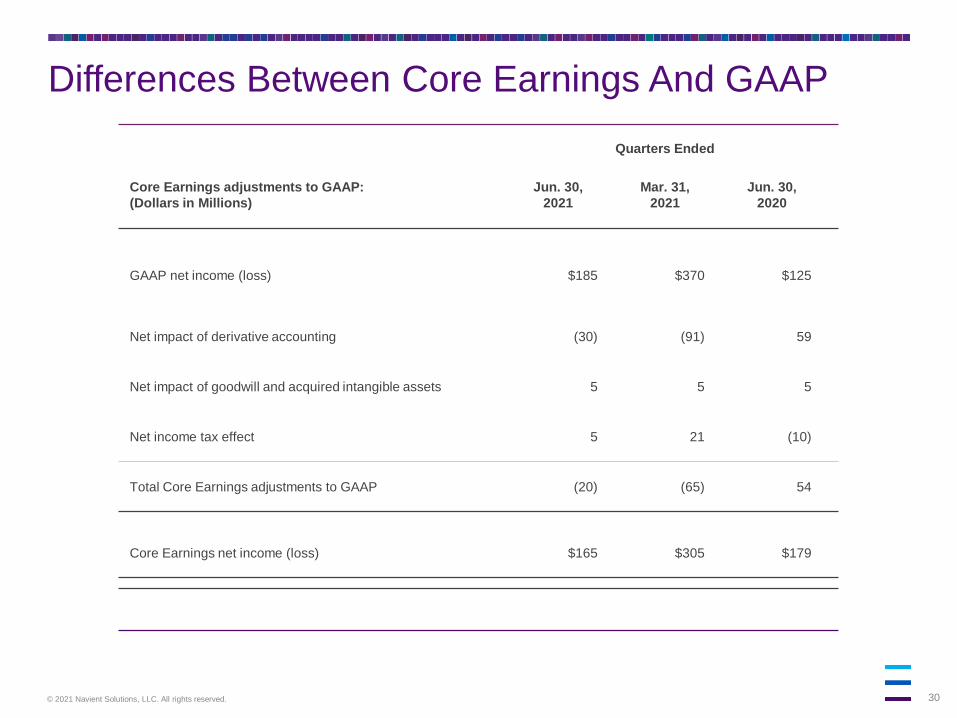
Differences Between Core Earnings And GAAP
Quarters Ended
Core Earnings adjustments to GAAP:
(Dollars in Millions)
Jun. 30,
2021
Mar. 31,
2021
Jun. 30,
2020
GAAP net income (loss) $185 $370 $125
Net impact of derivative accounting (30) (91) 59
Net impact of goodwill and acquired intangible assets 5 5 5
Net income tax effect 5 21 (10)
Total Core Earnings adjustments to GAAP (20) (65) 54
Core Earnings net income (loss) $165 $305 $179
31© 2021 Navient Solutions, LLC. All rights reserved.
Investor Relations Website
• NAVI / SLM student loan trust data (Debt/asset backed securities – NAVI / SLM Student Loan Trusts)
- Static pool information – detailed portfolio stratifications by trust as of the cutoff date
- Accrued interest factors
- Quarterly distribution factors
- Historical trust performance – monthly charge-off, delinquency, loan status, CPR, etc. by trust
- Since issued CPR – monthly CPR data by trust since issuance
• NAVI / SLM student loan performance by trust – Issue details
- Current and historical monthly distribution reports
- Distribution factors
- Current rates
- Prospectus for public transactions and Rule 144A transactions are available through underwriters
• Additional information (Webcasts and presentations)
- Archived and historical webcasts, transcripts and investor presentations
• Environmental Social Governance (ESG) Information
www.navient.com/investors
www.navient.com/abs