Embed Size (px)
Citation preview
Consumer
3QFY19E Results Preview
9 Jan 2019
Naveen Trivedi (FMCG, Appliances) [email protected],+91-22-6171 7324
Siddhant Chhabria (FMCG, Appliances) [email protected],+91-22-6171 7336
Madhukar Ladha (Aviation) [email protected], +91-22-6171-7323
Keshav Binani (Aviation) [email protected], +91-22-6171-7325
Himanshu Shah (Alco-Bev, Hotels, Lubricants) [email protected], +91-22-6171 7315
Mansi Lall (Alco-Bev, Hotels, Lubricants) [email protected], +91-22-3021 2070
Jay Gandhi (Jewellery) [email protected], +91-22-6171 7320
Rohit Harlikar (Jewellery) [email protected], +91-22-6639 3036
2
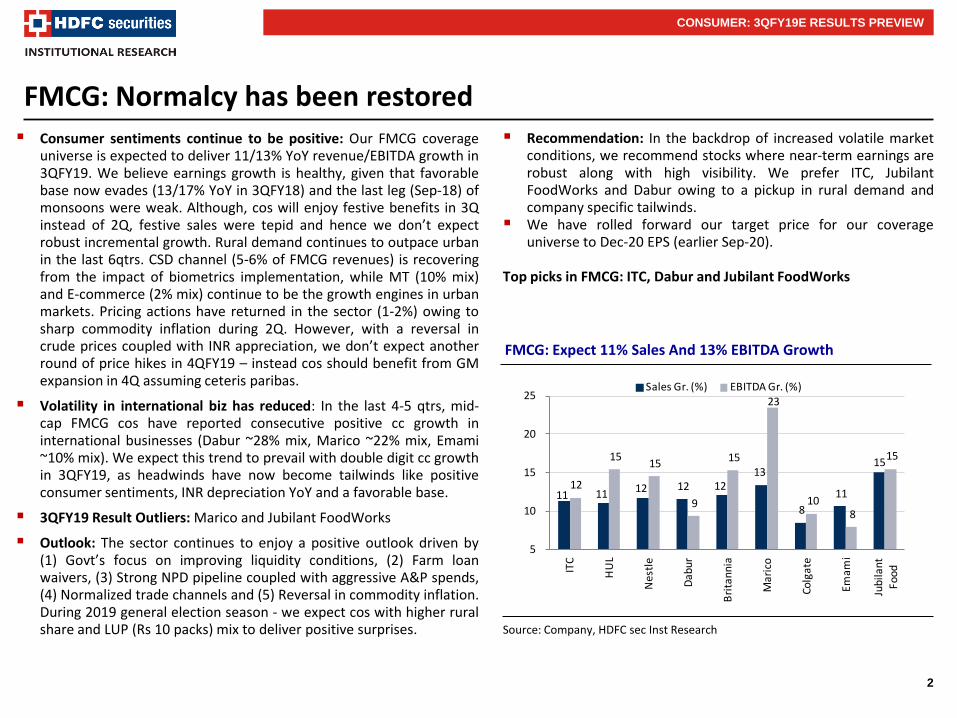
FMCG: Normalcy has been restored Consumer sentiments continue to be positive: Our FMCG coverage
universe is expected to deliver 11/13% YoY revenue/EBITDA growth in 3QFY19. We believe earnings growth is healthy, given that favorable base now evades (13/17% YoY in 3QFY18) and the last leg (Sep-18) of monsoons were weak. Although, cos will enjoy festive benefits in 3Q instead of 2Q, festive sales were tepid and hence we don’t expect robust incremental growth. Rural demand continues to outpace urban in the last 6qtrs. CSD channel (5-6% of FMCG revenues) is recovering from the impact of biometrics implementation, while MT (10% mix) and E-commerce (2% mix) continue to be the growth engines in urban markets. Pricing actions have returned in the sector (1-2%) owing to sharp commodity inflation during 2Q. However, with a reversal in crude prices coupled with INR appreciation, we don’t expect another round of price hikes in 4QFY19 – instead cos should benefit from GM expansion in 4Q assuming ceteris paribas.
Volatility in international biz has reduced: In the last 4-5 qtrs, mid-cap FMCG cos have reported consecutive positive cc growth in international businesses (Dabur ~28% mix, Marico ~22% mix, Emami ~10% mix). We expect this trend to prevail with double digit cc growth in 3QFY19, as headwinds have now become tailwinds like positive consumer sentiments, INR depreciation YoY and a favorable base.
3QFY19 Result Outliers: Marico and Jubilant FoodWorks
Outlook: The sector continues to enjoy a positive outlook driven by (1) Govt’s focus on improving liquidity conditions, (2) Farm loan waivers, (3) Strong NPD pipeline coupled with aggressive A&P spends, (4) Normalized trade channels and (5) Reversal in commodity inflation. During 2019 general election season - we expect cos with higher rural share and LUP (Rs 10 packs) mix to deliver positive surprises.
FMCG: Expect 11% Sales And 13% EBITDA Growth
CONSUMER: 3QFY19E RESULTS PREVIEW
Source: Company, HDFC sec Inst Research
Recommendation: In the backdrop of increased volatile market conditions, we recommend stocks where near-term earnings are robust along with high visibility. We prefer ITC, Jubilant FoodWorks and Dabur owing to a pickup in rural demand and company specific tailwinds.
We have rolled forward our target price for our coverage universe to Dec-20 EPS (earlier Sep-20).
Top picks in FMCG: ITC, Dabur and Jubilant FoodWorks
11 11 12 12 12 13
8
11
15
12
15 15
9
15
23
10 8
15
5
10
15
20
25
ITC
HU
L
Nes
tle
Dab
ur
Bri
tan
nia
Mar
ico
Co
lgat
e
Emam
i
Jub
ilan
t Fo
od
Sales Gr. (%) EBITDA Gr. (%)
3
FMCG: Normalcy has been restored
COMPANY 3QFY19E
OUTLOOK WHAT’S LIKELY KEY MONITORABLES
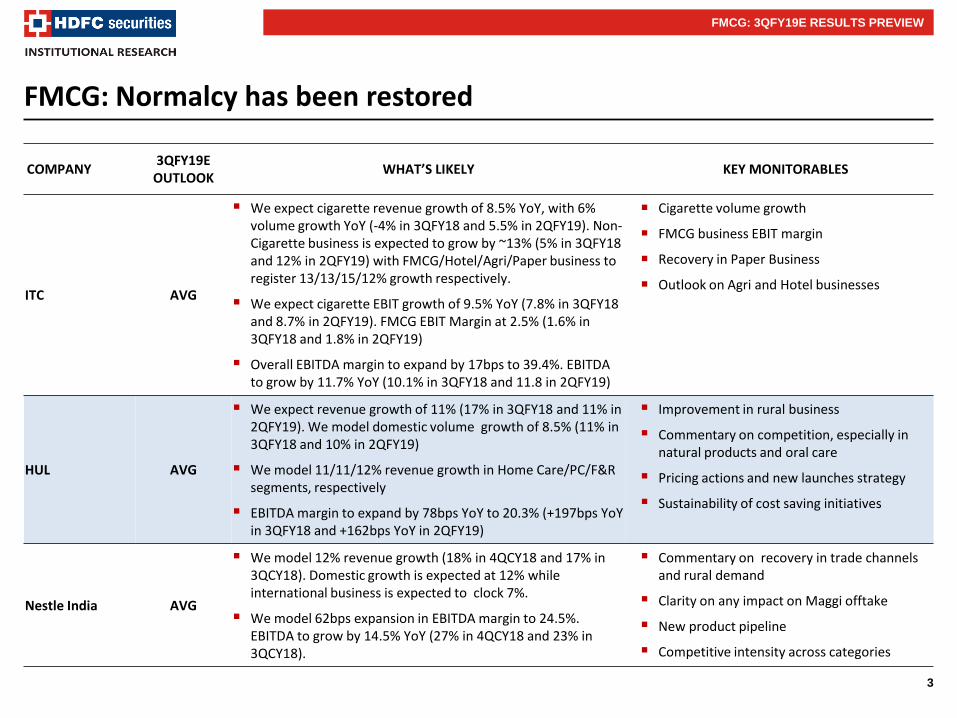
ITC AVG
We expect cigarette revenue growth of 8.5% YoY, with 6% volume growth YoY (-4% in 3QFY18 and 5.5% in 2QFY19). Non-Cigarette business is expected to grow by ~13% (5% in 3QFY18 and 12% in 2QFY19) with FMCG/Hotel/Agri/Paper business to register 13/13/15/12% growth respectively.
We expect cigarette EBIT growth of 9.5% YoY (7.8% in 3QFY18 and 8.7% in 2QFY19). FMCG EBIT Margin at 2.5% (1.6% in 3QFY18 and 1.8% in 2QFY19)
Overall EBITDA margin to expand by 17bps to 39.4%. EBITDA to grow by 11.7% YoY (10.1% in 3QFY18 and 11.8 in 2QFY19)
Cigarette volume growth
FMCG business EBIT margin
Recovery in Paper Business
Outlook on Agri and Hotel businesses
HUL AVG
We expect revenue growth of 11% (17% in 3QFY18 and 11% in 2QFY19). We model domestic volume growth of 8.5% (11% in 3QFY18 and 10% in 2QFY19)
We model 11/11/12% revenue growth in Home Care/PC/F&R segments, respectively
EBITDA margin to expand by 78bps YoY to 20.3% (+197bps YoY in 3QFY18 and +162bps YoY in 2QFY19)
Improvement in rural business
Commentary on competition, especially in natural products and oral care
Pricing actions and new launches strategy
Sustainability of cost saving initiatives
Nestle India AVG
We model 12% revenue growth (18% in 4QCY18 and 17% in 3QCY18). Domestic growth is expected at 12% while international business is expected to clock 7%.
We model 62bps expansion in EBITDA margin to 24.5%. EBITDA to grow by 14.5% YoY (27% in 4QCY18 and 23% in 3QCY18).
Commentary on recovery in trade channels and rural demand
Clarity on any impact on Maggi offtake
New product pipeline
Competitive intensity across categories
FMCG: 3QFY19E RESULTS PREVIEW
4
FMCG: Normalcy has been restored
COMPANY 3QFY19E
OUTLOOK WHAT’S LIKELY KEY MONITORABLES
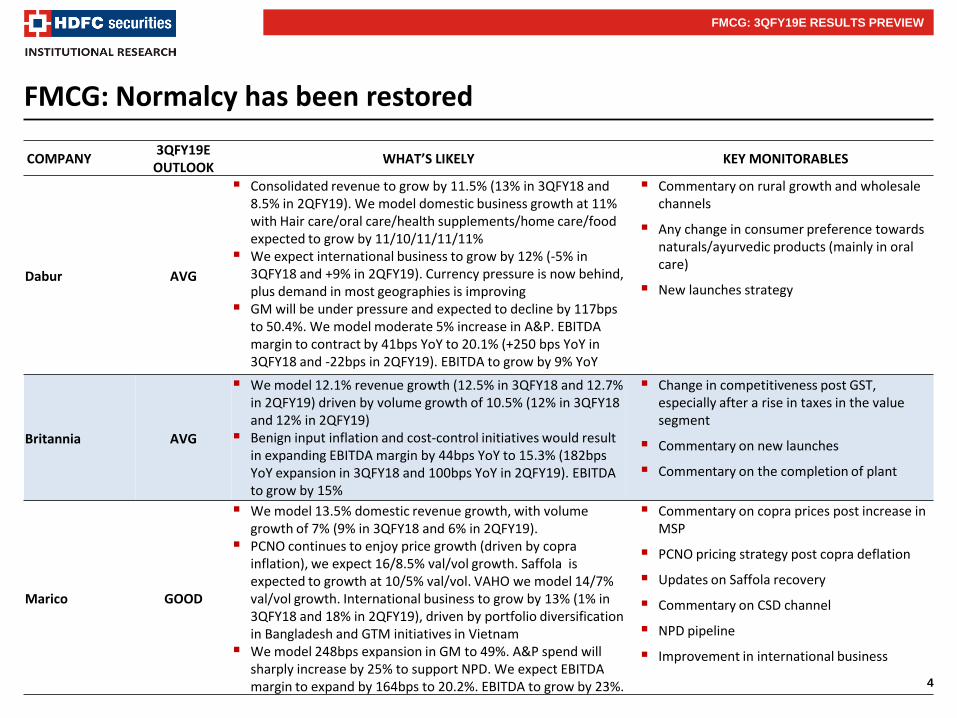
Dabur AVG
Consolidated revenue to grow by 11.5% (13% in 3QFY18 and 8.5% in 2QFY19). We model domestic business growth at 11% with Hair care/oral care/health supplements/home care/food expected to grow by 11/10/11/11/11%
We expect international business to grow by 12% (-5% in 3QFY18 and +9% in 2QFY19). Currency pressure is now behind, plus demand in most geographies is improving
GM will be under pressure and expected to decline by 117bps to 50.4%. We model moderate 5% increase in A&P. EBITDA margin to contract by 41bps YoY to 20.1% (+250 bps YoY in 3QFY18 and -22bps in 2QFY19). EBITDA to grow by 9% YoY
Commentary on rural growth and wholesale channels
Any change in consumer preference towards naturals/ayurvedic products (mainly in oral care)
New launches strategy
Britannia AVG
We model 12.1% revenue growth (12.5% in 3QFY18 and 12.7% in 2QFY19) driven by volume growth of 10.5% (12% in 3QFY18 and 12% in 2QFY19)
Benign input inflation and cost-control initiatives would result in expanding EBITDA margin by 44bps YoY to 15.3% (182bps YoY expansion in 3QFY18 and 100bps YoY in 2QFY19). EBITDA to grow by 15%
Change in competitiveness post GST, especially after a rise in taxes in the value segment
Commentary on new launches
Commentary on the completion of plant
Marico GOOD
We model 13.5% domestic revenue growth, with volume growth of 7% (9% in 3QFY18 and 6% in 2QFY19).
PCNO continues to enjoy price growth (driven by copra inflation), we expect 16/8.5% val/vol growth. Saffola is expected to growth at 10/5% val/vol. VAHO we model 14/7% val/vol growth. International business to grow by 13% (1% in 3QFY18 and 18% in 2QFY19), driven by portfolio diversification in Bangladesh and GTM initiatives in Vietnam
We model 248bps expansion in GM to 49%. A&P spend will sharply increase by 25% to support NPD. We expect EBITDA margin to expand by 164bps to 20.2%. EBITDA to grow by 23%.
Commentary on copra prices post increase in MSP
PCNO pricing strategy post copra deflation
Updates on Saffola recovery
Commentary on CSD channel
NPD pipeline
Improvement in international business
FMCG: 3QFY19E RESULTS PREVIEW
5
FMCG: Normalcy has been restored
COMPANY 3QFY19E
OUTLOOK WHAT’S LIKELY KEY MONITORABLES
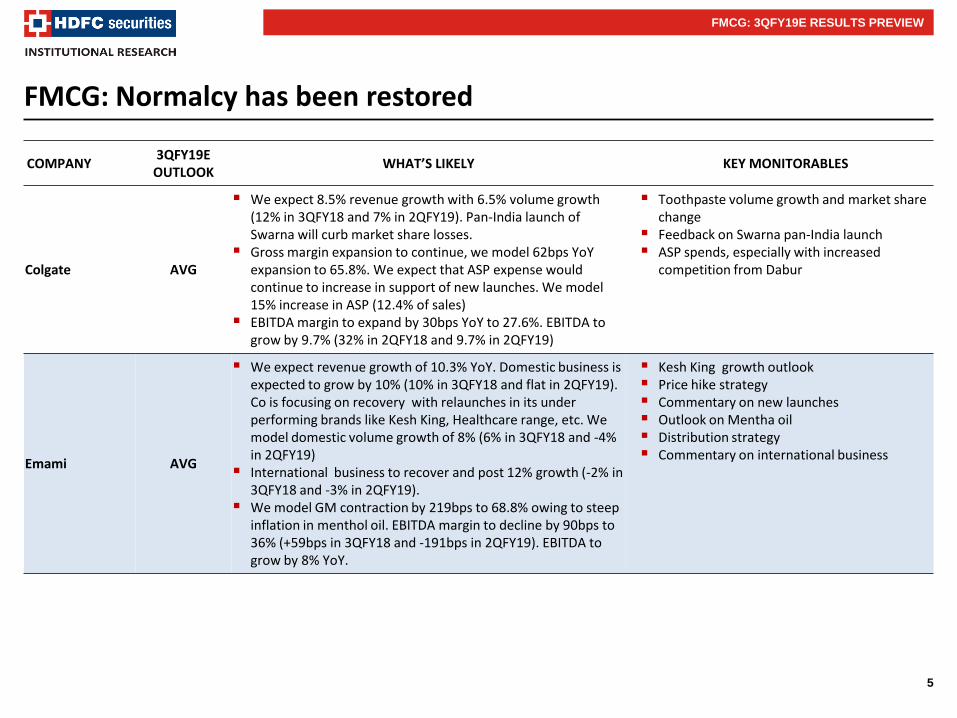
Colgate AVG
We expect 8.5% revenue growth with 6.5% volume growth (12% in 3QFY18 and 7% in 2QFY19). Pan-India launch of Swarna will curb market share losses.
Gross margin expansion to continue, we model 62bps YoY expansion to 65.8%. We expect that ASP expense would continue to increase in support of new launches. We model 15% increase in ASP (12.4% of sales)
EBITDA margin to expand by 30bps YoY to 27.6%. EBITDA to grow by 9.7% (32% in 2QFY18 and 9.7% in 2QFY19)
Toothpaste volume growth and market share change
Feedback on Swarna pan-India launch ASP spends, especially with increased
competition from Dabur
Emami AVG
We expect revenue growth of 10.3% YoY. Domestic business is expected to grow by 10% (10% in 3QFY18 and flat in 2QFY19). Co is focusing on recovery with relaunches in its under performing brands like Kesh King, Healthcare range, etc. We model domestic volume growth of 8% (6% in 3QFY18 and -4% in 2QFY19)
International business to recover and post 12% growth (-2% in 3QFY18 and -3% in 2QFY19).
We model GM contraction by 219bps to 68.8% owing to steep inflation in menthol oil. EBITDA margin to decline by 90bps to 36% (+59bps in 3QFY18 and -191bps in 2QFY19). EBITDA to grow by 8% YoY.
Kesh King growth outlook Price hike strategy Commentary on new launches Outlook on Mentha oil Distribution strategy Commentary on international business
FMCG: 3QFY19E RESULTS PREVIEW
6
FMCG: Normalcy has been restored
COMPANY 3QFY19E
OUTLOOK WHAT’S LIKELY KEY MONITORABLES
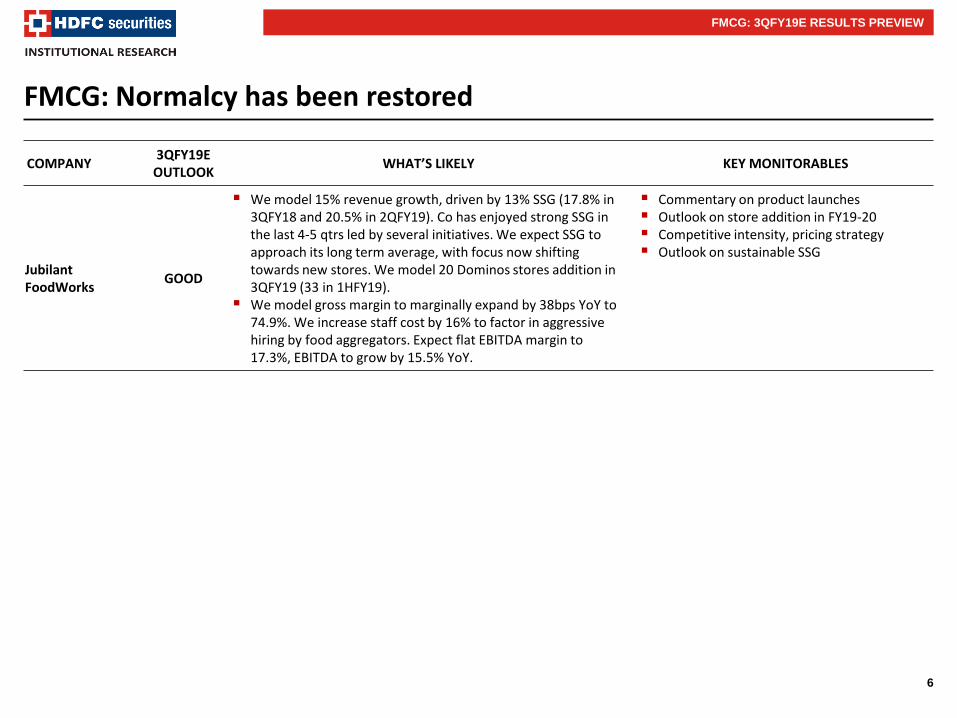
Jubilant FoodWorks
GOOD
We model 15% revenue growth, driven by 13% SSG (17.8% in 3QFY18 and 20.5% in 2QFY19). Co has enjoyed strong SSG in the last 4-5 qtrs led by several initiatives. We expect SSG to approach its long term average, with focus now shifting towards new stores. We model 20 Dominos stores addition in 3QFY19 (33 in 1HFY19).
We model gross margin to marginally expand by 38bps YoY to 74.9%. We increase staff cost by 16% to factor in aggressive hiring by food aggregators. Expect flat EBITDA margin to 17.3%, EBITDA to grow by 15.5% YoY.
Commentary on product launches Outlook on store addition in FY19-20 Competitive intensity, pricing strategy Outlook on sustainable SSG
FMCG: 3QFY19E RESULTS PREVIEW
7
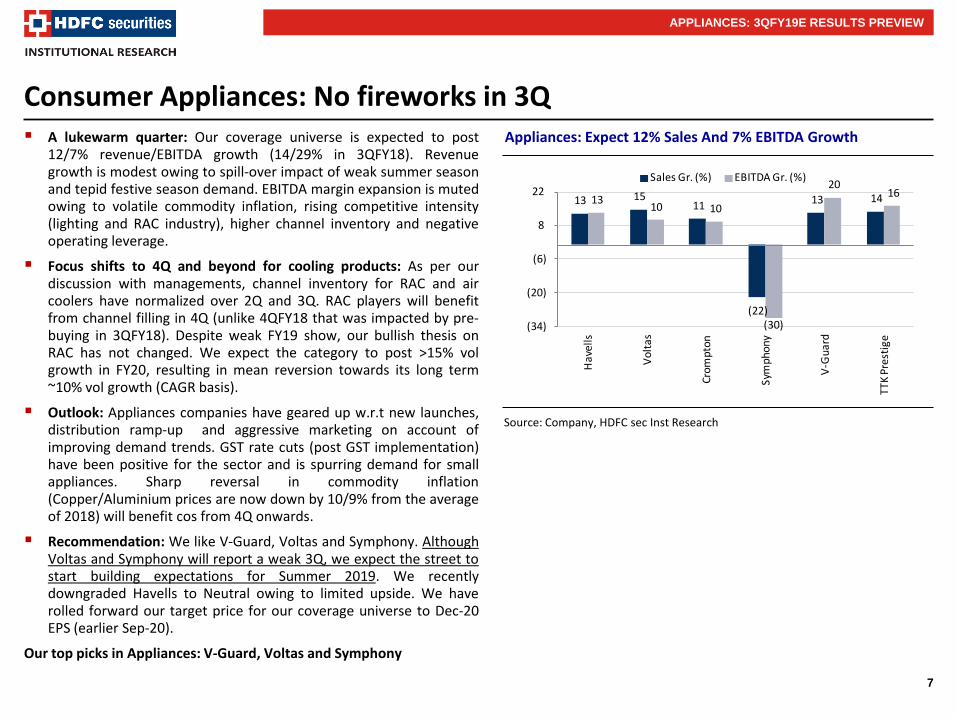
Consumer Appliances: No fireworks in 3Q A lukewarm quarter: Our coverage universe is expected to post
12/7% revenue/EBITDA growth (14/29% in 3QFY18). Revenue growth is modest owing to spill-over impact of weak summer season and tepid festive season demand. EBITDA margin expansion is muted owing to volatile commodity inflation, rising competitive intensity (lighting and RAC industry), higher channel inventory and negative operating leverage.
Focus shifts to 4Q and beyond for cooling products: As per our discussion with managements, channel inventory for RAC and air coolers have normalized over 2Q and 3Q. RAC players will benefit from channel filling in 4Q (unlike 4QFY18 that was impacted by pre-buying in 3QFY18). Despite weak FY19 show, our bullish thesis on RAC has not changed. We expect the category to post >15% vol growth in FY20, resulting in mean reversion towards its long term ~10% vol growth (CAGR basis).
Outlook: Appliances companies have geared up w.r.t new launches, distribution ramp-up and aggressive marketing on account of improving demand trends. GST rate cuts (post GST implementation) have been positive for the sector and is spurring demand for small appliances. Sharp reversal in commodity inflation (Copper/Aluminium prices are now down by 10/9% from the average of 2018) will benefit cos from 4Q onwards.
Recommendation: We like V-Guard, Voltas and Symphony. Although Voltas and Symphony will report a weak 3Q, we expect the street to start building expectations for Summer 2019. We recently downgraded Havells to Neutral owing to limited upside. We have rolled forward our target price for our coverage universe to Dec-20 EPS (earlier Sep-20).
Our top picks in Appliances: V-Guard, Voltas and Symphony
Source: Company, HDFC sec Inst Research
APPLIANCES: 3QFY19E RESULTS PREVIEW
Appliances: Expect 12% Sales And 7% EBITDA Growth
13 15 11
(22)
13 14 13 10 10
(30)
20 16
(34)
(20)
(6)
8
22
Hav
ells
Vo
ltas
Cro
mp
ton
Sym
phon
y
V-G
uar
d
TT
K P
rest
ige
Sales Gr. (%) EBITDA Gr. (%)
8
Consumer Appliances: No fireworks in 3Q
COMPANY 3QFY19E
OUTLOOK WHAT’S LIKELY KEY MONITORABLES
Havells India AVG
We expect Havells (ex-Lloyd ) to register ~14% revenue growth (14% in 3QFY18 and 28% in 2QFY19). C&W enjoys a favorable base (3%) while lighting growth will be impacted from EESL business. ECD should benefit from shift in festive season. We model 14/18/5/16% for Switchgears/Cables/Lighting/ECD. We model 5% growth in Lloyd (-4% in 2QFY19) owing to higher channel inventory.
We model flat (ex-Lloyd) EBITDA margin (251bps in 3QFY18 and -289bps in 2QFY19) owing to volatile commodity prices and limited pricing actions. Lloyd, we expect EBITDA margin of 2.8% (2.9% in 3QFY18 and 3.3% in 2QFY19). We model overall EBITDA growth of 13%.
Outlook on housing demand
Commentary on new launches in consumer durables
Update on Lloyd’s Consumer business (channel inventory)
Commentary on commodity inflation and pricing actions
Voltas
AVG
We expect consolidated net revenue growth of 15% YoY. UCP segment to report 5% growth (32% in 3QFY18 and 8% in 2QFY19) on account of higher channel inventory. We model 22% growth in EMPS (7% in 3QFY18 and 62% in 2QFY19)
We model UCP EBIT margin contraction of 400bps YoY to 9% due higher commodity inflation and inability to pass on cost (higher channel inventory). EMPS EBIT to expand by 91bps to 8%
EBITDA margin to decline by 32bps to 8%. We model overall EBITDA growth of 10%.
RAC channel inventory
Competitiveness in RAC market
Outlook on EMPS revenue and margin
APPLIANCES: 3QFY19E RESULTS PREVIEW
9
Consumer Appliances: No fireworks in 3Q
COMPANY 3QFY19E
OUTLOOK WHAT’S LIKELY KEY MONITORABLES
Crompton Consumer
AVG
We expect 11% revenue growth, driven by 3% growth from Lighting (23% in 3QFY18 and -4% in 2QFY19) and 15% growth from ECD segment (7% in 3QFY18 and 15% in 2QFY19). Lighting growth will be impacted by EESL business (shift in focus to B2B).
We model 13bps decline in EBITDA margin to 12.3% owing to margin pressure in conventional lighting & LED (increased competitive intensity) partially offset by premiumisation in fans. We model overall EBITDA growth of 10%.
Growth in premium fans
Commentary on GTM initiatives
Performance of new launches
Margin outlook for lighting
V-Guard Industries
AVG
We model 13% YoY revenue growth (23% in 3QFY18 and 6% in 2QFY19) for the quarter. The co. will benefit from shift in festive season along with modest replacement demand owing to Kerala floods. We expect 5/14/12/13/22/12% growth for Stabilizers/UPS/Pumps/Cables/Water Heaters/Fans.
We model 64bps expansion in gross margin (130bps in 3QFY18 and -234bps in 2QFY19) to 32.7%. V-Guard has spent significantly on brand rejuvenation during the last 4 quarters, hence we expect ASP to moderate during the quarter despite new launches. We expect 52bps EBITDA margin expansion to 9.9% (114bps in 3QFY18 and -354bps in 2QFY19)
Commentary on Kerala demand
Non-south performance
Performance of new launches
Outlook on input cost inflation and pricing action
APPLIANCES: 3QFY19E RESULTS PREVIEW
10
Consumer Appliances: No fireworks in 3Q
COMPANY 3QFY19E
OUTLOOK WHAT’S LIKELY KEY MONITORABLES
TTK Prestige AVG
We expect net revenue growth of 13% (15% in 3QFY18 and 8% in 2QFY19). We model 13/16/13/25% growth in Cookers/Cookware/Appliances/Others respectively.
We model EBITDA margin expansion of 28bps YoY (316bps in 3QFY18 and 187bps in 2QFY19). We expect EBITDA to grow by 16%
Performance of new product launches
Commentary on recovery in trade channels
Commentary on rural demand
Commodity inflation and pricing actions
Symphony (Standalone)
WEAK
We expect net revenue to contract by 22% (21% in 3QFY18 and -20% in 2QFY19) driven by higher than normal inventory in the trade channel (impacted by erratic summer). We model 25% revenue contraction in the domestic business.
We model gross margin decline of 50bps (135bps in 3QFY18 and -256bps in 2QFY19) to 53.8%. Due to negative oplev, we model EBITDA margin decline of 439bps (255bps in 3QFY18, -444bps in 2QFY19) to 35.5%.
Channel feedback
Inventory levels in trade channel
GST and erratic summer impact on unorganised players
Performance of Climate Technologies and other geographies
Outlook on exports
APPLIANCES: 3QFY19E RESULTS PREVIEW
11
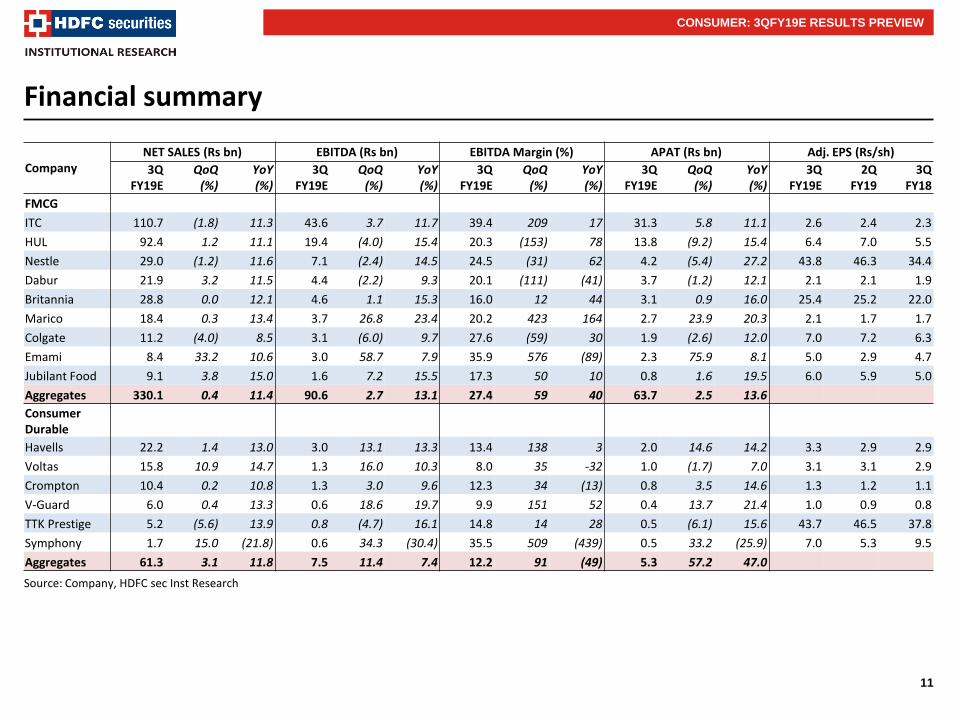
Financial summary
Source: Company, HDFC sec Inst Research
CONSUMER: 3QFY19E RESULTS PREVIEW
Company NET SALES (Rs bn) EBITDA (Rs bn) EBITDA Margin (%) APAT (Rs bn) Adj. EPS (Rs/sh)
3Q FY19E
QoQ (%)
YoY (%)
3Q FY19E
QoQ (%)
YoY (%)
3Q FY19E
QoQ (%)
YoY (%)
3Q FY19E
QoQ (%)
YoY (%)
3Q FY19E
2Q FY19
3Q FY18
FMCG
ITC 110.7 (1.8) 11.3 43.6 3.7 11.7 39.4 209 17 31.3 5.8 11.1 2.6 2.4 2.3
HUL 92.4 1.2 11.1 19.4 (4.0) 15.4 20.3 (153) 78 13.8 (9.2) 15.4 6.4 7.0 5.5
Nestle 29.0 (1.2) 11.6 7.1 (2.4) 14.5 24.5 (31) 62 4.2 (5.4) 27.2 43.8 46.3 34.4
Dabur 21.9 3.2 11.5 4.4 (2.2) 9.3 20.1 (111) (41) 3.7 (1.2) 12.1 2.1 2.1 1.9
Britannia 28.8 0.0 12.1 4.6 1.1 15.3 16.0 12 44 3.1 0.9 16.0 25.4 25.2 22.0
Marico 18.4 0.3 13.4 3.7 26.8 23.4 20.2 423 164 2.7 23.9 20.3 2.1 1.7 1.7
Colgate 11.2 (4.0) 8.5 3.1 (6.0) 9.7 27.6 (59) 30 1.9 (2.6) 12.0 7.0 7.2 6.3
Emami 8.4 33.2 10.6 3.0 58.7 7.9 35.9 576 (89) 2.3 75.9 8.1 5.0 2.9 4.7
Jubilant Food 9.1 3.8 15.0 1.6 7.2 15.5 17.3 50 10 0.8 1.6 19.5 6.0 5.9 5.0
Aggregates 330.1 0.4 11.4 90.6 2.7 13.1 27.4 59 40 63.7 2.5 13.6
Consumer Durable
Havells 22.2 1.4 13.0 3.0 13.1 13.3 13.4 138 3 2.0 14.6 14.2 3.3 2.9 2.9
Voltas 15.8 10.9 14.7 1.3 16.0 10.3 8.0 35 -32 1.0 (1.7) 7.0 3.1 3.1 2.9
Crompton 10.4 0.2 10.8 1.3 3.0 9.6 12.3 34 (13) 0.8 3.5 14.6 1.3 1.2 1.1
V-Guard 6.0 0.4 13.3 0.6 18.6 19.7 9.9 151 52 0.4 13.7 21.4 1.0 0.9 0.8
TTK Prestige 5.2 (5.6) 13.9 0.8 (4.7) 16.1 14.8 14 28 0.5 (6.1) 15.6 43.7 46.5 37.8
Symphony 1.7 15.0 (21.8) 0.6 34.3 (30.4) 35.5 509 (439) 0.5 33.2 (25.9) 7.0 5.3 9.5
Aggregates 61.3 3.1 11.8 7.5 11.4 7.4 12.2 91 (49) 5.3 57.2 47.0
12
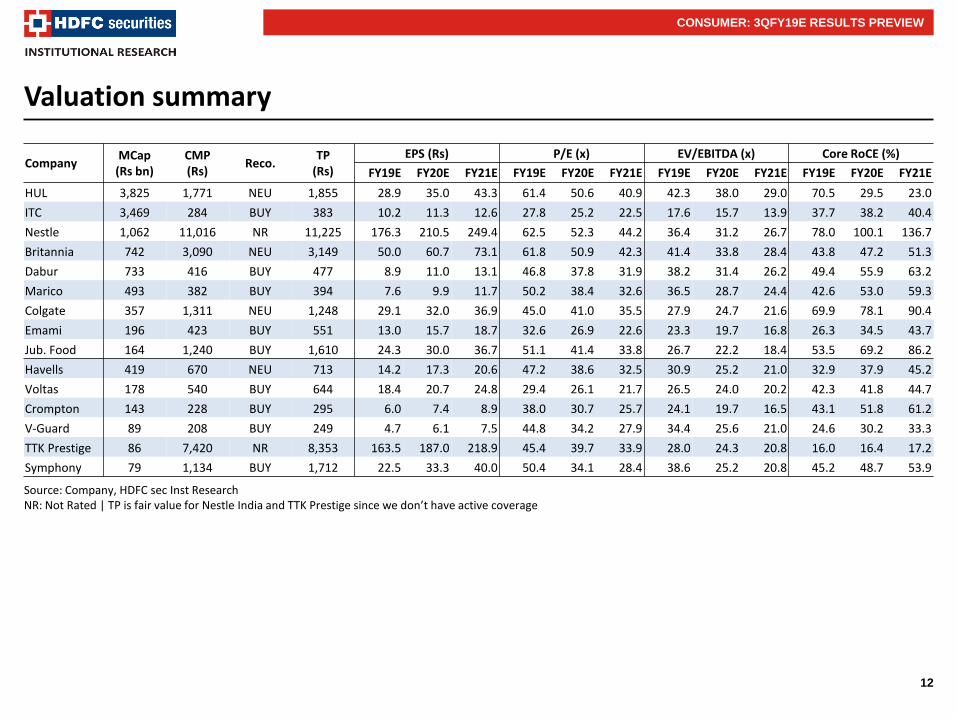
Valuation summary
Source: Company, HDFC sec Inst Research NR: Not Rated | TP is fair value for Nestle India and TTK Prestige since we don’t have active coverage
CONSUMER: 3QFY19E RESULTS PREVIEW
Company MCap
(Rs bn) CMP (Rs)
Reco. TP
(Rs)
EPS (Rs) P/E (x) EV/EBITDA (x) Core RoCE (%)
FY19E FY20E FY21E FY19E FY20E FY21E FY19E FY20E FY21E FY19E FY20E FY21E
HUL 3,825 1,771 NEU 1,855 28.9 35.0 43.3 61.4 50.6 40.9 42.3 38.0 29.0 70.5 29.5 23.0
ITC 3,469 284 BUY 383 10.2 11.3 12.6 27.8 25.2 22.5 17.6 15.7 13.9 37.7 38.2 40.4
Nestle 1,062 11,016 NR 11,225 176.3 210.5 249.4 62.5 52.3 44.2 36.4 31.2 26.7 78.0 100.1 136.7
Britannia 742 3,090 NEU 3,149 50.0 60.7 73.1 61.8 50.9 42.3 41.4 33.8 28.4 43.8 47.2 51.3
Dabur 733 416 BUY 477 8.9 11.0 13.1 46.8 37.8 31.9 38.2 31.4 26.2 49.4 55.9 63.2
Marico 493 382 BUY 394 7.6 9.9 11.7 50.2 38.4 32.6 36.5 28.7 24.4 42.6 53.0 59.3
Colgate 357 1,311 NEU 1,248 29.1 32.0 36.9 45.0 41.0 35.5 27.9 24.7 21.6 69.9 78.1 90.4
Emami 196 423 BUY 551 13.0 15.7 18.7 32.6 26.9 22.6 23.3 19.7 16.8 26.3 34.5 43.7
Jub. Food 164 1,240 BUY 1,610 24.3 30.0 36.7 51.1 41.4 33.8 26.7 22.2 18.4 53.5 69.2 86.2
Havells 419 670 NEU 713 14.2 17.3 20.6 47.2 38.6 32.5 30.9 25.2 21.0 32.9 37.9 45.2
Voltas 178 540 BUY 644 18.4 20.7 24.8 29.4 26.1 21.7 26.5 24.0 20.2 42.3 41.8 44.7
Crompton 143 228 BUY 295 6.0 7.4 8.9 38.0 30.7 25.7 24.1 19.7 16.5 43.1 51.8 61.2
V-Guard 89 208 BUY 249 4.7 6.1 7.5 44.8 34.2 27.9 34.4 25.6 21.0 24.6 30.2 33.3
TTK Prestige 86 7,420 NR 8,353 163.5 187.0 218.9 45.4 39.7 33.9 28.0 24.3 20.8 16.0 16.4 17.2
Symphony 79 1,134 BUY 1,712 22.5 33.3 40.0 50.4 34.1 28.4 38.6 25.2 20.8 45.2 48.7 53.9
13
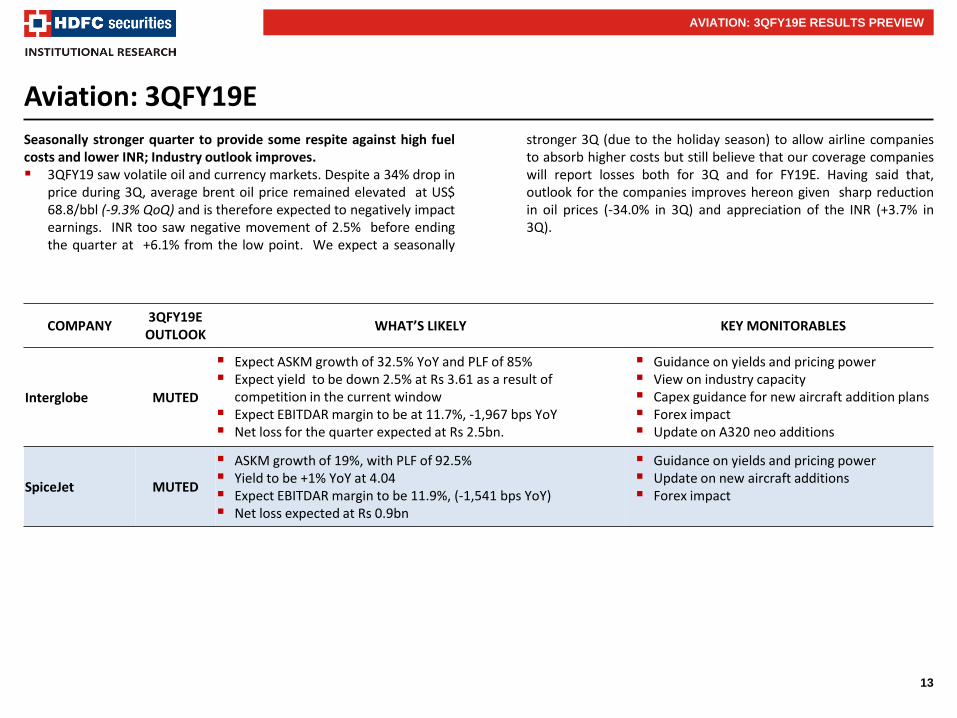
Aviation: 3QFY19E
COMPANY 3QFY19E
OUTLOOK WHAT’S LIKELY KEY MONITORABLES
Interglobe MUTED
Expect ASKM growth of 32.5% YoY and PLF of 85% Expect yield to be down 2.5% at Rs 3.61 as a result of
competition in the current window Expect EBITDAR margin to be at 11.7%, -1,967 bps YoY Net loss for the quarter expected at Rs 2.5bn.
Guidance on yields and pricing power View on industry capacity Capex guidance for new aircraft addition plans Forex impact Update on A320 neo additions
SpiceJet MUTED
ASKM growth of 19%, with PLF of 92.5% Yield to be +1% YoY at 4.04 Expect EBITDAR margin to be 11.9%, (-1,541 bps YoY) Net loss expected at Rs 0.9bn
Guidance on yields and pricing power Update on new aircraft additions Forex impact
AVIATION: 3QFY19E RESULTS PREVIEW
Seasonally stronger quarter to provide some respite against high fuel costs and lower INR; Industry outlook improves. 3QFY19 saw volatile oil and currency markets. Despite a 34% drop in
price during 3Q, average brent oil price remained elevated at US$ 68.8/bbl (-9.3% QoQ) and is therefore expected to negatively impact earnings. INR too saw negative movement of 2.5% before ending the quarter at +6.1% from the low point. We expect a seasonally
stronger 3Q (due to the holiday season) to allow airline companies to absorb higher costs but still believe that our coverage companies will report losses both for 3Q and for FY19E. Having said that, outlook for the companies improves hereon given sharp reduction in oil prices (-34.0% in 3Q) and appreciation of the INR (+3.7% in 3Q).
14
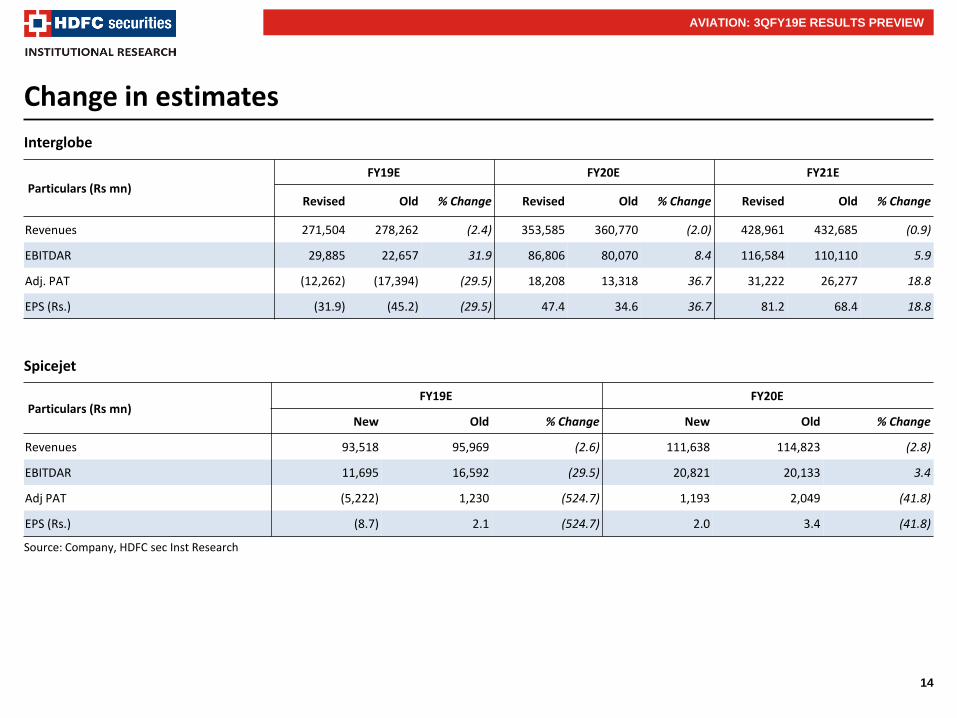
Change in estimates
AVIATION: 3QFY19E RESULTS PREVIEW
Source: Company, HDFC sec Inst Research
Particulars (Rs mn) FY19E FY20E FY21E
Revised Old % Change Revised Old % Change Revised Old % Change
Revenues 271,504 278,262 (2.4) 353,585 360,770 (2.0) 428,961 432,685 (0.9)
EBITDAR 29,885 22,657 31.9 86,806 80,070 8.4 116,584 110,110 5.9
Adj. PAT (12,262) (17,394) (29.5) 18,208 13,318 36.7 31,222 26,277 18.8
EPS (Rs.) (31.9) (45.2) (29.5) 47.4 34.6 36.7 81.2 68.4 18.8
Interglobe
Spicejet
Source: Company, HDFC sec Inst Research
Particulars (Rs mn) FY19E FY20E
New Old % Change New Old % Change
Revenues 93,518 95,969 (2.6) 111,638 114,823 (2.8)
EBITDAR 11,695 16,592 (29.5) 20,821 20,133 3.4
Adj PAT (5,222) 1,230 (524.7) 1,193 2,049 (41.8)
EPS (Rs.) (8.7) 2.1 (524.7) 2.0 3.4 (41.8)
15
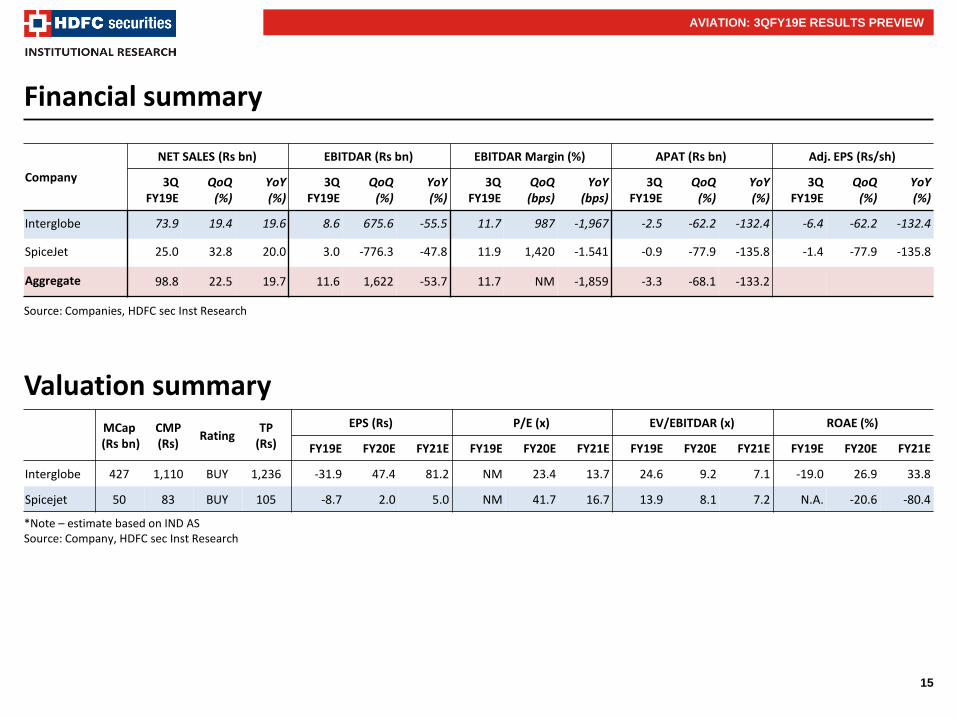
Financial summary
Company
NET SALES (Rs bn) EBITDAR (Rs bn) EBITDAR Margin (%) APAT (Rs bn) Adj. EPS (Rs/sh)
3Q FY19E
QoQ (%)
YoY (%)
3Q FY19E
QoQ (%)
YoY (%)
3Q FY19E
QoQ (bps)
YoY (bps)
3Q FY19E
QoQ (%)
YoY (%)
3Q FY19E
QoQ (%)
YoY (%)
Interglobe 73.9 19.4 19.6 8.6 675.6 -55.5 11.7 987 -1,967 -2.5 -62.2 -132.4 -6.4 -62.2 -132.4
SpiceJet 25.0 32.8 20.0 3.0 -776.3 -47.8 11.9 1,420 -1.541 -0.9 -77.9 -135.8 -1.4 -77.9 -135.8
Aggregate 98.8 22.5 19.7 11.6 1,622 -53.7 11.7 NM -1,859 -3.3 -68.1 -133.2
Source: Companies, HDFC sec Inst Research
AVIATION: 3QFY19E RESULTS PREVIEW
Valuation summary
*Note – estimate based on IND AS Source: Company, HDFC sec Inst Research
MCap
(Rs bn) CMP (Rs)
Rating TP
(Rs)
EPS (Rs) P/E (x) EV/EBITDAR (x) ROAE (%)
FY19E FY20E FY21E FY19E FY20E FY21E FY19E FY20E FY21E FY19E FY20E FY21E
Interglobe 427 1,110 BUY 1,236 -31.9 47.4 81.2 NM 23.4 13.7 24.6 9.2 7.1 -19.0 26.9 33.8
Spicejet 50 83 BUY 105 -8.7 2.0 5.0 NM 41.7 16.7 13.9 8.1 7.2 N.A. -20.6 -80.4
16
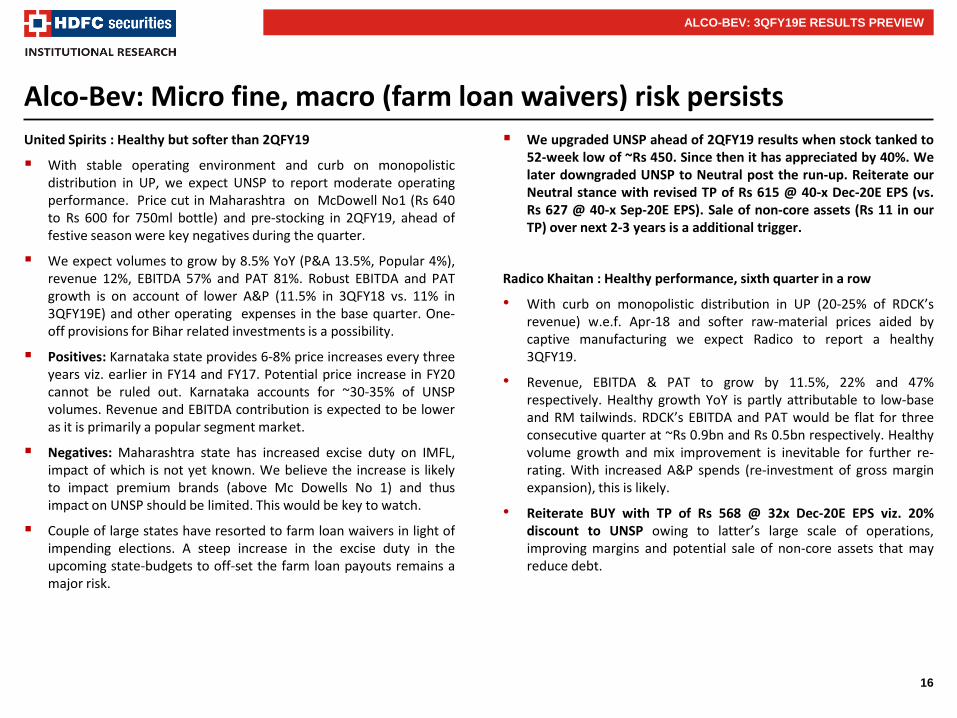
Alco-Bev: Micro fine, macro (farm loan waivers) risk persists
United Spirits : Healthy but softer than 2QFY19
With stable operating environment and curb on monopolistic distribution in UP, we expect UNSP to report moderate operating performance. Price cut in Maharashtra on McDowell No1 (Rs 640 to Rs 600 for 750ml bottle) and pre-stocking in 2QFY19, ahead of festive season were key negatives during the quarter.
We expect volumes to grow by 8.5% YoY (P&A 13.5%, Popular 4%), revenue 12%, EBITDA 57% and PAT 81%. Robust EBITDA and PAT growth is on account of lower A&P (11.5% in 3QFY18 vs. 11% in 3QFY19E) and other operating expenses in the base quarter. One-off provisions for Bihar related investments is a possibility.
Positives: Karnataka state provides 6-8% price increases every three years viz. earlier in FY14 and FY17. Potential price increase in FY20 cannot be ruled out. Karnataka accounts for ~30-35% of UNSP volumes. Revenue and EBITDA contribution is expected to be lower as it is primarily a popular segment market.
Negatives: Maharashtra state has increased excise duty on IMFL, impact of which is not yet known. We believe the increase is likely to impact premium brands (above Mc Dowells No 1) and thus impact on UNSP should be limited. This would be key to watch.
Couple of large states have resorted to farm loan waivers in light of impending elections. A steep increase in the excise duty in the upcoming state-budgets to off-set the farm loan payouts remains a major risk.
We upgraded UNSP ahead of 2QFY19 results when stock tanked to 52-week low of ~Rs 450. Since then it has appreciated by 40%. We later downgraded UNSP to Neutral post the run-up. Reiterate our Neutral stance with revised TP of Rs 615 @ 40-x Dec-20E EPS (vs. Rs 627 @ 40-x Sep-20E EPS). Sale of non-core assets (Rs 11 in our TP) over next 2-3 years is a additional trigger.
Radico Khaitan : Healthy performance, sixth quarter in a row
• With curb on monopolistic distribution in UP (20-25% of RDCK’s revenue) w.e.f. Apr-18 and softer raw-material prices aided by captive manufacturing we expect Radico to report a healthy 3QFY19.
• Revenue, EBITDA & PAT to grow by 11.5%, 22% and 47% respectively. Healthy growth YoY is partly attributable to low-base and RM tailwinds. RDCK’s EBITDA and PAT would be flat for three consecutive quarter at ~Rs 0.9bn and Rs 0.5bn respectively. Healthy volume growth and mix improvement is inevitable for further re-rating. With increased A&P spends (re-investment of gross margin expansion), this is likely.
• Reiterate BUY with TP of Rs 568 @ 32x Dec-20E EPS viz. 20% discount to UNSP owing to latter’s large scale of operations, improving margins and potential sale of non-core assets that may reduce debt.
ALCO-BEV: 3QFY19E RESULTS PREVIEW
17
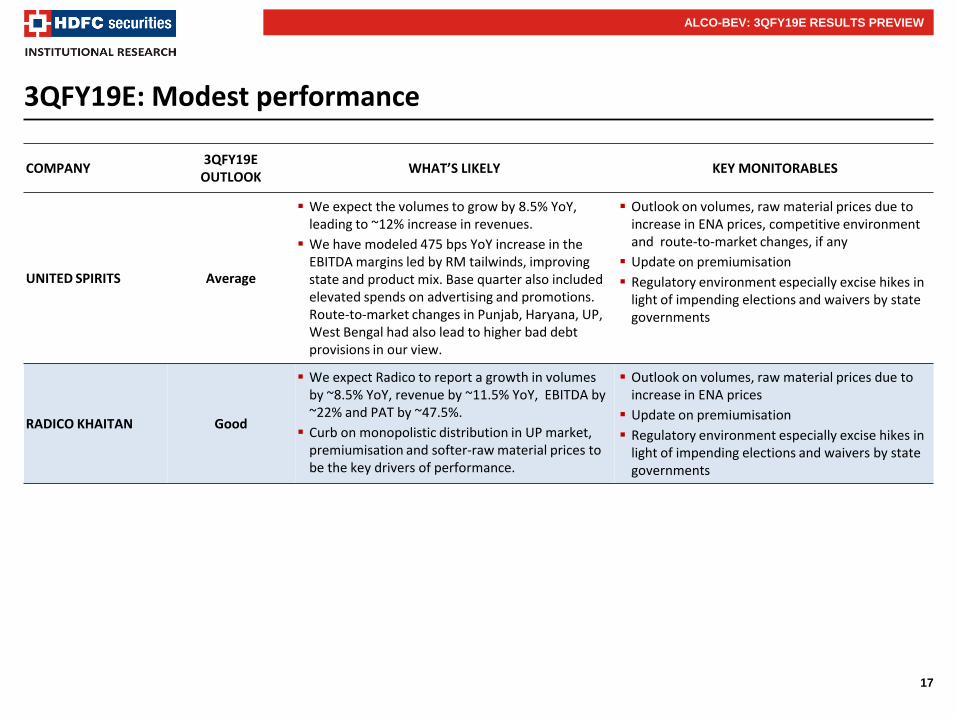
3QFY19E: Modest performance
COMPANY 3QFY19E
OUTLOOK WHAT’S LIKELY KEY MONITORABLES
UNITED SPIRITS Average
We expect the volumes to grow by 8.5% YoY, leading to ~12% increase in revenues.
We have modeled 475 bps YoY increase in the EBITDA margins led by RM tailwinds, improving state and product mix. Base quarter also included elevated spends on advertising and promotions. Route-to-market changes in Punjab, Haryana, UP, West Bengal had also lead to higher bad debt provisions in our view.
Outlook on volumes, raw material prices due to increase in ENA prices, competitive environment and route-to-market changes, if any
Update on premiumisation
Regulatory environment especially excise hikes in light of impending elections and waivers by state governments
RADICO KHAITAN Good
We expect Radico to report a growth in volumes by ~8.5% YoY, revenue by ~11.5% YoY, EBITDA by ~22% and PAT by ~47.5%.
Curb on monopolistic distribution in UP market, premiumisation and softer-raw material prices to be the key drivers of performance.
Outlook on volumes, raw material prices due to increase in ENA prices
Update on premiumisation
Regulatory environment especially excise hikes in light of impending elections and waivers by state governments
ALCO-BEV: 3QFY19E RESULTS PREVIEW
18
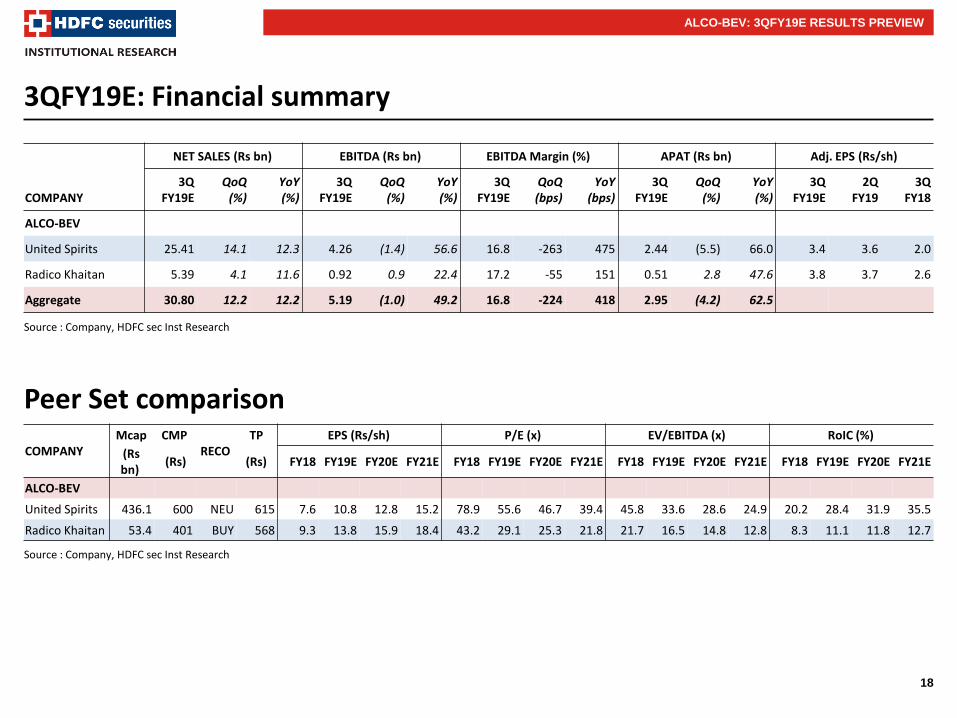
3QFY19E: Financial summary
Source : Company, HDFC sec Inst Research
Source : Company, HDFC sec Inst Research
Peer Set comparison
COMPANY
NET SALES (Rs bn) EBITDA (Rs bn) EBITDA Margin (%) APAT (Rs bn) Adj. EPS (Rs/sh)
3Q FY19E
QoQ (%)
YoY (%)
3Q FY19E
QoQ (%)
YoY (%)
3Q FY19E
QoQ (bps)
YoY (bps)
3Q FY19E
QoQ (%)
YoY (%)
3Q FY19E
2Q FY19
3Q FY18
ALCO-BEV
United Spirits 25.41 14.1 12.3 4.26 (1.4) 56.6 16.8 -263 475 2.44 (5.5) 66.0 3.4 3.6 2.0
Radico Khaitan 5.39 4.1 11.6 0.92 0.9 22.4 17.2 -55 151 0.51 2.8 47.6 3.8 3.7 2.6
Aggregate 30.80 12.2 12.2 5.19 (1.0) 49.2 16.8 -224 418 2.95 (4.2) 62.5
COMPANY Mcap CMP
RECO TP EPS (Rs/sh) P/E (x) EV/EBITDA (x) RoIC (%)
(Rs bn)
(Rs) (Rs) FY18 FY19E FY20E FY21E FY18 FY19E FY20E FY21E FY18 FY19E FY20E FY21E FY18 FY19E FY20E FY21E
ALCO-BEV
United Spirits 436.1 600 NEU 615 7.6 10.8 12.8 15.2 78.9 55.6 46.7 39.4 45.8 33.6 28.6 24.9 20.2 28.4 31.9 35.5
Radico Khaitan 53.4 401 BUY 568 9.3 13.8 15.9 18.4 43.2 29.1 25.3 21.8 21.7 16.5 14.8 12.8 8.3 11.1 11.8 12.7
ALCO-BEV: 3QFY19E RESULTS PREVIEW
19
Lubricants: Softening crude price, a tailwind
COMPANY 3QFY19E
OUTLOOK WHAT’S LIKELY KEY MONITORABLES
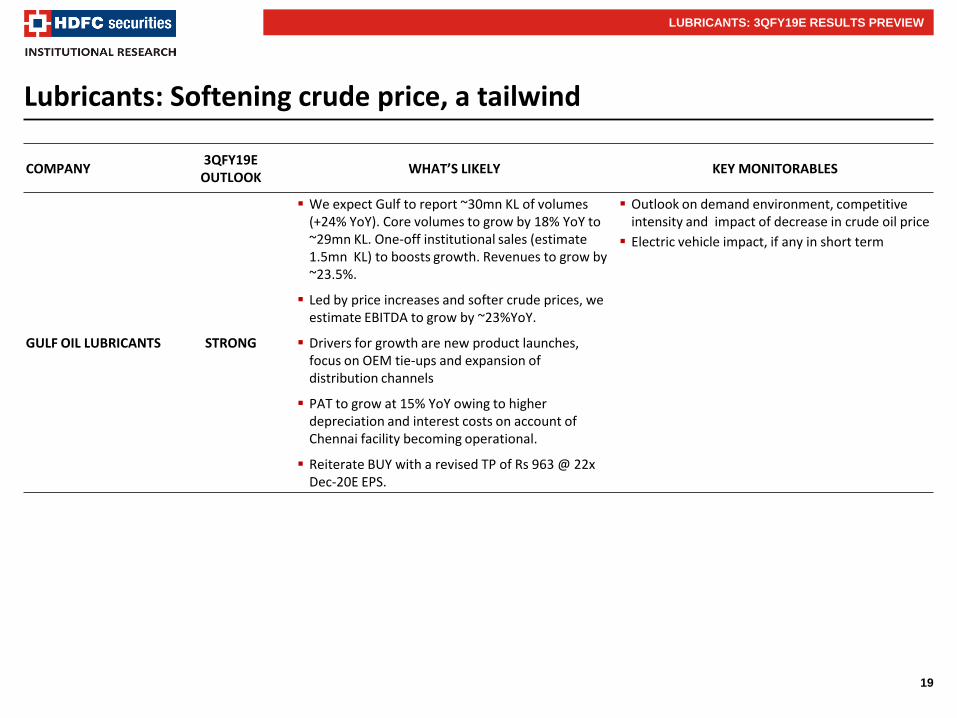
GULF OIL LUBRICANTS STRONG
We expect Gulf to report ~30mn KL of volumes (+24% YoY). Core volumes to grow by 18% YoY to ~29mn KL. One-off institutional sales (estimate 1.5mn KL) to boosts growth. Revenues to grow by ~23.5%.
Led by price increases and softer crude prices, we estimate EBITDA to grow by ~23%YoY.
Drivers for growth are new product launches, focus on OEM tie-ups and expansion of distribution channels
PAT to grow at 15% YoY owing to higher depreciation and interest costs on account of Chennai facility becoming operational.
Reiterate BUY with a revised TP of Rs 963 @ 22x Dec-20E EPS.
Outlook on demand environment, competitive intensity and impact of decrease in crude oil price
Electric vehicle impact, if any in short term
LUBRICANTS: 3QFY19E RESULTS PREVIEW
20
3QFY19E: Financial summary
Source : Company, HDFC sec Inst Research
Source : Company, HDFC sec Inst Research
Valuation
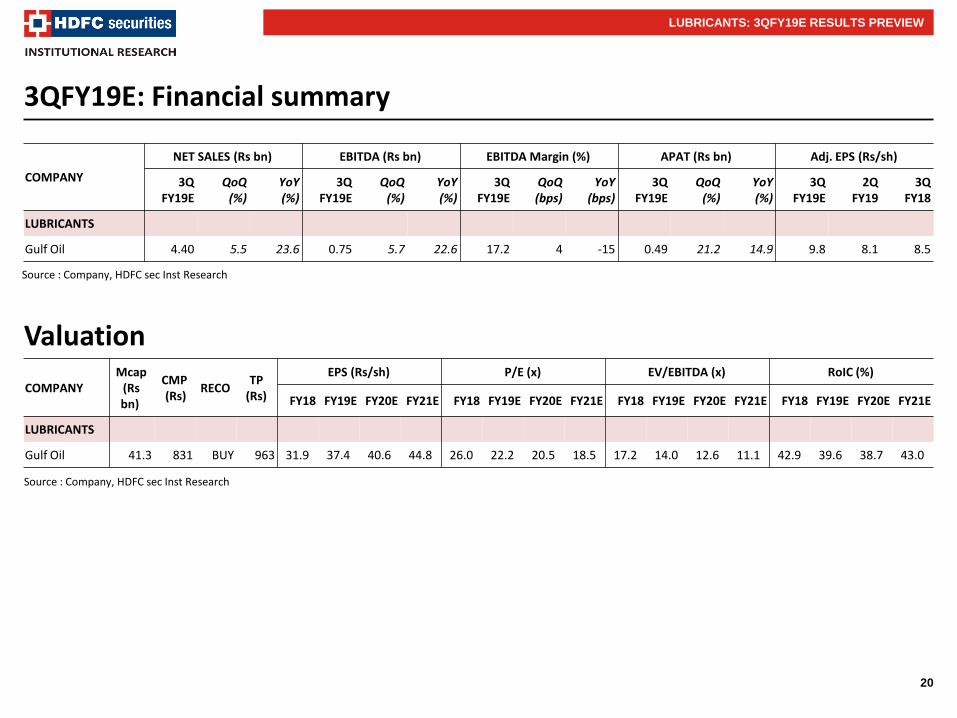
COMPANY
NET SALES (Rs bn) EBITDA (Rs bn) EBITDA Margin (%) APAT (Rs bn) Adj. EPS (Rs/sh)
3Q FY19E
QoQ (%)
YoY (%)
3Q FY19E
QoQ (%)
YoY (%)
3Q FY19E
QoQ (bps)
YoY (bps)
3Q FY19E
QoQ (%)
YoY (%)
3Q FY19E
2Q FY19
3Q FY18
LUBRICANTS
Gulf Oil 4.40 5.5 23.6 0.75 5.7 22.6 17.2 4 -15 0.49 21.2 14.9 9.8 8.1 8.5
COMPANY Mcap
(Rs bn)
CMP (Rs)
RECO TP
(Rs)
EPS (Rs/sh) P/E (x) EV/EBITDA (x) RoIC (%)
FY18 FY19E FY20E FY21E FY18 FY19E FY20E FY21E FY18 FY19E FY20E FY21E FY18 FY19E FY20E FY21E
LUBRICANTS
Gulf Oil 41.3 831 BUY 963 31.9 37.4 40.6 44.8 26.0 22.2 20.5 18.5 17.2 14.0 12.6 11.1 42.9 39.6 38.7 43.0
LUBRICANTS: 3QFY19E RESULTS PREVIEW
21
Hotels: Softer festive season
3QFY19 overview: In a seasonally strong quarter, we expect the occupancy to witness moderate growth in business district hotels owing to elongated festive season spread over Oct-Nov. Leisure travel demand though buoyant, has been partly impacted owing to increased overseas travel to neighboring countries (Nepal, Srilanka, Dubai, Bangkok etc). This has been partly on account of limited differential in airfare to tourist destinations vs. overseas travels. We expect ARR to improve by 3-4% for Indian Hotels and 6-7% for Lemon Tree.
Lemon Tree (LTHL)
LTHL is a leading mid-market (2-star to 4-star) hotel chain. It has emerged as a dominant player with ~8% market share (FY17) in the last decade. Medium term outlook remains robust due to healthy pipeline and improving mix. LTHL’s owned rooms will grow by 50% from 3,277 as of FY18 to 4,802 by FY21E.
LT opened its 2nd hotel in Pune (199 rooms) in Dec’18 which in the initial days witnessed healthy occupancy (+95% on some days) and Red Fox Hotel in Dehradun (92 hotels) in Oct-18.
Indian Hotels
In a seasonally strong quarter, we expect Indian Hotels (IHCL) to deliver a healthy 3Q with YoY growth of ~7%/15%/51% in revenue/ EBITDA/APAT respectively. IHCL re-opened Taj Connemara, Chennai in the last quarter which should boost growth.
We like IHCL owing to its strong brand equity, pan India footprint and leadership in luxury segment, healthy EBITDA/Capital Employed (30% in standalone) and significant scope for improvement in subsidiaries (especially Ginger with repositioning). Asset light strategy for expansions and monetization of non-core assets are additional positives.
Outlook : Valuations for hotel companies are not cheap (>20x FY20E EV/EBITDA), but the sector has potentials to transform itself from a cyclical to a structural play with increasing travel demand from Indian consumers, changing mix of customers, lower room penetration etc. We remain positive on Indian Hotels and Lemon Tree.
HOTELS : 3QFY19E RESULTS PREVIEW
22
3QFY19E: Mixed bag
COMPANY 3QFY19E
OUTLOOK WHAT’S LIKELY KEY MONITORABLES
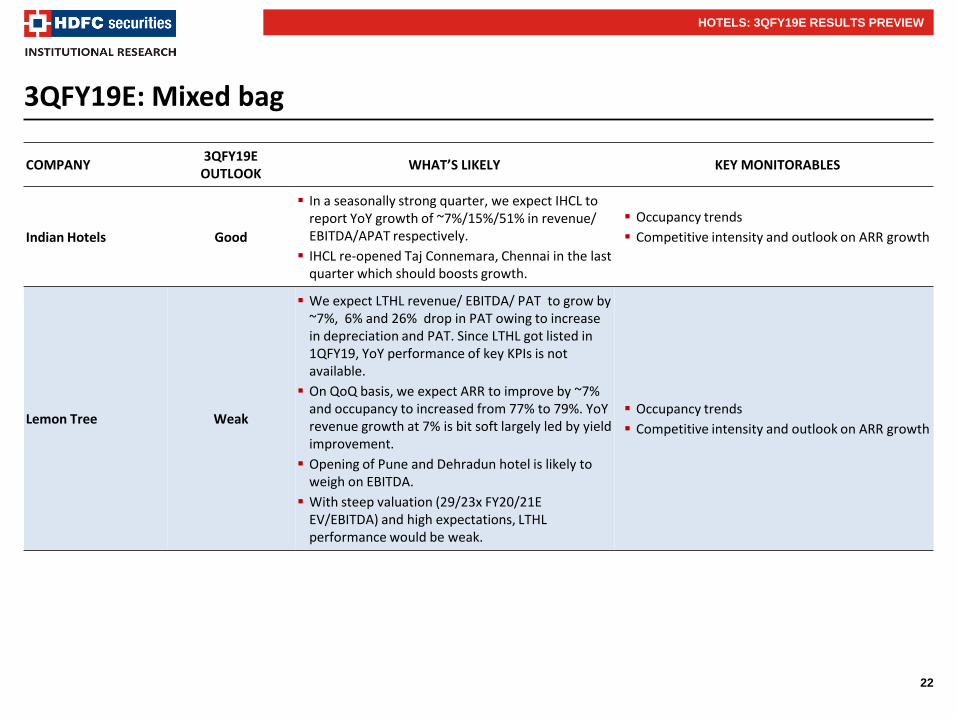
Indian Hotels Good
In a seasonally strong quarter, we expect IHCL to report YoY growth of ~7%/15%/51% in revenue/ EBITDA/APAT respectively.
IHCL re-opened Taj Connemara, Chennai in the last quarter which should boosts growth.
Occupancy trends
Competitive intensity and outlook on ARR growth
Lemon Tree Weak
We expect LTHL revenue/ EBITDA/ PAT to grow by ~7%, 6% and 26% drop in PAT owing to increase in depreciation and PAT. Since LTHL got listed in 1QFY19, YoY performance of key KPIs is not available.
On QoQ basis, we expect ARR to improve by ~7% and occupancy to increased from 77% to 79%. YoY revenue growth at 7% is bit soft largely led by yield improvement.
Opening of Pune and Dehradun hotel is likely to weigh on EBITDA.
With steep valuation (29/23x FY20/21E EV/EBITDA) and high expectations, LTHL performance would be weak.
Occupancy trends
Competitive intensity and outlook on ARR growth
HOTELS: 3QFY19E RESULTS PREVIEW
23
3QFY19E: Financial summary
Source : Company, HDFC sec Inst Research
Source : Company, HDFC sec Inst Research
Peer Set comparison
HOTELS: 3QFY19E RESULTS PREVIEW
COMPANY
NET SALES (Rs bn) EBITDA (Rs bn) EBITDA Margin (%) APAT (Rs bn) Adj. EPS (Rs/sh)
3Q FY19E
QoQ (%)
YoY (%)
3Q FY19E
QoQ (%)
YoY (%)
3Q FY19E
QoQ (bps)
YoY (bps)
3Q FY19E
QoQ (%)
YoY (%)
3Q FY19E
2Q FY19
3Q FY18
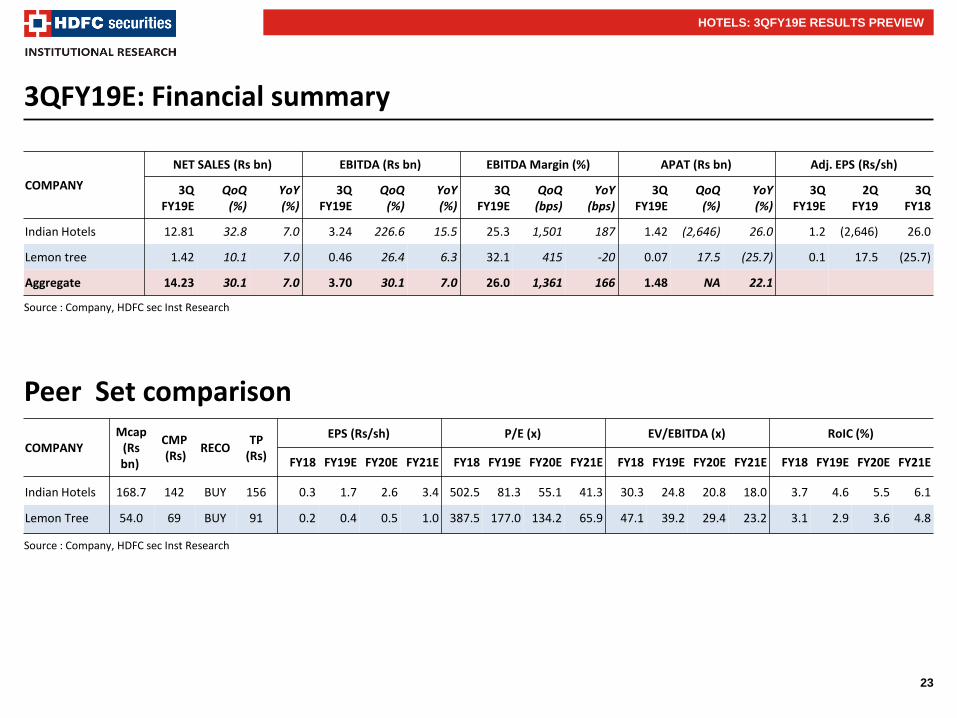
Indian Hotels 12.81 32.8 7.0 3.24 226.6 15.5 25.3 1,501 187 1.42 (2,646) 26.0 1.2 (2,646) 26.0
Lemon tree 1.42 10.1 7.0 0.46 26.4 6.3 32.1 415 -20 0.07 17.5 (25.7) 0.1 17.5 (25.7)
Aggregate 14.23 30.1 7.0 3.70 30.1 7.0 26.0 1,361 166 1.48 NA 22.1
COMPANY Mcap
(Rs bn)
CMP (Rs)
RECO TP
(Rs)
EPS (Rs/sh) P/E (x) EV/EBITDA (x) RoIC (%)
FY18 FY19E FY20E FY21E FY18 FY19E FY20E FY21E FY18 FY19E FY20E FY21E FY18 FY19E FY20E FY21E
Indian Hotels 168.7 142 BUY 156 0.3 1.7 2.6 3.4 502.5 81.3 55.1 41.3 30.3 24.8 20.8 18.0 3.7 4.6 5.5 6.1
Lemon Tree 54.0 69 BUY 91 0.2 0.4 0.5 1.0 387.5 177.0 134.2 65.9 47.1 39.2 29.4 23.2 3.1 2.9 3.6 4.8
24
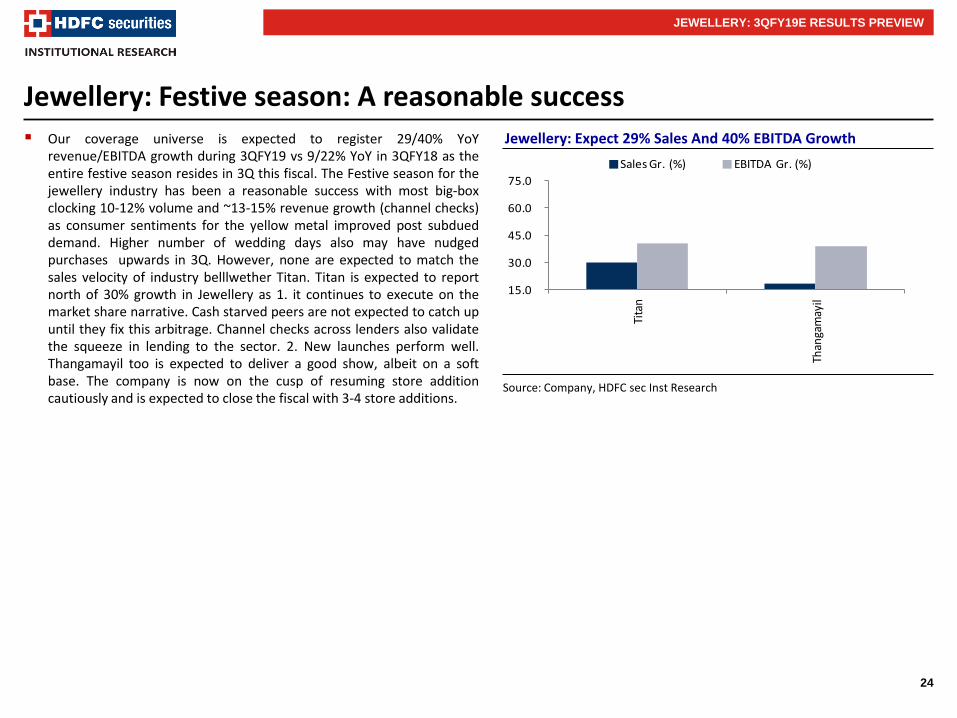
Jewellery: Festive season: A reasonable success Our coverage universe is expected to register 29/40% YoY
revenue/EBITDA growth during 3QFY19 vs 9/22% YoY in 3QFY18 as the entire festive season resides in 3Q this fiscal. The Festive season for the jewellery industry has been a reasonable success with most big-box clocking 10-12% volume and ~13-15% revenue growth (channel checks) as consumer sentiments for the yellow metal improved post subdued demand. Higher number of wedding days also may have nudged purchases upwards in 3Q. However, none are expected to match the sales velocity of industry belllwether Titan. Titan is expected to report north of 30% growth in Jewellery as 1. it continues to execute on the market share narrative. Cash starved peers are not expected to catch up until they fix this arbitrage. Channel checks across lenders also validate the squeeze in lending to the sector. 2. New launches perform well. Thangamayil too is expected to deliver a good show, albeit on a soft base. The company is now on the cusp of resuming store addition cautiously and is expected to close the fiscal with 3-4 store additions.
Jewellery: Expect 29% Sales And 40% EBITDA Growth
JEWELLERY: 3QFY19E RESULTS PREVIEW
Source: Company, HDFC sec Inst Research
15.0
30.0
45.0
60.0
75.0
Tita
n
Than
gam
ayil
Sales Gr. (%) EBITDA Gr. (%)
25
COMPANY 3QFY19E
OUTLOOK WHAT’S LIKELY KEY MONITORABLES
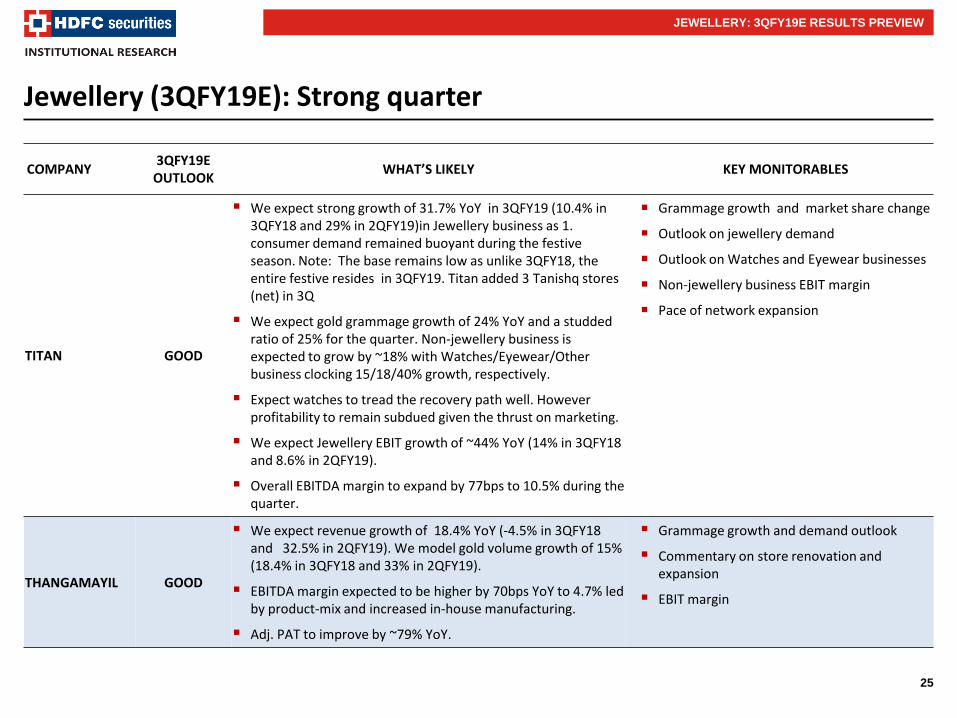
TITAN GOOD
We expect strong growth of 31.7% YoY in 3QFY19 (10.4% in 3QFY18 and 29% in 2QFY19)in Jewellery business as 1. consumer demand remained buoyant during the festive season. Note: The base remains low as unlike 3QFY18, the entire festive resides in 3QFY19. Titan added 3 Tanishq stores (net) in 3Q
We expect gold grammage growth of 24% YoY and a studded ratio of 25% for the quarter. Non-jewellery business is expected to grow by ~18% with Watches/Eyewear/Other business clocking 15/18/40% growth, respectively.
Expect watches to tread the recovery path well. However profitability to remain subdued given the thrust on marketing.
We expect Jewellery EBIT growth of ~44% YoY (14% in 3QFY18 and 8.6% in 2QFY19).
Overall EBITDA margin to expand by 77bps to 10.5% during the quarter.
Grammage growth and market share change
Outlook on jewellery demand
Outlook on Watches and Eyewear businesses
Non-jewellery business EBIT margin
Pace of network expansion
THANGAMAYIL GOOD
We expect revenue growth of 18.4% YoY (-4.5% in 3QFY18 and 32.5% in 2QFY19). We model gold volume growth of 15% (18.4% in 3QFY18 and 33% in 2QFY19).
EBITDA margin expected to be higher by 70bps YoY to 4.7% led by product-mix and increased in-house manufacturing.
Adj. PAT to improve by ~79% YoY.
Grammage growth and demand outlook
Commentary on store renovation and expansion
EBIT margin
JEWELLERY: 3QFY19E RESULTS PREVIEW
Jewellery (3QFY19E): Strong quarter
26
Financial summary
Source: Company, HDFC sec Inst Research
JEWELLERY: 3QFY19E RESULTS PREVIEW
Company
NET SALES (Rs bn) EBITDA (Rs bn) EBITDA Margin (%) APAT (Rs bn) Adj. EPS (Rs/sh)
3Q FY19E
QoQ (%)
YoY (%)
3Q FY19E
QoQ (%)
YoY (%)
3Q FY19E
QoQ (bps)
YoY (bps)
3Q FY19E
QoQ (%)
YoY (%)
3Q FY19E
2Q FY19
3Q FY18
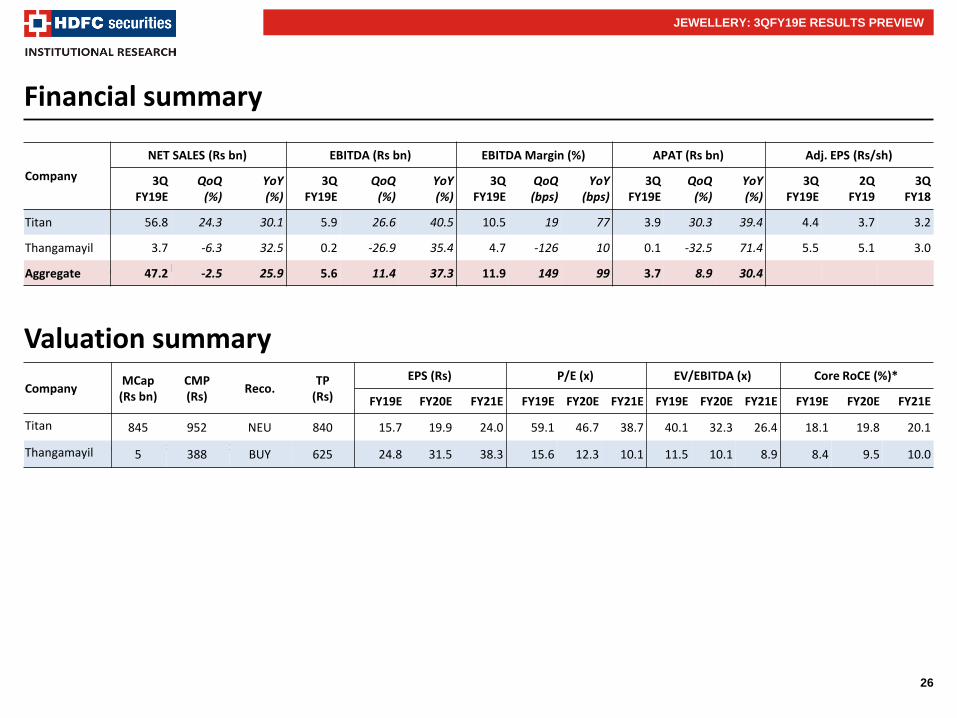
Titan 56.8 24.3 30.1 5.9 26.6 40.5 10.5 19 77 3.9 30.3 39.4 4.4 3.7 3.2
Thangamayil 3.7 -6.3 32.5 0.2 -26.9 35.4 4.7 -126 10 0.1 -32.5 71.4 5.5 5.1 3.0
Aggregate 47.2 -2.5 25.9 5.6 11.4 37.3 11.9 149 99 3.7 8.9 30.4
Valuation summary
Source: Company, HDFC sec Inst Research
Company MCap
(Rs bn) CMP (Rs)
Reco. TP
(Rs)
EPS (Rs) P/E (x) EV/EBITDA (x) Core RoCE (%)*
FY19E FY20E FY21E FY19E FY20E FY21E FY19E FY20E FY21E FY19E FY20E FY21E
Titan 845 952 NEU 840 15.7 19.9 24.0 59.1 46.7 38.7 40.1 32.3 26.4 18.1 19.8 20.1
Thangamayil 5 388 BUY 625 24.8 31.5 38.3 15.6 12.3 10.1 11.5 10.1 8.9 8.4 9.5 10.0
27
CONSUMER: 3QFY19E RESULTS PREVIEW
Rating Definitions
BUY : Where the stock is expected to deliver more than 10% returns over the next 12 month period
NEUTRAL : Where the stock is expected to deliver (-) 10% to 10% returns over the next 12 month period
SELL : Where the stock is expected to deliver less than (-) 10% returns over the next 12 month period
Disclosure: We, Naveen Trivedi , MBA, Siddhant Chhabria, PGDBM, Madhukar Ladha, CFA, Keshav Binani, CA, Himanshu Shah, CA & Mansi Lall, MBA authors and the names subscribed to this report, hereby certify that all of the views expressed in this research report accurately reflect our views about the subject issuer(s) or securities. HSL has no material adverse disciplinary history as on the date of publication of this report. We also certify that no part of our compensation was, is, or will be directly or indirectly related to the specific recommendation(s) or view(s) in this report. Research Analyst or his/her relative or HDFC Securities Ltd. does not have any financial interest in the subject company. Also Research Analyst or his relative or HDFC Securities Ltd. or its Associate may have beneficial ownership of 1% or more in the subject company at the end of the month immediately preceding the date of publication of the Research Report. Further Research Analyst or his relative or HDFC Securities Ltd. or its associate does not have any material conflict of interest. Any holding in stock –No HDFC Securities Limited (HSL) is a SEBI Registered Research Analyst having registration no. INH000002475. Disclaimer: This report has been prepared by HDFC Securities Ltd and is meant for sole use by the recipient and not for circulation. The information and opinions contained herein have been compiled or arrived at, based upon information obtained in good faith from sources believed to be reliable. Such information has not been independently verified and no guaranty, representation of warranty, express or implied, is made as to its accuracy, completeness or correctness. All such information and opinions are subject to change without notice. This document is for information purposes only. Descriptions of any company or companies or their securities mentioned herein are not intended to be complete and this document is not, and should not be construed as an offer or solicitation of an offer, to buy or sell any securities or other financial instruments. This report is not directed to, or intended for display, downloading, printing, reproducing or for distribution to or use by, any person or entity who is a citizen or resident or located in any locality, state, country or other jurisdiction where such distribution, publication, reproduction, availability or use would be contrary to law or regulation or what would subject HSL or its affiliates to any registration or licensing requirement within such jurisdiction. If this report is inadvertently send or has reached any individual in such country, especially, USA, the same may be ignored and brought to the attention of the sender. This document may not be reproduced, distributed or published for any purposes without prior written approval of HSL. Foreign currencies denominated securities, wherever mentioned, are subject to exchange rate fluctuations, which could have an adverse effect on their value or price, or the income derived from them. In addition, investors in securities such as ADRs, the values of which are influenced by foreign currencies effectively assume currency risk. It should not be considered to be taken as an offer to sell or a solicitation to buy any security. HSL may from time to time solicit from, or perform broking, or other services for, any company mentioned in this mail and/or its attachments. HSL and its affiliated company(ies), their directors and employees may; (a) from time to time, have a long or short position in, and buy or sell the securities of the company(ies) mentioned herein or (b) be engaged in any other transaction involving such securities and earn brokerage or other compensation or act as a market maker in the financial instruments of the company(ies) discussed herein or act as an advisor or lender/borrower to such company(ies) or may have any other potential conflict of interests with respect to any recommendation and other related information and opinions. HSL, its directors, analysts or employees do not take any responsibility, financial or otherwise, of the losses or the damages sustained due to the investments made or any action taken on basis of this report, including but not restricted to, fluctuation in the prices of shares and bonds, changes in the currency rates, diminution in the NAVs, reduction in the dividend or income, etc. HSL and other group companies, its directors, associates, employees may have various positions in any of the stocks, securities and financial instruments dealt in the report, or may make sell or purchase or other deals in these securities from time to time or may deal in other securities of the companies / organizations described in this report. HSL or its associates might have managed or co-managed public offering of securities for the subject company or might have been mandated by the subject company for any other assignment in the past twelve months. HSL or its associates might have received any compensation from the companies mentioned in the report during the period preceding twelve months from t date of this report for services in respect of managing or co-managing public offerings, corporate finance, investment banking or merchant banking, brokerage services or other advisory service in a merger or specific transaction in the normal course of business. HSL or its analysts did not receive any compensation or other benefits from the companies mentioned in the report or third party in connection with preparation of the research report. Accordingly, neither HSL nor Research Analysts have any material conflict of interest at the time of publication of this report. Compensation of our Research Analysts is not based on any specific merchant banking, investment banking or brokerage service transactions. HSL may have issued other reports that are inconsistent with and reach different conclusion from the information presented in this report. Research entity has not been engaged in market making activity for the subject company. Research analyst has not served as an officer, director or employee of the subject company. We have not received any compensation/benefits from the subject company or third party in connection with the Research Report. HDFC securities Limited, I Think Techno Campus, Building - B, "Alpha", Office Floor 8, Near Kanjurmarg Station, Opp. Crompton Greaves, Kanjurmarg (East), Mumbai 400 042 Phone: (022) 3075 3400 Fax: (022) 2496 5066 Compliance Officer: Binkle R. Oza Email: [email protected] Phone: (022) 3045 3600 HDFC Securities Limited, SEBI Reg. No.: NSE-INB/F/E 231109431, BSE-INB/F 011109437, AMFI Reg. No. ARN: 13549, PFRDA Reg. No. POP: 04102015, IRDA Corporate Agent License No.: HDF 2806925/HDF C000222657, SEBI Research Analyst Reg. No.: INH000002475, CIN - U67120MH2000PLC152193 Mutual Funds Investments are subject to market risk. Please read the offer and scheme related documents carefully before investing.
28
HDFC securities Institutional Equities Unit No. 1602, 16th Floor, Tower A, Peninsula Business Park, Senapati Bapat Marg, Lower Parel, Mumbai - 400 013 Board : +91-22-6171 7330 www.hdfcsec.com
CONSUMER: 3QFY19E RESULTS PREVIEW