Embed Size (px)
Citation preview

NAVAL POSTGRADUATE
SCHOOL
MONTEREY, CALIFORNIA
THESIS
Approved for public release; distribution is unlimited
MEDICAL REMOTE SENSORS IN TACTICAL NETWORKS
by
Hunter R. Coates Gabriel R. Urquidez
March 2015
Thesis Advisor: Alex Bordetsky Second Reader: Steven Iatrou

THIS PAGE INTENTIONALLY LEFT BLANK

REPORT DOCUMENTATION PAGE Fonn Approved OMB No. 0704-0188 Public reporting burden for this collection of information is estimated to average 1 hour per response, including the time for reviewing instruction, searching existing data sources, gathering and maintaining the data needed, and completing and reviewing the collection of information. Send comments regarding this burden estimate or any other aspect of this collection of information, including suggestions for reducing this burden, to Washington headquarters Services, Directorate for Information Operations and Reports, 1215 Jefferson Davis Highway, Suite 1204, Arlington, VA 22202-4302, and to the Office of Management and Budget, Paperwork Reduction Project (0704-0188) Washington, DC 20503.
1. AGENCY USE ONLY (Leave blank) I 2. REPORT DATE I 3. REPORT TYPE AND DATES COVERED March 2015 Master 's Thesis
4. TITLE AND SUBTITLE 5. FUNDING NUMBERS MEDICAL REMOTE SENSORS IN TACTICAL NETWORKS 6. AUTHOR(S) Hnnter R Coates and Gabriel R. Urquidez
7. PERFORMING ORGANIZATION NA:i\tiE (S) AND ADDRESS(ES) 8. PERFORi\tiiNG ORGANIZATION Naval Postgraduate School REPORT NUMBER Monterey, CA 93943-5000
9. SPONSORING /MONITORING AGENCY NAME(S) AND ADDRESS(ES) 10. SPONSORING/MONITORING NIA AGENCY REPORT NUMBER
11. SUPPLEMENTARY NOTES TI1e views expressed in this thesis are those of the author and do not reflect the official policy or position of the Department of Defense or the U.S. Govemment. IRB Protocol number __ N/ A __ .
12a. DISTRIBUTION I AVAILABILITY STATEMENT 12b. DISTRIBUTION CODE Approved for public release; distribution is unlimited
13. ABSTRACT (maximum 200 words)
The use of vital sign data is a fundamental diagnostic process that is ubiquitous in the delivety ofhea.lthcare in militaty medicine. This process, while providing invaluable information for planning pat ient treatment, has historically come with administrative challenges in transcription and remote monitoring. New advancements in sensors technologies operating in tactical networks provide a unique opportunity to meet these challenges . This thesis expands upon previous Naval Postgraduate School CENETIX laboratmy research into battlefield medicine by providing a. qualitative analysis of COTS sensor capabilities within the U.S. Coast Guard network infrastmcture. Due to the unique nature of the U.S. Coast Guard and the Department of Defense, utilization of tactical net\¥orked radios within a mesh net:v.•ork for transmission of vital sign data is explored.
14. SUBJECT TERl"\IS Vital signs, tactical mesh networks, sensors, battlefield medicine
17. SECURITY 18. SECURITY CLASSIFICATION OF CLASSIFICATION OF TffiS REPORT PAGE
Unclassified Unclassified NSN 7540-01-280-5500
15. NUMBER OF PAGES
71
16. PRICE CODE
19. SECURITY 20. LIMITATION OF CLASSIFICATION OF ABSTRACT ABSTRACT
Unclassified uu Standard Form 298 (Rev. 2-89) Prescribed by ANSI Std. 239-18

THIS PAGE INTENTIONALLY LEFT BLANK
ii
Approved for public release; distribution is unlimited
MEDICAL REMOTE SENSORS IN TACTICAL NETWORKS
Hunter R. Coates
Lieutenant, United States Navy B.S., University of Arizona, 2005 M.H.A., Baylor University, 2010
Gabriel R. Urquidez
Lieutenant, United States Navy B.A., University of California, Davis, 2002
M.H.A., Simmons College, 2010
Submitted in partial fulfillment of the
requirements for the degree of
MASTER OF SCIENCE IN NETWORK OPERATIONS AND TECHNOLOGY
from the
NAVAL POSTGRADUATE SCHOOL March 2015
Authors: Hunter R. Coates Gabriel R. Urquidez
Approved by: Alex Bordetsky, Ph.D. Thesis Advisor
Steven Iatrou Second Reader
Dan Borger, Ph.D. Chair, Graduate School of Information and Operation Sciences
iii

THIS PAGE INTENTIONALLY LEFT BLANK
iv

ABSTRACT
The use of vital sign data is a fundamental diagnostic process that is ubiquitous in the
delivery of healthcare in military medicine. This process, while providing invaluable
information for planning patient treatment, has historically come with administrative
challenges in transcription and remote monitoring. New advancements in sensors
technologies operating in tactical networks provide a unique opportunity to meet these
challenges. This thesis expands upon previous Naval Postgraduate School CENETIX
laboratory research into battlefield medicine by providing a qualitative analysis of COTS
sensor capabilities within the U.S. Coast Guard network infrastructure. Due to the unique
nature of the U.S. Coast Guard and the Department of Defense, utilization of tactical
networked radios within a mesh network for transmission of vital sign data is explored.
v

THIS PAGE INTENTIONALLY LEFT BLANK
vi

TABLE OF CONTENTS
I. INTRODUCTION........................................................................................................1 A. BACKGROUND ..............................................................................................1 B. FOCUS ON VITAL SIGNS ............................................................................2 C. EVIDENCE OF NEED ....................................................................................3 D. METHODOLOGY ..........................................................................................5 E. PURPOSE OF STUDY ....................................................................................5 F. CHAPTER OUTLINE.....................................................................................6
II. ANALYSIS OF SENSOR CAPABLITIES ................................................................7 A. DATA SOURCES AND SEARCH STRATEGY ..........................................7 B. THE IMPACT OF VITAL SIGNS .................................................................7 C. UNDERSTANDING THE MILITARY MEDICAL NEED ......................10 D. THE BASICS: UNDERSTANDING THE VITAL SIGNS ........................14
1. Body Temperature .............................................................................14 2. Pulse Rate ...........................................................................................15 3. Respiration Rate.................................................................................15
E. SENSORS .......................................................................................................16 F. BSN AND WBAN NETWORKS ..................................................................18 G. COMMUNICATION PLATFORMS...........................................................19 H. SENSOR STUDIES IN VITAL SIGNS .......................................................19 I. SENSOR DESIGN AND INTEGRATION CHALLENGES .....................20
1. Sensor Design .....................................................................................20 2. Integration ..........................................................................................21 3. Power-Source Miniaturization .........................................................21 4. Reliability ............................................................................................21
III. INTEGRATING VITAL SIGNS SENSORS INTO WIRELESS NETWORKS ..............................................................................................................23 A. TOPOLOGY ..................................................................................................23 B. PROTOCOL STANDARDS .........................................................................25
1. 802.15.1 Medium Rate WPAN ..........................................................25 2. 802.15.3 High Rate WPAN ................................................................26 3. 802.15.4 Low-Rate WPAN ................................................................27
a. ZigBee ......................................................................................29 4. 802.15.6 Wireless Body Area Networks ...........................................31
IV. INTEGRATION OBSERVATIONS ........................................................................33 A. COMMUNICATION EQUIPMENT ...........................................................33
1. TrellisWare TW230 Radios ..............................................................33 2. Zephyr BioHarness 3 Sensor.............................................................35
B. INFRASTRUCTURE DESIGN ....................................................................38 C. CONNECTIVITY OBSERVATION ...........................................................39 D. CONNECTIVITY VIA GATEWAY............................................................39 E. SOFTWARE OBSERVATIONS ..................................................................40
vii

V. CONCLUSION ..........................................................................................................45
LIST OF REFERENCES ......................................................................................................47
INITIAL DISTRIBUTION LIST .........................................................................................53
viii

LIST OF FIGURES
Figure 1. Typical dashboard of most EHR systems (from Pizziferri et al., 2005). ...........4 Figure 2. A Navy corpsman yells to communicate with a fellow corpsman as he
tends to a patient behind a noisy CH-53 helicopter (from http://www.stripes.com/news/31st-meu-s-nightingale-team-trains-to-respond-to-emergencies-1.37740). ..................................................................11
Figure 3. Example of paper documentation issued to military members for recording vital sign and other medical data (from Summers, 2013). ...............................13
Figure 4. Examples of automatic and standard vital sign instruments (from http://www.apkmodgame.net/tag/vital-sign-machine). ...................................14
Figure 5. Evolution of biosensors (from Yang, 2006). ...................................................17 Figure 6. Sensors within WBAN networks (from Kartsakli et. al., 2013). .....................18 Figure 7. Topology advantages and disadvantages (from Yang, 2006). .........................24 Figure 8. ISO OSI layers compared with 802.15.1 (from IEEE, 2015). .........................26 Figure 9. The physical specifications supported by IEEE 802.15.4 (from Yang,
2006). ...............................................................................................................27 Figure 10. PAN coordinator placement in topology (from IEEE, 2011). .........................28 Figure 11. ZigBee architecture in relation to the IEEE 802.15.2 standard (from Yang,
2006). ...............................................................................................................29 Figure 12. Three concentration areas of the healthcare profile sensor application
(from Yang, 2006). ..........................................................................................30 Figure 13. WBAN use cases (from IEEE, 2012). .............................................................31 Figure 14. TW230 radios (from TrellisWare, 2012). ........................................................34 Figure 15. BioHarness 3 with chest strap or compression shirt (from Zephyr, 2014). .....36 Figure 16. BioHarness 3 composite capabilities (from Zephyr, 2014). ............................37 Figure 17. Lab test infrastructure design. ..........................................................................38 Figure 18. TW-230 Bluetooth radio interface device (from TrellisWare, 2012). .............39 Figure 19. Zephyr BioHarness 3 module (left), chest strap (center) and gateway
(right). ..............................................................................................................40 Figure 20. Zephyr OmniSense live monitoring application display. ................................41 Figure 21. OmniSense gauge settings. ..............................................................................42 Figure 22. OmniSense Real-Time Vital Signs monitoring. ..............................................43
ix

THIS PAGE INTENTIONALLY LEFT BLANK
x

LIST OF TABLES
Table 1. Vital sign measurements (after NIH, 2015). ....................................................16 Table 2. TW230 specifications (from TrellisWare, 2012). ............................................35 Table 3. BioHarness 3 RF characteristics (from Zephyr, 2014). ...................................37
xi

THIS PAGE INTENTIONALLY LEFT BLANK
xii

LIST OF ACRONYMS AND ABBREVIATIONS
BSN body sensor network
CCA clear channel assessment
CENETIX Center for Network Innovation and Experimentation
COTS commercial off-the-shelf
CSMA/CA sense multiple access with collision avoidance
DOD Department of Defense
ECG electrocardiogram
EHR electronic health record
FFD full-function device
GAO Government Accountability Office
HA/DR humanitarian assistance and disaster relief
IEEE Institute of Electrical and Electronics Engineers
IOS International Organization for Standardization
IoT Internet of Things
ISM industrial scientific and medical
IT information technology
JTTS Joint Theater Trauma Registry
MAC Media Access Control
MEDIVAC medical evacuation
MEMS microelectromechanical systems
MTF military treatment facility
NFC near field communication
OSI open systems interconnection
PAN personal area network
PDA personnel digital assistant
RF radio frequency
RFD reduced-function device
RFID radio-frequency identification
RID radio interface device
SpO2 oxygen saturation xiii

TCCC tactical combat casualty care
UHF ultrahigh frequency
USAR urban search and rescue
WBAN wireless body area network
WPAN wireless personal area network
WSN wireless sensor network
xiv

ACKNOWLEDGMENTS
I would like to thank our thesis advisor, Dr. Alex Bordetsky, and second reader,
Mr. Steven Iatrou, for their guidance in helping write this thesis. I would also like to
thank my wonderful wife, Caroline, who was instrumental in supporting me while caring
for our two children, Josephine and Nela. I am consistently amused at how incredibly
lucky I am. And lastly, I would like to thank my friend and coauthor, LT Hunter Coates,
who made this journey memorable.
LT Gabriel R. Urquidez, MSC, USN
I, too, would like to thank our thesis advisor, Dr. Alex Bordetsky, and second
reader, Mr. Steven Iatrou, for their guidance during this endeavor. I would also like to
thank Gabriel Urquidez. He has made this time away from home seem to go by so much
faster. Thanks for everything! Most importantly, I would like to thank my family for the
courage, strength, and support they have provided me through this time at NPS. Donna,
you are an amazing woman and the love of my life. Hannah and Dayna, you two are
growing up to be such wonderful young ladies. Thank you for being such a big help to
your mother while she attends school and while I have been away. Daddy loves you both!
LT Hunter R. Coates, MSC, USN
xv

THIS PAGE INTENTIONALLY LEFT BLANK
xvi

I. INTRODUCTION
The U.S. Coast Guard and Department of Defense (DOD) operate as first
responders in emergency, natural disaster, and combat environments. These unique
environments provide challenging communication situations for healthcare providers
during medical triage in which weather conditions, lack of infrastructure, and combat
operations exacerbate the communication breakdown of vital sign data commonly found
during medical evacuations (MEDIVACs). Few electronic administrative options exist at
the tactical level for communicating vital signs; as a result, first responders utilize pen,
paper, and audio mediums to communicate patient data (Blackbourne, 2011). These
historical means of communication, however, have been shown to be ineffective and
error prone (Eastridge et al., 2011). An alternative to this manual process is automation of
the vital sign process acquisition and transmission with the application of biosensors.
Recent advancements in commercial off-the-shelf (COTS) monitoring devices offer new
alternatives to wireless monitoring of vital signs and may offer a solution for transcribing
and recording accurate vital sign data.
A. BACKGROUND
The communication and information problem in medicine can have wide
impactful effects outside the clinical setting. Historically, healthcare providers who lack
information and distrust verbal or medical documentation acquired on scene resort to
ordering duplicate tests and re-administering medications when dealing with the patients
arriving with unknown medical histories (Kripalani et al., 2007). Can technology provide
a better alternative to the current process of monitoring and transcribing medical data? If
healthcare providers can access patient medical histories before, during, and after the
patient arrives at a treatment facility for care, would the continuum of care lead to
increased efficiency and patient survivability? We say yes and propose that the answers
may lie in recent advancements in wireless sensor technology.
1

While recent advances in wireless network infrastructure have increased
bandwidth and connection capabilities in a wide assortment of technological platforms,
the development of the sensor is vital. The sensor must meet the physical and software
requirements of being small enough not to be burdensome for the user and yet
technologically powerful enough to transmit appropriate data—all while attaining an
above average battery life (Hirschberg, Betts, Emanuel, & Caples, 2014). The
miniaturization of sensors and advances in network infrastructure for remote monitoring
is regarded by many medical information technology professionals as the core technology
needed for the realization of real-time information sharing (Abuan, 2009). By utilizing
existing cellular, Wi-Fi, and tactical network infrastructures with low-power network
devices such as Bluetooth® and near field communications (NFCs), health monitoring is
extending outside the traditional clinical setting. The use of wearable sensors in remote
and harsh environments, such as on Ebola patients in sub-Saharan Africa or during search
and rescue operations in frigid ocean waters, would allow providers to access real-time
medical diagnostic data remotely. Leaders, for the first time, would have diagnostic data
on personnel health status, which could affect operational tempo in such environments as
naval boarding parties, special warfare, radiological, biohazard, humanitarian assistance
and disaster relief (HA/DR). Little research has been done on wearable sensor
capabilities for use within military tactical networks. In this thesis, we present our
research on the current capabilities of COTS sensor technologies for monitoring vital
signs and explain the challenges presented by using wireless technologies to transmit this
crucial data.
B. FOCUS ON VITAL SIGNS
Sensor adaption within medicine is growing in popularity due to its accuracy in
recording data and its boundless reach (Chan, Liang, & Lin, 2014). Vital sign monitoring
has traditionally been a static endeavor requiring medical personnel to perform clinical
assessments at the bedside. These assessments require physical interaction between the
provider and the patient and generally cover pulse, temperature, respiration rate, and
blood pressure. Depending on the severity of the patient’s condition, vital signs
monitoring may need to be conducted daily, hourly, or by the minute. The average time 2

needed to perform these assessments ranges from one to two minutes (Chan et al., 2014).
To increase provider efficiency and correct the large amount of man-hours lost to
continuous monitoring, many health care organizations have instituted machine-assisted
vital signs monitoring. These machines, usually found at the bedside in a hospital or
clinic setting, are large and bulky and require hard lines to be connected to the patient.
This current setup highlights two unintended, but significant consequences of manual
vital sign practice: limitation of range and user transcription errors.
Limitation of Range
The current state of computer-assisted vital signs monitoring found in operational
and hospital settings are limited to hard-wire connections to the patient and power source
(Kripalani et al., 2007). In many cases, the hospital vital sign systems are stand-alone
systems, which actively monitor, but lack any recordable means that can be transferred to
a central database. Although computer-assisted vital sign machines have improved
efficiencies in the physical process of acquiring vital signs, the limited range requires
patients to be monitored in the presence of a health provider.
Transcription Problems
The inability to automatically capture and transcribe vital signs forces providers
to routinely transcribe the same vital signs data multiple times. For example, in
emergency situations, first line responders commonly record vitals data on disposable
gloves and, when transferring the patient, verbally recite the data to the receiving
treatment team. Generally, this method of transferring information results in inaccurate or
missing medical histories (Kripalani et al., 2007).
C. EVIDENCE OF NEED
The Surgeon General of the Navy’s 2015 enabling objective is to capitalize on
information technology to improve the health and readiness of the fleet (Navy Medicine,
2015). More specifically, the Surgeon General’s underlying goal is to develop and
implement systems that share medical information across multiple interfaces by feeding
data into each individual’s electronic health record (EHR) see figure 1. The intent is to
3

discover a way for information to be exchanged jointly between providers on multiple
platforms to improve healthcare efficiencies and provider responsiveness in caring for the
warfighter. Previous studies have shown vital sign monitoring and recording is a prime
candidate for technological integration, as the current process of manually recording is
costly, inefficient, and error prone (Slight et al., 2014). Improving military medicine by
leveraging technology is not a new concept.
Figure 1. Typical dashboard of most EHR systems (from Pizziferri et al.,
2005).
In 1996, after Operation Desert Storm, the Government Accountability Office
(GAO) issued a scathing report on the shortfalls of wartime medical care (GAO, 1996).
In the report, the GAO noted nine military medicine procedures that failed to provide
adequate medical support. Of those nine identified, three were related to information
technology (IT) communications, computers, and information management. The
corrective actions stressed by the GAO were “incorporating technological advancements
and equipment modernization, to compete with the movement of combat troops and other
war-fighting materials to the theater” (GAO, 1996, p.5). Since that report, leaders in
military medicine have investigated numerous IT initiatives to improve battlefield
4

medicine with the hope of developing a systematic and integrated approach to better
organize and coordinate battlefield medicine. Some IT initiatives that made a debut over
the years include the 1998 Composite Health Care System (first clinical computer
module), the 2004 Armed Forces Health Longitudinal Technology Application (first
EHR), and the Joint Theater Trauma Registry (JTTS) (a database of all operational
battlefield injuries). The goal to minimize morbidity and mortality in military operations
remains the primary focus of military medicine, and the use of wireless sensor adaption
for monitoring vital signs may be the next technological step.
D. METHODOLOGY
We used a qualitative research method emphasizing case studies and literature
review to explore the viability of COTS sensors for monitoring vital signs within mesh
networks utilizing TrellisWare tactical radios. The concept of wireless sensor adaption to
monitor vital signs in medicine is quickly gaining traction in the civilian sector, and
studies to adapt wireless sensors in the military are limited. Through our baseline study,
we intend to provide a foundational analysis of issues associated with acquiring, storing,
forwarding, and acting upon critical vital sign data.
E. PURPOSE OF STUDY
The purpose of this study is to explore the current capabilities of COTS sensor
technologies for monitoring vital signs. Wearable sensors provide the opportunity to
project personnel vital signs in noncovert missions such as boarding parties, mass
casualties, preventative medicine, search and rescue, and pandemic disease outbreaks.
Vital sign information transfer has historically been limited to verbal- and paper-based
methods. These methods are prone to error and increase the risk of transcriptions being
absent from medical histories, which has been shown to impact later treatment options
(Blackbourne, 2011). Utilizing wearable sensors in tactical networks to automate vital
sign data may offer a solution to this problem. Sensor research is needed to adequately
determine the state of current sensor capabilities within the DOD tactical network
infrastructure. The thesis seeks to answer the following questions:
5

• What are pertinent vital sign information needs for adequate sensor application?
• Which Institute of Electrical and Electronics Engineers (IEEE) standards are best suited for wireless sensor’s transmitting vital sign data?
• Can the COTS product BioHarness 3 connect to a tactical mesh network utilizing TrellisWare radios?
F. CHAPTER OUTLINE
This thesis is organized into five chapters:
Chapter I provides an introduction to the problem and purpose of research.
Chapter II is a discussion of the literature review associated with vital signs and
previous sensor study applications.
Chapter III provides an overview of how sensors communicate over a wireless
medium.
Chapter IV is a discussion of observations of the BioHarness 3 sensor integration
into a wireless mesh network.
Chapter V summarizes the information discussed in the previous chapters and
concludes with recommendations.
6

II. ANALYSIS OF SENSOR CAPABLITIES
Sensor adaptation in medicine has begun to gain traction in both the private and
public medical industries as a viable technological platform for addressing a myriad of
problems (Topol, Steinhubl, & Torkamani, 2015). Chief among these problems is the
monitoring and recording issue in patient care that centers on the historical inability to
accurately monitor and transcribe medical data from one medium to another (South,
Skelley, Dang, & Woolley, 2015). Multiple studies have addressed the issue, but very
few have presented wireless remote sensors in tactical networks as a solution. Our
analysis seeks to bring better understanding of the monitoring and recording problem by
exploring sensor adaption capabilities within military medicine.
A. DATA SOURCES AND SEARCH STRATEGY
We performed multiple searches utilizing Google Scholar, PubMed, and IEEE
databases. Google Scholar returned 2.3 million results for the term body sensor. When we
narrowed the range to the years 2014 and 2015, the search returned 21,500 results. When
we searched PubMed for body sensor networks, we found an increasing number of peer-
reviewed articles, from three in 1971 to 338 in 2014. Other searches included vital sign
networks, military vital sign weaknesses, and vital sign impact on treatment. When we
narrowed our Google Scholar search to peer-reviewed articles and excluded patents, the
number of results dropped from 2.3 million to two million. Narrowing our search to the
years 2014 and 2015 caused the results to decrease to 17,900. We focused our research
primarily on articles published between 2005 and 2015, with the exception of historical
articles that we used to determine past vital sign processes. This search strategy provided
ample information for understanding the impact of vital signs in patient care.
B. THE IMPACT OF VITAL SIGNS
The first step to understanding how remote sensors in tactical networks can
impact the communication of vital signs is reviewing current vital sign monitoring and
documentation processes. When conducting this analysis, we found the prevalent
conclusion of most studies was the lack of any suitable IT solution for patient monitoring 7

and accurate data transcription. Regardless of the environment (e.g., hospital, clinic,
remote, or shipboard medicine), the consensus from the literature was that current
technological advances in patient monitoring were inconsistent at best. Attempts to apply
sensor solutions have focused on EHR and automated vital signs machines (Du, Yang,
Liao, Liu, & Liu, 2014). However, inaccuracy in the transfer of medical information from
automated machines into EHRs continues because providers are manually recording vital
signs from a machine onto paper, and then manually entering the data into a computer
(Smith, Banner, Lozano, Olney, & Friedman, 2009). As noted in the article “Connected
Care: Reducing Errors through Automated Vital Signs Data Upload,” the manual
transcription process of vital signs by providers increases the risk of omission and errors
in health records (Smith et al., 2009). The current transcription process contains
unnecessary risks that can have adverse effects on patient care, considering that vital
signs “are perhaps the most fundamental component of patient evaluation. They provide
the basis for clinical decision making regarding treatments, interventions, progress, and
discharge” (Smith et al., 2009, p. 318).
An example of the impact vital signs can have on clinical decisions is highlighted
in the 2009 study documenting the H1N1 influenza outbreak among military healthcare
beneficiaries in San Diego (Crum-Cianflone et al., p. 1805). The outbreak consisted of
761 patients who presented to the hospital with influenza-like symptoms. Of those
patients, 97 were confirmed positive for H1N1. On physical examination, providers
found patients suspected of having the H1N1 virus were universally febrile (>97.1
degrees Fahrenheit [F]). The information the temperature vital sign provided was the
determining factor for early detection of H1N1, which is the earliest indicator the body is
actively fighting infection. This information allowed providers to implement isolation
procedures and don personal protective equipment to contain the spread of the virus.
After the event, providers reviewed patients’ medical records and found many of the
records contained errors or omissions of early vital signs data. These inaccuracies seem to
stem from the use of verbal or handwritten processes for relaying patient data from one
medium to the next (Crum-Cianflone et al., 2009, p. 1809).
8

In the Journal of Healthcare Information Management, Gearing and Olney (2005)
describe the transcription problem as an over-duplication issue. They argue the habitual
use of paper for recording vital signs leads to an increase in chance for error. In their
study of patients in a hospital ward, they found that from initial documentation to final
data entry into an EHR, vital signs could be re-transcribed as many as three times for
each provider encounter. If patients have their vital signs taken every four hours and a
provider sees 30 patients in a day, as many as 900 opportunities for error are possible in a
single shift. These numbers include omission or potential transcription errors, such as
100.7 degrees F being transcribed as 107.0 degrees F (Gearing et al., 2005).
If not done correctly, the physical process of acquiring and documenting vital
signs can lead to adverse response by providers for timely care. Cioffi, Salter, Wilkes,
Vonu-Boriceanu, and Scott (2006), in their study of a hospital’s emergency department,
found that inadequate documentation was one of the main reasons clinicians failed to
respond to patients with abnormal vital signs. For Gearing et al., (2005), the key to
solving the monitoring and documentation problem is leveraging technology and
documenting vital signs data only in an electronic medium. In their study comparing the
entry of vital signs in a paper record versus an EHR, the researchers had clinicians
document vital signs in a paper-records format only and then in an EHR only.
Researchers found the error rate for electronic vital signs documentation was less than
5% compared with the paper chart error rate of 10%. Thus, providers who used an
electronic medium for documentation reduced the rate of vital sign entry errors in EHRs
by more than half (56%) (Gearing et al., 2005, p. 45). The process in this study, however,
still utilized manual data entry, with nurses recording vital sign data on paper charts and
then transcribing them via data entry into an EHR. A better method would utilize vital
sign machines that could send data to an EHR automatically.
In the study, “Connected Care: Reducing Errors through Automated Vital Signs
Data Upload,” researchers compared a previous baseline study that determined that error
rates for vital signs captured on plain paper transcribed into a paper chart were 10%
(Smith et al., 2009). In an effort to improve this error rate, utilizing a personnel digital
assistant (PDA), the researchers conducted a separate test to wirelessly transmit vital
9

signs data directly into an EHR. The data were automatically transmitted via hard wire to
electrodes hardwired onto a patient via body patches. Researchers reviewed 1,514 sets of
vital signs collected electronically for accuracy and compared the error rate with data
from the manual process. They found the automated upload of vital signs directly into an
EHR reduced the documentation error rate to less than 1% (Smith et al., 2009). This rate
represented a significant reduction in vital sign documentation errors with the use of
mobile technology when compared with traditional charting methods (P<.001). The
results of this study, conducted in the closed environment of a hospital ward, demonstrate
the potential benefits automatic communication can have on the monitoring and
documentation of patients.
C. UNDERSTANDING THE MILITARY MEDICAL NEED
Prehospital trauma care performed in the battlefield differs markedly from that
performed in the civilian sector. Treatment guidelines developed for the civilian setting
do not necessarily translate well to the military and may result in preventable deaths and
unnecessary additional casualties if the tactical environment is not fully considered. Vital
to preventing deaths is addressing the shortcomings of technology in monitoring and
documenting patient care in the battle space.
In the study “1831,” Army physician COL Lorne Blackbourne (2011) compared
the monitoring and treatment technologies available in the battlefield in 1831 to those in
2010. He found that while technology had advanced in numerous fields of medicine and
military operations, communication of basic medical vital sign data remained tethered to
the pen-and-paper technology that existed in 1831. He reasoned medical information was
not transferring with patients from the battlefield because documenting in the field took
too much time of the medics who were administering treatment. The inability to
document vital signs resulted in missing prehospital data.
10

Figure 2. A Navy corpsman yells to communicate with a fellow corpsman as
he tends to a patient behind a noisy CH-53 helicopter (from http://www.stripes.com/news/31st-meu-s-nightingale-team-trains-to-
respond-to-emergencies-1.37740).
The study “We Don’t Know What We Don’t Know: Prehospital Data in Combat
Casualty Care” documents the extent of the missing prehospital data problem.
Researchers discovered that from October 2001 to July 2010, over 22,800 U.S. casualties
were classified as having battle injuries requiring evacuation to a treatment facility
(Eastridge, Mabry, Blackbourne, & Butler, 2011). Of the medical data collected from
these individuals, the most common missing information was the prehospital data
collected at the site of injury and transport to a military treatment facility (MTF). The
missing data were attributed to the medics’ having to record vital sign data manually with
pen and paper. A possible reason manual recording of vital signs is so troublesome could
be what Helmus and Glenn (2005) describe as a combat zone where high stress, physical
exhaustion, and operational tempo are a daily occurrence, thus medical administration
can have a lower priority than physical care. However, when a soldier arrives at a
treatment facility, the lack of prehospital data has been proven to place limits on the 11

therapeutic interventions admitting physicians can perform, thereby reducing favorable
patient outcomes (Laudermilch, Nathens, & Rosengart, 2010). When reviewing the JTTS
in 2011, COL Blackbourne (2011) discovered that “less than 10% of entered patients had
any prehospital data, and that less than 1% had actionable information (vital signs)
documented” (p. 8). This lack of data meant receiving providers had to establish baseline
metrics of patients even though in most cases medics in the field already had baseline
information. Additionally, communications in operating environments are limited to
voice radios. These radios, while providing verbal communication to medics and MTFs,
are limited in capacity. Scannel-Desh and Doherty (2010) quote an Army nurse, who
said:
My patient was a Marine sergeant. He was my first Iraq casualty. We got a radio call that they were bringing a “tourniquet injury,” which means his limbs were blown off…His corpsman had tourniqueted his extremities, and he was dark gray. He lost a lot of blood, but was still conscious and talking. He leaned up close to me and said, “Ma’am, please tell my mother and my sister ‘I’m sorry.’” Then the doc said, “Ok, we’re taking the tourniquets down now,” and within about 7 seconds he was gone. (p. 8)
While dramatic, this story provides a picture of how providers’ limited
information can affect care for patients in the battlefield. Although having the vital signs
data monitored by the receiving staff may not have saved the soldier, access to the
sergeant’s vital signs may have assisted the provider in determining whether to remove
those tourniquets at that time.
COL Blackbourne (2011) notes that further compounding the problem, medics are
required to use the tactical combat casualty care (TCCC) card, a paper card issued to
service members and the current preferred method for recording prehospital data (see
Figure 3).
12

Figure 3. Example of paper documentation issued to military members for
recording vital sign and other medical data (from Summers, 2013).
Although an improvement over previous options, using the TCCC cards still
requires medics to manually transcribe vital signs data, a method which is subject to poor
documentation, errors in transcription, illegible handwriting, and possible loss of the
TCCC card during patient transit. Leveraging technological advancements to allow for
remote monitoring of wounded soldiers and an automatic documentation platform would
eliminate the need for TCCC cards and enable vital sign data to flow to a receiving
treatment facility automatically. By allowing real-time monitoring of patient vital signs,
medical doctors could track casualties during transport and offer support to attending
medics.
13

D. THE BASICS: UNDERSTANDING THE VITAL SIGNS
To address the problem of monitoring and documenting vital signs with sensors,
we needed to identify the technical requirements necessary for vital sign capture and
recording. To do this, we had to define the term vital signs and understand the
measurement of each. According to the National Institute of Health, vital signs are
measurements of the body’s most basic functions. The three main vital signs routinely
monitored by medical professionals and healthcare providers include body temperature,
pulse rate, and respiration rate (National Institute of Health [NIH], 2015). Blood pressure
is not considered a vital sign but generally is taken with the vital signs (Johns Hopkins
University of Medicine, 2015). Following the practice of John Hopkins Medicine, we are
omitting blood pressure monitoring as a sensor requirement and focusing on pulse,
respiration, and temperature as metrics. Vital signs are usually assessed using a
stethoscope, thermometer, and blood pressure cuff. Traditionally these have been manual
devices, but recently there has been a move to automated vital signs machines, which can
be used bedside or remotely with a battery (see Figure 4).
Figure 4. Examples of automatic and standard vital sign instruments (from
http://www.apkmodgame.net/tag/vital-sign-machine).
1. Body Temperature
According to the Johns Hopkins University of Medicine (2015), the normal body
temperature of a person varies depending on gender, recent activity, food and fluid
consumption, the time of day, and, in women, the stage of the menstrual cycle. Normal
body temperature can range from 97.8 to 99.1 degrees F for a healthy adult. A person’s
body temperature can be taken orally, rectally, axillary (under the armpit), by ear, or by
14

the skin; the latter measuring option is of most interest to our sensor research. In many
cases, the temperature is the most important vital sign as it is one of the first clues the
body is fighting off an infection (John Hopkins Medicine, 2015).
2. Pulse Rate
The pulse rate is a measurement of the heart rate or the number of times the heart
beats per minute. As the heart pushes blood through the arteries, the arteries expand and
contract with the flow of the blood. The normal pulse rate for healthy adults ranges from
60 to 100 beats per minute (John Hopkins Medicine, 2015). Taking a pulse indicates the
heart rhythm and strength of pulse, and knowing these factors can assist in identifying
shock or congestive heart failure (NIH, 2015).
3. Respiration Rate
The respiration rate is the number of breaths a person takes per minute. The rate is
usually measured when a person is at rest and simply involves determining the number of
breaths for one minute by counting how many times the chest rises. Respiration rates may
increase with fever, illness, and other medical conditions. Normal respiration rates for an
adult at rest range from 15 to 20 breaths per minute. For further clarity, consider Table 1.
15
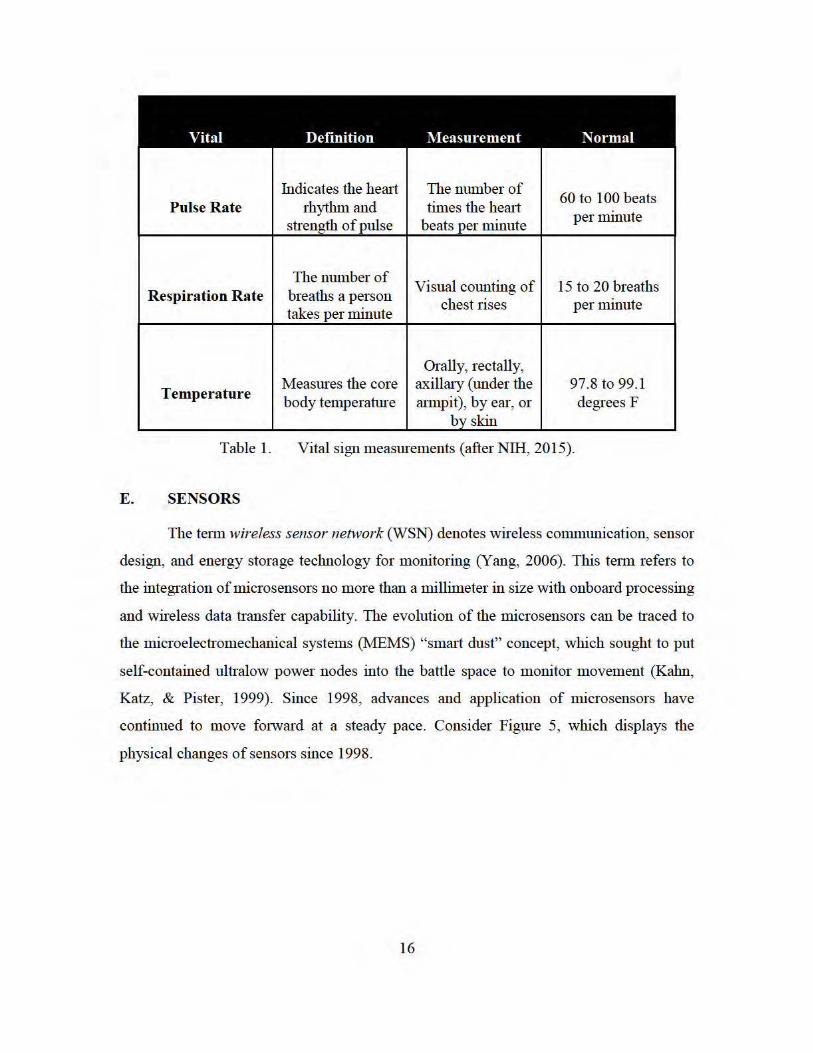
Vital Definition Measurement Normal
Indicates the herui The number of 60 to 100 beats Pulse Rate rhythm and times the heru1
per minute strength of pulse beats per minute
The number of Visual counting of 15 to 20 breaths
Respiration Rate breaths a person takes per minute
chest rises per minute
Orally, rectally,
Temperature Measmes the core axillruy (under the 97.8 to 99.1 body temperature rumpit), by ear, or degrees F
b_y skin
Table 1. Vital sign measm ements (after NIH, 20 15).
E. SENSORS
The tetm wireless sensor network (WSN) denotes wireless conununication, sensor
design, and energy storage technology for monitoring (Yang, 2006). This tetm refers to
the integration of microsensors no more than a millimeter in size with onboru·d processing
and wireless data transfer capability. The evolution of the microsensors can be traced to
the microelectromechanical systems (MEMS) "smru1 dust" concept, which sought to put
self-contained ultralow power nodes into the battle space to monitor movement (Kahn,
Katz, & Pister, 1999). Since 1998, advances and application of microsensors have
continued to move fmward at a steady pace. Consider Figme 5, which displays the
physical changes of sensors since 1998.
16

Figure 5. Evolution of biosensors (from Yang, 2006).
According to Yang (2006), WSNs can be categorized into three types of sensors:
indoor, outdoor, or urban. These three types of sensors are beginning to impact many
everyday processes in both industry and private life. The term Internet of things (IoT)
describes the coming new era of the networked interconnection of everyday objects,
which will fundamentally change communication options. “IoT will increase the ubiquity
of the Internet by integrating every object for interaction via embedded systems, which
leads to highly distributed network devices communicating with human begins as well as
other devices” (Xia, Yang, Wang, & Vinel, 2012). “Smart houses” are already utilizing
radio-frequency identification (RFID) technologies in multistandard NFC and ultrahigh
frequency (UHF) architectures to communicate tasks such as remotely turning lights on
or increasing the heat before the homeowners arrive home (Darianian & Michael, 2008).
However, while WSNs are having an impact on a broad range of applications, the
17

challenges of monitoring and recording the body remain. Yang (2006) claims that the
human body is a challenge because it consists of a complicated internal environment that
responds to and interacts with its external surroundings. Body sensor network (BSN) and
wireless body area network (WBAN) are interchangeable terms most professionals utilize
when addressing the human network (Niemela et al., 2014).
F. BSN AND WBAN NETWORKS
Both BSN and WBAN are network configurations that utilize sensor technology
to monitor and record biometric information. Niemela et al. (2014) describe both
networks as numerous sensors placed on or in a human body for performing ongoing
measurements of body vitals, possibly even processing the data, and transferring the data
to a server accessed by necessary persons, including the patient, and nursing personnel.
Monitoring platforms have adopted numerous strategies to deploy sensors, including
having them worn via straps, integrated into clothing, or even implanted within the body
(Yang, 2006). Consider figure 6.
Figure 6. Sensors within WBAN networks (from Kartsakli et. al., 2013).
18

G. COMMUNICATION PLATFORMS
According to IEEE (2011), BSNs operate in compliance with the IEEE 802.15
standard. This standard includes multiple protocol standards such as 802.15.1
(Bluetooth), 802.15.3 (high rate wireless personal area network (WPAN)), 802.15.4 (low-
rate WPAN), 802.15.6 (WBAN). The ZigBee standard expands upon IEEE 802.15.4. The
protocol requires compatible interconnection for data communication devices using low-
data-rate, low-power, and low-complexity short-range radio frequency (RF)
transmissions in a WPAN. ZigBee’s standard specifies the physical layer and media
access control for low-rate WPANs. IEEE 802.15.4 includes real-time suitability by
reservation of guaranteed time slots, collision avoidance through carrier sense multiple
access with collision avoidance (CSMA/CA), and integrated support for secure
communications (IEEE, 2011).
H. SENSOR STUDIES IN VITAL SIGNS
The use of wireless sensors to capture vital signs is an emerging field throughout
medicine. An important requirement of sensor adaption is the accuracy of vital sign
capture vice the traditional manual method. Any lack of confidence in the measurement
of vital sign data by providers would limit the adoption of this technology. To determine
if a distinction between vital sign data capture was evident between wireless sensor and
manual measurement processes, Kiokes et al. (2014) conducted a study to test the ability
to monitor and track athletes’ vital signs in a WSN. The result of the study revealed that
mobile values acquired wirelessly were generally equal to those acquired in fixed
environments (Kiokes et al., 2014). In their study, Kiokes et al. (2014) used the Arduino
Uno monitoring system and placed wireless sensor nodes on four athletes to measure
their vital signs during training. During conditioning, each sensor would wirelessly
transmit data to the coaches’ terminal using a star topology. The Arduino Uno operated
on the ZigBee application framework and communicated wirelessly to the coaches’
terminal as the four athletes moved around the stadium. Researchers found a positive
correlation when utilizing wireless sensors for the transmission and recording of vital
signs and recommended further analysis for inclusion in mesh networks.
19

Another study focused on the need for wireless vital signs monitoring during
urban search and rescue (USAR) operations (Pallis, Ferreria, Hildebrand, & Seynaeve,
2014). Utilizing the Zephyr BioHarness 3, a team of researchers studied the applicability
of wireless vital sign monitoring for victims trapped in collapsed buildings. The findings
were mixed. While the Zephyr allowed for the transmission of vital sign data,
complications with the device proved difficult to overcome. The device required a chest
strap to be worn, which in most cases was impossible to use on the trapped victims. Thus,
when first responders tried to utilize the sensors, they found it difficult, if not impossible,
to wrap the sensors around the trapped patients’ bodies.
In their study of wireless sensors in medicine, Hernandez-Silveira, Ang, and
Burdett (2014) utilized the Sensium digital patch in an effort to overcome the bulky
bedside monitors and static process of wires attached to patients. The wireless,
unobtrusive, lightweight, and disposable body-worn device was designed to monitor vital
signs (temperature, heart rate, and respiration rate) in real time. The findings were mixed.
While the digital patch freed up a patient to move around, allowing providers to monitor
and record vital sign data wirelessly, the patients’ physical motion of walking created
errors in the data. The errors from the sensor data called into the question the accuracy of
the vital sign data, which resulted in staff having to re-administer vital signs to confirm
accuracy (Hernandez-Silveira et al., 2014).
I. SENSOR DESIGN AND INTEGRATION CHALLENGES
Although most articles we reviewed regarded BSNs as the future for monitoring
vital signs, most agreed on the basic challenges which still need to be addressed. These
challenges include sensor design, integration, power-source miniaturization, and
reliability.
1. Sensor Design
With the rapid growth of the use of smart phones, size and functionality are
common requirements for users. This is also true with sensors. In the article “Nanowire
Biosensors,” Nair and Alam (2007) conclude that despite the tremendous potential of
biosensors, careful optimization in design is a key factor in ensuring optimal sensor 20

performance. For implementation within the military, the design must be small enough to
not impede the service member.
2. Integration
Another important challenge sensors must overcome is integration with other
systems. Standardization of sensors in other areas in medicine has been shown to provide
better outcomes. This is evident with the recent cardiac pacing technologies, which,
according to Trohman, Kim, and Pinski (2004), expanded substantially due to
standardization. For sensor adaption to gain a wider acceptance, proprietary equipment
must be phased out.
3. Power-Source Miniaturization
According to Yang (2006), power consumption determines not only the size of
the battery required but also the length of time sensors can be used. Therefore, future
designs must minimize power consumption. Sensors utilizing ZigBee or ultra wideband
radio are suggested as the solution to this problem (Porcino & Hirt, 2003). Porcino and
Hirt (2003) recommend sensors that utilize ZigBee or ultra wideband radio, pointing out
that short-range wireless technology is the key component of the IoT trend, where
“everyone and everything” is connected.
4. Reliability
As Hernandez-Silveira et al. (2014) discussed earlier, medical information
transmitted utilizing sensors must be accurate if it is going to be adopted by medical
providers. Studies have shown that any disruptive technology in an organization must
overcome the human element. People, as creatures of habit, have a hard time transitioning
to different processes even if the new process is better. Kulkarni and Ozturk (2010)
discuss this problem in a study examining sensor system adaption in healthcare and note
that cultural and socioeconomic factors play a key role in determining the speed at which
sensors are adopted within healthcare. Thus, for wireless sensors to be adopted by users,
the data being monitored and transmitted must be accurate.
21
When analyzing the literature for vital sign sensors, our goal was to determine
what constitutes a vital sign and if capabilities exist to wirelessly automate this process.
We found a prevalent theme in literature: the need to discover a wireless automatic
solution to remedy deficiencies in historical monitoring and recording methods. Case
studies in sensor adoption have attempted to implement biosensors in different
environments with mixed results. When reviewing the engineering requirements of a vital
sign monitoring sensor, we discovered the three prominent challenges for the design of
the sensor: integration, power-source miniaturization, and reliability.
22

III. INTEGRATING VITAL SIGNS SENSORS INTO WIRELESS NETWORKS
Wireless sensor networks come in many forms and levels of complexity. This
diversification is needed because of the variety of uses for sensors. This chapter discusses
the typical physical topology and protocol standards used in vital sign transmission in
WSNs.
A. TOPOLOGY
Network topology can be defined utilizing the International Organization for
Standardization (IOS) Open Systems Interconnection (OSI) seven layer model. This
model was developed to provide partitioning of each layer as an abstraction layer,
increasing interoperability but maintaining individuality. “Layering divides the total
problem into smaller pieces…ensuring independence of each layer by defining services
provided by a layer to the next higher layer, independent of how these services are
performed” (Zimmerman, 1980, p. 426). The first two layers (physical and link layers) of
the OSI model define the physical and logical topology of a wireless network. Figure 7
identifies common physical network topologies utilized in WSNs and discusses the
advantage and disadvantages of each.
23

Figure 7. Topology advantages and disadvantages (from Yang, 2006).
24
Topology
Star
Advantages
Simplicity Simple and cheap slave nodes low power consumption o f slave nodes low latency a1D high bandwidth CentraiLsed sys:ems
Mesh DLstributed processing Peer· tO·peer co.'llm w1icarion Very fault tolerant Scalable, many nodes pos.sible Large spatial coverage low/medium c.:>mplexity Energy con.sumption can be balanced
among nodes Star·mesh hybrid Low/medium c.:>mplexit y (if nodes can be
clas .. sified as slaves or masters before deployment I
Cluster tree
Large spatial coverage low latency a1D high bandwidth between
master and its slaves Good for local actuation or data
aggregation High reliability po.;sible Scalable, many nodes pos.sible Power consumption can be balaoced
among masters and it i s asymmetrical between m:ster and slaves
Node.s acting a.~ slave.s can be relatively lnexpenslve
low power consumption of leaf nodes Large spatial coverage area Many nodes possible Large spatial coverage Medium complexity (rerouting Ls required
when a node in the tree dies)
Dis.advanta.ges
Dedicated central node Limited spa:ial coverage Single point of failure Poor scalability, small number
of nodes i\.:j;y l llll l t:ll j~,; lJUWt:l t:tJII . .'~U ll l lJI iuu
(master oon..sumes much more energy than slaves)
Inefficient slave-to--slave commu1l cation
Di..srributed ?roces..sing Nodes lLsed :n lLSt have same basic
functionality, includ ing routing capabilit ies (may be an overkill in some applica· tion..s as it increa.ses co ..st)
Complexity of routing High latenc~· and low bandwidth
High complexity (if all nodes can act a.s masters)
High latenc~· and low bandwidth for mult j.hop commw1ication
Power con.sumption i..s a.sym met· rica! bet·.veen master and slaves
Medium scalability (root o f the tree i..s a bottleneck)
Low reliability (node failure affects routing)
High latenc~· and low bandwidth Asymmetric power con.sumption
(node.s iu the tree backbone con..sume more power)
Nodes lLsed :n lLSt have same ba.sic functionality, includ ing routing capabilit ies (may be an overkill in some application..s)

The choice of topology used for vital sign transmission is use case dependent. In a
non-austere and limited mobility environment such as a hospital, the topology of choice
would be a star configuration. This is due to its low cost and simple design scheme that
utilizes a centralized system. A star topology would not be a feasible solution in an
environment where the monitored subjects are highly mobile and network scalability (the
ability to increase or decrease the number of vital sign monitored persons) is a factor.
This use case would be better suited for a mesh or star mesh hybrid topology solution due
to the highly scalable and large coverage area characteristics.
B. PROTOCOL STANDARDS
Similar to network topology, the choice of wireless sensor protocol standards for
vital sign transmission is use case dependent. While one standard may provide better
range, the disadvantage normally lies in the increase in power consumption and larger
size requirement (Yuce & Ho, 2008). The following sections discuss the typical wireless
sensor protocol standards used in vital sign transmission.
1. 802.15.1 Medium Rate WPAN
The IEEE 802.15.1 standard defines the implementation of medium rate WPANs,
also known as Bluetooth®. This standard was developed to replace the need for cables to
connect portable and fixed electronic devices (IEEE, 2005). Bluetooth utilizes 79
channels within the unlicensed 2.45 GHz industrial scientific and medical (ISM) band
while operating in a master/slave configuration. The master node is responsible for clock
synchronization of slave nodes and determination of frequency hopping patterns. This
frequency hopping characteristic is implemented to combat RF interference and fading
(IEEE, 2005). As indicated in Figure 8, the OSI layers are expanded upon to develop the
Bluetooth® protocol stack.
25

Figure 8. ISO OSI layers compared with 802.15.1 (from IEEE, 2015).
Bluetooth technology has increased in popularity among vital sign sensor vendors
in recent years due to the newly developed low-energy protocol stack (Pantelopoulos &
Bourbakis, 2010). The Bluetooth low-energy technology allows for consumption of only
a small fraction of the power of the original Bluetooth products and is targeting sports
and wellness and healthcare devices (Pantelopoulos & Bourbakis, 2010). Data rates range
between 1 and 3Mbps. The disadvantage lies in the overall transmission range of 10
meters (Yuce & Ho, 2008).
2. 802.15.3 High Rate WPAN
The goal of IEEE 802.15.3 was to provide for low-complexity, low-cost, low-
power-consumption and high-data-rate (20 Mb/s or more) wireless connectivity among
devices within or entering the personal operating space, 10 meters, while implementing
quality of service capabilities for multimedia data support (IEEE, 2009). Because of its
relatively low maximum data rate, the 802.15.3 did not meet the success of other
competing standards, specifically 802.11 (Yang, 2006). In 2009, an amendment to the
original standard was introduced that offered an alternative physical layer operating in the
60 GHz band, which resulted in data rates of greater than 5 Gbps (Yang, 2006). This
standard has been deemed not efficient for the use of wireless sensors because of the
26

small size of data packets required for a typical vital sign monitoring scenario (Yang,
2006).
3. 802.15.4 Low-Rate WPAN
The IEEE 802.15.4 defines the physical and medium access control layer
specifications for low-data-rate wireless connectivity (IEEE, 2011). As shown in Figure
9, the physical layer is capable of using many different frequency bands.
Figure 9. The physical specifications supported by IEEE 802.15.4 (from Yang, 2006).
The physical layer also dictates the activation and deactivation of the transceiver,
energy detection, link quality indicator, channel selection, clear channel assessment
(CCA), and transmitting and receiving (IEEE, 2011). As defined by IEEE, the Media 27

Access Control (MAC) sublayer provides two services: the MAC data service and the
MAC management service interfacing to the MAC sublayer management entity. The
main features of the MAC sublayer are beacon management, frame
validation/acknowledgment, and control access to the physical layer through the use of
CSMA/CA.
The 802.15.4 standard can be used to create a star or peer-to-peer network. To
reduce the cost of this implementation, devices were divided into full-function device
(FFD) and reduced-function device (RFD) categories. The FFD has the ability to act as
the personal area network (PAN) coordinator. The PAN coordinator’s role is to control
the association of nodes as well as initiating, terminating, and routing communication
(Yang, 2006). Figure 10 provides examples of the utilization of the PAN coordinator
within both topologies.
Figure 10. PAN coordinator placement in topology (from IEEE, 2011).
28

a. ZigBee
The ZigBee Alliance expanded upon the 802.15.4 to include a network and
application layer that provides a framework that vendors can utilize to ensure
compatibility of products. Figure 11 shows the ZigBee architecture and its relation to the
802.15.4 standard.
Figure 11. ZigBee architecture in relation to the IEEE 802.15.2 standard (from Yang, 2006).
ZigBee utilizes three types of devices: ZigBee coordinator, ZigBee router, and
ZigBee end device. These three mirror in behavior the 802.15.4 defined devices PAN
coordinator, FFD, and RFD respectively. Their typical range is anywhere from 10 to75
meters (Pantelopoulos & Bourbakis, 2010).
One aspect of particular interest in the implementation of ZigBee is the Alliance’s
development of application profiles. These application profiles provide a device
29

description, cluster (data entities), and service types. The profiles are developed with the
consensus of vendors who take part in the Alliance. The current list of application
profiles spans 10 categories including healthcare. The healthcare profile is segmented
into three concentration areas (personal wellness, health and fitness, and disease
management), which are defined in Figure 12. These three concentration areas provide
the basis for interoperability in that products from other vendors can call upon and
communicate between devices by standardizing the data format.
Figure 12. Three concentration areas of the healthcare profile sensor application (from Yang, 2006).
30

Due to ZigBee’s utilizing the same frequency as wireless local area networks, 2.4
GHz, coexistence can be challenging (Yuce & Ho, 2008). Data rates may also be an issue
due to the relatively small throughput of approximately 250Kbps (Pantelopoulos &
Bourbakis, 2010).
4. 802.15.6 Wireless Body Area Networks
The 802.15.6 standard was developed to enable short-range (2 meters)
communications inside, on, or around the human body (Yang, 2006). The chart in Figure
13 identifies some of the use cases for this standard.
Figure 13. WBAN use cases (from IEEE, 2012).
WBAN uses the ISM bands as well as frequency bands approved by national
medical or regulatory authorities (IEEE, 2012). IEEE addresses the physical layer, MAC
layer, data encryption, and authentication within this standard. The physical layer is
divided into narrowband, ultra wideband, and human body communication categories.
31

Narrowband is considered optimal for medical applications, both for wearable and
implanted networks, by providing a scalable data range between 100 and 1,000 Kbps
(Yang, 2006). Ultra wideband provides more robust capability that includes high-
reliability, low-complexity, and ultralow-power operation (Yang, 2006). Human body
communication utilizes the body as the transmission medium instead of a physical
antenna; it operates at 21 MHz.
32

IV. INTEGRATION OBSERVATIONS
The observations in this chapter were performed during lab testing in preparation
for an experiment aboard the USCG ship ADM. Callaghan. The intended purpose of the
experiment was to conduct integration testing of a COTS wireless vital sign monitoring
sensor with a mesh infrastructure. Yet, because of proprietary hardware and fiscal and
time constraints, the experiment aboard USCG ADM. Callaghan was not performed. This
chapter details the observations found within the lab environment.
A. COMMUNICATION EQUIPMENT
For this experiment, communication equipment from two COTS vendors was
selected: TrellisWare radios and Zephyr wireless vital sign monitoring sensor BioHarness
3. The TrellisWare tactical radios were chosen based on previous research performed by
the Naval Postgraduate School Center for Network Innovation and Experimentation
(CENETIX) laboratory. In a 2014 study, Aras found that due to their relatively low
frequency and hull penetration ability, TW-230 radios provided adequate voice
communication utilizing only four nodes onboard USCG ship ADM. Callaghan (Aras,
2014). The Zephyr BioHarness 3 was chosen due to previous successful implementation
of Zephry products within tactical operational environment.
1. TrellisWare TW230 Radios
The TW230 radio is part of the Tactical Mobile Ad-Hoc Network family of radios
developed by TrellisWare. Since this is an OSI Layer 3 device, scalability is not an issue.
TW230s automatically establish mesh network connections when a new device is
introduced to the network. A photo of the radio and specifications are provided in Figure
14 and Table 2.
33

Figure 14. TW230 radios (from TrellisWare, 2012).
34
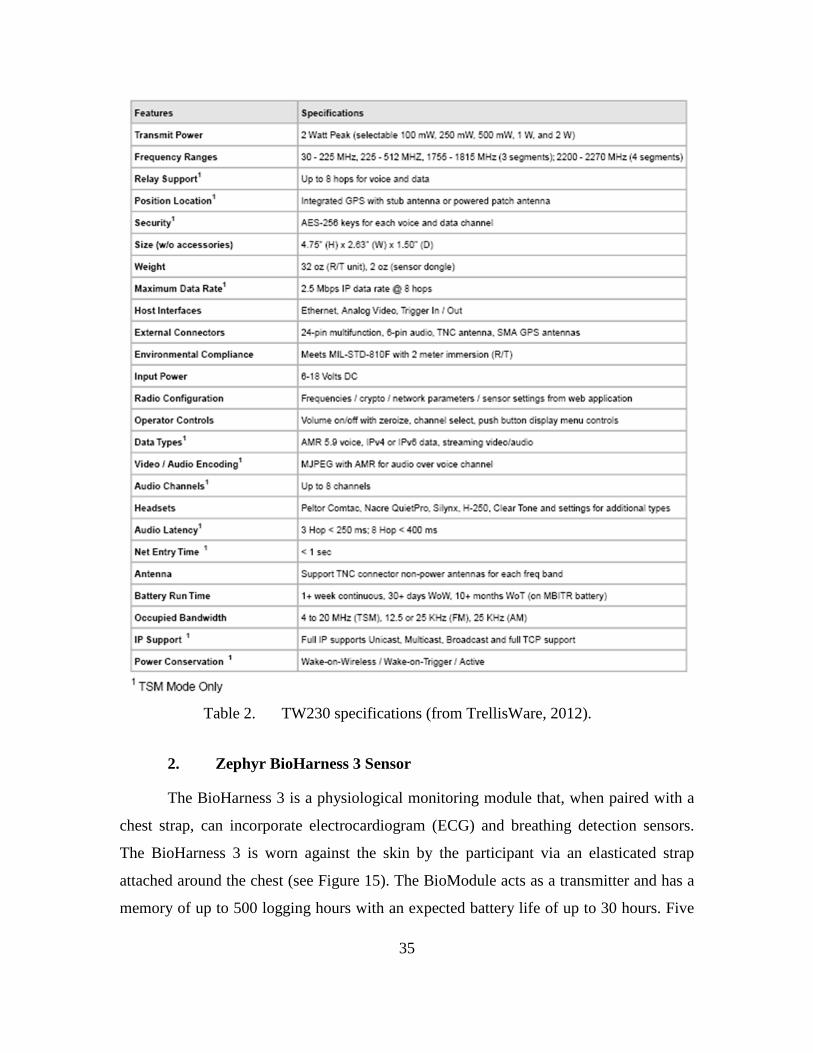
Table 2. TW230 specifications (from TrellisWare, 2012).
2. Zephyr BioHarness 3 Sensor
The BioHarness 3 is a physiological monitoring module that, when paired with a
chest strap, can incorporate electrocardiogram (ECG) and breathing detection sensors.
The BioHarness 3 is worn against the skin by the participant via an elasticated strap
attached around the chest (see Figure 15). The BioModule acts as a transmitter and has a
memory of up to 500 logging hours with an expected battery life of up to 30 hours. Five
35
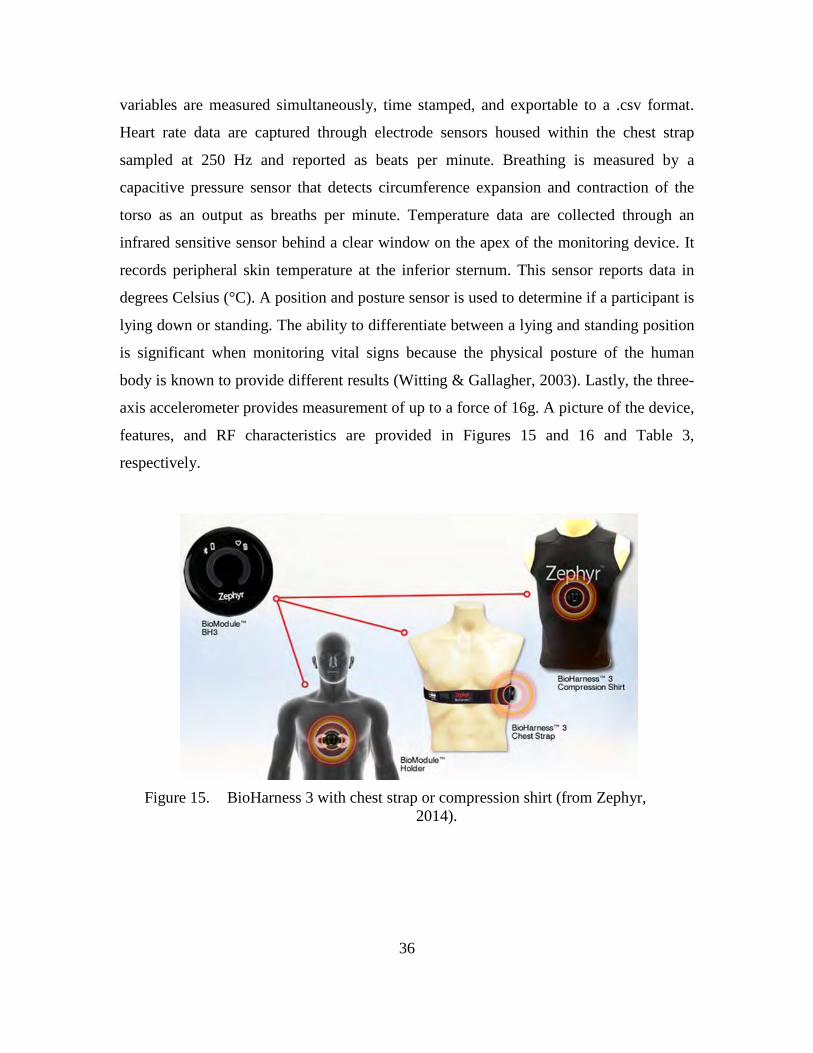
variables are measured simultaneously, time stamped, and exportable to a .csv format.
Heart rate data are captured through electrode sensors housed within the chest strap
sampled at 250 Hz and reported as beats per minute. Breathing is measured by a
capacitive pressure sensor that detects circumference expansion and contraction of the
torso as an output as breaths per minute. Temperature data are collected through an
infrared sensitive sensor behind a clear window on the apex of the monitoring device. It
records peripheral skin temperature at the inferior sternum. This sensor reports data in
degrees Celsius (°C). A position and posture sensor is used to determine if a participant is
lying down or standing. The ability to differentiate between a lying and standing position
is significant when monitoring vital signs because the physical posture of the human
body is known to provide different results (Witting & Gallagher, 2003). Lastly, the three-
axis accelerometer provides measurement of up to a force of 16g. A picture of the device,
features, and RF characteristics are provided in Figures 15 and 16 and Table 3,
respectively.
Figure 15. BioHarness 3 with chest strap or compression shirt (from Zephyr,
2014).
36

Figure 16. BioHarness 3 composite capabilities (from Zephyr, 2014).
Table 3. BioHarness 3 RF characteristics (from Zephyr, 2014).
37

B. INFRASTRUCTURE DESIGN
The lab test scenario was to incorporate multiple BioHarness 3 sensors. Each
sensor would be paired to a single TW-230 radio interface device utilizing Bluetooth
technology to connect to the mesh topology. We chose Bluetooth as the preferred RF
transmission medium because it was the common protocol between the two devices. The
TW-230 radios would be preconfigured in a mesh network with one of the TW-230
utilized as an end node. This end node would transmit all of the networked sensor data to
the remote server for storage and viewing. A healthcare provider could then utilize the
monitoring client to view real-time vital sign data using standard Internet protocols.
Figure 17. Lab test infrastructure design.
For the TW-230s to communicate via Bluetooth, a separate radio interface device
(RID) is required. The RID plugs directly into the side of the radio and requires software
version 4a Beta5 or higher. Figure 15 shows a picture of the RID.
38

Figure 18. TW-230 Bluetooth radio interface device (from TrellisWare, 2012).
C. CONNECTIVITY OBSERVATION
Problems soon arose during the initial pairing of the TW-230 radio and the
BioHarness 3. We found that both the TW-230 and BioHarness 3 were not able to operate
in a Bluetooth master mode, which is required in a master/slave relationship. While
connections were established directly to a Bluetooth-enabled laptop by both devices,
connections could not be established between the TW-230 and BioHarness 3. Further
investigation led to a proposed solution by Zephyr that entails the purchase of their
proprietary RID. This was not pursued due to time constraints.
D. CONNECTIVITY VIA GATEWAY
We shifted the lab test focus from integration of the BioHarness 3 into the mesh
network to an observation of the sensor utilizing the Zephyr Echo Gateway that came
with the product. The Echo Gateway can be seen in Figure 19 connected on the right side
of the laptop. The gateway uses 802.15.4 technology and allows the remote computer to
view live data from multiple sensors using the accompanying software.
39

Figure 19. Zephyr BioHarness 3 module (left), chest strap (center) and gateway
(right).
Connectivity between the BioHarness 3 module and the gateway was established
without issue once the accompanying software configuration was changed from
“Bluetooth” to “Echo” network within the general setting of the preference menu. After
donning the chest strap, the subject’s ECG and breath rate data was only captured after
dampening two areas on the chest strap as recommended in the manual. The range was
typical of a device operating in this frequency and power combination.
E. SOFTWARE OBSERVATIONS
The Zephyr BioHarness 3 was shipped with two different software applications,
OmniSense and OmniSense Analysis. OmniSense, the live data monitoring software, can
be viewed in Figure 20.
40

Figure 20. Zephyr OmniSense live monitoring application display.
OmniSense is a highly customizable application that can be tailored to display
many types of physiological data within the gauge display (see Figure 21).
41

Figure 21. OmniSense gauge settings.
Markers can be manually set during live monitoring for the ease of locating data
points to be analyzed later using the second software application, OmniSense Analysis.
The four tabs arranged vertically on the right of the application window provide an easily
accessible view of the selected sensor’s data (Details, Accel, Comms, and Sensors).
Details provides most of the physiological health data, while Accel provides a graphical
display of the acceleration forces set upon the sensor (see Figure 22).
42

Figure 22. OmniSense Real-Time Vital Signs monitoring.
The other two tabs (not displayed in Figure 22) provide a visual depiction of the
communications link and the status of additional sensors that could be attached to the
BioHarness 3 module, blood pressure cuff, or a peripheral capillary oxygen saturation
(SpO2 ) sensor.
Although the Zephyr product was not able to connect to the TW-230 radios using
TrellisWare’s RIDs, it was successful in capturing, storing, transmitting, and displaying
vital signs using the 802.15.4 gateway. The OmniSense application was easy to use, and
the depth of available viewing options provides a healthcare provider many options on
how and what data to display. This allows for a greater variety of use cases for the
43

BioHarness 3 vital sign monitoring platform to perform in. Further studies are warranted
with this product and its performance with Zephyr’s proprietary RIDs in order to test the
integration within a tactical mesh network.
44

V. CONCLUSION
The purpose of this study was to explore the current capabilities of COTS sensor
technologies for monitoring vital signs. Various COTS sensor systems exist, but
exploration into their adaptability into current U.S. Coast Guard and DOD network
infrastructure is limited. Due to the unique nature of the U.S. Coast Guard and the DOD,
utilization of tactical networked radios within a mesh network for transmission of vital
sign data was found to be the most ideal communication platform.
We explored medical vital sign process to determine whether a general need for a
technological solution to vital sign capture exists. We discovered through case studies
and literature review an overwhelming need to solve two historical problems associated
with the vital sign process: limitation of range and transcription of data. Studies
advocated the need to automate and make the vital signs process wireless as a solution to
these problems in both the civilian and military sectors.
We reviewed various peer-reviewed articles and studies and found a general
consensus of what sensor design requirements are needed for future adoption. These
requirements center on ease of integration, power-source longevity/miniaturization, and
reliability.
Integrating COTS software within U.S. Coast Guard and DOD infrastructure
proved challenging. In this study, we chose the Zephyr BioHarness 3 as the our testing
case because it operates on the 802.15.1 protocol standard, which would allow for
connectivity for wireless transmission to the U.S. Coast Guard’s current tactical radio
TW-230 to a broader mesh network. The BioHarness 3 was small and lightweight and
measured vital signs wirelessly. In our tests, we observed the inability of the TW-230 and
the BioHarness 3 to operate in a Bluetooth master mode due to proprietary RID issues.
The TW-230’s RID were not compatible with the BioHarness 3. Due to financial and
time constraints, the proprietary RIDs were not purchased and connectivity to TW-230s
was never established. We then explored alternate connectivity options, specifically the
use of the Zephyr Gateway 802.15.4 to connect to a mesh network. This configuration
was successful and vital sign data was automatically monitored and recorded.
45

Future Work
The role of the sensor in medicine is quickly becoming more commonplace in the
civilian sector. To keep pace, the military sector needs more research into sensor
technology to adequately adopt its benefits into the military network infrastructure.
Future work in sensor adoption is needed to address software integration, battery
longevity/miniaturization, and reliability issues unique to the military environment.
While our study was unsuccessful in connecting a COTS sensor to existing military
infrastructure (tactical radios), we are confident in the near future the problems associated
with acquiring and recording vital signs will be solved.
46

LIST OF REFERENCES
Aras, E. (2014). Boarding team networking on the move: Applying unattended relay nodes (Master’s thesis). Retrieved from Calhoun http://calhoun.nps.edu/bitstream/handle/10945/43869/14sep_aras_ercan.pdf
Blackbourne, L. H. (2011). 1831. United States Army Medical Department Journal, (April–June): 6–10. Retrieved from www.cs.amedd.army.mil/AMEDDJournal/2011AprJun.pdf
Chan, Y. S., Liang, H. J., & Lin, Y. H. (2014, April). Using wireless measuring devices and Tablet PC to improve the efficiency of vital signs data collection in hospital. In 2014 IEEE International Symposium on Bioelectronics and Bioinformatics (ISBB), (pp. 1–4).
Cioffi, J., Salter, C., Wilkes, L., Vonu-Boriceanu, O., & Scott, J. (2006). Clinicians’ responses to abnormal vital signs in an emergency department. Australian Critical Care, 19(2), 66–72. doi: 10.1016/S1036-7314(06)80011-1
Crum-Cianflone, N. F., Blair, P. J., Faix, D., Arnold, J., Echols, S., Sherman, S. S. ... Hale, B. R. (2009). Clinical and epidemiologic characteristics of an outbreak of novel H1N1 (swine origin) influenza A virus among United States military beneficiaries. Clinical Infectious Diseases, 49(12), 1801–1810.
Darianian, M., & Michael, M. P. (2008). Smart Home Mobile RFID-based Internet-of- things systems and services. Proceedings of the International Conference on Advanced Computer Theory and Engineering, Thailand, 116–120. doi: 10.1109/ICACTE.2008.180
Du, Z., Yang, Y., Liao, W., Liu, L., & Liu, L. (2014, June). Poster: Semi-automatic monitoring vital parameters of mobile users. Proceedings of the 12th Annual International Conference on Mobile systems, Applications, and Services (pp. 369–369).
Eastridge, B. J., Mabry, R., Blackbourne, L. H., & Butler, F. K. (2011). We don’t know what we don’t know: Prehospital data in combat casualty care. United States Army Medical Department Journal, 11–15. Retrieved from http://www.cs.amedd.army.mil/AMEDDJournal/2011AprJun.pdf
Government Accountability Office. (1996). Wartime medical care: DOD is addressing capability shortfalls, but challenges remain (GAO/NSIAD-96-224). Washington, DC: Author. Retrieved from http://www.gao.gov/archive/1996/ns96224.pdf
47

Gearing, P., Olney, C. M., Davis, K., Lozano, D., Smith, L. B., & Friedman, B. (2005). Enhancing patient safety through electronic medical record documentation of vital signs. Journal of Healthcare Information Management: JHIM, 20(4), 40–45.
Helmus, T. C., & Glenn, R. W. (2005). Steeling the mind: Combat stress reactions and their implications for urban warfare. Santa Monica, CA: RAND.
Hernandez-Silveira, M. A., Ang, S. S., & Burdett, A. (2014). Challenges and trade-offs involved in designing embedded algorithms for a low-power wearable wireless monitor. IFMBE Proceedings, 43, 416–419. http://dx.doi.org/10.1007/978-3-319-02913-9_106
Hirschberg, D. L., Betts, K., Emanuel, P., & Caples, M. (2014). Assessment of wearable sensor technologies for biosurveillance (ECBC-TR-1275). Aberdeen Proving Ground, MD: U.S. Army Research, Development and Engineering Command.
IEEE std 802.15.1-2005: Revision of IEEE Std 802.15.1-2002. (2015). [Standard for information telecommunications and information exchange between systems local and metropolitan area networks]. Retrieved from http://standards.ieee.org/getieee802/download/802.15.1-2005.pdf
IEEE std 802.15.3-2003. (2003). [Standard for information telecommunications and information exchange between systems local and metropolitan area networks]. Retrieved from http://standards.ieee.org/getieee802/download/802.15.3-2003.pdf
IEEE std 802.15.4-2011 (Revision of IEEE Std 802.15.4-2006) [Standard for Local and metropolitan area networks]. (2011). Retrieved from http://ieeeexplore.ieee.org/stamp/stamp.jsp?tp=&arnumber=6012487&isnumber=6012486
IEEE std 802.15.6-2012 Standard for Local and metropolitan area networks. (2012). Retrieved from http://standards.ieee.org/getieee802/download/802.15.6-2012.pdf
Johns Hopkins University School of Medicine. (n.d.) Vital signs (body temperature, pulse rate, respiration rate, blood pressure). Retrieved March 23, 2015 from http://www.hopkinsmedicine.org/healthlibrary/conditions/cardiovascular_diseases/vital_signs_body_temperature_pulse_rate_respiration_rate_blood_pressure_85,P00866/
Kahn, J. M., Katz, R. H., & Pister, K. S. (1999). Next century challenges: Mobile networking for “Smart Dust.” Mobicom ‘99 Proceedings of the 5th annual/ACM/IEEE International Conference on Mobile Computing and Networking, 271–278. http://dx.doi.org/10.1145/313451.313558
Kartsakli, E., Antonopoulos, A., Tennina, S., Lalos, A., Mekikis, P.V., Alonso, L., … Verikoukis, C. (2013). Enhancing quality of life with wireless sensor technology.
48
Retrieved from http://lifesciences.ieee.org/publications/newsletter/december-2013/464-enhancing-quality-of-life-with-wireless-sensor-technology
Kiokes, G., Vossou, C., Chatzistamatis, P., Potirakis, S. M., Vassiliadis, S., Prekas, K., ... Gulez, K. (2014). Performance evaluation of a communication protocol for vital signs used for the monitoring of athletes. International Journal of Distributed Sensor Networks, 1–14. doi: 10.1155/2014/453182
Kripalani S., LeFevre F., Phillips C.O., Williams M.V., Basaviah P., & Baker D.W. (2007). Deficits in communication and information transfer between hospital-based and primary care physicians: Implications for patient safety and continuity of care. JAMA, 297(8): 831–841. doi:10.1001/jama.297.8.831
Kulkarni, P., & Ozturk, Y. (2011). mPHASiS: Mobile patient healthcare and sensor information system. Journal of Network and Computer Applications, 34(1), 402–417.
Laudermilch, D. J., Nathens, A. B., & Rosengart, M. R. (2010). Lack of emergency medical service documentation is associated with poor patient outcomes: A validation of audit filters for prehospital trauma care. Journal of American College of Surgery, 2010(2), 220–227. doi: 10.1016/j.jamcollsurg.2009.10.008
Nair, P. R., & Alam, M. A. (2007, December). Design considerations of silicon nanwire biosensors. IEEE, 54, 3400–3408. doi: 10.1109/TED.2007.909059
Navy Medicine (22 October 2013). Navy medicine strategy map FY2015. Retrieved from www.med.navy.mil/Pages/StrategicMap.aspx
Niemela, V., Paso, T., Tuovinen, T., Haapola, J., Hamalainen, M., & Iinatti, J. (2014). Propogation effects and antenna properties and their impact on ED receivers’ performance in body sensor network. Medical Information Communication Technology (ISMICT) 2014 International Symposium, 1–5. doi: 10.1109/ISMICT.2014.6825226
National Institute of Health. (2015). Vital Signs. Medline Plus. Retrieved from http://www.nlm.nih.gov/medlineplus/ency/article/002341.htm
Pallis, G. C., Ferreria, N., Hildebrand, L., & Seynaeve, G. (2014). Wireless transmission of vital signs of entrapped victims during search and rescue operations in collapsed buildings. Wireless Mobile Communication and Healthcare, 254–257. http://dx.doi.org/10.1109/MOBIHEALTH.2014.7015959
Pantelopoulos, A., & Bourbakis, N. (2010). A survey on wearable sensor-based systems for health monitoring and prognosis. IEEE Transaction on Systems, Man and Cybernetics-Part C: Applications and Reviews, 40(1), 1-12.
49

Parush, A. (2014). Displays for health care teams: A conceptual framework and design methodology. Bisantz, A. M., Burns, C. M., & Fairbanks, R. J. (Eds.) Cognitive Systems Engineering in Health Care, RC Press.
Pizziferri, L., Kittler, A. F., Volk, L. A., Honour, M. M., Gupta, S., Wang, S., ... & Bates, D. W. (2005). Primary care physician time utilization before and after implementation of an electronic health record: A time-motion study. Journal of Biomedical Informatics, 38(3), 176–188. http://dx.doi.org/10.1016/j.jbi.2004.11.009
Porcino, D., & Hirt, W. (2003, July). Ultra-wideband radio technology: potential and challenges ahead. IEEE, 41(7), 66–74. http://dx.doi.org/10.1109/MCOM.2003.1215641
Savci, H. S., Sula, A., Wang, Z., Dogan, N. S., & Arvas, E. (2005, April). MICS transceivers: regulatory standards and applications [medical implant communications service]. Southeast, 2005. Proceedings, IEEE, 179–182. http://dx.doi.org/10.1109/SECON.2005.1423241
Scannell-Desch, E., & Doherty, M. E. (2010). Experiences of U.S. military nurses in the Iraq and Afghanistan wars, 2003–2009. Journal of Nursing Scholarship, 42(1), 3–12. http://dx.doi.org/10.1111/j.1547-5069.2009.01329.x
Slight, S. P., Franz, C., Olugbile, M., Brown, H. V., Bates, D. W., & Zimlichman, E. (2014). The return on investment of implementing a continuous monitoring system in general medical-surgical units. Critical care medicine, 42(8), 1862–1868.
Smith, L. B., Banner, L., Lozano, D., Olney, C. M., & Friedman, B. (2009). Connected care: Reducing errors through automated vital signs data upload. CIN: Computers, Informatics, Nursing, 27(5), 318–323. Retrieved from www.journals.lww.com/cinjournal/Abstract/2009/09000/Connected_Care_Reducing_Errors_Through_Automated.10.aspx
South, D. A., Skelley, J. W., Dang, M., & Woolley, T. (2015). Near-miss transcription errors: A comparison of reporting rates between a novel error-reporting mechanism and a current formal reporting system. Hospital pharmacy, 50(2), 118–124.
Summers, M. N. L. (2013). The Tactical Combat Casualty Care Casualty Card TCCC Guidelines–Proposed Change 1301.
Topol, E. J., Steinhubl, S. R., & Torkamani, A. (2015). Digital medical tools and sensors. JAMA, 313(4), 353–354.
TrellisWare Technologies, Products. (2012) CheetahNet II TW-230 user’s guide.
50

TrellisWare Technologies, Products. (2012) Bluetooth dongle accessory guide.
Trohman, R., Kim, M. H., & Pinski, S. L. (2004, November 5). Cardiac pacing: The state of the art. The Lancet, 364(9446), 1701–1719. http://dx.doi.org/10.1016/S0140-6736(04)17358-3
Witting, M. D., & Gallagher, K. (2003). Unique cutpoints for sitting-to-standing orthostatic vital signs. The American Journal of Emergency Medicine, 21(1), 45-47.
Watson, J. D., & Crick, F. H. (1953). A structure for deoxyribose nucleic acid. Nature, 171, 737–738. http://dx.doi.org/10.1038/171737a0
Xia, F., Yang, L. T., Wang, L., & Vinel, A. (2012). Internet of Things. International Journal of Communicating Systems, 25, 1101–1102. http://dx.doi.org/10.1002/dac.2417
Yang, G. Z. (2006). Body sensor networks (2nd ed.) [electronic version]. doi: 10.1007/978-1-4471-6374-9
Yuce, M., & Ho, C. (2008). Implementation of body area networks based on MICS/WMTS medical bands for healthcare systems. 30th Annual International IEEE EMBS Conference, 3417–3421.
Zimmermann, H. (1980). OSI reference model—The ISO model of architecture for open systems interconnection. Communications, IEEE Transactions on, 28(4), 425–432.
51

THIS PAGE INTENTIONALLY LEFT BLANK
52

INITIAL DISTRIBUTION LIST
1. Defense Technical Information Center Ft. Belvoir, Virginia 2. Dudley Knox Library Naval Postgraduate School Monterey, California
53