Embed Size (px)
Citation preview

NAVAL MEDICAL RESEARCH UNIT SAN ANTONIO
DEVELOPMENT AND VALIDATION OF A PROTOTYPE VACUUM SENSING
UNIT FOR THE DD2011 CHAIRSIDE AMALGAM SEPARATORS
JAY SHARTZER, B.S., SOPHIA JOHNSON, PH.D., AND AMBER NAGY, PH.D.
CRANIOFACIAL HEALTH AND RESTORATIVE MEDICINE
BIOMATERIALS AND ENVIRONMENTAL SURVEILLANCE
NAMRU-SA REPORT # 2015-92
Approved for public release; distribution is unlimited.

1
DECLARATION OF INTEREST
The views expressed in this article are those of the authors and do not necessarily reflect the
official policy or position of the Department of the Navy, Department of Defense, nor the U.S.
Government. This work was funded by work unit number G1016. Title 17 USC §105 provides
that ‘Copyright protection under this title is not available for any work of the U.S. Government.’
Title 17 USC §101 defines a U.S. Government work as a work prepared by a military service
member or employee of the U.S. Government as part of that person’s official duties.


3
TABLE OF CONTENTS
Abbreviations .................................................................................................................................. 4
Executive Summary ........................................................................................................................ 5
Introduction ..................................................................................................................................... 6
Materials and Methods .................................................................................................................... 7
Results ........................................................................................................................................... 21
Military Significance .................................................................................................................... 27
Future Development...................................................................................................................... 27
Appendix I: Terminology and Working Definitions .................................................................... 29
Appendix II: Circuit Diagram ....................................................................................................... 31
Appendix III: Program Flow Chart ............................................................................................... 32
Appendix IV: Transducer Conversion Compared to RG-1 .......................................................... 34
References ..................................................................................................................................... 35

4
ABBREVIATIONS
ADC Analog-to-digital Converter
Ag Silver
BSPP British Standard Pipe Parallel
BUMED Bureau of Medicine and Surgery
CLK Clock
CS Chip Select
Cu Copper
EPA U.S. Environmental Protection Agency
GB Gigabyte
GND Common electrical ground
Hg Mercury
I2C Inter-Integrated Circuit
ISO International Organization for Standardization
LED Light Emitting Diode
MISO Master In Slave Out
MOSI Master Out Slave In
NPT National Pipe Thread Taper
POTW Publically Owned Treatment Works
RG-1 Reference Gauge 1
RG-2 Reference Gauge 2
RTC Real-time Clock
SCL Serial Clock Line
SD Secure Digital
SDA Serial Data Line
Sn Tin
SPI Serial Peripheral Interface
SS Slave Select
VCC Voltage Common Connection
VDC Direct Current Voltage

5
EXECUTIVE SUMMARY
Background: Dental amalgam is a safe, durable, and effective material frequently used for tooth
restorations. Containing up to 50% mercury, amalgam waste created during placement and
removal of amalgam restorations can contribute to mercury pollution in waterways. Chairside
amalgam separators in dental clinics function as the first line of defense to remove amalgam
particulates and debris from dental wastewater through size-exclusion mechanisms. The
filtration and retention of particulate over time ultimately affects dental waste evacuation flow
rates which can be detrimental to dental procedures. Amalgam separator replacement is
performed in timed increments of 2-18 months depending upon manufacturer recommendations.
Currently, there are no commercially available amalgam separator units outfitted with an
alarming mechanism to alert dental clinicians that their dental waste filtration system no longer
operates within manufacturer specification. To address this need, we have developed a vacuum
sensing prototype that incorporates an alarm mechanism to denote when the DD2011 chairside
amalgam separator does not reach its effective filtering capacity. This research will improve the
cost effectiveness of amalgam separators by extending the lifetime of use until its capacity has
been reached and will also serve to ensure that dental clinics abide by local, state, and federal
mandates for amalgam waste management.
Objective: The goal of this report is to show a proof of concept for an alarm sensor that
measures the pressure differential across the amalgam separator. The alarm’s audible and visual
function will alert the user when replacing the separator is necessary.
Methods: A sensor was built to measure and record differential pressure values within the
vacuum lines located on both ports of the amalgam separator. A flow constricting valve was
positioned on the outflow port of the DD2011 chairside amalgam separator to induce varying
pressure differentials and simulate vacuum line blockage due to amalgam waste and dental
debris. Data generated from the transducers during simulated blockages were transformed into
pressure values using linear regression equations from the calibration data.
Results: The greatest divergence in differential pressure was observed when the flow
constricting valve was rotated from a fully open position (0°) to a position between 30 - 60°.
Obstructions beyond the 30° position induced a differential pressure that exceeded
predetermined differential pressure limit triggering the visible and audible alerts within the
sensor.
Conclusions: The simulated obstruction separator experiments validated the sensor’s ability to
detect differential pressure changes and alert the user of flow impediment through visual and
audible cues.
6
INTRODUCTION
Although the proportion of amalgams placed has decreased from approximately
50% in 2003 [1], to between 37-42% in the past decade [2], [3], amalgam waste is still an
environmental concern. Amalgam is composed of liquid mercury (Hg) and an alloy
powder consisting silver (Ag), tin (Sn), and copper (Cu) [4]. Dental clinics can produce
up to 4.5 g of Hg per day, which approximates to 1 kg per year [5]. Although releases of
Hg from individual clinics are not considered to be the major contributors to the overall
Hg burden in wastewater, the cumulative effect of Hg release from all dental clinics is
known to be significant [6].
In 2003, 50% of all Hg contamination entering publically owned treatment works
(POTW) was attributed to dental amalgam [7], [8]. An estimated 122,000 dental offices
have discharged amalgam into POTW for a total discharge approximation of 3.7 tons of
Hg per year [9].
Amalgam separators offer a cost-effective and efficient means of controlling Hg
discharge into POTW. This amalgam waste management practice removes up to 99% of
Hg from waste streams [10]. Separators function by using sedimentation, filtration,
centrifugation, chemical, or a combination of these removal mechanisms to eliminate
amalgam particulates from dental wastewater. A benefit of filtration amalgam separators
is that they function without the use of moving parts, which reduces the cost and the
probability of mechanical difficulties [11]. Chairside amalgam separators, such as the
DD2011, remove amalgam waste particulates by filtration and are attached to the vacuum
system of dental chairs for easy removal and replacement. Amalgam particulates
captured by manufacturer-installed, chairside amalgam traps prevent vacuum line
blockage by removing large dental waste deposits and tooth debris [12]. This makes
chairside amalgam separators a preferable option as a first line of defense for the removal
of dental amalgam waste. In addition, separators aid in preserving the wastewater
plumbing of dental clinics by preventing sludge build up over time.

7
Chairside amalgam separator replacement schedules are currently independent of the
volume of amalgam waste entering the filtration device and solely dependent upon a set service
schedule. Time-based determination of the amalgam separator lifespan does not address
variability between individual amalgam separators as well as outlying events that may critically
disrupt the separator’s efficiency. Unforeseen challenges, such as damage to the filtration
medium or debris buildup within the inflow and outflow ports, could disrupt the fluid flow and
prematurely reduce the suction force necessary to collect amalgam and biomaterial from a
patient’s oral cavity.
To ensure a properly functioning amalgam separator that performs within current and
proposed government mandates, a user-friendly sensor is necessary to monitor the differential
pressure across the separator that immediately reports adverse conditions. The objective of this
research was to design, build, and validate a vacuum sensing prototype that records changes in
pressure differentials and provides an audible and visible cue when vacuum pressure drops
below predesignated levels necessary for proper dental suction. These data will allow dental
clinics to achieve full utilization of amalgam separators in addition to remaining in compliance
with amalgam waste management regulation.
MATERIALS AND METHODS
Materials
Included below are the manufacturer and procurement information for the materials used
to develop the vacuum sensor. The power supply for Samsung SyncMaster LCD/TFT 770 was
manufactured by SIB-CORP (Clifton, NJ). The Adafruit data logging shield was manufactured
by Adafruit (New York City, NY). The Arduino Uno Rev3 microcontroller was manufactured
by Arduino LLC (Turin, Italy). The Secure Digital (SD) card was a Kingston 4 GB microSDHC
Class 4 SDC4/4GBET Flash SD card (Fountain Valley, CA). Carbon resistors with a 1%
tolerance were acquired from a 1/4W 86 Value 860 piece resistor kit set manufactured by Joe
Knows Electronics, LLC (Taylors, SC). The heat-shrink tubing was manufactured by Vktech
(Stockholm, Sweden). Gardner Bender manufactured (Menomonee Falls, WI) the LTB-400

8
black liquid electrical tape used. Jumper wires were either used from the Elenco JW-350 jumper
wire kit (Wheeling, IL) or from Dupont’s 3 x 40 piece jumper wire set, model number
RR40DUP. Non-lead solder was supplied by Rosewill (City of Industry, CA) in their RTK-090
tool kit, which is sold by Amamax (Houston, TX). All of the previously mentioned materials
were purchased through amazon.com. Swagelok PTI-S-JS0-31BJ-BX transducers, along with
connecting cables, were purchased from Swagelok Austin (Austin, TX). Ashcroft KXF01100-
1/0BAR=M04FM1 transducers along with connecting cables were purchased from BriceBarclay
(Stafford, TX). Type 316 stainless steel female National Pipe Thread (NPT) solid tees and
Female British Standard Pipe Parallel (BSPP) solid tee consisting of carbon steel with anti-
corrosive plating were purchased from Discount Hydraulics (Philadelphia, PA). NW/KF 25
flange to male 1/2 inch NPT thread adapters and NW/KF 25 to 1 inch hose adapters were
comprised of 304 stainless steel and purchased from Ted Pella (Redding, CA) along with an
aluminum NW/KF 25 flange to 1/2 inch or 5/8 inch hose adapters. Stainless steel worm gear
clamps (9/16 to 1-1/16 inch) and 1/2 inch Freeman Teflon tape were purchased through Global
Industrial (Buford, GA). KF 25 flange adapter to 1 inch male BSPP, aluminum toggle clamp
with cotter pin for flange size KF 25, and KF 25 stainless steel centering ring vacuum with
Viton® O-rings were purchased from Ideal Vacuum Products (Albuquerque, NM). Plastic
housing for the sensor case, light emitting diode (LEDs), USB A to B connector, button switch,
electronic spacers, protoboard, screw terminals, piezoelectric buzzer, and banana plug screw
connectors were available as stock materials during development.
Methods
All measurement units of pressure were converted to inches of Hg using
published conversion factors [13].
The sensor can be subcategorized into three major units: sensing, datalogging, and
alarm. These components are illustrated conceptually in Figure 1.

9
Figure 1. Graphical diagram of the sensing, datalogging, and alarming components of the
sensor. Figure is not to scale.
A. Sensing Component
1) The Ashcroft KXF01100-1/0BAR=M04FM1 transducer, identified by an oval in Figure
2, converts an applied pressure on its diaphragm ranging between -7.36 inches of Hg (-100 kPa)
of vacuum and atmosphere to a voltage between 0 and 10 direct current voltage (VDC) [14].
The transducer installed on the dental cart in Figure 2B was used during the simulated blocking
experimental setup. The Ashcroft transducers are threaded with 1/2 inch National Pipe Thread
Taper (NPT).

10
2) The Swagelok PTI-S-JS0-31BJ-BX transducer, identified by a square in Figure 2, was
constructed to use a voltage source of 14 to 30 VDC [15]. The Swagelok pressure transducer
measured -7.36 inches of Hg (-100 kPa) of vacuum to atmosphere and translated that pressure to
a range of 0 to 10 VDC as a signal output. The Swagelok used a male fitting of 1 inch BSPP
thread and attached to a pipe fitting of comparable female thread. While equal in performance,
the Ashcroft transducer was selected over for the Swagelok transducer in further validation of the
sensor as the former has a smaller footprint. Figure 2C illustrates the installation of the
Swagelok transducers on a dental chair.

11
Figure 2. A) Swagelok (square) and Ashcroft (oval) transducers. B) Installed Ashcroft pressure
transducers on the mobile dental cart for prototype sensor validation experiments.
C) End-use scenario installation of Swagelok pressure transducers on a dental chair.
3) A variety of fitting types were used to connect two transducers to the amalgam separator
and subsequently the inflow and outflow dental vacuum tubing. The fittings aligned each
B
A
C

12
transducer perpendicular using female-ended tees. Then each tee was connected in line with the
amalgam separator as well as the dental vacuum tubing using quick release K-F flange vacuum
adapters that were secured with Viton®
O-rings and flange clamps. The fitting’s assembly is
graphically represented in the sensing component of Figure 1 and the configuration of each
transducer is illustrated in Figure 2.
B. Data logging component
The datalogging component converts the pressure transducer output to digital data
which is then stored on the SD card. Figure 3 presents the complete datalogging
component during various stages of assembly. This component consists of an Arduino
Uno Rev3 microcontroller, an Adafruit data logging shield, a 4 GB SD card, a data
collection start button, a power source, and a voltage divider.

13
Figure 3. The datalogging component of the sensor A) with the Adafruit Data Logging Shield
(square) and SD card (circle) disassembled, and B) fully assembled without the cover.
4) The Arduino Uno Rev3 microcontroller shown in Figure 4 is a multi-use programmable
microcontroller with digital input/output pins, analog inputs, onboard clock, and reset button. A
detailed diagram of the analog inputs and digital input/output pins are in Figure 14 located in
Appendix II: Circuit Diagram.
The Arduino microcontroller is programmed using a subset of the programming language
C++ and interfaces with the Arduino IDE software [16]. Within Appendix III: Program Flow
Chart, Figures 15 and 16 represents the flow of data collection from the program initialization
until all data is written onto the SD card. The figures show the program running the Arduino
conceptually and without the syntax of C++. The program begins with checking the SD card for
errors and waiting for an indication from the user to begin data collection. Once such indication
is made, the program instructs the Arduino to create a text file on the SD card and begin data
collection. Communication with the SD card is performed using the serial peripheral interface
B
A

14
(SPI) communication protocol. Another communication protocol standard employed is Inter-
Integrated Circuit (I2C) [17]. The I
2C communication protocol uses the analog input pins on the
Arduino board to read time values from the real-time clock (RTC) and link the digitally-
converted transducer readings to the exact time they were collected. The Analog-to-digital
Converter (ADC) modified transducer data is continuously paired with the time of data
collection and written to the newly created text file until the power is lost or the user resets the
Arduino.
Figure 4. The Arduino Uno microcontroller functions as central component of the datalogger.
This device controls the flow of information received from the pressure transducers and RTC,
activates the alarming components, and formats the output data to the SD card.

15
5) The Adafruit data logging shield, seen in Figure 5, provides an interface for the onboard
RTC and SD card slot on top of the Arduino microcontroller. In general, Adafruit shields are
expansions to the Arduino microcontroller that interface directly with the input/output and
analog pins. The direct link between the Adafruit shield and microcontroller allows the
transcription of time-stamped, raw pressure values onto the SD card. The addition of free and
open-source Arduino libraries allowed for the seamless integration of the shield into the sensor
source code.
Figure 5. Adafruit data logging shield with inserted SD card. The SD card saves data and time
values concatenated on a delimited string of data. The data logging shield also contains the RTC
which provides the Arduino with real-time values.
6) AC Adapter/Charger Power Supply for a Samsung PSCV420102A SyncMaster
LCD/TFT monitor was repurposed to supply power to the vacuum sensor. The maximum input
voltage for the power supply is 240 volts, which was converted into 14 VDC up to 3 amps. The
electrical conductivity of 14 voltage output was confirmed with a multi-meter after modifying
the plug connection to the Arduino.
16
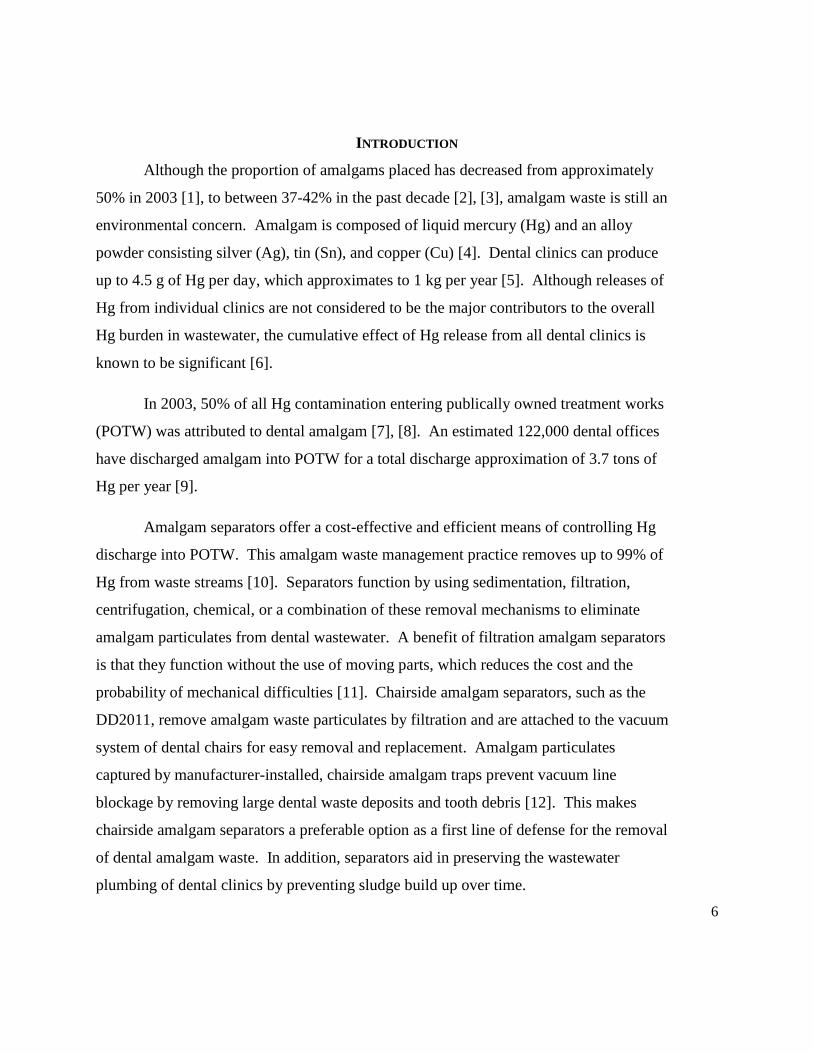
7) The voltage divider splits the input voltage into two output voltages of a desired ratio [18,
p. 61]. The addition of a voltage divider reduces the expected 0 to 10 input voltage signal
produced by the transducer to an Arduino compatible 0 to 5 voltage signal, Figure 6. For the
construction of this prototypic vacuum sensor, the desired ratio of input : output voltage was 2:1.
Figure 6. Voltage divider location on the Adafruit data logging shield. All references are made
from top to bottom. The top brown wire and screw terminal connects the pressure transducers
with the 14 volts in direct current power supply. The pair of resistors (oval), and blue wire
(orange star) provides the 2:1 voltage division for the inflow transducer to the Arudino’s Analog
Pin 1. The bottom pair of transducers (arrow), the third screw terminal, and grey wire provides
the 2:1 voltage division for the outflow transducer to the Arudino’s Analog Pin 2. The brown
wire at the bottom of the picture and the last screw terminal provides the electrical common
ground for the transducer.
C. Alarm Component
Audible differential pressure set points were determined with reference to the
International Organization of Standardization compliance flow rate requirement of
1L/min. A liter of water evacuated within 1 min, 1.5 min, and greater than 2 min were
categorized as normal, warning, and critical states respectively. The recorded pressure
differentials for each alarm state were greater than -4.0 (normal), between -4.0 and -8.5
(warning), and less than -8.5 (critical) inches of Hg. The flow rate was constricted using
a regulator valve at the outflow port on the amalgam separator. Normal, warning, and
Bottom
Top

17
critical audible alarm differential pressure states correspond to green, yellow, and red visual
LEDs of the alarm component.
The audible aspect of the alarm was achieved by attaching a piezo buzzer to the
Arduino. Both the LEDs and the buzzer can be seen left of the start run button in Figure 7. The
buzzer was programed to sound when the critical LED illuminates. In addition, a function was
added to turn the alarm audible on and off by holding the start-run button for more than a second
during operation.
Figure 7. The buzzer (triangle), LEDs (rectangle) and start-run button (oval) elements of the
alarm component.
Transducer Calibration
Transducers were calibrated using a reference gauge over a range of pressure values at a
consistent vacuum flow. This was accomplished by creating the same set-up as seen in Figure 8,
which allowed for nearly the same pressure induced simultaneously on both the transducers and
reference gauge diaphragms. An Ashcroft gauge with a pressure range from 0 to -7.36 inches of

18
Hg (0 to -100 inches of H2O), henceforth referred to as Reference Gauge 1 (RG-1), was
used to infer the linear relationship between the transducer output and the vacuum
pressure. A 0 to -14.71 inches of Hg (0 to -200 inches of H2O) Ashcroft gauge,
henceforth referred to as Reference Gauge 2 (RG-2), served to validate RG-1. RG-2
ensured that RG-1 functioned adequately given that unusually high differences between
the two gauges would signify that one of the gauges was malfunctioning.
Once the calibration rig was operational, a flow constricting valve was
manipulated to allow for unobstructed flow and the vacuum pressure was increased to a
point just below -0.74 inches of Hg (-10 inches of H2O). The calibration setup is
presented in Figure 8. The vacuum pressure changed according to the adjustment of the
flow constricting valve. The recorded pressure ranges for RG-1 were -1.103 to -6.988
inches of Hg (-10 to -90 inches of H2O) and are recorded in Table 1 in Appendix IV:
Transducer Conversion Compared to RG-1. A linear regression analysis was conducted
to establish a relationship between the gauge pressure and the ADC conversion of the
transducer output. Specifically, the trendline information (slope and y intersect) of the
averaged values from three independent calibration curves generated with the reference
gauges were used to convert the ADC output to equivalent pressure values in inches of
Hg. For example, the inflow calibration curve (Figure 9) linear equation was calculated
as Y = 34.67 × X + 1059; therefore, the inches of Hg for the inflow ADC output equaled
(inflow – 1059) / 34.67.

19
Figure 8. Calibration rig setup of the Swagelok pressure transducers (rectangle) with RG-1
(hexagon). The Ashcroft and Swagelok transducer calibrations were completed in an equivalent
manner.
Data Resolution
The ADC of the Arduino has a 10-bit ADC which equates to 1024 states that can be used
to digitally approximate an analog signal. For example, an ADC output of 0, 550, or 1023 is
equivalent 0, 2.68, or 5 VDC, respectively. Given that the pressure ranges for both transducers
are atmosphere to -7.36 inches of Hg, the resolution of the ADC can be calculated to be 4.88
(millivolt / state) × 7.36 (inches of Hg) / 5 volts = 0.00718 inches of Hg per state. The previously
mentioned equation does not factor in noise from electrical or fluidic sources; thus, a calibration
file was required to create a reliable relationship between the transducer output and pressure
values.

20
Data Code and Collection
The Arduino collects date information from the RTC and creates text files on the
SD card titled with the date and time that the experiment began. Inside this text file, the
Arduino assigns the date and time on the first line in ISO 8601 format [19]. The pressure
signals from the inflow and outflow transducers are converted into a digital step range
from 0 to 1023 by the microcontroller, and paired with the time point registered by the
RTC presented on the Adafruit data logger. The inflow and outflow signal ranges along
with the corresponding time points are appended to a delimited table in a text file located
on the SD card. Data collection continues until the user unplugs the power supply to the
Arduino or the Arduino’s reset button is pressed.
Amalgam Separator Obstruction Simulation
A DD2011 chairside amalgam separator obtained from Dennis J. Duel Associates,
Incorporated (Chicago, IL) was installed on the mobile dental cart (AMC-20CE, Aseptico
Inc., Woodinville, WA, USA) as shown in Figure 2B. To test the prototypic vacuum
sensor, an obstruction was simulated by installing a flow constricting valve to the outflow
port on the amalgam separator. Narrowing the outflow port cross-sectional area on the
DD2011 chairside amalgam separator allowed for the controlled resistance to be applied
across the transducer diaphragm over preset angles. These angles were determined using
a protractor for the following restriction positions: 0°, 15°, 30°, 45°, 55°, and 60°. The
90° position was not tested because it completely constricted fluid flow. Differential
pressure values were obtained for the aforementioned restriction angles. The
experimental procedure outlined below served to mimic a natural obstruction in a
controlled manner.
A high vacuum evacuation device was used to flush a liter of tap water through
the system. The time that flushing began and ended was recorded. The high vacuum
evacuation device valve remained open until all water was collected in a vessel before

21
placing it in its holder. The ADC output from four independent trials for each obstruction
position were converted into pressure readings using the linear regression equation generated
generated from the data presented in Figure 9.
RESULTS
Calibration
The relationship between the pressure induced on each of the transducers and values read
by the ADC on the Arduino was delineated during the calibration of the sensor. The data for the
calibrations between the Ashcroft and Swagelok pressure transducer with RG-1 are presented in
Figure 9. From this data, the transducers are assumed to have equivalent performance based
upon similar pressure output values and a p > 0.05. The more manageable Ashcroft transducers
were chosen for the remaining experimental studies that validated the performance of the
vacuum sensor in a practical and relevant scenario.
- 8- 6- 4- 20
7 0 0
8 0 0
9 0 0
1 0 0 0
1 1 0 0
i n c h e s o f H g
Ar
du
ni
o A
DC
O
ut
pu
t
A s h c r o f t I n f l o w
A s h c r o f t O u t f l o w
S w a g e l o c k I n f l o w
S w a g e l o c k O u t f l o w
Figure 9. Linear regression analysis of Ashcroft (filled shapes) and Swagelok transducers
(unfilled shapes) calibration using RG-1. The R2 value for each curve was greater than 0.9997.

22
Within an isolated system, the ADC conversion of the Ashcroft transducer output
was compared with the pressure readings for each reference gauge as seen in Figure 10.
Since both reference gauges outputted similar values, it was confirmed that the reference
gauges’ calibration were still valid, p > 0.05.
- 7- 6- 5- 4- 3- 2
7 0 0
8 0 0
9 0 0
1 0 0 0
1 1 0 0
i n c h e s o f H g
Ar
du
ni
o A
DC
O
ut
pu
t
G a u g e 1 I n f l o w
G a u g e 1 O u t f l o w
G a u g e 2 I n f l o w
G a u g e 2 O u t f l o w
Figure 10. Comparison of RG-1 and RG-2 versus Ashcroft transducer to illustrate a negligible
difference in the output values for both reference gauges.
Sensor Detection of Simulated Obstructions
To test the function of the vacuum sensor setup, hardware, and software, a flow
constricting valve was attached to the outflow port of the DD2011 chairside amalgam
separator located on a mobile dental cart. Changes in differential pressure, the difference
between the outflow and inflow pressure values, were first tested by introducing one liter
of water into the system with a completely open constricting valve.
An illustration in differential pressure for an unobstructed separator is shown in
Figure 11. The introduction of water into the vacuum sensing system can be divided into
four discreet stages. Stage one represents the initial pressure drop when water was
introduced to the system. In stage two, the pressure drop had a characteristic inflection

23
point, which was usually approximately -4.0 inches of Hg. Stage three was denoted by a rise in
pressure drop from -4.0 to 0 inches of Hg. Lastly, stage four corresponded to a stationary state
where the inflow and outflow pressure readings stabilized and returned to baseline levels.
1 0 2 0 3 0 4 0 5 0 6 0
- 4
- 3
- 2
- 1
0
1
T i m e ( s )
Di
ff
er
en
ti
al
P
re
ss
ur
e
(i
nc
he
s
of
H
g)
Figure 11. Stages of differential pressure after introducing water into an unobstructed DD2011
chairside amalgam separator using Ashcroft transducers.
To simulate DD2011 chairside separator blockage, a constricting valve was positioned
between 0° and 90° where 0° corresponded to a fully open valve and 90° corresponded to a
closed valve. When water was first introduced into the vacuum lines, the maximum resistance for
flow across the filter was reached. Reduction in the differential pressure as a function of flow
restriction was not initially apparent until the separator’s cross-sectional area was restricted to
Stage 1
Stage 2 Stage 3
Stage 4

24
the 45° position. The magnitude and consistent decline in the differential pressure
throughout the data collection timeframe for measured obstruction positions resulted in a
distinct output trend identifying a partial (45°) and total flow restriction angle (60°),
Figure 12. As water exits the separator, the water flow resistance decreased as the
pressure on the transducers’ membrane was reduced. This observation was apparent in
all valve closure positions excluding 60°. The obstruction at 60° maintained a high
membrane resistance, which prevented the inflow and outflow pressure readings from
equalizing. For all flow restriction conditions, stage four baseline levels were reached
earlier in unobstructed rather than obstructed amalgam separator.
0 5 0 1 0 0 1 5 0 2 0 0
- 1 5
- 1 0
- 5
0
5
T i m e ( s )
Di
ff
er
en
ti
al
P
re
ss
ur
e (
in
ch
es
o
f
Hg
)
0 °
1 5 °
3 0 °
4 5 °
5 5 °
6 0 °
Figure 12. Ashcroft differential pressure comparison of 0° (blue), 15° (red), 30° (green), 45°
(purple), 55° (black), and 60° (orange) positions during stage 3 and 4 of the pressure drop. The
values given represent the mean ± 0.6 inches of Hg of four independent replicates.
The increased resistance across the amalgam separator was proportional to the
forced reduction in flow rate. At or before the 30° valve position, the differential

25
pressure change was negligible but the flow rate gradually declined to 20% of an unobstructed
flow rate, Figure 13. The differential pressure doubled when water flow was restricted by
closing the valve between positions 45° and 60°, reducing the flow rate by 80% compared to
unobstructed flow (Figure 13). These trends infer an inverse relationship between the
differential pressure and flow rate.
0 5 1 0 1 5
- 1 5
- 1 0
- 5
0
F l o w R a t e ( L / m i n )
Ma
x.
D
if
fe
re
nt
ia
l
Pr
es
su
re
(
in
ch
es
o
f
Hg
)
0 °
1 5 °
3 0 °
4 5 °
5 5 °
6 0 °
Figure 13. Obstructed flow rate at 0° (blue), 15° (red), 30° (green), 45° (purple), 55° (black),
and 60° (orange) positions as a function of differential pressure ± 1.0 inches of Hg.
Varying flow rates for a liter of water to pass through the amalgam separator
corresponded to the built-in audible and visual differential pressure set points. The LED visual
alarm switched from normal to warning mode as the differential pressure decreased beyond -4.0
inches of Hg during and immediately after flushing one liter of water through the system at a

26
restriction angle of 45°. After activating the high evacuation device, the warning LED was
succeeded by the critical (differential pressure less than -8.5 inches of Hg) LED upon suctioning
water through the system at an impediment angle position of 55°. The critical LED remained
illuminated and a continuous audible alarm sounded since the differential pressure remained
outside the preset pressure limit when the water flow was restricted to a 60° position. Together,
these data demonstrate proof-of-principle that an effective, sensitive vacuum sensor can be
constructed to monitor flow rates and differential pressure of the DD2011 chairside amalgam
separator.
Conclusion
Commercially available amalgam separator units lack in-situ performance
monitoring and suitable replacement notification mechanisms. The purpose of this
research was to construct a prototypic vacuum sensor that continuously monitored
pressure differentials and triggered audible and visual alarms when a large differential
indicated excessive amalgam separator obstruction. This approach is based upon the
principle that solid particulate amalgam waste and dental debris accumulate and block the
movement of water through the filtration medium thereby reducing the flow rate. By
monitoring and recording flow rate data, chairside amalgam separators will be used to its
effective lifespan, which is predicted to save time and be more cost effective. In this
report the design, calibration, and validation of a prototypic vacuum sensor is described.
Two pressure transducers, Ashcroft and Swagelok, were shown to measure pressure
across the amalgam separator and provided adequate sensitivity during calibration
testing. However, the Ashcroft transducers were chosen for subsequent vacuum sensor
validation tests due to their smaller footprint. To simulate particulate and dental debris
obstruction in vacuum lines, a flow constricting valve was situated at the outflow port of
a DD2011 chairside amalgam separator installed on a mobile dental cart. The vacuum
sensor successfully detected and recorded simulated obstruction, which was demonstrated
by the inverse relationship between flow rate and pressure differential as the flow

27
constricting valve closed. In addition, the datalogging and alarm sensing components were
found to function as programmed with both an audible and visual alarm when the flow
obstruction exceeded designated warning and critical levels.
Together, these data provided evidence for the successful design and execution of a
vacuum sensing unit that has applications like dental wastewater effluent monitoring. It is
anticipated that this research will lead to the development of more efficient and effective dental
amalgam separator systems that include monitoring and alarm features. The availability and
deployment of second generation dental amalgam separators that have self-contained monitoring
and alert systems will improve environmental compliance efforts ahead of the EPA proposed
ruling on management of dental amalgam waste.
MILITARY SIGNIFICANCE
To further support nationwide Hg abatement efforts, the Navy issued Bureau of Medicine
and Surgery (BUMED) instruction 6260.30 mandates the use of amalgam separator systems in
dental treatment facilities. However, with more stringent dental amalgam waste regulation on
the horizon, it has become necessary to maximize the full potential of amalgam separator
systems. This includes improving filtration efficiency and utilizing separators to their maximum
effective lifespan. Therefore, the Navy has addressed the latter of these issues through
development of a prototypic vacuum sensor that can monitor and detect differential pressure
across chairside amalgam separators. The sensor alerts personnel if the suction force becomes
substandard. This technology is expected to help all military branches by reducing the financial
burden associated with replacing amalgam separators according to manufacturer’s assumed
versus observed unit lifespan. The sensor also has potential use in other applications that require
vacuum line monitoring.
FUTURE DEVELOPMENT
The development of a vacuum sensor outfitted with a datalogging unit and alarm feature
is an excellent initial effort to improve management of dental amalgam separator systems. While

28
the sensor described in this study has certainly demonstrated its functionality under ideal test
conditions, additional experiments are necessary to determine if it can perform under more
strenuous laboratory conditions as well as in the clinic. In upcoming studies, this prototype will
be subjected to dental wastewater that contains an appreciable amount of dental amalgam waste
and dental debris. It is expected that the effective lifetime of DD2011 chairside amalgam
separators will be better delineated by introducing the sensor into a more complex test
environment. Deployment of this sensor prototype in the clinic will undoubtedly bring to light
important functional and executional issues that cannot be identified by laboratory
experimentation. Additional research will be performed to lower costs associated with sensor
construction, including testing flow switches as an alternative to pressure transducers. Further,
an ADC with substantially greater accuracy and a more user-friendly interface could be
introduced into the datalogging component. The use of a more precise ADC, which would
supersede the Arduino’s onboard ADC, may give more frequent and accurate sampling of
transducer outputs. Such an improvement could potentially allow for more detailed analysis of
amalgam separator functionality. Additionally, an improved user interface may reduce
computing difficulties and unforeseen complications with data retrieval. The possibilities for
additional applications that stem from this technology are numerous and will positively impact
both the military and public sectors.

29
Appendix I: TERMINOLOGY AND WORKING DEFINITIONS
This section briefly explains computational science and engineering terminology
necessary to understand the sensor’s design and function.
Inches of Hg refers to a pressure unit. At 32ºF, the pressure induced on the bottom of a 1
inch Hg column is equivalent to 1 inch of Hg in pressure.
SPI refers to Serial Peripheral Interface which is a non-standardized communication
method between electronic devices. Generally, a device that uses SPI will have a pin
dedicated to communicating with another device, a pin dedicated to listening to that
device, a clock signal to keep pace for the data transfer, and a pin which turns on and off
the communication.
I2C refers to Inter-Integrated Circuit, a communication protocol licensed by NXP
Semiconductors. The protocol allows for many devices to communicate across two lines
by using an address system maintained by NXP Semiconductors.
Transducers are devices that convert some physical phenomena to an electrical signal of a
predefined range. The electrical signal used can be a current or a voltage in reference to a
common ground. The range of data is usually continuous in the analog fashion.
VDC refers to direct-current voltage.
VAC refers to voltage with alternating current.
GB refers to a gigabyte of data.
SD refers to a memory card that uses solid-state storage.
FAT16 and FAT32 refer to types of memory storage present on a SD card.
I/O is an alias of the external inputs and outputs of an integrated circuit or computer.
A data string is a series of characters that is manipulated by a computer program. These
characters can represent words, sentences, numbers, and anything else which can be
typed on a keyboard.

30
BSPP refers to British Standard Pipe Parallel which is a type of threading used in pipe
fittings. These fittings are defined in imperial units and correspond to the internal
diameter of a female-end fitting.
NPT refers to the National Pipe Thread Taper, which is another type of threading used in
pipe fittings. These fittings are also defined in Imperial units and correspond to the
internal diameter of the female-end fitting. The threading in the fittings is tapered,
meaning that there is an angle in the threading converging away from the opening.
Arduino IDE refers to the version 1.6.4 of the Arduino internal development
environment. The IDE is used to create and load user created programs onto the Arduino
microcontroller connected with an USB A to USB B cord. The Arduino IDE also
provides a serial monitor to a connected Arduino microcontroller to transmit readable
messages to and from a computer.
Real-time clock (RTC) is an integrated circuit that keeps a running clock, which
corresponds to the date and time one would find on a wall clock and calendar. RTCs are
usually paired with a rechargeable battery to power the circuit when the main power
supply is cut off.
Analog-to-digital converter (ADC) refers to a component that converts an analog
electrical signal to a digital signal representing a range of natural numbers. The length of
this range is usually in a power of 2, such as 1024, minus any offset due to design
limitations.

31
Appendix II: CIRCUIT DIAGRAM
Figure 14: Sensor circuit diagram. This diagram is not to scale. Electrical pins with an “X” were
not used. VCC: Voltage Common Connection. GND: common electrical ground.
I2C communication: Serial Clock Line (SCL), Serial Data Line (SDA), Analog_Pins_4, and 5.
SPI communication: Chip Select (CS), Slave Select (SS), Master Out Slave In (MOSI), Master
In Slave Out (MISO), and Cloak (CLK). The inflow and outflow transducers are represented
with the connections Pressure_Signal, Voltage_In, and Ground.

32
Appendix III: PROGRAM FLOW CHART
Figure 15. Initialization portion of the sensor program shown conceptually. This portion of the
program will run once when the sensor is first powered and prepares the sensor to begin data
collection. The color legend to the right categorizes each step of the algorithm according to
function.

33
Figure 16. Functional diagram displaying the part of the program on the Arduino as it processes
incoming data, activates any necessary alarms, and transfers the data to the attached SD card.
This process continues looping until the reset button on the Arduino is pressed or the Arduino is
shut down. The color legend to the right categorizes each step of the algorithm according to
function.

34
Appendix IV: TRANSDUCER CONVERSION COMPARED TO RG-1
Analog-to-Digital Conversion of Pressure Transducer Output
Reference
Gauge
Output
(inches of
Hg)
Sampling Date
Average
Standard
Deviation 7/6/2015 7/8/2015 7/9/2015
Infl
ow
Ou
tflo
w
Infl
ow
Ou
tflo
w
Infl
ow
Ou
tflo
w
Infl
ow
Ou
tflo
w
Infl
ow
Ou
tflo
w
-1.103 1021 1002 1020 1001 1020 1001 1020.33 1001.33 0.19 0.19
-1.471 1008 990 1007 989 1006 989 1007.00 989.33 0.58 0.19
-1.839 994 978 996 976 994 975 994.67 976.33 1.02 0.69
-2.207 983 965 983 964 981 964 982.33 964.33 1.02 0.19
-2.574 971 952 969 952 967 950 969.00 951.33 1.15 1.02
-2.942 958 939 956 938 955 937 956.33 938.00 0.69 0.58
-3.310 946 928 945 926 943 925 944.67 926.33 1.07 0.69
-3.678 935 915 933 913 931 913 933.00 913.67 1.15 0.38
-4.045 921 903 919 901 919 901 919.67 901.67 0.38 0.38
-4.413 908 890 907 888 905 887 906.67 888.33 1.07 0.69
-4.781 895 877 893 875 891 874 893.00 875.33 1.15 0.69
-5.149 883 864 881 862 879 861 881.00 862.33 1.15 0.69
-5.517 870 851 862 849 867 849 866.33 849.67 2.71 0.38
-5.884 857 838 856 837 852 835 855.00 836.67 2.08 1.07
-6.252 843 824 843 824 841 823 842.33 823.67 1.02 0.51
-6.620 831 811 830 811 828 809 829.67 810.33 1.07 1.02
-6.988 816 798 815 797 815 797 815.33 797.33 0.19 0.19
Table 1. RG-1 vs Ashcroft Transducer data retrieved during three sets of calibration testing.

35
REFERENCES
[1] J. F. Risher, “Elemental Mercury and Inorganic Mercury Compounds: Human Health
Aspects.” World Health Organization, 2003.
[2] M. G. Rasines Alcaraz, A. Veitz-Keenan, P. Sahrmann, P. R. Schmidlin, D. Davis, and Z.
Iheozor-Ejiofor, “Direct composite resin fillings versus amalgam fillings for permanent or
adult posterior teeth,” in Cochrane Database of Systematic Reviews, The Cochrane
Collaboration, Ed. Chichester, UK: John Wiley & Sons, Ltd, 2014.
[3] J. D. Overton and D. J. Sullivan, “Early Failure of Class II Resin Composite Versus Class II
Amalgam Restorations Placed by Dental Students,” J. Dent. Educ., vol. 76, no. 3, pp. 338–
340, Mar. 2012.
[4] U.S. Food and Drug Administration, “About Dental Amalgam Fillings,” www.fda.gov, 10-
Feb-2015. [Online]. Available:
http://www.fda.gov/MedicalDevices/ProductsandMedicalProcedures/DentalProducts/Denta
lAmalgam/ucm171094.htm. [Accessed: 24-Jul-2015].
[5] J. L. Drummond, M. D. Cailas, and K. Croke, “Mercury Generation Potential from Dental
Waste Amalgam,” J. Dent., vol. 31, no. 7, pp. 493–501, Sep. 2003.
[6] X. Zhao, K. J. Rockne, J. L. Drummond, R. K. Hurley, C. W. Shade, and R. J. Hudson,
“Characterization of Methyl mercury in Dental Wastewater and Correlation with Sulfate-
reducing Bacterial DNA,” Env. Sci Technol, vol. 42, no. 8, pp. 2780–6, Apr. 2008.
[7] “Effluent Limitations Guidelines and Standards for the Dental Category.” Environmental
Protection Agency, Sep-2014.
[8] “Dental Effluent Guidelines,” water.epa.gov, 25-Feb-2015. [Online]. Available:
http://water.epa.gov/scitech/wastetech/guide/dental/index.cfm. [Accessed: 15-Sep-2015].
[9] “Mercury in Dental Amalgam,” www.epa.gov, 29-Dec-2014. [Online]. Available:
http://www.epa.gov/mercury/dentalamalgam.html. [Accessed: 22-Jul-2015].
[10] B. Muhamedagic, L. Muhamedagic, and I. Masic, “Dental Office Waste - Public Health and
Ecological Risk,” Mater Sociomed, vol. 21, no. 1, pp. 35–8, 2009.
[11] L. D. Hylander, A. Lindvall, and L. Gahnberg, “High Mercury Emissions from Dental
Clinics Despite Amalgam Separators,” Sci. Total Environ., vol. 362, no. 1–3, pp. 74–84,
Jun. 2006.
[12] J. L. Drummond, Y. Liu, T.-Y. Wu, and M. D. Cailas, “Particle Versus Mercury Removal
Efficiency of Amalgam Separators,” J. Dent., vol. 31, no. 1, pp. 51–58, Jan. 2003.
[13] “The International System of Units (SI) – Conversion Factors for General Use,” National
Institute of Standards and Technology, NIST Special Publication 1038, May 2006.
[14] “Ashcroft Instruments GmbH | PRODUKTE,” www.ashcroft.eu. [Online]. Available:
http://www.ashcroft.eu/english/products/produkte-include.html?pid=58. [Accessed: 13-
May-2015].
[15] Swagelok, “Industrial Pressure Transducers.” Swagelok Company, Apr-2011.
[16] “Getting Started with Arduino,” www.arduino.cc, 2015. [Online]. Available:
https://www.arduino.cc/en/Guide/HomePage. [Accessed: 22-Jul-2015].
[17] “UM10204 I2C-bus Specification and User Manual.” NXP Semiconductors, 04-Apr-2014.

36
[18] J. W. Nilsson and S. A. Riedel, Electric Circuits, 9th ed. Boston: Prentice Hall, 2011.
[19] “Date and Time Format - ISO 8601,” www.iso.org, 01-Dec-2004. [Online]. Available:
http://www.iso.org/iso/home/standards/iso8601.htm. [Accessed: 21-Jul-2015].