Embed Size (px)
Citation preview
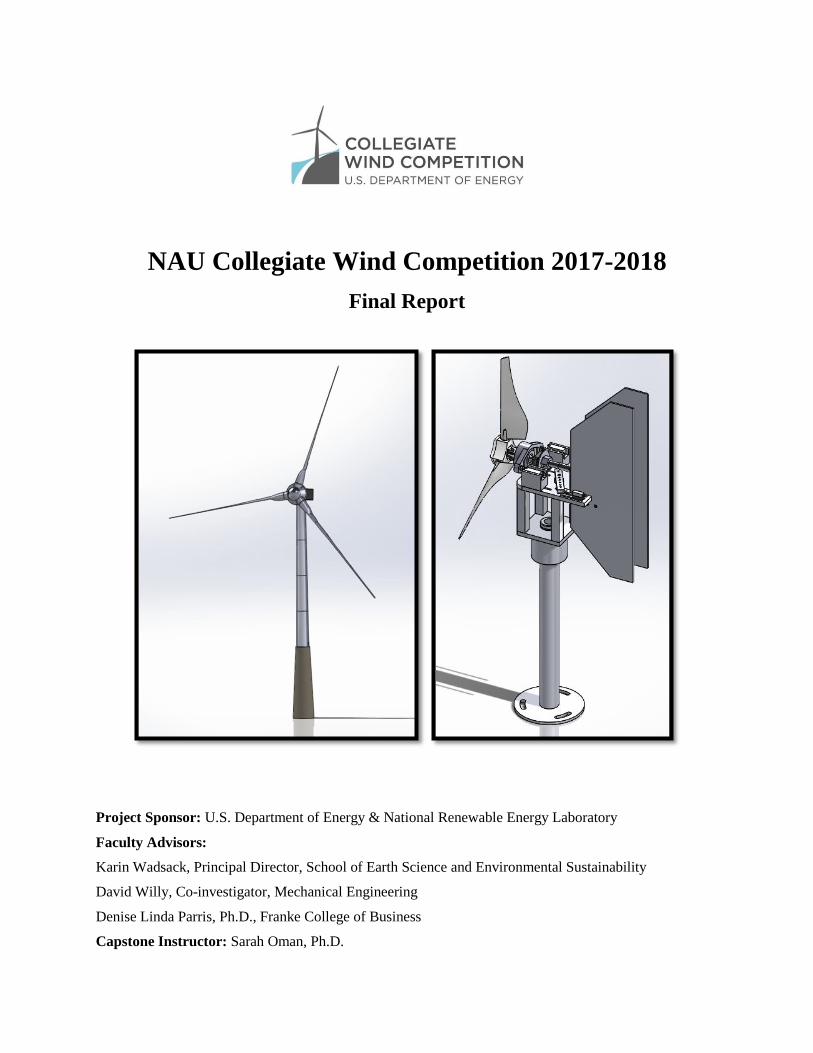
NAU Collegiate Wind Competition 2017-2018
Final Report
Project Sponsor: U.S. Department of Energy & National Renewable Energy Laboratory
Faculty Advisors:
Karin Wadsack, Principal Director, School of Earth Science and Environmental Sustainability
David Willy, Co-investigator, Mechanical Engineering
Denise Linda Parris, Ph.D., Franke College of Business
Capstone Instructor: Sarah Oman, Ph.D.
2
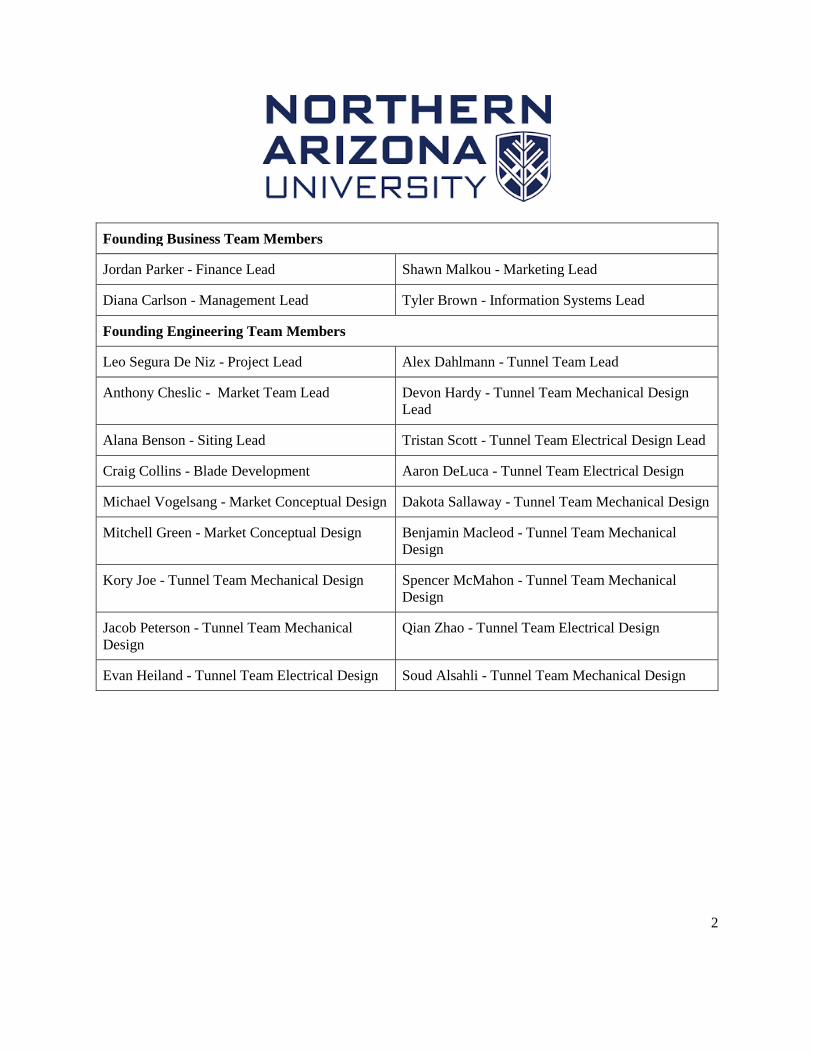
Founding Business Team Members
Jordan Parker - Finance Lead Shawn Malkou - Marketing Lead
Diana Carlson - Management Lead Tyler Brown - Information Systems Lead
Founding Engineering Team Members
Leo Segura De Niz - Project Lead Alex Dahlmann - Tunnel Team Lead
Anthony Cheslic - Market Team Lead Devon Hardy - Tunnel Team Mechanical Design
Lead
Alana Benson - Siting Lead Tristan Scott - Tunnel Team Electrical Design Lead
Craig Collins - Blade Development Aaron DeLuca - Tunnel Team Electrical Design
Michael Vogelsang - Market Conceptual Design Dakota Sallaway - Tunnel Team Mechanical Design
Mitchell Green - Market Conceptual Design Benjamin Macleod - Tunnel Team Mechanical
Design
Kory Joe - Tunnel Team Mechanical Design Spencer McMahon - Tunnel Team Mechanical
Design
Jacob Peterson - Tunnel Team Mechanical
Design
Qian Zhao - Tunnel Team Electrical Design
Evan Heiland - Tunnel Team Electrical Design Soud Alsahli - Tunnel Team Mechanical Design
3
EXECUTIVE SUMMARY
An electric vehicle (EV) is only as clean as the source that powers it. While EVs do not emit tailpipe
emissions, there are emissions associated with the source of electricity used to power them. By 2040,
there will be 530 million EVs worldwide. With the EV market on the rise there are concerns about the
increased demand for nonrenewable energy for charging these vehicles.
To help offset this problem, CleanerGrid is a wind farm developer who provides EV charging station
companies an alternative source of energy to offer their end consumers. Power produced by
CleanerGrid’s wind farms is sent to the grid and distributed. The business generates revenue by
establishing Power Purchase Agreements (PPAs) with EV charging station companies and selling excess
energy to the grid. The amount of energy used by the client is determined monthly and CleanerGrid will
receive payment based on the amount used.
CleanerGrid’s secondary focus is to develop vehicle to grid (V2G) technology. Three years after
CleanerGrid begins operations, a V2G technology license will be sold as a secondary source of revenue.
CleanerGrid is looking to obtain a $170 million loan with a 5% interest for 20 years, which will cover the
cost for the turbines, installation, and business capital costs for the start-up of the business and the first
wind farm.
CleanerGrid’s wind farms will be composed of 28 turbines with rated power of 3.5 MW each. A
prototype 3.5 MW wind turbine was designed to assess feasibility of the concept. The designed market
turbine features a hybrid concrete-steel tower, 70-meter blades, and a 120-meter tower. A test scale
turbine was designed and tested to operate is various wind conditions with a passive yaw and active blade
pitching system for optimum performance. Turbine performance and FEA analysis was completed for
both systems. Appropriate factors of safety were selected to ensure a reliable design. Mechanical and
electrical systems of the test turbine were tested proving a safe and dependable design.
4
Table of Contents
1. BUSINESS PLAN............................................................................................................................ 5 1.1 Business Overview ............................................................................................................................... 5 1.2 Market Opportunity ............................................................................................................................ 6
1.2.1 Market Growth .............................................................................................................................................. 6 1.2.2 Power Purchase Agreements (PPA) ....................................................................................................... 7 1.2.3 Business Competition.................................................................................................................................. 8
1.3 Management Team .............................................................................................................................. 8 1.3.1 Founding Team ............................................................................................................................................. 8 1.3.2 Full-time .......................................................................................................................................................... 8
1.4 Development and Operations .......................................................................................................... 9 1.4.1 Vehicle to Grid (V2G) Research and Development ........................................................................ 10
1.5 Financial Analysis ............................................................................................................................. 10 1.5.1 Start-up Financing ...................................................................................................................................... 10 1.5.2 Depreciation ................................................................................................................................................. 10 1.5.3 Income Statement ....................................................................................................................................... 10 1.5.4 Sales and Revenue ...................................................................................................................................... 10 1.5.5 Operating and Administration Expenses ............................................................................................. 11 1.5.6 Net Income ................................................................................................................................................... 11 1.5.7 Balance Sheet............................................................................................................................................... 11 1.5.8 Cash Flow ..................................................................................................................................................... 11
1.6 Risk Mitigation ................................................................................................................................... 11
2. TECHNICAL DESIGN ............................................................................................................... 12 2.1. Market Turbine .................................................................................................................................. 12
2.1.1. Deviations from Test Turbine ................................................................................................................ 12 2.2. Tunnel Turbine .................................................................................................................................. 13
2.2.1. Static Performance Analysis ................................................................................................................... 13 2.2.2. Mechanical Loads Analysis .................................................................................................................... 13 2.2.3. Yaw System ................................................................................................................................................. 17 2.2.4. Electrical Analysis ..................................................................................................................................... 17 2.2.5. Software Description ................................................................................................................................. 18 2.2.6. Testing Results ............................................................................................................................................ 18
3. APPENDIX A: BUSINESS FINANCIALS .................................................................................... 22
4. APPENDIX B: TUNNEL TURBINE DRAWINGS ..................................................................... 25
5
1. BUSINESS PLAN
1.1 Business Overview
CleanerGrid develops wind farms to provide a clean energy solution for the $75.7 billion Electric Vehicle
(EV) market, expected to grow to $127.7 billion dollars by 2020 [1]. The business makes money by
selling wind energy to charging stations companies through Power Purchase Agreements (PPAs) and
selling excess energy to utility companies. CleanerGrid’s purpose is to offer an alternative source of
energy. Cleanergird will do this by encouraging consumers to educate themselves about renewable
energy, drive investment in renewable energy to protect the environment and improve green infrastructure
within the EV market. The vision is to be the primary renewable energy provider within the electric
vehicle market.
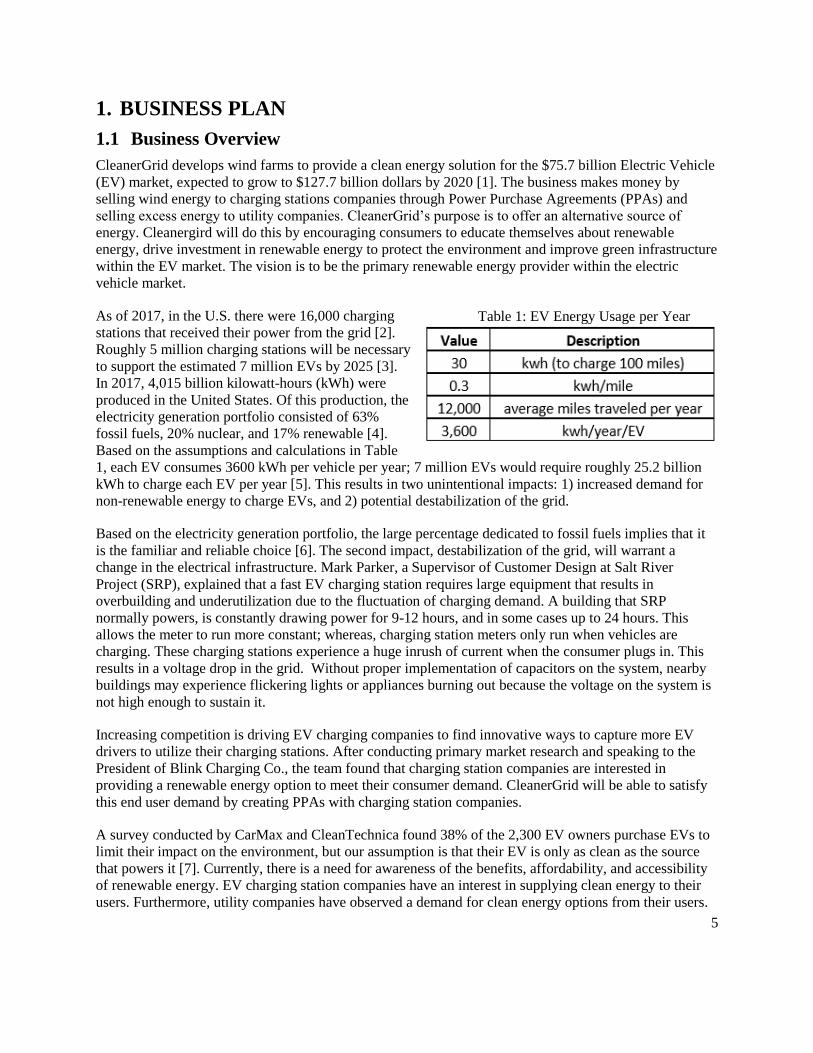
As of 2017, in the U.S. there were 16,000 charging
stations that received their power from the grid [2].
Roughly 5 million charging stations will be necessary
to support the estimated 7 million EVs by 2025 [3].
In 2017, 4,015 billion kilowatt-hours (kWh) were
produced in the United States. Of this production, the
electricity generation portfolio consisted of 63%
fossil fuels, 20% nuclear, and 17% renewable [4].
Based on the assumptions and calculations in Table
1, each EV consumes 3600 kWh per vehicle per year; 7 million EVs would require roughly 25.2 billion
kWh to charge each EV per year [5]. This results in two unintentional impacts: 1) increased demand for
non-renewable energy to charge EVs, and 2) potential destabilization of the grid.
Based on the electricity generation portfolio, the large percentage dedicated to fossil fuels implies that it
is the familiar and reliable choice [6]. The second impact, destabilization of the grid, will warrant a
change in the electrical infrastructure. Mark Parker, a Supervisor of Customer Design at Salt River
Project (SRP), explained that a fast EV charging station requires large equipment that results in
overbuilding and underutilization due to the fluctuation of charging demand. A building that SRP
normally powers, is constantly drawing power for 9-12 hours, and in some cases up to 24 hours. This
allows the meter to run more constant; whereas, charging station meters only run when vehicles are
charging. These charging stations experience a huge inrush of current when the consumer plugs in. This
results in a voltage drop in the grid. Without proper implementation of capacitors on the system, nearby
buildings may experience flickering lights or appliances burning out because the voltage on the system is
not high enough to sustain it.
Increasing competition is driving EV charging companies to find innovative ways to capture more EV
drivers to utilize their charging stations. After conducting primary market research and speaking to the
President of Blink Charging Co., the team found that charging station companies are interested in
providing a renewable energy option to meet their consumer demand. CleanerGrid will be able to satisfy
this end user demand by creating PPAs with charging station companies.
A survey conducted by CarMax and CleanTechnica found 38% of the 2,300 EV owners purchase EVs to
limit their impact on the environment, but our assumption is that their EV is only as clean as the source
that powers it [7]. Currently, there is a need for awareness of the benefits, affordability, and accessibility
of renewable energy. EV charging station companies have an interest in supplying clean energy to their
users. Furthermore, utility companies have observed a demand for clean energy options from their users.
Table 1: EV Energy Usage per Year
6
Many utility companies are diversifying their portfolio to include renewable energy sources to meet the
customer demand. According to the utility company, “SRP has established a goal that by 2020, SRP will
meet a target of 20 percent of its expected retail energy requirements with sustainable resources. Among
them are a diversified resource mix of wind, geothermal, large hydro and low-impact hydro, and solar
[8].” The increasing demand for energy results in the increasing use of non-renewable energy due to its
familiarity. Utility companies can meet their sustainability goals by purchasing excess power that is not
sold to the primary EV market, from CleanerGrid.
The want and need for renewable resources is intensifying and the solution is CleanerGrid. The first wind
farm project will begin in June of 2018 in West Texas. The wind farm will be composed of 28 turbines,
each with a rated power of 3.5 MW. The farm is expected to operate at 45% capacity producing a total of
386 Gigawatt-hours over a one-year period. Revenue will be generated by selling clean energy to
charging station companies through PPAs, and excess power to utility companies. CleanerGrid and the
customer will sign a PPA that specifies the rate for electricity over the span of the contract.
CleanerGrid has a secondary focus on developing a reliable vehicle to grid (V2G) connection to help
stabilize the grid. Research and development will begin in June 2018 and V2G technology will be
released in 2021. This technology will allow bidirectional power flow, thus allowing the vehicle to
discharge the energy stored in the battery, adding value to the parked vehicle. EV owners will then have
an asset in their vehicle, which due to its storage capacity can be used to support grids of varying scales.
V2G can also be associated with distributed generation systems to promote the integration of renewable
energy in the grid.
In 2022, CleanerGrid will expand, at the same location, to increase the production of energy by building a
second 98 MW power plant with utility scale wind turbines. The expansion will be completed in 2023;
this expansion will allow CleanerGrid to produce 772.6 Gigawatt-hours per year to meet current and
prospective charging station companies’ demand.
1.2 Market Opportunity
CleanerGrid conducted primary research by fielding a survey to EV owners and received 430
respondents. The survey found 63% of EV owners want to be environmentally friendly; however, they
have not considered the source of the electricity that fuels their vehicles.
1.2.1 Market Growth
According to the U.S. Department of Energy (DOE), “EVs, while operating in all electric mode, do not
produce tailpipe emissions. However, there are emissions associated with much of electricity production
in the United States [9].” The DOE states that 3.7 pounds of CO2 equivalent is generated per mile driven
in an EV based on its power source [9]. The primary purpose of an EV is to reduce pollution and
greenhouse gases. In today's marketplace, the goals of EVs regarding environmental improvements are
not being met to its full potential. According to the International Energy Agency, “Renewables only
account for 26% of electricity consumption of EVs while it’s expected to rise to 30% by 2022 [10].”
CleanerGrid is looking to work towards increasing this growth rate.
The EV market is growing at an astonishing rate, and Bloomberg predicts by 2040 there will be 530
million EV’s worldwide [11]. Based on driving and energy consumption averages, over 2.1 million GWh
is needed to power these electric vehicles per year. CleanerGrid will capitalize on this rapid growth by
being the first wind developer focused on powering EVs. According to Bloomberg’s New Energy
7
Finance’s annual long-term forecast of the world’s electric vehicle market, the EV market is growing
steadily and will continue to grow [11]. The Federal (up to $7,500) and State incentives for consumers to
purchase EV’s are encouraging growth. Every state has its own incentive programs for EV purchases and
as the market grows, the infrastructure needs to grow with it. CleanerGrid will be assisting with the
growing infrastructure by building an initial 98 MW wind farm and continuing to expand with market
growth. According to our primary market research, 63% of respondents are interested in a renewable
source of energy as an option to charge their vehicles. CleanerGrid is the solution to this problem by
partnering with EV companies to offer a green charging option to the end user.
In addition to sourcing more renewable energy for EVs, CleanerGrid is expecting to release new
technologies (such as the vehicle-to-grid technology by 2021 to car part manufacturers). About 85% of
respondents surveyed showed interest in being able have green energy sourced to their home. This is just
another reason that opens more opportunities in the industry for CleanerGrid to grow. CleanerGrid
doesn’t want to stop at providing clean energy to just car charging stations, we plan to expand across the
entire grid.
1.2.2 Power Purchase Agreements (PPA)
CleanerGrid will have PPAs with charging station companies to provide their stations with renewable
energy. Blink, one of the largest charging station providers in the United States, has already agreed to
working with us on a PPA. PPAs allow for CleanerGrid to generate and sell electricity to these clients for
a locked rate over the course of the next 20 years. We have decided to sell our renewable wind power at
premium rate of $0.06 per kWh per PPA agreement.
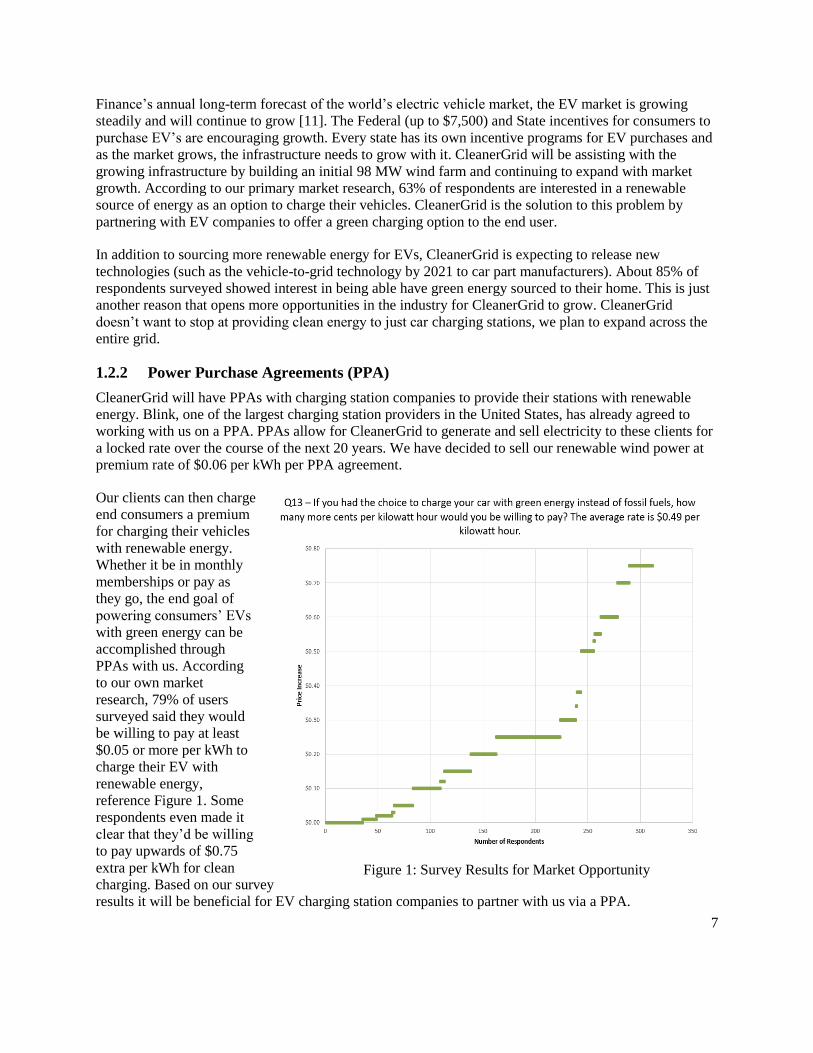
Our clients can then charge
end consumers a premium
for charging their vehicles
with renewable energy.
Whether it be in monthly
memberships or pay as
they go, the end goal of
powering consumers’ EVs
with green energy can be
accomplished through
PPAs with us. According
to our own market
research, 79% of users
surveyed said they would
be willing to pay at least
$0.05 or more per kWh to
charge their EV with
renewable energy,
reference Figure 1. Some
respondents even made it
clear that they’d be willing
to pay upwards of $0.75
extra per kWh for clean
charging. Based on our survey
results it will be beneficial for EV charging station companies to partner with us via a PPA.
Figure 1: Survey Results for Market Opportunity
8
1.2.3 Business Competition
CleanerGrid will not have any direct competition upon entry to the market. No charging company in the
market place is offering its consumers 100% renewable energy. The only two indirect competitors are
clean energy providers and traditional electricity providers.
Renewable energy developers and providers, such as industry leader NextEra, build wind farms to power
numerous different projects. NextEra and related companies do not source clean energy directly to EVs.
The direct competition expected in this specific field that the end consumers will be presented with are: to
power their vehicles with premium clean energy or to purchase cheaper, environmentally damaging
energy to power their EV. CleanerGrid provides a logical solution to help create a cleaner environment
while powering the ever growing EV market.
With the V2G market, car companies such as Nissan and Renault (with the help of energy supplier
companies) are in the early development stages of V2G technology. According to Ovo, one of the United
Kingdom’s largest energy suppliers, EV owners would need to purchase and install a special charger in
their home [12]. CleanerGrid strives to develop a user friendly (plug and play) experience that is far more
enticing to end users.
1.3 Management Team
1.3.1 Founding Team
Founding members have committed to work 10 hours per week for one year without compensation for a
combined total of 10% equity in the company, with no payment until year 2026. The founding members
will identify three full-time employees to take over the business model. The founding team will spend
their time overseeing operations and assisting the full-time employees as needed.
1.3.2 Full-time
CleanerGrid will work with the board of advisors to fill three full-time positions to run our wind farm(s)
and lead the V2G research. In 2019, the company will on-board one engineer and in 2020 will on-board
two additional engineers to assist with the research and development for V2G. Below is a list of necessary
employees for the future success of CleanerGrid with desired/acquired expertise.
Chief Executive Officer:
Entrepreneur
Visionary
Renewable energy expert
Great knowledge of EV’s
Knows how to establish partnerships
Chief Operating Officer:
Great understanding of the grid
Wind turbine experience
Visionary
EV knowledge
V2G knowledge
Engineer background

9
Lead Project Developer:
Leadership skills
Experience overseeing contractors on projects
Project Management experience
Wind turbine knowledge
Board of Directors
Our board will consist of 5 members each with one or two of the expertise listed below:
EV expert
Financial law operations
Wind/renewable energy
Lead engineer experience
Board of Advisors
Our board of advisors will consist of three professional connections. These individuals have agreed to be
available to give advice as necessary and to help hire our CEO and COO. The board members will receive
a combined total of 2% equity in our company with no payment until 2026.
Ross Taylor
Numerous years of experience in the wind industry
Has installed complex wind turbines
Experience installing turbines all around the world
Andy Kinard
President of Blink Charging stations
Extensive EV experience
15 years of experience working in the energy sector
Renewable energy experience
Jake Styacich
Strategic Communications and Policy Associate at EDTA
EV policy expert
Experience working with numerous EV companies
Always up to date on new EV information
1.4 Development and Operations
Each 98 MW wind farm will be composed of off-the-shelf 3.5 MW wind turbines; therefore, CleanerGrid
will not be responsible for any turbine manufacturing. CleanerGrid’s technical team will focus its early
efforts on site planning and site development. Once the first site is developed and CleanerGrid can afford
it, research and development operations will be focused around the vehicle-to-grid integration (V2G). For
these operations, CleanerGrid will be hiring full time technical employees.
CleanerGrid’s service distribution will operate on a business-to-business (B2B) basis. The company will
generate energy by use of 98 MW wind farms and sell the energy to EV charging station companies and
excess energy to the grid. Technical constraints to implementation include areas of the country where we
10
can’t easily deliver electricity from our initial wind farm in West Texas due to existing infrastructure.
This technical constraint is not a concern for CleanerGrid because we will be using virtual PPAs to sell
our energy.
1.4.1 Vehicle to Grid (V2G) Research and Development
The wind farm will work in conjunction with a vehicle-to-grid (V2G) charging system to operate in an
islanded mode. The system will rely on using electric vehicles plugged into charging stations or
specialized outlets as a form of battery storage that can hold power and then return it to the grid when told
to via a signal from the power company. To study the application of a V2G system on a microgrid, a
preprogrammed example of a V2G microgrid in Simulink was examined [13].
1.5 Financial Analysis
CleanerGrid made assumptions for portions of the financial statements based upon a financial model run
through the System Advisory Model (SAM) [14].
1.5.1 Start-up Financing
CleanerGrid will be seeking a $170 million government backed loan in 2018. American Wind Energy
Association (AWEA), explains that the “cost of the wind turbine is the single largest cost component, and
can make up 70% or more of the entire cost of a land-based wind project. The cost of installation, such as
construction, makes up the remaining capital costs [15].” Therefore, the amount of the loan will cover the
turbine costs, development, installation, and business capital costs. The interest on the loan is 5% with a
term of 20 years. This results in yearly payment of $13,463,088. We acquire a second loan in 2022 with
the same terms and conditions.
1.5.2 Depreciation
The company has decided to use a mixed allocation strategy for depreciation. The reason for this strategy
was determined by the diverse assets that CleanerGrid owns. The depreciation allocation is as follows: 90
percent to 5-year MACRS, 1.5 percent to 15 year MACRS, 2.5 percent to 15 year straight line, and 3
percent to 20 year straight line. Note that the depreciation allocation sums to 97 percent. The remaining 3
percent are due to non-depreciable assets.
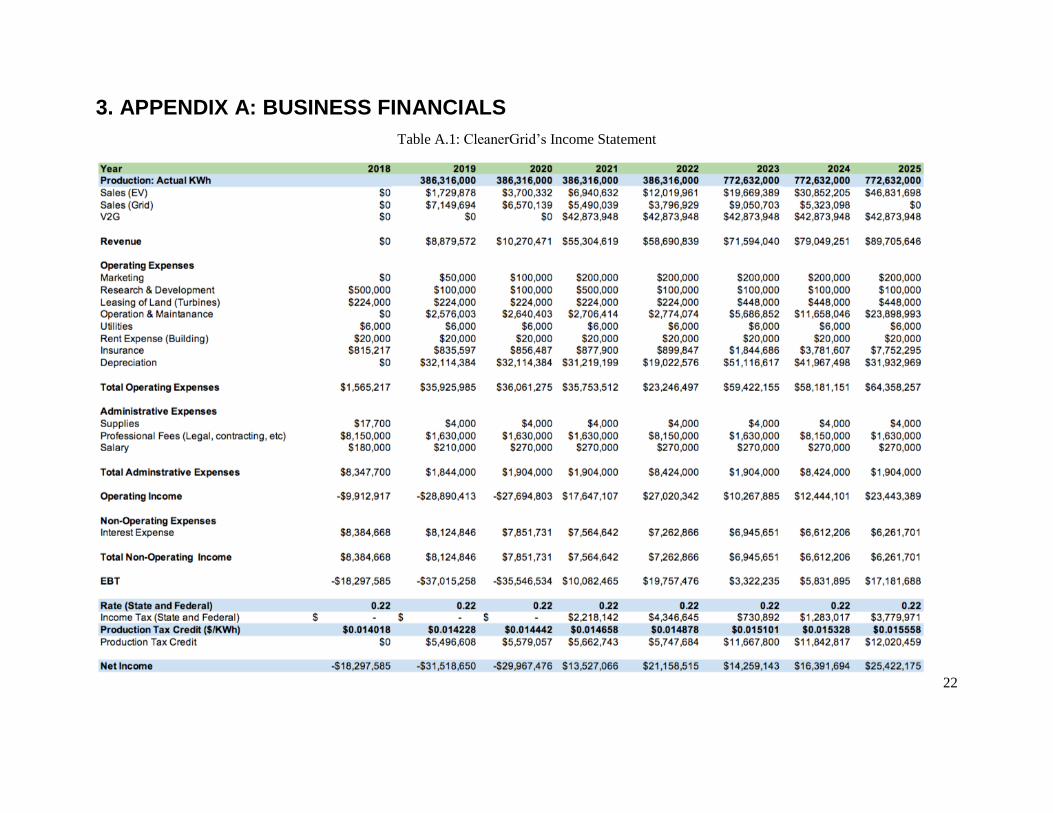
1.5.3 Income Statement
Reference Appendix A, Table A.1.
1.5.4 Sales and Revenue
Sales is separated into two categories: sales (EV) and sales (grid). A portion of the actual energy produced
is allocated to sales in each category. Our sales assumption (EV) is determined by the amount of kWh
needed for users who choose to purchase wind energy while charging publicly. Then, sales (grid) is
determined by the difference of the production of actual kWh and sales allocated to EV. The wind farm
will be constructed in 2018; therefore, 2019 will be the first year revenue is captured.
In 2021, the V2G technology will be sold to automakers through licensing. An assumption was made that
15% of EV purchases would have the option of the V2G technology incorporated in the vehicle.
CleanerGrid valued the V2G technology license at $435 per vehicle which results in roughly $42.8
million at 15% of sales for 2021.
11
1.5.5 Operating and Administration Expenses
Expenses for CleanerGrid are based by year and have a direct correlation with the increase of revenue
streams (Expansion and V2G).
1.5.6 Net Income
CleanerGrid will experience a positive net income in the year 2021. Net income will consider federal and
state taxes along with the production tax credit. After the year 2021, the net income will increase then
decrease in 2023 due to the expansion. Net income will increase thereafter.
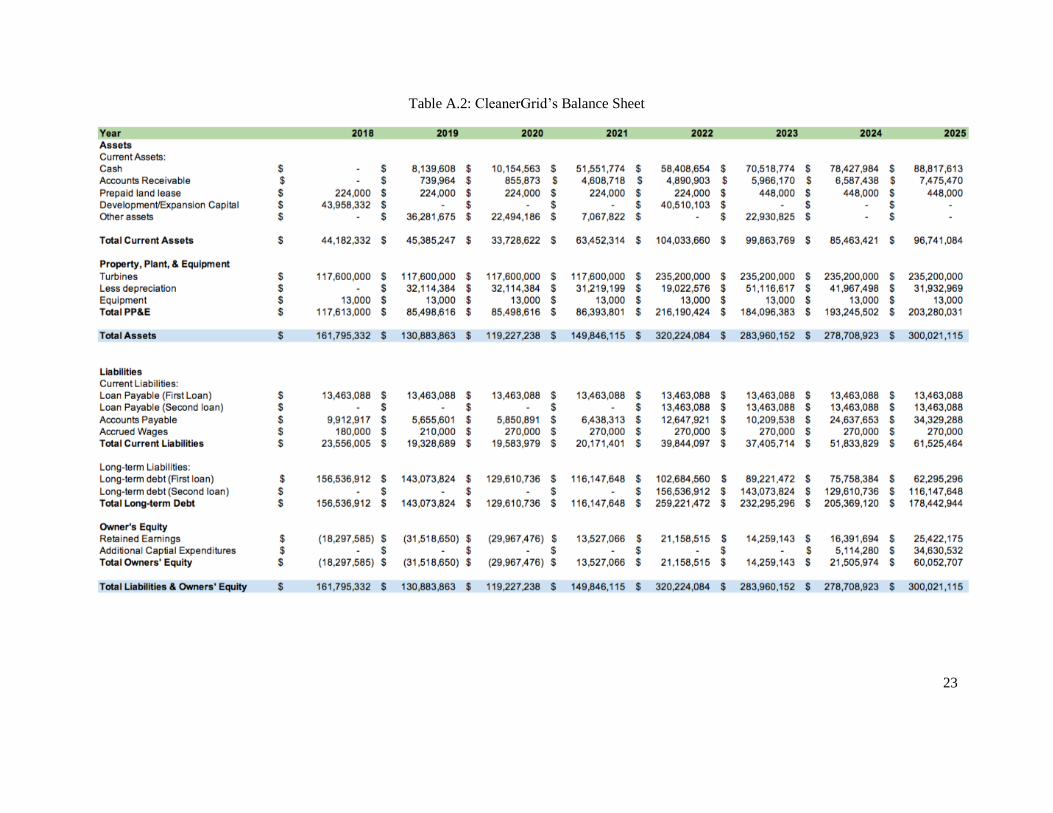
1.5.7 Balance Sheet
CleanerGrid projected financial balance sheets for 2018 to 2025, reference Appendix A, Table A.2.
Development and expansion capital is a current asset necessary for contracting, land fees, excavation, and
closing costs. Other assets include bond issuance, bonuses and reserve accounts. The property, plant and
equipment (PP&E) is made up of turbines, depreciation and equipment. The cost per turbine was $1,200
per kW. This cost comes to $4,200,000 per turbine. Since we have 28 turbines this results in the total cost
being $117.6 million. Equipment accounts for business technology including computers, software and
software updates, and technology improvements.
Liabilities are made up of current and long-term liabilities. Current liabilities are comprised of loans
payable, accounts payable, and accrued wages. Long-term liabilities accounts for our long-term debt.
Owners’ equity is comprised of retained earnings and additional capital expenditures. Retained earnings
becomes positive in 2021 and can be reinvested to pay off debt or for research and development. Money
allocated to additional capital expenditures is used for upgrades in our assets and other reinvestments into
the business. This equity is not recognized until 2024 because the company’s focus was in expansion and
development.
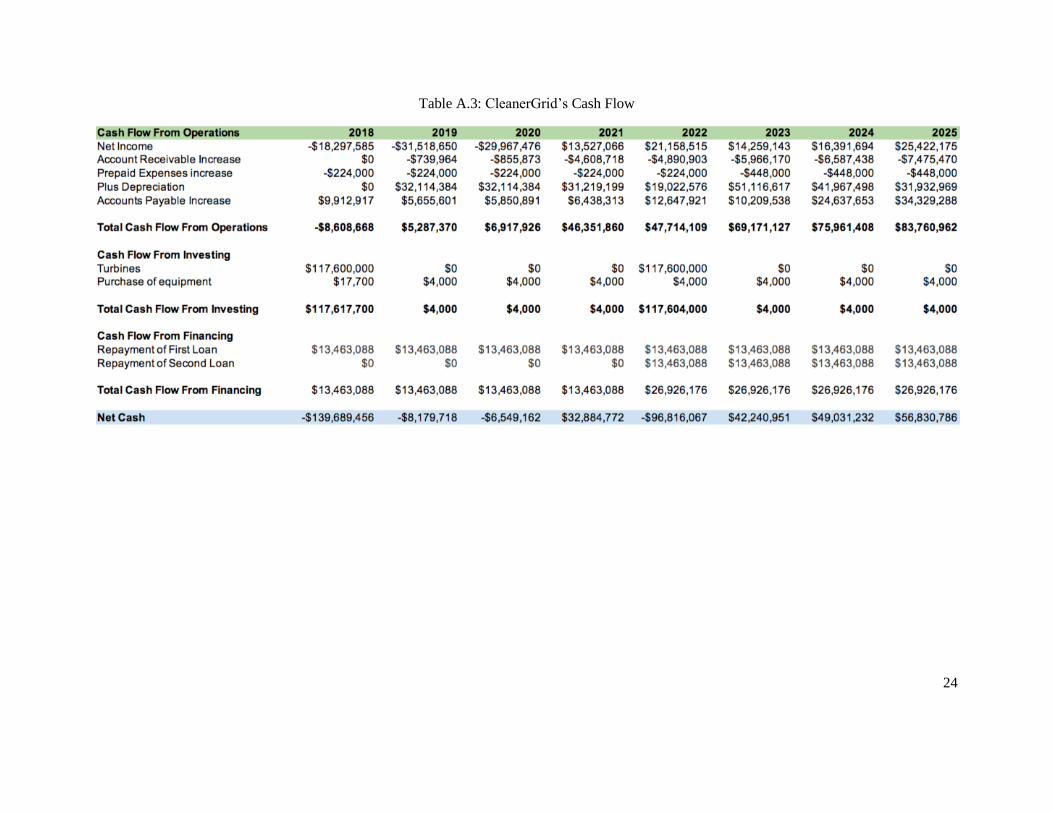
1.5.8 Cash Flow
Positive net cash is first observed in 2023. This is because the total cash flow from operations outweighs
the total cash flow from investing and financing. Reference Appendix A, Table A.3 for CleanerGrid’s
cash flow.
1.6 Risk Mitigation
The largest risk factor is the capital cost associated with building a wind farm. To mitigate this risk, we
have formed PPAs with EV charging companies before construction begins to guarantee revenue upon
completion.
CleanerGrid will reduce environmental impacts by continuously performing the due diligence to satisfy
environmental, ecological, and societal assessments.
We are taking grid demand into consideration, by doing this we are ensuring our excess power does not
go to waste. The business will adjust prices accordingly based on the grid demand. To mitigate this risk,
we will be continually seeking EV companies to sign PPA’s with, which will lower our excess energy
available.
12
2. TECHNICAL DESIGN
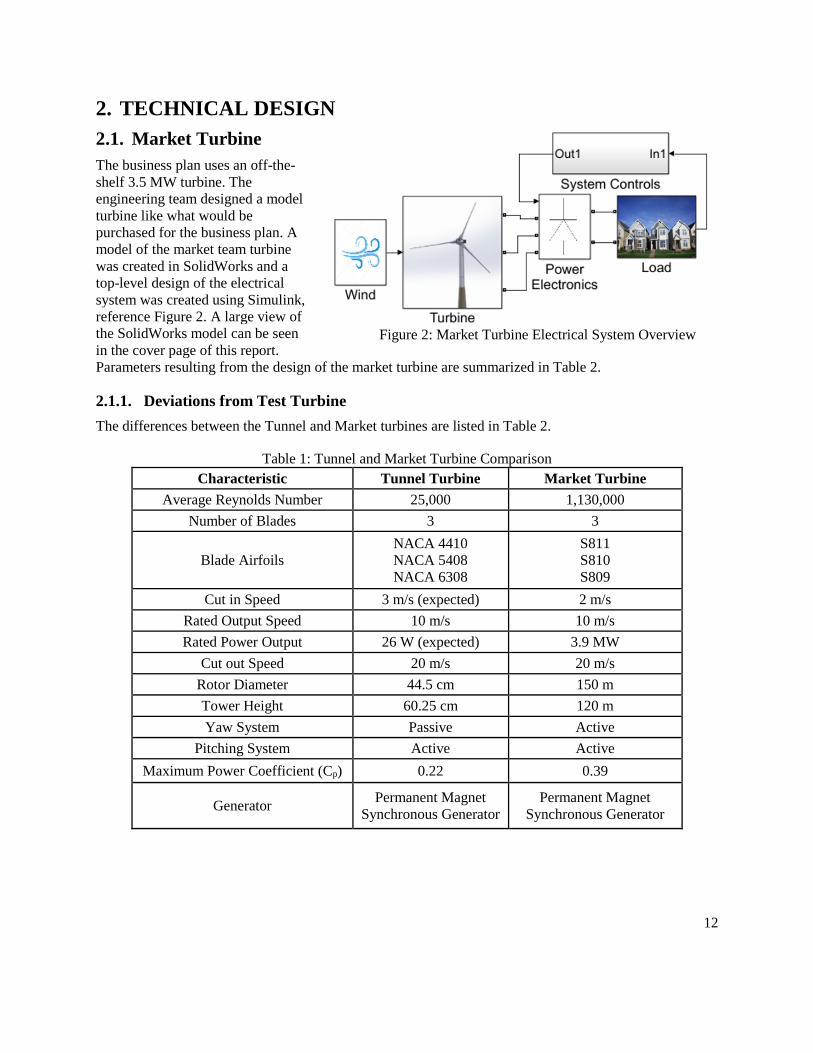
2.1. Market Turbine
The business plan uses an off-the-
shelf 3.5 MW turbine. The
engineering team designed a model
turbine like what would be
purchased for the business plan. A
model of the market team turbine
was created in SolidWorks and a
top-level design of the electrical
system was created using Simulink,
reference Figure 2. A large view of
the SolidWorks model can be seen
in the cover page of this report.
Parameters resulting from the design of the market turbine are summarized in Table 2.
2.1.1. Deviations from Test Turbine
The differences between the Tunnel and Market turbines are listed in Table 2.
Table 1: Tunnel and Market Turbine Comparison
Characteristic Tunnel Turbine Market Turbine
Average Reynolds Number 25,000 1,130,000
Number of Blades 3 3
Blade Airfoils
NACA 4410
NACA 5408
NACA 6308
S811
S810
S809
Cut in Speed 3 m/s (expected) 2 m/s
Rated Output Speed 10 m/s 10 m/s
Rated Power Output 26 W (expected) 3.9 MW
Cut out Speed 20 m/s 20 m/s
Rotor Diameter 44.5 cm 150 m
Tower Height 60.25 cm 120 m
Yaw System Passive Active
Pitching System Active Active
Maximum Power Coefficient (Cp) 0.22 0.39
Generator Permanent Magnet
Synchronous Generator
Permanent Magnet
Synchronous Generator
Figure 2: Market Turbine Electrical System Overview
13
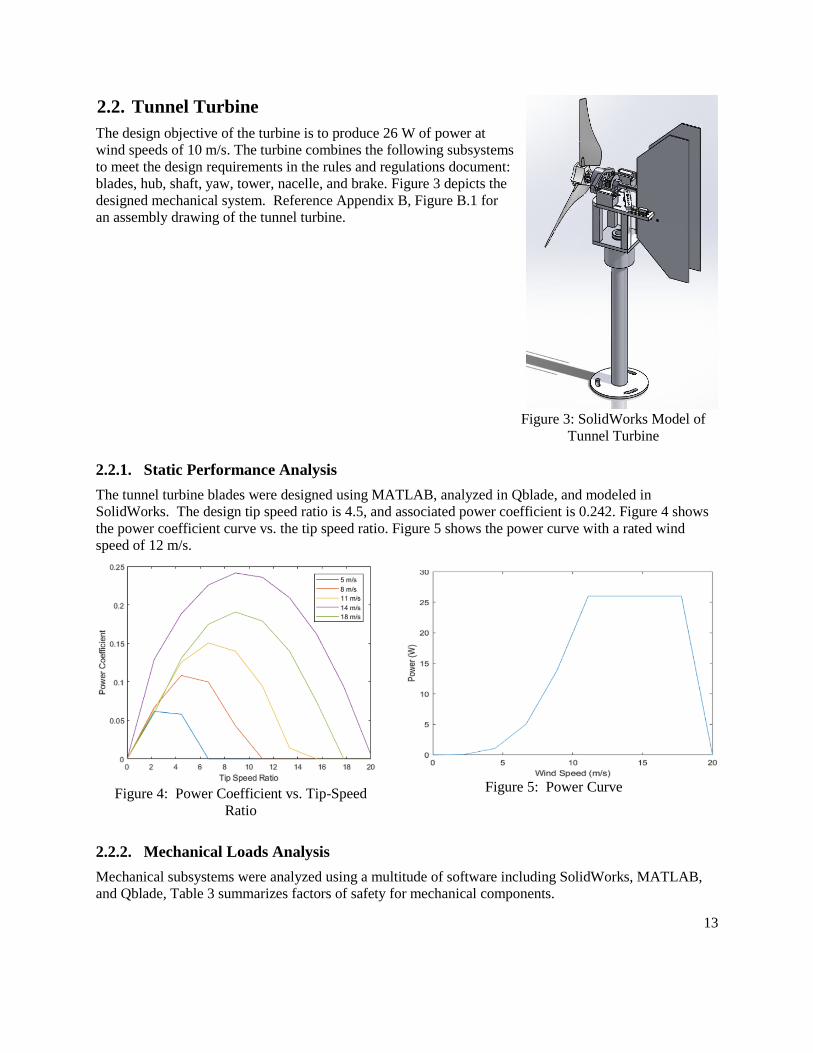
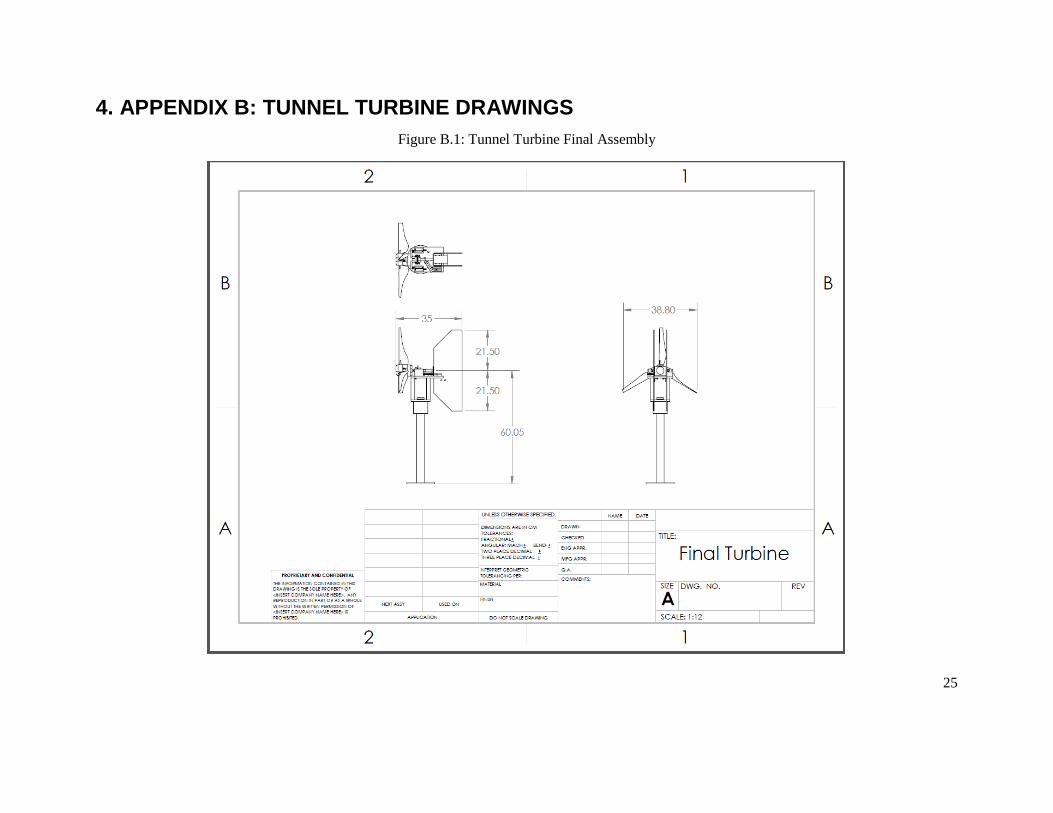
2.2. Tunnel Turbine
The design objective of the turbine is to produce 26 W of power at
wind speeds of 10 m/s. The turbine combines the following subsystems
to meet the design requirements in the rules and regulations document:
blades, hub, shaft, yaw, tower, nacelle, and brake. Figure 3 depicts the
designed mechanical system. Reference Appendix B, Figure B.1 for
an assembly drawing of the tunnel turbine.
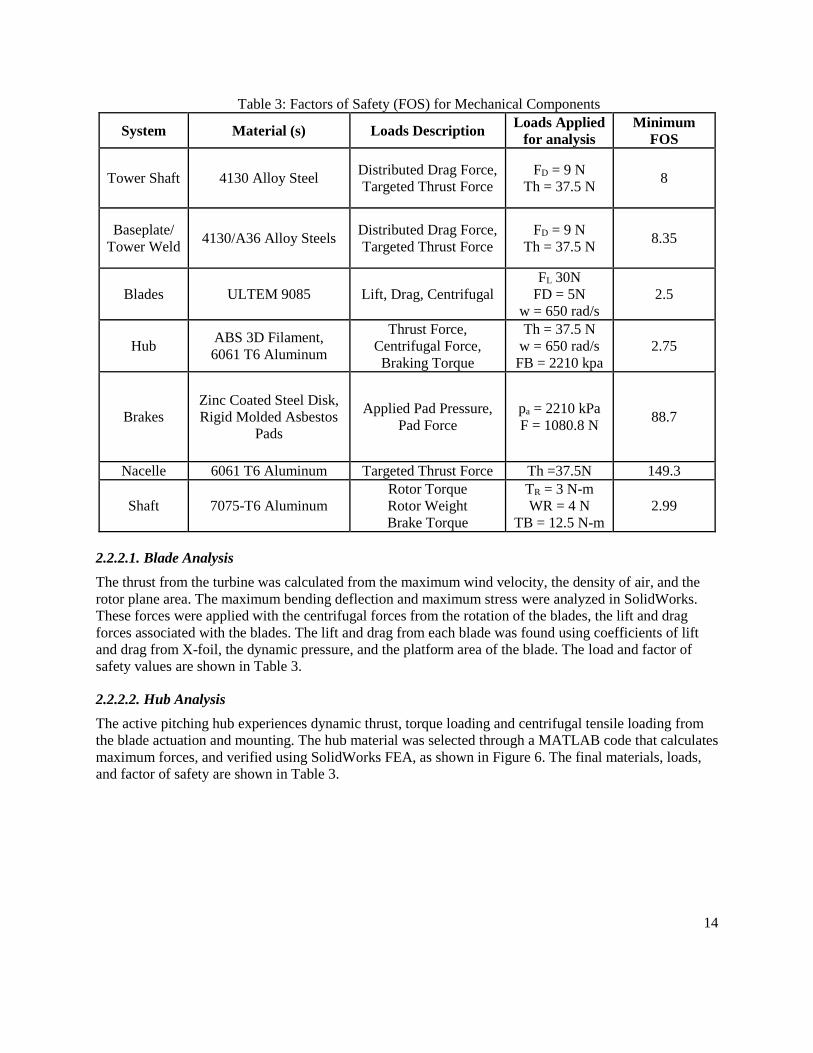
2.2.1. Static Performance Analysis
The tunnel turbine blades were designed using MATLAB, analyzed in Qblade, and modeled in
SolidWorks. The design tip speed ratio is 4.5, and associated power coefficient is 0.242. Figure 4 shows
the power coefficient curve vs. the tip speed ratio. Figure 5 shows the power curve with a rated wind
speed of 12 m/s.
Figure 5: Power Curve
2.2.2. Mechanical Loads Analysis
Mechanical subsystems were analyzed using a multitude of software including SolidWorks, MATLAB,
and Qblade, Table 3 summarizes factors of safety for mechanical components.
Figure 4: Power Coefficient vs. Tip-Speed
Ratio
Figure 3: SolidWorks Model of
Tunnel Turbine
14
Table 3: Factors of Safety (FOS) for Mechanical Components
System Material (s) Loads Description Loads Applied
for analysis
Minimum
FOS
Tower Shaft 4130 Alloy Steel Distributed Drag Force,
Targeted Thrust Force
FD = 9 N
Th = 37.5 N 8
Baseplate/
Tower Weld 4130/A36 Alloy Steels
Distributed Drag Force,
Targeted Thrust Force
FD = 9 N
Th = 37.5 N 8.35
Blades ULTEM 9085 Lift, Drag, Centrifugal
FL 30N
FD = 5N
w = 650 rad/s
2.5
Hub ABS 3D Filament,
6061 T6 Aluminum
Thrust Force,
Centrifugal Force,
Braking Torque
Th = 37.5 N
w = 650 rad/s
FB = 2210 kpa
2.75
Brakes
Zinc Coated Steel Disk,
Rigid Molded Asbestos
Pads
Applied Pad Pressure,
Pad Force
pa = 2210 kPa
F = 1080.8 N 88.7
Nacelle 6061 T6 Aluminum Targeted Thrust Force Th =37.5N 149.3
Shaft 7075-T6 Aluminum
Rotor Torque
Rotor Weight
Brake Torque
TR = 3 N-m
WR = 4 N
TB = 12.5 N-m
2.99
2.2.2.1. Blade Analysis
The thrust from the turbine was calculated from the maximum wind velocity, the density of air, and the
rotor plane area. The maximum bending deflection and maximum stress were analyzed in SolidWorks.
These forces were applied with the centrifugal forces from the rotation of the blades, the lift and drag
forces associated with the blades. The lift and drag from each blade was found using coefficients of lift
and drag from X-foil, the dynamic pressure, and the platform area of the blade. The load and factor of
safety values are shown in Table 3.
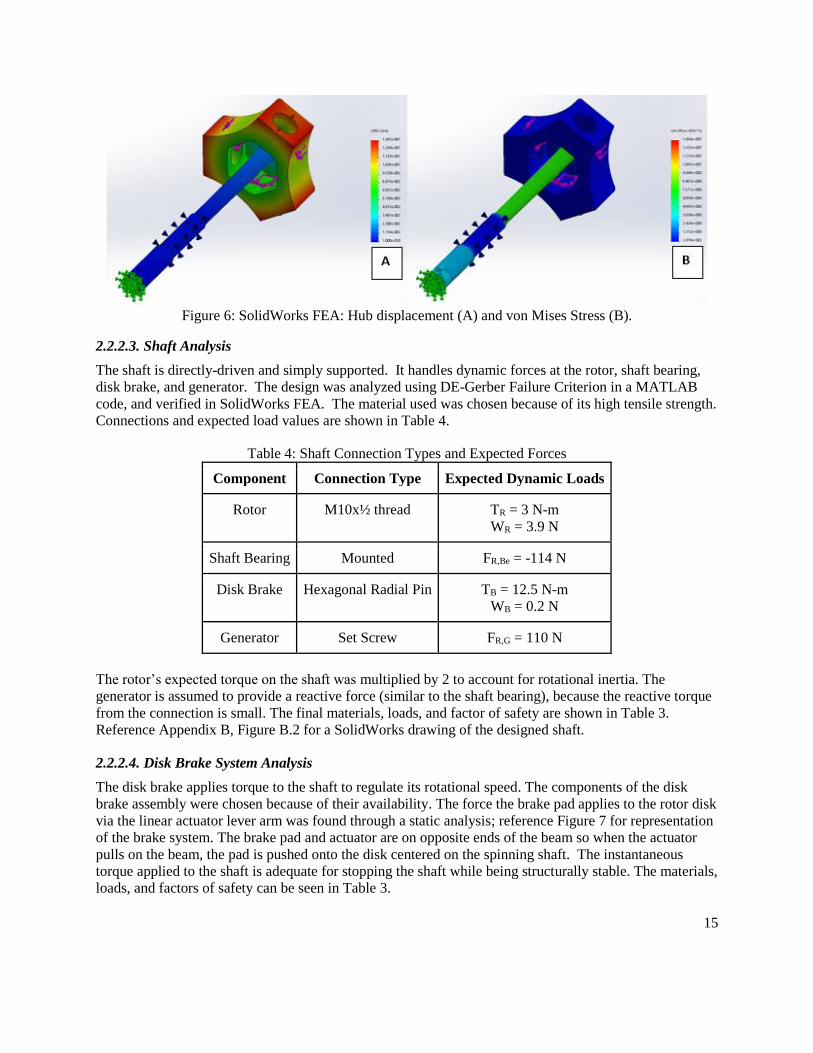
2.2.2.2. Hub Analysis
The active pitching hub experiences dynamic thrust, torque loading and centrifugal tensile loading from
the blade actuation and mounting. The hub material was selected through a MATLAB code that calculates
maximum forces, and verified using SolidWorks FEA, as shown in Figure 6. The final materials, loads,
and factor of safety are shown in Table 3.
15
Figure 6: SolidWorks FEA: Hub displacement (A) and von Mises Stress (B).
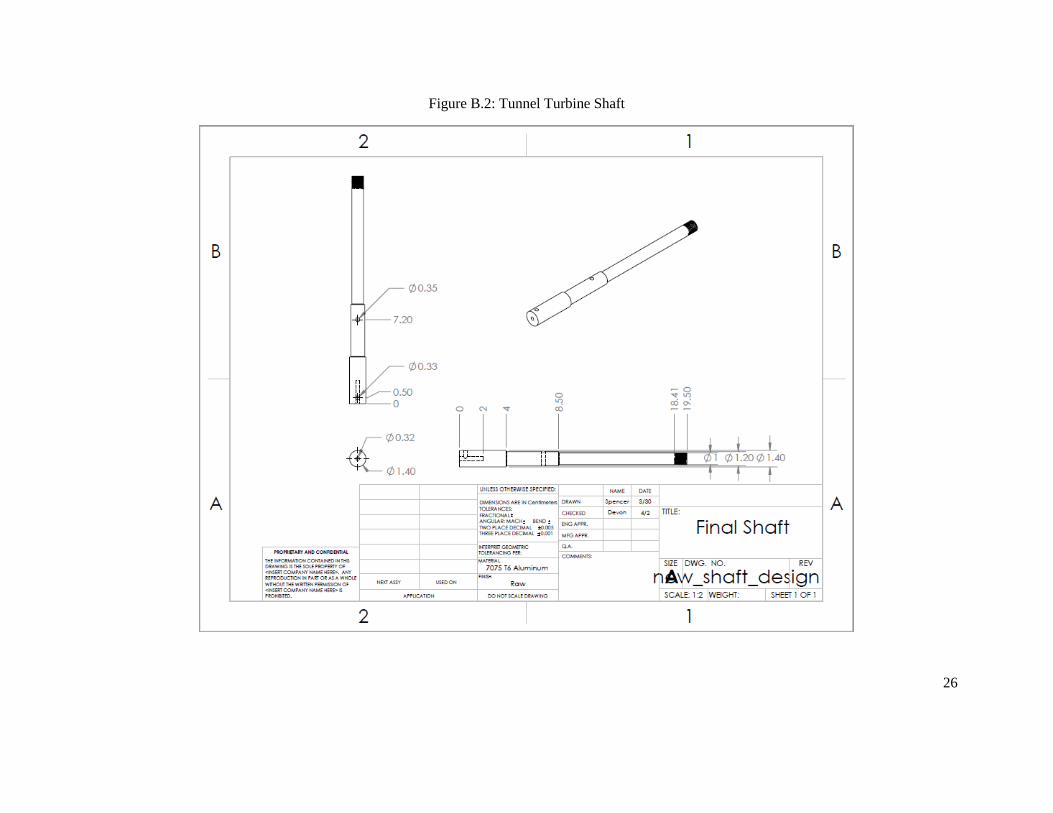
2.2.2.3. Shaft Analysis
The shaft is directly-driven and simply supported. It handles dynamic forces at the rotor, shaft bearing,
disk brake, and generator. The design was analyzed using DE-Gerber Failure Criterion in a MATLAB
code, and verified in SolidWorks FEA. The material used was chosen because of its high tensile strength.
Connections and expected load values are shown in Table 4.
Table 4: Shaft Connection Types and Expected Forces
Component Connection Type Expected Dynamic Loads
Rotor M10x½ thread TR = 3 N-m
WR = 3.9 N
Shaft Bearing Mounted FR,Be = -114 N
Disk Brake Hexagonal Radial Pin TB = 12.5 N-m
WB = 0.2 N
Generator Set Screw FR,G = 110 N
The rotor’s expected torque on the shaft was multiplied by 2 to account for rotational inertia. The
generator is assumed to provide a reactive force (similar to the shaft bearing), because the reactive torque
from the connection is small. The final materials, loads, and factor of safety are shown in Table 3.
Reference Appendix B, Figure B.2 for a SolidWorks drawing of the designed shaft.
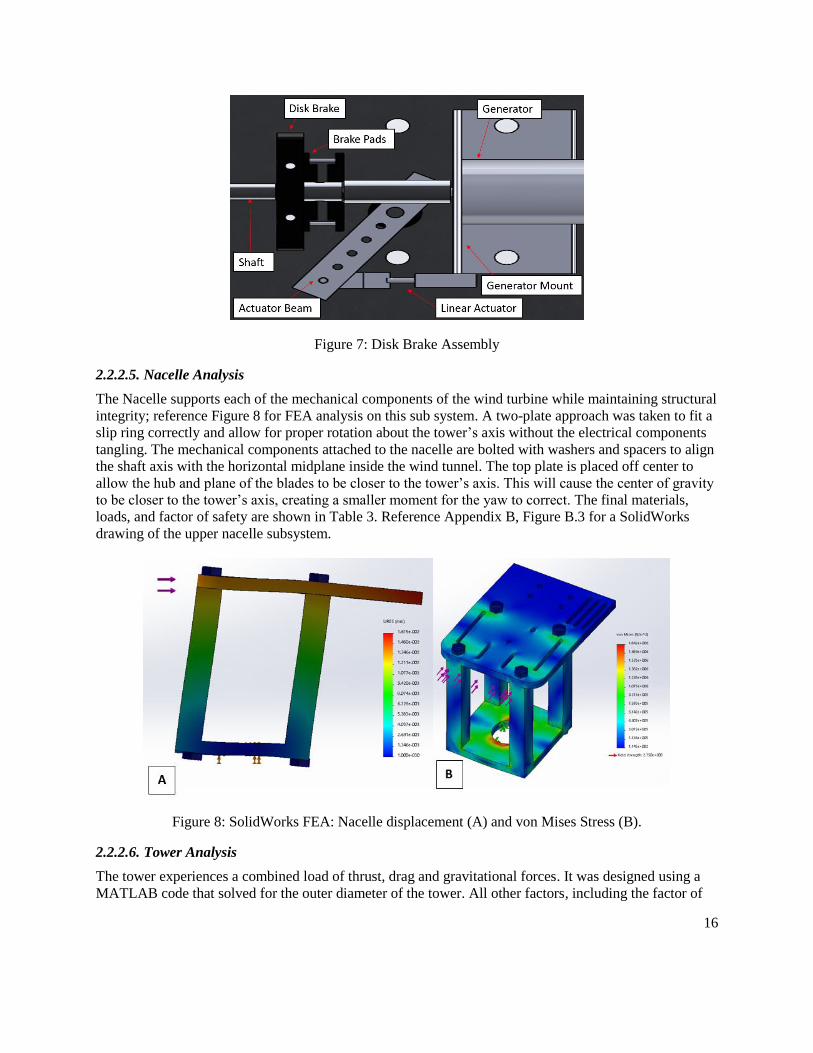
2.2.2.4. Disk Brake System Analysis
The disk brake applies torque to the shaft to regulate its rotational speed. The components of the disk
brake assembly were chosen because of their availability. The force the brake pad applies to the rotor disk
via the linear actuator lever arm was found through a static analysis; reference Figure 7 for representation
of the brake system. The brake pad and actuator are on opposite ends of the beam so when the actuator
pulls on the beam, the pad is pushed onto the disk centered on the spinning shaft. The instantaneous
torque applied to the shaft is adequate for stopping the shaft while being structurally stable. The materials,
loads, and factors of safety can be seen in Table 3.
16
Figure 7: Disk Brake Assembly
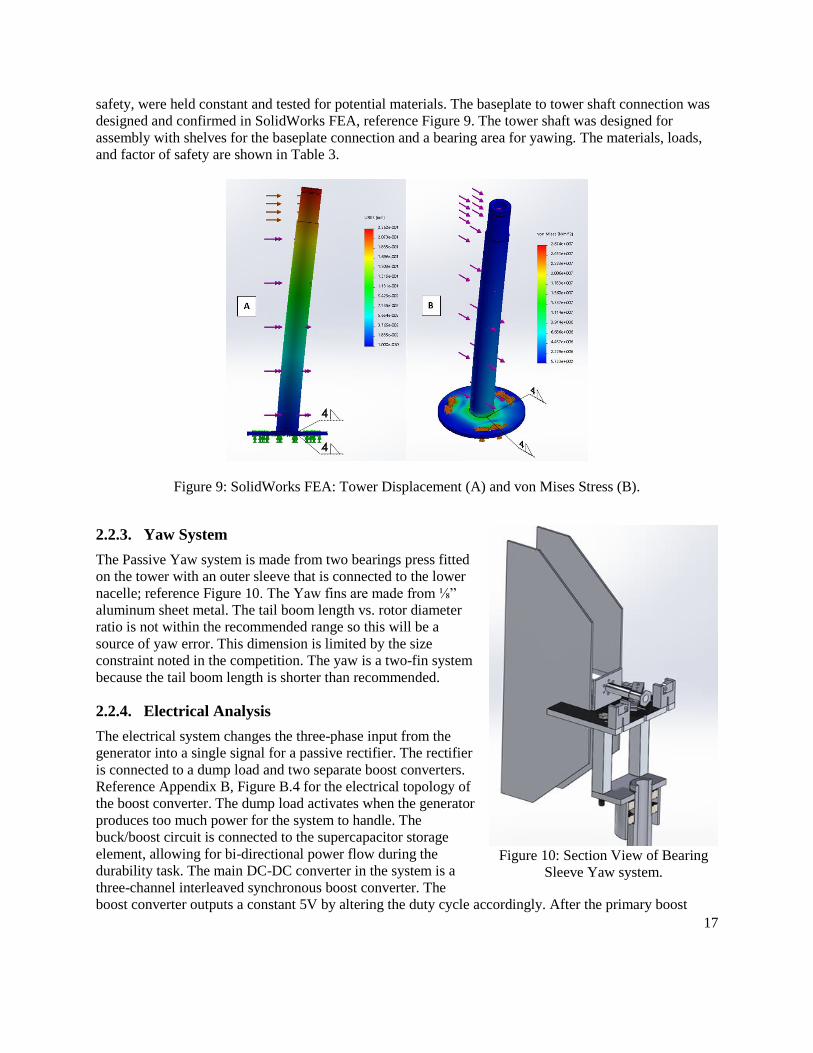
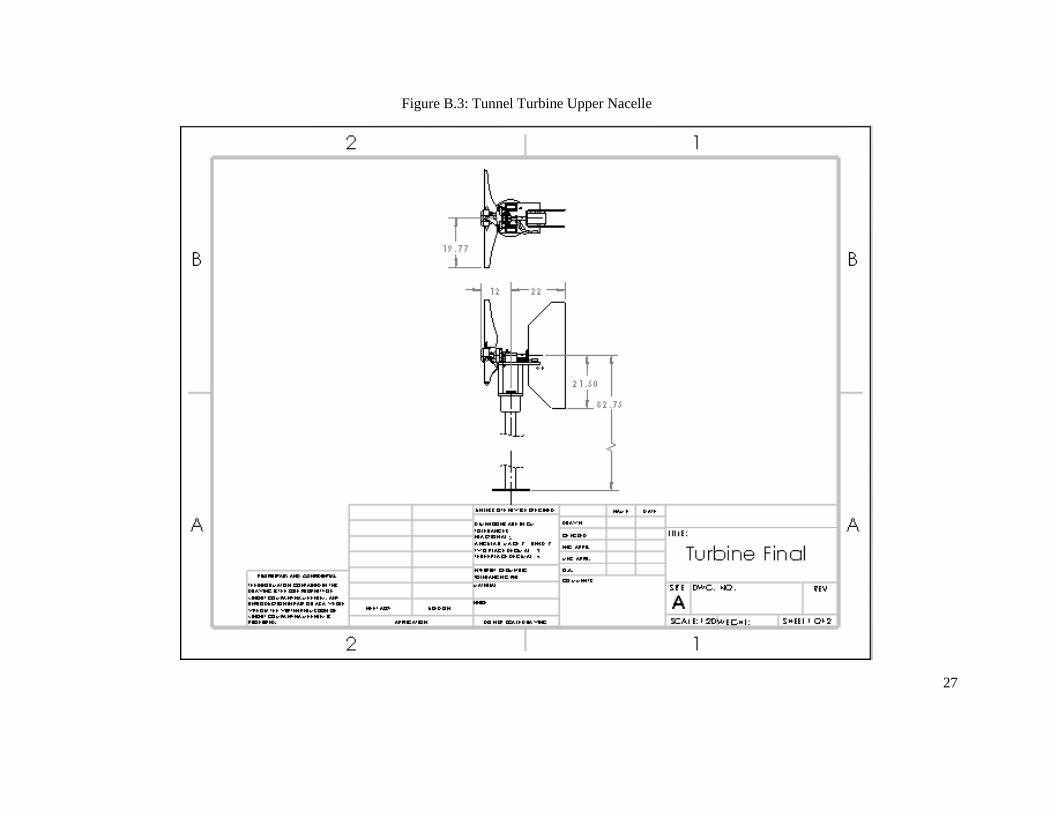
2.2.2.5. Nacelle Analysis
The Nacelle supports each of the mechanical components of the wind turbine while maintaining structural
integrity; reference Figure 8 for FEA analysis on this sub system. A two-plate approach was taken to fit a
slip ring correctly and allow for proper rotation about the tower’s axis without the electrical components
tangling. The mechanical components attached to the nacelle are bolted with washers and spacers to align
the shaft axis with the horizontal midplane inside the wind tunnel. The top plate is placed off center to
allow the hub and plane of the blades to be closer to the tower’s axis. This will cause the center of gravity
to be closer to the tower’s axis, creating a smaller moment for the yaw to correct. The final materials,
loads, and factor of safety are shown in Table 3. Reference Appendix B, Figure B.3 for a SolidWorks
drawing of the upper nacelle subsystem.
Figure 8: SolidWorks FEA: Nacelle displacement (A) and von Mises Stress (B).
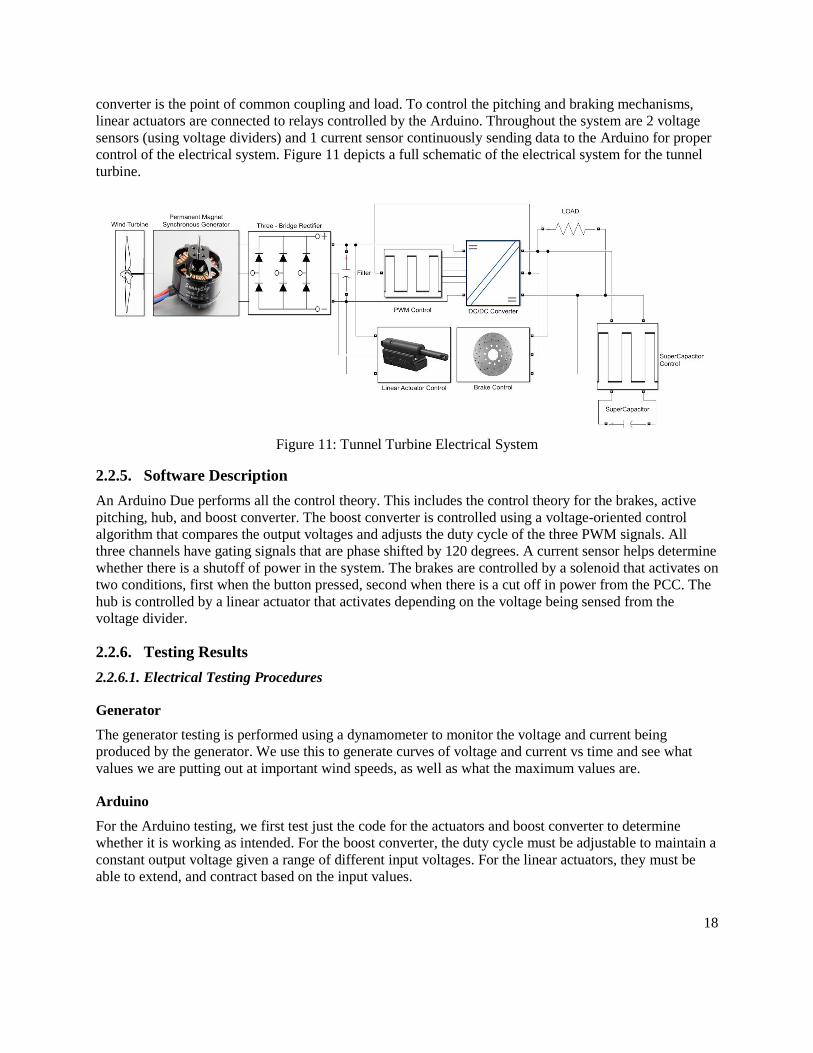
2.2.2.6. Tower Analysis
The tower experiences a combined load of thrust, drag and gravitational forces. It was designed using a
MATLAB code that solved for the outer diameter of the tower. All other factors, including the factor of
17
safety, were held constant and tested for potential materials. The baseplate to tower shaft connection was
designed and confirmed in SolidWorks FEA, reference Figure 9. The tower shaft was designed for
assembly with shelves for the baseplate connection and a bearing area for yawing. The materials, loads,
and factor of safety are shown in Table 3.
Figure 9: SolidWorks FEA: Tower Displacement (A) and von Mises Stress (B).
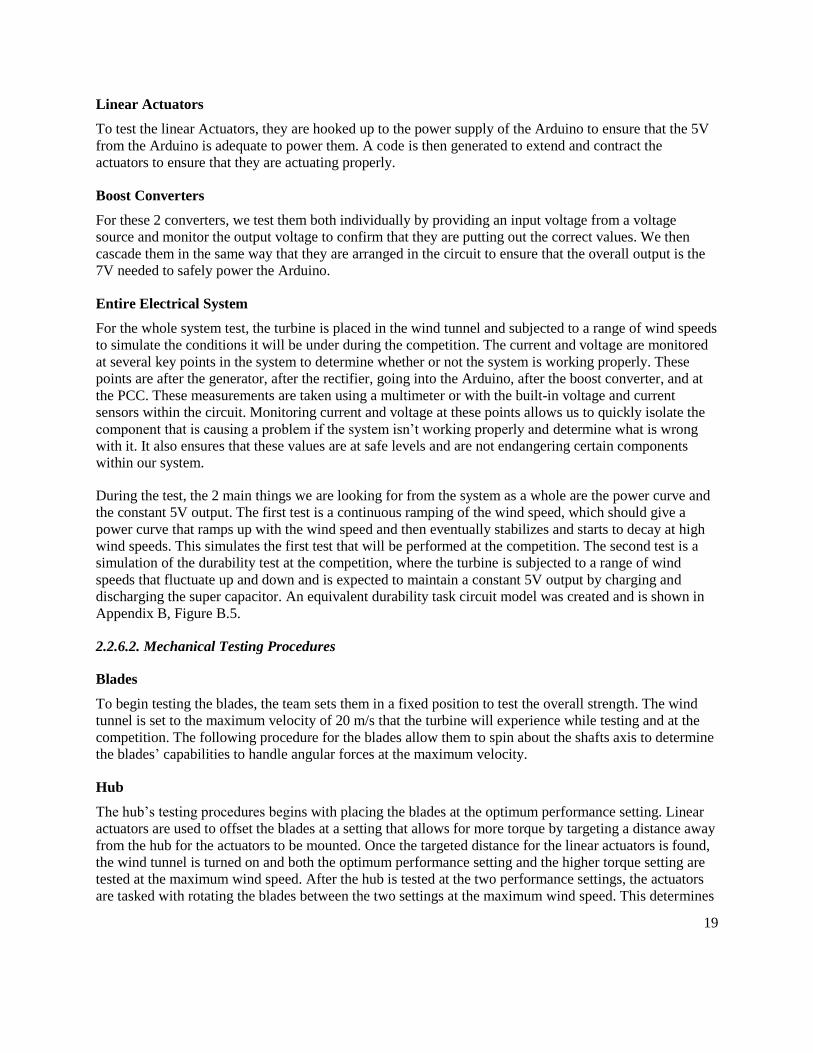
2.2.3. Yaw System
The Passive Yaw system is made from two bearings press fitted
on the tower with an outer sleeve that is connected to the lower
nacelle; reference Figure 10. The Yaw fins are made from ⅛”
aluminum sheet metal. The tail boom length vs. rotor diameter
ratio is not within the recommended range so this will be a
source of yaw error. This dimension is limited by the size
constraint noted in the competition. The yaw is a two-fin system
because the tail boom length is shorter than recommended.
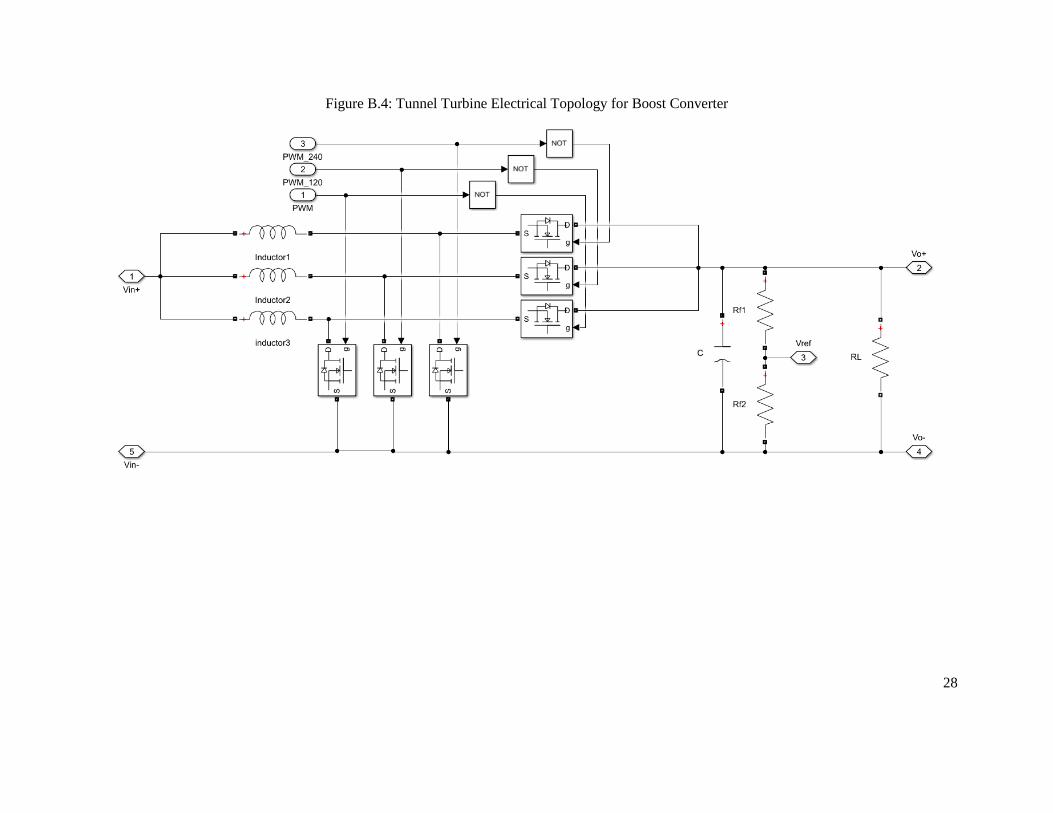
2.2.4. Electrical Analysis
The electrical system changes the three-phase input from the
generator into a single signal for a passive rectifier. The rectifier
is connected to a dump load and two separate boost converters.
Reference Appendix B, Figure B.4 for the electrical topology of
the boost converter. The dump load activates when the generator
produces too much power for the system to handle. The
buck/boost circuit is connected to the supercapacitor storage
element, allowing for bi-directional power flow during the
durability task. The main DC-DC converter in the system is a
three-channel interleaved synchronous boost converter. The
boost converter outputs a constant 5V by altering the duty cycle accordingly. After the primary boost
Figure 10: Section View of Bearing
Sleeve Yaw system.
18
converter is the point of common coupling and load. To control the pitching and braking mechanisms,
linear actuators are connected to relays controlled by the Arduino. Throughout the system are 2 voltage
sensors (using voltage dividers) and 1 current sensor continuously sending data to the Arduino for proper
control of the electrical system. Figure 11 depicts a full schematic of the electrical system for the tunnel
turbine.
Figure 11: Tunnel Turbine Electrical System
2.2.5. Software Description
An Arduino Due performs all the control theory. This includes the control theory for the brakes, active
pitching, hub, and boost converter. The boost converter is controlled using a voltage-oriented control
algorithm that compares the output voltages and adjusts the duty cycle of the three PWM signals. All
three channels have gating signals that are phase shifted by 120 degrees. A current sensor helps determine
whether there is a shutoff of power in the system. The brakes are controlled by a solenoid that activates on
two conditions, first when the button pressed, second when there is a cut off in power from the PCC. The
hub is controlled by a linear actuator that activates depending on the voltage being sensed from the
voltage divider.
2.2.6. Testing Results
2.2.6.1. Electrical Testing Procedures
Generator
The generator testing is performed using a dynamometer to monitor the voltage and current being
produced by the generator. We use this to generate curves of voltage and current vs time and see what
values we are putting out at important wind speeds, as well as what the maximum values are.
Arduino
For the Arduino testing, we first test just the code for the actuators and boost converter to determine
whether it is working as intended. For the boost converter, the duty cycle must be adjustable to maintain a
constant output voltage given a range of different input voltages. For the linear actuators, they must be
able to extend, and contract based on the input values.
19
Linear Actuators
To test the linear Actuators, they are hooked up to the power supply of the Arduino to ensure that the 5V
from the Arduino is adequate to power them. A code is then generated to extend and contract the
actuators to ensure that they are actuating properly.
Boost Converters
For these 2 converters, we test them both individually by providing an input voltage from a voltage
source and monitor the output voltage to confirm that they are putting out the correct values. We then
cascade them in the same way that they are arranged in the circuit to ensure that the overall output is the
7V needed to safely power the Arduino.
Entire Electrical System
For the whole system test, the turbine is placed in the wind tunnel and subjected to a range of wind speeds
to simulate the conditions it will be under during the competition. The current and voltage are monitored
at several key points in the system to determine whether or not the system is working properly. These
points are after the generator, after the rectifier, going into the Arduino, after the boost converter, and at
the PCC. These measurements are taken using a multimeter or with the built-in voltage and current
sensors within the circuit. Monitoring current and voltage at these points allows us to quickly isolate the
component that is causing a problem if the system isn’t working properly and determine what is wrong
with it. It also ensures that these values are at safe levels and are not endangering certain components
within our system.
During the test, the 2 main things we are looking for from the system as a whole are the power curve and
the constant 5V output. The first test is a continuous ramping of the wind speed, which should give a
power curve that ramps up with the wind speed and then eventually stabilizes and starts to decay at high
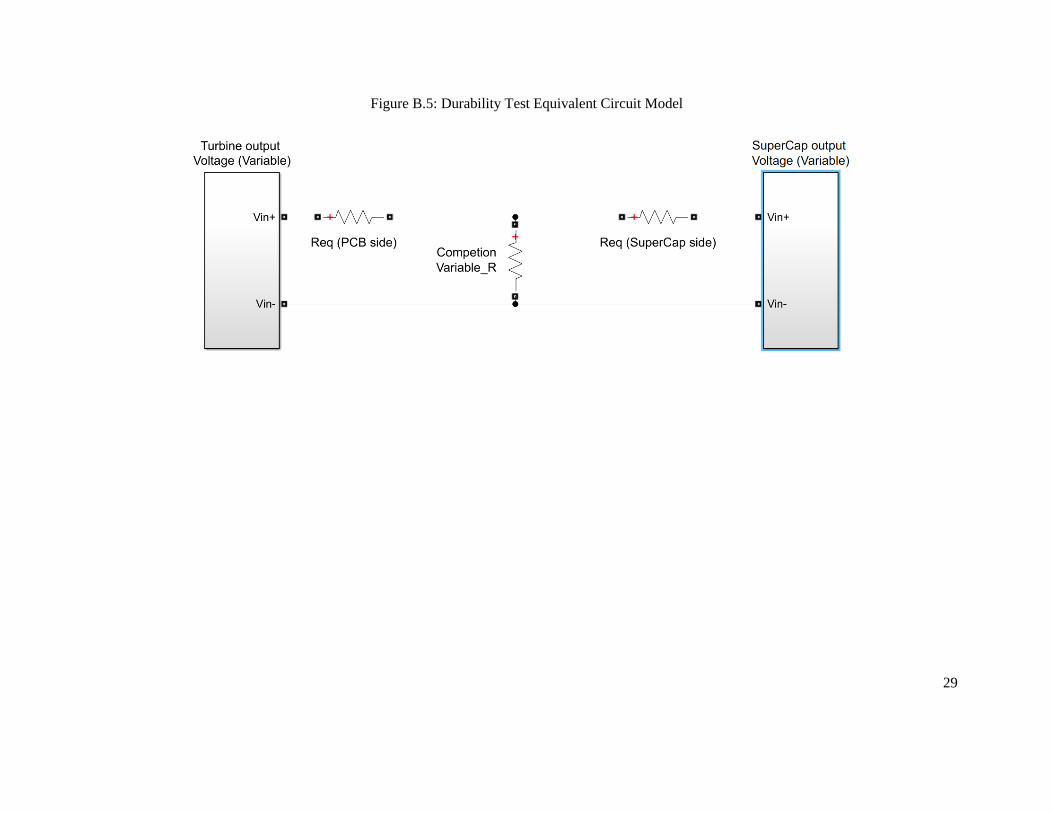
wind speeds. This simulates the first test that will be performed at the competition. The second test is a
simulation of the durability test at the competition, where the turbine is subjected to a range of wind
speeds that fluctuate up and down and is expected to maintain a constant 5V output by charging and
discharging the super capacitor. An equivalent durability task circuit model was created and is shown in
Appendix B, Figure B.5.
2.2.6.2. Mechanical Testing Procedures
Blades
To begin testing the blades, the team sets them in a fixed position to test the overall strength. The wind
tunnel is set to the maximum velocity of 20 m/s that the turbine will experience while testing and at the
competition. The following procedure for the blades allow them to spin about the shafts axis to determine
the blades’ capabilities to handle angular forces at the maximum velocity.
Hub
The hub’s testing procedures begins with placing the blades at the optimum performance setting. Linear
actuators are used to offset the blades at a setting that allows for more torque by targeting a distance away
from the hub for the actuators to be mounted. Once the targeted distance for the linear actuators is found,
the wind tunnel is turned on and both the optimum performance setting and the higher torque setting are
tested at the maximum wind speed. After the hub is tested at the two performance settings, the actuators
are tasked with rotating the blades between the two settings at the maximum wind speed. This determines

20
the hub’s capabilities of pitching the blades with the highest stress factors.
Tower/Baseplate/Nacelle
The components are tested throughout each testing procedure and experience minimum to maximum
forces during each test. The structural components of the turbine are visually measured while the wind
tunnel is in operation.
Brake
Testing the brake requires the wind tunnel to be set to the maximum velocity that the turbine will
experience at the competition. This wind speed produces the maximum torsional forces on the shaft,
which requires the brake to perform better than at lower wind speeds. The brake is applied in small
increments to avoid damage to the brake as well as the other components of the turbine. The brake is only
required to reach a rotational speed that is below 10% of the average RPM that the turbine produces. The
average RPM is based on five separate wind speed settings during testing. The rotational speed is
measured during the braking test to determine if the rotors are under this 10% limit if the brakes are
unable to stop the rotor completely.
Yaw
The yaw test is begun by setting the turbine at a 10° offset from direction of the wind. The wind tunnel is
then turned on with an increasing velocity until the yaw corrects the direction of the turbine. This process
is repeated by increasing the angle offset by increments of 10° until a 180° offset is tested, or until the
yaw no longer corrects the turbines direction.
Shaft
The shaft is the last mechanical component to be fully tested. Once each of the other components are
tested, the wind tunnel is turned on while slowly increasing the wind speed, and the shaft’s ability to
withstand forces while each of the previous tests are performed simultaneously. The combined test
incorporates the hub pitching and rotating the blades from the high torque setting to the optimum
performance setting, while the brakes attempt to slow down the rotor once the maximum wind speed is
reached.
21
3. REFERENCES
[1] Cision PR Newswire, "The global market for electric vehicle (EV) will grow from $75.7 billion in
2017 to around $127.7 billion by 2022 with a compound annual growth rate (CAGR) of 11.0% for
the period of 2017-2022".
[2] USA Today, "Number of electric vehicle charging points to rise significantly in 2018".
[3] A. C. a. K. Schefter, "Plug-in Electric Vehicle Sales Forecast Through 2025 and the Charging
Infrastructure Required," Edison Electric Institute, 2017.
[4] U.S. Energy Information Administration, "What is U.S. electricity generation by energy source?,"
2018.
[5] T. Moloughney, "How Much Does It Cost To Charge An Electric Car?," Plug In America.
[6] U.S. Energy Information Administration, "Renewable Energy Explained," 2017.
[7] Carmax, "2017 Hybrid & Electric Cars Survey Results," 2017.
[8] SRP, "2035 Sustainability Goals Delivering today, shaping tomorrow".
[9] U.S. Department of Energy, "Emissions from Hybrid and Plug-In Electric Vehicles," Fuels and
Vehicles.
[10] International Energy Agency, "Renewables 2017".
[11] Bloomberg New Energy Finance, "Electric Vehicle Outlook 2017," 2017.
[12] The Guardian, "Electric car owners 'can drive for free by letting energy firms use battery'".
[13] MathWorks, "24-hour Simulation of a Vehicle-to-Grid (V2G) System".
[14] National Renewable Energy Laboratory (NREL), "System Advisory Model (SAM)".
[15] American Wind Energy Association, "The Cost of Wind Energy in the U.S".
22
3. APPENDIX A: BUSINESS FINANCIALS
Table A.1: CleanerGrid’s Income Statement
23
Table A.2: CleanerGrid’s Balance Sheet
24
Table A.3: CleanerGrid’s Cash Flow
25
4. APPENDIX B: TUNNEL TURBINE DRAWINGS
Figure B.1: Tunnel Turbine Final Assembly
26
Figure B.2: Tunnel Turbine Shaft
27
Figure B.3: Tunnel Turbine Upper Nacelle
28
Figure B.4: Tunnel Turbine Electrical Topology for Boost Converter
29
Figure B.5: Durability Test Equivalent Circuit Model