Embed Size (px)
Citation preview
Nature Structural and Molecular Biology: doi:10.1038/nsmb.2982
Supplementary Figure 1
Distribution of miRNAs between lncRNA and protein-coding genes.
Pie chart showing distribution of human miRNA between protein coding and lncRNA genes. To the right, lncRNA miRNA genes are
further subdivided into intergenic (lincRNA) or other less well-characterized subdivisions such as pseudogene or antisense.
Nature Structural and Molecular Biology: doi:10.1038/nsmb.2982
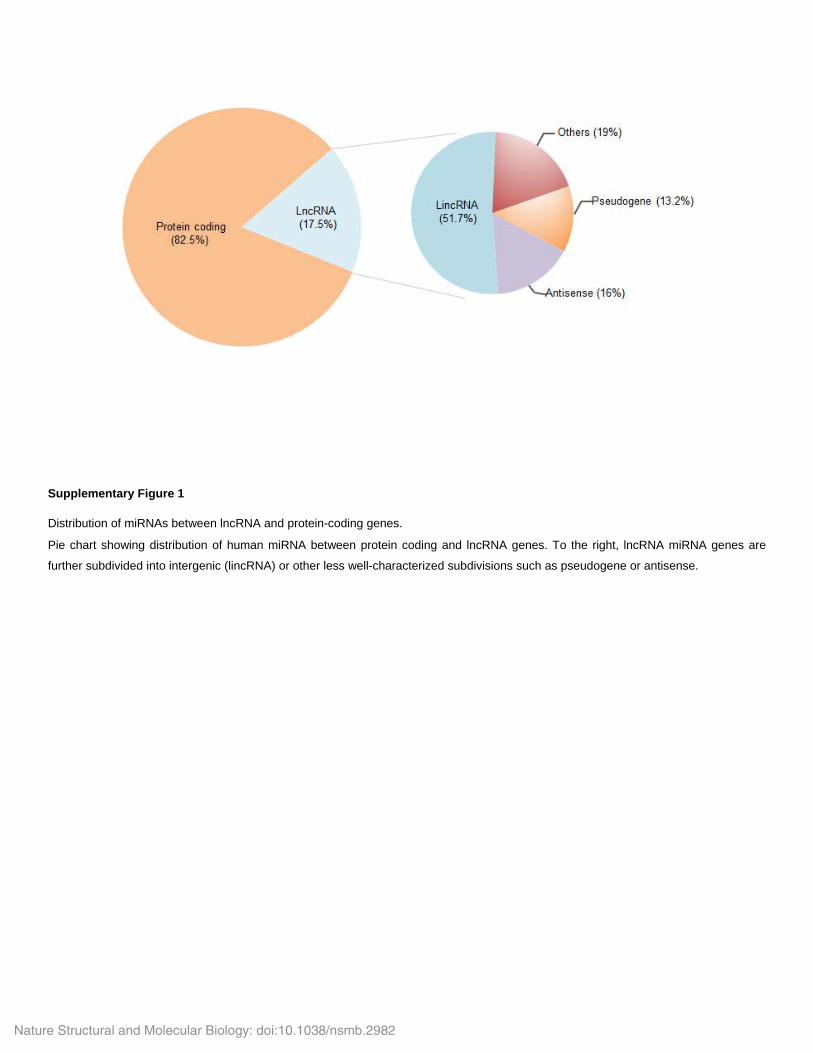
Supplementary Figure 2
Mapped 3 ends of lnc-pri-miR-122.
Sequencing results of lnc-pri-miR-122 3’RACE products amplified by poly(A) polymerase dependent method. Red arrow head marks the 3’ end cleavage sites based on sequence analysis.
Nature Structural and Molecular Biology: doi:10.1038/nsmb.2982
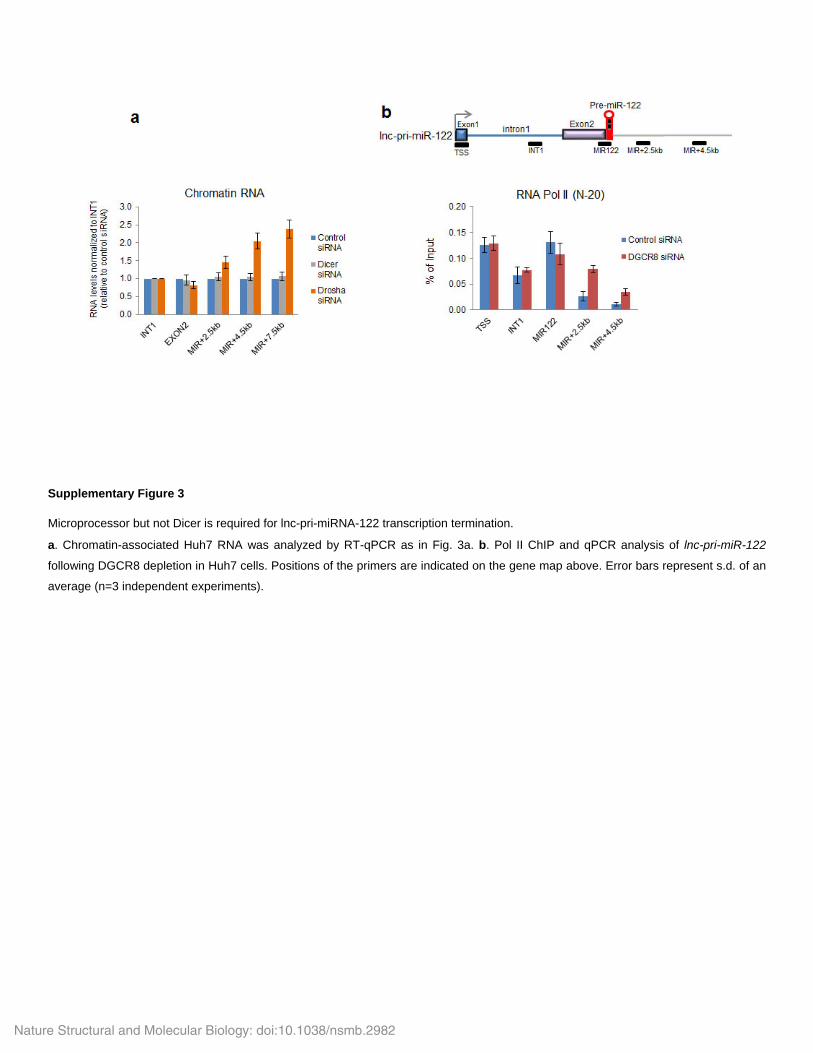
Supplementary Figure 3
Microprocessor but not Dicer is required for lnc-pri-miRNA-122 transcription termination.
a. Chromatin-associated Huh7 RNA was analyzed by RT-qPCR as in Fig. 3a. b. Pol II ChIP and qPCR analysis of lnc-pri-miR-122
following DGCR8 depletion in Huh7 cells. Positions of the primers are indicated on the gene map above. Error bars represent s.d. of an
average (n=3 independent experiments).
Nature Structural and Molecular Biology: doi:10.1038/nsmb.2982
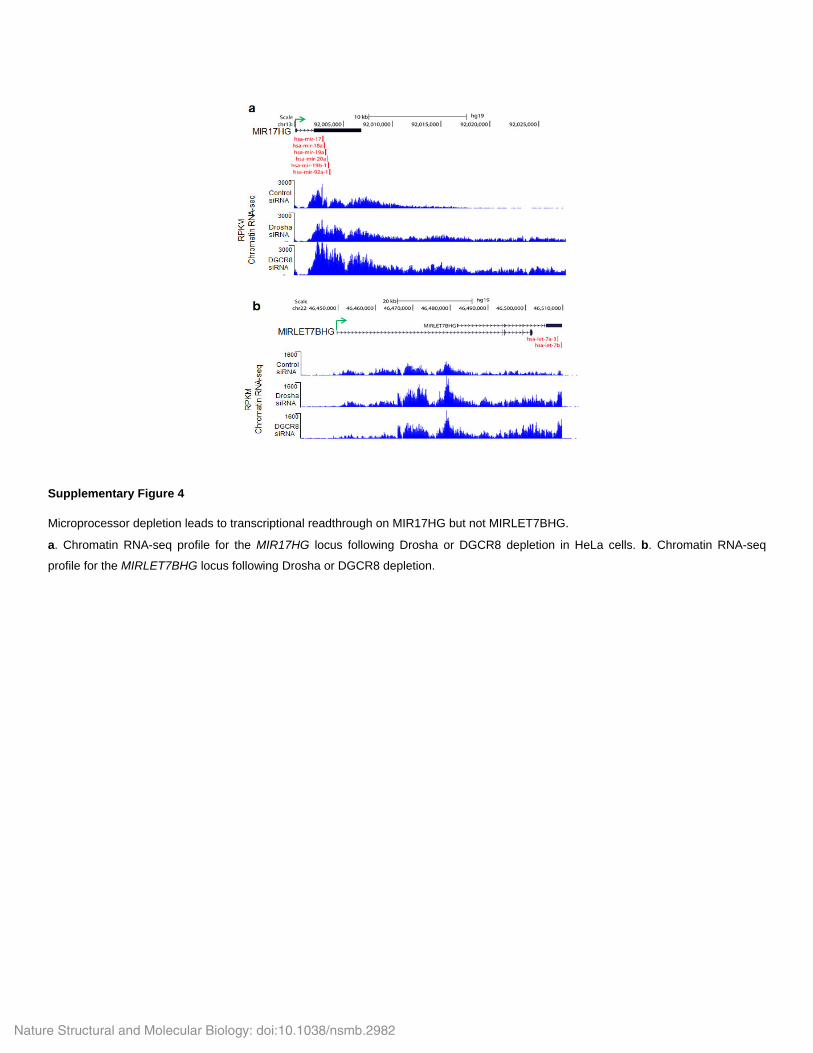
Supplementary Figure 4
Microprocessor depletion leads to transcriptional readthrough on MIR17HG but not MIRLET7BHG.
a. Chromatin RNA-seq profile for the MIR17HG locus following Drosha or DGCR8 depletion in HeLa cells. b. Chromatin RNA-seq
profile for the MIRLET7BHG locus following Drosha or DGCR8 depletion.
Nature Structural and Molecular Biology: doi:10.1038/nsmb.2982
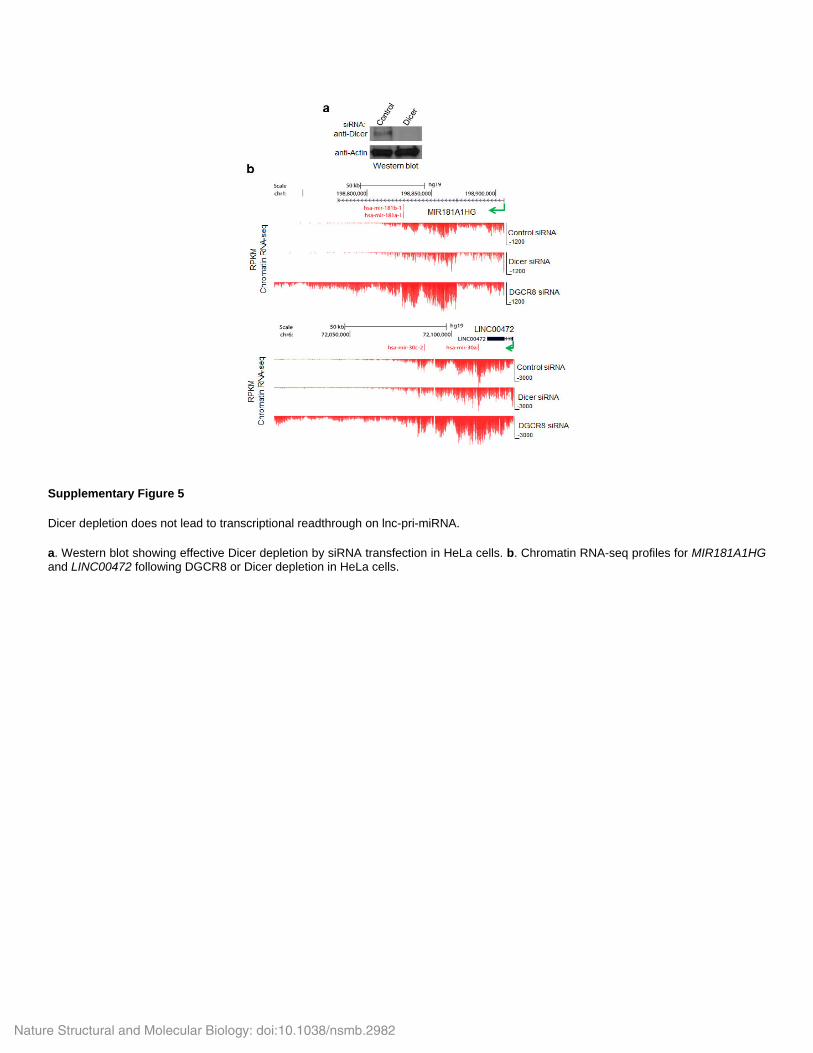
Supplementary Figure 5
Dicer depletion does not lead to transcriptional readthrough on lnc-pri-miRNA.
a. Western blot showing effective Dicer depletion by siRNA transfection in HeLa cells. b. Chromatin RNA-seq profiles for MIR181A1HGand LINC00472 following DGCR8 or Dicer depletion in HeLa cells.
Nature Structural and Molecular Biology: doi:10.1038/nsmb.2982
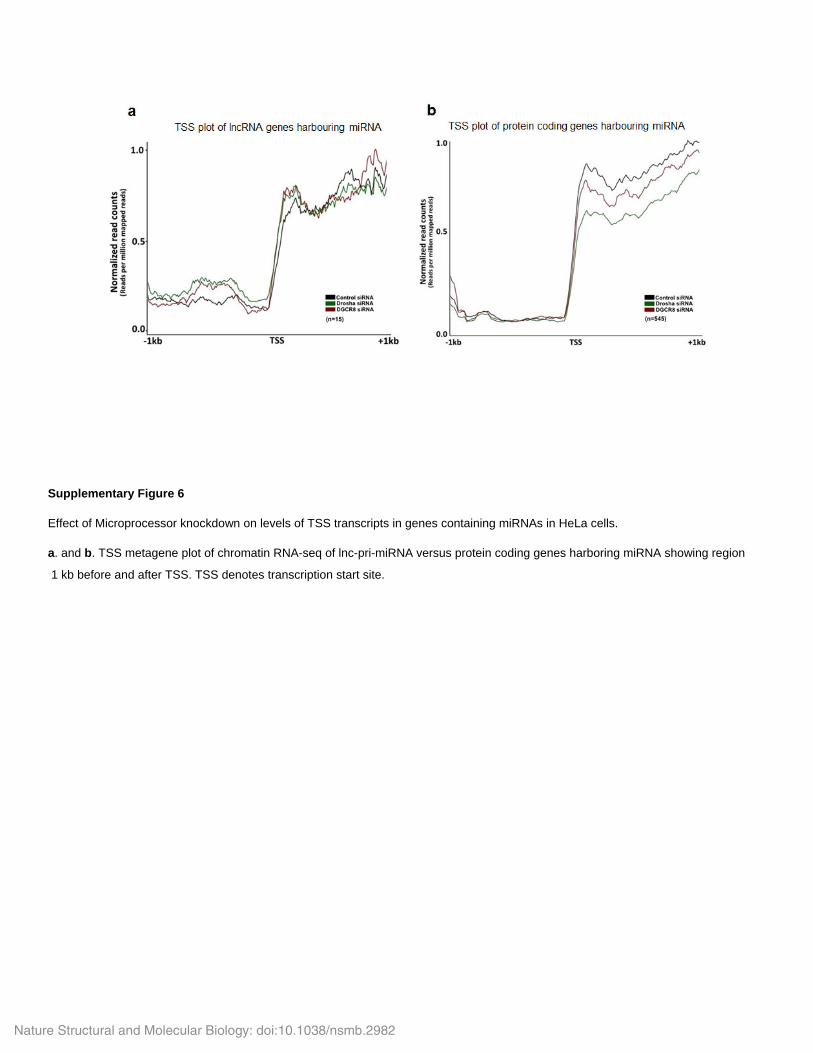
Supplementary Figure 6
Effect of Microprocessor knockdown on levels of TSS transcripts in genes containing miRNAs in HeLa cells.
a. and b. TSS metagene plot of chromatin RNA-seq of lnc-pri-miRNA versus protein coding genes harboring miRNA showing region
1 kb before and after TSS. TSS denotes transcription start site.
Nature Structural and Molecular Biology: doi:10.1038/nsmb.2982
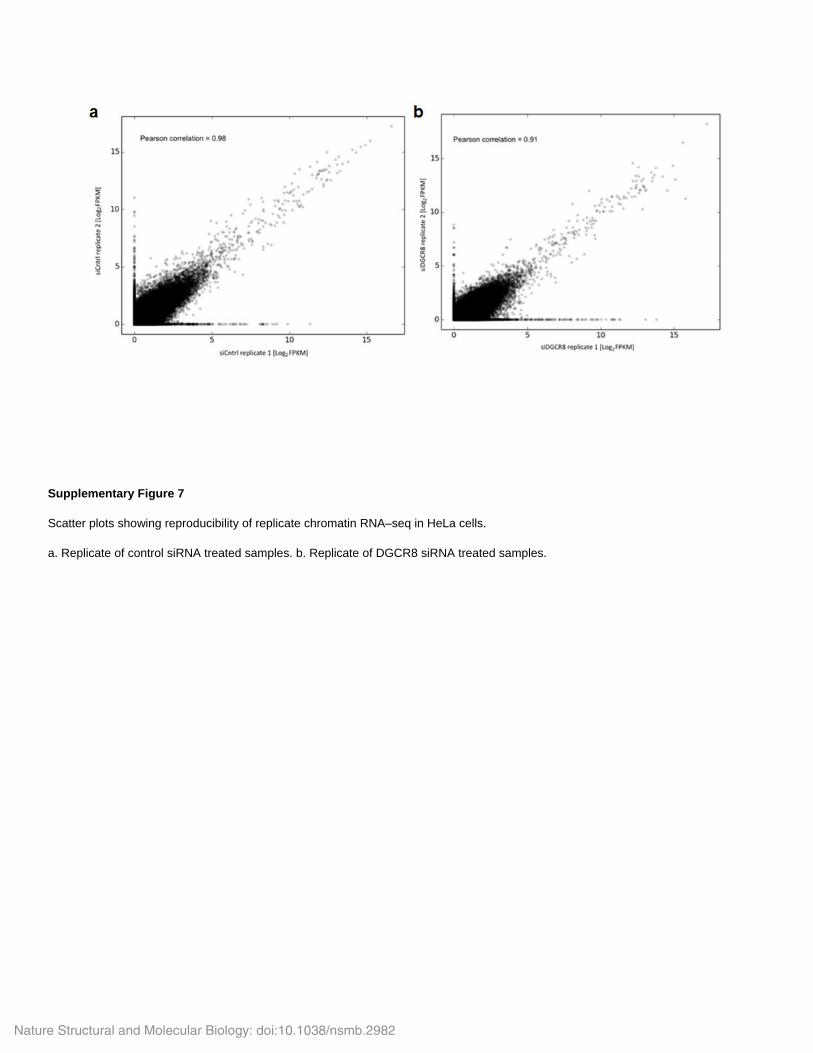
Supplementary Figure 7
Scatter plots showing reproducibility of replicate chromatin RNA–seq in HeLa cells.
a. Replicate of control siRNA treated samples. b. Replicate of DGCR8 siRNA treated samples.
Nature Structural and Molecular Biology: doi:10.1038/nsmb.2982
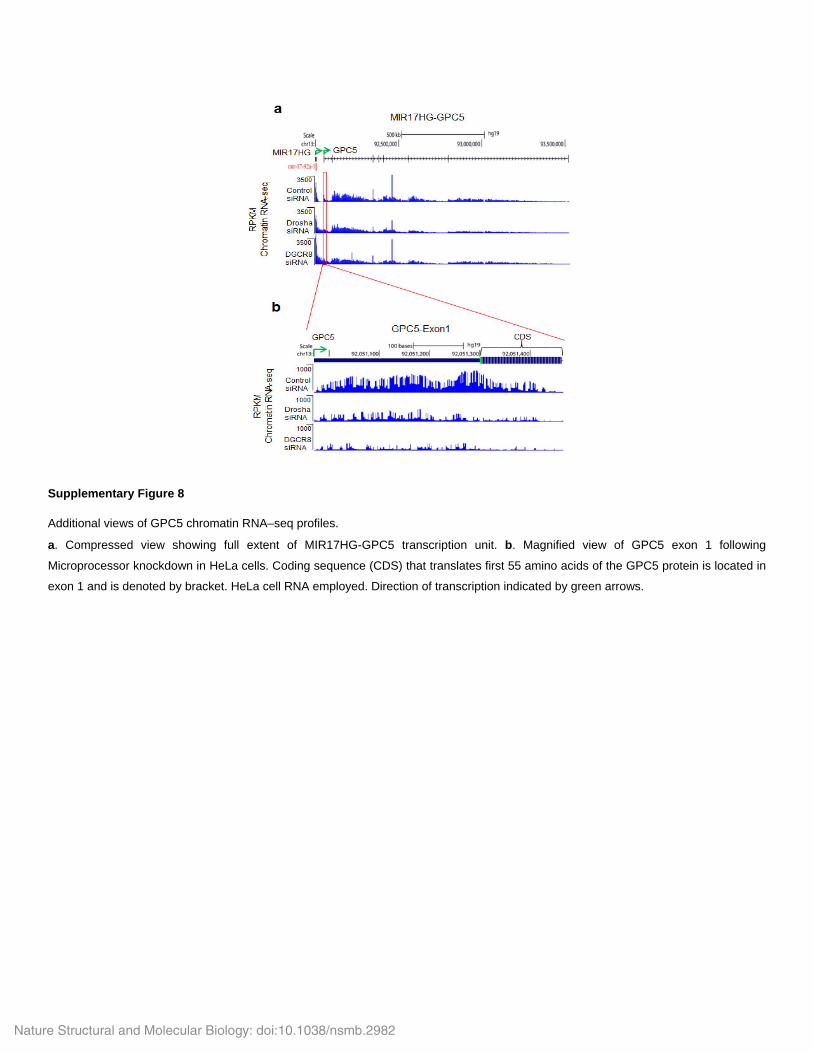
Supplementary Figure 8
Additional views of GPC5 chromatin RNA–seq profiles.
a. Compressed view showing full extent of MIR17HG-GPC5 transcription unit. b. Magnified view of GPC5 exon 1 following
Microprocessor knockdown in HeLa cells. Coding sequence (CDS) that translates first 55 amino acids of the GPC5 protein is located in
exon 1 and is denoted by bracket. HeLa cell RNA employed. Direction of transcription indicated by green arrows.
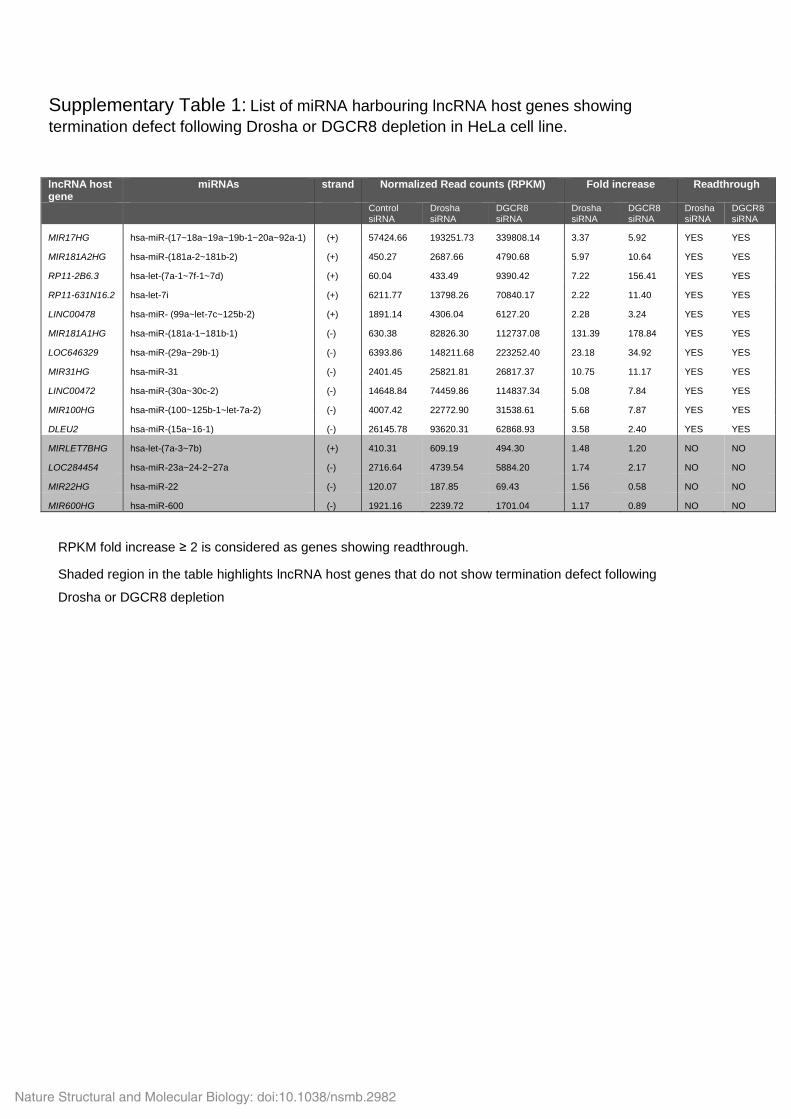
Supplementary Table 1: List of miRNA harbouring lncRNA host genes showing
termination defect following Drosha or DGCR8 depletion in HeLa cell line.
lncRNA host gene
miRNAs strand Normalized Read counts (RPKM) Fold increase Readthrough
Control siRNA
Drosha siRNA
DGCR8 siRNA
Drosha siRNA
DGCR8 siRNA
Drosha siRNA
DGCR8 siRNA
MIR17HG hsa-miR-(17~18a~19a~19b-1~20a~92a-1) (+) 57424.66 193251.73 339808.14 3.37 5.92 YES YES
MIR181A2HG hsa-miR-(181a-2~181b-2) (+) 450.27 2687.66 4790.68 5.97 10.64 YES YES
RP11-2B6.3 hsa-let-(7a-1~7f-1~7d) (+) 60.04 433.49 9390.42 7.22 156.41 YES YES
RP11-631N16.2 hsa-let-7i (+) 6211.77 13798.26 70840.17 2.22 11.40 YES YES
LINC00478 hsa-miR- (99a~let-7c~125b-2) (+) 1891.14 4306.04 6127.20 2.28 3.24 YES YES
MIR181A1HG hsa-miR-(181a-1~181b-1) (-) 630.38 82826.30 112737.08 131.39 178.84 YES YES
LOC646329 hsa-miR-(29a~29b-1) (-) 6393.86 148211.68 223252.40 23.18 34.92 YES YES
MIR31HG hsa-miR-31 (-) 2401.45 25821.81 26817.37 10.75 11.17 YES YES
LINC00472 hsa-miR-(30a~30c-2) (-) 14648.84 74459.86 114837.34 5.08 7.84 YES YES
MIR100HG hsa-miR-(100~125b-1~let-7a-2) (-) 4007.42 22772.90 31538.61 5.68 7.87 YES YES
DLEU2 hsa-miR-(15a~16-1) (-) 26145.78 93620.31 62868.93 3.58 2.40 YES YES
MIRLET7BHG hsa-let-(7a-3~7b) (+) 410.31 609.19 494.30 1.48 1.20 NO NO
LOC284454 hsa-miR-23a~24-2~27a (-) 2716.64 4739.54 5884.20 1.74 2.17 NO NO
MIR22HG hsa-miR-22 (-) 120.07 187.85 69.43 1.56 0.58 NO NO
MIR600HG hsa-miR-600 (-) 1921.16 2239.72 1701.04 1.17 0.89 NO NO
RPKM fold increase ≥ 2 is considered as genes showing readthrough.
Shaded region in the table highlights lncRNA host genes that do not show termination defect following
Drosha or DGCR8 depletion
Nature Structural and Molecular Biology: doi:10.1038/nsmb.2982
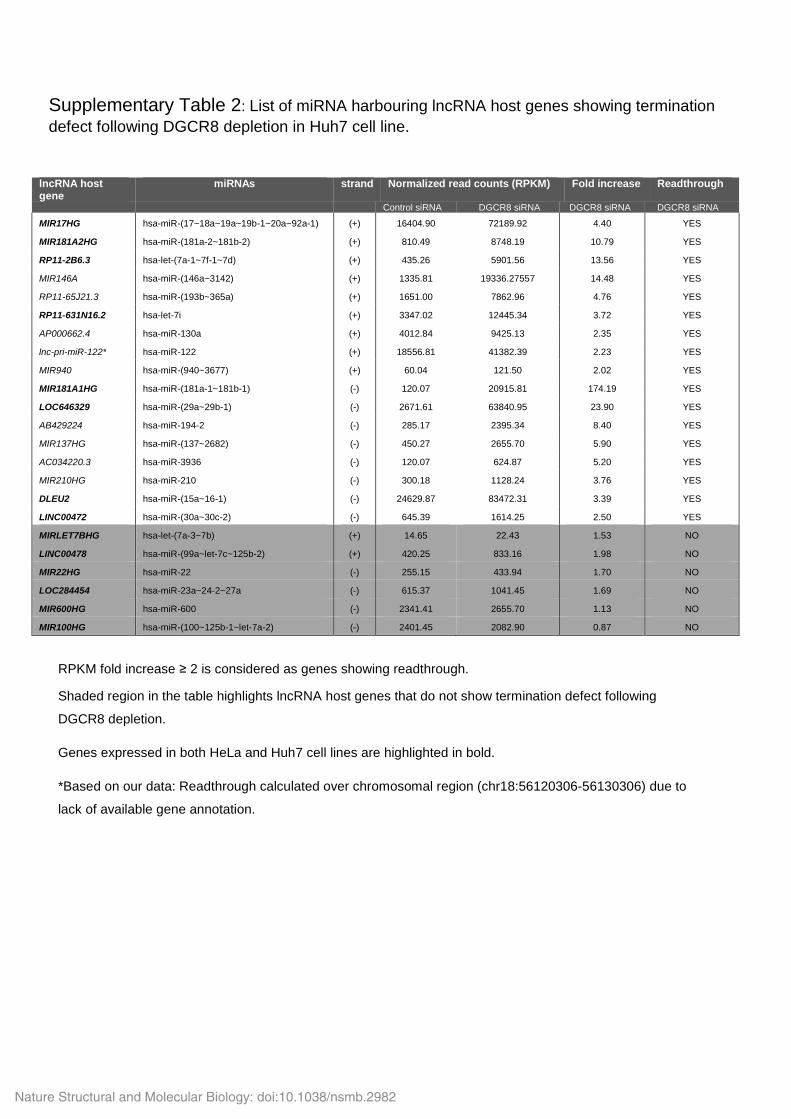
Supplementary Table 2: List of miRNA harbouring lncRNA host genes showing termination
defect following DGCR8 depletion in Huh7 cell line.
lncRNA host gene
miRNAs strand Normalized read counts (RPKM) Fold increase Readthrough
Control siRNA DGCR8 siRNA DGCR8 siRNA DGCR8 siRNA
MIR17HG hsa-miR-(17~18a~19a~19b-1~20a~92a-1) (+) 16404.90 72189.92 4.40 YES
MIR181A2HG hsa-miR-(181a-2~181b-2) (+) 810.49 8748.19 10.79 YES
RP11-2B6.3 hsa-let-(7a-1~7f-1~7d) (+) 435.26 5901.56 13.56 YES
MIR146A hsa-miR-(146a~3142) (+) 1335.81 19336.27557 14.48 YES
RP11-65J21.3 hsa-miR-(193b~365a) (+) 1651.00 7862.96 4.76 YES
RP11-631N16.2 hsa-let-7i (+) 3347.02 12445.34 3.72 YES
AP000662.4 hsa-miR-130a (+) 4012.84 9425.13 2.35 YES
lnc-pri-miR-122* hsa-miR-122 (+) 18556.81 41382.39 2.23 YES
MIR940 hsa-miR-(940~3677) (+) 60.04 121.50 2.02 YES
MIR181A1HG hsa-miR-(181a-1~181b-1) (-) 120.07 20915.81 174.19 YES
LOC646329 hsa-miR-(29a~29b-1) (-) 2671.61 63840.95 23.90 YES
AB429224 hsa-miR-194-2 (-) 285.17 2395.34 8.40 YES
MIR137HG hsa-miR-(137~2682) (-) 450.27 2655.70 5.90 YES
AC034220.3 hsa-miR-3936 (-) 120.07 624.87 5.20 YES
MIR210HG hsa-miR-210 (-) 300.18 1128.24 3.76 YES
DLEU2 hsa-miR-(15a~16-1) (-) 24629.87 83472.31 3.39 YES
LINC00472 hsa-miR-(30a~30c-2) (-) 645.39 1614.25 2.50 YES
MIRLET7BHG hsa-let-(7a-3~7b) (+) 14.65 22.43 1.53 NO
LINC00478 hsa-miR-(99a~let-7c~125b-2) (+) 420.25 833.16 1.98 NO
MIR22HG hsa-miR-22 (-) 255.15 433.94 1.70 NO
LOC284454 hsa-miR-23a~24-2~27a (-) 615.37 1041.45 1.69 NO
MIR600HG hsa-miR-600 (-) 2341.41 2655.70 1.13 NO
MIR100HG hsa-miR-(100~125b-1~let-7a-2) (-) 2401.45 2082.90 0.87 NO
RPKM fold increase ≥ 2 is considered as genes showing readthrough.
Shaded region in the table highlights lncRNA host genes that do not show termination defect following
DGCR8 depletion.
Genes expressed in both HeLa and Huh7 cell lines are highlighted in bold.
*Based on our data: Readthrough calculated over chromosomal region (chr18:56120306-56130306) due to
lack of available gene annotation.
Nature Structural and Molecular Biology: doi:10.1038/nsmb.2982
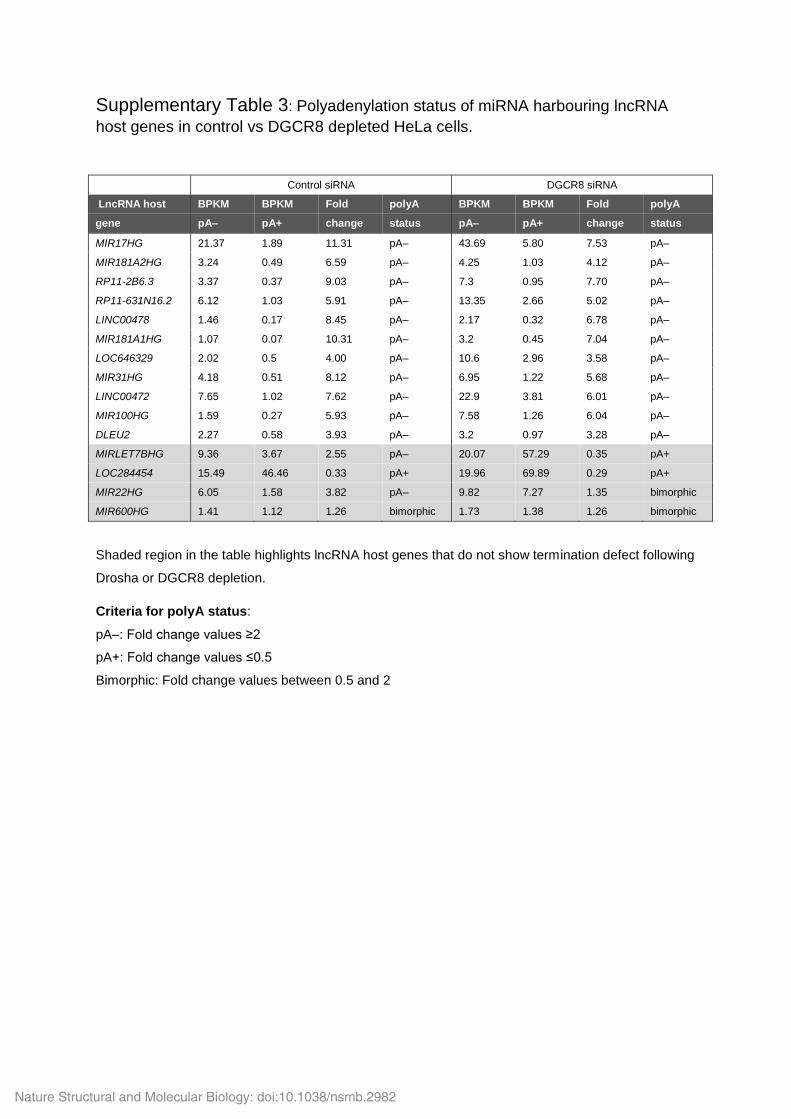
Supplementary Table 3: Polyadenylation status of miRNA harbouring lncRNA
host genes in control vs DGCR8 depleted HeLa cells.
Control siRNA DGCR8 siRNA
LncRNA host BPKM BPKM Fold polyA BPKM BPKM Fold polyA
gene pA– pA+ change status pA– pA+ change status
MIR17HG 21.37 1.89 11.31 pA– 43.69 5.80 7.53 pA–
MIR181A2HG 3.24 0.49 6.59 pA– 4.25 1.03 4.12 pA–
RP11-2B6.3 3.37 0.37 9.03 pA– 7.3 0.95 7.70 pA–
RP11-631N16.2 6.12 1.03 5.91 pA– 13.35 2.66 5.02 pA–
LINC00478 1.46 0.17 8.45 pA– 2.17 0.32 6.78 pA–
MIR181A1HG 1.07 0.07 10.31 pA– 3.2 0.45 7.04 pA–
LOC646329 2.02 0.5 4.00 pA– 10.6 2.96 3.58 pA–
MIR31HG 4.18 0.51 8.12 pA– 6.95 1.22 5.68 pA–
LINC00472 7.65 1.02 7.62 pA– 22.9 3.81 6.01 pA–
MIR100HG 1.59 0.27 5.93 pA– 7.58 1.26 6.04 pA–
DLEU2 2.27 0.58 3.93 pA– 3.2 0.97 3.28 pA–
MIRLET7BHG 9.36 3.67 2.55 pA– 20.07 57.29 0.35 pA+
LOC284454 15.49 46.46 0.33 pA+ 19.96 69.89 0.29 pA+
MIR22HG 6.05 1.58 3.82 pA– 9.82 7.27 1.35 bimorphic
MIR600HG 1.41 1.12 1.26 bimorphic 1.73 1.38 1.26 bimorphic
Shaded region in the table highlights lncRNA host genes that do not show termination defect following
Drosha or DGCR8 depletion.
Criteria for polyA status:
pA–: Fold change values ≥2
pA+: Fold change values ≤0.5
Bimorphic: Fold change values between 0.5 and 2
Nature Structural and Molecular Biology: doi:10.1038/nsmb.2982
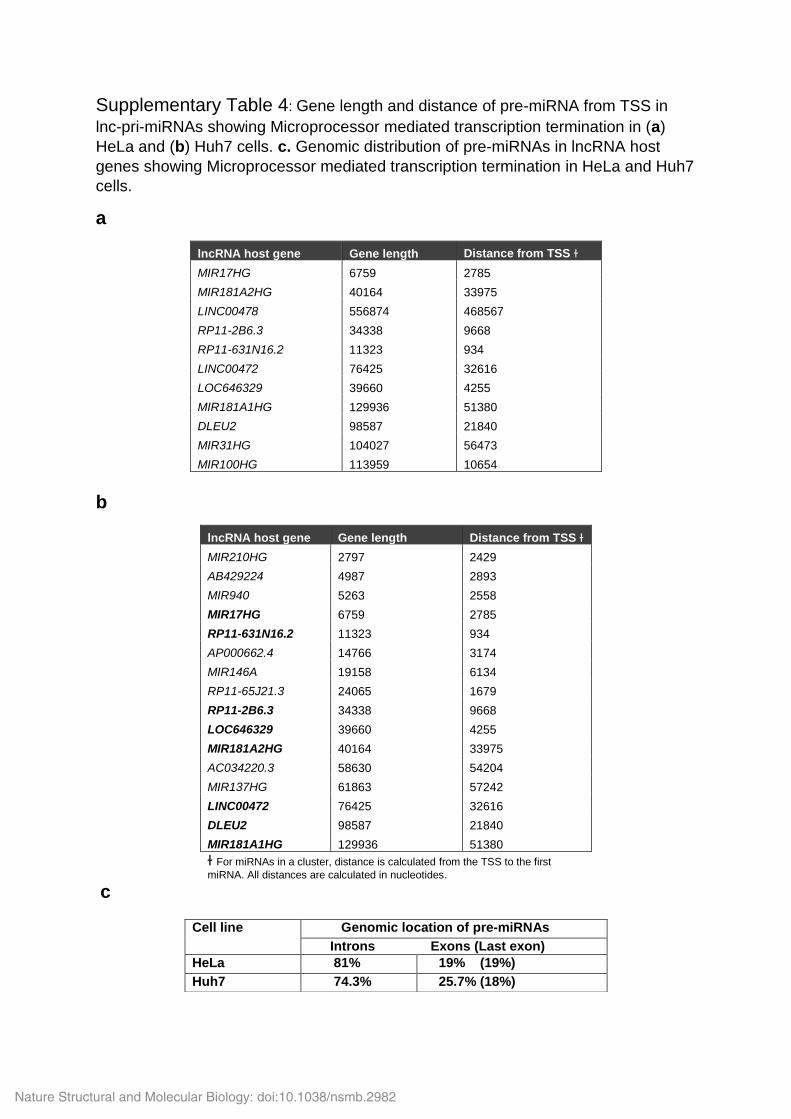
Supplementary Table 4: Gene length and distance of pre-miRNA from TSS in
lnc-pri-miRNAs showing Microprocessor mediated transcription termination in (a)
HeLa and (b) Huh7 cells. c. Genomic distribution of pre-miRNAs in lncRNA host
genes showing Microprocessor mediated transcription termination in HeLa and Huh7
cells.
a
lncRNA host gene Gene length Distance from TSS ɫ
MIR17HG 6759 2785
MIR181A2HG 40164 33975
LINC00478 556874 468567
RP11-2B6.3 34338 9668
RP11-631N16.2 11323 934
LINC00472 76425 32616
LOC646329 39660 4255
MIR181A1HG 129936 51380
DLEU2 98587 21840
MIR31HG 104027 56473
MIR100HG 113959 10654
b
lncRNA host gene Gene length Distance from TSS ɫ
MIR210HG 2797 2429
AB429224 4987 2893
MIR940 5263 2558
MIR17HG 6759 2785
RP11-631N16.2 11323 934
AP000662.4 14766 3174
MIR146A 19158 6134
RP11-65J21.3 24065 1679
RP11-2B6.3 34338 9668
LOC646329 39660 4255
MIR181A2HG 40164 33975
AC034220.3 58630 54204
MIR137HG 61863 57242
LINC00472 76425 32616
DLEU2 98587 21840
MIR181A1HG 129936 51380
ɫ For miRNAs in a cluster, distance is calculated from the TSS to the first
miRNA. All distances are calculated in nucleotides.
c
Cell line Genomic location of pre-miRNAs
Introns Exons (Last exon)
HeLa 81% 19% (19%)
Huh7 74.3% 25.7% (18%)
Nature Structural and Molecular Biology: doi:10.1038/nsmb.2982
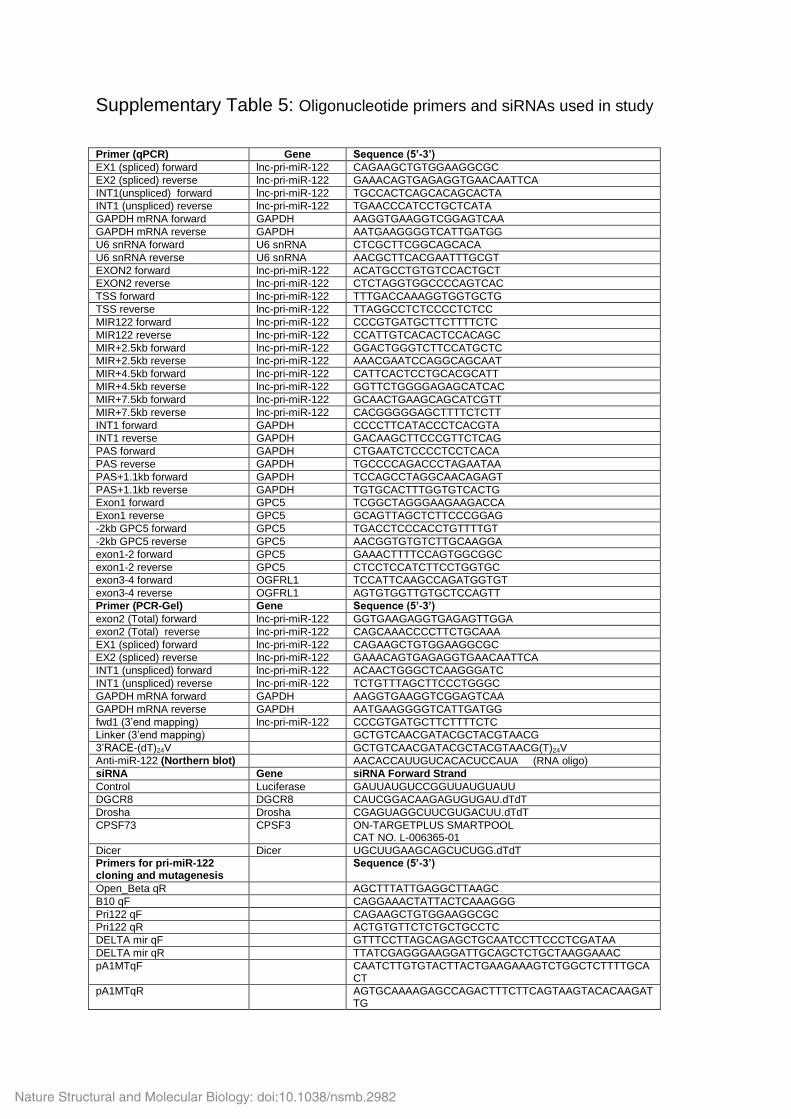
Supplementary Table 5: Oligonucleotide primers and siRNAs used in study
Primer (qPCR) Gene Sequence (5’-3’)
EX1 (spliced) forward lnc-pri-miR-122 CAGAAGCTGTGGAAGGCGC
EX2 (spliced) reverse lnc-pri-miR-122 GAAACAGTGAGAGGTGAACAATTCA
INT1(unspliced) forward lnc-pri-miR-122 TGCCACTCAGCACAGCACTA
INT1 (unspliced) reverse lnc-pri-miR-122 TGAACCCATCCTGCTCATA
GAPDH mRNA forward GAPDH AAGGTGAAGGTCGGAGTCAA
GAPDH mRNA reverse GAPDH AATGAAGGGGTCATTGATGG
U6 snRNA forward U6 snRNA CTCGCTTCGGCAGCACA
U6 snRNA reverse U6 snRNA AACGCTTCACGAATTTGCGT
EXON2 forward lnc-pri-miR-122 ACATGCCTGTGTCCACTGCT
EXON2 reverse lnc-pri-miR-122 CTCTAGGTGGCCCCAGTCAC
TSS forward lnc-pri-miR-122 TTTGACCAAAGGTGGTGCTG
TSS reverse lnc-pri-miR-122 TTAGGCCTCTCCCCTCTCC
MIR122 forward lnc-pri-miR-122 CCCGTGATGCTTCTTTTCTC
MIR122 reverse lnc-pri-miR-122 CCATTGTCACACTCCACAGC
MIR+2.5kb forward lnc-pri-miR-122 GGACTGGGTCTTCCATGCTC
MIR+2.5kb reverse lnc-pri-miR-122 AAACGAATCCAGGCAGCAAT
MIR+4.5kb forward lnc-pri-miR-122 CATTCACTCCTGCACGCATT
MIR+4.5kb reverse lnc-pri-miR-122 GGTTCTGGGGAGAGCATCAC
MIR+7.5kb forward lnc-pri-miR-122 GCAACTGAAGCAGCATCGTT
MIR+7.5kb reverse lnc-pri-miR-122 CACGGGGGAGCTTTTCTCTT
INT1 forward GAPDH CCCCTTCATACCCTCACGTA
INT1 reverse GAPDH GACAAGCTTCCCGTTCTCAG
PAS forward GAPDH CTGAATCTCCCCTCCTCACA
PAS reverse GAPDH TGCCCCAGACCCTAGAATAA
PAS+1.1kb forward GAPDH TCCAGCCTAGGCAACAGAGT
PAS+1.1kb reverse GAPDH TGTGCACTTTGGTGTCACTG
Exon1 forward GPC5 TCGGCTAGGGAAGAAGACCA
Exon1 reverse GPC5 GCAGTTAGCTCTTCCCGGAG
-2kb GPC5 forward GPC5 TGACCTCCCACCTGTTTTGT
-2kb GPC5 reverse GPC5 AACGGTGTGTCTTGCAAGGA
exon1-2 forward GPC5 GAAACTTTTCCAGTGGCGGC
exon1-2 reverse GPC5 CTCCTCCATCTTCCTGGTGC
exon3-4 forward OGFRL1 TCCATTCAAGCCAGATGGTGT
exon3-4 reverse OGFRL1 AGTGTGGTTGTGCTCCAGTT
Primer (PCR-Gel) Gene Sequence (5’-3’)
exon2 (Total) forward lnc-pri-miR-122 GGTGAAGAGGTGAGAGTTGGA
exon2 (Total) reverse lnc-pri-miR-122 CAGCAAACCCCTTCTGCAAA
EX1 (spliced) forward lnc-pri-miR-122 CAGAAGCTGTGGAAGGCGC
EX2 (spliced) reverse lnc-pri-miR-122 GAAACAGTGAGAGGTGAACAATTCA
INT1 (unspliced) forward lnc-pri-miR-122 ACAACTGGGCTCAAGGGATC
INT1 (unspliced) reverse lnc-pri-miR-122 TCTGTTTAGCTTCCCTGGGC
GAPDH mRNA forward GAPDH AAGGTGAAGGTCGGAGTCAA
GAPDH mRNA reverse GAPDH AATGAAGGGGTCATTGATGG
fwd1 (3’end mapping) lnc-pri-miR-122 CCCGTGATGCTTCTTTTCTC
Linker (3’end mapping) GCTGTCAACGATACGCTACGTAACG
3’RACE-(dT)24V GCTGTCAACGATACGCTACGTAACG(T)24V
Anti-miR-122 (Northern blot) AACACCAUUGUCACACUCCAUA (RNA oligo)
siRNA Gene siRNA Forward Strand
Control Luciferase GAUUAUGUCCGGUUAUGUAUU
DGCR8 DGCR8 CAUCGGACAAGAGUGUGAU.dTdT
Drosha Drosha CGAGUAGGCUUCGUGACUU.dTdT
CPSF73 CPSF3 ON-TARGETPLUS SMARTPOOL CAT NO. L-006365-01
Dicer Dicer UGCUUGAAGCAGCUCUGG.dTdT
Primers for pri-miR-122 cloning and mutagenesis
Sequence (5’-3’)
Open_Beta qR AGCTTTATTGAGGCTTAAGC
B10 qF CAGGAAACTATTACTCAAAGGG
Pri122 qF CAGAAGCTGTGGAAGGCGC
Pri122 qR ACTGTGTTCTCTGCTGCCTC
DELTA mir qF GTTTCCTTAGCAGAGCTGCAATCCTTCCCTCGATAA
DELTA mir qR TTATCGAGGGAAGGATTGCAGCTCTGCTAAGGAAAC
pA1MTqF CAATCTTGTGTACTTACTGAAGAAAGTCTGGCTCTTTTGCA CT
pA1MTqR AGTGCAAAAGAGCCAGACTTTCTTCAGTAAGTACACAAGAT TG
Nature Structural and Molecular Biology: doi:10.1038/nsmb.2982
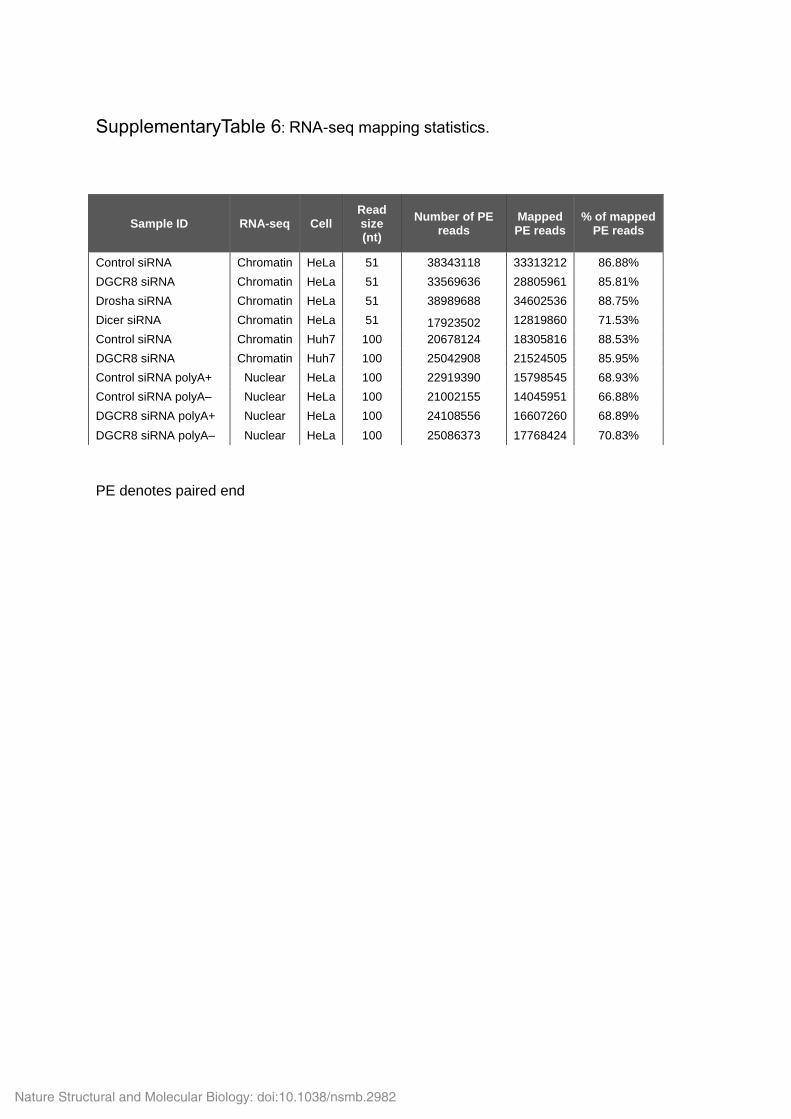
SupplementaryTable 6: RNA-seq mapping statistics.
PE denotes paired end
Sample ID RNA-seq Cell Read size (nt)
Number of PE reads
Mapped PE reads
% of mapped PE reads
Control siRNA Chromatin HeLa 51 38343118 33313212 86.88%
DGCR8 siRNA Chromatin HeLa 51 33569636 28805961 85.81%
Drosha siRNA Chromatin HeLa 51 38989688 34602536 88.75%
Dicer siRNA Chromatin HeLa 51 17923502 12819860 71.53%
Control siRNA Chromatin Huh7 100 20678124 18305816 88.53%
DGCR8 siRNA Chromatin Huh7 100 25042908 21524505 85.95%
Control siRNA polyA+ Nuclear HeLa 100 22919390 15798545 68.93%
Control siRNA polyA– Nuclear HeLa 100 21002155 14045951 66.88%
DGCR8 siRNA polyA+ Nuclear HeLa 100 24108556 16607260 68.89%
DGCR8 siRNA polyA– Nuclear HeLa 100 25086373 17768424 70.83%
Nature Structural and Molecular Biology: doi:10.1038/nsmb.2982