Embed Size (px)
Citation preview

Nature Immunology: doi:10.1038/ni.3630
Supplementary Figure 1
Characterization of Tet2-3 DKO mice
(a) Tet1, Tet2 and Tet3 mRNA expression assessed by quantitative RT-PCR. PolyA+ RNA was isolated from DP, CD4 SP and CD8 SP T cells from wild type (WT) and Tet2-/-Tet3fl/fl CD4cre (Tet2-3 DKO) mice. Relative mRNA expression levels were normalized to Gapdh. (b) 5hmC levels in genomic DNA of thymocyte subsets from WT (n=2) and Tet2-3 DKO (n=2) mice, estimated by anti-CMS dot blot after bisulfite treatment of genomic DNA to convert 5hmC to CMS. One representative experiment out of 2 is shown. (c) Haematoxylin and eosin staining of spleen, lung and liver sections from 6 week-old control (upper panel) and Tet2-3 DKO (lower panel) mice. (d) iNKT cells in lymph nodes (LN) of WT versus Tet2-/-, Tet3 KO and Tet2-3 DKO iNKT cells as defined by αGalCer-CD1d and TCRβ staining. (e) Percentage (left) and number (right) of iNKT cells in lymph nodes. n=6 (WT), n=3 (Tet2 KO), n=at least 2 (Tet3 KO), n=6 (Tet2/3 DKO). Data are mean + SEM. *P<0.05, **P< 0.01, ***P< 0.001, ****P< 0.0001 (unpaired t test)
Nature Immunology: doi:10.1038/ni.3630
Nature Immunology: doi:10.1038/ni.3630

Supplementary Figure 2
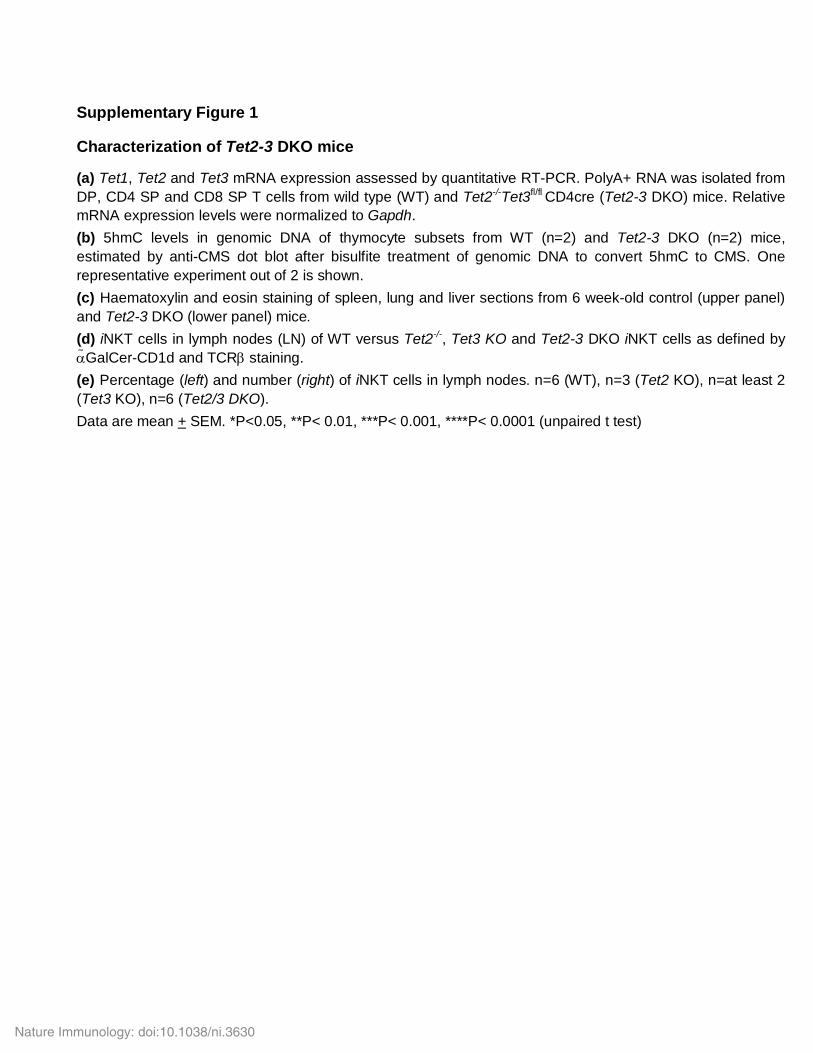
Analysis of CD4 and CD8 T cell development in wild type and Tet2-3 DKO mice. (a) Thymic cellularity in wild type (n=9) and Tet2-3 DKO (n=10) mice at 3-4 weeks of age. (b) Top, Analysis of DN, DP, CD4 and CD8 SP thymic subsets defined by surface staining for CD4 and CD8 markers. Bottom, Representation of these subsets after gating out iNKT cells as defined by αGalCer-CD1d and TCRβ staining. (c) Percentage and (d), Number of DP, CD4 SP and CD8 SP cells in the thymus of WT (n=6) and Tet2-3 DKO (n=5) mice at 3-4 weeks. (e) Representation of CD4 and CD8 T cells in lymph nodes (LN, top) and spleen (bottom) of WT and Tet2-3 DKO mice at 3-4 weeks. (f) Total number of cells in lymph nodes (LN) of 3-4 week old WT (n=3) and Tet2-3 DKO (n=3) mice. (g) Percentage and number of CD4 and CD8 cells in the LN of WT (n=6) and Tet2-3 DKO (n=3) mice analyzed at 3-4 weeks old. (h) Percentage and number of CD4 and CD8 cells in the spleen of WT (n=6) and Tet2-3 DKO (n=3) mice analyzed at 3-4 weeks old. Data are mean + SEM. *P<0.05, **P< 0.01, ***P< 0.001, ****P< 0.0001 (unpaired t test). At least 3 independent experiments were performed.
Nature Immunology: doi:10.1038/ni.3630
Nature Immunology: doi:10.1038/ni.3630

Supplementary Figure 3
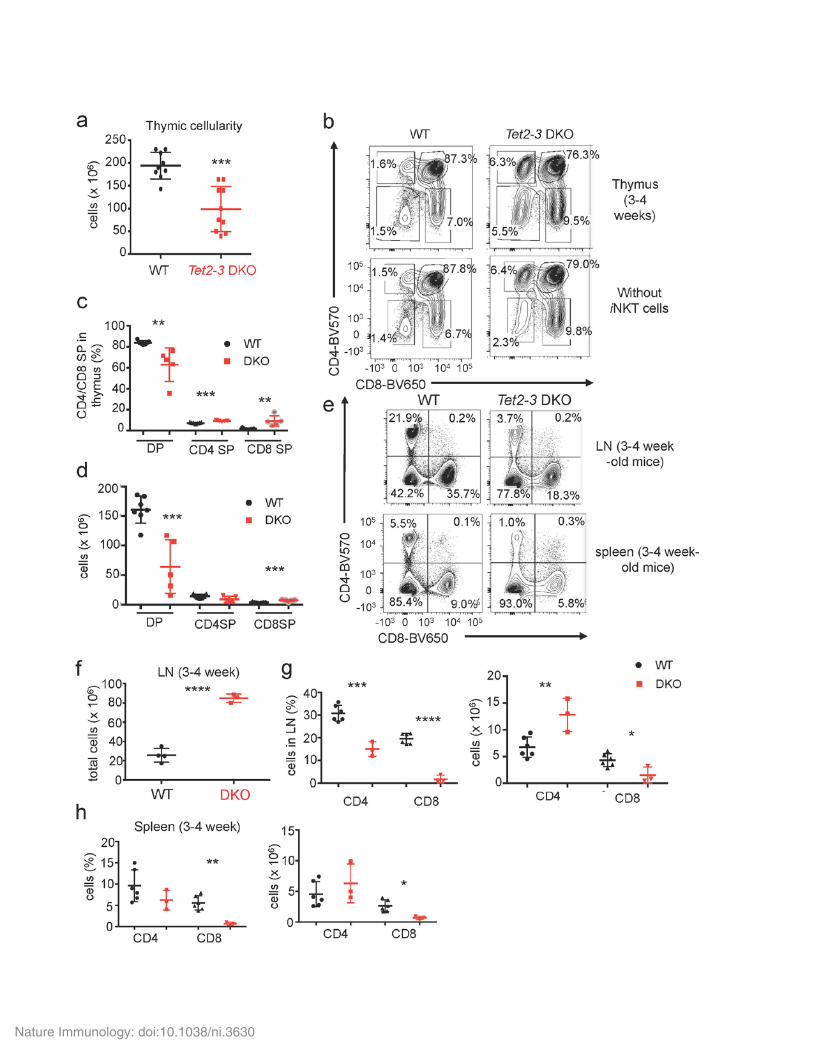
Profound loss of TET proteins is required for dysregulated expansion and function of iNKT cells. (a) iNKT cells in the thymus of representative 20 day-old WT versus Tet2-/-, Tet3 KO and Tet2-3 DKO mice, defined by staining with αGalCer-CD1d tetramer and anti-TCRβ. (b) Increased percentages (left) and numbers (right) of iNKT cells in spleens isolated from 4 week-old WT (n=6), T2-/- (T2 KO, n=3), T3 KO (n=3) and Tet2-3 DKO (n=10) mice. (c) Histogram evaluating the expression of RORγt (left); PLZF (center); and CD4 (right) in WT, single Tet2-/-
(Tet2 KO), Tet3 KO, Tet2-3 DKO thymic iNKT cells. (d, e) Histogram evaluating the expression of RORγt in the spleen (d) and lymph nodes (e) of WT, single Tet2-/-, Tet3 KO, Tet2-3 DKO iNKT cells. Data are mean + SEM. *P<0.05, **P< 0.01, ***P< 0.001, ****P< 0.0001 (unpaired t test)
Nature Immunology: doi:10.1038/ni.3630

Nature Immunology: doi:10.1038/ni.3630
Supplementary Figure 4
Cytokine production in Tet2-3 DKO iNKT cells. (a) Representative flow cytometric analysis of IL17 secretion by αGalCer-CD1d tetramer+ TCRβ+ cells. (b) Percentage of IL17-secreting iNKT cells among total iNKT cells. (c) Percentage of IL17-secreting iNKT cells among total thymocytes. (d) Representative flow cytometric analysis of IFNγ secretion by αGalCer-CD1d tetramer+ TCRβ+ TCR cells. (e) Percentage of IFNγ-secreting iNKT cells among total iNKT cells. (f) Percentage of IFNγ-secreting iNKT cells among total thymocytes. (g) Representative flow cytometric analysis of IL4 secretion by αGalCer-CD1d tetramer+ TCRβ+ cells. (h) Percentage of IL4-secreting iNKT cells among iNKT cells. (i) Percentage of IL4-secreting iNKT cells among total thymocytes. In all cases (a-i) 3 mice per genotype were evaluated in 2 independent experiments. (j) CD8 SP thymocytes were assessed by flow cytometry for the expression of markers that characterize memory-like CD8 cells: surface markers CD122, CD44, CXCR3 and the transcription factor Eomes. (k) Percentage of CD8 SP thymocytes that express CD122, CD44, CXCR3 and Eomes. WT (n=3) and Tet2-3 DKO (n=3) mice. For (j) and (k) 3 independent experiments were performed. Data are mean + SEM. *P<0.05, **P< 0.01, ***P< 0.001, ****P< 0.0001 (unpaired t test)
Nature Immunology: doi:10.1038/ni.3630

Nature Immunology: doi:10.1038/ni.3630
Supplementary Figure 5
Increase of NKT17 subset and reduction of NKT1 precursors in the NK1.1- Tet2-3 DKO iNKT cells. (a) Representative flow cytometric analysis of transcription factors PLZF and RORγt in αGalCer-CD1d tetramer+ CD24-TCRβ+ NK1.1- iNKT cells reveals dramatic increase of NKT17 subset. (b) Percentage of iNKT cells expressing PLZF and Rorγt (NKT17 subset) among the NK1.1– iNKT cells. n=5 WT mice and 7 Tet2-3 DKO mice. Data are compiled from 4 independent experiments. (c) Representative flow cytometric analysis of PLZF and T-bet expression in NK1.1– iNKT cells. The frequency of PLZF+Tbet+ NKT1 precursor cells is reduced. One representative experiment of 4 is shown. (d) Percentage of iNKT cells expressing PLZF and T-bet (NKT1 precursor cells) among NK1.1– iNKT cells. p<0.0001. n=5 WT mice and 7 Tet2-3 DKO mice. Data are compiled from 4 independent experiments. (e) Representative flow cytometric analysis of transcription factors PLZF and T-bet in αGalCer-CD1d tetramer+ CD24- TCRβ+ NK1.1+ iNKT cells shows expression of RORγt and emergence of an aberrant PLZFhigh Tbet+ population. (f) αGalCer-CD1d tetramer+ TCRβ+ NK1.1+ WT and Tet2-3 DKO iNKT cells were stimulated ex vivo with PMA and ionomycin. Representative flow cytometric analysis of αGalCer-CD1d tetramer+ cells that secrete IFNγ is shown. (g) Percentage of WT and Tet2-3 DKO αGalCer-CD1d tetramer+ CD24-TCRβ+NK1.1+ iNKT cells that secrete IFNγ. One of 2 independent experiments is shown. Cells isolated from 3 different mice/ genotype were evaluated. Data are mean + SEM. **P< 0.01, ****P< 0.0001 (unpaired t test)
Nature Immunology: doi:10.1038/ni.3630

Nature Immunology: doi:10.1038/ni.3630

Supplementary Figure 6
Correlation of DNA modifications (5mC and 5hmC) with gene expression
(a) Composite analysis of methylation (5mC+5hmC) in genes with decreased (left, downregulated) or increased (middle, upregulated) expression in young Tet2-3 DKO iNKT cells compared to WT. Right, Methylation in random genomic fragments. (b) Methylation changes in the promoter (left) and the gene body (right) of individual differentially-expressed genes, plotted against the ratio of their expression in WT versus young Tet2-3 DKO iNKT cells. Each dot represents a gene. Up (red dots) 698 genes with higher expression in WT compared to Tet2-3 DKO iNKT cells; Down (blue dots), 649 genes with lower expression in WT compared to Tet2-3 DKO iNKT cells.
Nature Immunology: doi:10.1038/ni.3630
Nature Immunology: doi:10.1038/ni.3630
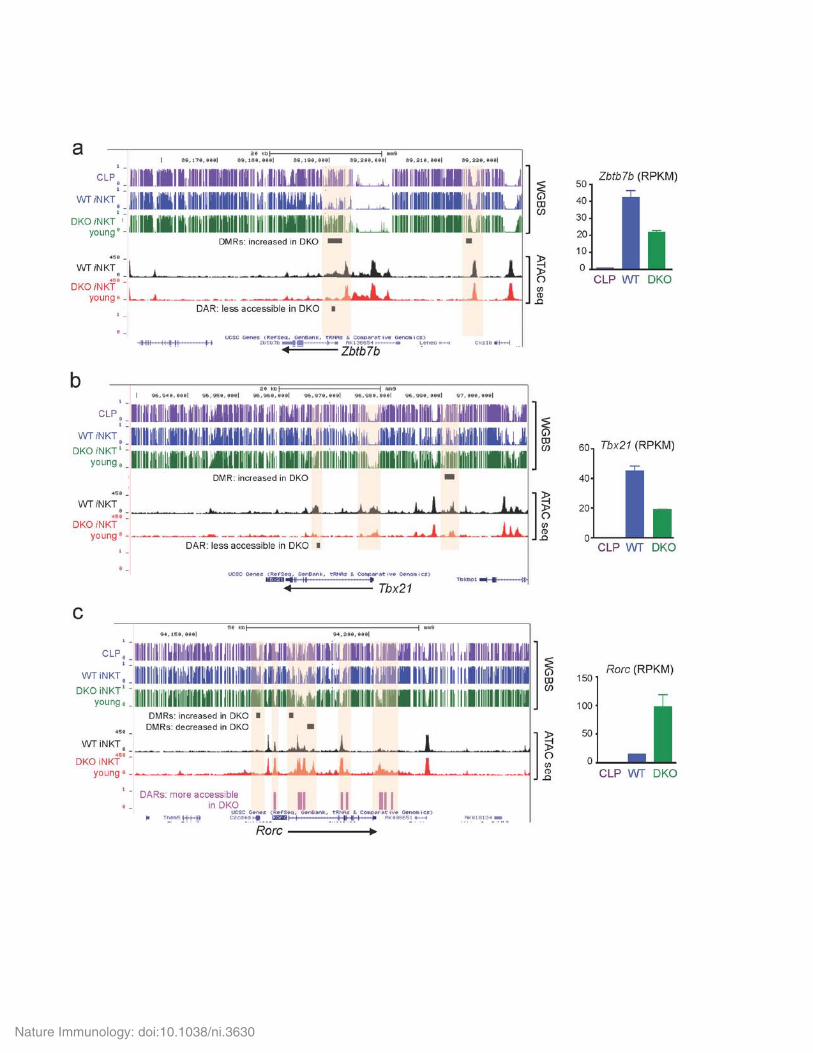
Supplementary Figure 7
Differentially modified regions (DMRs) and differentially accessible regions (DARs) in genes related to the iNKT cell specification program.
Genome browser views of DNA modification (5mC+5hmC) identified by WGBS and chromatin accessibility identified by ATAC-seq in (a) Tbx21; (b), Zbtb7b and (c) Rorc genes in common lymphoid progenitors (CLP, purple), WT iNKT cells (blue) and young Tet2/3 DKO iNKT cells (green). The arrow indicates the direction of transcription. Statistically significant DMRs (black) or DARs (purple for gain of accessibility in Tet2/3 DKO or black for more accessibility in WT iNKT cells) are indicated by horizontal bars. Selected regions in which modification or/and accessibility is altered from CLP to iNKT cells, and then progressively is affected in young iNKT cells are highlighted (salmon shading). For each gene, the gene expression level (RPKM) in each cell type is indicated.
Nature Immunology: doi:10.1038/ni.3630

Nature Immunology: doi:10.1038/ni.3630
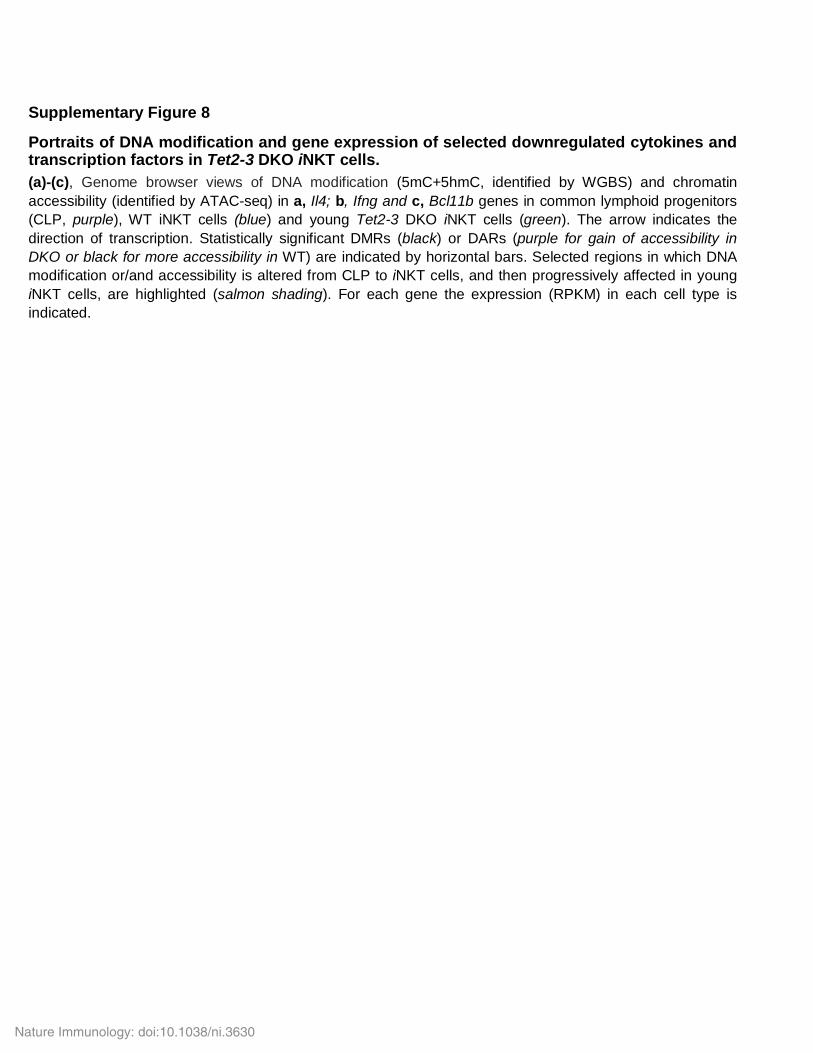
Supplementary Figure 8
Portraits of DNA modification and gene expression of selected downregulated cytokines and transcription factors in Tet2-3 DKO iNKT cells. (a)-(c), Genome browser views of DNA modification (5mC+5hmC, identified by WGBS) and chromatin accessibility (identified by ATAC-seq) in a, Il4; b, Ifng and c, Bcl11b genes in common lymphoid progenitors (CLP, purple), WT iNKT cells (blue) and young Tet2-3 DKO iNKT cells (green). The arrow indicates the direction of transcription. Statistically significant DMRs (black) or DARs (purple for gain of accessibility in DKO or black for more accessibility in WT) are indicated by horizontal bars. Selected regions in which DNA modification or/and accessibility is altered from CLP to iNKT cells, and then progressively affected in young iNKT cells, are highlighted (salmon shading). For each gene the expression (RPKM) in each cell type is indicated.
Nature Immunology: doi:10.1038/ni.3630

Supplementary Methods
DATA ANALYSIS
RNA-seq data analysis. The reads were mapped to the Mus musculus genome (mm9)
as well as UCSC transcriptome (downloaded on 05/17/2011) using Tophat1.
Multimapped reads were discarded. The read counts for each gene were quantified
using HTSeq-count tool2 with parameters: -m union -s reverse. Differential expression
analysis was performed using edgeR3 R package. Genes with RPKM less than 1 in at
least two replicates in each compared condition were filtered out before differential-
expression calling. Dispersion was estimated as tag-wise dispersion. Genes with
FDR<0.05 and at least 1.5-fold difference in expression were identified as differentially
expressed. SMARTseq samples were analyzed in the same way except NK1.1– and
NKT1 samples were mapped with Tophat2. Read counts for all SMART-seq samples
were quantified using HTSeq-count tool with parameters: -m union.
Heatmaps (Fig. 3b). RPKM values were transformed into row-wise z-scores and then
ordered using hierarchical clustering with Euclidean distance and Ward's minimum
variance method.
Heatmap of TFs (Fig. 4e). The log2 fold changes were ordered and truncated between -
2 and 2.
Enriched pathways. Enriched KEGG pathways were derived with GeneTrail tool4 using
default parameters and all UCSC mouse genes as a background.
CMS-IP seq. The reads of CMS-IP and input samples were mapped to the mm9
genome and lambda phage DNA using Bismark mapping tool5 with default parameters.
The mapping was done using the Bowtie 26 backend in the paired-end mode. Enriched
regions (ERGs) relative to input DNA were detected using the “findPeaks” routine in
HOMER 7 with parameters: -style histone –size 500.
In Fig. 5a, genes were categorized based on their expression and extended 10% of
length upstream from transcription start sites (TSS) and downstream from transcriptional
termination sites (TTS). Regions were separated into 101 equal-sized bins and average
Nature Immunology: doi:10.1038/ni.3630

counts per million reads values for each bin were calculated. Finally, log2 ratio between
CMS-IP and input was calculated for each bin. Plotting was done using ngs.plot 8.
Identifying tissue-specific enhancers. Tissue-specific enhancer lists can be found:
http://chromosome.sdsc.edu/mouse/download.html
Mapping of WGBS data. We employed BSMAP (v2.74)9 to align paired-end reads from
bisulfite-treated samples to the mm9 mouse reference genome allowing 4 mismatches.
Reads mapping to multiple locations in the reference genome with the same mapping
score were removed as well as the 5′ends bearing a quality lower than 20 (-R -p 12 -n
0 -v 4 -w 2 -r 1 -q 20).
Bisulfite conversion efficiency was estimated based on cytosine methylation in non-CpG
context. For all the samples the bisulfite conversion efficiency was higher than 0.996.
Duplicated reads caused by PCR amplification were removed by BSeQC (v1.2.0)10
applying a Pvalue cutoff Poisson distribution test in removing duplicate reads(1e-5).
Consequently, a maximum of three stacked reads at the same genomic location were
allowed and kept for further analysis. In addition, BSeQC was employed for removing
DNA methylation artifacts introduced by end repair during adaptor ligation. Overlapping
segments of two mates of a pair were reduced to only one copy to avoid considering the
same region twice during the subsequent DNA methylation quantification.
Methylation calling. To estimate CpG DNA methylation at both DNA strands, we
executed the methratio.py script, from BSMAP (v2.74)9 (-t 0 -g 1 -x CG -i correct).
DMR discovery -BSseq-. To identify differentially methylated cytosines (DMCs), pair-
wise comparisons between different groups [CLPs (n=2 technical replicates), wild-type
(n=2 biological replicates) and Tet2-Tet3 DKO (n=2 biological replicates) iNKT cells]
were performed with BSseq (v1.2.0)11. We required each tested CpG to be covered by at
least 2 reads in each of the samples. We kept 2% of the most significantly different
CpGs for the subsequent determination of DMRs, defined as more than 5 adjacent CpG
with more than 10% increase/decrease and no more than 500 bp away from one
another. From those pre-determined DMRs we filtered those who had a median change
of higher than 10% using a FDR of 5%. DMRs with at least 25% difference in
Nature Immunology: doi:10.1038/ni.3630

5mC+5hmC were used to generate the heatmap in Figure 6a. CLP data for two
technical replicates are from12 (accession code SRX852183). Annotation of DMRs. We used annotatepeak.pl script from HOMER7 suite to annotate
the Hyper- and Hypo- methylated DMRs to a region in the genome. DMRs falling inside
2000 bp upstream and 500 bp downstream of TSS were defined as DMR falling in
promoter region. All the other functional annotations were retrieved as they are from
annotatepeak.pl table results, i.e. exons, introns, 3′, 5′and intergenic regions. The
same procedure was conducted using all the CpGs in the mm9 genome, used as control
for further comparisons.
Identification of DMRs overlapping with 5hmC (CMS-IP). Tet2-Tet3 DKO DMRs with
at least 20% difference when compared to wild-type iNKT cells were identified (10,945
and 767, respectively). These were overlapped with CMS-IP peaks (5hmC peaks from
wild-type iNKT cells) using bedtools intersect and a threshold of 50% minimum region
intersection. We obtained 4568 more-methylated regions and 10 less-methylated
regions in DKO-intersecting 5hmC peaks. The results are shown in Table 1.
Correlation of DNA modifications (5mC and 5hmC) with differential gene expression. The distance from the transcription start site (TSS) to the transcription
termination site (TTS) for each differentially expressed gene was divided into 100 bins.
The average change in DNA modification within each gene body (bins 26-100) and each
promoter (+/- 2 kb relative to TSS) was calculated. The values against the log2-fold
change in expression of the corresponding gene were plotted. The data of this analysis
are shown in Supplementary Fig. 6b.
Discovery and Anotation of differentially accessible regions (DARs).
Mapping: For each sample, paired end ATAC-seq data was mapped against the mm9
using bowtie 13 ( -p 8 -m 1 --best --strata -X 2000 -S --fr --chunkmbs 1024). Unmapped
reads were processed with trim galore 14 and remapped using bowtie with the same
parameter settings as described above. Sequencing reads mapping to the reference
genome in this second round were merged with the initial mapping results. The merged
results were filtered for duplicated reads using PICARD tools 1.94
Nature Immunology: doi:10.1038/ni.3630
(http://picard.sourceforge.net) and reads mapping to the mitochondrial DNA (chrM) were
removed using samtools15.
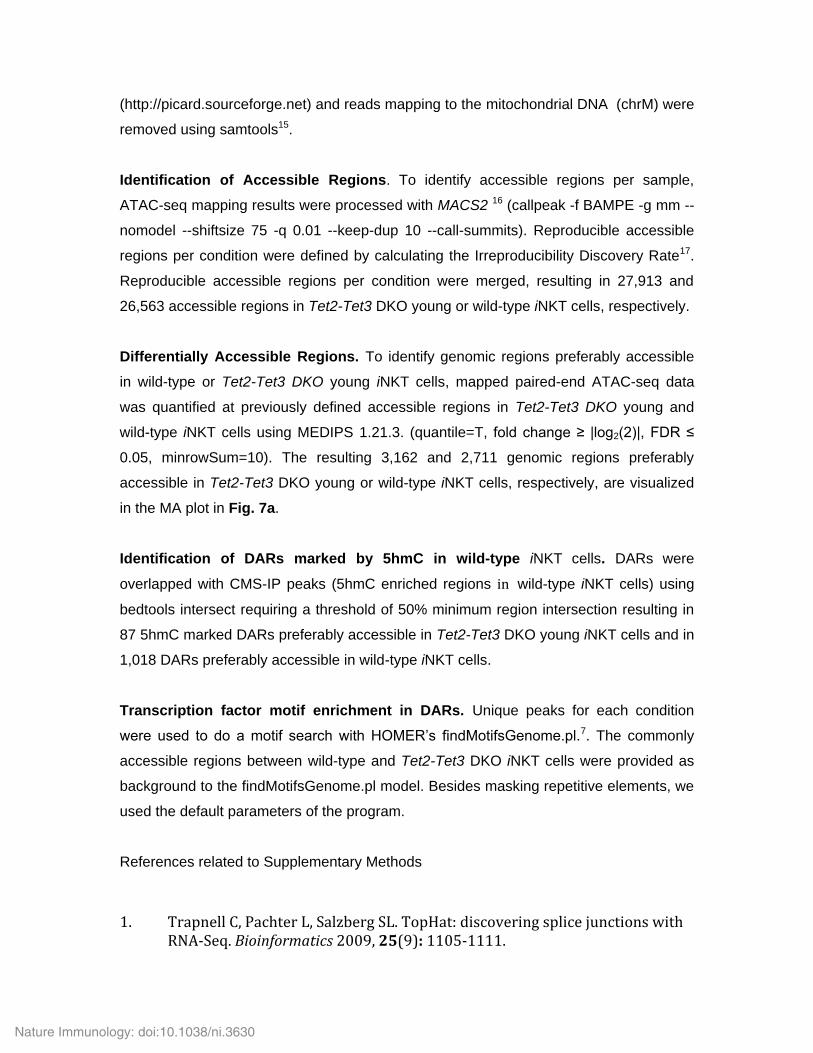
Identification of Accessible Regions. To identify accessible regions per sample,
ATAC-seq mapping results were processed with MACS2 16 (callpeak -f BAMPE -g mm --
nomodel --shiftsize 75 -q 0.01 --keep-dup 10 --call-summits). Reproducible accessible
regions per condition were defined by calculating the Irreproducibility Discovery Rate17.
Reproducible accessible regions per condition were merged, resulting in 27,913 and
26,563 accessible regions in Tet2-Tet3 DKO young or wild-type iNKT cells, respectively.
Differentially Accessible Regions. To identify genomic regions preferably accessible
in wild-type or Tet2-Tet3 DKO young iNKT cells, mapped paired-end ATAC-seq data
was quantified at previously defined accessible regions in Tet2-Tet3 DKO young and
wild-type iNKT cells using MEDIPS 1.21.3. (quantile=T, fold change ≥ |log2(2)|, FDR ≤
0.05, minrowSum=10). The resulting 3,162 and 2,711 genomic regions preferably
accessible in Tet2-Tet3 DKO young or wild-type iNKT cells, respectively, are visualized
in the MA plot in Fig. 7a. Identification of DARs marked by 5hmC in wild-type iNKT cells. DARs were
overlapped with CMS-IP peaks (5hmC enriched regions in wild-type iNKT cells) using
bedtools intersect requiring a threshold of 50% minimum region intersection resulting in
87 5hmC marked DARs preferably accessible in Tet2-Tet3 DKO young iNKT cells and in
1,018 DARs preferably accessible in wild-type iNKT cells.
Transcription factor motif enrichment in DARs. Unique peaks for each condition
were used to do a motif search with HOMER’s findMotifsGenome.pl.7. The commonly
accessible regions between wild-type and Tet2-Tet3 DKO iNKT cells were provided as
background to the findMotifsGenome.pl model. Besides masking repetitive elements, we
used the default parameters of the program.
References related to Supplementary Methods
1. Trapnell C, Pachter L, Salzberg SL. TopHat: discovering splice junctions with RNA-Seq. Bioinformatics 2009, 25(9): 1105-1111.
Nature Immunology: doi:10.1038/ni.3630
2. Anders S, Pyl PT, Huber W. HTSeq-a Python framework to work with high-
throughput sequencing data. Bioinformatics 2015, 31(2): 166-169. 3. Robinson MD, McCarthy DJ, Smyth GK. edgeR: a Bioconductor package for
differential expression analysis of digital gene expression data. Bioinformatics 2010, 26(1): 139-140.
4. Backes C, Keller A, Kuentzer J, Kneissl B, Comtesse N, Elnakady YA, et al.
GeneTrail--advanced gene set enrichment analysis. Nucleic acids research 2007, 35(Web Server issue): W186-192.
5. Krueger F, Andrews SR. Bismark: a flexible aligner and methylation caller for
Bisulfite-Seq applications. Bioinformatics 2011, 27(11): 1571-1572. 6. Langmead B, Trapnell C, Pop M, Salzberg SL. Ultrafast and memory-efficient
alignment of short DNA sequences to the human genome. Genome biology 2009, 10(3): R25.
7. Heinz S, Benner C, Spann N, Bertolino E, Lin YC, Laslo P, et al. Simple
combinations of lineage-determining transcription factors prime cis-regulatory elements required for macrophage and B cell identities. Molecular cell 2010, 38(4): 576-589.
8. Shen L, Shao N, Liu X, Nestler E. ngs.plot: Quick mining and visualization of
next-generation sequencing data by integrating genomic databases. BMC genomics 2014, 15: 284.
9. Xi Y, Li W. BSMAP: whole genome bisulfite sequence MAPping program. BMC
bioinformatics 2009, 10: 232. 10. Lin X, Sun D, Rodriguez B, Zhao Q, Sun H, Zhang Y, et al. BSeQC: quality
control of bisulfite sequencing experiments. Bioinformatics 2013, 29(24): 3227-3229.
11. Hansen KD, Langmead B, Irizarry RA. BSmooth: from whole genome bisulfite
sequencing reads to differentially methylated regions. Genome biology 2012, 13(10): R83.
12. Kieffer-Kwon KR, Tang Z, Mathe E, Qian J, Sung MH, Li G, et al. Interactome
maps of mouse gene regulatory domains reveal basic principles of transcriptional regulation. Cell 2013, 155(7): 1507-1520.
13. Langmead B, Salzberg SL. Fast gapped-read alignment with Bowtie 2. Nature methods 2012, 9(4): 357-359.
Nature Immunology: doi:10.1038/ni.3630

14. Krueger F. Trim Galore: A wrapper tool around Cutadapt and FastQC to consistently apply quality and adapter trimming to FastQ files, with some extra functionality for MspI-digested RRBS-type (Reduced Representation Bisufite-Seq) libraries. 2015. Available: http://www.bioinformatics.babraham.ac.uk/projects/trim_galore/. 2015.
15. Li H, Handsaker B, Wysoker A, Fennell T, Ruan J, Homer N, et al. The
Sequence Alignment/Map format and SAMtools. Bioinformatics 2009, 25(16): 2078-2079.
16. Zhang Y, Liu T, Meyer CA, Eeckhoute J, Johnson DS, Bernstein BE, et al. Model-
based analysis of ChIP-Seq (MACS). Genome biology 2008, 9(9): R137. 17. Li Q, Brown, J. B., Huang, H., & Bickel, P. Measuring reproducibility of high-
throughput experiments. . The annals of applied statistics 2011: 1752-1779.
Nature Immunology: doi:10.1038/ni.3630


![lk>k dkO;&ladyu (NUn] eqDr vfHkO;fDr eap)](https://img.pdfslide.us/doc/110x75/6264f415861d12082d479bac/lkgtk-dkoampladyu-nun-eqdr-vfhkofdr-eap.jpg)