Embed Size (px)
Citation preview

Supplementary Figure 1
Expression of apoptosis-related genes in tumor Treg cells. (a) Identification of FOXP3 Treg cells by FACS. CD45
+ cells were gated as enriched lymphoid cell populations with low-granularity.
Singlet cells were gated on the basis of forward and side scatter W and H parameters. Next, T cell subsets were identified on the basis
Nature Immunology: doi:10.1038/ni.3868

of CD3, CD4, and CD8 staining. Treg cells were identified as FOXP3+CD4
+ T cells. FOXP3
-CD4
+ T cells were conventional T cells. (b)
Ki67 expression in tumor infiltrating T cell subsets. Ki67 expression was detected in human ovarian cancer infiltrating FOXP3+ and
FOXP3-CD45
+CD3
+CD4
+ cells. Ki67 expression was shown in CD4
+ T cells from two representative ovarian cancer specimens (left
panel) and in FOXP3- and FOXP33
+CD4
+ T cell subsets (right panel). mean ± s.d., n = 10, Student’s t-test, * P < 0.05. (c) Split
Manders’ coefficient plot depicts the colocalization of FOXP3 (red) and cleaved CASP3 (green) in human ovarian cancer section. One representative of 10 is shown. (d,e) Effect of mouse tumor medium on Treg cell gene expression. Normal mouse GFP
+ Treg cells and
GFP- conventional T cells were cultured with MC38-medium for 24 hours. Expression of pro-apoptotic (d) and anti-apoptotic (e) genes
was quantified by real-time PCR. The level of each gene in Treg cells was normalized to that in conventional T cells. Data are shown as mean ± s.d., n = 5; Student's t-test, *P < 0.05.
Nature Immunology: doi:10.1038/ni.3868

Supplementary Figure 2
Suppressive activity of mouse live and apoptotic Treg cells. (a) Representative dot plots show Treg and Tconv apoptosis induced by anti-FAS mAb Jo-1. Annexin V expression was analyzed by FACS at 30 minutes and 4 hours. (b,c) Mouse Treg apoptosis was induced by different conditions. T cell suppressive assay was
Nature Immunology: doi:10.1038/ni.3868

performed with these apoptotic Treg cells. T cell TNF (b) and IL-2 (c) were measured on day 3 by ELISA, n = 5, Student’s t-test, *P < 0.05. (d-f) Effect of live and apoptotic Treg cells on ID8-OVA tumor immunity. ID8-OVA-bearing mice were treated with live and apoptotic Treg cells. Tumor growth is shown as final bioluminescent signal quantification (d). Effector T cell cytokine expression (e, f) was detected in cancer ascites fluid. Data presented as mean ± s.d., n = 10 animals per group; ANOVA with Dunett post-hoc test, *P < 0.05. (g) Scheme of pmel-specific B16-F10 model. B16-F10 tumor bearing RAG2
–/– mice received Pmel-specific T cells and intratumoral
apoptotic Treg cell administration as indicated.
Nature Immunology: doi:10.1038/ni.3868
Supplementary Figure 3
Apoptotic Treg cells mediated immunosuppression via small and non-protein molecules. (a-c) Effect of CTLA-4 blockade on apoptotic Treg-mediated immunosuppression. T cell immunosuppressive assay was performed with
apoptotic Treg cells in the presence of anti-CTLA4 mAb. TNF (a) and IFN- (b) were analyzed by FACS on day 3 and IL-2 (c) was
Nature Immunology: doi:10.1038/ni.3868

detected by ELISA on day 5 n = 5, ANOVA with Dunett’s post-hoc test, *P < 0.05. (d) Effect of apoptotic Treg supernatants on T cell IL-2 production. Apoptotic Treg supernatants were collected at 6 hour time point and were added into T cell culture. T cell IL-2 was measured by ELISA. One of 3 experiments is shown. (e-m) Effect of the indicated cytokine blockade on apoptotic Treg cell-mediated immunosuppression. T cell immunosuppressive assay was performed with apoptotic Treg cells in the presence of anti-TGF-β (e-g), anti-
EBI3 (h-j), and anti-IL-10 (k-l) mAbs. TNF (e, h, k) and IFN- (f, I, l) were analyzed by FACS on day 3. IL-2 (g, j, m) was detected by
ELISA on day 5. n = 5, ANOVA with Dunett’s post-hoc test, *P < 0.05.
Nature Immunology: doi:10.1038/ni.3868

Supplementary Figure 4
Adenosine production by apoptotic Treg cells.
Treg cell apoptosis was induced with anti-Fas mAb. Adenosine was measured by mass spectrometry in supernatants collected at different time points. Based on the standard curve (a) and the extracted ion changed chromatogram (b), adenosine was detected at 0.5 and 6 hours after induction of apoptosis (c). One of 3 independent experiments is shown.
Nature Immunology: doi:10.1038/ni.3868

Supplementary Figure 5
The metabolic profile of Treg cells. (a,b) Purine (a) and pyrimidine (b) associated metabolism pathway in tumor associated Treg cells. GSEA analysis was performed in tumor associated Treg cells compared to conventional T cells at GSE55705 data set from GEO database. (c) Intracellular content of ATP in Treg cells and Tconv. ATP level was measured in cell lysates with comparable amount of protein by colorimetric assay. Data shown as mean ± s.d., Student’s t-test, n = 5, *P < 0.05. (d) Effect of the pannexin-1 channel inhibitors on apoptotic Treg ATP release. Apoptosis was induced by anti-FAS treatment in the presence or absence of inhibitors probenecid and carbenoxolone. ATP in the supernatants was measured by colorimetric assay. Data presented as mean ± s.d., Student’s t-test, n = 5, *P < 0.05 in comparison with control. (e,f) Intracellular (e) and released (f) ATP in live (e) and apoptotic (f) wild-type or Nt5e
–/– mouse
Treg cells. ATP level in whole cells was
normalized to total protein expression (e). ATP in apoptotic Treg cell supernatants was shown at 30 minutes (f). n = 5, paired Student’s t-test, *P > 0.05. (g) Adenosine production by wild-type and Nt5e
–/– apoptotic Treg cells. Treg cell apoptosis was induced with anti-FAS and
the supernatants were collected at 30 minutes. After deproteinization, adenosine was measured by colorimetric assay. Data shown as mean ± s.d., n = 5, Student’s t-test, *P < 0.05.
Nature Immunology: doi:10.1038/ni.3868

Supplementary Figure 6
The effect of tumor oxidative stress on Treg cells. (a,b) Effect of glucose restriction and 2-DG on conventional T cell (a) and Treg (b) apoptosis. Human T cell subsets were cultured with or without glucose or 2-DG for 24 hours. Annexin V
+ T cells were measured by flow cytometry. One-way ANOVA with Dunnet’s post-
hoc test, *P < 0.05. (c) Effect of human ovarian cancer ascites on Treg apoptosis. Mouse Treg cells and conventional T cells (Tconv) were co-cultured with 50% ascites from intraperitoneal ID8 ovarian cancer bearing animals or hydrogen peroxide for 24 hours. Additional cultures were treated with NAC as a free radical scavenger. Annexin V
+ Treg cells and Tconv were analyzed by flow
cytometry. Data presented as mean ± s.d., n = 6, *P < 0.05. (d) Superoxide level in human ascites. The concentration of superoxide
was measured with colorimetric test. Water contains 2 M H2O2 as a positive control. Data are shown as mean ± s.d., n = 3. (e)
Mitochondrial load of mouse
Treg cells. The cells were treated with fluorescent mitochondrial activity dye (Mitotracker) and analyzed by
flow cytometry. One of 3 assays is shown. (f) Level of reactive oxygen species (ROS) in ovarian cancer infiltrating conventional T cells and Treg cells. The level of ROS was tested by CellROX Green and ROS content was shown as mean fluorescence intensity. Data shown as mean ± s.d., n = 5, Student’s t-test, *P < 0.05. (g,h) Expression of human Nrf2 and NRF2-associated genes and protiens in Treg cells. Nfe2l2 and NRF2-associated gene transcripts (g) and proteins (h) were determined in T cell subsets by real-time PCR and immunoblotting, respectively. Data presented as mean ± s.d., n = 5, paired Student’s t-test, *P < 0.05
Nature Immunology: doi:10.1038/ni.3868

Supplementary Table 1. Enrichment of Gene Ontology Terms in Treg cells compared to conventional T cells in B16 melanoma tissues (data series GSE55705).
Up-regulated genes GO term GO ID raw p-value adj. p-value electron transport chain GO:0022900 2.24e-07 0.0008 apoptotic process GO:0006915 2.47e-06 0.0031 generation of precursor metabolites and energy GO:0006091 3.57e-06 0.0031 programmed cell death GO:0012501 3.64e-06 0.0031 death GO:0016265 4.38e-06 0.0031 cell death GO:0008219 5.50e-06 0.0032 induction of apoptosis GO:0006917 0.0001 0.0292 regulation of apoptotic process GO:0042981 0.0001 0.0292 induction of programmed cell death GO:0012502 7.68e-05 0.0292 organophosphate metabolic process GO:0019637 0.0001 0.0292
Down-regulated genes RNA metabolic process GO:0016070 1.04e-10 2.79e-07 cellular macromolecule metabolic process GO:0044260 9.61e-10 8.59e-07 nucleic acid metabolic process GO:0090304 9.35e-10 8.59e-07 nucleobase-containing metabolic process GO:0006139 1.40e-09 9.39e-07 gene expression GO:0010467 5.97e-09 2.29e-06 cellular metabolic compound metabolic process GO:0006725 5.42e-09 2.29e-06 heterocycle metabolic process GO:0046483 5.76e-09 2.29e-06 RNA processing GO:0006396 1.69e-08 5.67e-06 cellular nitrogen compound metabolic process GO:0034641 2.74e-08 8.17e-06 organic cyclic compound metabolic process GO:1901360 4.32e-08 1.16e-05
Note: Enrichment of Gene Ontology Terms for biological processes was analyzed for significantly up- and down-regulated genes on a background of Affymetrix Mouse 420a v. 2.0 platform (GPL8321). The table contains top 10 significantly enriched biological processes terms.
Nature Immunology: doi:10.1038/ni.3868

Supplementary Table 2. Enrichment of KEGG Pathways in Treg cells compared to conventional T cells in B16 melanoma tissues (data series GSE55705).
Up-regulated pathways Pathway name raw p-value adj. p-value metabolic pathways 1.07e-62 1.99e-60 Huntington's disease 1.53e-25 1.42e-23 Alzheimer's disease 3.28e-24 2.03e-22 Parkinson's disease 2.31e-21 1.07e-19 oxidative phosphorylation 2.58e-19 9.60e-18 pathways in cancer 5.97e-16 1.85e-14 MAPK signaling pathway 8.74e-14 2.09e-12 cell cycle 8.97e-14 2.09e-12 proteasome 5.58e-13 1.15e-11 p53 signaling pathway 3.86e-10 4.22e-09 pyrimidine metabolism 6.14e-10 6.34e-09 purine metabolism 5.71e-06 2.21e-05 apoptosis 2.11e-05 7.11e-05 chemokine signaling pathway 4.59e-12 8.54e-11 pyruvate metabolism 0.0004 0.0011 fatty acid metabolism 0.0006 0.0013
Down-regulated pathways ribosome 3.18e-09 5.15e-07 ribosome biogenesis in eukarytes 0.0005 0.0324 RNA transport 0.0006 0.0324 spliceosome 0.0060 0.2430 acute myleoid leukemia 0.0241 0.7128 valine, leucine and isoleucine biosynthesis 0.0286 0.7128 aldosterone-regulated sodium reabsorption 0.0308 0.7128 RNA degradation 0.0363 0.7351 colorectal cancer 0.0442 0.7956 apoptosis 0.3392 0.7990
Note: Enrichment of KEGG Pathways were analyzed for significantly up- and down-regulated genes on a background of mouse genome. The table contains top 10
Nature Immunology: doi:10.1038/ni.3868

enriched pathways and some other statistically enriched pathways. Additionally, of the up-regulated pathways there are some significantly enriched pathways (below dashed line), but not in top 10.
Nature Immunology: doi:10.1038/ni.3868

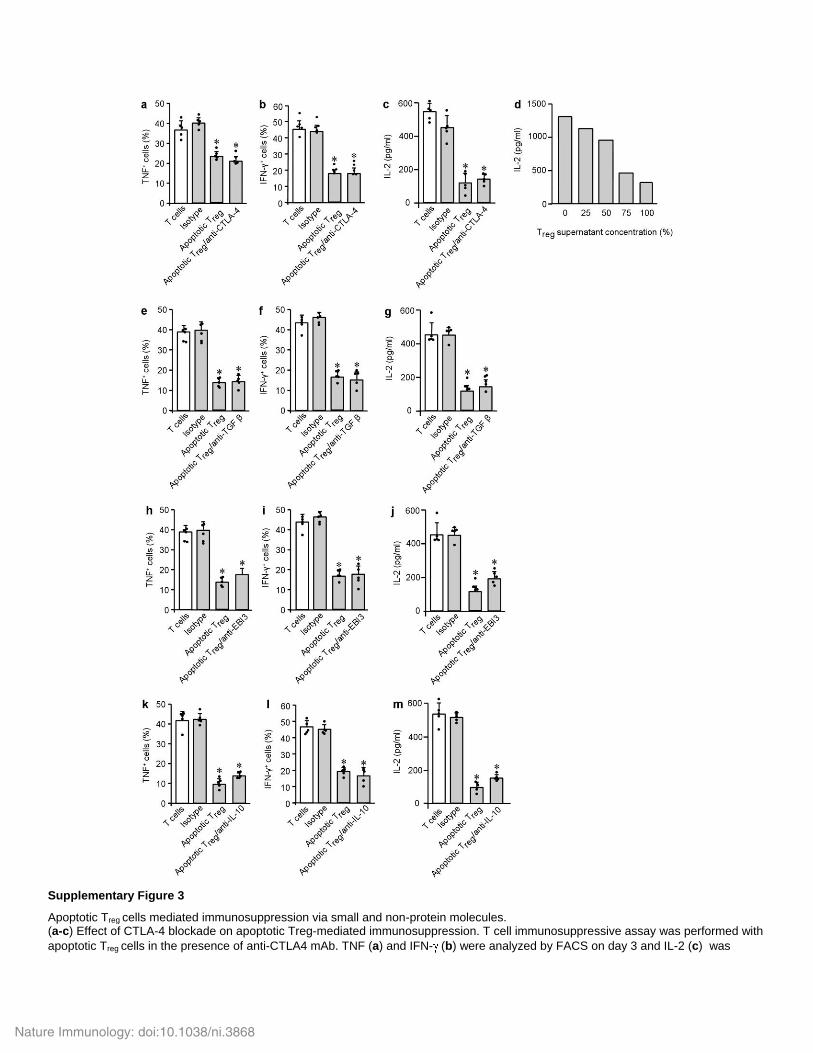
Supplementary Table 3. Primers for real-time PCR analysis (5’ 3’)
Gene ID (GeneBank)
Human
Forward Reverse
Bbc3 TGGGTGAGACCCAGTAAGGA CTCCCTGGGGCCACAAATCT
BclxL AGACCCCCAGTGCCATCAAT CATCCAAACTGCTGCTGTGCG
Bcl2 GGAGGCTGGGATGCCTTTGT AAAGCCAGCTTCCCCAATGA
Bim GGTCTGCAGTTTGTTGGAGC ATGGAAGCCATTGCACTGAGA
Bax TTTGCTTCAGGGTTTCATCCA CTGGAGACAGGGACATCAGT
Casp3 GCTCTGGTTTTCGGTGGGTG ACCACGGCAGGCCTGAATAAT
Casp8 AGCCCTGCTGAATTTGCTAGTC CAGGAGAATATAATCCGCTCCAC
Casp9 CAGGCCCCATATGATCGAGG TCAAGAGCACCGACATCACC
Fas CCCTGTCCTCCAGGTGAAAG AGACAAAGCCACCCCAAGTT
Gapdh CTCCTCCTGTTCGACAGTCA TGCAGGAGGCATTGCTGATG
Gclc ACCAGACCGGCAAAGAGAAG CCAGGACAGCCTAATCTGGG
Gclm AAGCACTTTCTCGGCTACGA TCATGAAGCTCCTCGCTGTG
Ggct CAGAGAGGATCCACCTCCGA TAACCCCTTCTTGCTCATCCAG
Hmox1 GTGCCACCAAGTTCAAGCAG CACGCATGGCTCAAAAACCA
Mcl1 GACTTTTGGCTACGGAGAAGGA AACTCCACAAACCCATCCCAG
Nqo1 GCTGGTTTGAGCGAGTGTTC CTGCCTTCTTACTCCGGAAGG
Nrf2 CGACCTTCGCAAACAACTCT TGTGGGCAACCTGGGAGTAG
Gene ID (GeneBank)
Mouse
Forward Reverse
Bbc3 CATAGAGCCACATGCGAGCG TGCTCTTCTTGTCTCCGCCG
BclxL ACCTCCTCCCCGACCTATGA CTATCTCCGGCGACCAGCAA
Bcl2 CAGCCTGAGAGCAACCCAAT TATAGTTCCACAAAGGCATCCCAG
Bim CTGCGAGCTGTGTTCCACTT ATGGAAGCCATTGCACTGAGA
Bax GAGCTGCAGAGGATGATTGC CTTGGATCCAGACAAGCAGC
Casp3 GAGCTTGGAACGGTACGCTA GCGAGATGACATTCCAGTGC
Nature Immunology: doi:10.1038/ni.3868
Casp8 AGAAAGCGAAGCAGCCTATGG TAGAAGAGCTGTAACCTGTGGC
Casp9 GCGCGACATGATCGAGGATA TGGTCTTTCTGCTCACCACC
Fas TGCTTGCTGGCTCACAGTTA GTTCCATGTTCACACGAGGC
Gapdh CCCTTAAGAGGGATGCTGCC TACGGCCAAATCCGTTCACA
Gclc TTGGGTCGCAAGTAGGAAGC GTTAGAGTACCGAAGCGGGG
Gclm TGGGCACAGGTAAAACCCAA CACCCTGATGCCTAAGCCAA
Ggct CGCCTGCAGGACTTTAAGC AAGCCGATCGGATACAAGCA
Hmox1 GAGCAGAACCAGCCTGAACT AAATCCTGGGGCATGCTGTC
Mcl1 CAAAGAGGCTGGGATGGGTTT CCCTATTGCACTCACAAGGC
Nqo1 CCGATTCAGAGTGGCATCCT GAGCAATTCCCTTCTGCCCT
Nrf2 TTGCCCTAGCCTTTTCTCCG ATGTGGGCAACCTGGGAGTA
Nature Immunology: doi:10.1038/ni.3868