Embed Size (px)
Citation preview
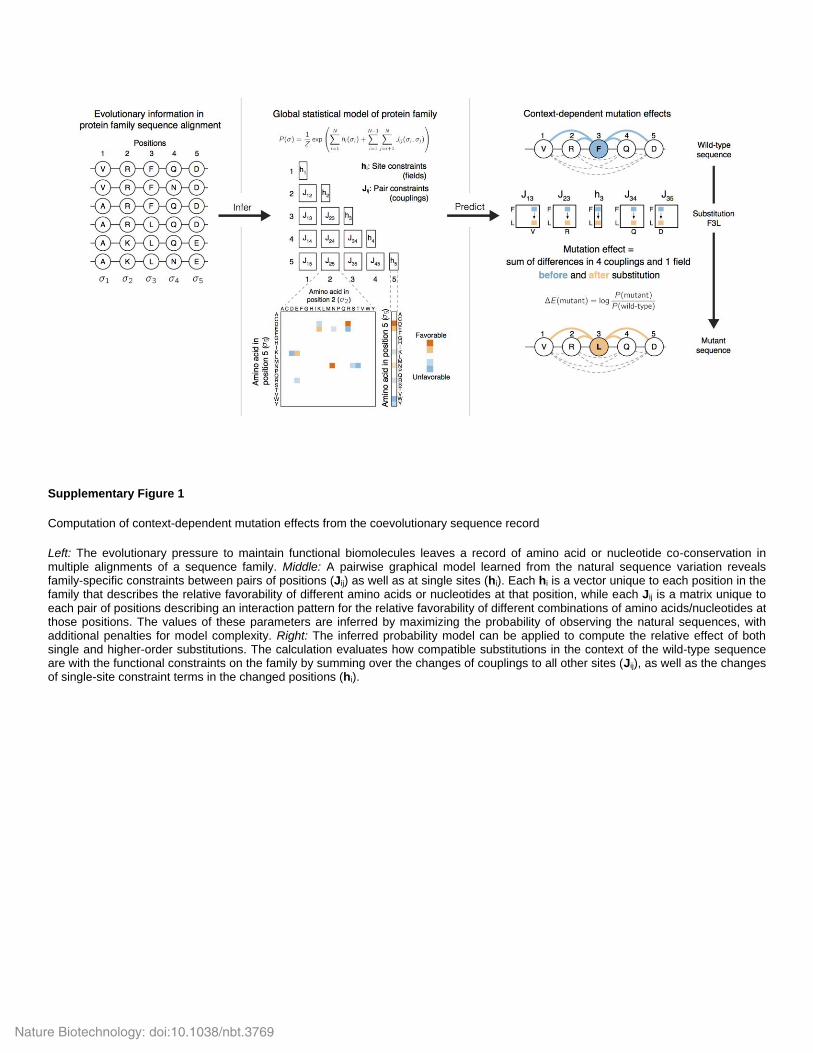
Supplementary Figure 1
Computation of context-dependent mutation effects from the coevolutionary sequence record
Left: The evolutionary pressure to maintain functional biomolecules leaves a record of amino acid or nucleotide co-conservation in multiple alignments of a sequence family. Middle: A pairwise graphical model learned from the natural sequence variation reveals family-specific constraints between pairs of positions (Jij) as well as at single sites (hi). Each hi is a vector unique to each position in the family that describes the relative favorability of different amino acids or nucleotides at that position, while each Jij is a matrix unique to each pair of positions describing an interaction pattern for the relative favorability of different combinations of amino acids/nucleotides at those positions. The values of these parameters are inferred by maximizing the probability of observing the natural sequences, with additional penalties for model complexity. Right: The inferred probability model can be applied to compute the relative effect of both single and higher-order substitutions. The calculation evaluates how compatible substitutions in the context of the wild-type sequence are with the functional constraints on the family by summing over the changes of couplings to all other sites (Jij), as well as the changes of single-site constraint terms in the changed positions (hi).
Nature Biotechnology: doi:10.1038/nbt.3769
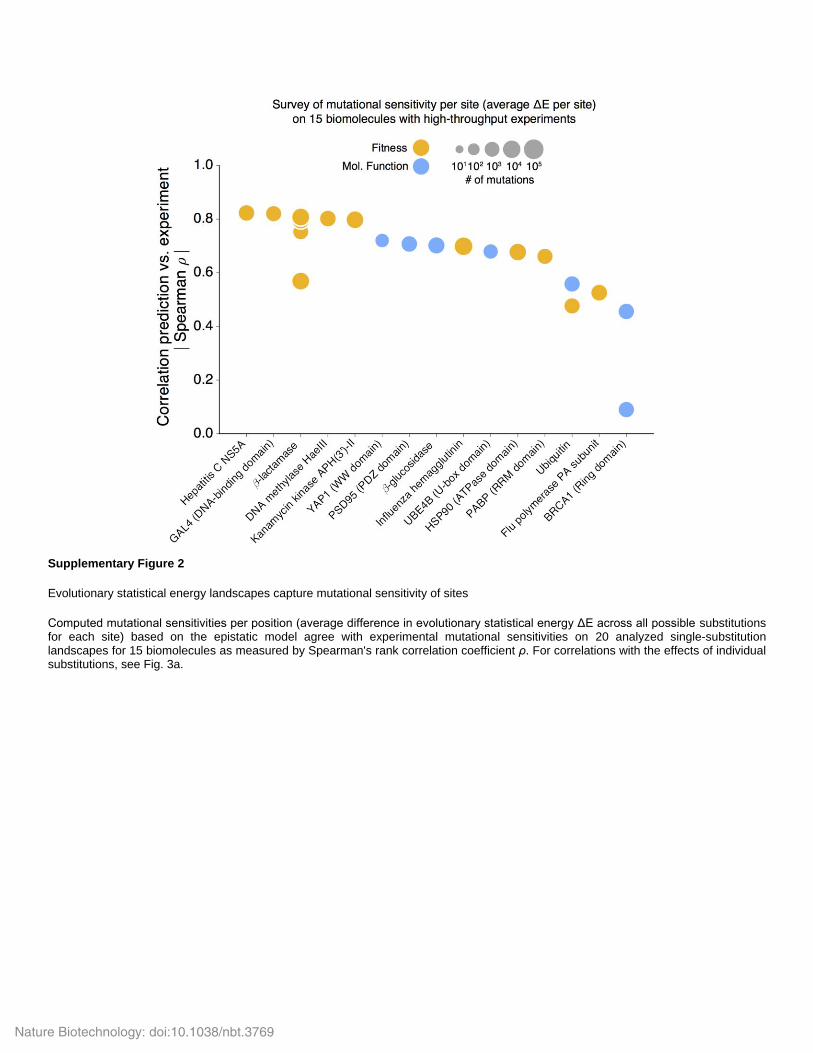
Supplementary Figure 2
Evolutionary statistical energy landscapes capture mutational sensitivity of sites
Computed mutational sensitivities per position (average difference in evolutionary statistical energy ΔE across all possible substitutions for each site) based on the epistatic model agree with experimental mutational sensitivities on 20 analyzed single-substitution landscapes for 15 biomolecules as measured by Spearman's rank correlation coefficient ρ. For correlations with the effects of individual substitutions, see Fig. 3a.
Nature Biotechnology: doi:10.1038/nbt.3769
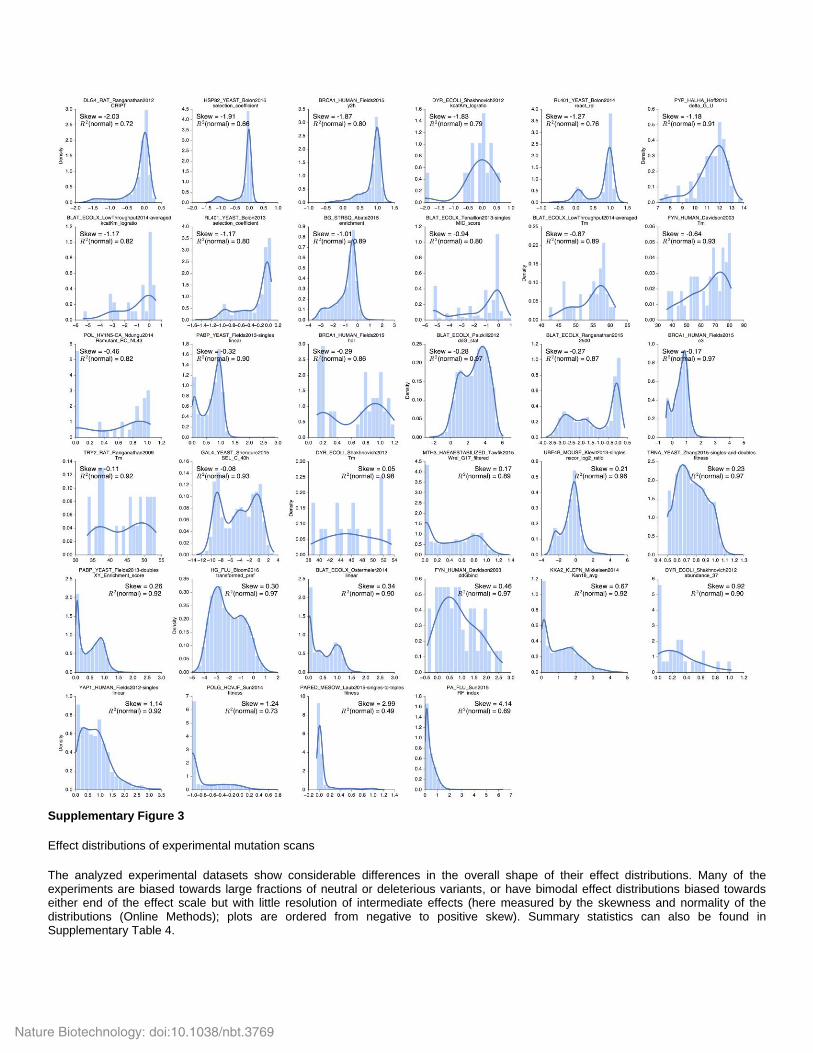
Supplementary Figure 3
Effect distributions of experimental mutation scans
The analyzed experimental datasets show considerable differences in the overall shape of their effect distributions. Many of the experiments are biased towards large fractions of neutral or deleterious variants, or have bimodal effect distributions biased towards either end of the effect scale but with little resolution of intermediate effects (here measured by the skewness and normality of the distributions (Online Methods); plots are ordered from negative to positive skew). Summary statistics can also be found in Supplementary Table 4.
Nature Biotechnology: doi:10.1038/nbt.3769

Supplementary Figure 4
Agreement between evolutionary statistical energies and all features tested in experimental mutation scans
Full set of Spearman's rank correlation coefficients ρ between evolutionary statistical energies ΔE and experimental effects across all tested functional features and conditions in the analyzed mutation scans (e.g. different antibiotic concentrations or number of rounds of selection). Correlation coefficients are provided in Supplementary Table 3.
Nature Biotechnology: doi:10.1038/nbt.3769
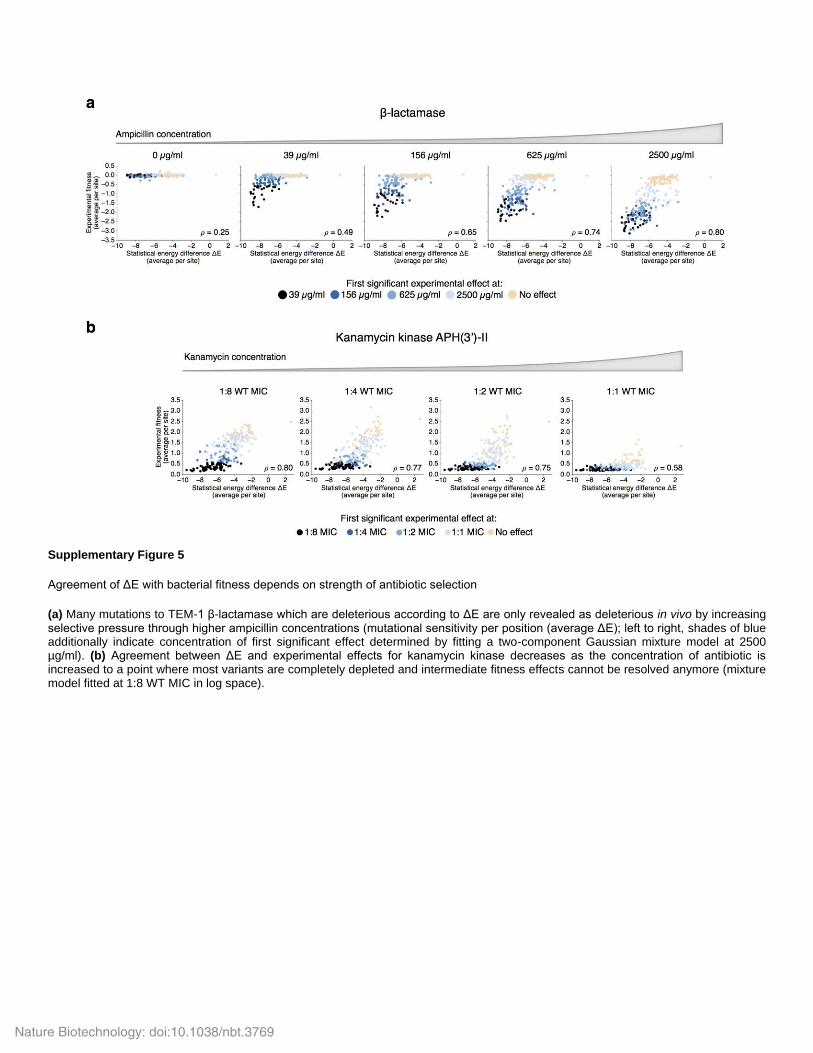
Supplementary Figure 5
Agreement of ΔE with bacterial fitness depends on strength of antibiotic selection
(a) Many mutations to TEM-1 β-lactamase which are deleterious according to ΔE are only revealed as deleterious in vivo by increasing selective pressure through higher ampicillin concentrations (mutational sensitivity per position (average ΔE); left to right, shades of blue additionally indicate concentration of first significant effect determined by fitting a two-component Gaussian mixture model at 2500 µg/ml). (b) Agreement between ΔE and experimental effects for kanamycin kinase decreases as the concentration of antibiotic is increased to a point where most variants are completely depleted and intermediate fitness effects cannot be resolved anymore (mixture model fitted at 1:8 WT MIC in log space).
Nature Biotechnology: doi:10.1038/nbt.3769
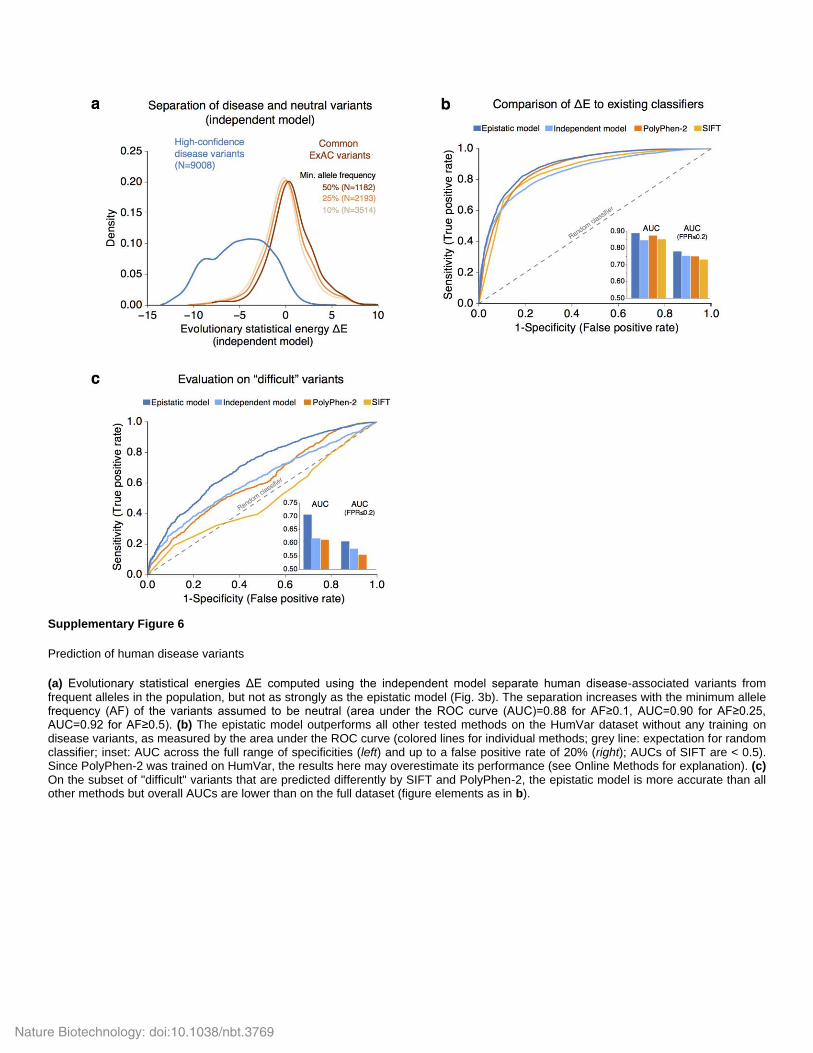
Supplementary Figure 6
Prediction of human disease variants
(a) Evolutionary statistical energies ΔE computed using the independent model separate human disease-associated variants from frequent alleles in the population, but not as strongly as the epistatic model (Fig. 3b). The separation increases with the minimum allele frequency (AF) of the variants assumed to be neutral (area under the ROC curve (AUC)=0.88 for AF≥0.1, AUC=0.90 for AF≥0.25, AUC=0.92 for AF≥0.5). (b) The epistatic model outperforms all other tested methods on the HumVar dataset without any training on disease variants, as measured by the area under the ROC curve (colored lines for individual methods; grey line: expectation for random classifier; inset: AUC across the full range of specificities (left) and up to a false positive rate of 20% (right); AUCs of SIFT are < 0.5). Since PolyPhen-2 was trained on HumVar, the results here may overestimate its performance (see Online Methods for explanation). (c) On the subset of "difficult" variants that are predicted differently by SIFT and PolyPhen-2, the epistatic model is more accurate than all other methods but overall AUCs are lower than on the full dataset (figure elements as in b).
Nature Biotechnology: doi:10.1038/nbt.3769
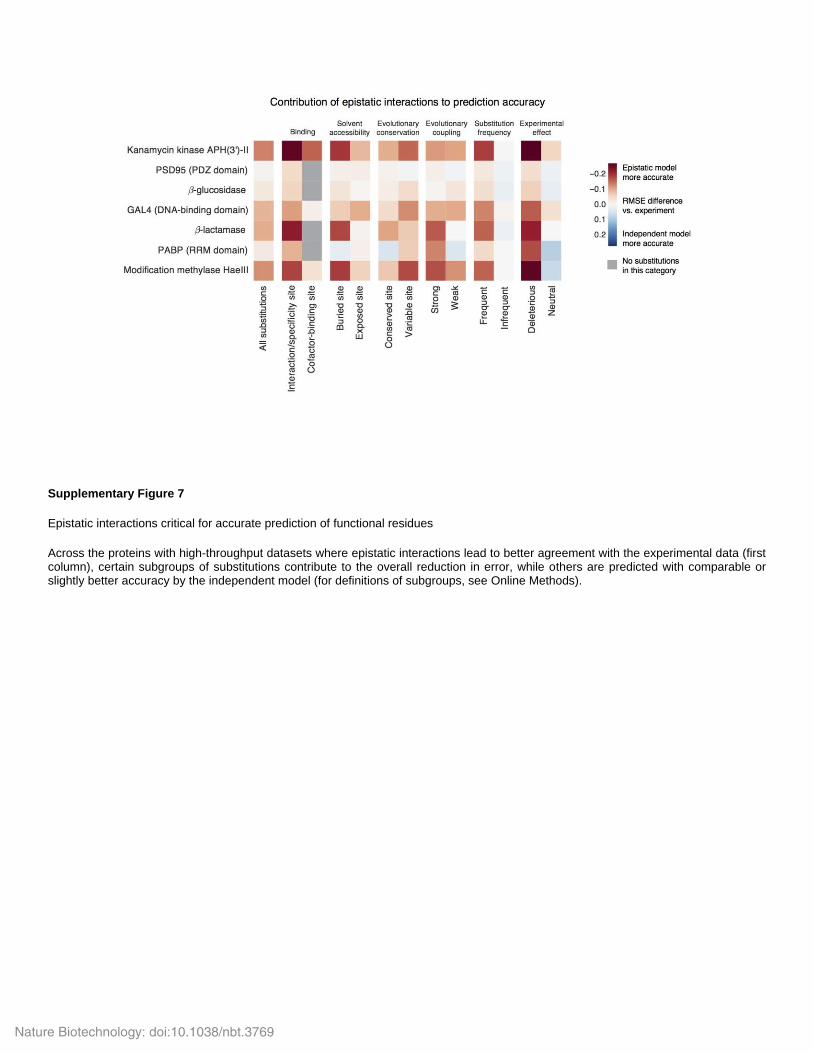
Supplementary Figure 7
Epistatic interactions critical for accurate prediction of functional residues
Across the proteins with high-throughput datasets where epistatic interactions lead to better agreement with the experimental data (first column), certain subgroups of substitutions contribute to the overall reduction in error, while others are predicted with comparable or slightly better accuracy by the independent model (for definitions of subgroups, see Online Methods).
Nature Biotechnology: doi:10.1038/nbt.3769
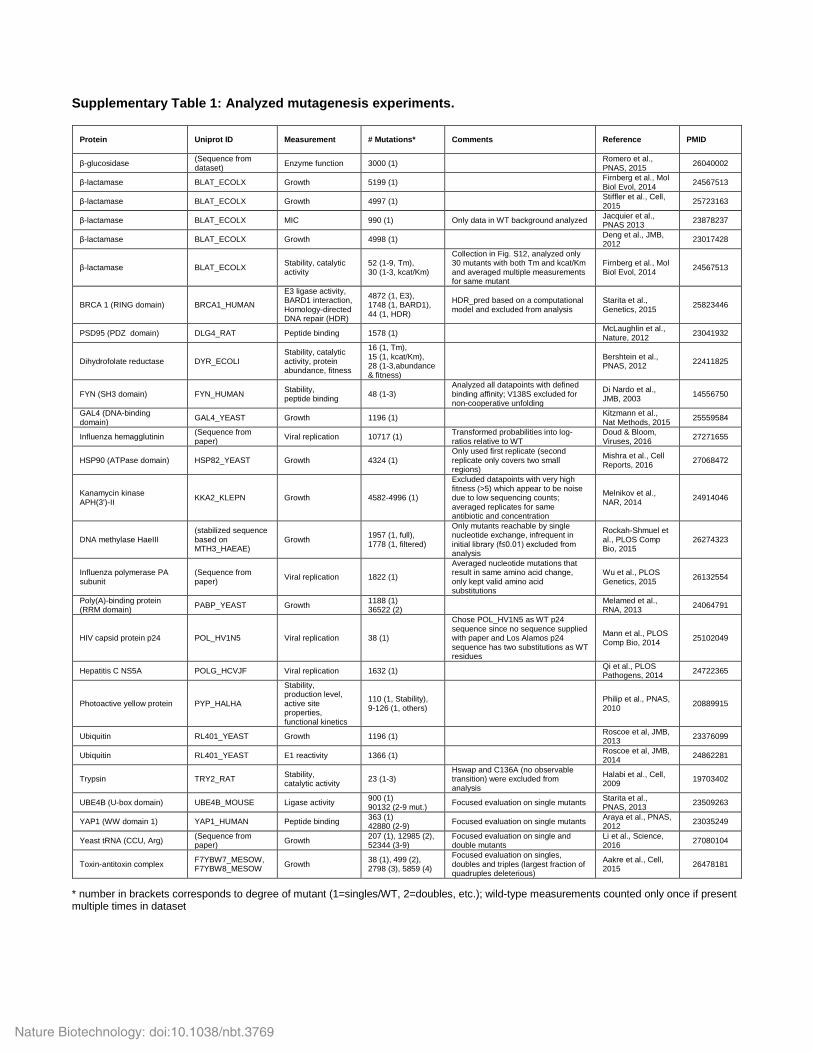
Supplementary Table 1: Analyzed mutagenesis experiments.
* number in brackets corresponds to degree of mutant (1=singles/WT, 2=doubles, etc.); wild-type measurements counted only once if present multiple times in dataset
Protein
Uniprot ID
Measurement
# Mutations*
Comments
Reference
PMID
β-glucosidase (Sequence from dataset) Enzyme function 3000 (1) Romero et al.,
PNAS, 2015 26040002
β-lactamase BLAT_ECOLX Growth 5199 (1) Firnberg et al., Mol Biol Evol, 2014 24567513
β-lactamase BLAT_ECOLX Growth 4997 (1) Stiffler et al., Cell, 2015 25723163
β-lactamase BLAT_ECOLX MIC 990 (1) Only data in WT background analyzed Jacquier et al., PNAS 2013 23878237
β-lactamase BLAT_ECOLX Growth 4998 (1) Deng et al., JMB, 2012 23017428
β-lactamase BLAT_ECOLX Stability, catalytic activity
52 (1-9, Tm), 30 (1-3, kcat/Km)
Collection in Fig. S12, analyzed only 30 mutants with both Tm and kcat/Km and averaged multiple measurements for same mutant
Firnberg et al., Mol Biol Evol, 2014 24567513
BRCA 1 (RING domain) BRCA1_HUMAN
E3 ligase activity, BARD1 interaction, Homology-directed DNA repair (HDR)
4872 (1, E3), 1748 (1, BARD1), 44 (1, HDR)
HDR_pred based on a computational model and excluded from analysis
Starita et al., Genetics, 2015 25823446
PSD95 (PDZ domain) DLG4_RAT Peptide binding 1578 (1) McLaughlin et al., Nature, 2012 23041932
Dihydrofolate reductase DYR_ECOLI Stability, catalytic activity, protein abundance, fitness
16 (1, Tm), 15 (1, kcat/Km), 28 (1-3,abundance & fitness)
Bershtein et al., PNAS, 2012 22411825
FYN (SH3 domain) FYN_HUMAN Stability, peptide binding 48 (1-3)
Analyzed all datapoints with defined binding affinity; V138S excluded for non-cooperative unfolding
Di Nardo et al., JMB, 2003 14556750
GAL4 (DNA-binding domain) GAL4_YEAST Growth 1196 (1) Kitzmann et al.,
Nat Methods, 2015 25559584
Influenza hemagglutinin (Sequence from paper) Viral replication 10717 (1) Transformed probabilities into log-
ratios relative to WT Doud & Bloom, Viruses, 2016 27271655
HSP90 (ATPase domain) HSP82_YEAST Growth 4324 (1) Only used first replicate (second replicate only covers two small regions)
Mishra et al., Cell Reports, 2016 27068472
Kanamycin kinase APH(3')-II KKA2_KLEPN Growth 4582-4996 (1)
Excluded datapoints with very high fitness (>5) which appear to be noise due to low sequencing counts; averaged replicates for same antibiotic and concentration
Melnikov et al., NAR, 2014 24914046
DNA methylase HaeIII (stabilized sequence based on MTH3_HAEAE)
Growth 1957 (1, full), 1778 (1, filtered)
Only mutants reachable by single nucleotide exchange, infrequent in initial library (f≤0.01) excluded from analysis
Rockah-Shmuel et al., PLOS Comp Bio, 2015
26274323
Influenza polymerase PA subunit
(Sequence from paper) Viral replication 1822 (1)
Averaged nucleotide mutations that result in same amino acid change, only kept valid amino acid substitutions
Wu et al., PLOS Genetics, 2015 26132554
Poly(A)-binding protein (RRM domain) PABP_YEAST Growth 1188 (1)
36522 (2) Melamed et al., RNA, 2013 24064791
HIV capsid protein p24 POL_HV1N5 Viral replication 38 (1)
Chose POL_HV1N5 as WT p24 sequence since no sequence supplied with paper and Los Alamos p24 sequence has two substitutions as WT residues
Mann et al., PLOS Comp Bio, 2014 25102049
Hepatitis C NS5A POLG_HCVJF Viral replication 1632 (1) Qi et al., PLOS Pathogens, 2014 24722365
Photoactive yellow protein PYP_HALHA
Stability, production level, active site properties, functional kinetics
110 (1, Stability), 9-126 (1, others) Philip et al., PNAS,
2010 20889915
Ubiquitin RL401_YEAST Growth 1196 (1) Roscoe et al, JMB, 2013 23376099
Ubiquitin RL401_YEAST E1 reactivity 1366 (1) Roscoe et al, JMB, 2014 24862281
Trypsin TRY2_RAT Stability, catalytic activity 23 (1-3)
Hswap and C136A (no observable transition) were excluded from analysis
Halabi et al., Cell, 2009 19703402
UBE4B (U-box domain) UBE4B_MOUSE Ligase activity 900 (1) 90132 (2-9 mut.) Focused evaluation on single mutants Starita et al.,
PNAS, 2013 23509263
YAP1 (WW domain 1) YAP1_HUMAN Peptide binding 363 (1) 42880 (2-9) Focused evaluation on single mutants Araya et al., PNAS,
2012 23035249
Yeast tRNA (CCU, Arg) (Sequence from paper) Growth 207 (1), 12985 (2),
52344 (3-9) Focused evaluation on single and double mutants
Li et al., Science, 2016 27080104
Toxin-antitoxin complex F7YBW7_MESOW, F7YBW8_MESOW Growth 38 (1), 499 (2),
2798 (3), 5859 (4)
Focused evaluation on singles, doubles and triples (largest fraction of quadruples deleterious)
Aakre et al., Cell, 2015 26478181
Nature Biotechnology: doi:10.1038/nbt.3769
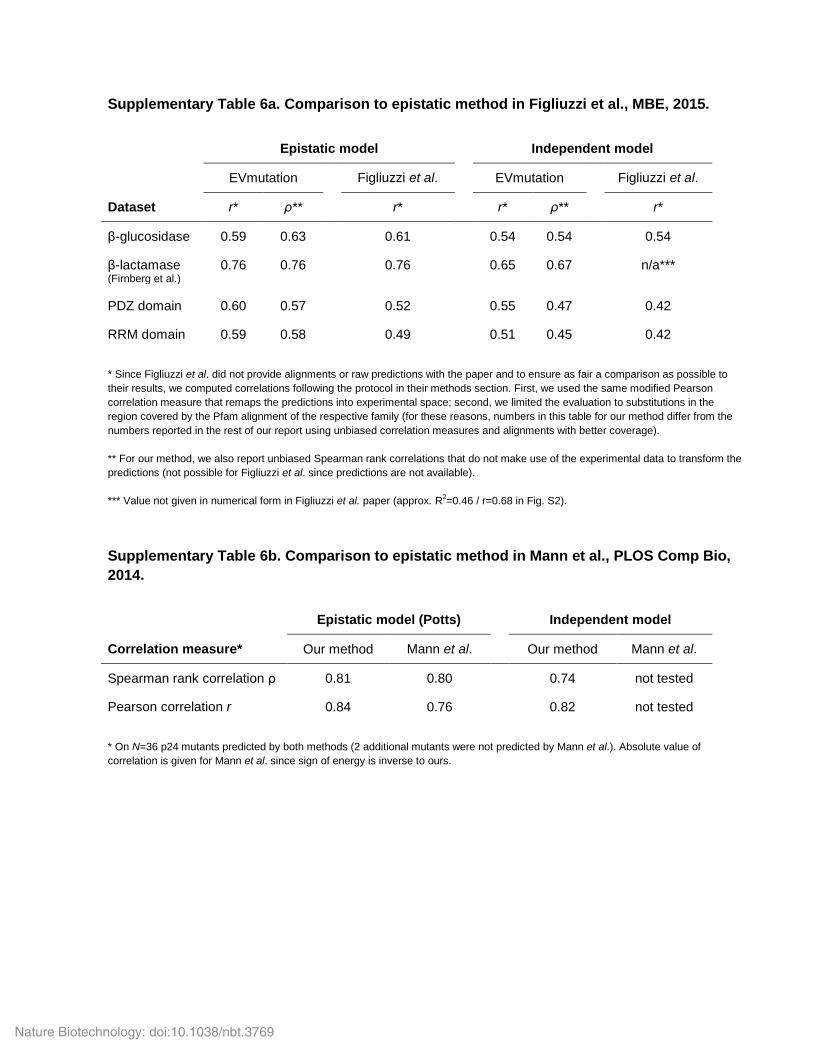
Supplementary Table 6a. Comparison to epistatic method in Figliuzzi et al., MBE, 2015. Epistatic model
Independent model
EVmutation Figliuzzi et al.
EVmutation Figliuzzi et al.
Dataset r* ρ** r*
r* ρ** r*
β-glucosidase 0.59 0.63 0.61
0.54 0.54 0.54
β-lactamase (Firnberg et al.)
0.76 0.76 0.76
0.65 0.67 n/a***
PDZ domain 0.60 0.57 0.52
0.55 0.47 0.42
RRM domain 0.59 0.58 0.49
0.51 0.45 0.42
* Since Figliuzzi et al. did not provide alignments or raw predictions with the paper and to ensure as fair a comparison as possible to their results, we computed correlations following the protocol in their methods section. First, we used the same modified Pearson correlation measure that remaps the predictions into experimental space; second, we limited the evaluation to substitutions in the region covered by the Pfam alignment of the respective family (for these reasons, numbers in this table for our method differ from the numbers reported in the rest of our report using unbiased correlation measures and alignments with better coverage). ** For our method, we also report unbiased Spearman rank correlations that do not make use of the experimental data to transform the predictions (not possible for Figliuzzi et al. since predictions are not available). *** Value not given in numerical form in Figliuzzi et al. paper (approx. R2=0.46 / r=0.68 in Fig. S2).
Supplementary Table 6b. Comparison to epistatic method in Mann et al., PLOS Comp Bio, 2014.
Epistatic model (Potts) Independent model
Correlation measure* Our method Mann et al. Our method Mann et al.
Spearman rank correlation ρ 0.81 0.80 0.74 not tested
Pearson correlation r 0.84 0.76 0.82 not tested
* On N=36 p24 mutants predicted by both methods (2 additional mutants were not predicted by Mann et al.). Absolute value of correlation is given for Mann et al. since sign of energy is inverse to ours.
Nature Biotechnology: doi:10.1038/nbt.3769