Embed Size (px)
Citation preview
Full Terms & Conditions of access and use can be found athttp://www.tandfonline.com/action/journalInformation?journalCode=gsol20
Download by: [American University of Beirut] Date: 25 November 2016, At: 04:41
International Journal of Sustainable Energy
ISSN: 1478-6451 (Print) 1478-646X (Online) Journal homepage: http://www.tandfonline.com/loi/gsol20
Natural ventilation in Beirut residential buildingsfor extended comfort hours
Ghina Annan, Nesreen Ghaddar & Kamel Ghali
To cite this article: Ghina Annan, Nesreen Ghaddar & Kamel Ghali (2016) Natural ventilationin Beirut residential buildings for extended comfort hours, International Journal of SustainableEnergy, 35:10, 996-1013, DOI: 10.1080/14786451.2014.972403
To link to this article: http://dx.doi.org/10.1080/14786451.2014.972403
Published online: 24 Oct 2014.
Submit your article to this journal
Article views: 102
View related articles
View Crossmark data
Citing articles: 2 View citing articles
International Journal of Sustainable Energy, 2016Vol. 35, No. 10, 996–1013, http://dx.doi.org/10.1080/14786451.2014.972403
Natural ventilation in Beirut residential buildings for extendedcomfort hours
Ghina Annan, Nesreen Ghaddar∗ and Kamel Ghali
Department of Mechanical Engineering, Faculty of Engineering and Architecture, American University ofBeirut, P.O. Box 11-236, Riad El Solh, Beirut 1107 2020, Lebanon
(Received 1 August 2014; accepted 27 September 2014)
This paper examines the effectiveness of natural ventilation in Beirut for the purpose of extending com-fort periods within living and sleeping zones of the residential buildings. A field survey is conductedto estimate the common window opening and degree profiles. A base case model representing a typi-cal residential apartment located in Beirut was then adopted in integrated environmental solutions (IES)software and calibrated by experimentation through monitoring simulated and measured data indoor. Thecalibrated IES model was used to evaluate typical wall layering and building local materials and theirrole in improving indoor comfort with natural ventilation. The simulation results showed that an opti-mal wall configuration of higher insulation and capacitance, comprised of a 5 cm layer of strawboardsandwiched between a 2 cm × 10 cm wall of masonry Hempcrete units, achieved the highest degree ofthermal comfort and enhanced comfort in winter season when compared to the base case.
Keywords: natural ventilation effectiveness; local building material; thermal comfort in naturallyventilated spaces
Nomenclature
Cp specific heat (kJ/kg K)DX direct expansionh height above the groundHrs number of hoursHVAC heating ventilation and air conditioningIAQ indoor air qualityP wind pressure in (Pa)RH relative humidity (%)SHGC solar heat gain coefficientT temperature (°C)Tcomf optimum comfort temperature for natural ventilationTa.out outdoor air temperatureU-value overall heat transfer coefficient (W/(m2 K)u weather file wind speed input at height 10 m
*Corresponding author. Email: [email protected]
© 2014 Taylor & Francis
International Journal of Sustainable Energy 997
V reference wind speed (m/s)WWR windows to wall ratio
Greek symbolsρ air density (kg/m3)
1. Introduction
The primary energy demand for residential buildings is dominated by the electricity demand forlighting and heating ventilation and air conditioning (HVAC). Mathews et al. (2001) have shownthat air conditioning is responsible for a substantial share of energy use (50%). With advancementof building materials and designs, natural convection has become one of the alternatives forreducing energy consumption.
In moderate climates, natural ventilation is an attractive method for reducing energy usewhile maintaining a comfortable and acceptable indoor air quality. It can be split into twotypes: wind-driven and buoyancy-driven ventilations, or it can be a mixture of both (Linden1999; van Moeseke et al. 2005; Larsen 2006; Baker 2011). Furthermore, Eftekhari and Pinnock(1998) examined natural ventilation inside a lightweight test room, where the predicted meanvote for thermal comfort indicated that the values in the afternoon significantly improved withhigher internal velocity. Also, Etheridge and Zhang (1998) indicated a strong synergy betweenporous insulation and wind energy, which could lead to significant reductions in energy consump-tion. Serghides and Georgakis (2012) proved that the building envelope of residential buildingshas the most cost-effective and energy-efficient impact on the building thermal performance inMediterranean climate, for which external insulation was derived as the most effective for theMediterranean climate. In addition, Eftekhari (1998) studied the thermal comfort in a naturallyventilated test room in the UK. It was deduced that adding a 200 mm thick layer of concrete tothe walls improved the thermal comfort over the summer by 40% (Eftekhari 1998).
Natural ventilation is mainly intended for countries with low winter temperatures and mod-erate summer temperatures. Germany initiated the use of night natural ventilation for the officebuilding (Pfafferott, Herkel, and Wambsganß 2004). Brazil (Arent, Paula, and Ghisi 2011) andBangkok (Tantasavasdi, Srebric, and Chen 2001) approve and encourage the use of natural ven-tilation in residential buildings. On the other hand, natural ventilation could hardly be applied inhot and humid climates, such as the countries of the Arabian Gulf region. However, several coun-tries, such as Dubai, started designing new buildings that implement passive cooling approachescombined with proper ventilation, courtyards, wind-towers, shading devices, thermal massr, andinsulation to reduce energy consumption (Haggag 2008). UAE, Qatar, Algeria, Pakistan, andAfghanistan have started to develop different cooling strategies to create a thermally comfortableenvironment (Abdurahiman 1988; Al-Shaali 2002; Haggag 2008; Network 2013). Generally, itwas found that natural ventilation can save 10–30% of total energy consumption (Walker 2010).In Thailand, 20% of energy savings in a year was achieved when natural ventilation was used inthe winter months (Tantasavasdi, Srebric, and Chen 2001).
In Lebanon, natural ventilation has not been studied or regulated by building designers. Major-ity of its constructions rely on HVAC systems to provide thermal comfort inside the apartments,for which 40–44% of its energy consumption is consumed by HVAC (Holness 2009). Residentialbuildings consume 65–73% of electrical energy production in Lebanon (Houri and Ibrahim-Korfali 2005) and 80% if combined with commercial buildings (Houri 2006). The interest inthis work is in the coastal zone which extends about 230 km in length (CDR 2005). The coastalzone has a minimum temperature of 7–16°C, a maximum temperature of 24–32°C, and a RHof 60–80% (UNDP 2005a, 2005b). A dry bulb temperature of 32°C and a RH of 55–66% can
998 G. Annan et al.
be regarded as satisfying and comfortable if accompanied by an air velocity of about 0.5 m/s(Ghaddar, Ghali, and Chehaitly 2011). Recently, Yassine et al. (2014) examined envelop designfeatures that can potentially reduce the energy consumed in attaining appropriate thermal comfortlevels in typical residential buildings. They evaluated wall configurations using natural carbonneutral material such as hemp fibres or Hempcrete mixed with concrete (Awwad et al. 2010; Tranet al. 2010) and rendered the mechanical ventilation a feasible option for attainment of comfortfor the largest number of hours per year in Beirut climate. Yassine et al. (2014) reported an opti-mal wall configuration comprised of a massive wall made of a 5 cm layer of straw sandwichedbetween 2 cm × 10 cm of Hempcrete in the living zone, in addition to 10 cm of Hempcrete inthe bedroom zone. The optimal configuration combined with modulation of mechanical ventila-tion was shown to reduce the operational cost of the house by 26.9% and the discomfort hoursby 37.8% compared to the base case of conventional air conditioning. It is of interest to exam-ine if such a configuration when combined with a natural configuration would also increase thenumber of comfort hours.
The objective of this work is to investigate the feasibility of the use of natural ventilation tech-niques in Lebanon, and more specifically in the coastal area of Lebanon. The monthly comforthours and their percentage of total occupied hours are studied when using natural ventilationcombined with the use of natural materials in building envelop to enhance comfort hours.
2. Research methodology
Typical building envelope materials used in Lebanon’s residential buildings as well as two-wallconfigurations using natural carbon neutral material are considered to assess their role in enhanc-ing natural ventilation feasibility to provide comfort in the different occupant zones: the livingand bedroom zones. A base case model representing a typical residential apartment Beirut will beadopted in integrated environmental solutions (IES) software. The IES model and inputs will beverified and calibrated by experimentation. A field survey is conducted through a questionnaireto estimate the common window opening and degree profiles practiced by occupants. This sur-vey data are used in the calibrated IES model in parametric simulations year round to obtain theeffectiveness of natural ventilation associated with different local envelop material and climatesin Beirut.
2.1. Simulation model
The IES virtual environment (IES-VE) is used as the simulation tool for studying building oper-ational energy consumption and for assessing the feasibility of natural ventilation (Ahmed andWongpanyathaworn 2012). Macroflo IES module is used to model and simulate air flow throughopenings in the building envelope, and ApacheSim IES module is used to model the heat transferprocesses occurring in and around the building based on first-principles mathematical modellingof heat transfer (Macroflo, MacroFlo Calculation Methods 2012).
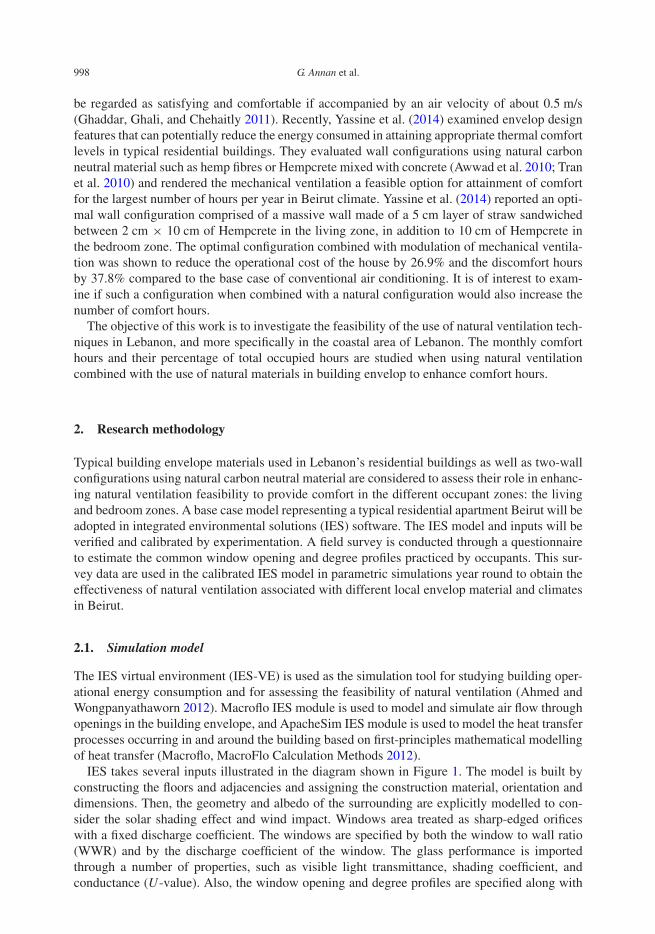
IES takes several inputs illustrated in the diagram shown in Figure 1. The model is built byconstructing the floors and adjacencies and assigning the construction material, orientation anddimensions. Then, the geometry and albedo of the surrounding are explicitly modelled to con-sider the solar shading effect and wind impact. Windows area treated as sharp-edged orificeswith a fixed discharge coefficient. The windows are specified by both the window to wall ratio(WWR) and by the discharge coefficient of the window. The glass performance is importedthrough a number of properties, such as visible light transmittance, shading coefficient, andconductance (U-value). Also, the window opening and degree profiles are specified along with
International Journal of Sustainable Energy 999
Figure 1. Diagram showing the inputs to IES.
the number of occupants, occupancy schedule, lighting/equipment, the internal gains, and theweather conditions. The window opening profile and window opening degree profile representthe period for which the occupants open their windows and the percentage of window openablearea, respectively.
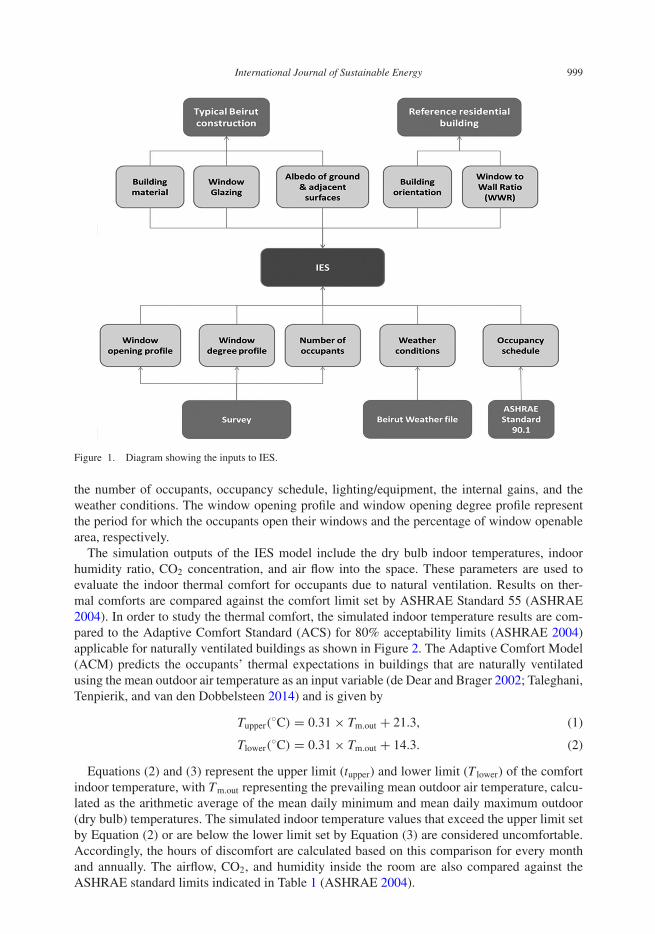
The simulation outputs of the IES model include the dry bulb indoor temperatures, indoorhumidity ratio, CO2 concentration, and air flow into the space. These parameters are used toevaluate the indoor thermal comfort for occupants due to natural ventilation. Results on ther-mal comforts are compared against the comfort limit set by ASHRAE Standard 55 (ASHRAE2004). In order to study the thermal comfort, the simulated indoor temperature results are com-pared to the Adaptive Comfort Standard (ACS) for 80% acceptability limits (ASHRAE 2004)applicable for naturally ventilated buildings as shown in Figure 2. The Adaptive Comfort Model(ACM) predicts the occupants’ thermal expectations in buildings that are naturally ventilatedusing the mean outdoor air temperature as an input variable (de Dear and Brager 2002; Taleghani,Tenpierik, and van den Dobbelsteen 2014) and is given by
Tupper(◦C) = 0.31 × Tm.out + 21.3, (1)
Tlower(◦C) = 0.31 × Tm.out + 14.3. (2)
Equations (2) and (3) represent the upper limit (tupper) and lower limit (T lower) of the comfortindoor temperature, with Tm.out representing the prevailing mean outdoor air temperature, calcu-lated as the arithmetic average of the mean daily minimum and mean daily maximum outdoor(dry bulb) temperatures. The simulated indoor temperature values that exceed the upper limit setby Equation (2) or are below the lower limit set by Equation (3) are considered uncomfortable.Accordingly, the hours of discomfort are calculated based on this comparison for every monthand annually. The airflow, CO2, and humidity inside the room are also compared against theASHRAE standard limits indicated in Table 1 (ASHRAE 2004).
1000 G. Annan et al.
Figure 2. ASHRAE Standard 55, acceptability limits.
Table 1. ASHRAE 55 Allowable limits (ASHRAE 2004).
Parameter Min.value Max.value
Macroflo ext. Vent (l/s) 0 10Room CO2 concentration (ppm) 400 1000Relative humidity (%) 20 64
2.2. Software calibration by experimentation
The calibration of the IES-VE is performed by experimentally monitoring temperature andenvironmental conditions for a typical residential apartment during summer in Beirut and thencomparing measured values with software predictions. The objective of the experiments is tocalibrate the IES-EV software and to ensure predicting accurately the building performance forlocal conditions and materials in the presence of natural ventilation. An actual reference and typ-ical residential building in Beirut was selected and is considered also the base case scenario forthe subsequent simulations after the software calibration.
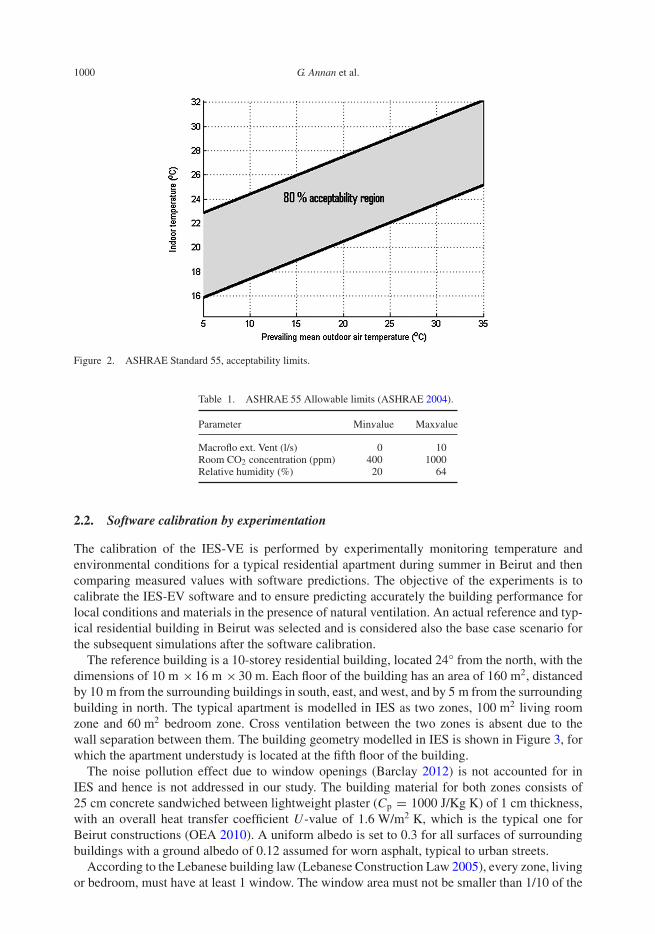
The reference building is a 10-storey residential building, located 24° from the north, with thedimensions of 10 m × 16 m × 30 m. Each floor of the building has an area of 160 m2, distancedby 10 m from the surrounding buildings in south, east, and west, and by 5 m from the surroundingbuilding in north. The typical apartment is modelled in IES as two zones, 100 m2 living roomzone and 60 m2 bedroom zone. Cross ventilation between the two zones is absent due to thewall separation between them. The building geometry modelled in IES is shown in Figure 3, forwhich the apartment understudy is located at the fifth floor of the building.
The noise pollution effect due to window openings (Barclay 2012) is not accounted for inIES and hence is not addressed in our study. The building material for both zones consists of25 cm concrete sandwiched between lightweight plaster (Cp = 1000 J/Kg K) of 1 cm thickness,with an overall heat transfer coefficient U-value of 1.6 W/m2 K, which is the typical one forBeirut constructions (OEA 2010). A uniform albedo is set to 0.3 for all surfaces of surroundingbuildings with a ground albedo of 0.12 assumed for worn asphalt, typical to urban streets.
According to the Lebanese building law (Lebanese Construction Law 2005), every zone, livingor bedroom, must have at least 1 window. The window area must not be smaller than 1/10 of the
International Journal of Sustainable Energy 1001
Figure 3. The building geometry of the similar building used for simulations: (a) facing north, (b) top view.
total area of the room (Lebanese Construction Law 2005). This is also considered in the basecase scenario. Sliding windows are widely used in Beirut area and in the newly constructedbuilding since it performs better in admitting natural ventilation (Gao and Lee 2010; Chiltonet al. 2012). The windows are fitted in both zones as follows: 2 m × 6 m on west and south sideof the living zone; 2 m × 5 m on south side; and 2 m × 6 m on east side of the bedroom. Internaldoors within each zone, living and bedroom, are opened to allow air movement. The windowglazing is composed of 6 mm clear float of conductivity of 1.06 W/m K, transmittance of 0.55,outside reflectance value of 0.4, inside reflectance of 0.05 and refractive index 1.526, a U-value
1002 G. Annan et al.
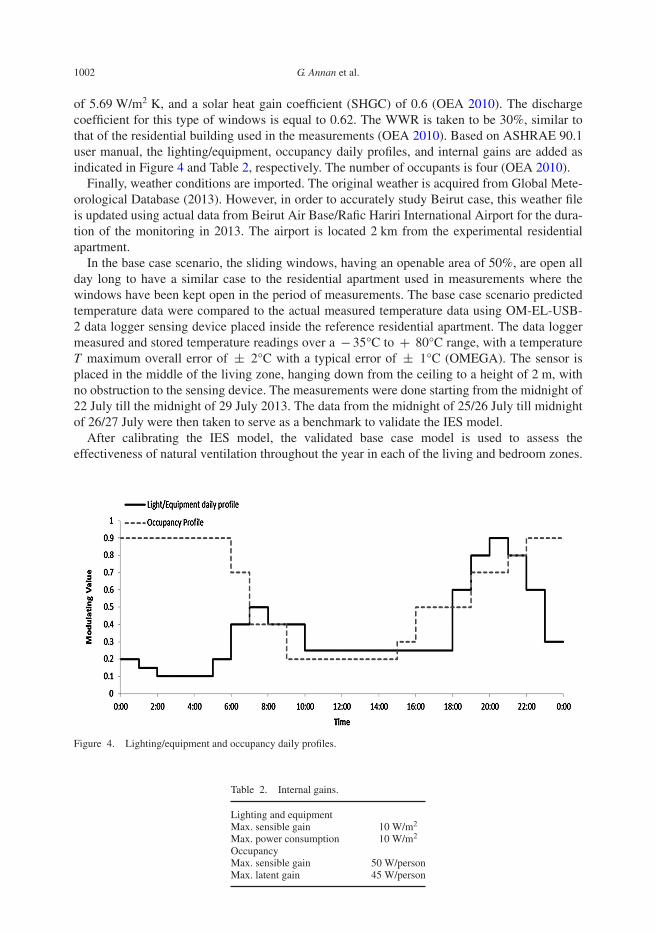
of 5.69 W/m2 K, and a solar heat gain coefficient (SHGC) of 0.6 (OEA 2010). The dischargecoefficient for this type of windows is equal to 0.62. The WWR is taken to be 30%, similar tothat of the residential building used in the measurements (OEA 2010). Based on ASHRAE 90.1user manual, the lighting/equipment, occupancy daily profiles, and internal gains are added asindicated in Figure 4 and Table 2, respectively. The number of occupants is four (OEA 2010).
Finally, weather conditions are imported. The original weather is acquired from Global Mete-orological Database (2013). However, in order to accurately study Beirut case, this weather fileis updated using actual data from Beirut Air Base/Rafic Hariri International Airport for the dura-tion of the monitoring in 2013. The airport is located 2 km from the experimental residentialapartment.
In the base case scenario, the sliding windows, having an openable area of 50%, are open allday long to have a similar case to the residential apartment used in measurements where thewindows have been kept open in the period of measurements. The base case scenario predictedtemperature data were compared to the actual measured temperature data using OM-EL-USB-2 data logger sensing device placed inside the reference residential apartment. The data loggermeasured and stored temperature readings over a − 35°C to + 80°C range, with a temperatureT maximum overall error of ± 2°C with a typical error of ± 1°C (OMEGA). The sensor isplaced in the middle of the living zone, hanging down from the ceiling to a height of 2 m, withno obstruction to the sensing device. The measurements were done starting from the midnight of22 July till the midnight of 29 July 2013. The data from the midnight of 25/26 July till midnightof 26/27 July were then taken to serve as a benchmark to validate the IES model.
After calibrating the IES model, the validated base case model is used to assess theeffectiveness of natural ventilation throughout the year in each of the living and bedroom zones.
Figure 4. Lighting/equipment and occupancy daily profiles.
Table 2. Internal gains.
Lighting and equipmentMax. sensible gain 10 W/m2
Max. power consumption 10 W/m2
OccupancyMax. sensible gain 50 W/personMax. latent gain 45 W/person
International Journal of Sustainable Energy 1003
3. Field survey of people comfort and associated window opening
3.1. Field survey objective and outcomes
A field survey is carried out among a population of occupants living in Beirut residential build-ings in order to extract information about common occupants’ adaptation in regulating theopening and closing of the windows in each season.
The questionnaire, shown in Appendix 1, consisted of 12 questions and requirements.Lebanon’s employment rate is almost 90.7% (Byblos 2013); accordingly the working popula-tion is reliable in defining a clear trend of window opening profile. We selected 225 employedhouseholds living in Beirut to take the survey. The directory of the 225 participants’ phone num-bers and email addresses was provided by the Order of Engineers and Architects of Beirut. Thesurvey was sent electronically with a clear guidance explaining to people some technical factsabout natural ventilation, and asking the occupants to fill out the survey. The respondent ratewas approximately 89% from 200 respondents. Survey participants were asked to specify thetimes they and their family members prefer to open the windows during the 24 h of a typical dayin both bedroom and living room zones. Accordingly, this opening profile is assumed all yearlong but with variable opening degrees based on seasonal variation. The survey also providedthe following valuable information:
(1) The average time of daily home occupancy and the number of occupants per apartment.(2) The average apartment area, WWR and external windows.(3) General satisfaction and free comments concerning natural ventilation.
The output values of the survey have been gathered, counted and tabulated using IBM SPSSStatistics software.
3.2. Field survey results
The field survey showed that 64% of the participants live in apartment block, with 71% amongthem having an apartment area ranging between 150 and 250 m2, 63% living between the thirdand sixth floors, with 76% of the total participants having three to five occupants per apartment.The common WWR resulted to be 30% with 70% of participants. Most respondents indicated thatduring March, April and mid-May (spring season), natural ventilation is practiced and comfort isachieved. They assumed that natural ventilation is only effective in this period where the outsidetemperature is moderate compared to other seasons.
Studying the frequency at which occupants open the windows in both living room and bed-room, it is realised that most of the respondents have similar behaviour in regulating the openingand closing of the windows.
In the living zone, the percentage of respondents who open the windows during the periodof 00:00 to 06:00 was only 5%. This frequency of respondents increases in the period between06:00 and 17:00 reaching 40% of the total respondents. In the period 17:00–22:00, this frequencyexceeded 50% of respondents and reaching 70% in the period 20:00–22:00. Then the frequencyof respondents who open the windows decreased again at 22:00 to around 40% in the period22:00–24:00.
A similar survey result analysis is done in the bedroom. The percentage of respondents whoopen the windows during the period 00:00–06:00 was around 40% of total respondents, stilllower than half of the survey respondents. This frequency of respondents increased to around60% in the period between 06:00 and 08:00, and then decreased again at 08:00 to under 50% andcontinued to decrease till reaching null frequencies in noon period. The frequency increased at
1004 G. Annan et al.
16:00 till reaching a frequency of 54% at 21:00. The frequency then continued to increase in theperiod 21:00 –24:00, reaching a frequency of around 70% between 22:00 and 24:00.
Literature studies have indicated that even though the window opening profile is related toenvironmental conditions such as indoor vs. outdoor temperature, it is also a function of personalfactors: routine and habits of households, and arriving and leaving times (Herkel, Knapp, andPfafferott 2008; Pfafferott and Herkel 2007; Xu, Fu, and Di 2009). Accordingly, a commonwindow opening profile was adopted to reflect the behavior of occupants in opening and closingof the windows as in the following:
• In the living zone, window open from 17:00 to 22:00.• In the bedroom, window open from 06:00 to 08:00 and from 21:00 to 24:00.
The survey also specified the estimated window opening degree profiles of occupants, whichrepresent the degree to which the window can be opened depending on the season. As per therespondents, a minimal degree of 25% is preferred in rainy seasons and a maximal degree of100% is preferred in hot seasons in which the temperature is too high and rain is of no concern.Both minimal and maximal degrees are reflected with degrees of 25% in fall and winter and100% in spring and summer in IES.
4. Importing the weather file and validation of IES model
4.1. Importing the weather file
In order to replicate the original Beirut weather file, AUTODESK-Ecotect is used to import thedata from an excel sheet that has the exact form of a weather file template. Actual Beirut weatherdata taken from Beirut Airport weather station have been added to the excel sheet, containingthe temperature, relative humidity, wind speed, and wind direction, which mainly affect naturalventilation. The excel sheet for the whole year weather data is converted to EnergyPlus weatherfile format (.epw) using AUTODESK-Ecotect so that it can be read by IES.
4.2. Calibration of IES model
In order to calibrate IES results, the reference apartment used in measurements is modelled inIES. The sliding windows, with an openable area of 50%, are open all day long to have a casesimilar to the residential apartment used in measurements where the windows have been keptopen in the period of measurements. The zone is susceptible to solar radiation throughout theday, which is also accounted in IES simulations. The simulation temperature results are thencompared to the actual measured temperatures inside the reference apartment.
A comparison between the resulting simulated and measured temperatures inside the apart-ment showed a difference of 0.93°C between the two data starting the midnight of 25/26 Julyuntil the midnight of 26/27 July, taking into account the temperature error margin of the sensingdevice used and small variations between the model in IES and the actual reference building. Todecrease this difference, a calibration of IES model was performed. Natural ventilation highlydepends on wind flow and its interaction with the building envelope, on openings and on solarradiation. The wind flow is mainly dependent on the WWR, whereas the solar radiation reachinginside the apartment could be affected by the SHGC of the window used and the building mate-rial. The WWR is kept fixed, 30%. Any airflow into the apartment will be mainly from the openwindow with slight effect from any tiny cracks leaking air into the apartment.
International Journal of Sustainable Energy 1005
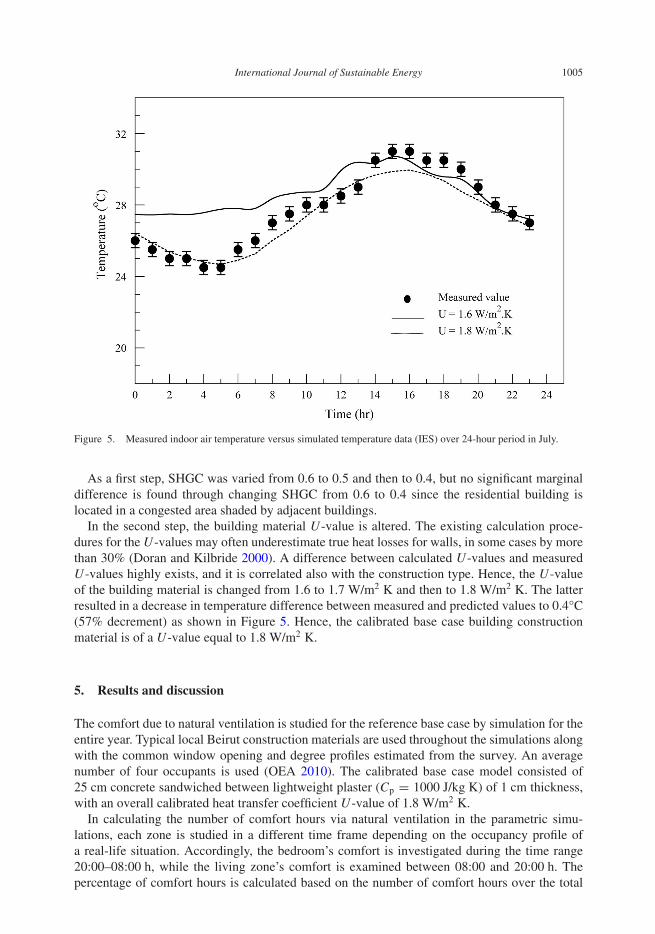
Figure 5. Measured indoor air temperature versus simulated temperature data (IES) over 24-hour period in July.
As a first step, SHGC was varied from 0.6 to 0.5 and then to 0.4, but no significant marginaldifference is found through changing SHGC from 0.6 to 0.4 since the residential building islocated in a congested area shaded by adjacent buildings.
In the second step, the building material U-value is altered. The existing calculation proce-dures for the U-values may often underestimate true heat losses for walls, in some cases by morethan 30% (Doran and Kilbride 2000). A difference between calculated U-values and measuredU-values highly exists, and it is correlated also with the construction type. Hence, the U-valueof the building material is changed from 1.6 to 1.7 W/m2 K and then to 1.8 W/m2 K. The latterresulted in a decrease in temperature difference between measured and predicted values to 0.4°C(57% decrement) as shown in Figure 5. Hence, the calibrated base case building constructionmaterial is of a U-value equal to 1.8 W/m2 K.
5. Results and discussion
The comfort due to natural ventilation is studied for the reference base case by simulation for theentire year. Typical local Beirut construction materials are used throughout the simulations alongwith the common window opening and degree profiles estimated from the survey. An averagenumber of four occupants is used (OEA 2010). The calibrated base case model consisted of25 cm concrete sandwiched between lightweight plaster (Cp = 1000 J/kg K) of 1 cm thickness,with an overall calibrated heat transfer coefficient U-value of 1.8 W/m2 K.
In calculating the number of comfort hours via natural ventilation in the parametric simu-lations, each zone is studied in a different time frame depending on the occupancy profile ofa real-life situation. Accordingly, the bedroom’s comfort is investigated during the time range20:00–08:00 h, while the living zone’s comfort is examined between 08:00 and 20:00 h. Thepercentage of comfort hours is calculated based on the number of comfort hours over the total
1006 G. Annan et al.
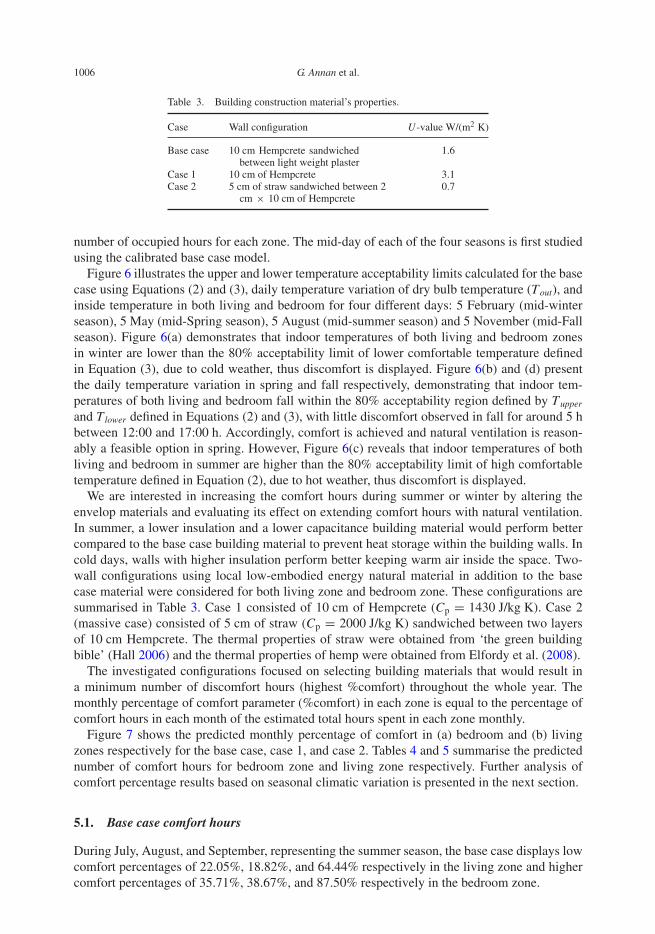
Table 3. Building construction material’s properties.
Case Wall configuration U-value W/(m2 K)
Base case 10 cm Hempcrete sandwichedbetween light weight plaster
1.6
Case 1 10 cm of Hempcrete 3.1Case 2 5 cm of straw sandwiched between 2
cm × 10 cm of Hempcrete0.7
number of occupied hours for each zone. The mid-day of each of the four seasons is first studiedusing the calibrated base case model.
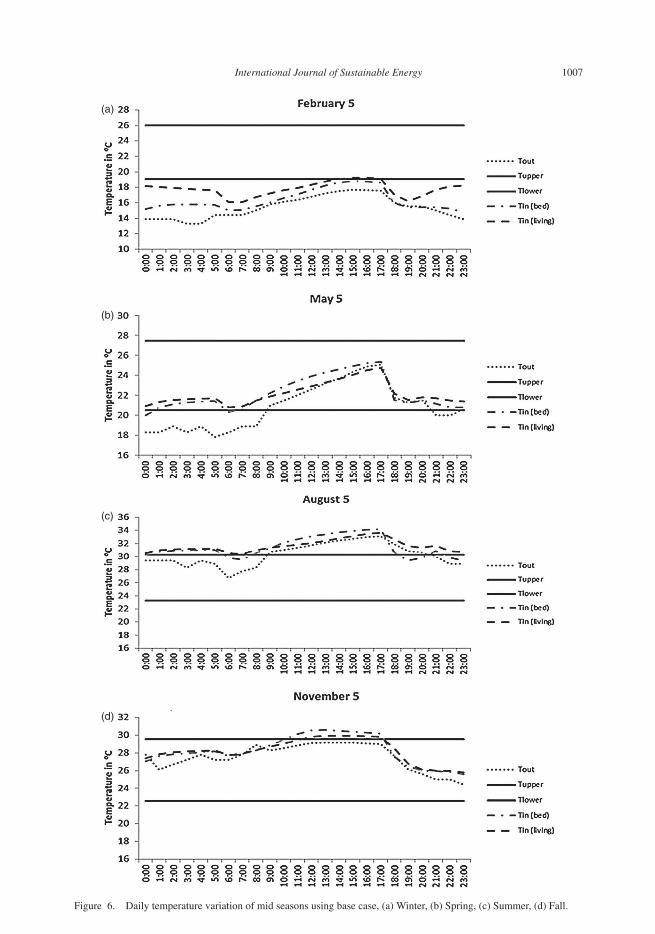
Figure 6 illustrates the upper and lower temperature acceptability limits calculated for the basecase using Equations (2) and (3), daily temperature variation of dry bulb temperature (Tout), andinside temperature in both living and bedroom for four different days: 5 February (mid-winterseason), 5 May (mid-Spring season), 5 August (mid-summer season) and 5 November (mid-Fallseason). Figure 6(a) demonstrates that indoor temperatures of both living and bedroom zonesin winter are lower than the 80% acceptability limit of lower comfortable temperature definedin Equation (3), due to cold weather, thus discomfort is displayed. Figure 6(b) and (d) presentthe daily temperature variation in spring and fall respectively, demonstrating that indoor tem-peratures of both living and bedroom fall within the 80% acceptability region defined by Tupper
and Tlower defined in Equations (2) and (3), with little discomfort observed in fall for around 5 hbetween 12:00 and 17:00 h. Accordingly, comfort is achieved and natural ventilation is reason-ably a feasible option in spring. However, Figure 6(c) reveals that indoor temperatures of bothliving and bedroom in summer are higher than the 80% acceptability limit of high comfortabletemperature defined in Equation (2), due to hot weather, thus discomfort is displayed.
We are interested in increasing the comfort hours during summer or winter by altering theenvelop materials and evaluating its effect on extending comfort hours with natural ventilation.In summer, a lower insulation and a lower capacitance building material would perform bettercompared to the base case building material to prevent heat storage within the building walls. Incold days, walls with higher insulation perform better keeping warm air inside the space. Two-wall configurations using local low-embodied energy natural material in addition to the basecase material were considered for both living zone and bedroom zone. These configurations aresummarised in Table 3. Case 1 consisted of 10 cm of Hempcrete (Cp = 1430 J/kg K). Case 2(massive case) consisted of 5 cm of straw (Cp = 2000 J/kg K) sandwiched between two layersof 10 cm Hempcrete. The thermal properties of straw were obtained from ‘the green buildingbible’ (Hall 2006) and the thermal properties of hemp were obtained from Elfordy et al. (2008).
The investigated configurations focused on selecting building materials that would result ina minimum number of discomfort hours (highest %comfort) throughout the whole year. Themonthly percentage of comfort parameter (%comfort) in each zone is equal to the percentage ofcomfort hours in each month of the estimated total hours spent in each zone monthly.
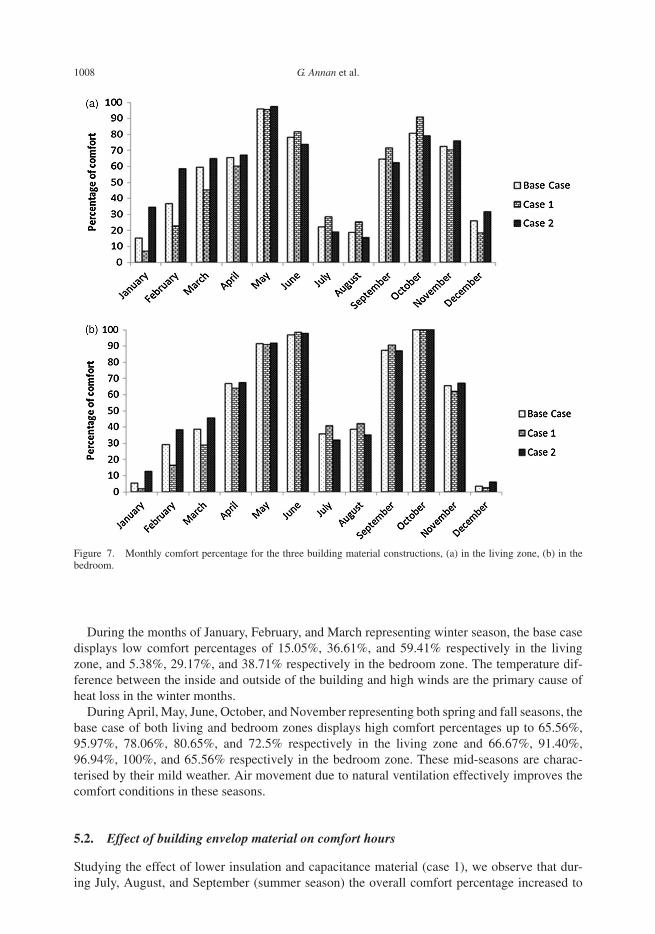
Figure 7 shows the predicted monthly percentage of comfort in (a) bedroom and (b) livingzones respectively for the base case, case 1, and case 2. Tables 4 and 5 summarise the predictednumber of comfort hours for bedroom zone and living zone respectively. Further analysis ofcomfort percentage results based on seasonal climatic variation is presented in the next section.
5.1. Base case comfort hours
During July, August, and September, representing the summer season, the base case displays lowcomfort percentages of 22.05%, 18.82%, and 64.44% respectively in the living zone and highercomfort percentages of 35.71%, 38.67%, and 87.50% respectively in the bedroom zone.
International Journal of Sustainable Energy 1007
(a)
(b)
(c)
(d)
Figure 6. Daily temperature variation of mid seasons using base case, (a) Winter, (b) Spring, (c) Summer, (d) Fall.
1008 G. Annan et al.
Figure 7. Monthly comfort percentage for the three building material constructions, (a) in the living zone, (b) in thebedroom.
During the months of January, February, and March representing winter season, the base casedisplays low comfort percentages of 15.05%, 36.61%, and 59.41% respectively in the livingzone, and 5.38%, 29.17%, and 38.71% respectively in the bedroom zone. The temperature dif-ference between the inside and outside of the building and high winds are the primary cause ofheat loss in the winter months.
During April, May, June, October, and November representing both spring and fall seasons, thebase case of both living and bedroom zones displays high comfort percentages up to 65.56%,95.97%, 78.06%, 80.65%, and 72.5% respectively in the living zone and 66.67%, 91.40%,96.94%, 100%, and 65.56% respectively in the bedroom zone. These mid-seasons are charac-terised by their mild weather. Air movement due to natural ventilation effectively improves thecomfort conditions in these seasons.
5.2. Effect of building envelop material on comfort hours
Studying the effect of lower insulation and capacitance material (case 1), we observe that dur-ing July, August, and September (summer season) the overall comfort percentage increased to
International Journal of Sustainable Energy 1009
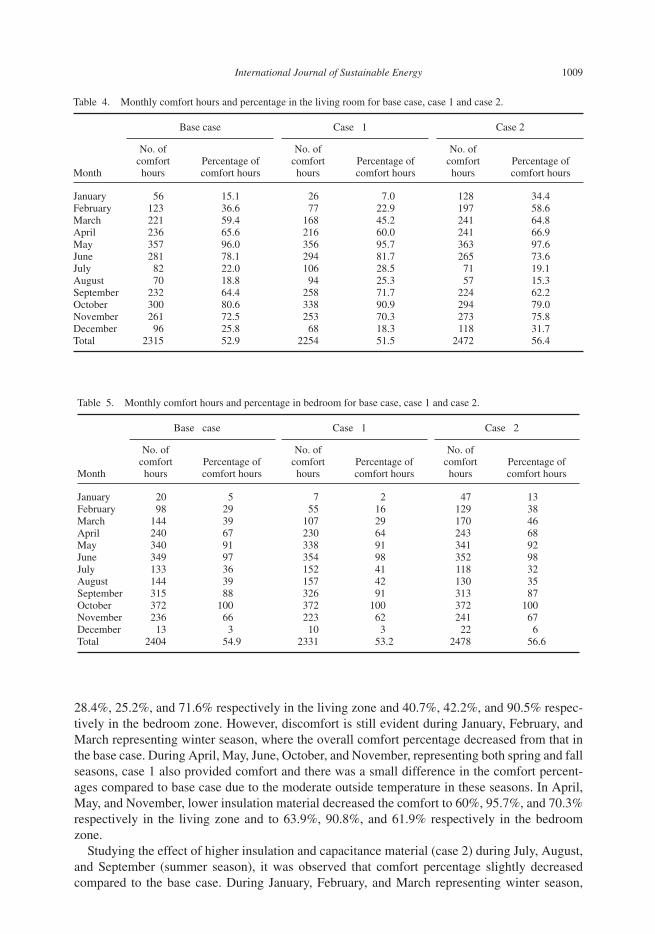
Table 4. Monthly comfort hours and percentage in the living room for base case, case 1 and case 2.
Base case Case 1 Case 2
Month
No. ofcomforthours
Percentage ofcomfort hours
No. ofcomforthours
Percentage ofcomfort hours
No. ofcomforthours
Percentage ofcomfort hours
January 56 15.1 26 7.0 128 34.4February 123 36.6 77 22.9 197 58.6March 221 59.4 168 45.2 241 64.8April 236 65.6 216 60.0 241 66.9May 357 96.0 356 95.7 363 97.6June 281 78.1 294 81.7 265 73.6July 82 22.0 106 28.5 71 19.1August 70 18.8 94 25.3 57 15.3September 232 64.4 258 71.7 224 62.2October 300 80.6 338 90.9 294 79.0November 261 72.5 253 70.3 273 75.8December 96 25.8 68 18.3 118 31.7Total 2315 52.9 2254 51.5 2472 56.4
Table 5. Monthly comfort hours and percentage in bedroom for base case, case 1 and case 2.
Base case Case 1 Case 2
Month
No. ofcomforthours
Percentage ofcomfort hours
No. ofcomforthours
Percentage ofcomfort hours
No. ofcomforthours
Percentage ofcomfort hours
January 20 5 7 2 47 13February 98 29 55 16 129 38March 144 39 107 29 170 46April 240 67 230 64 243 68May 340 91 338 91 341 92June 349 97 354 98 352 98July 133 36 152 41 118 32August 144 39 157 42 130 35September 315 88 326 91 313 87October 372 100 372 100 372 100November 236 66 223 62 241 67December 13 3 10 3 22 6Total 2404 54.9 2331 53.2 2478 56.6
28.4%, 25.2%, and 71.6% respectively in the living zone and 40.7%, 42.2%, and 90.5% respec-tively in the bedroom zone. However, discomfort is still evident during January, February, andMarch representing winter season, where the overall comfort percentage decreased from that inthe base case. During April, May, June, October, and November, representing both spring and fallseasons, case 1 also provided comfort and there was a small difference in the comfort percent-ages compared to base case due to the moderate outside temperature in these seasons. In April,May, and November, lower insulation material decreased the comfort to 60%, 95.7%, and 70.3%respectively in the living zone and to 63.9%, 90.8%, and 61.9% respectively in the bedroomzone.
Studying the effect of higher insulation and capacitance material (case 2) during July, August,and September (summer season), it was observed that comfort percentage slightly decreasedcompared to the base case. During January, February, and March representing winter season,
1010 G. Annan et al.
the comfort percentage increased from that in the base case to 34.4%, 58.6%, and 64.8% in theliving zone and to 12.6%, 38.4%, and 45.7% in the bedroom zone. During fall and spring months,there was a small difference between the base case and cases 1 and 2. In June, higher insulationmaterial (case 1) displays less comfort percentages than the base case, reaching 73.6% in theliving zone and 97.8% in the bedroom zone due to lower temperatures reached during the night-time. Similarly, in October, the comfort decreases to 79% in the living zone, while maintaining100% comfort in the bedroom zone.
Clearly, natural ventilation is a feasible option in Beirut city during the fall and spring seasonswith comfort hours (more than 60%). Changing the building envelope does not significantlychange the comfort percentages during the fall and spring seasons when natural ventilation isused. However, increasing the U-value of the wall as well as heat capacity (case 2) has a sig-nificant effect during the winter season, especially in the living zone with an improvement ofcomfort. During summer time, the use of the massive wall had a negative effect on the comfort,but it was comparable to the positive effect during the winter season. Using low insulation (case1) improved the comfort during the summer but significantly reduced comfort during winter.
It is clear from the aforesaid that the effect of higher insulation is more evident during thewinter time where the comfort hours have almost doubled during January and February. Theadded value of using local natural building material is in lowering embodied energy (Olgyayaand Herdtb 2004; Yassine et al. 2012; Yassine et al. 2014). It is true that 100% comfort is notachieved during winter, but it is much easier to control personal comfort by using more clothinglayers. However, for the hot humid months of July and August, there is an inevitable need of airconditioning and the use of higher insulation will decrease the HVAC consumption as comparedto using typical construction material with low insulation. Since the overall yearly hours of com-fort for the massive case 2 is better, we recommend its use, and if integrated with mechanicalventilation or conventional air conditioning, it can reduce the cost of energy consumption.
6. Recommendations and conclusion
This paper integrates assessment of utilising natural ventilation in Beirut residential area withthermal comfort. Using Beirut typical construction materials and Beirut occupants’ behaviour inregulating the opening and closing of the windows established in a conducted survey, the workis indicative of considerable potential for saving energy by using natural ventilation instead ofair conditioning.
The use of natural ventilation was found to be more effective for comfort with the use of locallyavailable wall massive construction materials mainly in the moderate seasons of fall and spring.This recommendation is applicable to similar mesothermal climates. Using high insulation andcapacitance material was recommended, achieving a yearly thermal comfort of 56.6% in thebedroom and 56.5% in the living zone.
References
Abdurahiman, M. S. 1988. HVAC and Climatic Design in the Arab Courtyard Houses. Calicut, India: National Instituteof Technology Calicut.
Ahmed, N. A., and K. Wongpanyathaworn. 2012. “Optimising Louver Location to Improve Indoor Thermal ComfortBased on Natural Ventilation.” Procedia Engineering 49: 169–178.
Al-Shaali, R. K. 2002. “Maximizing Natural Ventilation by Design in Low Rise Residential Buildings using WindCatchers in the Hot Arid Climate of UAE.” Master thesis, University of Southern California, USA.
Arent, L. T., M. A. Paula, and E. Ghisi. 2011. “Thermal Comfort Analysis of a Naturally Ventilated Building.” 12thInternational Conference of Building Performance Simulation Association. Sydney, November 14–16.
International Journal of Sustainable Energy 1011
ASHRAE. 2004. ASHRAE Standard 55–2004: Thermal Environmental Conditions for Human Comfort. Atlanta, GA:ASHRAE, 2004.
Awwad, E., B. Hamad, M. Mabsout, and H. Khatib. 2010. Sustainable Construction Material Using Hemp Fibers –Preliminary Study. 2nd International conference on Sustainable Construction Materials June 28–30.
Baker, N. 2011. Natural Ventilation: Stack Ventilation. RIBA. Accessed November 20, 2013. http://www.architecture.com/SustainabilityHub/Designstrategies/Air/1-2-1-2-Naturalventilation-stackventilation.aspx
Barclay, M. 2012. “The Interaction of Building Energy Use, Ventilation Performance and Urban Noise Under FutureClimate Scenarios.” PhD. Thesis, School of Architecture, The University of Sheffield.
Byblos. 2013. “Byblos Economic Research & Analysis Department, Lebanon This Week.” Byblos Bank sal, no. 300:1–2.
CDR. 2005. CDR National Physical Master Plan for the Lebanese Territory. Beirut, Lebanon: Council for Developmentand Reconstruction (CDR).
Chilton, A., P. Novo, N. McBride, A. Lewis-Nunes, I. Johnston, and J. Rene. 2012. “Natural Ventilation and AcousticComfort.” Proceedings of the Acoustics 2012 Nantes Conference, Nantes, France.
de Dear, R. J., and G. S. Brager. 2002. “Thermal Comfort in Naturally Ventilated Buildings: Revisions to ASHRAEStandard 55.” Energy and Buildings 34 (4): 549–561.
Doran, S., and E. Kilbride. 2000. Safety and Health Business Plan, Field Investigations of the Thermal Performance ofConstruction Elements as Built. Glasgow, UK: Building Research Establishment.
Eftekhari, M. M. 1998. “Natural ventilation: Impact of Wall Material and Windows on Thermal Comfort.” BuildingServices Engineering Research and Technology 19: 43–47.
Eftekhari, M. M., and D. J. Pinnock. 1998. “Natural Ventilation: Airflow Measurements in a Lightweight Test Room.”Building Services Engineering Research and Technology 19: 37–42.
ELARD (European LEADER Association for Rural Development) Coastal Zones. 2010. Vulnerability, Adaptation andMitigation Chapters of Lebanon’s Second National Communication, Climate Risks, Vulnerability & AdaptationAssessment. Beirut, Lebanon: Ministry of Environment/UNDP.
Elfordy, S., F. Lucas, and F. Tancret, Y. Scudeller, L. Goudet. 2008. “Mechanical and Thermal Properties of Lime andHemp Concrete (“Hempcrete”) Manufactured by a Projection Process.” Construction and Building Materials 22(22): 2116–2123.
Etheridge, D. W., and J. J. Zhang. 1998. “Dynamic Insulation and Natural Ventilation: Feasibility Study.” BuildingServices Engineering Research and Technology 19: 203–212.
Gao, C. F., and W. L. Lee. 2010. “Influence of Window Types on Natural Ventilation of Residential Buildings in HongKong.” International High Performance Buildings Conference at Purdue University, West Lafayette, Indiana, USA.
Ghaddar, N., K. Ghali, and S. Chehaitly. 2011. “Assessing Thermal Comfort of Active People in Transitional Spaces inPresence of Air Movement.” Energy and Buildings 43 (10): 2832–2842.
Haggag, M. A. 2008. “The Use of Passive Cooling Strategies in Dubai Moving Towards Sustainability.” Proceeding ofEcocity World Summit 2008. Dubai City, UAE.
Hall, K. 2006. The Green Building Bible. Vols. 1 and 2. 3rd ed. Carmarthenshire, Wales: The Green Building Press.Herkel, S., U. Knapp, and J. Pfafferott. 2008. “Towards a Model of User Behaviour Regarding the Manual Control of
Windows in Office Buildings.” Building and Environment 43: 588–600.High-performance Commercial Building Façades. 2013. Double-skin Facades and Natural Ventilation. Ernest
Orlando Lawrence Berkeley National Laboratory, University of California, Berkeley. Accessed November 03.http://gaia.lbl.gov/hpbf/techno_c3.htm
Holness, G. V. R. 2009. “Energy Efficiency in Existing Buildings – Our Greatest Opportunity for a Sustainable Future,Sustaining Our Future by Rebuilding Our Past.” ASHRAE Journal 1: 1–4.
Houri, A. 2006. “Solar Water Heating in Lebanon: Current Status and Future Prospects.” Renewable Energy 31: 663–675.Houri, A., and S. Ibrahim-Korfali. 2005. “Residential Energy Consumption Patterns: The Case of Lebanon.” Interna-
tional Journal of Energy Research 29: 755–766.Larsen, T. S. 2006. “Natural Ventilation Driven by Wind and Temperature Difference.” Thesis submitted for the degree
of Ph.D., Department of Civil Engineering, Aalborg University.Lebanese Construction Law. 2005. Law 15874, November 2005.Linden, P. F. 1999. “The Fluid Mechanics of Natural Ventilation.” Annual Review of Fluid Mechanics 31: 201–238.Macroflo, MacroFlo Calculation Methods. 2012. IES Virtual Environment 6.5. Glasgow, UK: Integrated
Environmental Solutions. http://www.iesve.com/website/var/assets/support/userguides/ve2012/thermal_reference/apachesimcalculationmethods.pdf.
Mathews, E. H., C. P. Botha, D. C. Arndt, and A. Malan. 2001. “HVAC Control Strategies to Enhance Comfort andMinimize Energy Usage.” Energy and Buildings 33: 853–863.
van Moeseke, G., E. Gratia, S. Reiter, and A. De Herde. 2005. “Wind Pressure Distribution Influence on NaturalVentilation for Different Incidences and Environment Densities.” Energy and Buildings 37: 878–889.
Network CA News. 2013. “Gulf’s Largest Open-Air Square to be Built in Doha.” Network, CA News Network, DMGWorld Medi1. Accessed November 21. http://www.constructarabia.com/construction-news/gulfs-largest-open-air-square-to-be-built-in-doha/
OEA. 2010. Thermal Standards for Buildings in Lebanon 2010: Order of Engineers. Beirut, Lebanon: OEA.Olgyaya, V., and J. Herdtb. 2004. “The Application of Ecosystems Services Criteria for Green Building Assessment.”
Solar Energy 77: 389–398.Pfafferott, J., and S. Herkel. 2007. “Statistical Simulation of User Behaviour in Low-energy Office Buildings.” Solar
Energy 81 (5): 676–682.
1012 G. Annan et al.
Pfafferott, J., S. Herkel, and M. Wambsganß. 2004. “Design, Monitoring and Evaluation of a Low Energy Office Buildingwith Passive Cooling by Night Ventilation.” Energy and Buildings 36: 455–465.
Serghides, D. K., and C. G. Georgakis. 2012. “The Building Envelope of Mediterranean Houses: Optimization of Massand Insulation.” Journal of Building Physics 36: 83–98.
Taleghani, M., M. Tenpierik, and A. van den Dobbelsteen. 2014. “Energy Performance and Thermal Comfort ofCourtyard/Atrium Dwellings in the Netherlands in the Light of Climate Change.” Renewable Energy 63: 486–497.
Tantasavasdi, C., J. Srebric, and Q. Chen. 2001. “Natural Ventilation Design for Houses in Thailand.” Energy andBuildings 33: 815–824.
Tran Le, A. D., C. Maalouf, T. H. Mai, E. Wurtz, and F. Collet. 2010. “Transient Hygrothermal Behavior of a HempConcrete Building Envelope.” Energy and Buildings 42: 1797–1806.
UNDP. 2005a. UNDP Climate and Comfort: Passive Design Strategies for Lebanon. Beirut, Lebanon: UNDP.UNDP. 2005b. UNDP Passive Climate and Comfort Design Strategies for Lebanon. Beirut, Lebanon: UNDP.USGBC Fact Sheet. 2010. “Natural Ventilation, A Road Map for Sustainable Building.” Cascadia Chapter. Walker Andy
Natural Ventilation. National Renewable Energy Laboratory.Xu, B., L. Fu, and H. Di. 2009. “Field Investigation on Consumer Behavior and Hydraulic Performance of a District
Heating System in Tianjin, China.” Building and Environment 44 (2): 249–259.Yassine, B., K. Ghali, N. Ghaddar, I. Srour, and G. Chehab. 2012. “A Numerical Modeling Approach to Evaluate Energy-
Efficient Mechanical Ventilation Strategies.” Energy and Buildings 55: 618–630.Yassine, B., K. Ghali, N. Ghaddar, I. Srour, and G. Chehab. 2014. “Effectiveness of Earth Tube Heat Exchanger System
Coupled to a Space Model in Achieving Thermal Comfort in Rural Areas.” International Journal of SustainableEnergy 33 (3): 567–586.
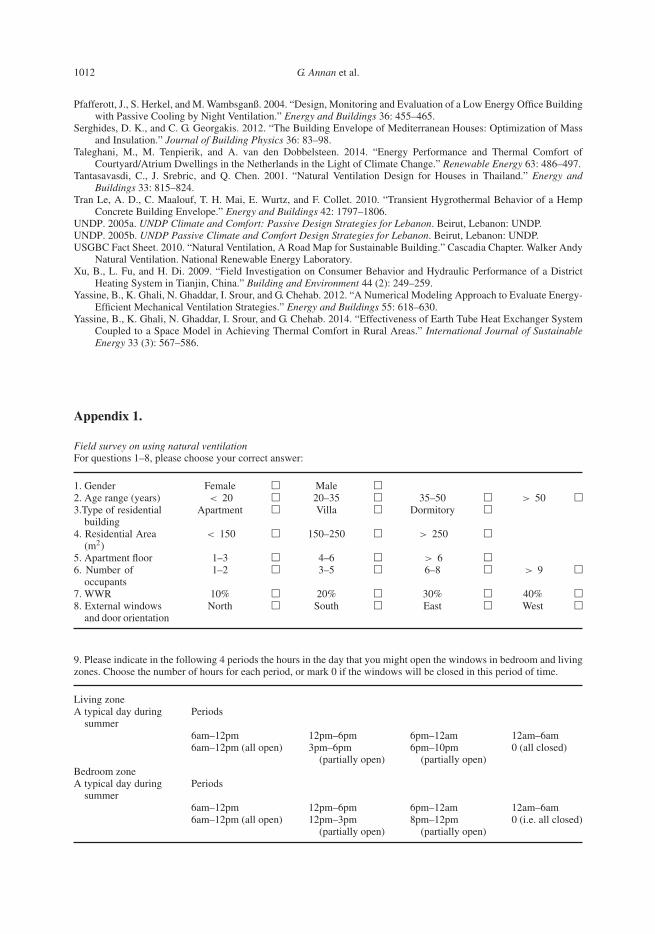
Appendix 1.
Field survey on using natural ventilationFor questions 1–8, please choose your correct answer:
1. Gender Female � Male �2. Age range (years) < 20 � 20–35 � 35–50 � > 50 �3.Type of residential
buildingApartment � Villa � Dormitory �
4. Residential Area(m2)
< 150 � 150–250 � > 250 �
5. Apartment floor 1–3 � 4–6 � > 6 �6. Number of
occupants1–2 � 3–5 � 6–8 � > 9 �
7. WWR 10% � 20% � 30% � 40% �8. External windows
and door orientationNorth � South � East � West �
9. Please indicate in the following 4 periods the hours in the day that you might open the windows in bedroom and livingzones. Choose the number of hours for each period, or mark 0 if the windows will be closed in this period of time.
Living zoneA typical day during
summerPeriods
6am–12pm 12pm–6pm 6pm–12am 12am–6am6am–12pm (all open) 3pm–6pm
(partially open)6pm–10pm
(partially open)0 (all closed)
Bedroom zoneA typical day during
summerPeriods
6am–12pm 12pm–6pm 6pm–12am 12am–6am6am–12pm (all open) 12pm–3pm
(partially open)8pm–12pm
(partially open)0 (i.e. all closed)

International Journal of Sustainable Energy 1013
10. Please indicate the degree to which you open the window (window degree of opening profile) in each season.
Degree of opening
Season 0 0.25 0.5 0.75 1SpringSummerFallWinter