Embed Size (px)
Citation preview

Molecular Ecology (2004) doi: 10.1111/j.1365-294X.2004.02228.x
© 2004 Blackwell Publishing Ltd
Blackwell Publishing, Ltd.
Natural selection of the major histocompatibility complex (
Mhc
) in Hawaiian honeycreepers (Drepanidinae)
SUSAN I . JARVI ,
*†‡
CHERYL L . TARR,
*§
CARL E . MCINTOSH,
*
CARTER T . ATKINSON
†
and ROBERT C. FLEISCHER
*
*
Molecular Genetics Laboratory, National Zoological Park, Smithsonian Institution, Washington, USA,
†
Pacific Islands Ecosystem Research Center, Hawaii Volcanoes National Park, USA,
‡
Department of Biology, University of Hawaii, Hilo HI 96720, USA
Abstract
The native Hawaiian honeycreepers represent a classic example of adaptive radiation andspeciation, but currently face one the highest extinction rates in the world. Although multi-ple factors have likely influenced the fate of Hawaiian birds, the relatively recent intro-duction of avian malaria is thought to be a major factor limiting honeycreeper distributionand abundance. We have initiated genetic analyses of class II ββββ
chain
Mhc
genes in four spe-cies of honeycreepers using methods that eliminate the possibility of sequencing mosaicvariants formed by cloning heteroduplexed polymerase chain reaction products. Phylo-genetic analyses group the honeycreeper
Mhc
sequences into two distinct clusters. Variationwithin one cluster is high, with
d
N
>
d
S
and levels of diversity similar to other studiesof
Mhc
(
B
system) genes in birds. The second cluster is nearly invariant and includessequences from honeycreepers (Fringillidae), a sparrow (Emberizidae) and a blackbird(Emberizidae). This highly conserved cluster appears reminiscent of the independentlysegregating
Rfp-Y
system of genes defined in chickens. The notion that balancing selectionoperates at the
Mhc
in the honeycreepers is supported by transpecies polymorphism andstrikingly high
d
N
/
d
S
ratios at codons putatively involved in peptide interaction. Mitochon-drial DNA control region sequences were invariant in the i’iwi, but were highly variablein the ‘amakihi. By contrast, levels of variability of class II ββββ
chain
Mhc
sequence codonsthat are hypothesized to be directly involved in peptide interactions appear comparablebetween i’iwi and ‘amakihi. In the i’iwi, natural selection may have maintained variationwithin the
Mhc
, even in the face of what appears to a genetic bottleneck.
Keywords
: avian
Mhc
, balancing selection, Drepanidinae, Hawaiian honeycreepers, mtDNA,
Plasmodium
Received 5 January 2004; revision received 7 April 2004; accepted 7 April 2004
Introduction
Genes encoded within the major histocompatibility com-plex (
Mhc
) are thought to undergo positive or balancingselection and a growing body of evidence suggests thatthis selection is mediated largely through differentialrecognition by Mhc antigens of peptides from pathogens(Hughes & Nei 1988; Kaufman & Salomonsen 1997; Gilbert
et al
. 1998; Hill & Weatherall 1998; Hughes & Yeager 1998;Hedrick & Kim 2000; Vogel
et al
. 1999). The evidence for
balancing selection acting on the
Mhc
is mostly indirect,and includes the relatively high number of alleles andsequence polymorphism, the long-term retention of alleles(i.e. transpecies polymorphism) and relatively high ratesof nonsynonymous (
d
N
) vs. synonymous (
d
S
) substitutionwithin the peptide-binding region (PBR) (Hedrick 1994,1999; Hughes & Nei 1988; Hughes & Yeager 1998). Onlyrarely have cases of epidemic or introduced disease beenused to determine the effects of such selection on vari-ation at the
Mhc
(reviewed in: Gilbert
et al
. 1998; Hill &Weatherall 1998; Brown 1999; Vogel
et al
. 1999).The Hawaiian honeycreeper-malaria disease system
provides an exceptional model in which the influencesof parasite-driven selection on host genes can be invest-igated. The Hawaiian honeycreepers are an endemic clade
Correspondence: Susan I. Jarvi, Department of Biology, Universityof Hawaii, Hilo, HI 96720, USA. E-mail: [email protected]§Present address: Centers for Disease Control and Prevention,Mailstop C-03, Atlanta, GA 30333 USA.

2
S . I . J A R V I
E T A L
.
© 2004 Blackwell Publishing Ltd,
Molecular Ecology
, 10.1111/j.1365-294X.2004.02228.x
of finches renowned for their extensive and rapid adaptiveradiation (Freed
et al
. 1987; Tarr & Fleischer 1995; Fleischer
et al
. 1998; Fleischer & McIntosh 2001). The honeycreepershave been severely impacted by the activities of humans:28 of the 53 known species (34 known from historical spe-cimens, 19 from fossils) are extinct, and 18 of the remainingspecies are endangered (Jacobi and Atkinson 1995; Jarvi
et al
. 2001). Although direct take, habitat loss and degrada-tion, introduced predators and competitors have all beenimplicated in the extinction and endangerment of honey-creepers, invasive disease, in particular introduced, mosquito-transmitted avian malaria (
Plasmodium relictum
), is thoughtto be the most detrimental factor limiting honeycreeperdistribution and abundance today (Warner 1968; vanRiper
et al
. 1986; Atkinson
et al
. 1995, 2000, 2001; Yorinks& Atkinson 2000; Jarvi
et al
. 2001). While Hawaiian strainsof
P. relictum
appear to cause severe disease in Hawaiianhoneycreepers relative to introduced bird species (Atkinson
et al
. 1995; van Riper 1991), there is also variation in suscep-tibility among honeycreeper species (Atkinson
et al
. 1995,2000, 2001; Yorinks & Atkinson 2000; Jarvi
et al
. 2001). Inparticular, the ‘amakihi (
Hemignathus virens
) has relativelylower mortality rates than its close relative (Fleischer
et al
.1998, 2001) the i’iwi (
Vestiaria coccinea
) following experi-mental infections with
P. relictum
(Atkinson
et al
. 1995,2000, 2001). This dichotomy of malaria resistance in twoclosely related honeycreeper species sets up an opportun-ity to begin to define host genetic polymorphisms relatedto disease resistance and to evaluate the effects of parasite-driven selection on host genes. This study compares levelsand patterns of genetic variation of
Mhc
class II
β
chainpeptide-binding region and mitochondrial DNA (mtDNA)control region sequence in four species of Hawaiianhoneycreepers.
Materials and methods
Sampling
Whole blood was collected from natural populations of‘amakihi, ‘apapane (
Himatione sanguinea
), i’iwi and palila(
Loxiodes bailleui
) from the island of Hawai’i. As part of astudy of pathogenicity of avian malaria in honeycreepers(Atkinson
et al
. 1995), juvenile hatch-year i’iwi (
n
= 9) werecaptured with mist nets on the eastern flank of Mauna Loavolcano in high elevation (1800 m) forests. This elevation isnear the upper elevational limits of
Culex quinquefasciatus
,the primary vector of avian malaria in Hawai’i (van Riper
et al
. 1986), and has mean yearly temperatures that arebelow the lower thermal limits needed to support sporo-geny of the parasite in the vector (Benning
et al
. 2002). The‘apapane (
n
= 1) and ‘amakihi (
n
= 10) were also involvedin pathogenicity studies (Atkinson
et al
. 2000), and werecaptured in xeric, high-elevation habitat (2000 m) on Mauna
Kea volcano. The palila (
n
= 8) were mist-netted in drywoodland forests on Mauna Kea and released (Fleischer
et al
. 1994). Approximately 50–100
µ
L of blood was collectedby jugular or brachial venepuncture. Blood samples werealso obtained from one captive bred family of ‘amakihi.The dam originated from Pohakuloa, the sire from MaunaKea, and eight progeny were produced at the Conservationand Research Center, Smithsonian Institution, Front Royal,VA (Scott Derrickson, personal communication). Aftercollection, heparinized samples were mixed with an appro-ximate equal volume of lysis buffer (0.1
m
Tris–HCl pH 8.0,0.1
m
sodium EDTA, 2% SDS) and frozen (
−
50
°
C).
DNA isolation
Genomic DNA was extracted from blood samples usingstandard techniques. Briefly, samples were digested in1 mL of 50 m
m
Tris–HCl, 100 m
m
sodium EDTA, 2% SDSwith 0.5 mg/mL proteinase K overnight at 55
°
C. DNAextractions were completed with one phenol, two phenol/dimethyl chloride 1 : 1, and one dimethyl chloride/isoamylalcohol (24 : 1) extraction steps, and dialysed against10 m
m
Tris–HCl, pH 8.0 and 1 m
m
EDTA. DNA con-centration was quantified by spectrophotometry (SpectronicInstruments).
Amplification and cloning of partial class II B genes for primer design
Degenerative priming sequences #305 and #306 (Edwards
et al
. 1995a) were initially used for polymerase chainreaction (PCR) amplification from ~ 100 ng total genomicDNA from two individual ‘amakihi under conditionsdescribed in Edwards
et al
. (1995a). Bands of ~ 180 bp wereexcised from a 1.5% LMP agarose gel and purified (Glassmilk, Geneclean or Qiaquick Gel Extraction Kit, QiagenInc.). Purified PCR products were cloned (TA cloning kit,Invitrogen) and sequenced (as described below). Internalprimers PBR1.5 (TGAACGGGTGAGGTTCGT) and PBR1.3(GTACGTGTCCACCGCTGT) were then designed basedon the sequences of several clones. The sequences reportedin this paper were obtained using these core primingsequences.
PCR + 1 cloning
To specifically avoid the inclusion of mosaic (artefactual)sequences due to the cloning of heteroduplexes, formedwhen single-stranded DNA from highly similar but dis-tinct alleles re-anneal after the last round of PCR, mostof the sequences reported in this study were obtainedusing either PCR + 1 cloning methods (Borriello & Krauter1990; L’Abbe
et al
. 1992) or strand separation by SSCPelectrophoresis and subsequent re-amplification prior to

M H C I N H A W A I I A N H O N E Y C R E E P E R S
3
© 2004 Blackwell Publishing Ltd,
Molecular Ecology
, 10.1111/j.1365-294X.2004.02228.x
sequencing (Grace
et al
. 1995; Table 1). Some sequenceswere obtained by direct cloning but were only included inthis study if they were verified by replication (Table 1).Replication of a sequence involved duplicate PCR ampli-fication with the same template DNA followed by cloningand sequencing as described. Using methods describedby Borriello & Krauter (1990) PCR + 1 amplification ofthe target DNA was carried out as follows: asymmetricamplification was carried out using primers PBR1.5Bam(GGATCCTGAACGGGTGAGGTTCGT) 2
µ
L of 2
µ
m
andPBR1.3Sal (GTCGACGTACGTGTCCACCGCTGT) 2
µ
L of20
µ
m
in 50
µ
L reaction volumes following manufacturer’sprotocols (Perkin-Elmer Cetus) with a 5 min ‘hot start’ at94
°
C prior to the addition of
Taq
DNA polymerase. Theinclusion of
Bam
HI and
Sal
I restriction sites is unrelated tothe PCR + 1 protocol, but were found to improve primerannealing. Cycling conditions were 94
°
C for 1 min, 52
°
Cfor 2 min and 72
°
C for 3 min for 35–40 cycles. Twentymicrolitres was subjected to one round of reamplificationin a 50
µ
L total volume using a third primer 1.5Mlu(ACGCGTTGAACGGGTGAGGTTCGT) with similar para-meters. Products were gel-purified (1.5% LMP NuSieve,FMC BioProducts; Qiaquick Gel Extraction Kit, Qiagen) and
cloned (as described above) in X-L Blue competent cells.Clones were evaluated for the presence of the
Mlu
I site byrestriction digest analysis and only clones containing the
Mlu
I site, which served as a marker for homoduplexedDNA, were used for further analysis.
Preparation of cDNA library
To prepare an ‘amakihi cDNA library, RNA was isolatedwith Rna-zol Btm (Cinna Scientific, Inc) from a mid- to late-development embryo collected from the Pohakuloa regionon the flank of Mauna Kea volcano, Hawai’i. mRNA waspurified (Polytract mRNA Isolation systems, Promega)and a cDNA library constructed with the Zap ExpresscDNA synthesis kit (Stratagene).
Single-stranded polymorphism assays (SSCP)
PCR products of the approximate expected size producedusing primer set PBR1.5Bam/PBR1.3Sal were gel purifiedas before, and quantified visually in a 1.5% agarose gel.SSCP conditions and sequence isolation were carriedout as described in Grace
et al
. (1995), and following
Table 1 The origin and number of sequences included in this study. Homoduplexes (HD) were obtained by PCR + 1 cloning methods.Other sequences were obtained by direct cloning of PCR products (unconfirmed homoduplexes, UHD) or by single-stranded gel isolationand direct sequencing of product (SSCP). Species: Hevi (Hemignathus virens), Veco (Vestiaria coccinea), Hisa (Himatione sanguinea) and Loba(Loxioides bailleui). Sequences/individual obtained are indicated numerically. Sequences obtained from members of a family are indicatedby s (sire), d (dam) or p (progeny) and those obtained from cDNA are indicated by (c)
Sequence #HD #UHD #SSCP Sequence #HD #UHD #SSCP
Hevi 1 2 0 0 Hevi 16.1p 0 3 0Hevi 2 2 0 0 Hevi 17.1p 0 2 0Hevi 2.1 2 0 0 Hevi 17.2p 0 2 0Hevi 3 2 0 0 Hevi 18.1p 0 1 1Hevi 4 3 1 0 Hevi 19.1p 0 3 0Hevi 4.1 1 5 0 Hevi 21.2c 1 0 0Hevi 5 1 0 0 Hevi 23.6c 1 0 0Hevi 5.1 0 3 0 Veco 1 2 2 1Hevi 6 1 0 0 Veco 2 1 1 1Hevi 6.1 1 0 0 Veco 2.1 1 0 0Hevi 7 1 2 0 Veco 2.2 1 1 0Hevi 8 1 0 0 Veco 3 1 0 0Hevi 9 1 0 0 Veco 4 1 0 0Hevi 9.1 0 0 1 Veco 4.1 0 0 1Hevi 10 1 2 0 Veco 4.2 0 0 1Hevi 11.2 s 0 0 1 Veco 4.3 0 0 1Hevi 11.3 s 0 0 1 Veco 4.4 0 0 1Hevi 11.4 s 0 0 1 Veco 5 0 0 1Hevi 11.6 s 0 2 0 Veco 6 0 0 2Hevi 12.1d 0 0 2 Veco 7 0 0 2Hevi 12.3d 0 0 1 Veco 9 0 0 1Hevi 12.4d 0 6 0 Hisa 1 2 0 0Hevi 13.1p 0 3 0 Hisa 1.1 2 0 0Hevi 14.1p 0 2 0 Hisa 1.2 0 2 0Hevi 15.1p 0 0 1 Loba 1 0 0 8Hevi 15.2p 0 4 0

4
S . I . J A R V I
E T A L
.
© 2004 Blackwell Publishing Ltd,
Molecular Ecology
, 10.1111/j.1365-294X.2004.02228.x
manufacturer’s protocol (Novex™, San D iego, CA) Briefly,~ 50–100 ng DNA (5
µ
L direct PCR product or 10
µ
Lpurified product) was added to load dye containing 95%formamide, 20
µ
m
EDTA, 10
µ
m
NaOH and 0.1% dye(bromophenol blue and xylene cyanol, w/v) up to a totalvolume of 20 µL. The sample was then fully denatured byboiling for 4 min with immediate quenching on ice untilloaded into a Novex™ acrylamide gel. Generally, 4–20%Novex™ gradient gels were used at a constant runningtemperature of 15 °C for 2 h at 200 V. Gels were stainedwith Syber® Green II (FMC Bioproducts). A 1 mL aerosol-resistant pipette tip was used to core out a sample fromthe band of interest. PCR re-amplification with cyclingparameters of 94 °C for 30 s, 50 °C for 1 min, 72 °C for1 min. The products were then purified as described aboveand sequenced.
Nucleotide sequence determination
All nucleotide sequences were determined by the PCRdye-terminator method on a ABI 373 automated sequencerusing plasmid-derived primers for cloned sequences andprimers PBR1.5 and PBR1.3 for SSCP-derived sequences.Sequences were aligned, compared and corrected usingsequencher (Gene Codes Corp.) or seq-ed (version 3.0.1,Applied Biosystems). Sequences were translated andchecked for stop codons or other evidence that they mightbe pseudogenes.
Measures of diversity
Aligned and corrected DNA sequences were analysedusing mega 2.0 (Kumar et al. 2000) and arlequin 2.000(Schneider et al. 2000). Measures of genetic diversity werecalculated from various groupings of the sequences, andcompared with variation in other avian taxa, includingDarwin’s finches (Geospizinae) exon 2 sequences (GenBankAccession nos Z74411–Z74470; Vincek et al. 1997) andothers (Acrocephalus arundinaceus U24405–8, Agelaius phoen-iceus U24412–3, U24415–9, U24427, Aphelocoma coerulescensU24399–401, U24420–26, Carpodacus mexicanus U24409–11,U23968–9, U23976; Edwards et al. 1995b). We divided theHawaiian drepanidine sequences by species and use thefollowing acronyms: ‘amakihi, Hevi; i’iwi, Veco; ‘apapane,Hisa; and palila, Loba. Captive-bred ‘amakihi were usedfor phylogenetic analyses but removed from estimates ofvariation.
Analyses were made on all 45 PBR codons, and onthe 13 hypothesized (Brown et al. 1993) peptide-bindingcodons (PBCs) and 32 nonpeptide-binding codons (non-PBCs) separately. In addition, based on tree topology(see below), honeycreeper sequences fell into two very dif-ferentiated clusters. These clusters also appear to differ indegree of within-cluster diversity, so analyses were also
made on each cluster separately. Darwin’s finch sequencesalso showed two clusters, one of which appeared to havelow diversity. We analysed these sequences separatelyas well. We estimated dS and dN using the methoddescribed by Kumar et al. (2000) in the computer programmega, which corrects for multiple substitutions at a site,transition/transversion bias, and degeneracy. We alsocalculated Kimura 2-parameter (K2P) distances on allsubstitutions.
Phylogenetic relationships
We assessed the relationships of Mhc DNA sequencesby constructing a neighbour joining tree (Saitou & Nei1987) from K2P corrected distance matrices using paup*. Inaddition to the drepanidine sequences obtained in thisstudy, we included 60 Darwin’s finch sequences (Vinceket al. 1997), one sparrow sequence Pasa39.43 (AF420007,Freeman-Gallant et al. 2002), one blackbird sequenceAgph117.5 (U24418) and two galliform sequences usedto root the tree (Phasianus cochicus, X75404 and Gallusdomesticus BLBIIB, X07447).
Mitochondrial control region sequence determination
We amplified portions of the mitochondrial control region(CR) for both i’iwi and ‘amakihi using primers from Tarr(1995). We compared sequences of 11 i’iwi samples fromthe islands of Kaua’i (n = 4), Maui (n = 3) and Hawai’i(n = 4) with sequences of 11 ‘amakihi samples from Kaua’i(n = 1), Maui (n = 4) and Hawai’i (n = 6). Two sections ofthe CR were amplified: (i) part of the 5′ or left domain usingprimers LGL4 (5′-CAATTGTATTCGCCCACCTC-3′) orLGL2 and H417 (Tarr 1995); and (ii) part of the 3′ or rightdomain using primers LCR1 and H1248 (Tarr 1995).Amplified products were cleaned with Qiagen kits andsequenced using either manual or automated methods (seeabove). Sequences were aligned in sequencher and ex-ported for analyses of variation within taxa and popu-lations. Means and SEs of Tamura–Nei and γ-correcteddistances within each taxon and population were calculatedin mega (Kumar et al. 2000).
Results
PCR amplification, and cloning of partial Mhc class II β genes
A total of 51 cloned Mhc or SSCP products are includedin this study, originating from 38 different individualsrepresenting four species of Hawaiian honeycreepers.
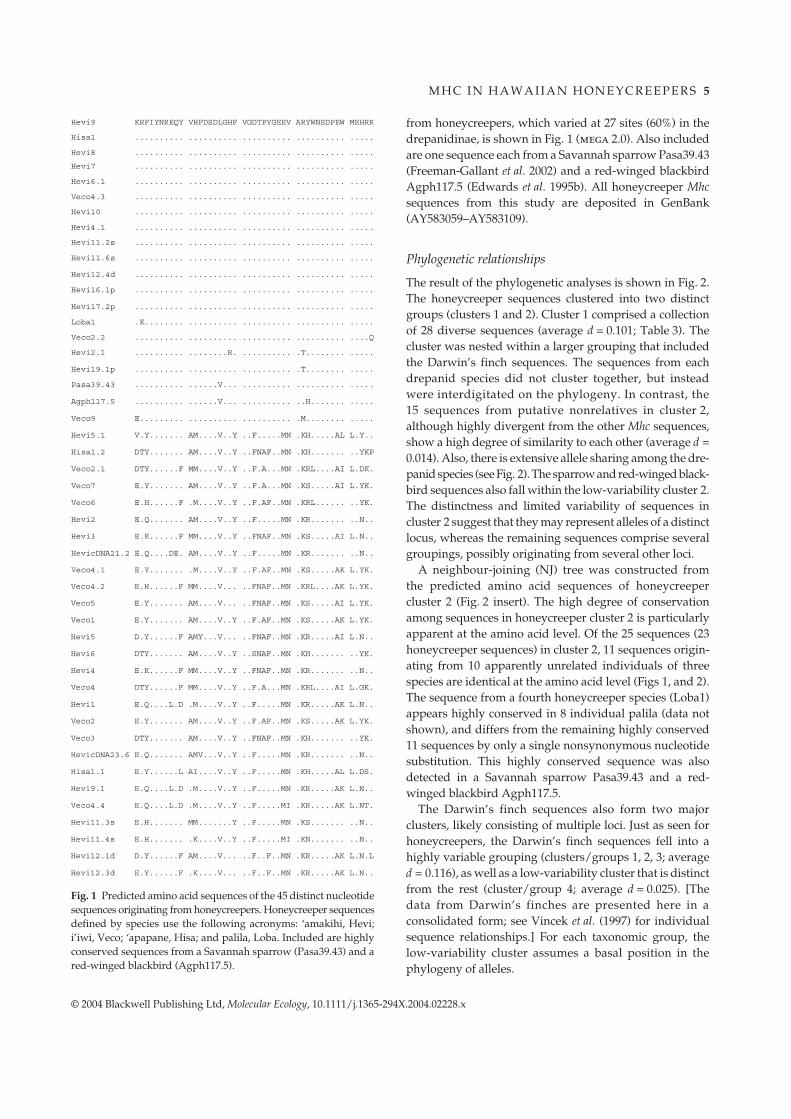
The sequence length we determined was 135 bp, of which58 nucleotide sites were variable in the honeycreepers. Analignment of the 45 unique inferred amino acid sequences
M H C I N H A W A I I A N H O N E Y C R E E P E R S 5
© 2004 Blackwell Publishing Ltd, Molecular Ecology, 10.1111/j.1365-294X.2004.02228.x
from honeycreepers, which varied at 27 sites (60%) in thedrepanidinae, is shown in Fig. 1 (mega 2.0). Also includedare one sequence each from a Savannah sparrow Pasa39.43(Freeman-Gallant et al. 2002) and a red-winged blackbirdAgph117.5 (Edwards et al. 1995b). All honeycreeper Mhcsequences from this study are deposited in GenBank(AY583059–AY583109).
Phylogenetic relationships
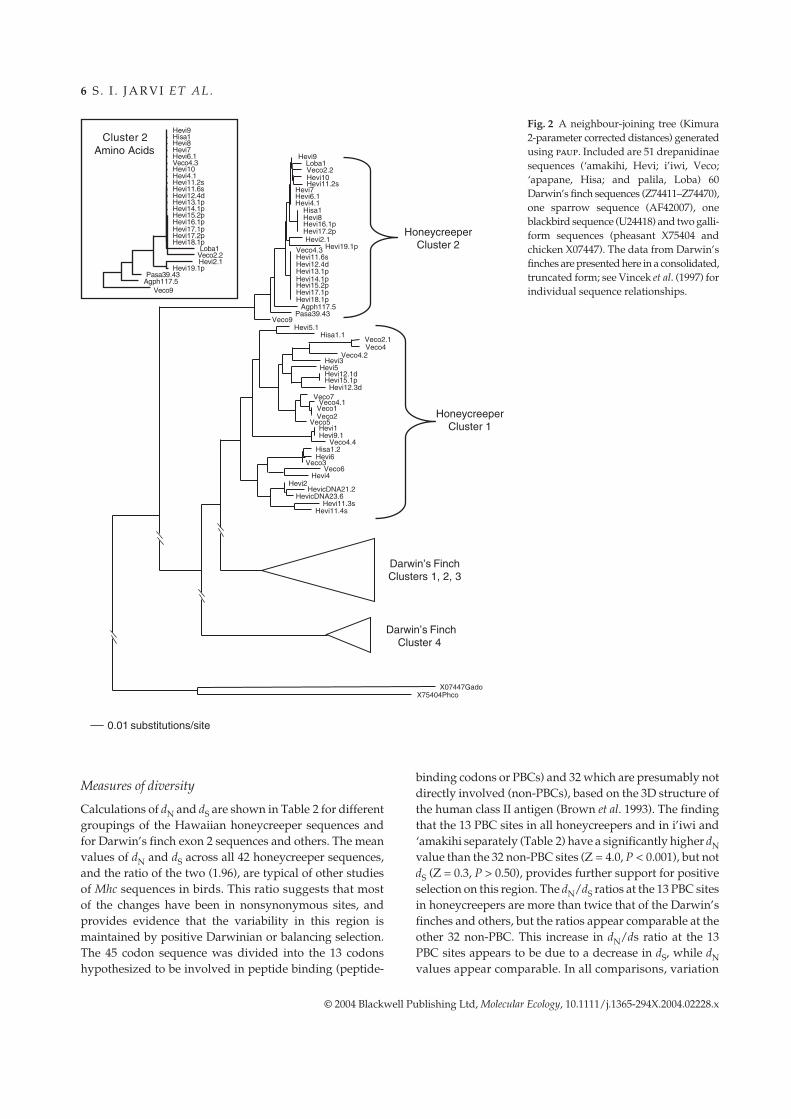
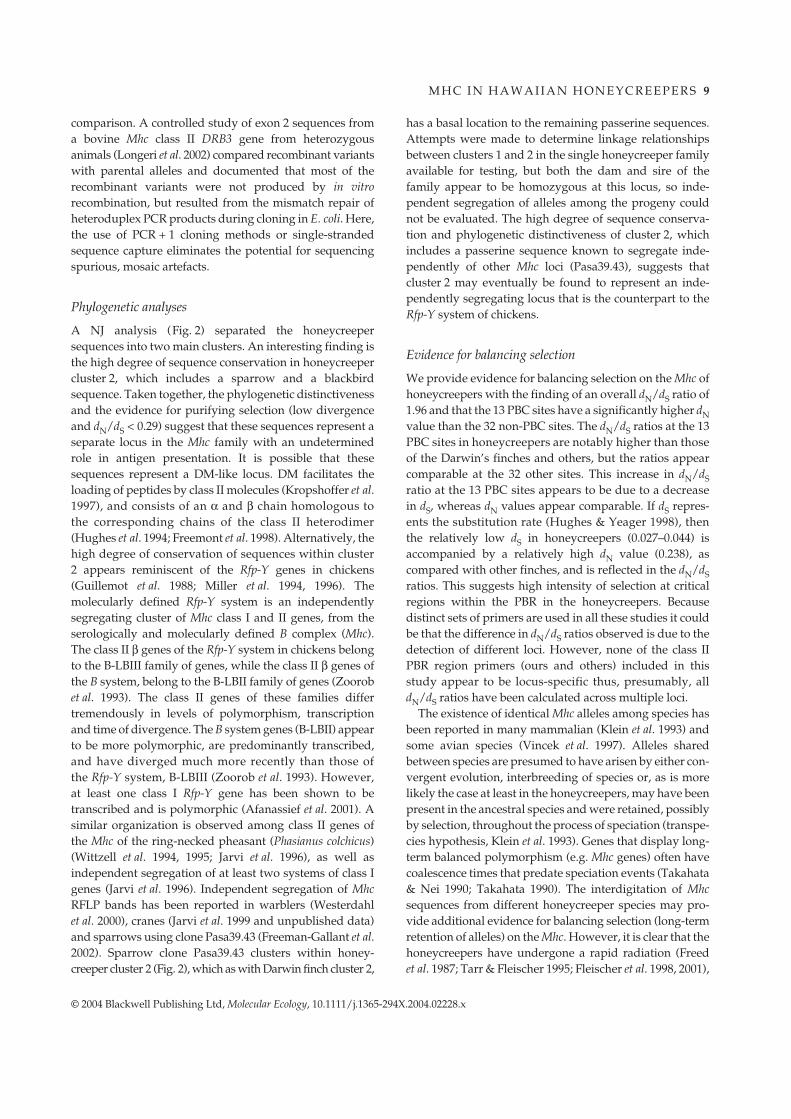
The result of the phylogenetic analyses is shown in Fig. 2.The honeycreeper sequences clustered into two distinctgroups (clusters 1 and 2). Cluster 1 comprised a collectionof 28 diverse sequences (average d = 0.101; Table 3). Thecluster was nested within a larger grouping that includedthe Darwin’s finch sequences. The sequences from eachdrepanid species did not cluster together, but insteadwere interdigitated on the phylogeny. In contrast, the15 sequences from putative nonrelatives in cluster 2,although highly divergent from the other Mhc sequences,show a high degree of similarity to each other (average d =0.014). Also, there is extensive allele sharing among the dre-panid species (see Fig. 2). The sparrow and red-winged black-bird sequences also fall within the low-variability cluster 2.The distinctness and limited variability of sequences incluster 2 suggest that they may represent alleles of a distinctlocus, whereas the remaining sequences comprise severalgroupings, possibly originating from several other loci.
A neighbour-joining (NJ) tree was constructed fromthe predicted amino acid sequences of honeycreepercluster 2 (Fig. 2 insert). The high degree of conservationamong sequences in honeycreeper cluster 2 is particularlyapparent at the amino acid level. Of the 25 sequences (23honeycreeper sequences) in cluster 2, 11 sequences origin-ating from 10 apparently unrelated individuals of threespecies are identical at the amino acid level (Figs 1, and 2).The sequence from a fourth honeycreeper species (Loba1)appears highly conserved in 8 individual palila (data notshown), and differs from the remaining highly conserved11 sequences by only a single nonsynonymous nucleotidesubstitution. This highly conserved sequence was alsodetected in a Savannah sparrow Pasa39.43 and a red-winged blackbird Agph117.5.
The Darwin’s finch sequences also form two majorclusters, likely consisting of multiple loci. Just as seen forhoneycreepers, the Darwin’s finch sequences fell into ahighly variable grouping (clusters/groups 1, 2, 3; averaged = 0.116), as well as a low-variability cluster that is distinctfrom the rest (cluster/group 4; average d = 0.025). [Thedata from Darwin’s finches are presented here in aconsolidated form; see Vincek et al. (1997) for individualsequence relationships.] For each taxonomic group, thelow-variability cluster assumes a basal position in thephylogeny of alleles.
Fig. 1 Predicted amino acid sequences of the 45 distinct nucleotidesequences originating from honeycreepers. Honeycreeper sequencesdefined by species use the following acronyms: ‘amakihi, Hevi;i’iwi, Veco; ‘apapane, Hisa; and palila, Loba. Included are highlyconserved sequences from a Savannah sparrow (Pasa39.43) and ared-winged blackbird (Agph117.5).
6 S . I . J A R V I E T A L .
© 2004 Blackwell Publishing Ltd, Molecular Ecology, 10.1111/j.1365-294X.2004.02228.x
Measures of diversity
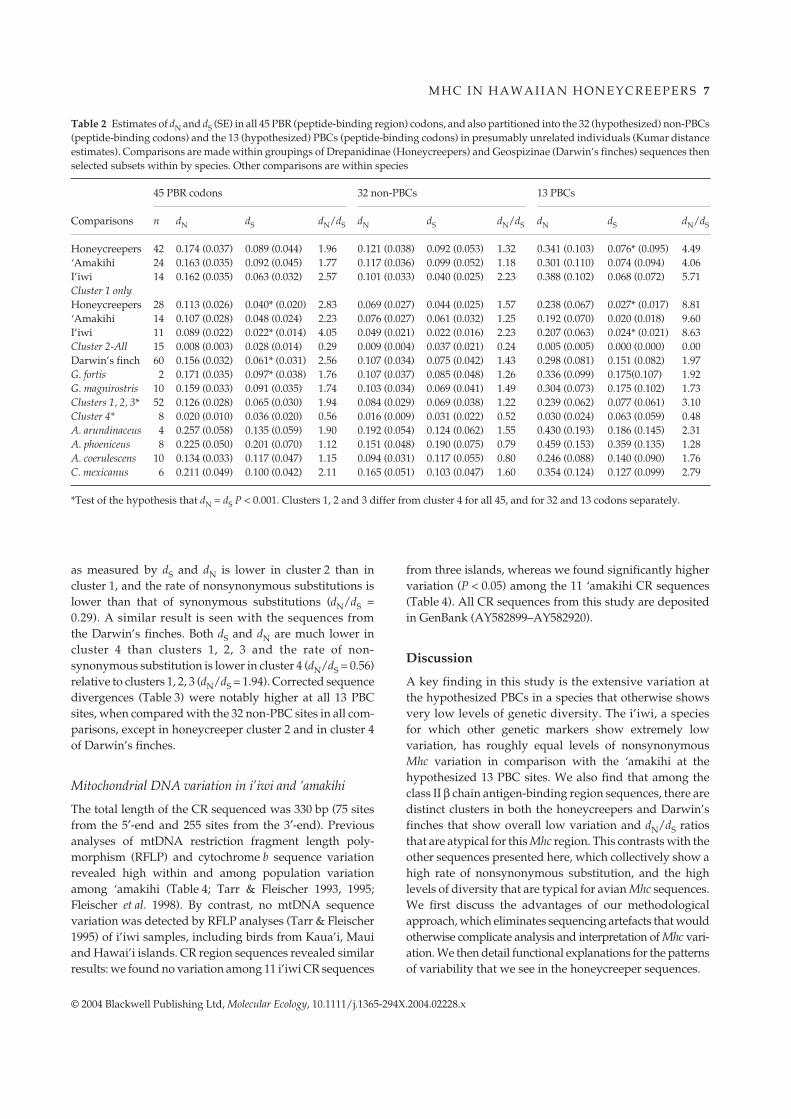
Calculations of dN and dS are shown in Table 2 for differentgroupings of the Hawaiian honeycreeper sequences andfor Darwin’s finch exon 2 sequences and others. The meanvalues of dN and dS across all 42 honeycreeper sequences,and the ratio of the two (1.96), are typical of other studiesof Mhc sequences in birds. This ratio suggests that mostof the changes have been in nonsynonymous sites, andprovides evidence that the variability in this region ismaintained by positive Darwinian or balancing selection.The 45 codon sequence was divided into the 13 codonshypothesized to be involved in peptide binding (peptide-
binding codons or PBCs) and 32 which are presumably notdirectly involved (non-PBCs), based on the 3D structure ofthe human class II antigen (Brown et al. 1993). The findingthat the 13 PBC sites in all honeycreepers and in i’iwi and‘amakihi separately (Table 2) have a significantly higher dNvalue than the 32 non-PBC sites (Z = 4.0, P < 0.001), but notdS (Z = 0.3, P > 0.50), provides further support for positiveselection on this region. The dN/dS ratios at the 13 PBC sitesin honeycreepers are more than twice that of the Darwin’sfinches and others, but the ratios appear comparable at theother 32 non-PBC. This increase in dN/ds ratio at the 13PBC sites appears to be due to a decrease in dS, while dNvalues appear comparable. In all comparisons, variation
Fig. 2 A neighbour-joining tree (Kimura2-parameter corrected distances) generatedusing paup. Included are 51 drepanidinaesequences (‘amakihi, Hevi; i’iwi, Veco;‘apapane, Hisa; and palila, Loba) 60Darwin’s finch sequences (Z74411–Z74470),one sparrow sequence (AF42007), oneblackbird sequence (U24418) and two galli-form sequences (pheasant X75404 andchicken X07447). The data from Darwin’sfinches are presented here in a consolidated,truncated form; see Vincek et al. (1997) forindividual sequence relationships.
M H C I N H A W A I I A N H O N E Y C R E E P E R S 7
© 2004 Blackwell Publishing Ltd, Molecular Ecology, 10.1111/j.1365-294X.2004.02228.x
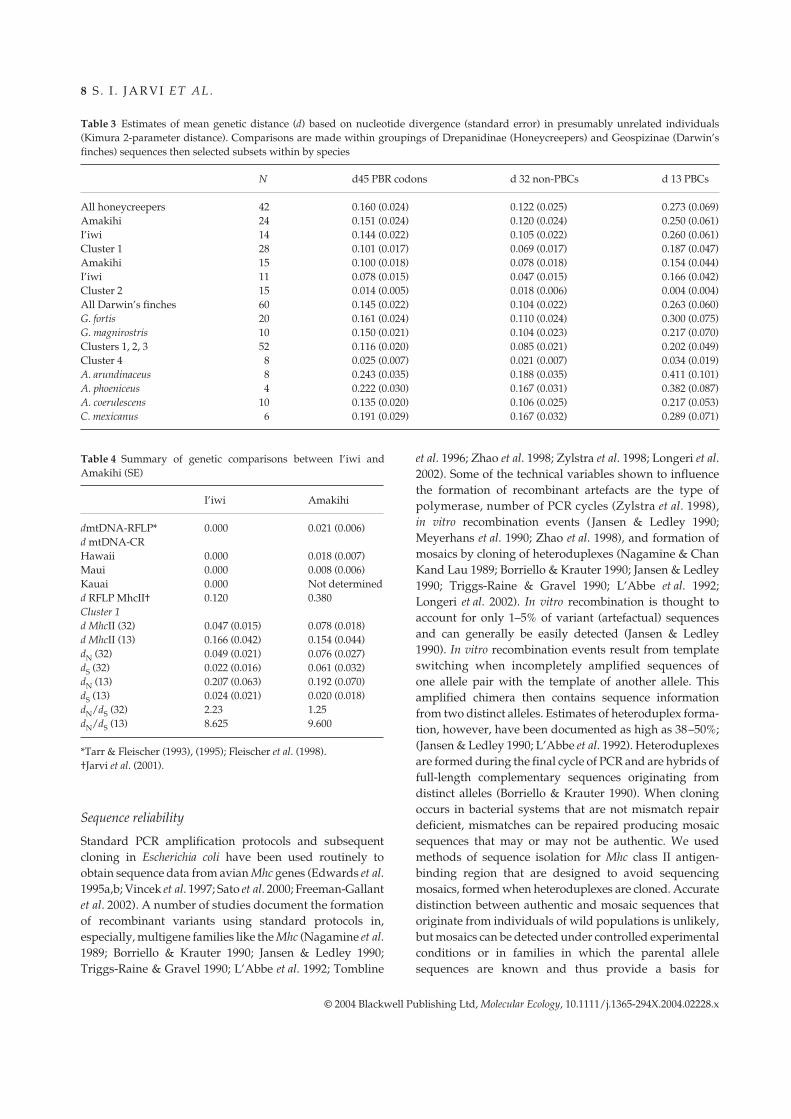
as measured by dS and dN is lower in cluster 2 than incluster 1, and the rate of nonsynonymous substitutions islower than that of synonymous substitutions (dN/dS =0.29). A similar result is seen with the sequences fromthe Darwin’s finches. Both dS and dN are much lower incluster 4 than clusters 1, 2, 3 and the rate of non-synonymous substitution is lower in cluster 4 (dN/dS = 0.56)relative to clusters 1, 2, 3 (dN/dS = 1.94). Corrected sequencedivergences (Table 3) were notably higher at all 13 PBCsites, when compared with the 32 non-PBC sites in all com-parisons, except in honeycreeper cluster 2 and in cluster 4of Darwin’s finches.
Mitochondrial DNA variation in i’iwi and ‘amakihi
The total length of the CR sequenced was 330 bp (75 sitesfrom the 5′-end and 255 sites from the 3′-end). Previousanalyses of mtDNA restriction fragment length poly-morphism (RFLP) and cytochrome b sequence variationrevealed high within and among population variationamong ‘amakihi (Table 4; Tarr & Fleischer 1993, 1995;Fleischer et al. 1998). By contrast, no mtDNA sequencevariation was detected by RFLP analyses (Tarr & Fleischer1995) of i’iwi samples, including birds from Kaua’i, Mauiand Hawai’i islands. CR region sequences revealed similarresults: we found no variation among 11 i’iwi CR sequences
from three islands, whereas we found significantly highervariation (P < 0.05) among the 11 ‘amakihi CR sequences(Table 4). All CR sequences from this study are depositedin GenBank (AY582899–AY582920).
Discussion
A key finding in this study is the extensive variation atthe hypothesized PBCs in a species that otherwise showsvery low levels of genetic diversity. The i’iwi, a speciesfor which other genetic markers show extremely lowvariation, has roughly equal levels of nonsynonymousMhc variation in comparison with the ‘amakihi at thehypothesized 13 PBC sites. We also find that among theclass II β chain antigen-binding region sequences, there aredistinct clusters in both the honeycreepers and Darwin’sfinches that show overall low variation and dN/dS ratiosthat are atypical for this Mhc region. This contrasts with theother sequences presented here, which collectively show ahigh rate of nonsynonymous substitution, and the highlevels of diversity that are typical for avian Mhc sequences.We first discuss the advantages of our methodologicalapproach, which eliminates sequencing artefacts that wouldotherwise complicate analysis and interpretation of Mhc vari-ation. We then detail functional explanations for the patternsof variability that we see in the honeycreeper sequences.
Table 2 Estimates of dN and dS (SE) in all 45 PBR (peptide-binding region) codons, and also partitioned into the 32 (hypothesized) non-PBCs(peptide-binding codons) and the 13 (hypothesized) PBCs (peptide-binding codons) in presumably unrelated individuals (Kumar distanceestimates). Comparisons are made within groupings of Drepanidinae (Honeycreepers) and Geospizinae (Darwin’s finches) sequences thenselected subsets within by species. Other comparisons are within species
Comparisons
45 PBR codons 32 non-PBCs 13 PBCs
n dN dS dN/dS dN dS dN/dS dN dS dN/dS
Honeycreepers 42 0.174 (0.037) 0.089 (0.044) 1.96 0.121 (0.038) 0.092 (0.053) 1.32 0.341 (0.103) 0.076* (0.095) 4.49‘Amakihi 24 0.163 (0.035) 0.092 (0.045) 1.77 0.117 (0.036) 0.099 (0.052) 1.18 0.301 (0.110) 0.074 (0.094) 4.06I’iwi 14 0.162 (0.035) 0.063 (0.032) 2.57 0.101 (0.033) 0.040 (0.025) 2.23 0.388 (0.102) 0.068 (0.072) 5.71Cluster 1 onlyHoneycreepers 28 0.113 (0.026) 0.040* (0.020) 2.83 0.069 (0.027) 0.044 (0.025) 1.57 0.238 (0.067) 0.027* (0.017) 8.81‘Amakihi 14 0.107 (0.028) 0.048 (0.024) 2.23 0.076 (0.027) 0.061 (0.032) 1.25 0.192 (0.070) 0.020 (0.018) 9.60I’iwi 11 0.089 (0.022) 0.022* (0.014) 4.05 0.049 (0.021) 0.022 (0.016) 2.23 0.207 (0.063) 0.024* (0.021) 8.63Cluster 2-All 15 0.008 (0.003) 0.028 (0.014) 0.29 0.009 (0.004) 0.037 (0.021) 0.24 0.005 (0.005) 0.000 (0.000) 0.00Darwin’s finch 60 0.156 (0.032) 0.061* (0.031) 2.56 0.107 (0.034) 0.075 (0.042) 1.43 0.298 (0.081) 0.151 (0.082) 1.97G. fortis 2 0.171 (0.035) 0.097* (0.038) 1.76 0.107 (0.037) 0.085 (0.048) 1.26 0.336 (0.099) 0.175(0.107) 1.92G. magnirostris 10 0.159 (0.033) 0.091 (0.035) 1.74 0.103 (0.034) 0.069 (0.041) 1.49 0.304 (0.073) 0.175 (0.102) 1.73Clusters 1, 2, 3* 52 0.126 (0.028) 0.065 (0.030) 1.94 0.084 (0.029) 0.069 (0.038) 1.22 0.239 (0.062) 0.077 (0.061) 3.10Cluster 4* 8 0.020 (0.010) 0.036 (0.020) 0.56 0.016 (0.009) 0.031 (0.022) 0.52 0.030 (0.024) 0.063 (0.059) 0.48A. arundinaceus 4 0.257 (0.058) 0.135 (0.059) 1.90 0.192 (0.054) 0.124 (0.062) 1.55 0.430 (0.193) 0.186 (0.145) 2.31A. phoeniceus 8 0.225 (0.050) 0.201 (0.070) 1.12 0.151 (0.048) 0.190 (0.075) 0.79 0.459 (0.153) 0.359 (0.135) 1.28A. coerulescens 10 0.134 (0.033) 0.117 (0.047) 1.15 0.094 (0.031) 0.117 (0.055) 0.80 0.246 (0.088) 0.140 (0.090) 1.76C. mexicanus 6 0.211 (0.049) 0.100 (0.042) 2.11 0.165 (0.051) 0.103 (0.047) 1.60 0.354 (0.124) 0.127 (0.099) 2.79
*Test of the hypothesis that dN = dS P < 0.001. Clusters 1, 2 and 3 differ from cluster 4 for all 45, and for 32 and 13 codons separately.
8 S . I . J A R V I E T A L .
© 2004 Blackwell Publishing Ltd, Molecular Ecology, 10.1111/j.1365-294X.2004.02228.x
Sequence reliability
Standard PCR amplification protocols and subsequentcloning in Escherichia coli have been used routinely toobtain sequence data from avian Mhc genes (Edwards et al.1995a,b; Vincek et al. 1997; Sato et al. 2000; Freeman-Gallantet al. 2002). A number of studies document the formationof recombinant variants using standard protocols in,especially, multigene families like the Mhc (Nagamine et al.1989; Borriello & Krauter 1990; Jansen & Ledley 1990;Triggs-Raine & Gravel 1990; L’Abbe et al. 1992; Tombline
et al. 1996; Zhao et al. 1998; Zylstra et al. 1998; Longeri et al.2002). Some of the technical variables shown to influencethe formation of recombinant artefacts are the type ofpolymerase, number of PCR cycles (Zylstra et al. 1998),in vitro recombination events (Jansen & Ledley 1990;Meyerhans et al. 1990; Zhao et al. 1998), and formation ofmosaics by cloning of heteroduplexes (Nagamine & ChanKand Lau 1989; Borriello & Krauter 1990; Jansen & Ledley1990; Triggs-Raine & Gravel 1990; L’Abbe et al. 1992;Longeri et al. 2002). In vitro recombination is thought toaccount for only 1–5% of variant (artefactual) sequencesand can generally be easily detected (Jansen & Ledley1990). In vitro recombination events result from templateswitching when incompletely amplified sequences ofone allele pair with the template of another allele. Thisamplified chimera then contains sequence informationfrom two distinct alleles. Estimates of heteroduplex forma-tion, however, have been documented as high as 38–50%;(Jansen & Ledley 1990; L’Abbe et al. 1992). Heteroduplexesare formed during the final cycle of PCR and are hybrids offull-length complementary sequences originating fromdistinct alleles (Borriello & Krauter 1990). When cloningoccurs in bacterial systems that are not mismatch repairdeficient, mismatches can be repaired producing mosaicsequences that may or may not be authentic. We usedmethods of sequence isolation for Mhc class II antigen-binding region that are designed to avoid sequencingmosaics, formed when heteroduplexes are cloned. Accuratedistinction between authentic and mosaic sequences thatoriginate from individuals of wild populations is unlikely,but mosaics can be detected under controlled experimentalconditions or in families in which the parental allelesequences are known and thus provide a basis for
Table 3 Estimates of mean genetic distance (d) based on nucleotide divergence (standard error) in presumably unrelated individuals(Kimura 2-parameter distance). Comparisons are made within groupings of Drepanidinae (Honeycreepers) and Geospizinae (Darwin’sfinches) sequences then selected subsets within by species
N d45 PBR codons d 32 non-PBCs d 13 PBCs
All honeycreepers 42 0.160 (0.024) 0.122 (0.025) 0.273 (0.069)Amakihi 24 0.151 (0.024) 0.120 (0.024) 0.250 (0.061)I’iwi 14 0.144 (0.022) 0.105 (0.022) 0.260 (0.061)Cluster 1 28 0.101 (0.017) 0.069 (0.017) 0.187 (0.047)Amakihi 15 0.100 (0.018) 0.078 (0.018) 0.154 (0.044)I’iwi 11 0.078 (0.015) 0.047 (0.015) 0.166 (0.042)Cluster 2 15 0.014 (0.005) 0.018 (0.006) 0.004 (0.004)All Darwin’s finches 60 0.145 (0.022) 0.104 (0.022) 0.263 (0.060)G. fortis 20 0.161 (0.024) 0.110 (0.024) 0.300 (0.075)G. magnirostris 10 0.150 (0.021) 0.104 (0.023) 0.217 (0.070)Clusters 1, 2, 3 52 0.116 (0.020) 0.085 (0.021) 0.202 (0.049)Cluster 4 8 0.025 (0.007) 0.021 (0.007) 0.034 (0.019)A. arundinaceus 8 0.243 (0.035) 0.188 (0.035) 0.411 (0.101)A. phoeniceus 4 0.222 (0.030) 0.167 (0.031) 0.382 (0.087)A. coerulescens 10 0.135 (0.020) 0.106 (0.025) 0.217 (0.053)C. mexicanus 6 0.191 (0.029) 0.167 (0.032) 0.289 (0.071)
Table 4 Summary of genetic comparisons between I’iwi andAmakihi (SE)
I’iwi Amakihi
dmtDNA-RFLP* 0.000 0.021 (0.006)d mtDNA-CRHawaii 0.000 0.018 (0.007)Maui 0.000 0.008 (0.006)Kauai 0.000 Not determinedd RFLP MhcII† 0.120 0.380Cluster 1d MhcII (32) 0.047 (0.015) 0.078 (0.018)d MhcII (13) 0.166 (0.042) 0.154 (0.044)dN (32) 0.049 (0.021) 0.076 (0.027)dS (32) 0.022 (0.016) 0.061 (0.032)dN (13) 0.207 (0.063) 0.192 (0.070)dS (13) 0.024 (0.021) 0.020 (0.018)dN/dS (32) 2.23 1.25dN/dS (13) 8.625 9.600
*Tarr & Fleischer (1993), (1995); Fleischer et al. (1998).†Jarvi et al. (2001).
M H C I N H A W A I I A N H O N E Y C R E E P E R S 9
© 2004 Blackwell Publishing Ltd, Molecular Ecology, 10.1111/j.1365-294X.2004.02228.x
comparison. A controlled study of exon 2 sequences froma bovine Mhc class II DRB3 gene from heterozygousanimals (Longeri et al. 2002) compared recombinant variantswith parental alleles and documented that most of therecombinant variants were not produced by in vitrorecombination, but resulted from the mismatch repair ofheteroduplex PCR products during cloning in E. coli. Here,the use of PCR + 1 cloning methods or single-strandedsequence capture eliminates the potential for sequencingspurious, mosaic artefacts.
Phylogenetic analyses
A NJ analysis (Fig. 2) separated the honeycreepersequences into two main clusters. An interesting finding isthe high degree of sequence conservation in honeycreepercluster 2, which includes a sparrow and a blackbirdsequence. Taken together, the phylogenetic distinctivenessand the evidence for purifying selection (low divergenceand dN/dS < 0.29) suggest that these sequences represent aseparate locus in the Mhc family with an undeterminedrole in antigen presentation. It is possible that thesesequences represent a DM-like locus. DM facilitates theloading of peptides by class II molecules (Kropshoffer et al.1997), and consists of an α and β chain homologous tothe corresponding chains of the class II heterodimer(Hughes et al. 1994; Freemont et al. 1998). Alternatively, thehigh degree of conservation of sequences within cluster2 appears reminiscent of the Rfp-Y genes in chickens(Guillemot et al. 1988; Miller et al. 1994, 1996). Themolecularly defined Rfp-Y system is an independentlysegregating cluster of Mhc class I and II genes, from theserologically and molecularly defined B complex (Mhc).The class II β genes of the Rfp-Y system in chickens belongto the B-LBIII family of genes, while the class II β genes ofthe B system, belong to the B-LBII family of genes (Zoorobet al. 1993). The class II genes of these families differtremendously in levels of polymorphism, transcriptionand time of divergence. The B system genes (B-LBII) appearto be more polymorphic, are predominantly transcribed,and have diverged much more recently than those ofthe Rfp-Y system, B-LBIII (Zoorob et al. 1993). However,at least one class I Rfp-Y gene has been shown to betranscribed and is polymorphic (Afanassief et al. 2001). Asimilar organization is observed among class II genes ofthe Mhc of the ring-necked pheasant (Phasianus colchicus)(Wittzell et al. 1994, 1995; Jarvi et al. 1996), as well asindependent segregation of at least two systems of class Igenes (Jarvi et al. 1996). Independent segregation of MhcRFLP bands has been reported in warblers (Westerdahlet al. 2000), cranes (Jarvi et al. 1999 and unpublished data)and sparrows using clone Pasa39.43 (Freeman-Gallant et al.2002). Sparrow clone Pasa39.43 clusters within honey-creeper cluster 2 (Fig. 2), which as with Darwin finch cluster 2,
has a basal location to the remaining passerine sequences.Attempts were made to determine linkage relationshipsbetween clusters 1 and 2 in the single honeycreeper familyavailable for testing, but both the dam and sire of thefamily appear to be homozygous at this locus, so inde-pendent segregation of alleles among the progeny couldnot be evaluated. The high degree of sequence conserva-tion and phylogenetic distinctiveness of cluster 2, whichincludes a passerine sequence known to segregate inde-pendently of other Mhc loci (Pasa39.43), suggests thatcluster 2 may eventually be found to represent an inde-pendently segregating locus that is the counterpart to theRfp-Y system of chickens.
Evidence for balancing selection
We provide evidence for balancing selection on the Mhc ofhoneycreepers with the finding of an overall dN/dS ratio of1.96 and that the 13 PBC sites have a significantly higher dNvalue than the 32 non-PBC sites. The dN/dS ratios at the 13PBC sites in honeycreepers are notably higher than thoseof the Darwin’s finches and others, but the ratios appearcomparable at the 32 other sites. This increase in dN/dSratio at the 13 PBC sites appears to be due to a decreasein dS, whereas dN values appear comparable. If dS repres-ents the substitution rate (Hughes & Yeager 1998), thenthe relatively low dS in honeycreepers (0.027–0.044) isaccompanied by a relatively high dN value (0.238), ascompared with other finches, and is reflected in the dN/dSratios. This suggests high intensity of selection at criticalregions within the PBR in the honeycreepers. Becausedistinct sets of primers are used in all these studies it couldbe that the difference in dN/dS ratios observed is due to thedetection of different loci. However, none of the class IIPBR region primers (ours and others) included in thisstudy appear to be locus-specific thus, presumably, alldN/dS ratios have been calculated across multiple loci.
The existence of identical Mhc alleles among species hasbeen reported in many mammalian (Klein et al. 1993) andsome avian species (Vincek et al. 1997). Alleles sharedbetween species are presumed to have arisen by either con-vergent evolution, interbreeding of species or, as is morelikely the case at least in the honeycreepers, may have beenpresent in the ancestral species and were retained, possiblyby selection, throughout the process of speciation (transpe-cies hypothesis, Klein et al. 1993). Genes that display long-term balanced polymorphism (e.g. Mhc genes) often havecoalescence times that predate speciation events (Takahata& Nei 1990; Takahata 1990). The interdigitation of Mhcsequences from different honeycreeper species may pro-vide additional evidence for balancing selection (long-termretention of alleles) on the Mhc. However, it is clear that thehoneycreepers have undergone a rapid radiation (Freedet al. 1987; Tarr & Fleischer 1995; Fleischer et al. 1998, 2001),

10 S . I . J A R V I E T A L .
© 2004 Blackwell Publishing Ltd, Molecular Ecology, 10.1111/j.1365-294X.2004.02228.x
so it is unclear how nuclear sequences that evolve neutrallyand under purifying selection would assort phylogenetically.
Species comparison
Studies involving experimental infection with malariahave provided evidence that susceptibility to malariavaries among species of honeycreepers. ‘Amakihi havesubstantially lower mortality (65%) than do i’iwi (90–100%)under comparable experimental conditions (Atkinson et al.1995, 2000; Yorinks & Atkinson 2000). This difference insusceptibility appears to translate to wild populationsas well as wild ‘amakihi typically have prevalences ofinfection with chronic malaria that are up to 5–10 timeshigher than wild i’iwi, suggesting that significantly more‘amakihi are able to survive the initial acute phase of thedisease under natural conditions (CT Atkinson, unpub-lished). While ‘amakihi are generalists, quite sedentaryand are currently abundant throughout the main Hawaiianislands, i’iwi are considered specialists, are a mobile speciesand although historically abundant, are currently limitedto forests above 1500 m on Hawai’i, Maui and Kaua’i (Fancy& Ralph 1998). The leading hypothesis for restriction ofthis species to higher elevations is high susceptibility tomalaria (Atkinson et al. 1995).
In a comparison based on RFLP analyses (Jarvi et al.2001) i’iwi appear significantly less variable (P < 0.001) atclass II loci than ‘amakihi (Table 4). In the current study,we found no difference in Mhc sequence variabilitybetween i’iwi and ‘amakihi at the 13 PBC sites, dS and dNvalues and genetic distances did not differ overall. How-ever, at the 32 non-PBC sites diversity in i’iwi appearsconsistently lower than that observed in ‘amakihi(summarized in Tables 2, 3). Thus, the RFLP/Southern blotanalyses of class II genes may reflect the low variability ini’iwi at non-PBC or other adjacent or linked sites, but can-not resolve the higher level of variability at the 13 PBCsites. Additional studies of nuclear genes of individualssubjected to experimental infection with malaria and fromnatural populations are currently underway. These studieswill allow us to directly relate particular Mhc variants withresistance to malaria.
Studies of mtDNA, as assessed by RFLP analyses ofwhole mtDNA, cytochrome b sequences, and CR regionsequences, show no variation among i’iwi, but showsubstantial variation within and among populations of‘amakihi (Table 4; Tarr & Fleischer 1993, 1995; Fleischeret al. 1998). This suggests that i’iwi have had a considerablymore recent coalescence time for their mtDNA sequencesthan ‘amakihi. The extremely low variation in i’iwimtDNA may have been caused by a genetic bottleneck ora selective sweep. A bottleneck is further supported by thefinding of low allozyme variation in i’iwi relative to ‘amak-ihi (Johnson et al. 1989): it would be unlikely that a selective
sweep at one locus would impact variation at manyunlinked loci. This reduction in variation likely alsoinvolved a recent spread among the islands, as i’iwi on allislands, including distantly located ones (e.g. Kaua’i andHawai’i), have identical haplotypes. Such low genetic vari-ation suggests that the event happened relatively recently— thousands or tens of thousands of years ago, but notmuch earlier. We do not think the putative bottleneckoccurred more recently than thousands of years agobecause nuclear variation in the i’iwi as assessed by AFLP(SI Jarvi et al. unpublished) and microsatellite data (LEggert et al. unpublished) appears comparable with thatfound in the ‘amakihi. In other words, there may have beentime since a major bottleneck for the rapidly mutating micro-satellites and some other nuclear loci to recover variation,while loci with lower mutation rates (i.e. mtDNA) mightnot have had time to accumulate mutations. In the case ofmicrosatellites, assuming a mutation rate of 10−4, a simpleequilibrium level for the heterozygosity we observedwould be ~ 10 000 years. Because transmission of the para-site causing the current malaria epidemic could not occuruntil the arrival of its vector Culex quinquefasciatus in 1826(Hardy 1960) it is unlikely related to this historic bottle-neck. One interesting implication of this putative historicalbottleneck is that the level of variation in the Mhc mightalso expected to be low, as there is no evidence of a highermutation rate for Mhc genes. The finding of similar Mhcvariation at the 13 PBC sites suggests that selection mayhave maintained variation in i’iwi, even in the face of whatappears to be a major genetic bottleneck.
Acknowledgements
We would like to thank the following for assistance in the field, inlaboratory studies or for providing tissue samples: Paul Banko,Scott Derrickson, Marcy Grace, Isaac Jones, Carla Kishinami,Thane Pratt and Jennifer Wilcox, and for helpful comments anddiscussion: Ronald Goto, Peter and Rosemary Grant, Phil Hedrick,Austin Hughes, Marcia Miller and Wayne Potts. This research wasmade possible by financial support from a Smithsonian MolecularEvolution Fellowship to S.I. Jarvi, a Smithsonian Institution Schol-arly Studies grant (to RCF, SIJ and Jon Ballou) a Smithson Fundgrant (to RCF), a National Science Foundation grant (DEB-0083944to David Duffy, SIJ, CTA, RCF and Michael Samuel), and theU.S. Geological Survey, Wildlife and Invasive Species Programs.Any use of trade, product, or firm names in this publication is fordescriptive purposes only and does not imply endorsement by theU.S. Government. The opinions expressed in this product arethose of the authors and do not necessarily represent the opinionsof the U.S. Government.
References
Afanassief M, Goto RM, Ha J et al. (2001) At least one class I genein restriction fragment pattern-Y (Rfp-Y), the second MHC genecluster in the chicken is transcribed, polymorphic and shows

M H C I N H A W A I I A N H O N E Y C R E E P E R S 11
© 2004 Blackwell Publishing Ltd, Molecular Ecology, 10.1111/j.1365-294X.2004.02228.x
divergent specialization in antigen binding region. Journal ofImmunology, 166, 3324–3333.
Atkinson CT, Dusek RJ, Lease JK (2001) Serological responses andimmunity to super-infection with avian malaria in experimentally-infected Hawaii Amakihi. Journal of Wildlife Diseases, 37, 20–27.
Atkinson CT, Dusek RJ, Woods KL, Iko WM (2000) Pathogenicityof avian malaria in experimentally-infected Hawaii Amakihi.Journal of Wildlife Diseases, 36, 197–204.
Atkinson CT, Woods KL, Dusek RJ, Sileo LS, Iko WM (1995) Wild-life disease and conservation in Hawaii: pathogenicity of avianmalaria (Plasmodium relictum) in experimentally infected Iiwi(Vestiaria coccinea). Parasitology, 111 (Suppl.), 59–69.
Benning TL, LaPointe D, Atkinson CT, Vitousek PM (2002)Interactions of climate change with biological invasions andland use in the Hawaiian Islands: modeling the fate of endemicbirds using a geographic information system. Proceedings of theNational Academy of Sciences of the USA, 99, 14246–14249.
Borriello F, Krauter KS (1990) Reactive site polymorphism inthe murine protease inhibitor gene family is delineated usinga modification of the PCR reaction (PCR+1). Nucleic AcidsResearch, 18, 5481–5487.
Brown JL (1999) The new heterozygosity theory of mate choiceand the MHC. Genetica, 104, 215–221.
Brown JH, Jardetzky T, Saper MA, Samraoui B, Bjorkman PJ,Wiley DC (1993) Three-dimensional structure of the humanclass II histocompatibility antigen HLA-DR1. Nature, 364, 33–39.
Edwards SV, Grahn M, Potts WK (1995a) Dynamics of Mhc evolu-tion in birds and crocodilians: amplification of class II geneswith degenerate primers. Molecular Ecology, 4, 719–729.
Edwards SV, Wakeland EK, Potts WK (1995b) Contrasting histo-ries of avian and mammalian Mhc genes revealed by class II βsequences from songbirds. Proceedings of the National Academy ofSciences of the USA, 92, 12200–12204.
Fancy SG, Ralph CJ (1998) I’iwi Vestiaria coccinea. In: The Birds ofNorth America (eds Poole A, Gill FB), no. 327, pp. 1–16. Academyof Natural Sciences, Philadelphia/American OrnithologistsUnion, Washington, DC.
Fleischer RC, McIntosh CE (2001) Molecular systematics andbiogeography of the Hawaiian avifauna. In: Evolution, Ecology,Conservation and Management of Hawaiian Birds: A VanishingAvifauna. Studies in Avian Biology, 22 (eds Scott JM, Conant S,Van Riper C), pp. 51–60. Allen Press, Lawrence, KS.
Fleischer RC, McIntosh CE, Tarr CL (1998) Evolution on a volcanicconveyor belt: using phylogenetic reconstructions and K-Arbased ages of the Hawaiian Islands to estimate molecular evo-lutionary rates. Molecular Ecology, 7, 533–545.
Fleischer RC, Tarr CL, Pratt TK (1994) Genetic structure andmating system in the Palila, an endangered Hawaiian honey-creeper, as assessed by DNA fingerprinting. Molecular Ecology,3, 383–392.
Freed LA, Conant SC, Fleischer RC (1987) Evolutionary ecologyand radiation of Hawaiian forest birds. TREE, 2, 196–203.
Freeman-Gallant CR, Johnson EM, Saponara F, Stanger M (2002)Variation at the major histocompatibility complex in Savannahsparrows. Molecular Ecology, 11, 1125–1130.
Freemont DH, Crawford F, Marrack P, Hendrickson WA, KapplerJ (1998) Crystal structure of H2-M. Immunity, 9, 385–393.
Gilbert SC, Plebanski M, Gupta S et al. (1998) Association ofmalaria parasite populations structure, HLA and immunolo-gical antagonism. Science, 279, 1173–1177.
Grace MB, Buzard GS, Weintraub BD (1995) Allele-specific associ-ated polymorphism analysis: novel modification of SSCP for
mutation detection in heterozygous alleles using the paradigmof resistance to thyroid hormone. Human Mutation, 6, 232–242.
Guillemot F, Billault A, Pourquie O et al. (1988) A molecular mapof chicken MHC complex: the class II beta genes are closelylinked to the class I genes and nucleolar organizer. EMBO, 7,2775–2785.
Hardy DE (1960) Insects of Hawaii. Diptera: Nematocera-Brachycera.University of Hawaii Press, Honolulu.
Hedrick PW (1994) Evolutionary genetics of the major histocom-patiblity complex. American Naturalist, 143, 945–964.
Hedrick PW (1999) Balancing selection and MHC. Genetica, 104,207–214.
Hedrick PW, Kim TJ (2000) Genetics of complex polymorphisms:parasites and maintenance of MHC variation. In: EvolutionaryGenetics from Molecules to Morphology (eds Singh RS, Krimbus CK),pp. 204–223. Cambridge University Press, New York.
Hill AVS, Weatherall DJ (1998) Host genetic factors in resistance tomalaria. In: Malaria: Parasite Biology, Pathogenesis and Protections(ed. Sherman IW), pp. 445–455. ASM Press, Washington DC.
Hughes AL, Nei M (1988) Patterns of nucleotide substitutionsat major histocompatibility complex class I loci reveals over-dominant selection. Nature, 335, 167–170.
Hughes AL, Yeager M (1998) Natural selection at major histocom-patibility loci of vertebrates. Annual Review of Genetics, 32, 415–435.
Hughes AL, Hughes MK, Howell CY, Nei M (1994) Naturalselection at the major histocompatibility complex of mammals.Philosophical Transactions of the Royal Society of London, Series B,345, 359–367.
Jacobi JD, Atkinson CT (1995) Hawaii’s endemic birds. In: OurLiving Resources. A Report to the Nation on the Distribution,Abundance, and Health of US Plants, Animals, and Ecosystems(eds LaRoe ET, Farris GS, Puckett CE, Doran PD, Mac MJ),pp. 376–381. US Department of the Interior, National BiologicalService, Washington, DC.
Jansen R, Ledley FD (1990) Disruption of phase during PCR ampli-fication and cloning of heterozygous target sequences. NucleicAcids Research, 18, 5153–5156.
Jarvi SI, Atkinson CT, Fleischer RC (2001) Immunogenetics andresistance to avian malaria (Plasmodium relictum) in Hawaiianhoneycreepers (Drepanidinae). In: Evolution, Ecology, Conserva-tion and Management of Hawaiian Birds: A Vanishing Avifauna.Studies in Avian Biology, 22 (eds Scott JM, Conant S, Van Riper C),pp. 254–263. Allen Press, Lawrence, KS.
Jarvi SI, Goto R, Briles WE, Gee GF, Miller MM (1999) Identifica-tion, inheritance and linkage of B-G-like genes and MHC class Igenes in cranes. Journal of Heredity, 90, 152–159.
Jarvi SI, Goto RM, Briles WE, Miller MM (1996) Characterizationof Mhc genes in an multigenerational family of ring-neckedpheasants. Immunogenetics, 43, 125–135.
Johnson NK, Martin JA, Ralph CJ (1989) Genetic evidence for theorigin and relationships of Hawaiian honeycreepers (Aves:Fringillidae). Condor, 91, 379–396.
Kaufman J, Salomonsen J (1997) The ‘minimal essential Mhc’ revis-ited: both peptide-binding and cell surface expression level ofMHC molecules are polymorphisms selected by pathogens inchickens. Hereditas, 127, 67–73.
Klein J, Satta Y, Takahata N, O’huigin C (1993) Trans-species MHCpolymorphisms and the origin of species in primates. Journal ofMedical Primatology, 22, 57–64.
Kropshoffer H, Hammerling GJ, Vogt AB (1997) How HLA-DMedits the MHC class II peptide repertoire: survival of the fittest?Immunology Today, 18, 77–82.

12 S . I . J A R V I E T A L .
© 2004 Blackwell Publishing Ltd, Molecular Ecology, 10.1111/j.1365-294X.2004.02228.x
Kumar S, Tamura K, Jakobsen I, and. Nei M (2000) MEGA: Molec-ular Evolutionary Genetics Analysis, Version 2.1. Arizona StateUniversity, Tempe.
L’Abbe D, Belmaaza A, Decary F, Chartrand P (1992) Eliminationof heteroduplex artifacts when sequencing HLA genes ampli-fied by polymerase chain reaction (PCR). Immunogenetics, 35,395–397.
Longeri M, Zanotti M, Damiani G (2002) Recombinant DRBsequences produced by mismatch repair of heteroduplexes dur-ing cloning in Escherichia coli. European Journal of Immunogenetics,29, 517–523.
Meyerhans A, Vartanian JP, Wain-Hobson S (1990) DNA recom-bination during PCR. Nucleic Acids Research, 18, 1687.
Miller MM, Goto R, Bernot A et al. (1994) Two Mhc class I and twoMhc class II genes map to the chicken Rfp-Y system outside ofthe B complex. Proceedings of the National Academy of Sciences ofthe USA, 91, 4397–4401.
Miller MM, Goto RM, Taylor RL Jr et al. (1996) Assignment ofRfp-Y to the chicken major histocompatibility complex/NORmicrochromosome and evidence for high-frequency recombina-tion associated with the nucleolar organizer region. Proceedingsof the National Academy of Sciences of the USA, 93, 3958.
Nagamine CM, Chan Kand Lau Y-FC (1989) A PCR artifact: gen-eration of heteroduplexes. American Journal of Human Genetics,45, 337–339.
van Riper C III (1991) The impact of introduced vectors and avianmalaria on insular passeriform bird populations in Hawaii.Bulletin of the Society of Vector Ecologists, 16, 59–83.
van Riper C III, van Riper SG, Goff MI, Laird M (1986) The epi-zootiology and ecological significance of malaria in Hawaiianland birds. Ecological Monographs, 56, 327–344.
Saitou N, Nei M (1987) The neighbor-joining method. A newmethod for reconstructing phylogenetic trees. Molecular Biologyand Evolution, 4, 406–425.
Sato A, Figueroa F, Mayer WE, Grant PR, Grant BR, Klein J (2000)Mhc class II genes of Darwin’s finches: divergence by pointmutations and reciprocal recombination. In: Major Histocom-patibility Complex, Evolution, Structure and Function (ed. KasaharaM), pp. 518–541. Springer, Tokyo.
Schneider S, Roessli D, Excoffier L (2000) Arlequin: A Software forPopulation Genetics Data Analysis, Version 2.000. Genetics andBiometry Laboratory, Department of Anthropology, Universityof Geneva, Geneva, Switzerland.
Takahata N (1990) A simple genealogical structure of stronglybalanced allelic lines and trans-species evolution of poly-morphism. Proceedings of the National Academy of Sciences of theUSA, 87, 2419–2423.
Takahata N, Nei M (1990) Allelic genealogy under overdominantand frequency-dependent selection and polymorphism ofmajor histocompatibility complex loci. Genetics, 124, 967–978.
Tarr CL (1995) Amplification and determination of mitochondrialcontrol-region sequences in oscine passerines. Molecular Ecology,4, 527–529.
Tarr CL, Fleischer RC (1993) Mitochondrial DNA variation andevolutionary relationships in the ‘Amakihi’ complex. Auk, 110,825–831.
Tarr CL, Fleischer RC (1995) Evolutionary relationships of theHawaiian honeycreepers (Aves: Drepanidinae). In: HawaiianBiogeography: Evolution in a Hot-Pot Archipelago (eds Wagner W,Funk V), pp. 147–159. Smithsonian Institution Press, Washington, DC.
Tombline G, Bellizzi D, Sgaramella V (1996) Heterogeniety ofprimer extension products in asymmetric PCR is due to bothcleavage by a structure-specific exo/endonuclease activity ofDNA polymerases and to premature stops. Proceedings of theNational Academy of Sciences of the USA, 93, 2724.
Triggs-Raine BL, Gravel RA (1990) Diagnostic heteroduplexes:simple detection of carriers of a 4-bp insertion mutation inTay-Sachs disease. American Journal of Human Genetics, 46,183–184.
Vincek V, O’Huigin C, Satta Y et al. (1997) How large was thefounding population of Darwin’s finches? Proceedings of theRoyal Society of London, Series B, 264, 111–118.
Vogel TU, Evans DT, Urvater JA, O’Connor DH, Hughes AL,Watkins DI (1999) Major histocompatibility complex genes inprimates: co-evolution with pathogens. Immunological Reviews,167, 327–337.
Warner RE (1968) The role of introduced diseases in the extinctionof the endemic Hawaiian avifauna. Condor, 70, 101–120.
Westerdahl H, Wittzel H, von Schantz T (2000) Mhc diversity intwo passerine birds: no evidence for a minimum essential Mhc.Immunogenetics, 52, 92–100.
Wittzell H, von Schantz T, Zoorob R, Auffray C (1994) Molecularcharacterization of three Mhc class II B haplotypes in the ring-necked pheasant. Immunogenetics, 39, 395–403.
Wittzell H, von Schantz T, Zoorob R, Auffray C (1995) Rfp-Y-likesequences assort independently of pheasant Mhc genes. Immuno-genetics, 42, 68–71.
Yorinks N, Atkinson CT (2000) Effects of malaria (Plasmodiumrelictum) on activity budgets of experimentally-infected juvenileApapane (Himatione sanquinea). Auk, 117, 731–738.
Zhao H, Giver L, Shao Z, Affholter JA, Arnold FH (1998) Molecu-lar evolution by staggered extension process (StEP) in vitrorecombination. Nature Biotechnology, 16, 258.
Zoorob R, Bernot A, Renoir DM, Choukri F, Auffray C (1993)Chicken major histocompatility complex class II β genes: an-alyses of interallelic and interlocus sequence variance. EuropoeanJournal of Immunology, 23, 1139.
Zylstra P, Rothenfluh HS, Weiller GF, Blanden RV, Steele EJ (1998)PCR amplification of murine immunoglobulin germline V genes:strategies for minimization of recombination artifacts. Immuno-logical Cell Biology, 76, 395.
Sue Jarvi is an Assistant Professor of Biology with research interestsin host/parasite coevolution, and population level conservationgenetic studies. Cheryl Tarr is a postdoctoral researcher in theNational Center for Infectious Diseases at the Centers for DiseaseControl and Prevention and has research interests in evolutionarygenetics and molecular systematics. Carl is the laboratorymanager and researcher in the Genetics Program with interests inevolutionary genetics of Hawaiian and other avian taxa, and incomputational biology and programming. Carter Atkinson is aResearch Microbiologist with USGS with interests in avian bloodparasites and the impacts and management of introduced aviandiseases in Pacific island ecosystems. Rob Fleischer is Head of theGenetic Program, and has research interests in evolutionarybiology and in the application of genetic markers to systematic,population and conservation studies of birds and mammals, withspecial interests in the native Hawaiian avifauna.