Embed Size (px)
Citation preview

1
Natural Resources Management
What are natural resources?
Soil, water and vegetation are three basic natural resources. The survival of creation depends upon them and nature has provided them as assets to human beings.
In a wider view, land, water, biodiversity and genetic resources, biomass resources, forests, livestock, fisheries, wild flora and fauna are considered as natural resources.
Now the question is are we aware of these resources? Or the question may be reframed as do we regard those as resources?
If we really regard those as our resources then we have to think about managing those efficiently.
Natural Resource Management: Natural Resources Management (NRM) refers to the sustainable utilization of major natural resources, such as land, water, air, minerals, forests, fisheries, and wild flora and fauna. Together, these resources provide the ecosystem services that underpin human life.
Concern for natural resources management
Over‐exploitation of natural resources by growing population resulted in various severe problems. Destruction of vegetation has resulted in land degradation, denudation, soil erosion, landslides, floods, drought and unbalanced ecosystems. A balanced ecosystem is an urgent need.
Natural resources (land, water, biodiversity and genetic resources, biomass resources, forests, livestock and fisheries) – the very foundation of human survival, progress and prosperity, have been degrading fast, and the unprecedented pace of their erosion is one of the root causes of the agrarian crisis that the country is facing. The demographic and socio‐economic pressures notwithstanding, the unmindful agricultural intensification, over use of marginal lands, imbalanced use of fertilizers, organic matter depletion and deteriorating soil health, extensive

2
diversion of prime agricultural lands to non‐agricultural uses, misuse and inefficient use of irrigation water, depleting aquifers, salination of fertile lands and water logging, deforestation, biodiversity loss and genetic erosion, and climate change are the main underlying causes.
For example, during the ancient period Garhwal Himalaya was full of dense forest and lush green vegetation. The Himalaya is the perennial source of water for rivers, streams and reservoirs. Undoubtedly, nature takes care of its resources through natural process over a period of time and maintains them. But ever‐increasing population, developmental activities and technological modernisation have over‐exploited available resources without taking into consideration the damage and consequences for coming generations. Vegetation plays an important role in protecting land and water. These resources are being depleted at an alarming rate because of human intervention. Degradation and destruction of forest cover in the Himalaya is directly responsible for the denudation of watersheds. In the absence of vegetative ground cover, during the monsoon rainwater comes down to the plains unchecked. Sudden swelling of streams, flash floods in the hills and severe floods in the plains and drought in upstream areas are the consequences.
The downward rush of water has tremendous erosive force and moves millions of tonnes of fertile soil during the rainy season. It causes all types of erosion as well as devastating landslides in the Himalaya. Developmental activities, construction of roads, extraction of building material and mining, etc., are a constant threat.
Denuded hills and other wastelands pose serious problems which adversely affect agriculture and human life in the region. Landslides and landslips block hill roads and charge streams with heavy sediment loads. The soil erosion taking place crosses the permissible limit of 4.5 to 11.5 tonnes/ha many times, causing siltation in the downstream and final consequence is severe hydro metrological disorders like flood and drought in the states dependent on those Himalayan Rivers.
Destruction of mangrove forests had led severe damages of Sundarban islands during cyclone ‘Aila’ in 2009 and huge losses and damages in Myanmar during cyclone ‘Nargis’ during 2008.

3
During Orissa Super cyclone in the year 2000, sea water entered into 150 K.m. inland as the mangrove forests were destroyed for shrimp cultivation. Mangrove forests act as natural barrier to hold a natural hazard from becoming a disaster.
Moreover, due to impacts of climate change like global warming, many adverse changes are taking place in the nature as well as in the natural resources.
Now the concern is the stipulated overall GDP growth rate of 9 per cent and agricultural growth rate of 4.1 per cent during the XI Plan cannot be achieved with the ongoing shrinking and degradation of the country’s natural resources. Interlinked as producers and service providers, the resources must be judiciously conserved, developed and harnessed.
Natural Resources Management for poverty alleviation:
After ‘Nargis
Cyclone ‘Aila’

4
Poverty and Environmental Degradation has a Cause‐and‐Effect Relationship. The thin layer of soil that covers most of the earth’s land surface is the key to human well‐being and survival. Without it, there would be no plants, no crops, no animals, no forests and no people. However, about 40% of the earth’s land surface and more than one billion people are affected by land degradation. Degraded lands are home to the poorest segments of the rural population.
Natural resources (NR) provide fundamental life support, in the form of both consumptive and public‐good services. Ecological processes maintain soil productivity, nutrient recycling, the cleansing of air and water, and climatic cycles. Soils are the foundation of agriculture, which in turn is the basic building block in the livelihoods of all people. At the genetic level, diversity found in natural life‐forms supports the breeding programs necessary to protect and improve cultivated plants and domesticated animals. Wild flora and fauna form the basis of traditional medicine and a significant part of the modern pharmacological industry. In ecologically fragile, marginal environments the poor are often locked into patterns of natural resource degradation by their lack of access to productive resources, institutional services, credit and technology. Without these resources, they are compelled to overstrain already eroding lands in order to survive. The increased pressure on the land – through deforestation, overgrazing and over cultivation – causes a decline in soil fertility and production, and thus aggravates poverty. This circular, cause‐and‐effect relationship between rural poverty and environmental degradation is clear. Unless degradation is to be addressed directly, the sustainability of rural development projects will be undermined and attempts to alleviate rural poverty will be jeopardized. The natural‐resources foundation is coming under increasing pressure from both increasing population and higher levels of per‐capita economic activity. During the period 1990 to 2030 the world’s population is likely to grow by 3.7 billion. Ninety percent of this increase will occur in developing countries. Over the next four decades Sub‐Saharan Africa’s population is expected to rise from 500 million to 1.5 billion, Asia’s from 3.1 billion to 5.1 billion, and Latin America’s from 450 million to 750 million.

5
The distribution of people between rural and urban areas has important implications for the types of stress placed on the environment. In 1990 most people lived in rural areas, but by 2030 the urban population will be twice the size of the rural population. Developing country cities, as a group, are expected to grow by 160 percent over this period, whereas rural populations will grow by only 10 percent. While it is very difficult to forecast how per capita income will change will change in the next 30 years, it is quite clear that the growing population aspires to a higher standard of living. This will often entail an accelerated use of natural resources, both as inputs to the economy, and as recipients of waste. However, the relationship between economic growth and environmental stress is not a linear one, as growth also generates resources to better manage natural resources. Inefficiencies in the utilization of NR often arise because property rights are not complete, exclusive, enforced, and transferable. In addition, defined property rights and opportunities to exploit weaknesses in the assignment of such rights are often skewed. In India land distribution is highly skewed, more than 80 per cent of the farmers are small, marginal and sub‐marginal and together own about 40 per cent of the total cultivated land, and increasing proportions of the holdings are becoming uneconomical. The result is a “smaller pie” than theoretically possible and a “smaller piece of the pie” for the poor. Policymakers’ first order of business should be to: (a) clarify property rights where they do not exist, are obscure, or are in dispute; (b) alter property‐rights distribution in the interest of poverty alleviation; and (c) enforce property rights that are compatible with poverty alleviation.
0
2
4
6
8
1990 2030
Latin America
Asia
SSA

6
The commitment made by world leaders to halve poverty by 2015 1will not be met if we do not address the ‘natural capital’ that shapes the lives and livelihoods of the rural poor.2
History of natural resources management in India
Traditional knowledge is vital for sustainability of natural resources including forests, water, and agro ecosystems across landscape continuum spanning from households through farms, village, commons and wilderness.
The management of natural resources to meet people’s requirements has been practised since the pre‐Vedic era.
Farmers were ranked high in the social system and village management was in their hands. In order to manage land, water and vegetation, technical knowledge suitable to the specific conditions of a region was required. They gained this knowledge and developed skill through experience and learning by doing. Farmers’ traditional knowledge of agriculture includes tested technologies in the field.
In a study in the hills of Garhwal Himalayas, the traditional ways of managing natural resources have been noticed, some of those are as follows:
IRRIGATION
Farmers used to carry water to their fields through small irrigation channels known as gulas. These go from the source of water along the slopes to the fields. In order to avoid seepage losses farmers use pipes. By means of gravitational force they transport irrigation water from its source. In hills it is difficult to construct gulas for all the terraces, and pipes are convenient in transporting water to every field. In order to make judicious use of water, they use a sprinkler system through gravitational force and economical utilisation of water.
In the Garhwal Himalaya farmers use tree trunks as rainwater irrigation channels by taking care of undulating topography and checking seepage losses (Sharma and Sinha 1993).
WATER HARVESTING
1 Millennium Development Goal 2 Lennart Båge, President of IFAD

7
The region of Garhwal comes in the high rainfall area and in the lack of proper management system most of the rainwater goes waste as runoff. Farmers of the hill region have their traditional technology for making small dug‐out ponds to harvest rainwater. They construct such ponds at several places and use the water for survival or for supplemental irrigation. Improvements over the traditional practices are that at the bottom LDPE sheets are placed to check seepage losses. Lined tanks are cost‐intensive and beyond the reach of the farmers.
MANAGEMENT OF DRINKING WATER
Streams are the source of water in the Himalaya. Farmers pay regard to these water resources. They use the water for drinking and make efforts to keep streams clean and unpolluted. They maintain vegetation on the banks to have a clean flow without sediment for human consumption. They do not permit their cattle at the places from which they collect drinking water. They have their own traditional system for the management of drinking water. They do not allow anyone to throw garbage in its current to avoid pollution and infection.
WATER-BASED INDUSTRY
In the hills flour mills are not available. Farmers have their indigenous technology to run flour mill by means of water fall. They use home-made wooden wheels as turbines to run the mills. These mills are locally known as gharat or panchaki. It is a local response to needs of the people without electric or any other complex machine systems.
AGRICULTURE
• They use a special type of traditional plough. Other types of ‘improved’ ploughs do not work in the hills as the soil is gravelly and not deep.
• Under rainfed conditions farmers in hill regions plough their land several times before the onset of rain to conserve water and increase water retention capacity.
• Farmers plough their land straight instead of in circles and open parallel furrows for rainwater harvesting and retaining moisture. However, there is a recommendation to plough the land across the slope to check erosion.
• Farmers of hill regions prefer mixed cropping for minimising risks under rainfed conditions and creating ground cover for checking runoff and soil loss. They grow legumes with maize and ginger or turmeric with maize.
• After sowing ginger, colocasia and turmeric, farmers use paddy straw, wheat straw or leaf litters as mulch to ensure proper germination. • Farmers do not practise weeding and interculturing in the maize crop because of soil conditions and the requirement of fodder in the
rainy season. • Farmers of the Garhwal hills store seeds by selection for different plots with special identification and use them in those particular plots.
8
• In the outer Himalaya farmers were reluctant to grow maize because of wild animals such as bears, wild boars and monkeys. In khadar (lowland) areas they grow paddy and irrigated wheat and in uplands they take rainfed rabi crops.
• In the hills farmers grow mainly mandua, jhingora and guar. Because of recent developments they have been attracted towards off‐
season vegetables, e.g., peas, tomatoes, etc. 3
In real terms, sustainability was ingrained in the thought processes of early Indians as evident from the teachings of Vedas. For example, the Atharva Veda hymn 12.1.11 reads,
‘O Earth! Pleasant be thy hills, snow‐clad mountains and forests, O numerous coloured firms protected earth! On this earth I stand undefeated, unslain, unhurt!
Another hymn from Atharva Veda reads:
“Whatever I dig out from you, O Earth! May that have quick regeneration again; may we not damage thy vital habitat and heart.”4
Status of natural resource in India at present:
Land:
3 Mishra, A.S, Central 4 Kumar, B.M, KAU, Asian Agri‐History, Vol‐2

9
WATER:
Total Cultivated area
Irrigated
Rainfed
Total Geographical Area of India
Non degraded
Degraded
Table 1: Annual requirement of fresh water (b cu m) Under Sector
2000 2025 2050
Irrigation 541 910 1072
Domestic 42 73 102
Industries 8 22 63

10
Water availability at the National level is reaching close to 1700 cubic meter (cu m) per capita – the threshold line, and if things do not improve, it will drop to
water scarcity line by 2025. India annually receives about 350 million hectare meter (m h m) rain water, but almost half of it finds its way back to the sea.
With nearly 60 m ha of net irrigated area and irrigation using over 80 per cent of all fresh water, India ranks first in the world in irrigated acreage. There is huge gap of 14 m ha between irrigation potential created and utilized, and the irrigation intensity is only 135 per cent which should be raised to 175 per cent or more. Besides low water use efficiency, there is high inequity in water use and irrigation development, let alone the fast receding aquifers and blocks after blocks turning “dark” and “grey” in certain parts of the country. 5
5 Working Group on ‘Natural Resources Management’ of Eleventh Plan, Planning Commission
0
500
1000
1500
2000
2500
3000
3500
Per Capita Water Storage in Cubic Meter
India
China
Brazil
Thermal Power 2 15 130
Others 41 72 80
Total 634 1049 1447

11
The following water management strategies and actions are recommended:
Undertake scientific and comprehensive assessment of water resources, monitors and evaluates water extraction, storage and use, and enhances income per unit of water consumed.
Prevent/ discourage unsustainable use of groundwater resources in critical zones, develop the resources in unexploited zones, and increase awareness of farmers and
Air: Although air is not considered conventionally as natural resource. But we have realized that air is also gifted by us by nature. Human activities have polluted air and now polluted air is posing a danger to our life. The following map will show how the air pollution made our lives precarious by posing problem to public health.

12
Forest: Let us first see the area under forest coverage

W
Weg‘vehba
Natural Res
Water Resour
West Bengal coendowed with growth of popu‘excess’ water ivariability of raexpanding with has become anbrunt of siltatioaltered their cou
Recorded
forest19%
Fore
sources Manag
rce in West Be
overs 2.7 per ce7.5 per cent oflation, expansioin the colonial ain within the time in spite of extremely diffon even after thurses appreciab
st cover of
gement in West
engal:
ent of the natiof the water reson of irrigation document, nowState causes tf ever‐increasinicult task for thhe artificial indubly during last tw
Total Geographical area81%
f India
t Bengal
onal territory aource of the conetwork and dew suffers from he twin menacng investment inhe country boatuction of waterwo centuries an
O3
Fo
nd renders homountry and thatevelopmental nacute dearth oces of flood ann water managets that require r from the Farad many of them
De6
Open38%
orest Cover
me to 8 per cent is becoming ieeds. The Bengof water duringnd drought. Boement. The navminimum draftkka Barrage. Thm have been wip
ense2%
r
nt of the Indianncreasingly scagal Delta, which g lean months. oth the flood avigation even in t. The Kolkata phe rivers flowinped out from th
n population. Trce with the unwas described The spatial andnd drought isothe southern tport continues tng through this he map.
13
The State is ncontrolled as areas of d temporal opleths are idal regime to face the State have

W
Trtaa1tutewpt
Water Resource
The Irrigation aresource withinthe surface watavailable grounavailable groun1995, 2002). Gothis is the mostuneven. The ontransfer of watestimated to bewater. The greapaddy in early 1this State.
9
2.7
ArRest of India
e: Availability V
nd Waterways the State in 19ter in this stated water thoughd water as1.76oswami and Bast widely acceptene‐dimensional ter proved futile 30‐40 per centatest foul is be1970s. To realis
97.3%
7%
rea a West Bengal
Vs Requirement
Department (1987. The Experte is estimated th being 1.46 M6 m.ham while su (1992) howeed report on thsupply‐side mae due to evapot only (NCIWRDing played in the this, one mus
8%
PopuRest Of Ind
1987) of the Got committee mato be 13.29 Mhham only is totthe Irrigation Cever, presentede issue. The avanagement of woration and traD, 1999). In fact he agricultural st have a compr
92%
%
ulationdia West Bengal
overnment of Wade a detailed eham, only aboutally utilisable. TCommission of d a more detaileailability of watwater involving ansit losses. Thepresent water csector – the larehensive under
7.5%
WaReso
Rest of India
West Bengal maexploration in thut 40 percent oThe Central GroGovernment ofed account of tter resource witan almost bline water efficiencrisis in West Bergest consumerstanding about
92.5%
ater urces
a West Bengal
de an assessmehe 26 river basiof it is utilisableound Water Bof India put it ahe Water Resothin this State id faith on largency in dam‐canengal is largely r, since the intt the supply‐dem
ent of the availns and stated te. On the otheroard estimated s 2.38 m.ham. urces of West is spatially and e dams and lonnal networks ofdue to misuse oroduction of himand scenario
14
lable water hat though r hand, the the annual (Goswami, Bengal and temporally ng distance f India was or abuse of gh yielding of water in

15
Availability of Water in West Bengal
Surface and Ground water (Mham)
Availability Utilisable
Surface water 13.29 5.31
Ground water 1.46 1.46
Total 14.75 6.77

16
Source: State Irrigation Department
The utilisable surface water (5.31Mham) in this State is less than 40 per cent of the available surface water (13.29 Mham). One major challenge of water management is to reduce this crucial gap. If utilisable water can be enhanced to 60 per cent of the available water by creation of more storage, additional 1.20 Mham of water will be available for our use. The irrigation sector is the largest consumer of water followed by the inland navigation sector. The official projection evinces that demand of water for agriculture would shoot up to 7.71 and 10.98 Mham in the years 2011 and 2025 respectively and those are more than available water for use by all sectors. So creation of additional storage and demand side management are dual challenges of present water management.6
The figure below shows the arsenic contaminated blocks of West Bengal till September, 2006. It indicates that if the demand of water in agriculture cannot be met through surface water and if the laws on groundwater use can not be enforced, the possibilities of groundwater contamination will be more. More groundwater contamination means more health hazard and consequently more spending by the state for public health.
6 Rudra,Kalyan, Status of water resources in West Bengal, gangajal.org.in
0 2 4 6 8 10 12
Demand of Water in Agriculture 2025
2011

17

18
Stakeholders should be made aware about the value and scarcity of water and negative fallouts of improper use and,
Develop and adopt water use efficient cost-effective and eco-friendly crops, cropping patterns, farming systems and technologies.
Integrate rain, surface and ground waters and promote conjunctive use of poor quality and polluted waters.
Institutionalize participatory management of water (Water Users Associations, including proactive women’s participation), rationalize water pricing and operational and maintenance charges and distribution of irrigation water and equitable access to water as a common resource.
What have been done towards NRM? Participatory approach has been promoted through JFM, PIM and PWM etc. for the last 10 to 15 years, but more than 30 per cent of NRM programmes continue to be under top‐down approach even at this stage. Institutionalization of participatory approach has thus not yet taken place on large scale even in programmes where participatory guidelines are used. This has resulted not only in continued over exploitation of the natural resources due to low emphasis on proper management of the resources, but also in non‐inclusive growth and greater inequity.
Post project sustainability continues to be a challenge. This appears to be mainly due to: (i) inadequate delivery mechanism at National, State and District levels, (ii) low capacity building at Community level, (iii) lack of sustainability of CBOs, (iv) low attention towards allocation of users’ right over CPR, (v) lack of payment of genuine contribution by actual users, (vi) delay in fund flow particularly under those programmes which are funded by MoA and (vii) lack of proper modality for carrying out repair and maintenance of CPR, etc.

19
Growing population also warrants food security. For food security XI Plan documents talked about second green revolution. During the first green revolution, rampant use of chemical fertilizer, pesticides, and indiscriminate use of underground water had very bad impact on natural resources. So, during the second greed revolution things are planned in a different manner. Irrigation expansion has been one of the three input‐related driving factors (the other two being seeds of modern HYVs and fertilizer) in the Green Revolution process. Gross irrigated area went up by over 300 per cent, from 22.6 m ha in 1950‐1951 to 57 m ha (gross irrigated area over 75.1 m ha) in 2000‐2001, rendering India as the country having the largest irrigated area in the world. The ultimate irrigation potential for the country has been estimated at about 140 m ha (59 m ha through major and medium irrigation projects, 17 m ha through minor irrigation schemes and 64 m ha through groundwater development). So far, the irrigation potential of nearly 100 m ha has already been created, but only about 86 m ha is being utilized, thus leaving a gap of 14 m ha between created and utilized potential. Following initiatives have already been taken in improving agricultural practices towards eco‐friendly ways,
Long‐term demonstrations on soil test based fertilizer and manure prescriptions for rice to establish the possibility of achieving the targeted yield and maintaining soil fertility are in progress.
Higher grain yields were recorded in the treatments where fertilizer was applied on targeted yield basis compared to the general recommendation.
Integrated nutrient management technologies for pulse and oilseed‐based cropping systems have been developed by conducting field experiments on farmers’ fields.
Mixed bio fertilizer formulations consisting of nitrogen‐fixing organisms and phosphate‐solubilizing bacteria proved superior to individual inoculants.
In Marathwada region, groundnut pod yield was increased by 25% owing to Rhizobium inoculation
7
7 DARE/ICAR Annual Report 2003‐04

S
W
AieWcctw
Success Stories
Watershed M
A micro watershmposed througengaged. TractoWatershed Deveconservation mconservation metimes in the watwas introduced
Cre3
U
Irriga
in effective Nat
Management
hed having an arh participatory aor was used in delopment Fund easures recordeeasures. The opeershed. Croppinin the watersh
eated 1%
Utilised26%
tion poten
tural Resource M
rea of 532 ha inapproach on aradesilting of villa(WDF) ranged fed forage yielden‐grazing was cg intensity and ched which gave
Ultimate Potentia
l43%
ntial
Management:
n villages Bajni aable and non‐arage pond and lafrom 1‐40% in cd of 1.97tonnescontrolled througcrop yields increan average yie
46%
Ultim
Major,m
Minor ir
Ground
and Prakash Nagrable lands. In mand shaping. Thcash. A model os/ha as compargh the introductased from 67% teld of 2 tonnes/
42
12%
mate IrrigatioPotential
medium irrigaiton p
rrigation
water developmen
gar in Datia distrmost of the active contribution mof protected rocred to that of tion of stall‐feedto 105%. To utili/ha. Thus, the w
2%
on
project
nt
rict was selectedvities, labourersmade by the facky wastelands 0.08 tonne/haing which increaze low lying watwaterlogged fie
d. Several treatm of watershed vrmers towards patch of about from catchmeased milk producterlogged fields, lds were put to
20
ments were village were creation of 37 ha with
ent without ction by 2‐3 paddy crop o profitable

21
cultivation of paddy during kharif season which were otherwise kept fallow prior to the project. In addition to this, a revolving fund scheme was also launched to create employment opportunities among the rural unemployed poor by creating 10 Self Help Groups.8
Road ahead: The natural resources are interlinked as producers and service providers to maintain environmental health, augment agriculture production and ensure economic development. One of the major concerns in this endeavour is to rehabilitate the degraded and vulnerable land and water resources suffering from soil erosion, soil acidity, salinity, alkalinity, water logging, water depletion, water pollution etc and to ensure livelihood support to the rural population in the country. Soil and water conservation practices through engineering and vegetative measures need to be more indigenous, innovative and eco‐friendly and those which are maintainable by farming community. The existing soil and water conservation practices to arrest soil erosion and reclamation measures for other soil degradation processes also need to be re‐looked. Soil buffering system and land use policy are also vital components of NRM to attain sustainability that needs to be activated.
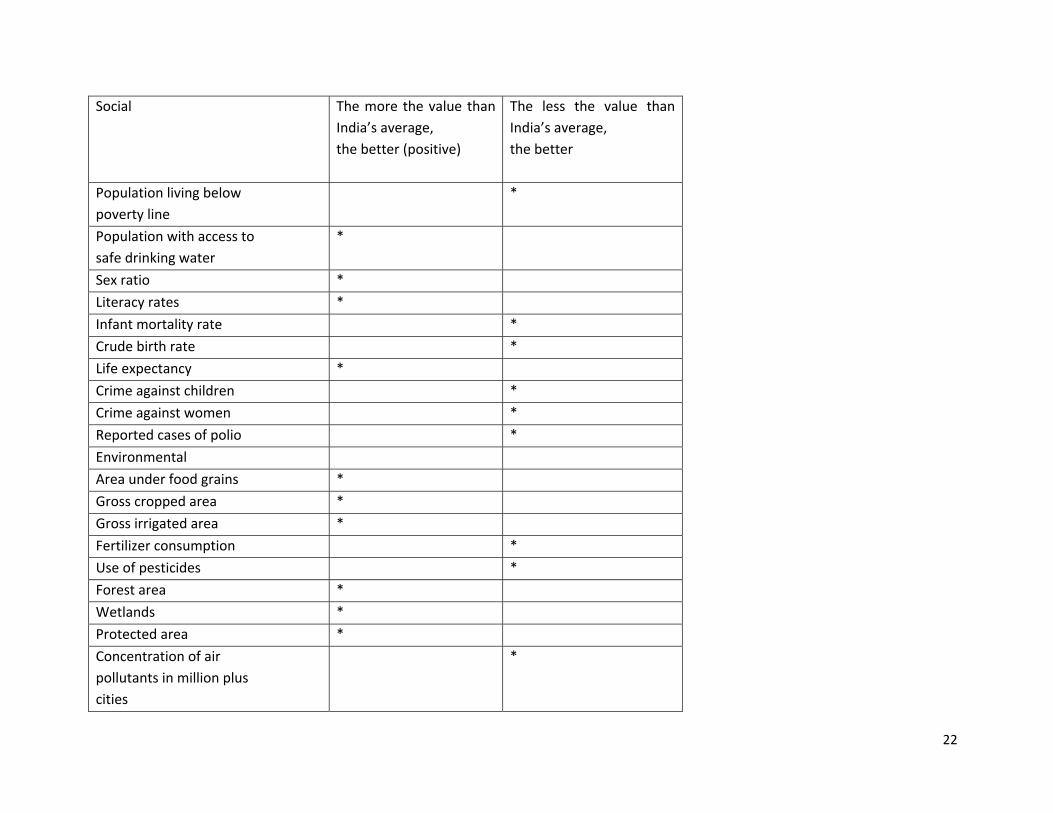
Development activities of most of the countries of the world are getting directions from the Millennium Development Goals (MDGs). Among the eight MDGs, the seventh MDG is ‘Ensuring Sustainable Development’. Other MDGs are concerned with poverty alleviation. Sustainable development is obviously for poverty alleviation. Sustainability is concerned with the development which develops our present without hampering the prospect of development of future generation. To ensure sustainable development natural resources has to be managed with efficiency and utmost care. How to know that my country/ state/ district/ area are in the right direction towards sustainable development? In a study sponsored by Ministry of Statistics and Programme Implementation, Govt. of India, certain indicators have been selected to capture sustainable development.
Indicators and their Status in Sustainability Index
8 DARE/ICAR Annual Report 2003‐04
22
Social
The more the value than India’s average, the better (positive)
The less the value than India’s average, the better
Population living below poverty line
*
Population with access to safe drinking water
*
Sex ratio *
Literacy rates *
Infant mortality rate *
Crude birth rate *
Life expectancy *
Crime against children *
Crime against women *
Reported cases of polio *
Environmental
Area under food grains *
Gross cropped area *
Gross irrigated area *
Fertilizer consumption *
Use of pesticides *
Forest area *
Wetlands *
Protected area *
Concentration of air pollutants in million plus cities
*

23
Reported cases of asthma *
Reported cases of malaria *
Reported cases of Diarrhoea
*
Reported cases of dengue *
Reported cases of whooping cough
*
Economic
GDP *
Fiscal deficit *
Consumption of Electricity
*
Investments (Industry, agriculture, education)
* 9
The United Nations has designated 2008 as the International Year of Planet Earth and is celebrating it during the Triennium 2007‐2009. Subtitled as Earth Science for Society, its science programme has ten themes: Groundwater – reservoir for a thirsty planet; Hazards – minimizing risks, maximizing awareness; Earth and Health – building a safer environment; Climate Change – the stone tape; Resources – towards sustainable use; Megacities – our global urban future; Deep Earth – from crust to core; Ocean – abyss of time; Soil – Earth’s living skin; and Earth and Life – origins of diversity. These themes show a strong focus on addressing societal needs and mustering science and technology to efficiently harness the natural resources and to protect the environment in a sustainable manner.
Proposed Strategies and Interventions for NRM in the XI Plan:
9 Jayashree Roy et al, JU, MoSPI, GOI

24
The “business as usual” will not do. NRM, particularly through the watershed approach, needs major adjustments and shifts in the strategies and approaches. The programme should be divided into three components: � Comprehensive integrated development of multiple natural resources on watershed basis; � Situation specific and need‐based development of individual resources (out side the watersheds); and � Integrated crop‐livestock‐fish‐biomass farming system based management of natural resources, especially in rainfed areas (inside and outside the watershed programmes). A differentiated and need‐based approach with substantial investment in natural resource management both in irrigated and rainfed areas in watershed as well as beyond watershed programmes is called for. The following programmatic interventions are suggested separately for each component: Comprehensive management of natural resources The major steps are: � Delineation, codification and prioritization of sub‐watersheds for the preparation of perspective plan at the State level. � Separation of capacity building phase from main implementation phase. � Consideration of sub‐watershed as a geo‐hydrological unit at Programme Implementing Agency level and revenue village as a management unit at Watershed Committee level. � Gram Panchayat to play governance role while stakeholders groups (UG / SHG etc.) should carry out execution of their own works and be accountable to Gram Sabha. Panchayatas should help to create durable assets in watersheds by linking the programme with NREGS. � Preparation of State specific process guidelines to build upon their strengths and experiences.

25
� Integration of small size forest areas under watershed programmes through CFM in place of JFM as being successfully practiced in Andhra Pradesh. � Enhancement in project duration from 5 to 10 years for adoption of comprehensive approach. � Organisation of CBOs into sustainable bodies as a pre‐project activity through complementary funding. Location specific management of natural resources The following need‐based treatments, outside of watersheds, are priority actions: � Reclamation of problem soils (saline, alkaline, acidic etc.); greater attention is called for acidic soils as the acidification is spreading fast. � Comprehensive development of degraded lands assigned to resource poor families under land distribution programmes. � Development of common land with revenue department through adequate investment. � Revival of small size indigenous water harvesting structures. � Investment on community borewells to retain ground water as a common property resource. Farming systems based management of natural resources Keeping in mind the above paragraphs 22 to 26, the following steps are essential: � Development of farming systems through new paradigm consisting of (i) Sustainable management of natural resources through social regulations, (ii) Diversification of farming systems, (iii) Major emphasis on improving soil health and use of inputs based on internal raw materials, (iv) emphasis on protective irrigation, (v) Extension system managed by CBOs, (vi) Financial support through revolving funds and (vii) Adequate facilitation through experienced resource organizations. � Convergence of different production related programmes, namely, agriculture, horticulture, livestock, fisheries etc as per the new paradigm.
26
� Labour incentives for preparation of organic inputs from internal raw materials (to cut down the costs as being done for chemical inputs from external raw materials). Special attention should be paid towards inclusiveness and gender mainstreaming within the context of natural resource management. For this purpose, the following specific steps may be taken: (i) introducing special package for the communities which received land through distribution of surplus land, (ii) cultivation of fallow land for food crops through women SHGs, (iii) increased emphasis on tribal dominated forest based economy, (iv) resolving legal complications in treating CPR, (v) provision of drinking water to all households, (vi) equitable distribution of harvested water for irrigation and other livelihoods, (vii) provision of additional fund as seed money to women SHGs for development of livelihoods of only resource poor families, and (viii) equitable distribution of the additional resource that has been created in the watershed, even as prior right to previously existing resources are recognized and left largely undisturbed within a positive sum game framework. 10
Government of India has also announced various programmes to cope up with the evil impact of climate change. On June 30, 2008, Prime Minister of India Dr. Manmohan Singh released India’s first National Action Plan on Climate Change (NAPCC) outlining existing and future policies and programmes addressing climate mitigation and adaptation. The plan identifies the following eight core “national missions” running through 2017.
1) National Solar Mission: The NAPCC aims to promote the development and use of solar energy for power generation and other uses with the ultimate objective of making solar competitive with fossil‐ based energy options.
2) National Mission for Enhanced Energy Efficiency: Current initiatives are expected to yield savings of 10,000 MW by 2012. Building on the Energy Conservation Act 2001, the plan recommends:
• Mandating specific energy consumption decreases in large energy consuming industries, with a system for companies to trade energy‐ savings certificates;
• Energy incentives, including reduced taxes on energy‐efficient appliances; and
• Financing for public‐ private partnerships to reduce energy consumption through demand –side management programmes in the municipal buildings and agricultural sectors.
3) National Mission on Sustainable Habitat: To promote energy efficiency as a core component of urban planning, the plan calls for:
10 Working Group on ‘Natural Resources Management’ of Eleventh Plan, Planning Commission

27
• Extending the existing Energy Conservation Building Code;
• A grater emphasis on urban waste management and recycling, including power production from waste;
• Strengthening the enforcement of automotive fuel economy standards and using pricing measures to encourage the purchase of efficient vehicles; and
• Incentives for the use of public transportation. 4) National Water Mission: With water scarcity projected to worsen as a result of climate change, the plan sets a goal of a 20%
improvement in water use efficiency through pricing and other measures. 5) National Mission for Sustaining the Himalayan Ecosystem: The plan aims to conserve biodiversity, forest cover, and other ecological
values in the Himalayan region, where glaciers that are a major source of India’s water supply are projected to recede as a result of global warming.
6) National Mission for a “Green India”: Goals include the afforestation of 6 million hectares of degraded forest lands and expanding forest cover from 23% to 33% of India’s territory.
7) National Mission for Sustainable Agriculture: The plan aims to support climate adaptation in agriculture through the development of climate‐resilient crops, expansion of weather insurance mechanisms, and agricultural practices.
8) National Mission on Strategic Knowledge for Climate Change: To gain a better understanding of climate science, impacts and challenges, the plan envisions a new Climate Science Research Fund, improved climate modelling and increased international collaboration. It also encourages private sector initiatives to develop adaptation and mitigation technologies through venture capital funds.11
Policy formulation for natural resource management strategies should consider risk assessment, risk management strategies. The local level initiatives should be backed up by national and sub‐national plans.
The physical infrastructural support is not sufficient but the social factors are also to be taken care of. The social safety nets are also to be strengthened to support people who are vulnerable in the face of effects of degradation of natural resources.
Other Government interventions towards NRM:
i. Watershed development programme of various ministries and agencies
11 Summary, (India’s National Action Plan on Climate Change)

28
ii. Soil management through proper use of iii. Regulation of water uses by acts ,e.g. ‘The West Bengal Groundwater Resources(Management Control and Regulation) Act
2005’ iv. National Biodiversity Board and Plant Variety Protection and Farmer’s Rights Authority‐ Participatory breeding, integrated
germplasm and indigenous knowledge conservation and benefit sharing, particularly involving women and tribals, should be promoted through transparent modes of accessing the National Gene Fund and increasing gene and IPR literacy. Establishment of living heritage of livestock germplasm (mostly at State Farms), village gene banks, offshore quarantine centres for germplasm screening against serious diseases and pests and maintenance and trade of pedigreed animals and elite medicinal and aromatic plant landraces – for maintaining biodiversity
v. Popularisation of System Rice Intensification (SRI)
vi. The package of measures include comprehensive soil health improvement, conservation, harvesting and efficient use of water, integrated farming system with multi purpose biomass production and utilization, including trees, rainfed fodder, livestock and fishery, and should support protective irrigation to stabilize rainfed crops and farming systems, collective utilities like seed bank, grain bank, biomass shredders, fodder bank, procurement and collective marketing, and differentiated flow of credit, insurance and other risk‐proofing mechanism
vii. integrated crop‐livestock‐fish‐biomass farming system approach
viii. Dovetailing forest management with watershed development through CFM.
ix. Educating the village farmers towards natural resource management through use of Village Knowledge Centres. This list is indicative and not exhaustive. Let us have a look into Watershed Development Programme in brief. Na onal Watershed Development Programme The Department of Land Resources in the Ministry of Rural Development is administering three area‐based watershed programmes for development of wastelands/degraded lands namely Drought Prone Areas Programmes (DPAP), Desert

29
Development Programme (DDP) and Integrated Wastelands Development Programme (IWDP) to check the diminishing produc vity of wasteland and loss of natural resources. The DPAP was launched in 1973‐74 to tackle the special problems faced by those areas that are constantly afflicted by drought condi ons. Presently, 972 blocks of 195 districts in 16 States are covered under the Programme. DDP was launched in 1977‐78 to mi gate the adverse effects of deser fica on. Presently, 235 blocks of 40 districts in 7 States are covered under the Programme. IWDP has been under implementa on since 1989‐90. The projects under the IWDP are generally sanc oned in areas that are not covered under DDP or DPAP. Since 1 April 1995, these three programmes are being implemented on the basis of Common Guidelines for Watershed Development. Details of projects sanc oned and funds released from 1995‐96 to 2007‐2008 are as under: Name of Scheme No. of Projects Sanctioned Area Covered (in Lakh Ha) Total funds released by Centre (Rs. in crores)DPAP 27439 130.20 2837.81
DDP 15746 78.73 2103.23
IWDP 1877 107.0 2797.56
Grand Total 45062 322.93 7738.60
The projects under DPAP and DDP are sanc oned for 500 ha. each while the IWDP projects cover an area of 5000‐6000 ha. The cost norms for all the three schemes have been revised to Rs.6000 per ha. Under DPAP and DDP, it is shared between the Centre and the States in ra o of 75:25. In case of IWDP, the cost sharing between the Centre and State Governments is in the ra o of 11:1.

30
Funds are released in seven installments, six installments at the rate of 15 per cent and the last installment at the rate of 10 per cent. The first installment is released along with the ini al sanc on‐order and subsequent installments on receipt of u liza on for 50 per cent of the available funds as well as the following documents:
• Quarterly Progress Reports • U lisa on Cer ficates • The Audited Statement of Accounts for the previous years and • Evidence of sa sfactory comple on of ins tu onal arrangements
Projects are implemented by District Rural Development Agencies/Zilla Parishads (DRDAs/ZPs) through Project Implemen ng Agencies (PIAs). PIAs could be a Line Department (of the State Government), Panchaya Raj Ins tu ons or a reputed NGO. One PIA normally handles 10‐12 watershed projects covering an area of about 5000‐6000 hectares. The PIA is required to maintain a technical team of 4 experts called Watershed Development Team (WDT) and individual projects (500 hectares) are planned and executed by the local people living in the watershed area called the Watershed Associa on (WA) through an elected body called Watershed Commi ee (WC). The Department of Land Resources has brought out a new ini a ve called Hariyali with an objec ve of empowering PRIs both financially and administra vely in implementa on of Watershed Development Programmes. Under this ini a ve, all ongoing area development programmes namely, Integrated Wastelands Development Programme (IWDP), Drought Prone Areas Programme (DPAP) and Desert Development Programme (DDP) are to be implemented through the PRIs. New projects under the aforesaid area development programmes are being implemented in accordance with the guidelines for Hariyali from 1 April 2003. Projects sanc oned prior to this date shall con nue to be implemented as per the Watershed Development Guidelines of 2001. In the new arrangement, Gram Panchayats shall implement projects under overall supervision and guidance of Project Implementa on Agencies (PIAs). An intermediate panchayat may be the PIA for all the projects sanc oned to a par cular Block/Taluka. In case, these Panchayats are not adequately empowered, then the Zilla Panchayat can either act as PIA itself or may appoint a suitable Line Department like Agriculture, Forestry /Social Forestry, Soil Conserva on, etc., or an Agency of the State Government/ University/Ins tute as PIA. Failing these op ons, the ZP/DRDA may consider appoin ng a reputed Non‐Government Organiza on (NGO) in the district with adequate experience and exper se in the implementa on of watershed projects or related area development works as the PIA a er thoroughly examining their creden als.

31
The Project Implemen ng Agency (PIA) will provide necessary technical guidance to the Gram Panchayat for prepara on of development plans for the watershed through Par cipatory Rural Appraisal (PRA) exercise, undertake community organisa on and training for the village communi es, supervise watershed development ac vi es, inspect and authen cate project accounts. Source: Na onal Portal Content Management Team, Reviewed on: 07‐01‐2011 Now, let us have a quick glance on the status of Watershed Development Programme in West Bengal. The following tables may guide us to have an idea of physical as well as financial achievement on different components of the programme. It may be mentioned that some of the districts have the need of execution of various components of Watershed Development Programme.
STATUS OF DPAP (Hariyali) PROGRAMME AS ON 30.9.2011
Sl.No. District Batch No.
No. of
MWS
Sanctioned cost (In Lakh Rs.)
Fund received (in lakh
Rs.)
Expenditure in Lakh Rs. (Upto 30.9.2011) Area treated (in ha.)
1 Purulia
Hariyali-I
40 1200
533 458.96
6025.33
Hariyali-II
40 1200
537.63 489.33
7389.44
Hariyali-III
44 1320
590.75 472.34
6722.97
Hariyali-IV
44 1320
198 165.88 2408.94
Total 168 5040 1859.38 1586.51 22546.68 2 Bankura Hariyali- 14 420 185 180.834 2769.00

32
I Hariyali-
II 14
420 63
61.8 909.00 Hariyali-
III 15
450 201.7
174.87 2515.00 Hariyali-
IV 15
450 67.5
58.69 882.00 Total 58 1740 517 476.194 7075.00
3 Paschim Medinipur
Hariyali-I
14 420
63 58.55 400
Hariyali-II 14 420
63 39.350 135
Hariyali-III
16 480
72 26.430 0
Hariyali-IV
16 480
72 4.94 0
Total 60 1800 270 129.27 535
4 Birbhum
Hariyali-I
4 120
54 48.72 759.00
Hariyali-II
4 120
18 18.1 253.00
Hariyali-III
5 150
22.5 22 349.00
Hariyali-IV
5 150
22.5 21.43 333.00
Total 18 540 117 110.25 1694.00 Grand Total
304 9120 2763 2302.224 31850.68

33
STATUS OF IWDP AS ON 30.9.2011
District Block
Area Project Cost
Year of sanction
Release of fund Expr. Area treated
(in ha.) (in lakh Rs.) (in lakh Rs.) (in lakh Rs.) (in ha)
(upto30.9.2011)
Center State Total
Burdwan
Bardhaman(under revised Guidelines),
Kanksa Block 5460 327.6 2001-02 295.51 27.3 322.81 318.36 5305.93
Bardhaman(Project-II), Durgapur-Faridpur 8700 522 2004=05 349.67 32.56 382.23 357.28 5870.48
Bardhaman(Project-III), Ausgram-II Block 520 31.2 2004=05 21.05 1.98 23.03 24.82 411.00
Bardhaman (Project IV) Ausgram-I Block 5613.69 336.82 2005-06 225.83 21.05 246.88 218.90 3574.41
Bardhaman(Project-V),Durgapur-
Faridpur 3168.2 190.09 2005-06 77.038 7.13 84.168 70.98 1172.44

34
Bardhaman(project-VI) Andal Block 3888.5 233.31 2006-07 32.08 2.92 35 11.06 0.00
Bardhaman (Pro.VII) Kanksa Block 5167 310.02 2006-07 252.94 23.25 276.19 253.29 4190.43
Bardhaman (Project-VIII) Ausgram-I Block 4175 250.5 2006-07 169.9 15.65 185.55 126.14 2101.01
Birbhum
Birbhum(Project-I), Rampurhat-I Block 5000 300 2003-04 122.18 11.25 133.43 133.51 2272.00
Birbhum (Project 11) Khoyrasole Block 5000 300 2006-07 123.03 11.25 134.28 130.88 2137.00
Birbhum (project III) Md. Bazar Block 5000 300 2005-06 123.55 11.25 134.8 126.67 2110.00
Birbhum (Project IV)Khoyrasole Block 5000 300 2005-06 41.25 3.75 45 45.4 840.00
Birbhum (Project V) Md. Bazar Block 5000 300 2005-06 123.28 11.24 134.52 118.32 1745.00
Birbhum (Project VI) Nalhati-I Block 7086.56 425.19 2006-07 170.46 15.95 186.41 66.7 1017
Birbhum(Project VII) Khoyrasole Block 5000 300 2006-07 123.72 11.24 134.96 130.16 1986.00
Birbhum (Project VIII) Khoyrasole Block 6870 412 2006-07 56.67 5.15 61.82 53.73 1048.00
6524 391.5 2006-07 161.04 14.68 175.72 143.99 2047.00 Md. Bazar –(Project-IX)
Birbhum (Project X) Md. Bazar Block 5000 300 2006-07 41.25 3.75 45 46.39 551.37
Birbhum (Project XI) Md. Bazar Block 5000 300 2006-07 123.75 11.25 135 100.53 1489.00

35
Source: P&RD Department, Government of West Bengal
Paschim Medinipur
West Medinipur(Project-I)
5000 300 2003-04 123.75 11.25 135 126.23 1050.00 Garbeta-I/Garbeta-III/Keshiary Blocks
West Medinipur(Project-II) Garbeta-II Block 978 58.69 2005-06 24.166 2.197 26.363 22.50 107
West Medinipur(Project-III) Garbeta-II Block 1184 71.04 2005-06 29.31 2.66 31.97 12.50 187
West Medinipur Project-IV 876 52.54 2005-06 21.66 1.97 23.63 13.20 113
Garbeta-II Block
West Medinipur (Project-V) Garbeta-II Block 559 33.52 2005-06 13.82 1.26 15.08 8.60 117
West Medinipur (Project-VI) 1035 62.09 2005-06 25.59 2.33 27.92 16.20 126
Garbeta-II Block
Bankura
Bankura(Project-III) Bankura-II Block 2400 144 2004-05 59.05 5.4 64.45 53.60 790.00
Bankura(Project-IV) Khatra Block 2200 132 2004-05 89.47 8.25 97.72 52.97 787.00
Bankura(Project-V) Raipur Block 2640 158.4 2005-06 64.73 3.96 68.69 58.04 831.00
Bankura(Project-VI)Taldangra Block 4000 240 2005-06 163.17 15 178.17 102.02 1450.00
Total 118046 7082.71 3248.914 296.877 3545.79 2942.959 45426.07

36
Learner’s assignment:
1) What are the programmes running in the district having components of natural resource management? 2) Name the agencies that are responsible for implementation of the programmes. 3) If you are posted in a district where a watershed development programme is ongoing, please visit the programme.
Observe the implementation part and assess whether the programme is in the right path in achieving the objective/s. 4) If you are not posted in such district, then please choose any other programme on natural resource management and
go through the aims and objectives of the programme. Observe the implementation part and assess whether the programme is in the right path in achieving the objective/s.
5) Write down at least one of the best practices on natural resources management observed in your district. Here ‘district’ means the district where you are posted for your district training.

37
ABBREVIATIONS:
Sr. No. Abbreviations Full form1) CBO Community Based Organisation 2) CFM Community Forest Management 3) CPR Common Property Resource 4) GDP Gross Domestic Product 5) HYV High Yielding Variety 6) IFAD International Fund for Agricultural Development 7) JFM Joint Forest Management 8) MOA Ministry of Agriculture 9) NCIWRD National Commission on Integrated Water Resources
Development 10) NREGS National Rural Employment Guarantee Scheme 11) PIM Participatory Irrigation Management 12) P&RD Panchayat & Rural Development 13) PWM Participatory Watershed Management 14) SHG Self Help Group 15) SSA Sub-Saharan Africa 16) UG User’s Group
The write up is prepared by Ms.Gargi Ghosh, WBCS (Exe), Associate Professor, Natural Disaster Management, ATI, Kolkata.