Embed Size (px)
Citation preview

March 13, 2014
Natural Resources
Commission Meeting
NRC Policy Committee on
Wildlife & Fisheries

Proposed Orders
• NRC – For Information
– Field Dog Trials at Allegan State Game Area
(WCO Amendment No. 3 of 2014)
– Bear License Quotas (WCO Amendment
No. 4 of 2014)
– Elk Regulations and License Quotas (WCO
Amendment No. 5 0f 2014)

NRC Policy Committee on
Wildlife and Fisheries
• Fisheries Division Update
• Wildlife Division Update
• Elk Regulations and Quotas
• Bear Hunting; Red Oak License Quota
• Bovine TB Disease Surveillance Report
• Surveys to measure support for antler-point restrictions in two areas in the Lower Peninsula
• 2012 Deer Hunter Opinion Survey

Department of Natural Resources
Fisheries Division Update
Jim Dexter, Chief
Fisheries Division
March 13, 2014

Fisheries Update
• Conversations and Coffee
– 11 meetings
– Regulation proposals
• B.A.S.S. Angler of the Year Tournament
– Bays de Noc
• Upcoming Fishery Advisory meetings

Department of Natural Resources
Any Questions?
Thank You!

Wildlife Division Update
Russ Mason, Chief
Wildlife Division
March 13, 2014
Field Dog Trials at Allegan SGA
• Audit findings:
– Conflicts with intended grant purposes habitat
management and wildlife restoration
– Mows trails, cuts wood, and trims brush or
trees, adverse impact on nesting wildlife
• Allegan SGA:
– Cease managing land for field dog trials
– Remove field dog trial designation
– Remove from field dog trial
permitting process

Wildlife Habitat Grant Program
• Purpose: Provide funding to local, state, federal, and
tribal units of government, profit or non-profit groups,
and individuals to assist WLD with developing or
improving game species habitat
• Available Grant Funds FY2014: ~$650,000
– Projects can occur on public or private lands
– 44 applications received that met March 1 deadline
– A total of $1,950,000 has been requested
– Awards are expected to be announced by the Director on
April 1, 2014
– The FY2015 RFP will come out this summer for
projects that will take place Oct. 1, 2014 -
Sept. 30, 2015

Events & Feedback
• Waterfowl USA
• Blue Water MDHA Banquet
• UPBHA Banquet
• Camp Liberty
• Ducks Unlimited
• Pheasants Forever
• And more!
Positive feedback and
great encouragement!

Thank You
www.michigan.gov/wildlife

Elk Regulations
Brent Rudolph, Deer and Elk Program Leader
Wildlife Division
March 13, 2014

Michigan Elk Population Status
• Objective: 500–900 elk
• Winter survey 2014:
668 elk (range: 443-891),
low calf:cow
• Elk outside core:
potential bTB crossover and
agricultural damage
– Conflict reduction: DNR-initiated contacts,
increasing hunting access

2014 & 2015 Proposed
License Quotas
• 100 licenses (100 less
than 2013)
• Expected harvest: 85
(plus tribal take and Pure
Michigan Hunt)
• Expect stable or potential
population reduction over
2014 and 2015 seasons

Season Dates and License Quotas
Unit Any Elk Antlerless
L 15 35
Hunt Period 1
Aug. 26 - 29, 2014 Aug. 25 - 28, 2015
Sept. 12 - 15, 2014 Sept. 11- 14, 2015
Sept. 26 - 29, 2014 Sept. 25 - 28, 2015
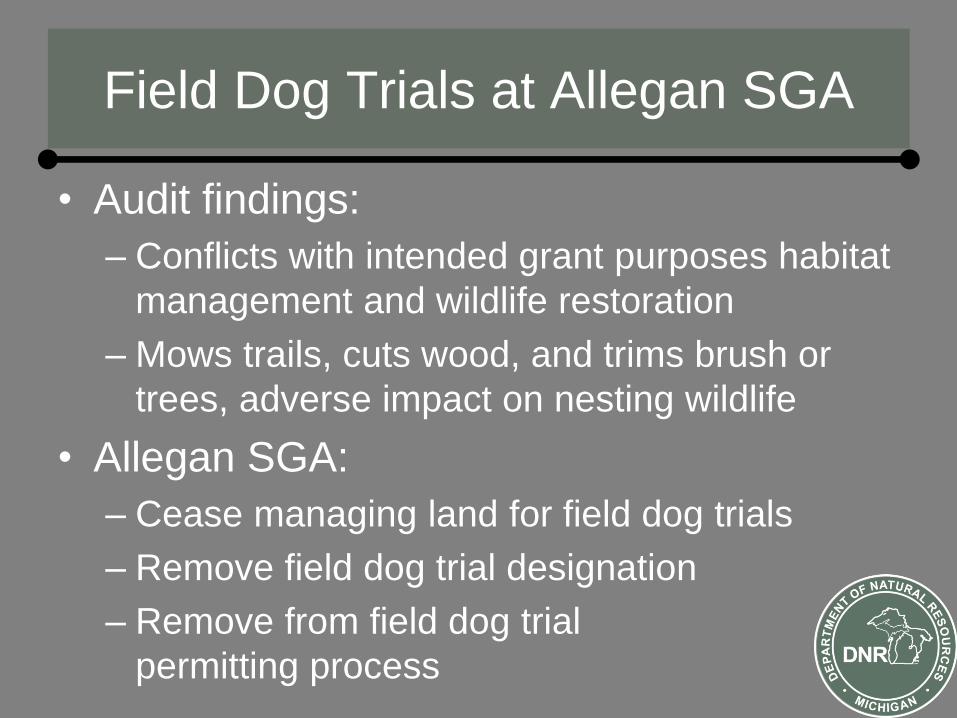
Season Dates and License Quotas
Unit Any Elk Antlerless
F 5 15
G 10 20
Total 15 35
Hunt Period 2
Dec. 6 - 14, 2014 Dec. 5 - 13, 2015

Season Dates and License Quotas
• OPTIONAL Hunt Period 3
– January 14 – 18, 2015
– January 13 – 17, 2016
• Maximum licenses: 40

Tribal Licenses
• The 2007 Inland Consent Decree
authorizes the five 1836 Treaty Tribes to
issue licenses equal to 10% of state
issued elk licenses, rounded up.

Thank You
www.michigan.gov/elk

2013 Bear Harvest Update
Adam Bump, Bear and Furbearer Specialist
Wildlife Division
March 13, 2014

2012 and 2013 Bear Season
Summary
• Approved Goals
– West UP- Maintain 2012 population
– East UP- Maintain 2012 population
– NLP- Allow population to decline about 10%
from 2012 levels before stabilizing
• No changes were recommended for 2013
– “Pre-approved” drop from 835 to 750 licenses
in Red Oak BMU

2013 Registration Results State
Licensed Hunter Harvest
HUNT NAME 2012
REGISTRATION
2013
REGISTRATION
LICENSE
QUOTA
LICENSE
SUCCESS %
Bergland 1st 63 58 165 35
Bergland 2nd 74 93 370 25
Bergland 3rd 76 91 730 12
Baraga 1st 82 77 255 30
Baraga 2nd 96 96 470 20
Baraga 3rd 77 110 895 12
Amasa 1st 57 52 100 52
Amasa 2nd 53 55 150 37
Amasa 3rd 47 66 255 26
West UP Total 625 698 3390 21

2013 Registration Results
State Licensed Hunter Harvest
HUNT NAME 2012
REGISTRATION
2013
REGISTRATION
LICENSE
QUOTA
LICENSE
SUCCESS %
Carney 1st 36 37 115 32
Carney 2nd 57 39 225 17
Carney 3rd 45 26 475 5
Gwinn 1st 68 49 200 25
Gwinn 2nd 70 71 290 24
Gwinn 3rd 77 57 760 8
Newberry 1st 120 83 270 31
Newberry 2nd 128 92 360 26
Newberry 3rd 115 136 890 15
East UP 716 590 3585 16

2013 Registration Results
State Licensed Hunter Harvest
HUNT NAME 2012
REGISTRATION
2013
REGISTRATION
LICENSE
QUOTA
LICENSE
SUCCESS %
Drummond Island 1 1 1 100
Red Oak 256 216 750 29
Baldwin 31 43 70 61
Gladwin 17 13 110 12
NLP 304 272 930 29
Statewide Total 1646 1561 7906 20

2012-2013 Comparison
• 10% reduction in Red Oak licenses
• Statewide success rate declined from 21%
to 20%
• Statewide harvest 5% lower (85 bears)
• ~14% above state desired harvest (1,375)

West UP Eco-Region
0
500
1000
1500
2000
2500
3000
3500
4000
2010 2011 2012 2013 2014 2015
Yr+
Ad
t B
ears
Year
Simulation model results for WUP Yr + Adt bear population 2010-2015
2012 Desired Population Trend
Population Trend with Actual 2012 Harvest
Population Trend with Actual 2013 Harvest

East UP Eco-Region
0
500
1000
1500
2000
2500
3000
3500
4000
4500
2010 2011 2012 2013 2014 2015
Yr+
Ad
t B
ears
Year
Simulation model results for the EUP Yr + Adt bear population 2010-2015
Desired 2012 Population Trend
Population trend with actual 2012 and 2013 harvests

NLP Eco-Region
0
200
400
600
800
1000
1200
1400
1600
2009 2010 2011 2012 2013 2014 2015
Yr+
Ad
t b
ears
Year
Simulation model results for NLP Yr + Adt bear population 2009-2015
Population Trend with Actual 2012 harvest
2012 Desired Population Trend
Population Trend with Actual 2013 harvest

NLP Hunter Effort per Kill

NLP Success Rates (1992-2013)
0
10
20
30
40
50
60
70
% S
uccess
Year
Bear Hunting Success Rates in The Northern Lower Peninsula
Baldwin
Gladwin
Red Oak
NLP Total

NLP Satisfaction Rates
(1992-2013)
0
10
20
30
40
50
60
2009 2010 2011 2012% H
un
ters
Resp
on
din
g "
Very
Go
od
"
or
"G
oo
d"
Year
Hunter Satisfaction in the NLP
Satisfaction # of bears seen
Satisfaction opportunities to take
Satisfaction overall experience

0
10
20
30
40
50
60
2009 2010 2011 2012
% o
f H
un
ters
Resp
on
din
g "
Very
g
oo
d" o
r "G
oo
d"
Year
Hunter Satisfaction Red Oak BMU
Satisfaction # of bears seen Satisfaction opportunities to take
Satisfaction overall experience
NLP Success Rates (1992-2013)
New Information for 2015
• New genetic mark-recapture estimate
expected in late 2014
• Anticipate statistical reconstruction
estimator by late 2014
• Both will help inform discussions for NLP

External Engagement
• 2007 Inland Consent Decree
– 1836 Treaty Tribes allocation
• Stakeholder Perceptions

2014 Bear Season
Recommendations
• No changes to licenses from 2013
– Exception: reduce Red Oak licenses from
750 to 675 licenses
• Part of a long-term strategy implemented in 2012

Looking Forward
• Bear regulations up for review in 2015
– Discuss and reset eco-regional population
trend goals
– Recommend new license quotas based on
new trend goals and 3-year average success
rates
– Evaluate some potential regulation changes

Looking Forward (Potential Discussion Items)
Regulatory
• Population issues (set eco-
regional trend goals/license quotas – MBHA/MHDF/UPBHA- increase
bear population
– Concern of level of harvest
• Guiding regulations – Eliminate guiding
– Develop way to spread guiding
activity out- mitigate impacts of
hunter density
– Look at making the placement of
commercial bear bait on CF lands
illegal in WCO
– Require guides to label baits and
stands (guide liable for violations of
use, not client)
• Baiting
– Bait permits (pay fee to bait,
mandatory tagging of bait sites)
all types of bait, charge fee for id
for bait permits
– Start of legal baiting
• Move to July 1
• August 1
• Don’t change start of baiting
period
– Restrict/regulate the placement
of bait not just use of bait
– Require name/address on baits

Looking Forward (Potential Discussion Items)
• Youth/apprentice hunters- harvest on
all land not just private land
• Transfer of tag liberalized- easier to
transfer to youth/senior citizen
• Bait/hound regulations
– Alternate opening of bear season
to allow hound and bait hunters
to be first on alternate years
– Address conflict between bait
and hound hunters (several
potential solutions proposed)
• Require hound hunters to possess a
valid kill tag for the mgmt. unit in
which they are hunting/training
• Evaluate BMU boundaries in at least
the NLP
• Allow residents over “x” age to
purchase a license with no
preference points
• Start NLP season on Sept. 10
• There is an issue with sealing and
processors/taxidermists. We need to
clarify or change regulations
pertaining to when (and what) needs
to be sealed.
• Set standard date for having ground
blinds and tree stands in woods- all
species
Regulatory

Looking Forward (Potential Discussion Items)
• Access to commercial forest lands for
hunting/trapping (same for state lands)
• Access/road closures CF public
• Address recreational feeding of bears
• Legislation to control and limit commercial
baiting
• Statutory

Thank You
www.michigan.gov/dnr

Dave Richey: Detroit Free Press
2013 Bovine TB Surveillance
Dr. Steve Schmitt
Dr. Dan O’Brien
Wildlife Health Section Michigan Department of Natural Resources

M. Bovis in free-ranging WTD
• TB not native to N. American
wildlife; introduced by cattle
• Rare, sporadic in wild deer
• Eight previous occurrences
prior to the current outbreak
• Michigan is the first recorded
self-sustaining North American
outbreak in wild deer

Year Positive Total Deer Tested
1975 & 1994 2 2
1995 18 403
1996 56 4,966
1997 73 3,720
1998 78 9,057
1999 58 19,499
2000 53 25,855
2001 61 24,278
2002 51 18,100
2003 32 17,307
2004 28 15,131
2005 16 7,364
2006 41 7,914
2007 27 8,316
2008 37 16,309
2009 31 5,723
2010 24 4,974
2011 17 6,026
2012 23 4,721
2013 21 5,868
2014 0 11
Grand Total 747 205,544
Michigan White-tailed Deer
Surveillance

Bovine Tuberculosis Surveillance Areas
5 County Bovine TB Area: 725 Alcona
Alpena
Montmorency
Oscoda
Presque Isle

Surrounding Tier of Counties: 16
Cheboygan
Crawford
Iosco
Ogemaw
Otsego
Roscommon
Bovine Tuberculosis Surveillance Areas

Other areas: 6
Antrim
Emmet (2)
Mecosta
Osceola
Shiawassee
Bovine Tuberculosis Surveillance Areas


• Enhanced surveillance to detect TB in
the deer herd in the Saginaw Area.


Bovine TB Eradication Strategies
Strategy 1
• Keep deer from concentrating by eliminating supplemental feeding and baiting
Strategy 2
• Reduce deer numbers through hunting to a level supported by the natural vegetation.

PR
ES
QU
E IS
LE
MO
NT
MO
RE
NC
Y
OS
CO
DA
AL
PE
NA
AL
CO
NA
DMU 452
* Extrapolated from head-only apparent prevalence; Mandatory head testing.
Year Inside
DMU452
5-County
Outside
DMU452
1995 4.9% (no testing)
1996 2.5% 0.2%
1997 4.7% 0.4%
1998 2.7% 0.3%
1999 2.4% 0.2%
2000 2.5% 0.4%
2001 2.3%* 0.5%
2002 2.6% 0.5%
2003 1.7% 0.2%
2004 1.7% 0.2%
2005 1.2% 0.1%
2006 2.3% 0.3%
2007 1.4% 0.2%
2008 1.9% 0.3%
2009 1.9% 0.4%
2010 1.8% 0.2%
2011 1.2% 0.1%
2012 1.7% 0.3%
2013 1.7% 0.2%
Apparent TB Prevalence in
White-tailed Deer

(Cochran-Armitage test for trend, two-tailed, p < 0.0001)
Apparent Prevalence of Bovine Tuberculosis (w/95% Confid. Limits),
Adult White-tailed Deer, DMU 452, 1995-2013
* Extrapolated from head-only apparent prevalence: Mandatory testing. H:/Dan/Tuberculosis/Presentations/Extrapics/TBTrendGraphs/DMU452Trend9513.ppt
Evidence suggests that eradication of TB,
if it can be achieved, will take decades.

Are we better off today than when we started
our TB Management Strategies in 1995?
1. Bovine TB has been reduced from 4.9% in 1995 to 1.7% in 2013 - a 65% decrease.
2. No evidence that bovine TB is spreading or building up outside the 5-county TB Area - no positives since 2010.
3. Bovine TB has not become established in our elk herd.
4. No evidence that Bovine TB has become established in any wildlife species other than deer.
5. Fewer cattle herds becoming infected – 1-3 per year.
Conclusion: “Stay the Course”
Because, if we roll back our management of TB, we can expect to see a decline in these positive effects.

Thank You
www.michigan.gov/emergingdiseases

Michigan’s Bovine
Tuberculosis Program
Dr. Richard W. Smith Assistant State Veterinarian over Ruminant Programs
Bovine TB Program Coordinator

2013 Infected Herds 4 TB Infected Herds & 1 Infected Feedlot

Saginaw Situation
• To date the Gratiot County, Midland
County herds and the Arenac County
feedlot all tied to Saginaw dairy herd
infection.
• Waiting for genome study from Huron
County feedlot to see if it is tied to
Saginaw infection – results in early April
• 83 of the 230 herds traced needed to TB
test - 14,994 head of cattle TB tested.

How Saginaw Herd Infection Happen
• Trace investigation found that Saginaw herd
last purchased milking cows in mid-90s.
• Three different source herds that had
provided the Saginaw herd with bulls were
TB tested - 6,085 head of cattle were
negative.
• Most likely source of infection was from a
cow purchased in mid-90s, perhaps from
dispersal sale in TB zone.

How Other Herd Infections Happen
• Gratiot infection - infection introduced
from feeding infected unpasteurized milk
from Saginaw dairy.
• Midland infection - infected animal
originated from Saginaw dairy.
• Arenac infection - infection introduced by
feeding unpasteurized milk from Saginaw
dairy at Gratiot farm in 2012.
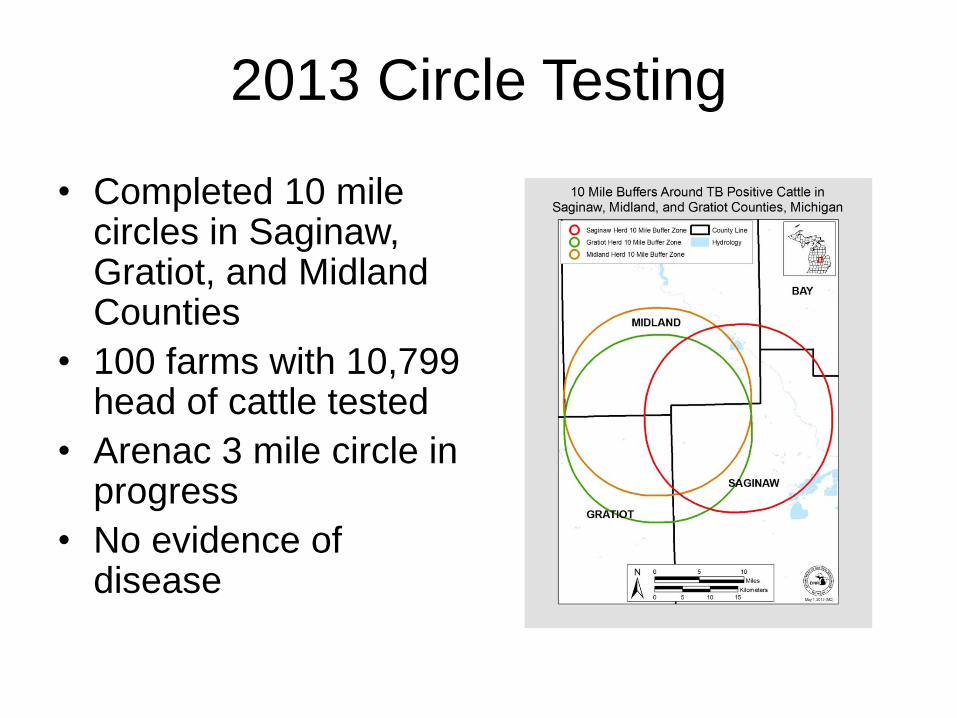
2013 Circle Testing
• Completed 10 mile circles in Saginaw, Gratiot, and Midland Counties
• 100 farms with 10,799 head of cattle tested
• Arenac 3 mile circle in progress
• No evidence of disease

2014 Circle Testing
• Presque Isle – Cheboygan
Counties
38 herds to test
• Huron County
Will wait to for genome study
in early April to determine
circle size

Questions?

Surveys to measure support for
antler-point restrictions (APRs) in
two areas in the Lower Peninsula
Brian Frawley
Wildlife Division
March 13, 2014

Objective of APRs
• Protect a portion of yearling bucks from
harvest and allow them to become older.

APR Proposals
• Two proposals submitted by the Lower
Peninsula – Deer Management Initiative.
• North-central LP
• Southern LP

APR Proposal in North-central LP
• All bucks must have at least three points on one
antler. A second buck must have at least four
points.
• Exempt mentored youth hunters, apprentice
hunters, and youth hunters participating in the
Liberty Hunt.
• APRs would be in place for five years.

APR Proposal in Southern LP
• All bucks taken (first or second buck) must have
at least four points on one antler.
• Exempt mentored youth hunters, apprentice
hunters, and youth hunters participating in the
Liberty Hunt.
• APRs would be in place for five years.

APR Evaluation Process
• Process developed jointly by the DNR and an
APR workgroup made up of representatives
from several organizations and several
members of the deer hunting community.

APR Evaluation Process
• At least 66% of hunters in the affected area must
support mandatory APRs.
• Endorsed a scientifically designed survey to
evaluate support for APR.

Point-of-Sales (POS) Surveys Considered
but Rejected.
• POS survey would complicate and prolong the sale of hunting
licenses.
• POS survey would not be targeted.
• Rely upon personnel at the vendor’s business to administer the
survey. Thus, the DNR could not guarantee the survey was
administered properly.
• Many vendors would object because they would
be forced to administer surveys at their expense and at the
inconvenience of their customers.

Probability Sampling
• A probability sample is a sample selected
in such a way that each person in the
population being studied has a known
likelihood of being included in the sample.
• The results can be reliably projected from
the sample to the larger population.

Survey Process
• Randomly selected sample.
• Sent a cover letter with an enclosed
questionnaire and postage-paid return
envelope via first-class mail.
• Initial mailing was followed by two
additional questionnaires to
nonrespondents.

Survey Questions
1. Do you hunt deer in the area to be affected by these
proposed regulations? Yes No
2. Do you own at least 5 acres of land in the area affected by
the proposed regulations? Yes No
3. Do you farm in the area affected by the proposed
regulations? (A farm is defined as any place from which
$1,000 or more of agricultural products were produced and
sold, or normally would have been sold, during the year.)
Yes No
4. Do you support the antler-point restriction proposal? Yes No

Survey Process
• The percentage of support was measured by
dividing the number of “yes” responses by the
sum of those responses indicating “yes” or “no.”
• At least 50% of people receiving the survey had
to reply in order to accept the results of the
survey.

Survey Results
Table 1. The estimated number of hunters in the area affected by proposed APRs, and the number of hunters
selected to receive an APR survey.
Area
Total number
of huntersa
Number of
people
included in
samplea
Number of
questionnaires
that were
undeliverable
Number of
questionnaires
returned
Response
rate (%)b
North-central LP 100,000 3,000 11 2,167 72
Southern LP 340,006 2,300 17 1,700 74
aEstimated number of people that hunted deer in area during 2012 (Frawley 2013). bSample size adjusted for undeliverable questionnaires when calculating response rate.

Survey Results
Table 2. Proportion of hunters supporting or opposing proposed antler point restrictions.
Area Group
Yes (Supported mandatory APR
regulations)
No (Did not support mandatory APR
regulations)
%a 95% CLb %a 95% CLb
North-central LP Hunters 61.7 2.2 38.3 2.2
Hunters that own at least
5 acresc 62.2 3.2 37.8 3.2 Hunters that farmedc,d 60.4 6.9 39.6 6.9 Southern LP Hunters 54.9 2.5 45.1 2.5
Hunters that own at least
5 acresc 57.4 3.6 42.6 3.6 Hunters that farmedc,d 56.6 5.9 43.4 5.9 aPercentage of hunters; hunters that failed to provide an answer (<1%) were not used to measure support for mandatory APR regulations. b95% confidence limits. cSubset of hunters. dA farm is defined as any place from which $1,000 or more of agricultural products were produced and sold, or normally would have been
sold, during the year.

Conclusions
• Support from hunters was insufficient (<66%) to
recommend implementation of antler point
restrictions in either of the areas.

Thank You
www.michigan.gov/dnr

2012 Deer Hunter Opinion Survey

Objectives
• Estimate importance of deer hunting.
• Quantify hunter activity during the past
three years.
• Determine deer hunters’ opinions on
various hunting regulations.
Methods
• 5,697 randomly selected 2012 deer
hunting license buyers sent survey.
• Questionnaires mailed in mid-February
2013. Up to two follow-up mailings sent to
non-respondents.
• 58% response rate.
Results
• 86% of license buyers indicated hunting
deer was an important recreational
activity.
• 99% of the license buyers had hunted
deer during the past three years (667,995
hunters).

0%
10%
20%
30%
40%
50%
60%
70%
80%
Excellent or very good Good or fair Poor
Pro
po
rtio
n o
f h
un
ters
Rating for deer hunting experience
2006 2012
Deer Hunter Satisfaction

Preface to Questions About Buck
Harvest Regulations
Michigan has a long tradition of allowing anyone who
wishes to hunt bucks to purchase a deer hunting license
(unlimited buck hunting participation). Legal bucks have
been defined as a deer with at least one antler three or
more inches in length. In recent years, hunters could
harvest two bucks in any combination of seasons if one
buck had at least 4 antler points on one side. Each year,
5% or less of Michigan deer hunters takes 2 bucks.

Support for Additional Restrictions on
Buck Harvest
• Most deer hunters in the UP (52%), NLP (54%), and SLP
(56%) supported additional restrictions on buck harvest.
0%
10%
20%
30%
40%
50%
60%
70%
Upper Peninsula Northern LowerPeninsula
Southern LowerPeninsulaP
rop
ort
ion
of
hu
nte
rs s
up
po
rtin
g
ad
ditio
na
l bu
ck h
arv
est r
estr
ictio
ns
Region
2001 2006 2012

Support for Existing Restrictions
Proportion of deer hunters that supported existing buck harvest restrictions. (Allow hunters to take a total of two bucks in any combination of seasons if one of those bucks has at least 4 antler points on one antler.)
Restriction and region
Level of support
Strongly support or support
Oppose or strongly oppose Not sure
% 95% CL % 95% CL % 95% CL
UP 60 5 37 4 3 2 NLP 69 3 27 3 5 1 SLP 66 4 31 4 3 1 Statewide 67 2 30 2 4 1

Support for Regional APRs
Proportion of deer hunters that supported regional APRs. (Allow hunters to take a total of two bucks in any combination of seasons, but require regional minimum antler point restrictions. In the UP, one buck 2 or more points on one side, the other 4 or more points on one side. In the NLP, one buck 3 or more points on one side, the other 4 or more points on one side. In the SLP both bucks 4 or more points on one side.)
Restriction and region
Level of support
Strongly support or support
Oppose or strongly oppose Not sure
% 95% CL % 95% CL % 95% CL
UP 53 5 41 5 6 2 NLP 46 3 45 3 9 2 SLP 45 4 46 4 9 2 Statewide 46 2 45 2 9 1

Support for One-buck Limit
0%
10%
20%
30%
40%
50%
60%
70%
Support Oppose Not sure
Pro
po
rtio
n o
f h
un
ters
Opinion about one buck limit
1993 2001 2006 2012

Discussion
• Most hunters in DNR surveys supported
additional restrictions on buck harvest.
• MSU study reported 70% of deer hunters
believed there were too few mature bucks
for harvest, and 55% of hunters indicated
the DNR should try to produce more
mature bucks.

Discussion
• Less than 50% of hunters have been satisfied by their overall
hunting experience each year, and less than 25% of hunters have
been satisfied by the number of antlered deer seen during the past
hunting season.
15%
20%
25%
30%
35%
40%
45%
50%
2008 2009 2010 2011 2012
Pro
po
rtio
n o
f s
ati
sfi
ed
hu
nte
rs
Year
Number of antlered deer seen Number of deer harvested
Number of deer seen Overall deer hunting experience

Discussion
• Although most deer hunters favored additional
buck harvest restrictions, none of the buck
harvest restrictions evaluated received higher
support than the existing regulations.
• Additional discussions with deer hunters and
other stakeholders are needed to determine
what tradeoffs are acceptable.

Survey Comparison
Deer Hunter Survey APR Surveys Deer Hunter Survey
• Area-specific • Statewide and regional
• Exempt youth and
apprentice hunters
• No exemptions
• Five year experiment • No timeframe
• Yes or No • Strongly support, support,
oppose, strongly oppose,
or not sure
• APRs were requested to
protect a portion of yearling
bucks from harvest and
allow them to become older
• APR question asked after
stating 5% or less of
hunters take two bucks;
does not provide any
further rational for APRs

Broader APR Evaluation
• “Hunter’s Choice”
(Upper Peninsula & DMU 487)
– 2014 – 2016 regulations: Wildlife Division
evaluation
• Third-party evaluation of impacts:
– Population impacts
– Disease risk
– Hunter participation
– Hunting-related economic impacts
– Crop & silvicultural damage
Third-Party Evaluation
• Solicitation~March – May 2014
• Review and selection~June 2014
– One or more impacts
– Potentially include Quality Deer Management
more broadly
– Demonstrate sufficient expertise/independence
• Report and presentation~February 2015
– Pursue peer-reviewed outlet for
consolidated report

Thank You
www.michigan.gov/dnr