Embed Size (px)
Citation preview

Policy ReseaRch WoRking PaPeR 4882
Natural Resources and Reforms
Mohammad AminSimeon Djankov
The World BankFinancial and Private Sector Vice PresidencyEnterprise Analysis UnitMarch 2009
WPS4882

Produced by the Research Support Team
Abstract
The Policy Research Working Paper Series disseminates the findings of work in progress to encourage the exchange of ideas about development issues. An objective of the series is to get the findings out quickly, even if the presentations are less than fully polished. The papers carry the names of the authors and should be cited accordingly. The findings, interpretations, and conclusions expressed in this paper are entirely those of the authors. They do not necessarily represent the views of the International Bank for Reconstruction and Development/World Bank and its affiliated organizations, or those of the Executive Directors of the World Bank or the governments they represent.
Policy ReseaRch WoRking PaPeR 4882
The authors use a sample of 133 countries to investigate the link between the abundance of natural resources and micro-economic reforms. Previous studies suggest that natural resource abundance gives rise to governments that are less accountable to the public and states that are oligarchic, and that it leads to the erosion of social capital. These factors are likely to hamper economic reforms. The authors test this hypothesis using data on
This paper—a product of the Enterprise Analysis Unit, Financial and Private Sector Vice Presidency—is part of a larger effort in the department to is part of a larger effort in the department to better understand the functioning of the private sector. Policy Research Working Papers are also posted on the Web at http://econ.worldbank.org. The author may be contacted at [email protected].
micro-economic reforms from the World Bank’s Doing Business database. The results provide a robust support for the “resource curse” view: a move from the 75th percentile to the 25th percentile on resource abundance equals 10.9 percentage points more reform. This is a large effect given that the mean probability of reform in the sample is 57.1 percent.

Natural Resources and Reforms
Mohammad Amin and Simeon Djankov*
Keywords: Reform, Natural resources, Regulation JEL: Q0, O25, K2, L51 ___________________________ * The authors are, respectively, Economist and Chief Economist in the Finance and Private Sector Development Vice Presidency of the World Bank, Washington DC. Contact email: [email protected].

1. Introduction
The relationship between natural resource abundance and economic performance has
been the subject of much academic debate. Prior to the 1980s, the conventional wisdom
was that natural resource abundance was a contributing factor to economic growth. In an
influential study, Rostow (1961) argued that natural resource endowments would enable
developing countries to make the transition from underdevelopment to industrial “take-
off” just as they had done for countries such as Australia and the United States. Similar
views were expressed by Balassa (1980) and Krueger (1980).
A number of studies have since challenged this view, arguing that the abundance
of natural resources leads to poor economic performance (Wheeler 1984; Auty 1993;
Sachs and Warner 1995, 1997; Gylfason et al. 1999), more civil wars (Reynal-Querol
2002), poorer quality of political institutions (Wantchekon 1999; Ross 2001), and higher
corruption (Leite and Weidmann 1999).
A small but growing literature suggests that natural resource abundance may lead
to poorer quality of economic institutions. First, governments in resource rich countries
are less dependent on public taxation for their revenue, which makes them less
accountable to the people and less interested in reform (Luciani 1987, Chaudhry 1994,
Karl 1997, Moore 2000, 2004). As Luciani (1987) succinctly puts it, rentier states do “not
need to formulate anything deserving the appellation of economic policy.” Second, the
availability of large rents from the extraction of natural resources tends to increase the
reward for political agents from rent-seeking activity and thus diverts talent from industry
to the bureaucracy (Tovrik 2002, Auty 2001b). Third, greater concentration of wealth that
tends to accompany greater abundance of natural resources tends to erode social capital, a
2

necessary ingredient for generating consensus on reforms (Isham et al. 2002, Rodrik
1999a).
We contribute to this strand of the literature by analyzing the relationship between
natural resource abundance and micro economic reforms. The analysis is done on a
sample of 133 countries, with data on reforms from the World Bank’s Doing Business
project. Previous studies have shown these reforms to expand growth (for example,
Klapper, Laeven and Rajan (2006) and Barseghyan (2008)).
Our data are not subject to the criticisms of other measures of economic
institutions, which suffer from significant endogeneity issues, and measure outcomes
rather than institutions (for example, Glaeser et al. 2004). The Doing Business data are
focused on specific regulatory or legal reforms, and as such they are a better indicator of
underlying institutions. At the same time, they are sufficiently micro-measured so as to
avoid the possibility of such reforms affecting the usage of natural resources.
We find robust evidence for the negative link between natural resource abundance
and growth-enhancing reforms. The estimates imply that a move from the most natural
resource rich country (Swaziland) to the poorest (Japan) increases the probability of
reform by 44.7 percentage points, a large effect given that the probability of reform in the
full sample is only 57.1%. A move from the 75th percentile to the 25th percentile on
resource abundance equals 10.9 percentage points more reform.
Using alternative measures of natural resource abundance, we find that the
likelihood of growth enhancing reforms increases by a high of 50.7 and a low of 23.9
percentage points when we move from the most to the least natural resource abundant
country. These results are robust to the inclusion of various proxies for the initial
3

institutional environment, controlling for per capita income, civil conflict,
fractionalization within societies, education level and geography.
The rest of the paper is organized as follows. Section 2 describes the data and
main variables. Section 3 shows the main regression results, Section 4 provides
robustness checks. Section 5 concludes.
2. Description of the data
The sample consists of 133 countries for which information on our main variables is
available. The time period covered by the study is 2003-2008. In the analysis we utilize
several sources of data, including the World Bank’s Doing Business project and World
Development Indicators, Comtrade (United Nations), Polity IV, Freedom House, Armed
Conflict Database, Djankov et al. (2007), La Porta et al. (1999) and Sachs and Warner
(1997). A definition of all variables and their sources is provided in Table 1. Summary
statistics for the main variables are provided in Table 2.
2.1 Dependent variable
The dependent variable is based on data from the World Bank’s Doing Business project.
As part of its annual exercise, Doing Business compiles ten sets of indicators covering
various aspects of the business climate including starting a business, paying taxes,
obtaining licenses, getting credit, protecting investors, employing workers, international
trade, property registration, closing a business and enforcement of private contracts.
Information is also available on an annual basis on important reforms on each of these
indicators. This information is coded as a dummy variable which equals 1 if a country
4
implemented a positive reform during the year on a given indicator and 0 otherwise. A
positive reform, as defined in Doing Business, is one that makes it faster, cheaper or
administratively easier for local businesses to start and run operations; or a reform that
defines and increases the protection of property rights. An example is reducing the
number of days to get an industry license, eliminating the minimum capital requirement
for start-ups, or increasing the legal rights of creditors and minority shareholders.
Using this dataset, we define the main dependent variable, Reform, as a dummy
variable equal to 1 if a positive reform occurred in one or more of the ten indicators in a
given year and 0 otherwise. The mean value of the variable equals 0.55 and the standard
deviation is 0.50 (Table 2). For robustness, we also report our main results using an
alternative measure that equals (log of 1 plus) the number of indicators on which a
positive reform occurred during a given year (Number of Reforms). For example, in 2005,
Turkey implemented reforms in paying taxes and international trade implying a score of
1.099 (log of 1 plus 2) for the dependent variable. The two dependent variables are highly
correlated (correlation of 0.877).
Information on changes in the quality of the business environment is also
available from alternative sources such as Heritage Foundation’s Freedom of the World
Index or Fraser Institute’s Economic Freedom of the World. One could use annual
changes in these data to construct a measure of reform similar to the ones described
above. However, the Doing Business data offer two advantages. First, unlike other data
sources that are based in part on experts’ perceptions, the Doing Business data are based
on actual reforms. Second, and more important, since the Doing Business data cover a
specific set of policy reforms, reverse causality from our dependent variable to natural
5
resources is unlikely. It is difficult, for example, to imagine that the enactment of a more
efficient bankruptcy law would influence the exploration and usage of natural resources.
In contrast, other available indicators of the business environment are aggregate or macro
level measures. A possible feedback effect from macro level changes in the business
environment to the exploration and usage of natural resources is plausible. This problem
is identified in Glaeser et al. (2004), among others.
2.2 Explanatory variables
Resource abundance
The main explanatory variable is a measure of natural resource abundance in a country.
We follow the literature in using the value of primary exports as a percentage of GDP
(SXP) as our main measure of resource abundance. Primary exports are defined as those
in the SITC (Revision 1) categories of 0, 1, 2, 3, 4 and 68.1 Data source for primary
exports is U.N Comtrade and GDP values are from World Development Indicators,
World Bank. Values of SXP are available on an annual basis but they show little variation
over our sample period.2 Hence, we use initial year values of SXP. To eliminate extreme
values or temporary shocks, we use log values of the variable averaged over the five-year
interval prior to the reform years (1998-2002).
According to SXP, Japan is least natural resource abundant (-1.28) followed by
Bangladesh, United States (-0.02) and Cambodia (0.31). At the high end, the most natural
resource abundant country is Swaziland (4.46), followed by Bahrain (4.14), Tajikistan
1 This definition of primary exports follows Sachs and Warner (1995). 2 The correlation between current and one year lagged values of SXP over our reform period (2003-2008) equals 0.957.
6
(4.08) and Papua New Guinea (3.98). The mean value of SXP equals 2.13 and the
standard deviation is 1 (Table 2).
To check for the robustness of our results, we use a number of alternative
measures of natural resource abundance discussed in the literature. We report detailed
results on two of these measures: the (log of) primary exports expressed as a percentage
of total merchandise exports, averaged over 1998-2002 (PX); and the (log of) share of
mineral production in GDP in 1971 (Minerals). The Minerals variable is taken from
Sachs and Warner (1997) and was originally constructed using country-specific
production data from the U.S. Bureau of Mines for the top twenty-three minerals in 1971.
The three measures of resource abundance show substantial correlation with each
other. For example, SXP shows a correlation of 0.71 with PX and 0.49 with Minerals.
Results using two other measures, net primary exports to GDP ratio and total land area
per person, are discussed in the robustness section.
Other determinants of reform
The proclivity to reform is likely to depend on the quality of the broader economic
institutions that may determine how governments behave. Further, a number of studies
also show that the quality of institutions is inversely correlated with the abundance of
natural resources (see, for example, Auty 2001). As some of these studies suggest, greater
resource abundance may be a causal factor for the poorer quality of institutions that may
in turn lead to a lower incidence of reforms. Nevertheless, we control for a number of
alternative proxy measures of broader economic institutions suggested in the previous
literature to ensure that our results are on the conservative side.
7
We begin by controlling for the quality of democracy. Amin and Djankov (2009)
show the quality of democracy to be highly correlated with the reform measures
discussed above and also known to be inversely correlated with natural resource
abundance (see, for example, Ross 2001). We use the “democracy” variable for year
2003, the beginning of the reform period, from the Polity IV data (Democracy). The
variable ranges between 0 and 10 with higher values implying a better quality of
democracy.
Next, we control for differences in income levels across countries using (log of)
GDP per capita (constant 2005 USD, PPP adjusted) and the average annual growth rate in
GDP per capita. Both these variables are taken from World Development Indicators,
World Bank and averaged over the period 1998-2002. Of the three resource abundance
measures, the share of primary exports in total merchandise exports shows a substantial
negative correlation with GDP per capita (correlation of -0.37). As discussed above, a
number of studies have shown that natural resource abundant countries show lower
growth rates although it is unclear whether this is a causal effect of the former on the
latter. We may also expect higher income and faster growing countries to reform more
because these countries have greater capacity for reform, and more checks and balances
on the government that prevent the use of business regulations by politicians for
generating rents.
Third, we use two sets of controls for geography. The first is the absolute distance
of a country from the equator divided by 90 (Latitude). The second is region fixed effects
where regions include East Asia and Pacific, Latin America and Caribbean (LAC),
Middle East and North Africa (MENA), North America, South Asia, Sub-Saharan Africa
8

(SSA) and the omitted category of Europe and Central Asia (ECA). Classification of
countries into these regions is taken from the World Development Indicators of the
World Bank.
Fourth, there is some evidence that civil conflict is more frequent in natural
resource rich countries. As Rodrik (1999a) suggests, such conflicts can seriously
undermine the capacity to reform. We follow this literature in controlling for a dummy
variable that equals 1 if a country faced one or more incident of civil war during the
reform period 2003-2008 (Civil War (current)) and 0 otherwise. To capture any effects of
previous wars, we use a similar dummy variable covering the five year period before the
reforms (Civil War (lagged)). The data source for these variables is the Armed Conflict
Database.3
Fifth, micro-economic reforms are unlikely to be of much use if the broader
institutional environment does not provide adequate security and protection of private
investment. We control for this factor using the Rule of Law measure taken from World
Bank’s Governance indicators (2003 values). The measure broadly captures respect for
private property, the incidence of crime and the enforceability of private and government
contracts.
Sixth, successful implementation of reforms requires building a social consensus
on the desirability of such reforms. Achieving such a consensus may be particularly
difficult in countries that are more fragmented along ethnic or religious lines. We control
for this factor using three separate measures of the degree of fragmentation or
3 We also experimented by distinguishing between minor and major civil wars as defined in the Armed Conflict Database and also with the total number of civil wars. These variations make little difference to the main results.
9

fractionalization in a country along ethnic, linguistic and religious lines. The source for
these variables is Alesina et al. (2003).
Next, there is now substantial evidence showing that the legal tradition of a
country is a strong proxy for various aspects of the institutional environment. For
example, Djankov et al. (2002) show that entry barriers are much lower in common law
relative to the French civil law countries. Similar findings are reported for shareholder
rights (Djankov et al. 2008), contract enforcement (Djankov et al. 2003) and the
flexibility of labor markets (Botero et al. 2004). We control for the legal tradition of a
country using dummy variables. These traditions include French, German, Scandinavian,
Socialist and the omitted category of English common law. The data source for the
variable is Djankov et al. (2007).
Last, starting with the seminal work of Max Weber, a number of studies have
highlighted the importance of religion in shaping the quality of institutions. For example,
Stulz and Williamson (2003) show that the low level of creditors’ protection present in
Catholic countries is due to the anti-usury culture pervasive in the Catholic tradition.
Following this literature, we use dummy indicators identifying the main religious group
in the country as either Muslim, or Catholic, Protestant and the residual category of all
other religions. The source for these indicators is La Porta et al. (1999).
In addition to these variables, we briefly discuss our results with a number of
other controls. Examples include the level of regulation across countries at the beginning
of the sample period, the degree of openness of the economy, foreign aid, the level of
education, and mortality rate for early European settlers in the previously colonized
countries.
10

Consistent with the literature discussed above, we find a strong link between
some of the control variables discussed above and reform. Nevertheless, the negative
relationship between natural resource abundance and reform survives these controls.
Figure 1 provides a graphical illustration of this relationship controlling for GDP per
capita and regional fixed effects.
3. Empirical results
The main empirical results are provided in Table 3. The estimated coefficient values and
their significance levels are obtained using a logit specification with Huber-White robust
standard errors clustered on the country. Without any additional controls, the estimated
coefficient of SXP equals -0.317, significant at close to 1% level (column 1). The
coefficient estimate implies that a move from the least natural resource abundant country
(Japan) to the most (Swaziland) decreases the probability of reform by 44.7 percentage
points, a large effect given that the mean value of the dependent variable equals 57.1%.
The corresponding decrease in moving from the 75th percentile value of SXP to the 25th
percentile value equals 10.9 percentage points.
The estimated coefficient of the SXP variable declines in magnitude on account of
each of the controls discussed above except for the civil war dummies (columns 2-10).
However, it remains negative, economically large and statistically significant. The
coefficient value is lowest (in absolute value) when we control for Democracy equaling -
0.240, significant at close to 5% level (p-value of 0.056, column 2). Even this lowest
11

estimate implies a decrease in the probability of reform by 33.8 percentage points when
we move from the least to the most resource abundant country. 4
We find that, controlling for the level of resource abundance, reform is
significantly more likely in countries with a higher quality of democracy (column 2),
countries that have lower incidence of civil war, are more distant from the equator, are
growing faster, and those in the ECA region relative to all other regions. Chances of
reform are significantly lower for countries that follow the English common law relative
to all other legal traditions. Relative to all other religions, Catholic, Muslim and
Protestant countries show a lower probability of reform although this effect is significant
only for the Protestant countries (at the 10% level, not shown). In sum, natural resource
abundance is associated with much fewer micro-economic reforms, and this association
remains strong when we control for various measures of institutional quality.
4. Robustness
First, we repeat the regression exercise using the OLS method and the Number of
Reforms as the dependent variable. The relationship between resource abundance and
reform holds (Table 4). As above, it is weaker in magnitude with the various controls
(except for civil war dummies) than otherwise but still large and statistically significant at
the 5% level. The estimates in Table 4 imply that without any additional control, a move
from the least to the most natural resource abundant country lowers the dependent
variable by a large 0.552 (against the mean value of 0.556 of the dependent variable). The
corresponding decline with the various controls in place ranges between a low of 0.412
4 Simultaneously controlling for all the variables in Table 3, the estimated coefficient of SXP remains negative and significant. It equals -0.241, significant at the 5% level (p-value of 0.050).
12

when we control for ethnic, linguistic and religious fractionalization (columns 9) and a
high of 0.631 when we control for the incidence of civil wars (column 5).
Second, we report regression results using PX, the share of primary exports in
total merchandise exports as the resource abundance measure (Table 5). The main results
continue to hold. Without any other controls, a move from the least (Japan) to the most
natural resource abundant country (Swaziland) decreases the probability of reform by
40.1 percentage points. With the various controls in place, the decrease ranges between
23.9 (with the region fixed effects control, column 7) and 41.6 (with the rule of law
control, column 6).
Next, we use the third measure of resource abundance, Minerals (Table 6). As
above, greater abundance of minerals is associated with a negative effect on the
probability of reform and this effect is very large in magnitude. For example, moving
from the least (Ethiopia, among others) to the most mineral rich country (Oman) reduces
the probability of reform by 44.6 percentage points without any controls (column 1), a
low of 29.5 percentage points with the control for Democracy (column 2) and a high of
50.7 percentage points with the region fixed effects in place (column 7). However, these
large effects are statistically significant at less than 5% level only in one specification
(with the regional effects), insignificant at the 10% level when we control for Democracy
and the legal origin of countries (columns 2, 10) and significant at the 10% level in the
remaining specifications.
The statistically weaker effect of Minerals on reform is similar to the broader
findings in the literature on the resource curse. For example, Stijns (2001) finds that
while primary exports to GDP ratio across countries is significantly inversely correlated
13
with GDP per capita growth, mineral abundance shows little evidence of such a resource
curse. One reason for this could be that estimates of mineral production are based on
approximations, especially for the set of developing countries (Sachs and Warner, 1997).
Also, the weak results for Minerals in the present paper seem to be driven by two
countries, Saudi Arabia and Oman, which show excessively large production of minerals
relative to the rest of the countries. Share of minerals in GDP equals 1.51 for Oman and
1.36 for Saudi Arabia. The next highest is Kuwait (0.65) followed by United Arab
Emirates (0.59). Excluding Saudi Arabia and Oman from the sample we find that for the
specifications in Table 6, the estimated coefficient of Minerals increased substantially in
magnitude ranging between -3.045 and -3.9 compared with -1.287 to -2.38 for the full
sample. Further, these estimated coefficients are all significant at less than 1% level.
These larger effects are driven mainly by the exclusion of Saudi Arabia from the sample.
Figure 2 provides a graphical illustration of Saudi Arabia as an atypical case.
Fourth, we check for the stability of the resource abundance-reform relationship
by using share of net primary exports in GDP and (log of) land area per person. The
former measure of resource abundance yielded results roughly similar to the ones in
Table 3. Its estimated coefficient value was large, negative and significant at close to 1%
level in the all the specification. These estimates imply that a move from the smallest to
the highest value of net primary exports to GDP ratio decreases the probability of reform
in the range of 83.6 percentage points (controlling for region fixed effects) to 66.3
percentage points (controlling for Democracy). We find similar results using land area
per person except in two specifications (controlling for regional fixed effects and
fractionalization variables) where the estimated coefficient value is statistically weak
14
(significant between 10-20% level). However, even in these weak cases, the relationship
is large in magnitude. A move from the smallest to the largest value of land area per
person decreases the probability of reform by 18.6 percentage points controlling for
regional fixed effects and 23.8 percentage points controlling for ethnic, linguistic and
religious fractionalization. The corresponding decline with no additional controls equals
35.1 percentage points (p-value of 0.017).
Finally, we performed a number of additional robustness checks on the results
reported in Tables 3-6. These checks include following Rodrik (1999b) in controlling for
the primary and secondary gross enrollment rates (from World Development Indicators,
World Bank) and the initial (year 2003) level of regulation using the Heritage
Foundation’s Business Freedom index; controlling for a measure of openness equal to the
fraction of years during the period 1970-1990 in which the country is rated as an open
economy according to the criterion in Sachs and Warner (1995); controlling for GDP per
capita in all the specifications; controlling for the (log of) settler mortality rate from
Acemoglu et al (2001) and controlling for net foreign aid as percentage of GDP (average
of annual values over 1998-2002 and current and lagged annual values during 2003-
2008).5 The relationship between the three resource abundance measures and reform
remains robust to all these checks except when we control for settler mortality, a result
most likely due to the smaller sample size (we lose 87 countries, which have no data on
settler mortality).
5 Foreign aid is defined as net official development assistance (ODA) which consists of disbursements of loans made on concessional terms (net of repayments of principal) and grants by official agencies of the members of the Development Assistance Committee (DAC), by multilateral institutions, and by non-DAC countries to promote economic development and welfare in countries and territories in the DAC list of ODA recipients. Data source for the variable is World Development Indicators, World Bank.
15
5. Conclusion
Prior to the mid-1980s, the conventional wisdom was that the abundance of natural
resources contributed positively to economic growth. More recent studies have shown
that the opposite may be true.
A logical channel for this deleterious effect is that the incentive to build good
economic institutions through growth enhancing reforms is low in natural resource
abundant countries. The present study puts this idea to the test by using data on micro-
economic reforms over the period 2003-2008. The findings confirm yet another form of a
“natural resource curse.” That is, the proclivity to improve the general business
environment is significantly lower in natural resource abundant countries.
16

References
Acemoglu, Daron, Simon Johnson and James A. Robinson (2001), “The Colonial Origins of Comparative Development: An Empirical Investigation,” American Economic Review, 91(5), pp. 1369-1401. Alesina, Alberto, Arnaud Develeeschauwer, William Easterly Sergio Kurlat and Romain Wacziarg (2003), “Fractionalization,” Journal of Economic Growth, 8: 155-194. Amin, Mohammad and Simeon Djankov (2009), “Democracy and Reform,” CEPR Discussion Paper No. 7151. Auty, Richard (1993), Sustaining Development in Mineral Economies: The Resource Curse Thesis, Routledge, London. Auty, Richard (2001a), Resource Abundance and Economic Development, edited volume. Oxford University Press, New York. Auty, Richard (2001b), “The Political Economy of Resource Driven Growth,” European Economic Review, 45(4-6): 839-846. Balassa, Bela A. (1980), The Process of Industrial Development and Alternative Development Strategies, Princeton University, Princeton, USA. Barseghyan, Levon (2008), “Entry Costs and Cross-Country Differences in Income and Productivity,” Journal of Economic Growth, 13, 145-167. Botero, Juan, Simeon Djankov, Rafael La Porta, Florencio Lopez-de Silanes and Andrei Shleifer (2004), “The Regulation of Labor,” Quarterly Journal of Economics, 119(4): 1339-82. Chaudhry, K. (1994), “Economic Liberalization and the Lineages of the Rentier State,” Comparative Politics, 27: 1-25. Djankov, Simeon, Rafael La Porta, Florencio Lopez-de Silanes and Andrei Shleifer (2002), “The Regulation of Entry,” Quarterly Journal of Economics, 117(1): 1-37. Djankov, Simeon, Rafael La Porta, Florencio Lopez-de Silanes and Andrei Shleifer (2003), “Courts,” Quarterly Journal of Economics, 118(2): 453-517. Djankov, Simeon, Caralee McLiesh and Andrei Shleifer (2007), “Private Credit in 129 Countries,” Journal of Financial Economics, 84(2): 299-329. Djankov, Simeon, Rafael La Porta, Florencio Lopez-de Silanes and Andrei Shleifer (2008), “The Law and Economics of Self Dealing,” Forthcoming, Journal of Financial Economics.
17
Glaeser, Edward, Rafael La Porta, Florencio Lopez-de-Silanes and Andrei Shleifer (2004), Do Institutions Cause Growth?, Journal of Economic Growth, 9, 271-303. Gylfason, T., T.T. Herbertsson and G. Zoega (1999), “A Mixed Blessing: Natural Resources and Economic Growth,” Macroeconomic Dynamics, 3: 204-225. Isham, J., M. Woolcock, L. Pritchett and G. Busby (2002), “The Varieties of Rentier Experience: How Natural Resource Export Structures Affect the Political Economy of Economic Growth,” mimeograph, available at www.middlebury.org. Karl, T. L. (1997), The Paradox of Plenty: Oil Booms and Petro-States, California University Press. Klapper, Leora, Luc Laeven, and Raghuram Rajan (2006), “Entry regulation as a barrier to Entrepreneurship,” Journal of Financial Economics, 82, 3: 591-629. Krueger, A (1980), “Trade Policy as an Input to Development,” American Economic Review, 70(2): 288-292. La Porta, Rafael, Florencio Lopez-de Silanes, Andrei Shleifer and Robert Vishny (1999), “The Quality of Government,” Journal of Law, Economics and Organization, 15(1): 222-79. Luciani, G. (1987), Allocation vs. Production States: A Theoretical Framework, in H. Beblawi and G. Luciani (eds), The Rentier State: Volume II, Croom Helm, London. Moore, M. (2000), “Political Underdevelopment: What Causes Bad Governance?,” Public Management Review, 3(3): 385-418. Moore, M. (2004), “Revenues, State Formation and the Quality of Governance in Developing Countries,” International Political Science Review, 25(3): 297-319. Reynal-Querol, Marta (2002), “Ethnicity, Political Systems and Civil Wars,” Journal of Conflict Resolution, 46: 29-54. Rodrik, Dani (1996), “Understanding Economic Policy Reform,” Journal of Economic Literature, 24 (1): 9-41. Rodrik, Dani (1999a), “Where Did All the Growth Go? External Shocks, Social Conflict and Growth Collapse,” Journal of Economic Growth, 4(4): 385-412. Rodrik, Dani (1999b), “Democracies Pay Higher Wages,” Quarterly Journal of Economics, 114, 3: 707-738.
18

Rostow, Walt Whitman (1961), The Stages of Economic Growth: A Non-communist Manifesto, Cambridge University Press, Cambridge, U.K. Ross, M. L. (2001), Timber Booms and Institutional Breakdown in Southeast Asia, Cambridge University Press, New York. Sachs, Jeffery D. and Andrew M. Warner (1995), “Natural Resource Abundance and Economic Growth,” NBER Working Paper No. 5398, Cambridge, MA. Sachs, Jeffery D. and Andrew M. Warner (1997), “Natural Resource Abundance and Economic Growth,” Center for International Development and Harvard Institute for International Development, mimeograph. Stulz, Rene and Rohan Williamson (2003), “Culture, Openness and Finance,” Journal of Financial Economics, 70, 3: 313-349. Tovrik, Ragnar (2002), “Natural Resources, Rent Seeking and Welfare,” Journal of Development Economics, 67: 455-470. Wantchekon, L (1999), Why Do Resource Dependent Countries Have Authoritarian Governments?, Yale University, New Haven, USA. Wheeler, D (1984), “Sources of Stagnation in Sub-Saharan Africa,” World Development, 12(1): 1-23.
19
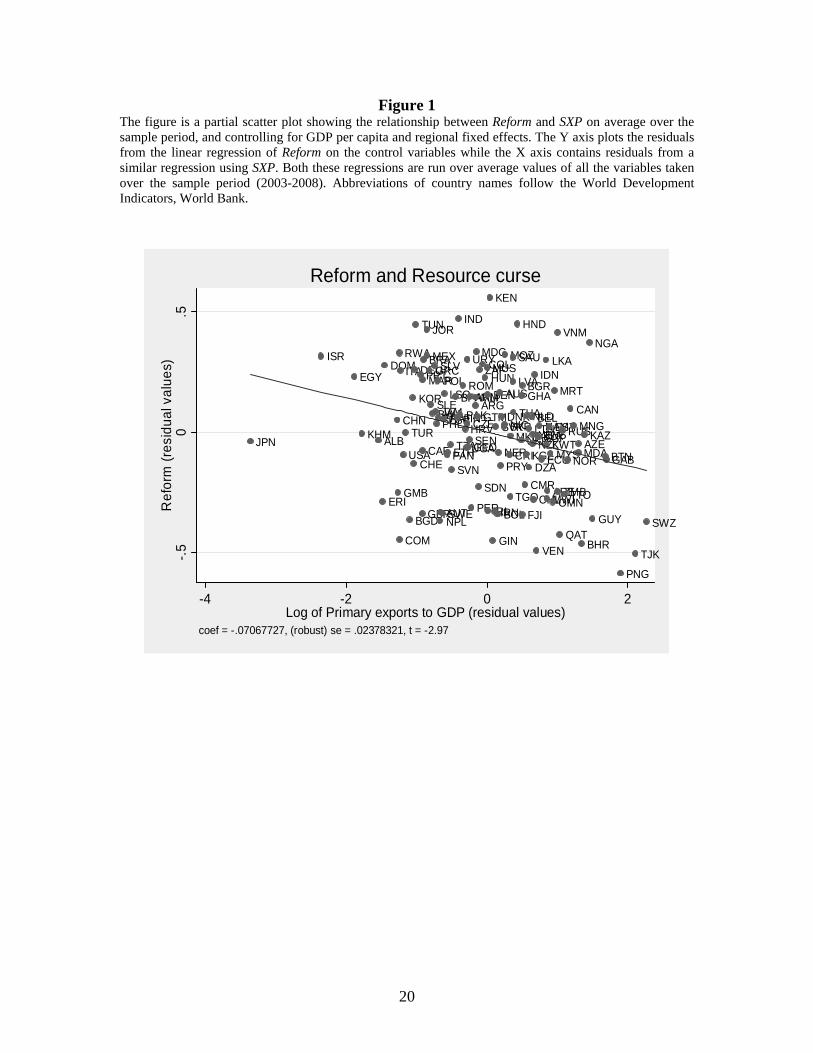
Figure 1 The figure is a partial scatter plot showing the relationship between Reform and SXP on average over the sample period, and controlling for GDP per capita and regional fixed effects. The Y axis plots the residuals from the linear regression of Reform on the control variables while the X axis contains residuals from a similar regression using SXP. Both these regressions are run over average values of all the variables taken over the sample period (2003-2008). Abbreviations of country names follow the World Development Indicators, World Bank.
JPN
ISR
EGY
KHMALB
ERI
DOM
CHN
GMB
RWA
COM
ITA
USA
TUR
BGD
KOR
CHE
DEU
TUN
PRT
GBR
CAF
MAR
BRAMEX
JOR
GRC
SLEBWA
SLV
JAMPHL
POL
FRA
NPLAUTSWE
ESP
LSO
PANETHTZA
SVN
BFA
FIN
IND
PAK
ROM
HRV
UGA
URY
CZE
GEOSEN
ARM
PER
MLIARG
MDG
GTM
SDN
ZAFCOLHUNMUS
BEN
IRL
KEN
GIN
IRN
SVK
BOL
NER
AUS
PRY
DNKSYRNIC
MOZ
CRI
TGO
MKD
LVA
SAU
THA
HND
UKR
GHA
FJI
BGR
CMR
KGZ
NLDLTU
DZA
BEL
YEMNZL
CHL
IDN
VEN
BLRSGPNAM
ECU
LKA
KWT
MWIARE
EST
MYS
OMN
MRT
VNM
ZMB
QAT
RUS
TTO
NOR
CAN
MNG
MDAAZE
BHR
KAZ
NGA
GUY
BTNGAB
PNG
TJK
SWZ
-.5
0.5
Ref
orm
(re
sid
ual v
alue
s)
-4 -2 0 2Log of Primary exports to GDP (residual values)
coef = -.07067727, (robust) se = .02378321, t = -2.97
Reform and Resource curse
20
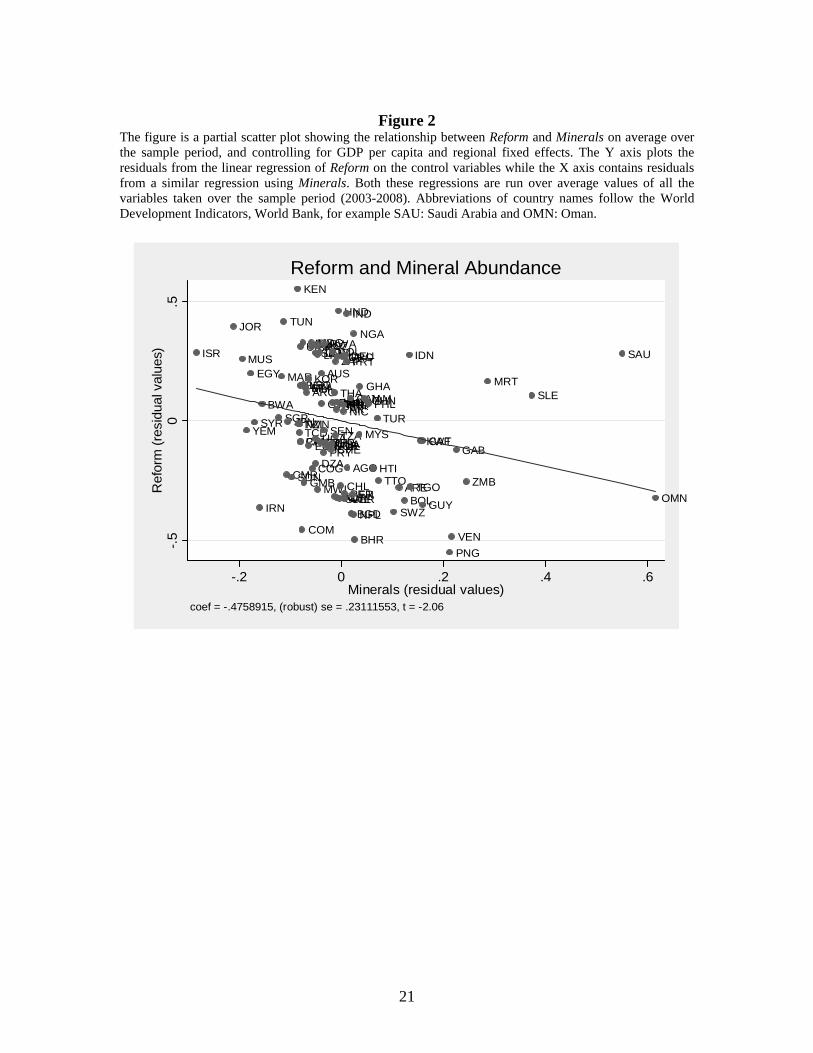
Figure 2
The figure is a partial scatter plot showing the relationship between Reform and Minerals on average over the sample period, and controlling for GDP per capita and regional fixed effects. The Y axis plots the residuals from the linear regression of Reform on the control variables while the X axis contains residuals from a similar regression using Minerals. Both these regressions are run over average values of all the variables taken over the sample period (2003-2008). Abbreviations of country names follow the World Development Indicators, World Bank, for example SAU: Saudi Arabia and OMN: Oman.
ISR
JOR
MUS
YEM
EGY
SYR
IRN
BWASGP
MAR
TUN
CMR
JPN
SDN
KEN
TWNNZLTCDPAN
BEN
CRI
URY
COM
MEX
LSO
GMB
BFAMLIARGKOR
ECU
MDGBRA
COG
SLV
DZA
UGA
MOZLKA
MWI
DOM
ETH
AUS
GTM
PRY
RWA
SENNERGNBNORCHEUSA
COL
DNKTHA
IRL
TZA
ZAF
PAKNLD
AUT
ITA
HND
BEL
SWE
FRAFIN
CHL
GRC
NICESP
PERGBR
DEU
IND
PRT
AGO
CAN
BGD
FJI
NPL
NGA
BHR
MYS
GHAJAMCHNPHL
HTI
TUR
TTO
SWZ
AREBOL
IDN
TGO
KWTCAF
GUY
PNG
VEN
GAB
ZMB
MRTSLE
SAU
OMN
-.5
0.5
Ref
orm
(re
sidu
al v
alue
s)
-.2 0 .2 .4 .6Minerals (residual values)
coef = -.4758915, (robust) se = .23111553, t = -2.06
Reform and Mineral Abundance
21

Table 1: Description of variables
Variable Description Reform Dummy equal to 1 if a country implemented one or more reform during the year and 0 otherwise. Source: Doing Business,
www.doingbusiness.org. Number of reforms Log of 1 plus the total number of reforms for a given country-year. Source: Doing Business. SXP Share of primary exports in GDP (average over 1998-2002; log values). Primary exports include all exports in SITC (Revision 1)
categories of 0, 1, 2, 3, 4 and 68. Source for primary exports is U.N. Comtrade and World Bank for GDP. PX Primary exports as percentage of total merchandise exports (average over 1998-2002; log values). Source: primary exports are
from U.N. Comtrade and total merchandise exports are from World Development Indicators, World Bank. Minerals Share of mineral production in GNP in 1971 (log values). Source: Sachs and Warner (1997). Democracy Democracy score in 2003. Source: Polity IV. GDP per capita Log of GDP per capita (constant 2005 USD, PPP adjusted) averaged over 1998-2002. Source: World Development Indicators,
World Bank. Growth rate Log difference in GDP per capita (constant 2005 USD, PPP adjusted) from its value in the previous year. Averaged over 1998-
2002. Source: World Development Indicators, WDI. Latitude Absolute distance of a country from the equator divided by 90. Source: La Porta et al. (1999). Civil War (current) A dummy variable equal to 1 if a country experienced one or more incident of civil war during 2003-2007 and 0 otherwise. Civil
war is defined as those conflicts that are classified as Type 3 or 4. Source: Armed Conflict Database. Civil War (lagged) Same as Civil War (current) above but for the period 1998-2002. Source: Armed Conflict Database. Rule of Law Values of Rule of Law index in 2003. Source: World Bank. www.worldbank.org/wbi/governance/data Europe and Central Asia (ECA)
Dummy indicating a country in Europe or Central Asia region. Source: WDI, World Bank.
East Asia and Pacific Dummy indicating a country in East Asia or Pacific region. Source: WDI, World Bank. Latin America and Caribbean (LAC)
Dummy indicating a country in Latin America or Caribbean region. Source: WDI, World Bank.
Middle East and North Africa (MENA)
Dummy indicating a country in Middle East or North Africa region. Source: WDI, World Bank.
North America Dummy indicating a country in North America region. Source: WDI, World Bank. South Asia Dummy indicating a country in South Asia region. Source: WDI, World Bank. Sub-Saharan Africa (SSA) Dummy indicating a country in Sub-Saharan Africa region. Source: WDI, World Bank. English legal origin Dummy indicating a country's legal system based on the English common law. Source: Djankov et al. (2007). French legal origin Dummy indicating a country's legal system based on the French civil law. Source: Djankov et al. (2007). German legal origin Dummy indicating a country's legal system based on German civil law. Source: Djankov et al. (2007). Scandinavian legal origin Dummy indicating a country's legal system based on Scandinavian legal system. Source: Djankov et al. (2007).
22

23
Socialist legal origin Dummy indicating a country's legal system is Socialist. Source: Djankov et. al. (2007). Ethnic fractionalization A measure of the degree of ethnic fractionalization. Source: Alesina et al. (2003) Linguistic fractionalization A measure of the degree of linguistic fractionalization. Source: Alesina et al. (2003) Religious fractionalization A measure of the degree of religious fractionalization. Source: Alesina et al. (2003). Muslim Dummy indicating the main religion in the country is Islam. Source: La Porta et. al. (1999). Catholic Dummy indicating the main religion in the country is Catholicism. Source: La Porta et. al. (1999). Protestant Dummy indicating the main religion in the country is Protestantism. Source: La Porta et. al. (1999). All other religions Dummy indicating main religion is other than Islam, Catholicism and Protestantism. Source: La Porta et. al. (1999).
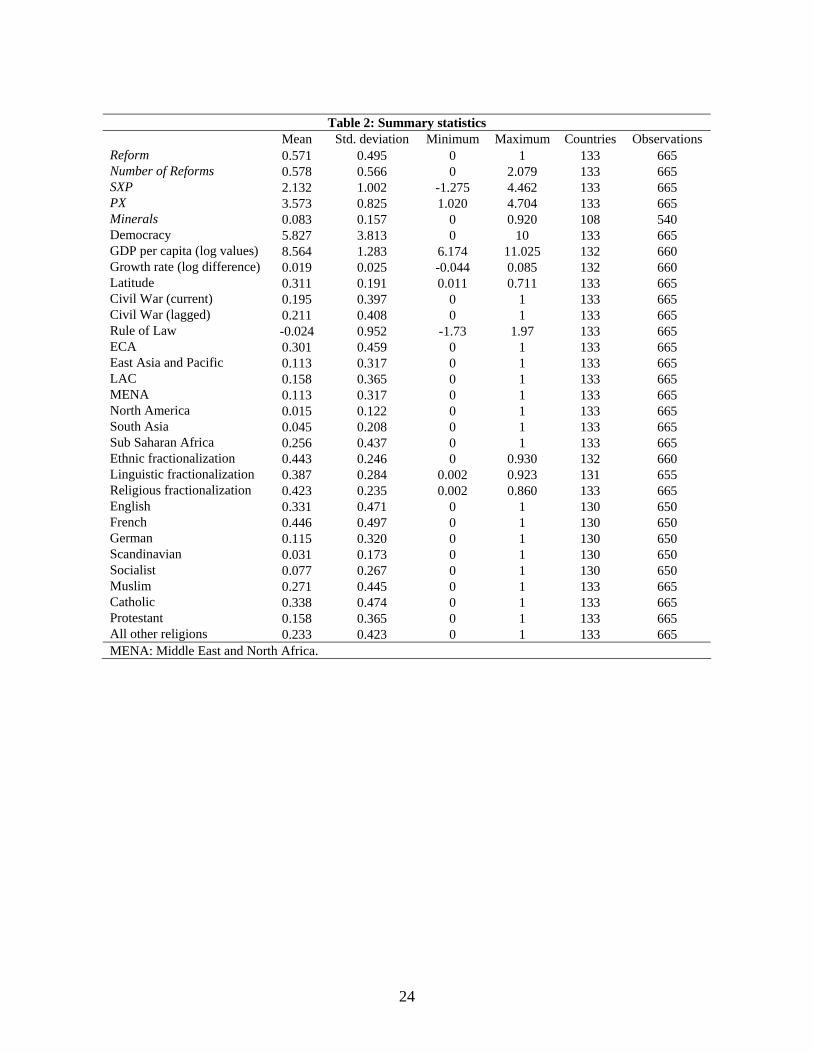
Table 2: Summary statistics
Mean Std. deviation Minimum Maximum Countries Observations Reform 0.571 0.495 0 1 133 665 Number of Reforms 0.578 0.566 0 2.079 133 665 SXP 2.132 1.002 -1.275 4.462 133 665 PX 3.573 0.825 1.020 4.704 133 665 Minerals 0.083 0.157 0 0.920 108 540 Democracy 5.827 3.813 0 10 133 665 GDP per capita (log values) 8.564 1.283 6.174 11.025 132 660 Growth rate (log difference) 0.019 0.025 -0.044 0.085 132 660 Latitude 0.311 0.191 0.011 0.711 133 665 Civil War (current) 0.195 0.397 0 1 133 665 Civil War (lagged) 0.211 0.408 0 1 133 665 Rule of Law -0.024 0.952 -1.73 1.97 133 665 ECA 0.301 0.459 0 1 133 665 East Asia and Pacific 0.113 0.317 0 1 133 665 LAC 0.158 0.365 0 1 133 665 MENA 0.113 0.317 0 1 133 665 North America 0.015 0.122 0 1 133 665 South Asia 0.045 0.208 0 1 133 665 Sub Saharan Africa 0.256 0.437 0 1 133 665 Ethnic fractionalization 0.443 0.246 0 0.930 132 660 Linguistic fractionalization 0.387 0.284 0.002 0.923 131 655 Religious fractionalization 0.423 0.235 0.002 0.860 133 665 English 0.331 0.471 0 1 130 650 French 0.446 0.497 0 1 130 650 German 0.115 0.320 0 1 130 650 Scandinavian 0.031 0.173 0 1 130 650 Socialist 0.077 0.267 0 1 130 650 Muslim 0.271 0.445 0 1 133 665 Catholic 0.338 0.474 0 1 133 665 Protestant 0.158 0.365 0 1 133 665 All other religions 0.233 0.423 0 1 133 665 MENA: Middle East and North Africa.
24
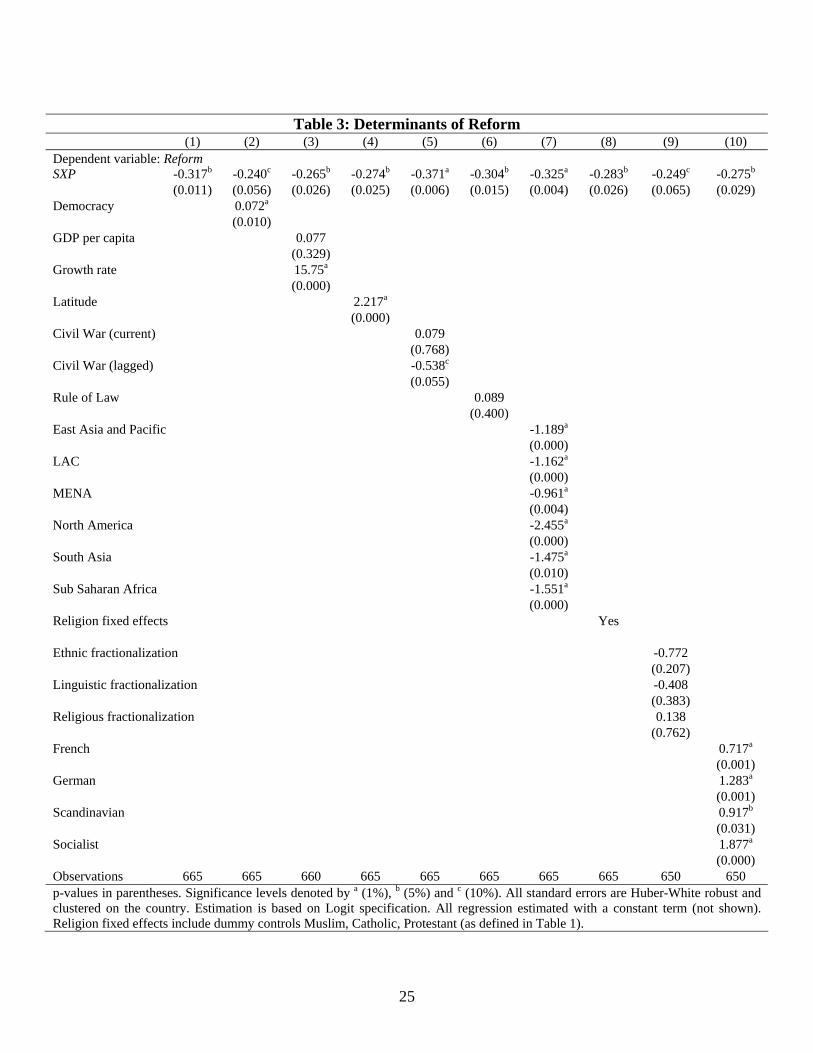
Table 3: Determinants of Reform
(1) (2) (3) (4) (5) (6) (7) (8) (9) (10) Dependent variable: Reform SXP -0.317b -0.240c -0.265b -0.274b -0.371a -0.304b -0.325a -0.283b -0.249c -0.275b (0.011) (0.056) (0.026) (0.025) (0.006) (0.015) (0.004) (0.026) (0.065) (0.029) Democracy 0.072a (0.010) GDP per capita 0.077 (0.329) Growth rate 15.75a (0.000) Latitude 2.217a (0.000) Civil War (current) 0.079 (0.768) Civil War (lagged) -0.538c (0.055) Rule of Law 0.089 (0.400) East Asia and Pacific -1.189a (0.000) LAC -1.162a (0.000) MENA -0.961a (0.004) North America -2.455a (0.000) South Asia -1.475a (0.010) Sub Saharan Africa -1.551a (0.000) Religion fixed effects Yes Ethnic fractionalization -0.772 (0.207) Linguistic fractionalization -0.408 (0.383) Religious fractionalization 0.138 (0.762) French 0.717a (0.001) German 1.283a (0.001) Scandinavian 0.917b (0.031) Socialist 1.877a (0.000) Observations 665 665 660 665 665 665 665 665 650 650 p-values in parentheses. Significance levels denoted by a (1%), b (5%) and c (10%). All standard errors are Huber-White robust and clustered on the country. Estimation is based on Logit specification. All regression estimated with a constant term (not shown). Religion fixed effects include dummy controls Muslim, Catholic, Protestant (as defined in Table 1).
25

Table 4: Robustness of Reforms Variable
(1) (2) (3) (4) (5) (6) (7) (8) (9) (10) Dependent variable: Number of Reforms SXP -0.091a -0.074b -0.073b -0.078b -0.104a -0.091a -0.089a -0.079b -0.068c -0.073b (0.006) (0.031) (0.015) (0.013) (0.002) (0.005) (0.002) (0.018) (0.053) (0.025) Democracy 0.015c (0.073) GDP per capita 0.009 (0.661) Growth rate 4.818a (0.000) Latitude 0.533a (0.000) Civil War (current) 0.037 (0.731) Civil War (lagged) -0.160 (0.133) Rule of Law -0.002 (0.937) East Asia and Pacific -0.301a (0.000) LAC -0.281a (0.001) MENA -0.242b (0.012) North America -0.645a (0.000) South Asia -0.402a (0.006) Sub Saharan Africa -0.375a (0.000) Religion fixed effects Yes Ethnic fractionalization -0.171 (0.300) Linguistic fractionalization -0.164 (0.215) Religious fractionalization 0.113 (0.378) French 0.206a (0.001) German 0.394a (0.000) Scandinavian 0.177 (0.156) Socialist 0.554a (0.000) R-squared 0.026 0.035 0.072 0.057 0.035 0.026 0.107 0.044 0.042 0.104 Observations 665 665 660 665 665 665 665 665 650 650 p-values in parentheses. Significance levels denoted by a (1%), b (5%) and c (10%). All standard errors are Huber-White robust and clustered on the country. Estimation method used is OLS. All regression estimated with a constant term (not shown). Religion fixed effects include dummy controls Muslim, Catholic, Protestant (as defined in Table 1).
26

Table 5: Robustness of Natural Resource Abundance Variable
(1) (2) (3) (4) (5) (6) (7) (8) (9) (10) Dependent variable: Reform PX -0.445a -0.327b -0.313b -0.288b -0.456a -0.463a -0.265b -0.414a -0.353b -0.380a (0.001) (0.020) (0.033) (0.026) (0.001) (0.002) (0.038) (0.004) (0.023) (0.004) Democracy 0.062b (0.035) GDP per capita 0.005 (0.954) Growth rate 14.87a (0.000) Latitude 1.948a (0.000) Civil War (current) 0.152 (0.591) Civil War (lagged) -0.400 (0.173) Rule of Law -0.034 (0.769) East Asia and Pacific -1.252a (0.000) LAC -1.041a (0.000) MENA -1.004a (0.007) North America -2.205a (0.000) South Asia -1.236b (0.025) Sub Saharan Africa -1.389a (0.000) Religion fixed effects Yes Ethnic fractionalization -0.450 (0.501) Linguistic fractionalization -0.452 (0.346) Religious fractionalization 0.027 (0.951) French 0.791a (0.000) German 1.115a (0.004) Scandinavian 0.789c (0.076) Socialist 1.842a (0.000) Observations 665 665 660 665 665 665 665 665 650 650 p-values in parentheses. Significance levels denoted by a (1%), b (5%) and c (10%). All standard errors are Huber-White robust and clustered on the country. Estimation is based on Logit specification. All regression estimated with a constant term (not shown). Religion fixed effects include dummy controls Muslim, Catholic, Protestant (as defined in Table 1).
27

28
Table 6: Robustness of Natural Resource Abundance Variable
(1) (2) (3) (4) (5) (6) (7) (8) (9) (10) Dependent variable: Reform Minerals -1.941c -1.287 -1.899c -1.705c -1.982c -1.811c -2.208b -2.033c -1.797c -1.717 (0.075) (0.240) (0.066) (0.092) (0.069) (0.071) (0.032) (0.071) (0.058) (0.119) Democracy 0.065b (0.031) GDP per capita 0.103 (0.152) Growth rate 5.862 (0.170) Latitude 1.230b (0.039) Civil War (current) -0.099 (0.696) Civil War (lagged) -0.067 (0.796) Rule of Law 0.216b (0.031) East Asia and Pacific -1.070a (0.002) LAC -0.850b (0.012) MENA -0.189 (0.677) North America -1.763a (0.000) South Asia -0.754 (0.246) Sub Saharan Africa -1.112a (0.001) Religion fixed effects Yes Ethnic fractionalization -0.351 (0.556) Linguistic fractionalization -0.340 (0.467) Religious fractionalization -0.657 (0.137) French 0.612a (0.006) German 0.484 (0.171) Scandinavian 0.804b (0.046) Observations 540 540 535 540 540 540 540 540 520 540 p-values in parentheses. Significance levels denoted by a (1%), b (5%) and c (10%). All standard errors are Huber-White robust and clustered on the country. Estimation is based on Logit specification. All regression estimated with a constant term (not shown). Religion fixed effects include dummy controls Muslim, Catholic, Protestant (as defined in Table 1).