Embed Size (px)
Citation preview
Natural Natural Resources Resources and and Economic Economic GrowthGrowth: What : What Are the Are the Issues?Issues?
Thorvaldur Gylfason
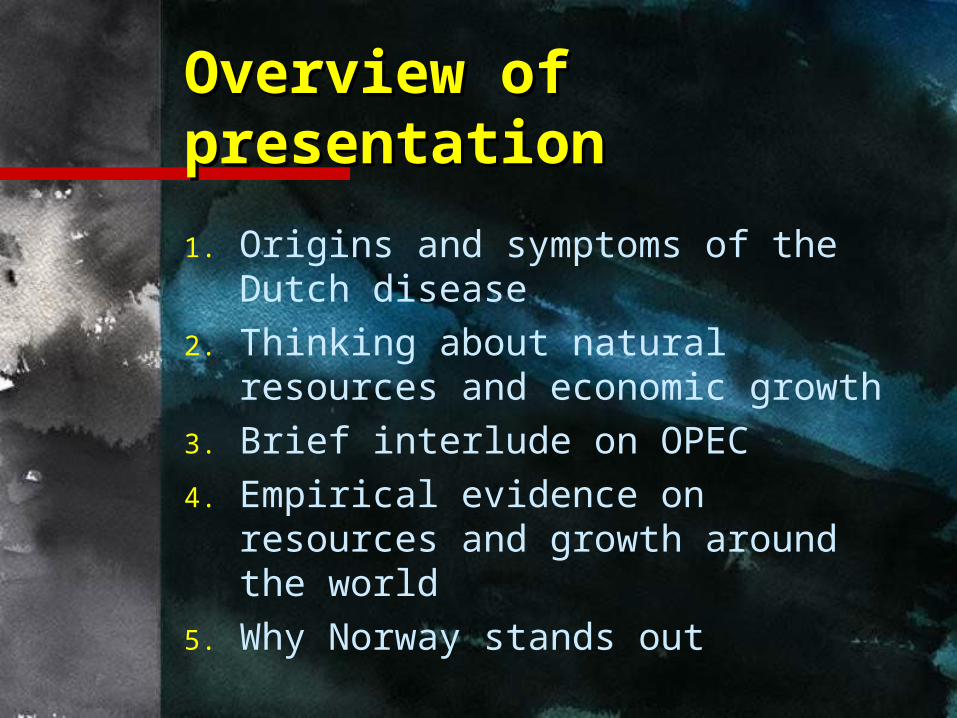
Overview of Overview of presentationpresentation
1. Origins and symptoms of the Dutch disease
2. Thinking about natural resources and economic growth
3. Brief interlude on OPEC4. Empirical evidence on resources
and growth around the world5. Why Norway stands out
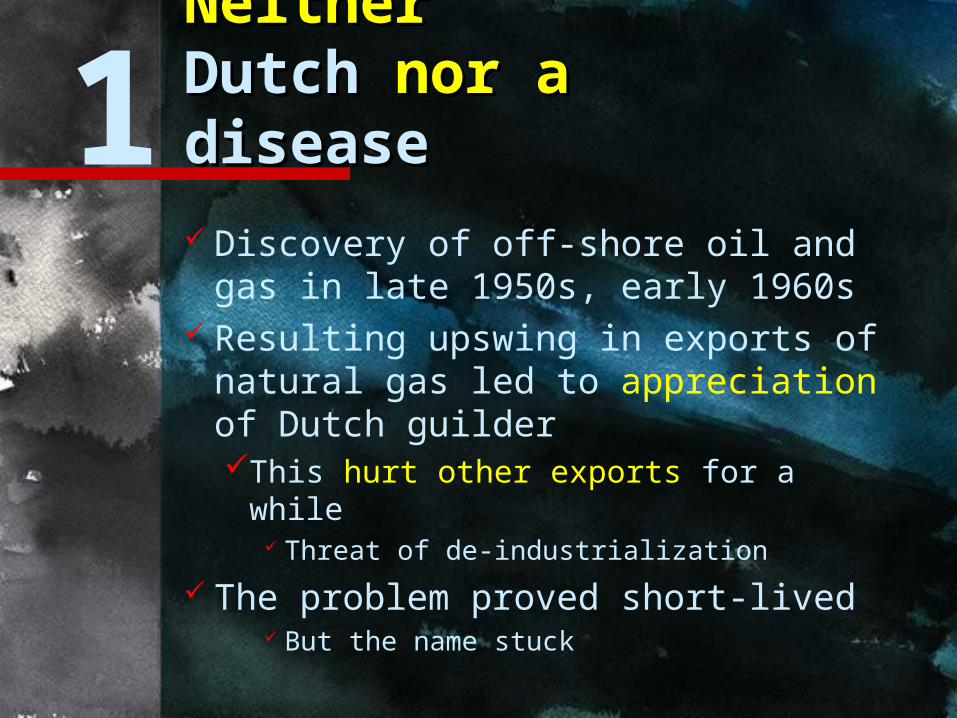
Neither Neither DutchDutch nor a nor a diseasedisease
Discovery of off-shore oil and gas in late 1950s, early 1960s
Resulting upswing in exports of natural gas led to appreciation of Dutch guilderThis hurt other exports for a while
Threat of de-industrialization
The problem proved short-lived But the name stuck
1
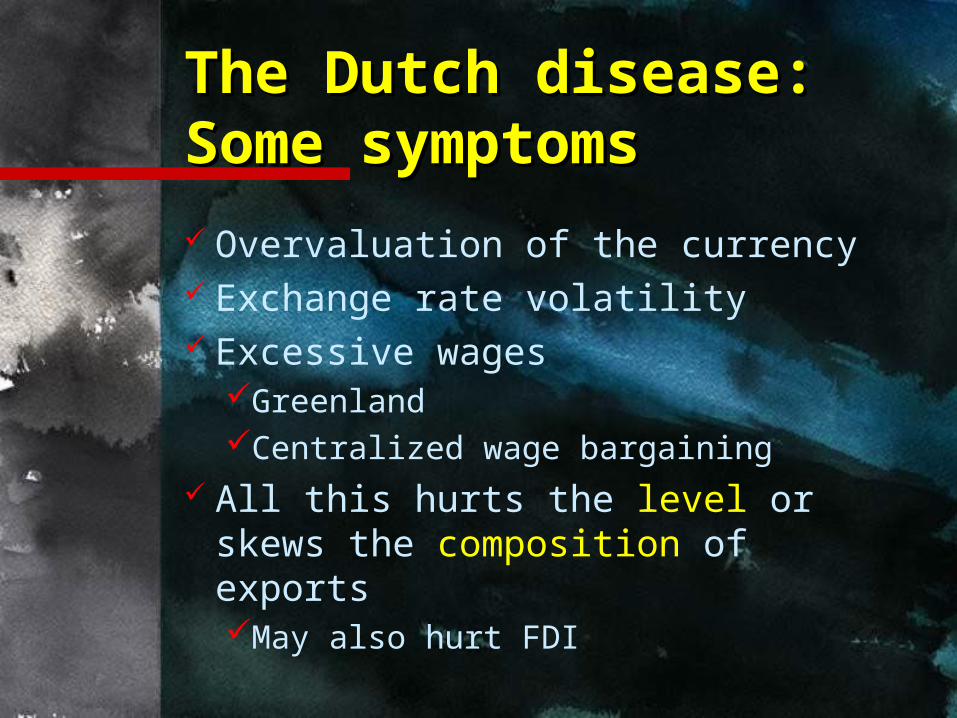
The The Dutch diseaseDutch disease: : Some symptomsSome symptoms
Overvaluation of the currency Exchange rate volatility Excessive wages
GreenlandCentralized wage bargaining
All this hurts the level or skews the composition of exportsMay also hurt FDI
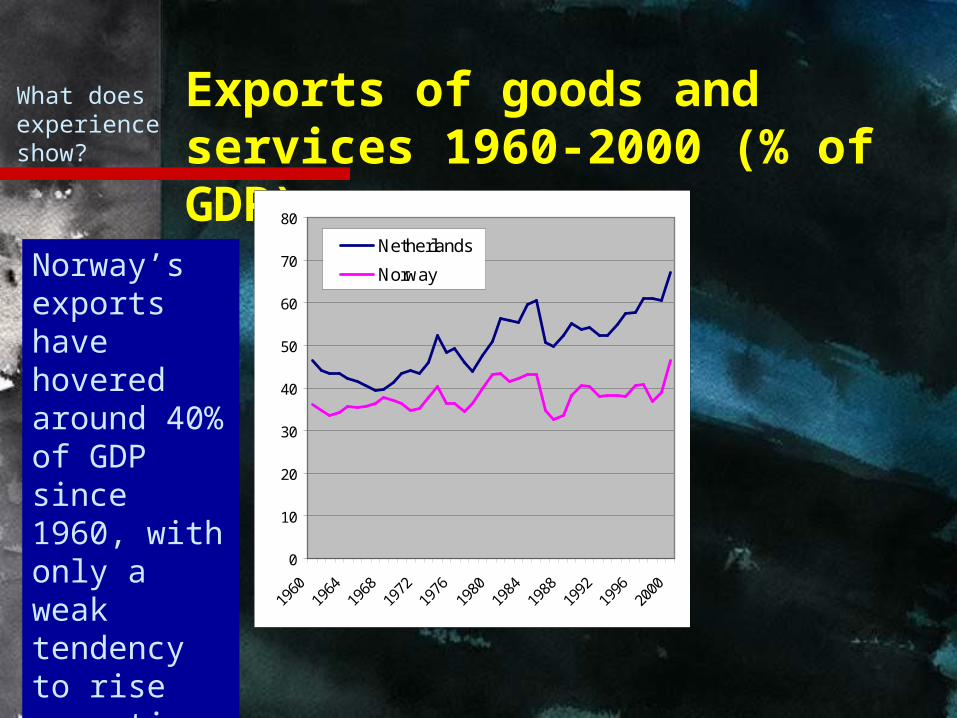
Exports of goods and services 1960-2000 (% of GDP)
What does experience show?
Norway’s exports have hovered around 40% of GDP since 1960, with only a weak tendency to rise over time
0
10
20
30
40
50
60
70
80
1960
1964
1968
1972
1976
1980
1984
1988
1992
1996
2000
Netherlands
Norway
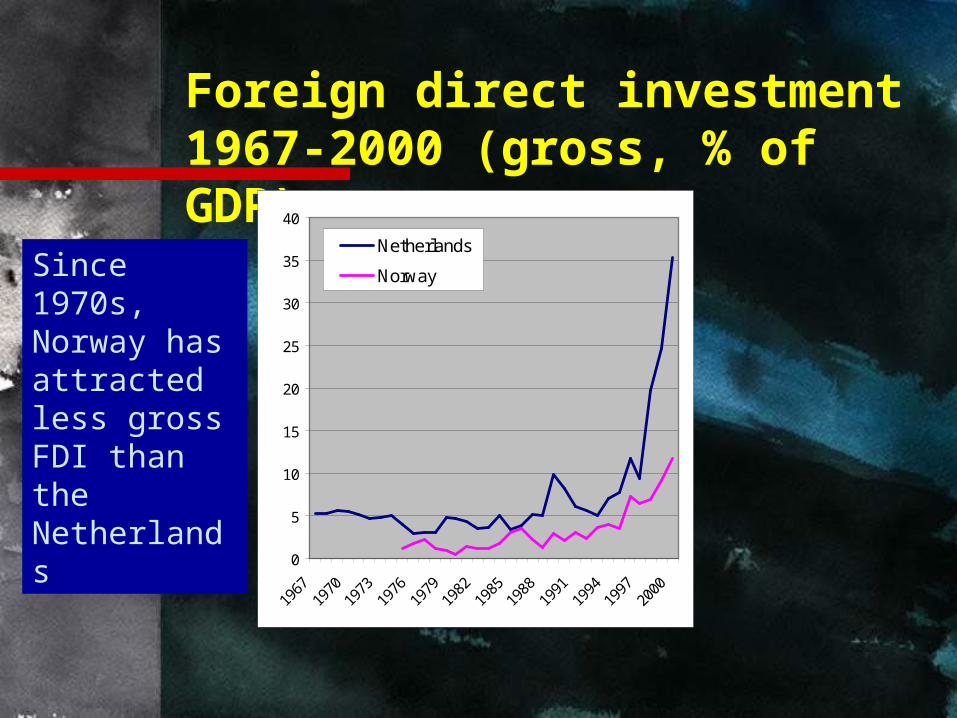
Foreign direct investment 1967-2000 (gross, % of GDP)
Since 1970s, Norway has attracted less gross FDI than the Netherlands
0
5
10
15
20
25
30
35
40
1967
1970
1973
1976
1979
1982
1985
1988
1991
1994
1997
2000
Netherlands
Norway
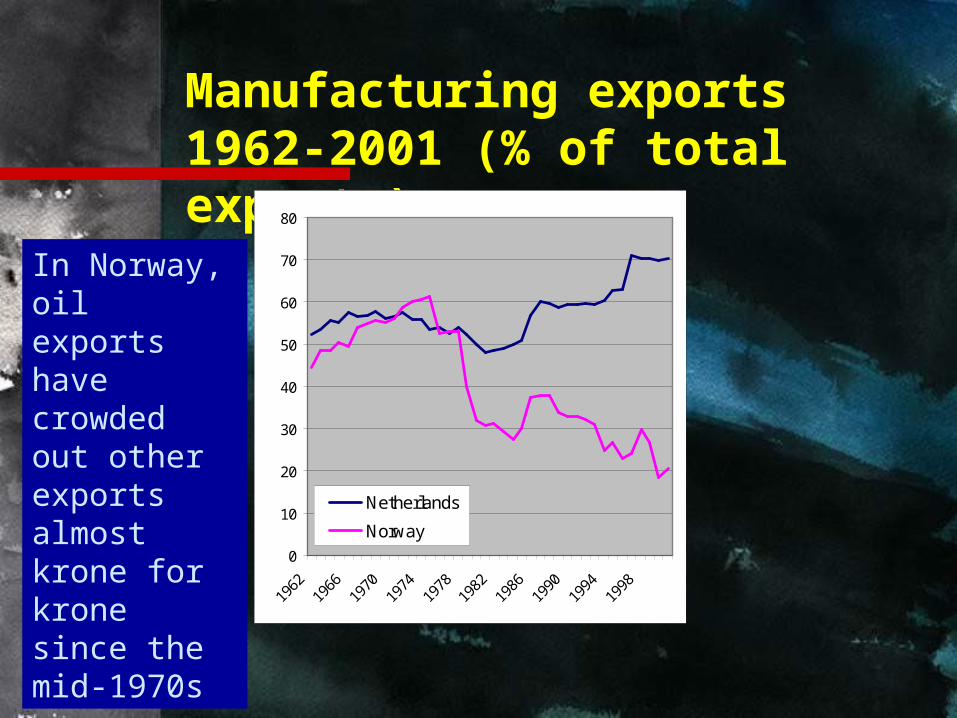
Manufacturing exports 1962-2001 (% of total exports)
In Norway, oil exports have crowded out other exports almost krone for krone since the mid-1970s
0
10
20
30
40
50
60
70
80
1962
1966
1970
1974
1978
1982
1986
1990
1994
1998
Netherlands
Norway

Why these things Why these things may be importantmay be important
Exports and FDI are good for growthOpennessOpenness to trade and investment to trade and investment
stimulates imports of goods and stimulates imports of goods and services, technology, ideas, know-services, technology, ideas, know-howhow
Too much primary export dependence and too little manufacturing may hurt growth
Economic growth is keygrowth is key
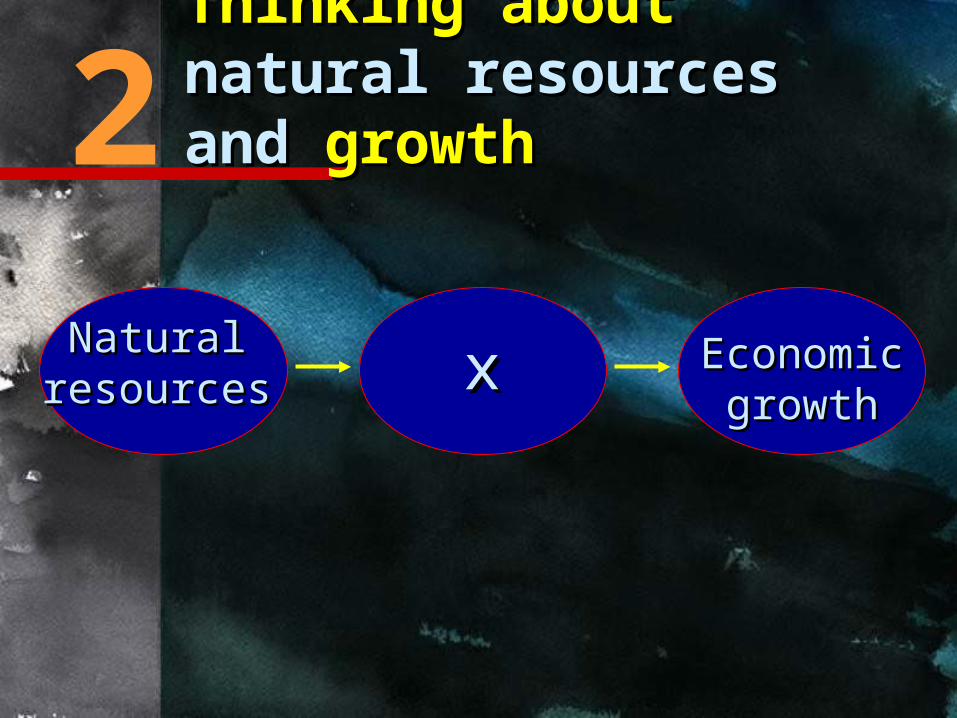
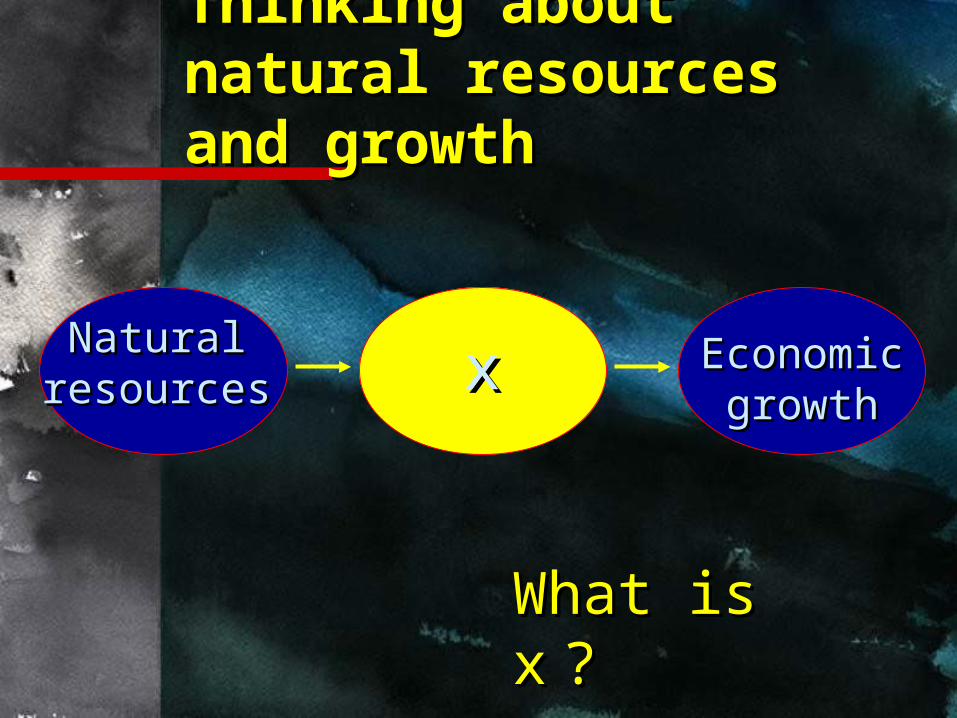
Thinking about Thinking about natural resources natural resources andand growth growth
NaturalNaturalresourcesresources
EconomicEconomicgrowthgrowth
xx
2
Thinking about Thinking about natural resources natural resources and growthand growth
NaturalNaturalresourcesresources
EconomicEconomicgrowthgrowth
xx
What is What is xx ??
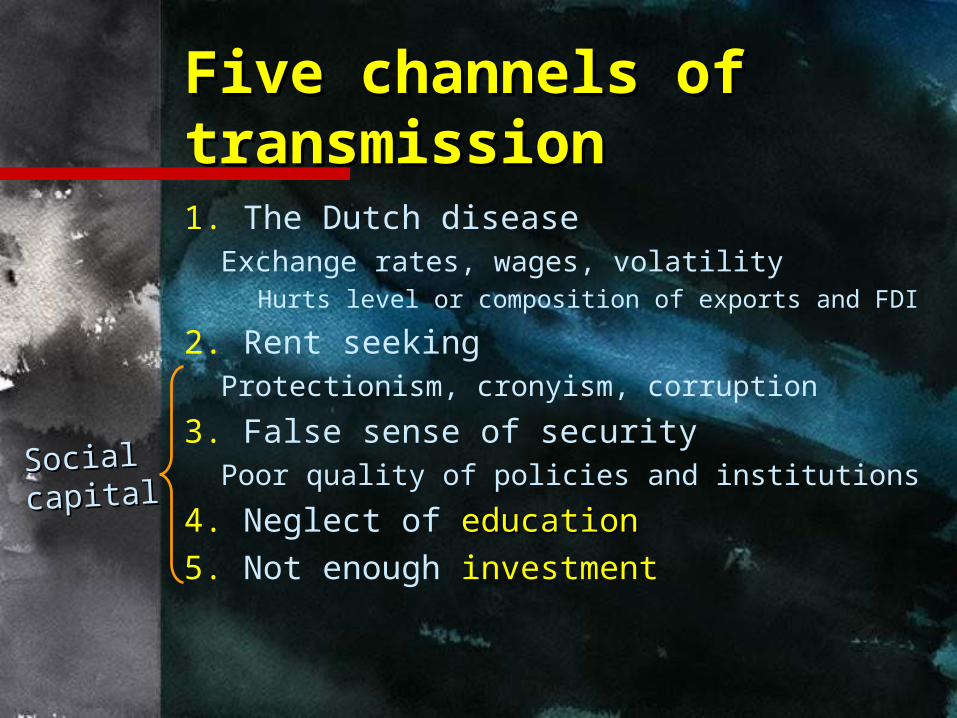
Five channels of Five channels of transmissiontransmission1. The Dutch disease
Exchange rates, wages, volatilityHurts level or composition of exports and FDI
2. Rent seekingProtectionism, cronyism, corruption
3. False sense of securityPoor quality of policies and institutions
4. Neglect of educationeducation5. Not enough investment
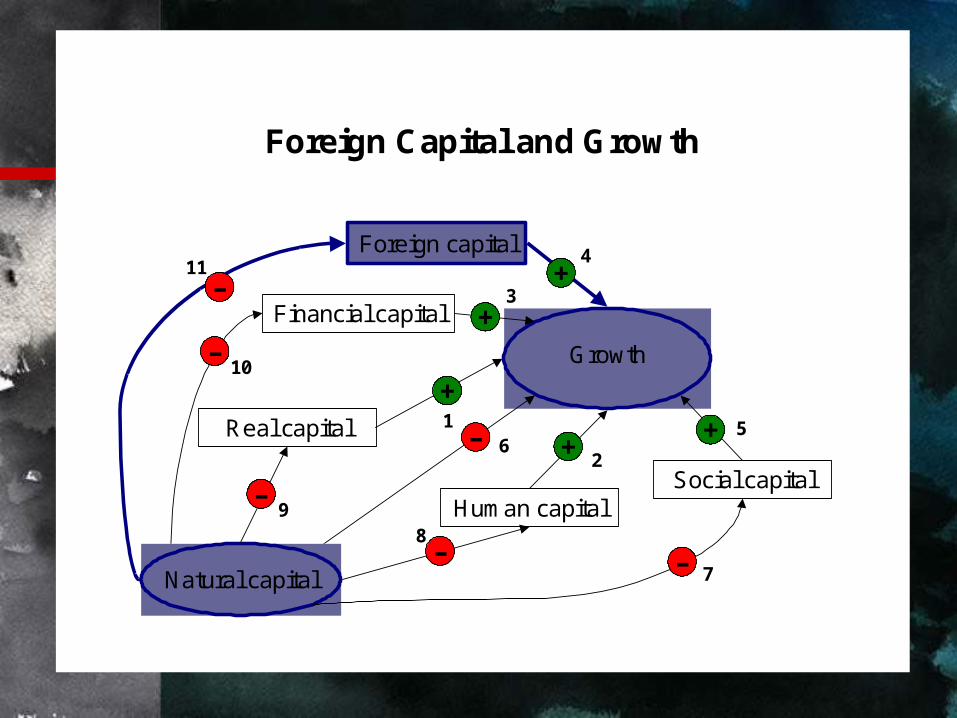
SocialSocialcapitalcapital
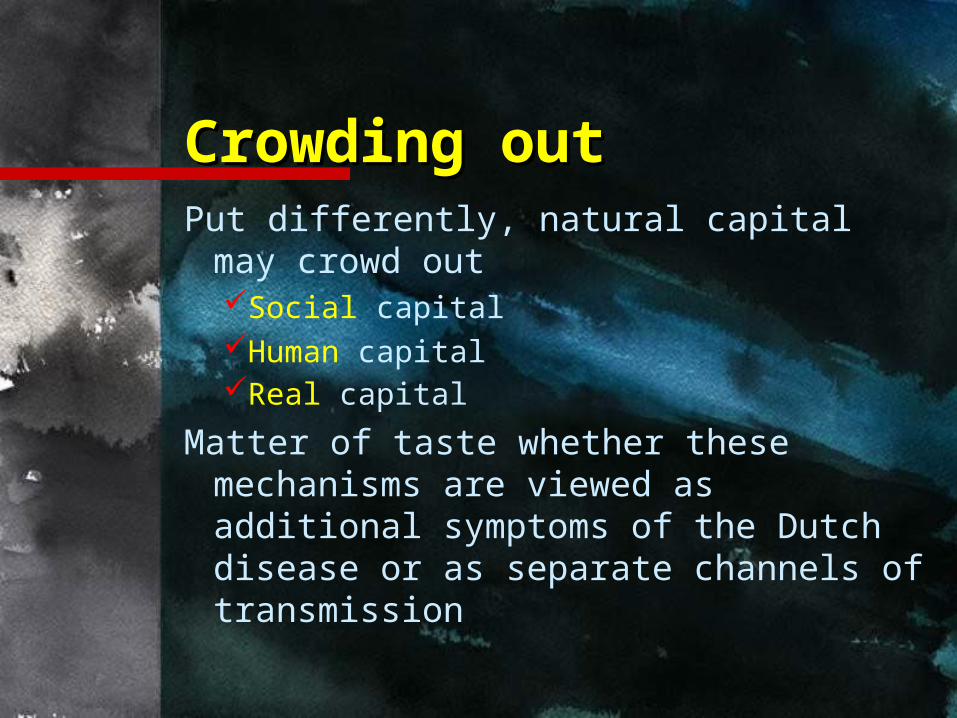
Crowding outCrowding outPut differently, natural capital may
crowd outSocial capitalHuman capitalReal capital
Matter of taste whether these mechanisms are viewed as additional symptoms of the Dutch disease or as separate channels of transmission
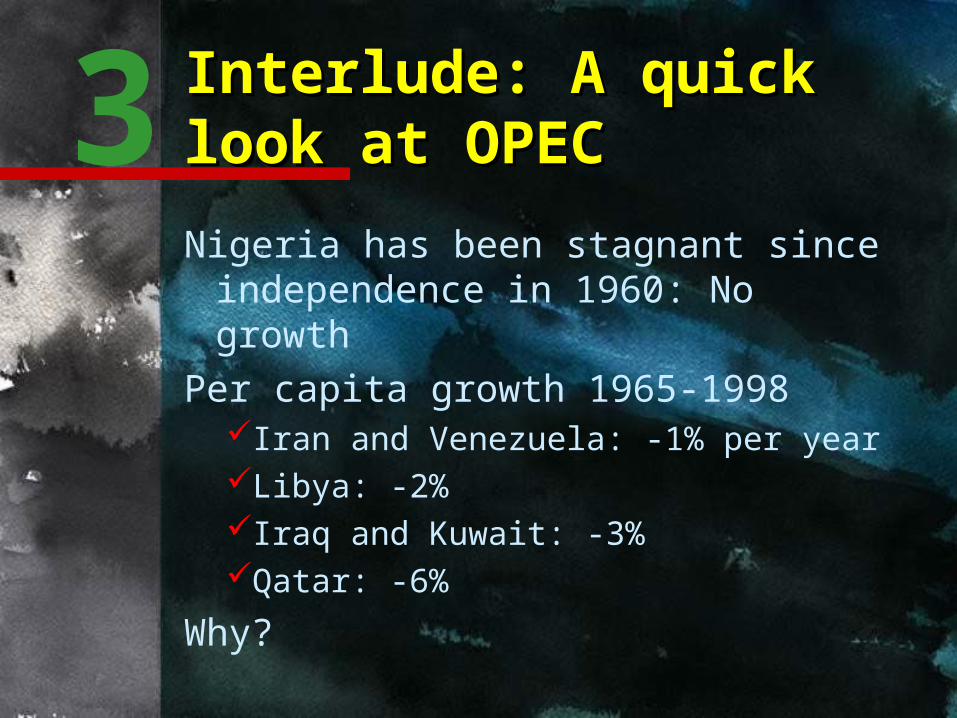
Interlude: A quick Interlude: A quick look at OPEClook at OPEC
Nigeria has been stagnant since independence in 1960: No growth
Per capita growth 1965-1998Iran and Venezuela: -1% per yearLibya: -2%Iraq and Kuwait: -3%Qatar: -6%
Why?
3
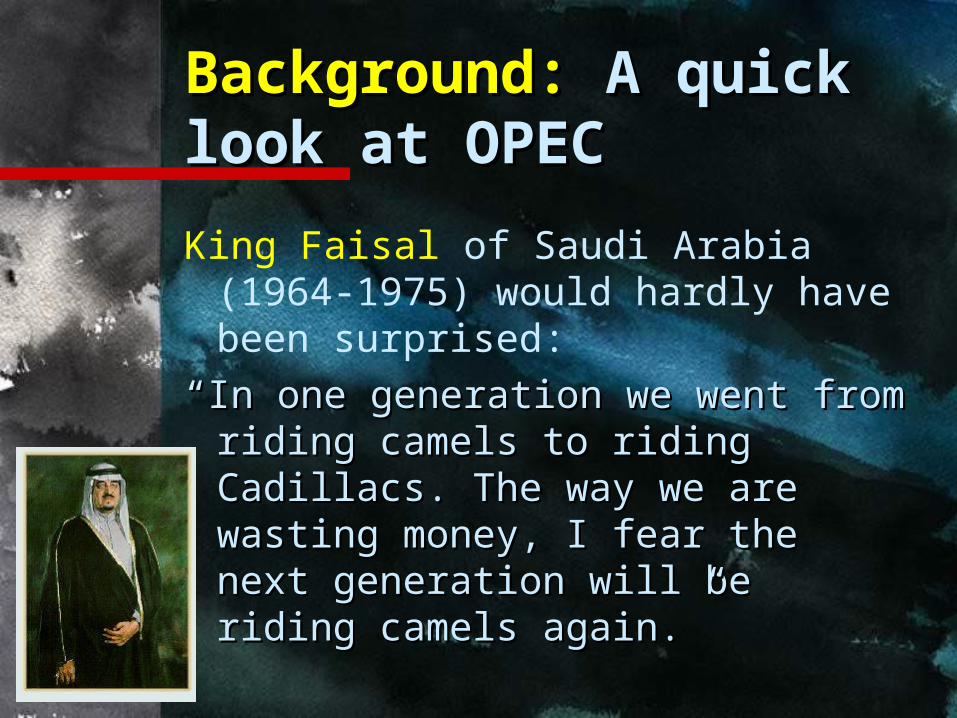
Background: Background: A A quick look at OPECquick look at OPEC
King Faisal of Saudi Arabia (1964-1975) would hardly have been surprised:
““In one generation we went from In one generation we went from riding camels to riding Cadillacs. riding camels to riding Cadillacs. The way we are wasting money, I The way we are wasting money, I fear the next generation will be fear the next generation will be riding camels again.”riding camels again.”
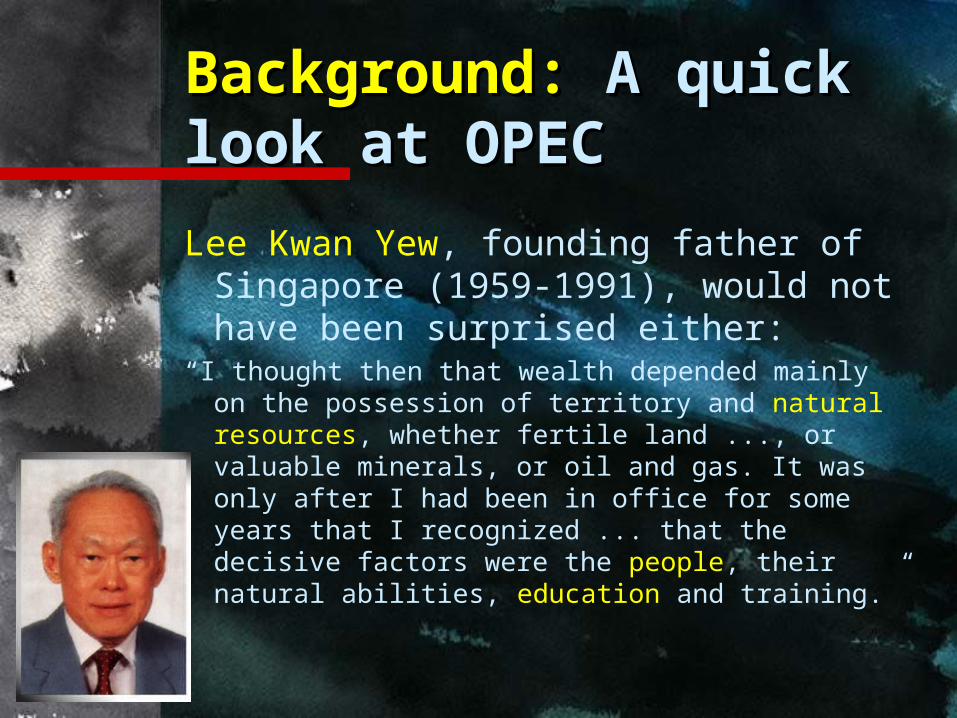
Background: Background: A A quick look at OPECquick look at OPEC
Lee Kwan Yew, founding father of Singapore (1959-1991), would not have been surprised either:
“I thought then that wealth depended mainly on the possession of territory and natural resources, whether fertile land ..., or valuable minerals, or oil and gas. It was only after I had been in office for some years that I recognized ... that the decisive factors were the people, their natural abilities, education and training.”
Increasing Increasing awareness thatawareness that oil oil brings risksbrings risks
If ... oil revenue is managed well, it can educate, heal and provide jobs for ... the people. But oil brings risks as well as benefits. Rarely have developing countries used oil money to improve the lives of the majority of citizens or bring steady economic growth. More often, oil revenues have caused crippling economic distortions and been spent on showy projects, weapons and Paris shopping trips for government officials.
New York Times, 1 August 2000.
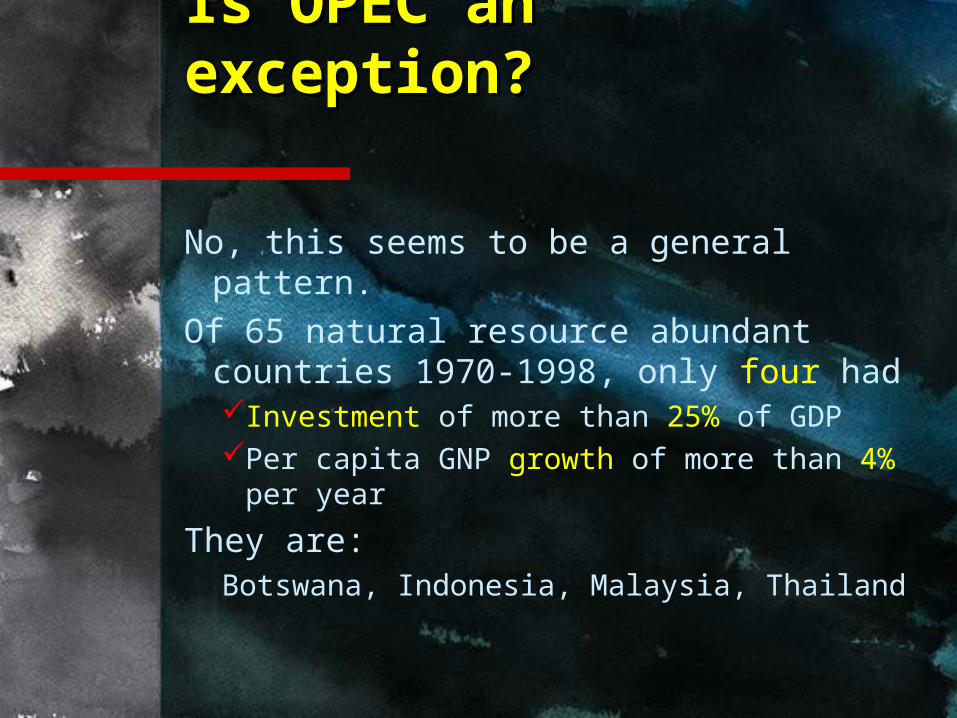
Is OPEC an Is OPEC an exception?exception?
No, this seems to be a general pattern.
Of 65 natural resource abundant countries 1970-1998, only four hadInvestment of more than 25% of GDPPer capita GNP growth of more than
4% per year
They are:Botswana, Indonesia, Malaysia, Thailand
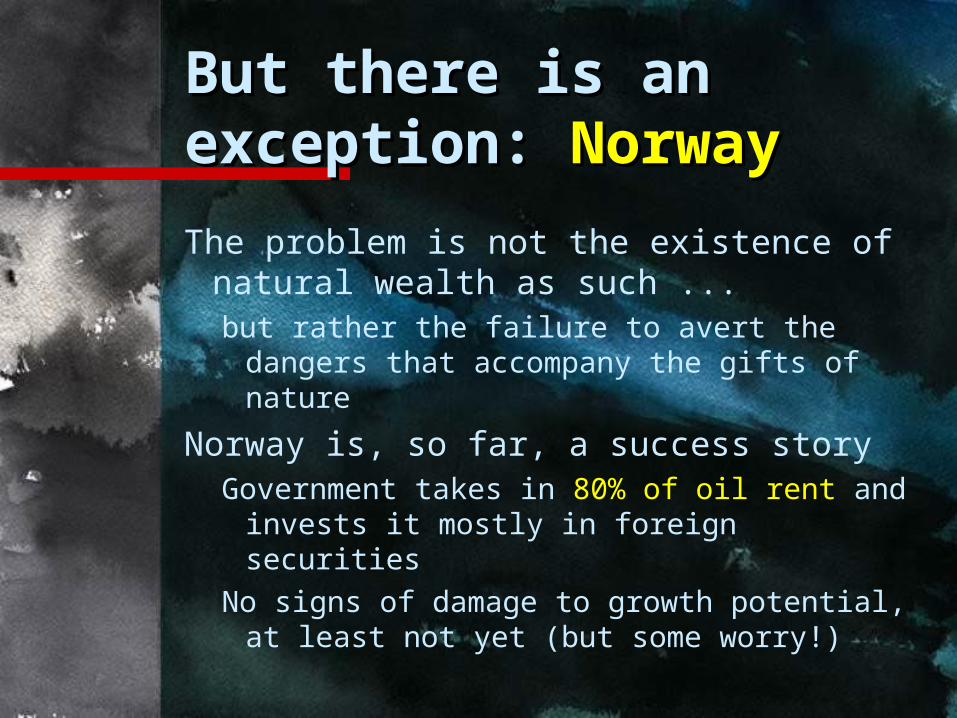
But there is an But there is an exception:exception: Norway Norway
The problem is not the existence of natural wealth as such ... but rather the failure to avert the
dangers that accompany the gifts of nature
Norway is, so far, a success storyGovernment takes in 80% of oil rent and
invests it mostly in foreign securitiesNo signs of damage to growth potential,
at least not yet (but some worry!)
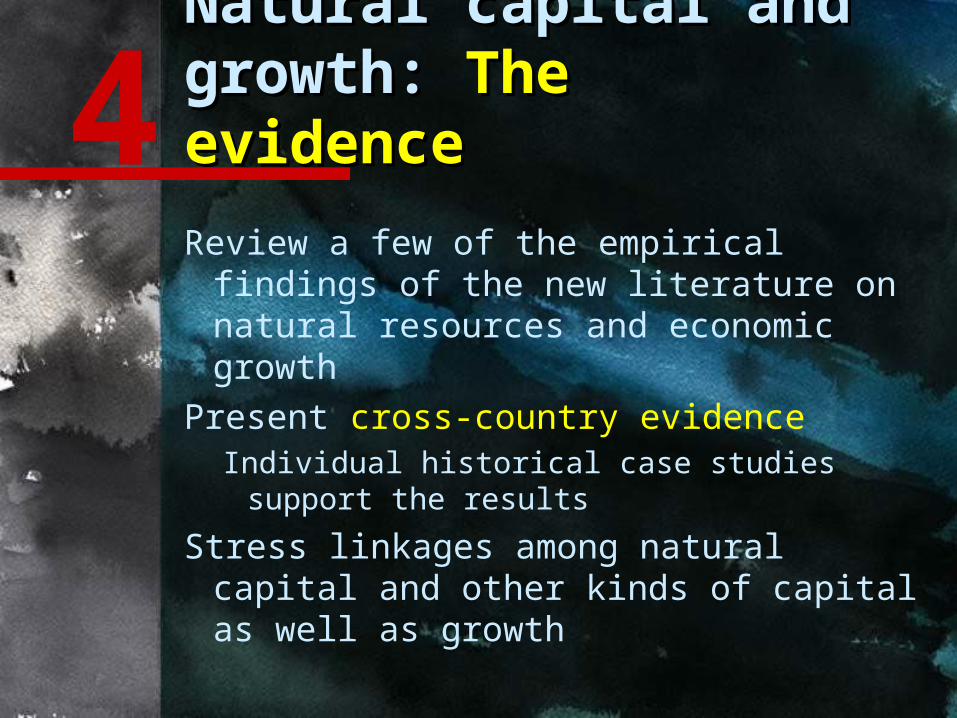
Natural capital and Natural capital and growth:growth: The The evidenceevidence
Review a few of the empirical findings of the new literature on natural resources and economic growth
Present cross-country evidenceIndividual historical case studies support
the results
Stress linkages among natural capital and other kinds of capital as well as growth
4
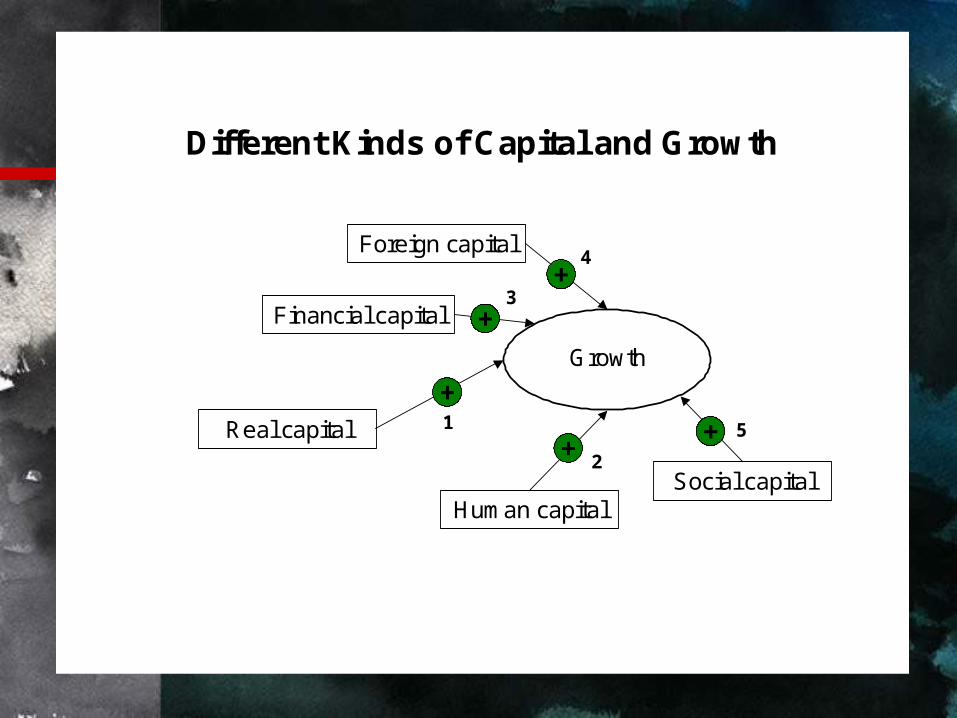
Different Kinds of Capital and Growth
Foreign capital
Financial capital
Human capitalSocial capital
Growth
Real capital
3
1
4
5
2
+
+
+
+
+
Different Kinds of Capital and Growth
Foreign capital
Financial capital
Human capitalSocial capital
Growth
Real capital
7
11
3
1
4
5
2
98
10
+
+
+
+
+
–
– 6
Natural capital
–
–
–
–
Foreign capital
Financial capital
Human capitalSocial capital
Real capital
7
11
3
1
4
5
2
98
10
+
+
+
+
+
–
– 6
Natural capital
–
–
–
–
Growth
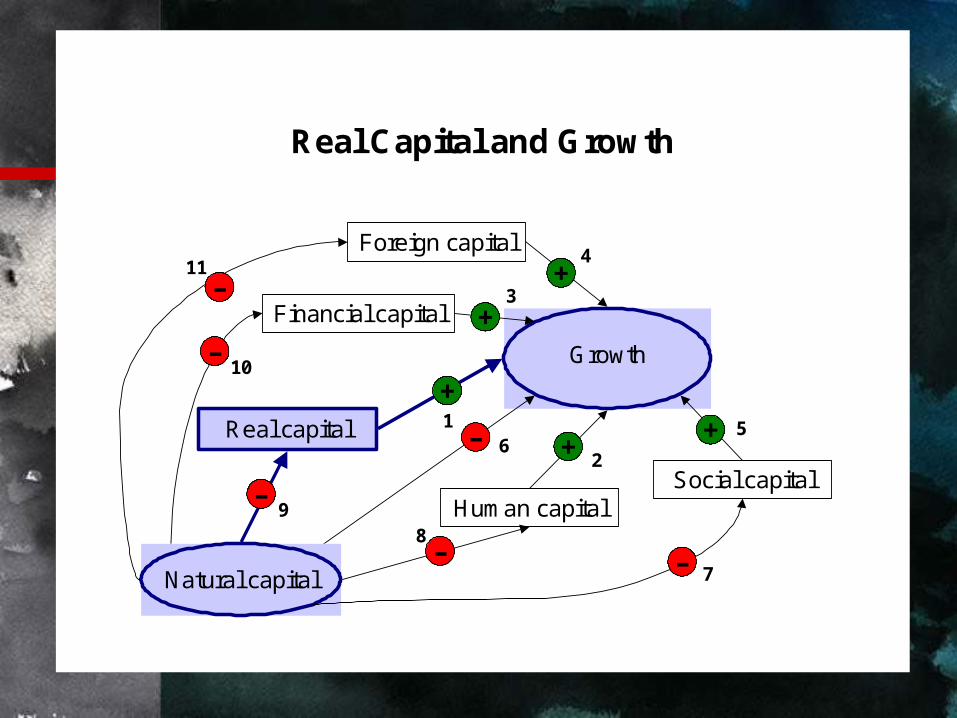
Real Capital and Growth
Foreign capital
Financial capital
Human capitalSocial capital
Real capital
7
11
3
1
4
5
2
98
10
+
+
+
+
+
–
– 6
Natural capital
–
–
–
–
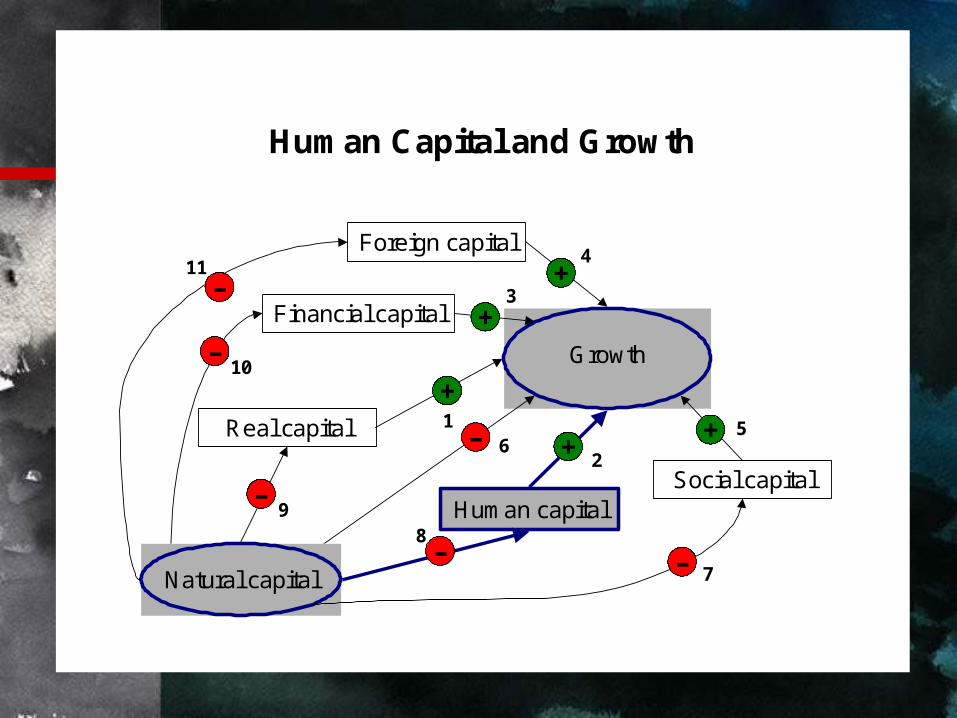
Human Capital and Growth
Growth
Foreign capital
Financial capital
Human capitalSocial capital
Real capital
7
11
3
1
4
5
2
98
10
+
+
+
+
+
–
– 6
Natural capital
–
–
–
–
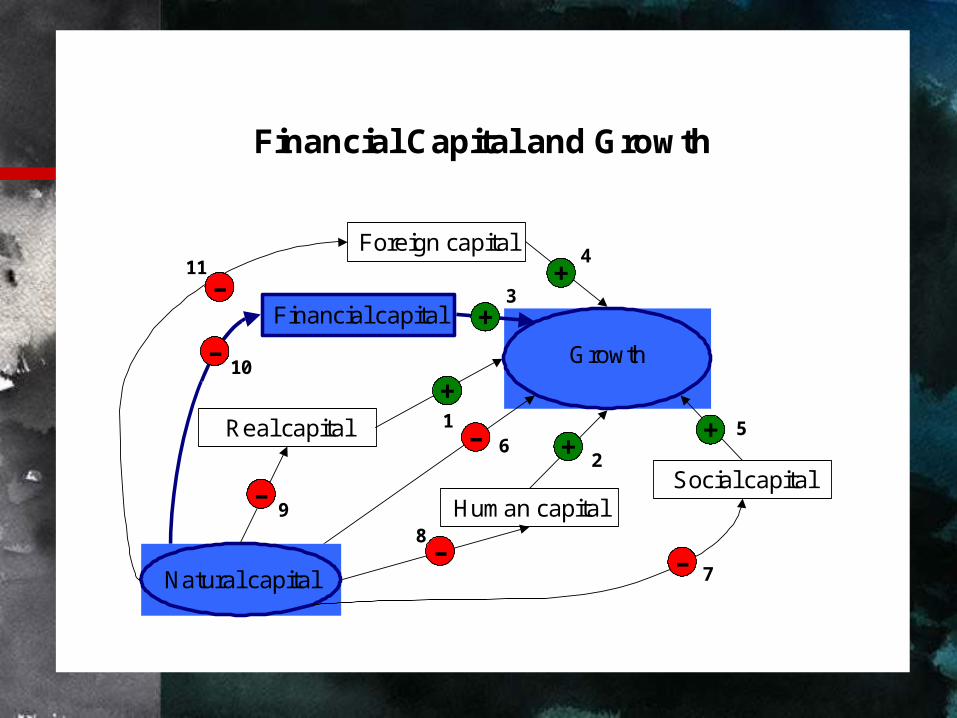
Financial Capital and Growth
Growth
Foreign capital
Financial capital
Human capitalSocial capital
Real capital
7
11
3
1
4
5
2
98
10
+
+
+
+
+
–
– 6
Natural capital
–
–
–
–
Social Capital and Growth
Growth
Foreign capital
Financial capital
Human capitalSocial capital
Real capital
7
11
3
1
4
5
2
98
10
+
+
+
+
+
–
– 6
Natural capital
–
–
–
–
Foreign Capital and Growth
Growth
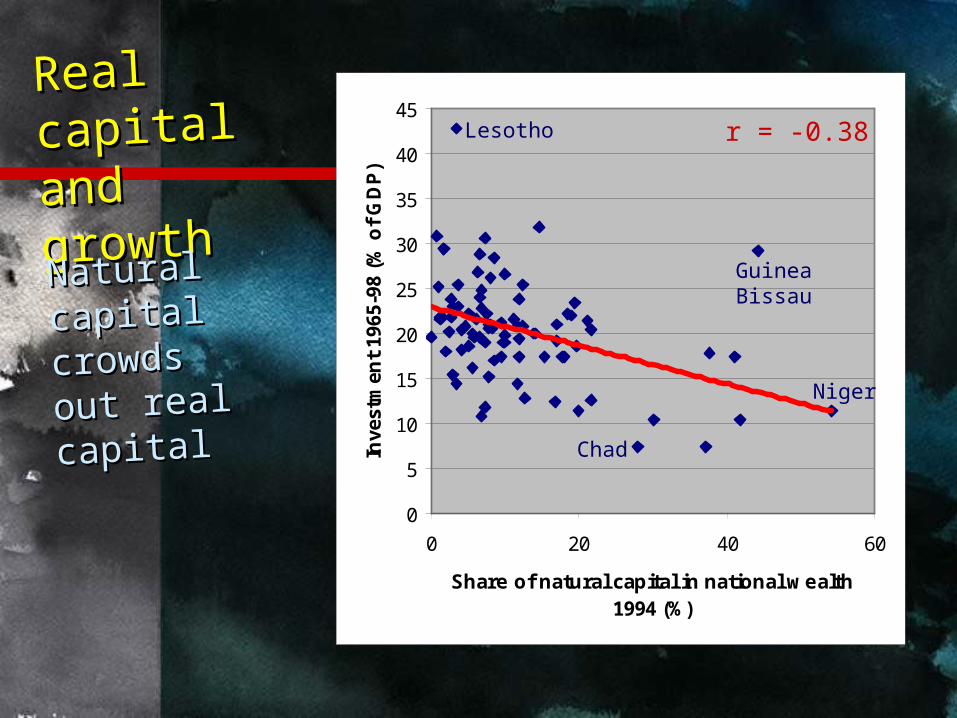
Real Real capital capital and and growthgrowthNatural Natural capital capital crowds crowds out real out real capitalcapital
0
5
10
15
20
25
30
35
40
45
0 20 40 60
Share of natural capital in national wealth 1994 (%)
Inve
stm
ent
1965
-98
(% o
f G
DP
)
r = -0.38
Niger
Chad
Lesotho
Guinea Bissau
-8
-6
-4
-2
0
2
4
6
0 5 10 15 20 25 30 35
Investment 1965-98 (% of GDP)
Gro
wth
of
GN
P p
er c
apit
a 19
65-9
8, a
dju
sted
fo
r in
itia
l in
com
e (%
per
yea
r)
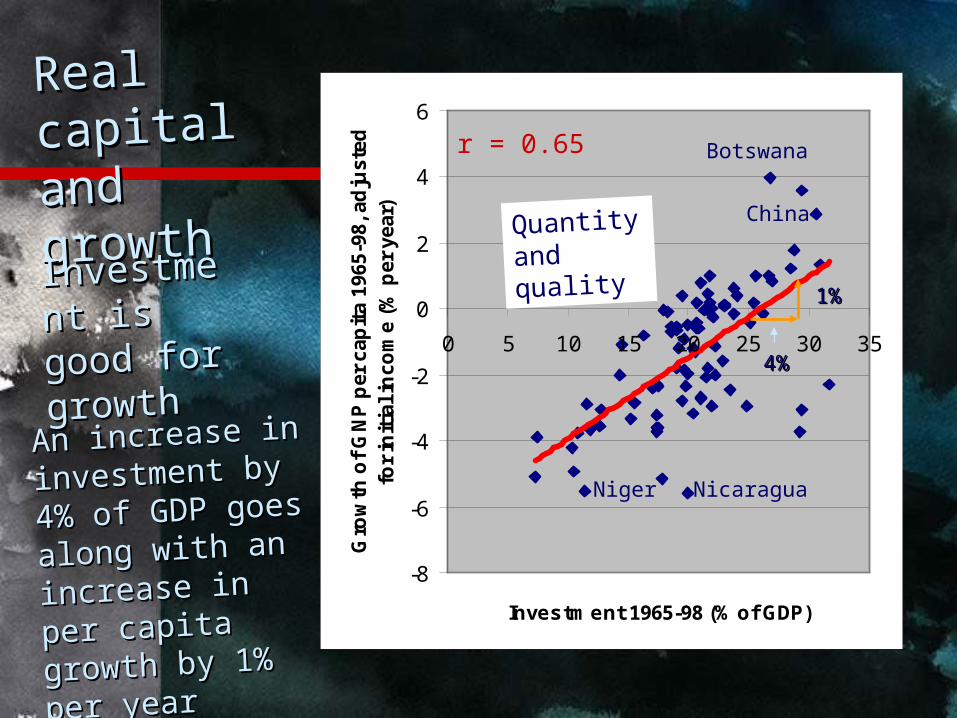
Real Real capital capital and and growthgrowth
Botswana
China
NicaraguaNiger
InvestmeInvestment is good nt is good
for growthfor growth
r = 0.65
An increase in An increase in
investment by investment by
4% of GDP goes 4% of GDP goes
along with an along with an
increase in per increase in per
capita growth by capita growth by
1% per year 1% per year
4%4%
1%1%
Quantity and quality

Interpretation of Interpretation of resultsresults
Growth
Investment
Growth
Resources
Investment
Resources
+ =
Human Human capital and capital and
growthgrowth
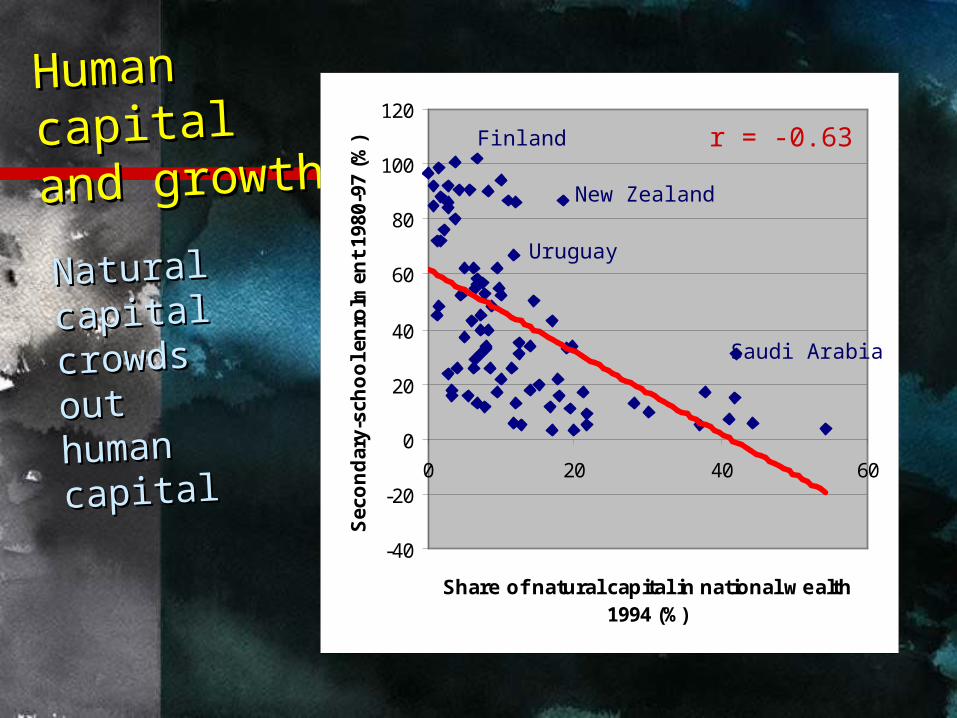
Natural Natural capital capital crowds crowds out out human human capitalcapital
-40
-20
0
20
40
60
80
100
120
0 20 40 60
Share of natural capital in national wealth 1994 (%)
Sec
on
dar
y-sc
ho
ol e
nro
lmen
t 19
80-9
7 (%
) r = -0.63
Uruguay
New Zealand
Saudi Arabia
Finland
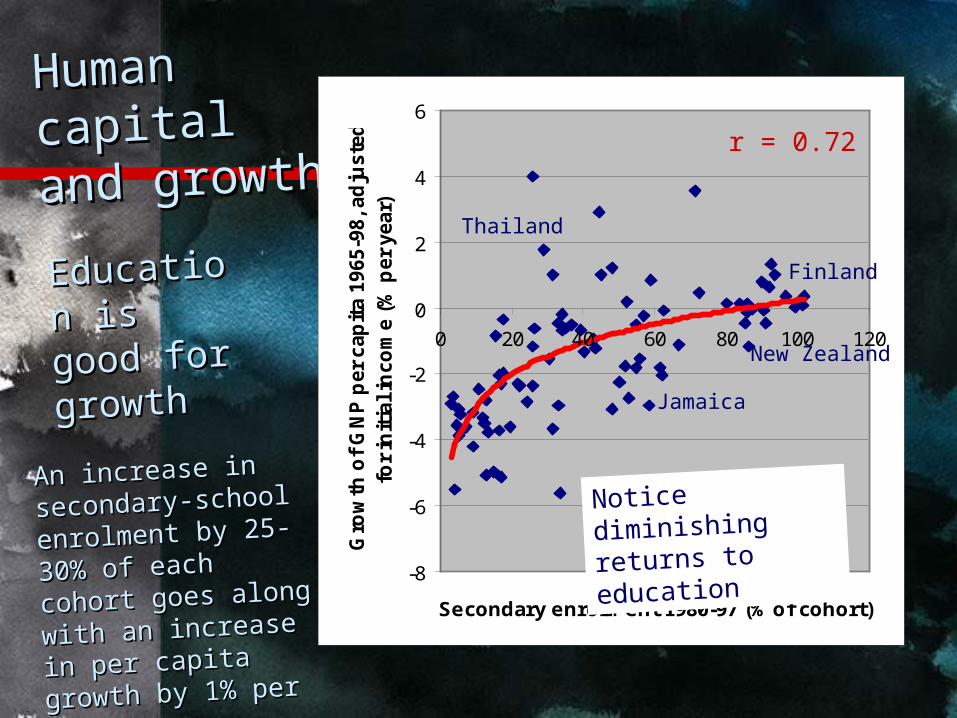
Human Human capital and capital and
growthgrowth
-8
-6
-4
-2
0
2
4
6
0 20 40 60 80 100 120
Secondary enrolment 1980-97 (% of cohort)
Gro
wth
of
GN
P p
er
cap
ita 1
965-9
8, ad
juste
d
for
init
ial in
co
me (
% p
er
year)
Finland
Thailand
New Zealand
Jamaica
EducatioEducation is good n is good
for for growthgrowth
r = 0.72
An increase in An increase in
secondary-school secondary-school
enrolment by 25-enrolment by 25-
30% of each cohort 30% of each cohort
goes along with an goes along with an
increase in per increase in per
capita growth by capita growth by
1% per year1% per year
Notice diminishing
returns to education

Interpretation of Interpretation of resultsresults
Growth
Education
Growth
Resources
Education
Resources
+ =
Interpretation of Interpretation of resultsresults
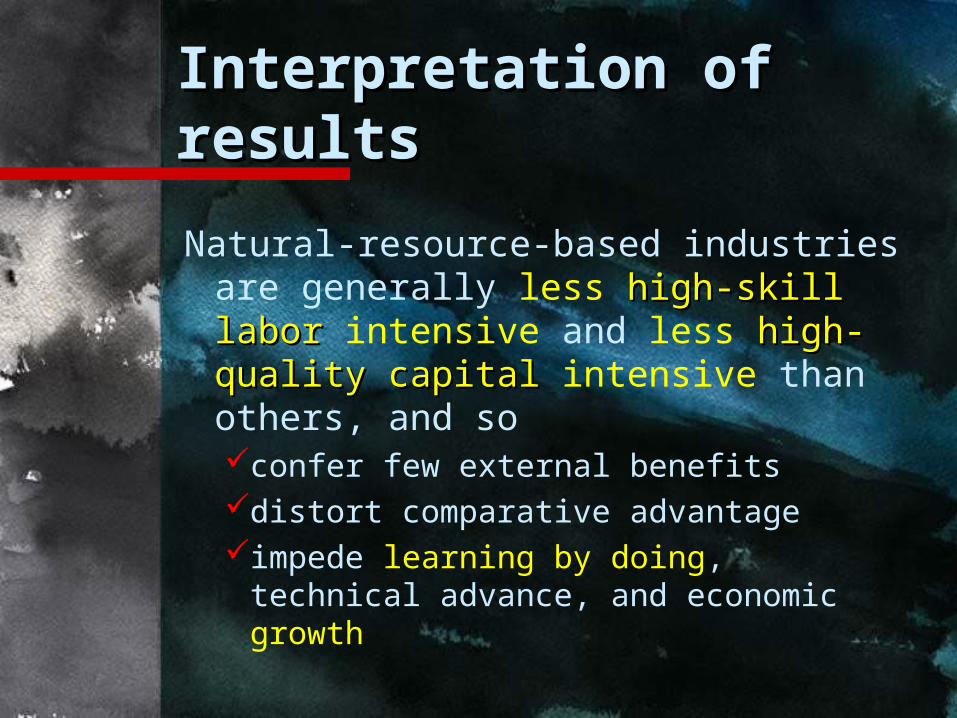
Natural-resource-based industries are generally less high-skill laborhigh-skill labor intensive and less high-quality high-quality capitalcapital intensive than others, and soconfer few external benefits distort comparative advantageimpede learning by doing, technical
advance, and economic growth
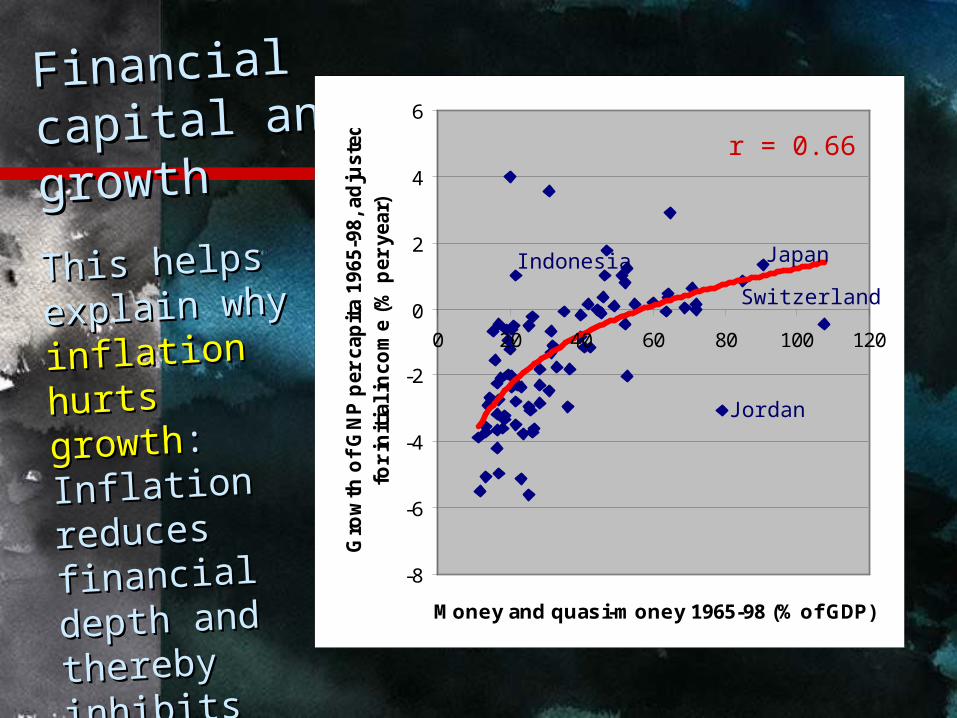
Financial Financial
capital and capital and
growthgrowth
Natural Natural capital capital crowds out crowds out
financial financial
capitalcapital
0
20
40
60
80
100
120
0 10 20 30 40 50 60
Share of natural capital in national wealth 1994 (%)
Mo
ney
an
d q
uas
i-m
on
ey 1
965-
98 (
% o
f G
DP
)
r = -0.68
Japan
China
New Zealand
Switzerland
Financial Financial
capital and capital and
growthgrowth
-8
-6
-4
-2
0
2
4
6
0 20 40 60 80 100 120
Money and quasi-money 1965-98 (% of GDP)
Gro
wth
of
GN
P p
er
cap
ita 1
965-9
8, ad
juste
d
for
init
ial in
co
me (
% p
er
year)
Indonesia Japan
Switzerland
Jordan
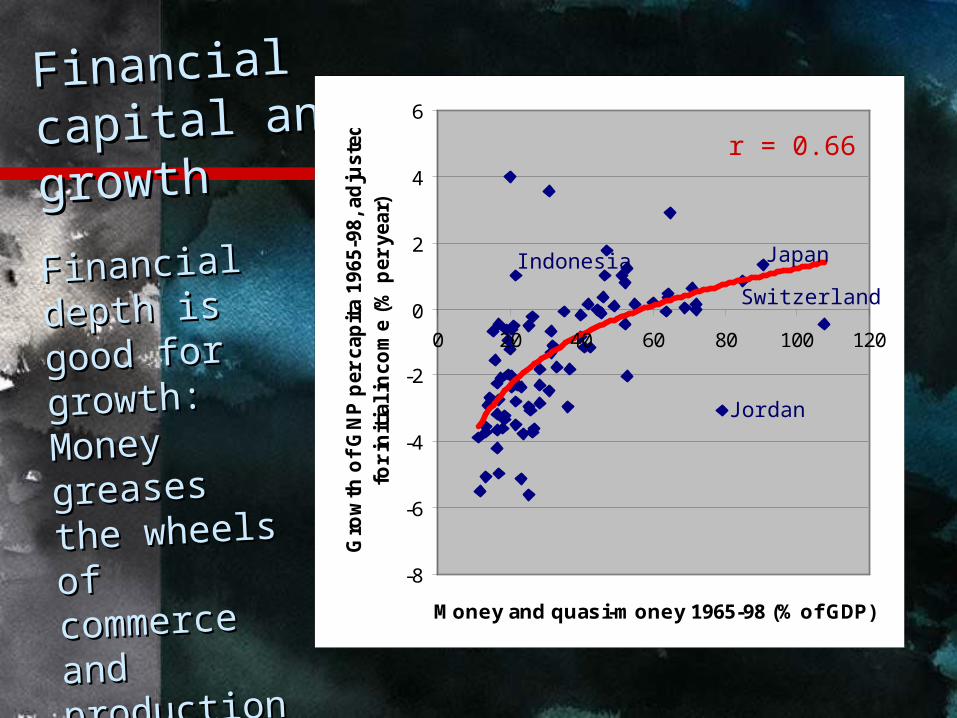
Financial Financial
depth is depth is good for good for
growth: growth: Money Money greases the greases the
wheels of wheels of
commerce commerce
and and productionproduction
r = 0.66
Financial Financial
capital and capital and
growthgrowth
-8
-6
-4
-2
0
2
4
6
0 20 40 60 80 100 120
Money and quasi-money 1965-98 (% of GDP)
Gro
wth
of
GN
P p
er
cap
ita 1
965-9
8, ad
juste
d
for
init
ial in
co
me (
% p
er
year)
Indonesia Japan
Switzerland
Jordan
This helps This helps
explain why explain why
inflation inflation hurts growthhurts growth: :
Inflation Inflation reduces reduces financial financial
depth and depth and
thereby thereby inhibits inhibits growthgrowth
r = 0.66
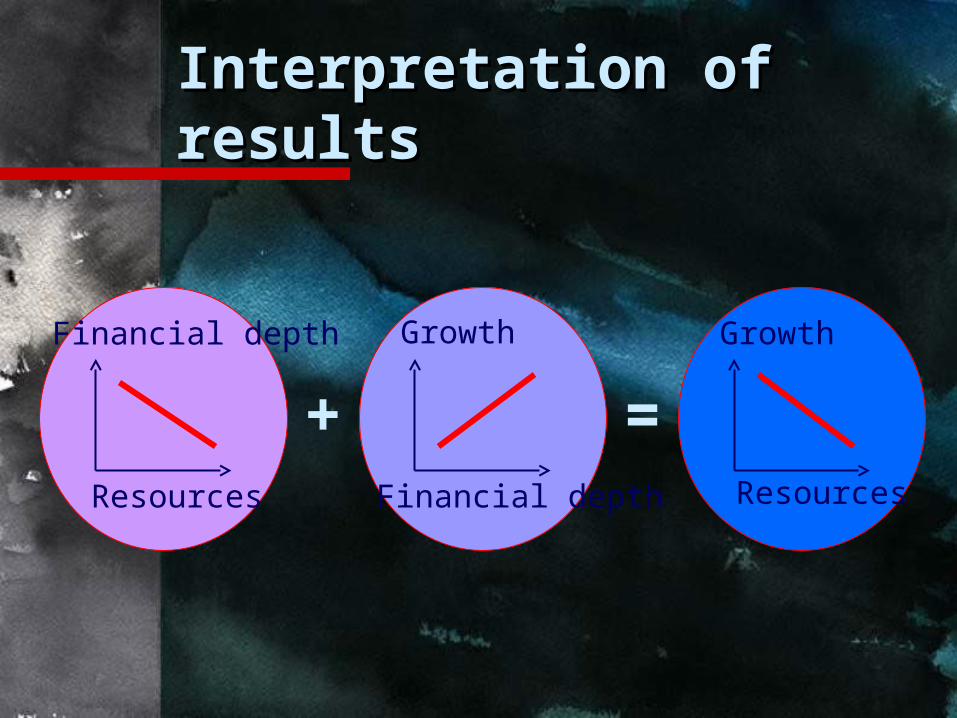
Interpretation of Interpretation of resultsresults
Growth
Financial depth
Growth
Resources
Financial depth
Resources
+ =
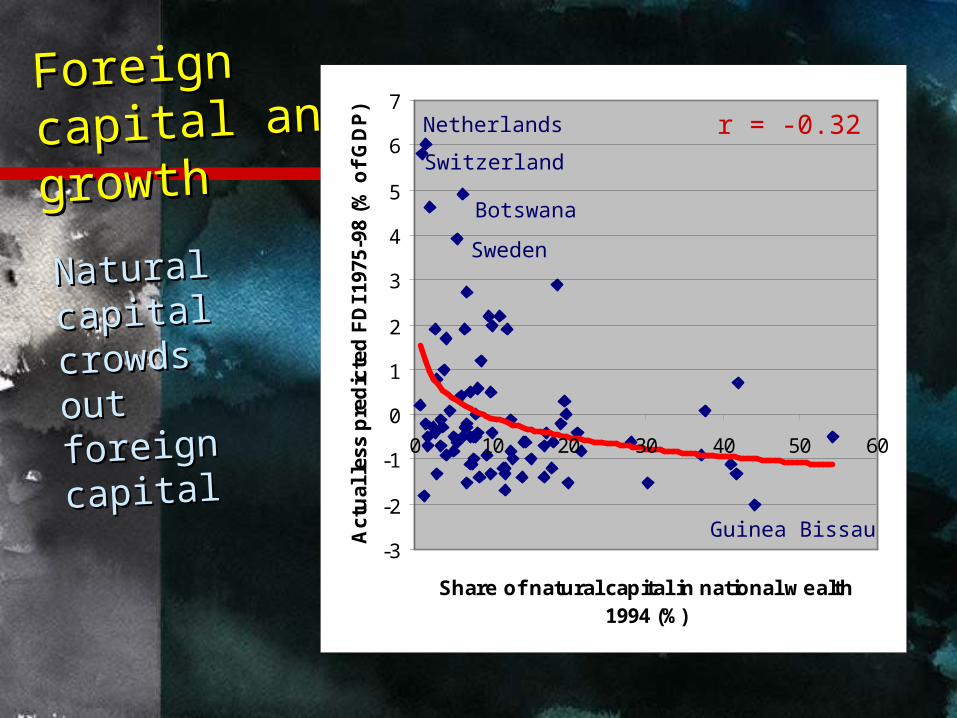
Foreign Foreign capital and capital and
growthgrowth
Natural Natural capital capital crowds crowds out out foreign foreign capitalcapital
-3
-2
-1
0
1
2
3
4
5
6
7
0 10 20 30 40 50 60
Share of natural capital in national wealth 1994 (%)
Act
ual
less
pre
dic
ted
FD
I 197
5-98
(%
of
GD
P)
r = -0.32
Botswana
Sweden
Switzerland
Netherlands
Guinea Bissau
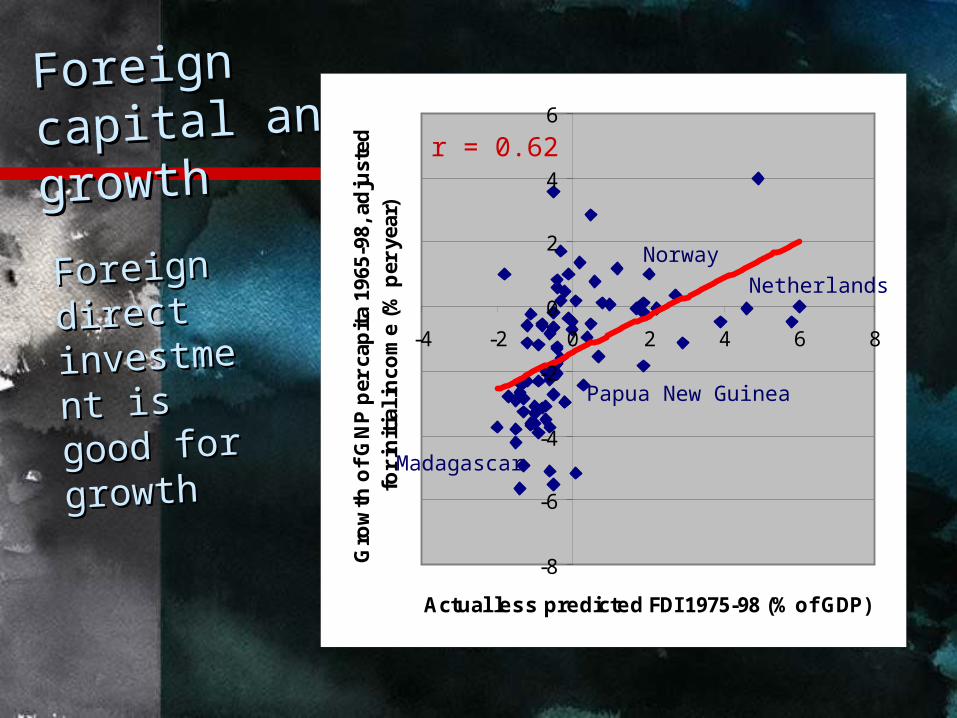
Foreign Foreign capital and capital and
growthgrowth
-8
-6
-4
-2
0
2
4
6
-4 -2 0 2 4 6 8
Actual less predicted FDI 1975-98 (% of GDP)
Gro
wth
of
GN
P p
er c
apit
a 19
65-9
8, a
dju
sted
fo
r in
itia
l in
com
e (%
per
yea
r)
Foreign Foreign direct direct investmeinvestment is good nt is good
for for growthgrowth
NetherlandsNorway
Papua New Guinea
Madagascar
r = 0.62
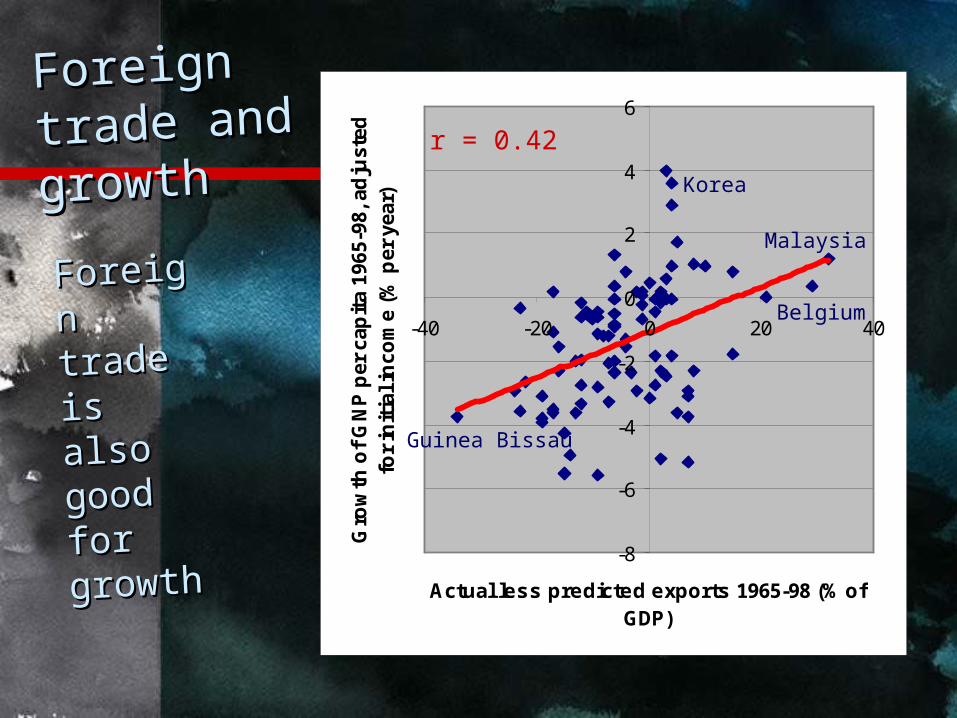
Foreign Foreign trade and trade and
growthgrowth
Foreign Foreign trade is trade is also also good good for for growthgrowth
-8
-6
-4
-2
0
2
4
6
-40 -20 0 20 40
Actual less predicted exports 1965-98 (% of GDP)
Gro
wth
of
GN
P p
er c
apit
a 19
65-9
8, a
dju
sted
fo
r in
itia
l in
com
e (%
per
yea
r)
Guinea Bissau
Belgium
Korea
Malaysia
r = 0.42
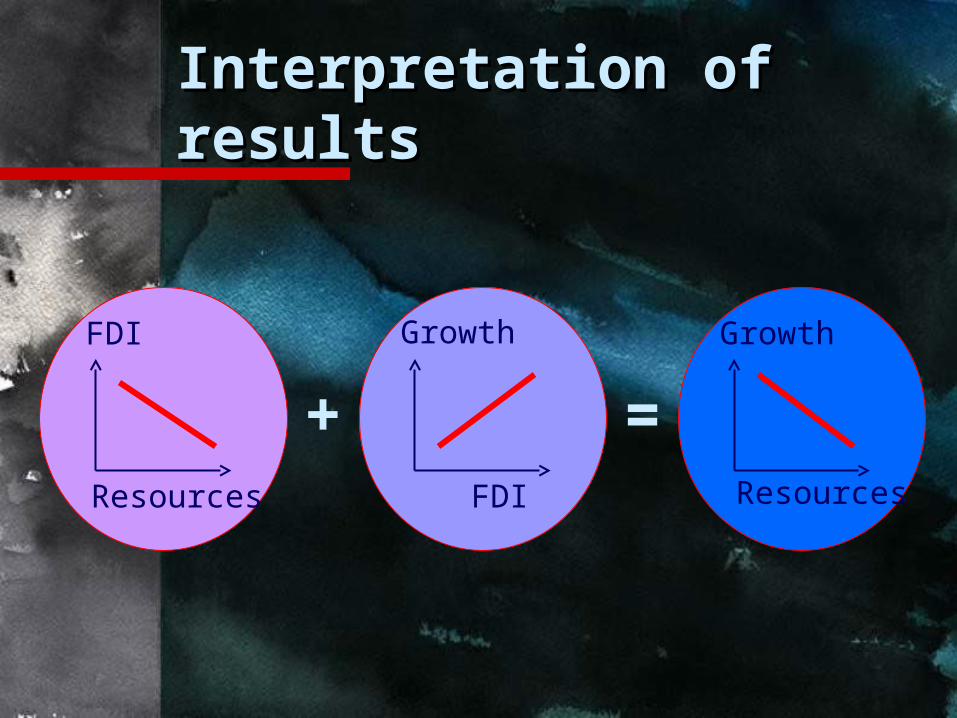
Interpretation of Interpretation of resultsresults
Growth
FDI
Growth
Resources
FDI
Resources
+ =
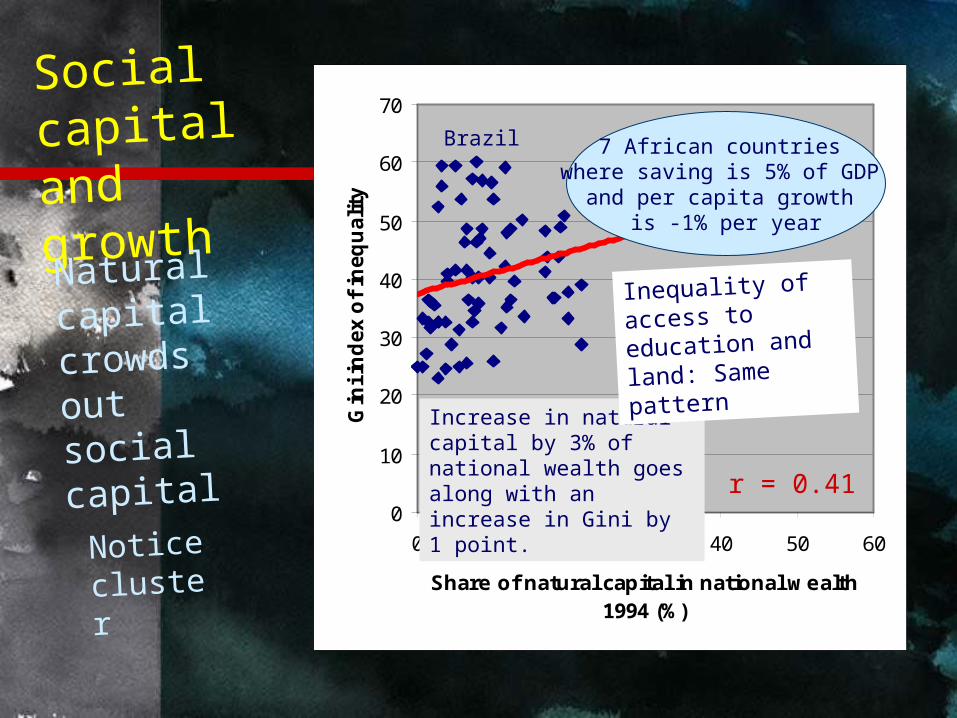
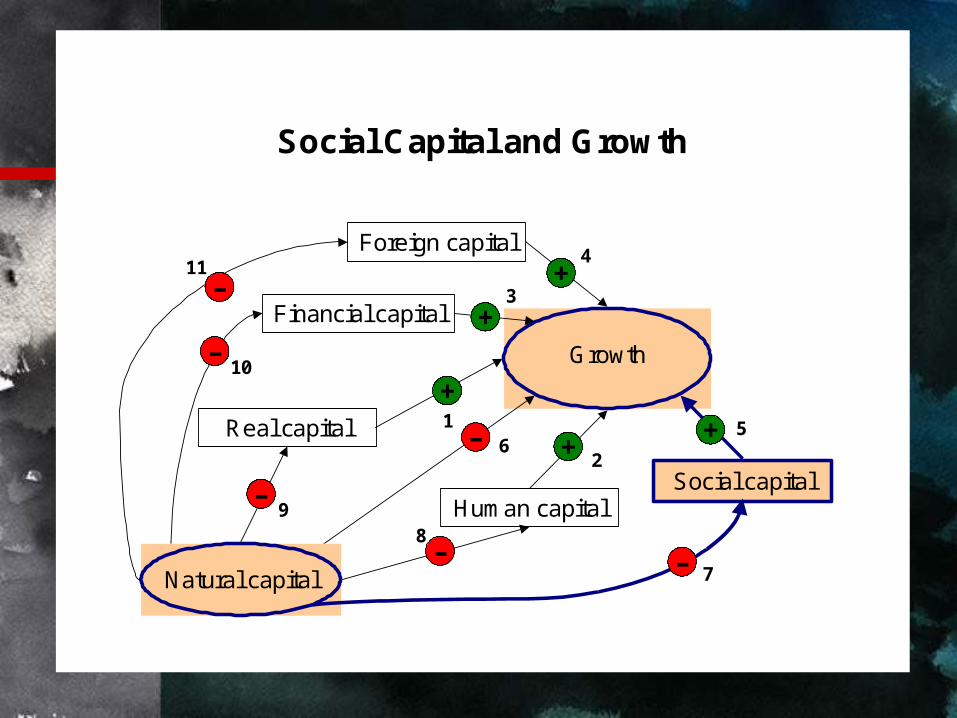
Social capital and
growth
Natural capital crowds out social capital
0
10
20
30
40
50
60
70
0 10 20 30 40 50 60
Share of natural capital in national wealth 1994 (%)
Gin
i in
dex o
f in
eq
uality
Increase in natural capital by 3% of national wealth goes along with an increase in Gini by 1 point.
7 African countries where saving is 5% of GDP
and per capita growth is -1% per year
Notice cluster
r = 0.41
Inequality of
access to education and
land: Same
pattern
Brazil
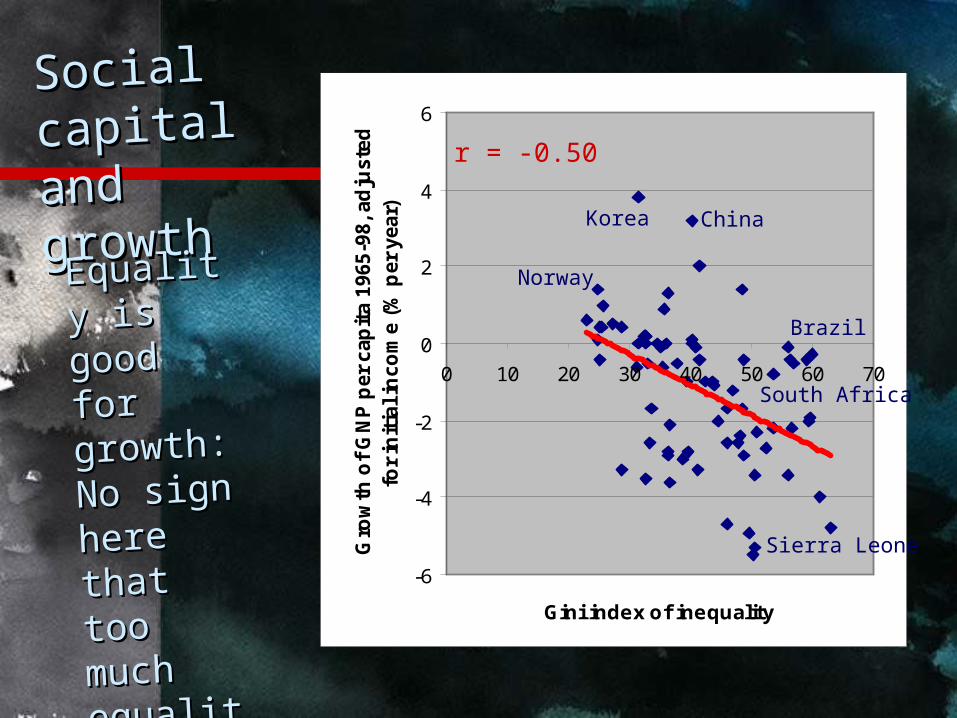
Social Social capital and capital and
growthgrowth
-6
-4
-2
0
2
4
6
0 10 20 30 40 50 60 70
Gini index of inequality
Gro
wth
of
GN
P p
er
cap
ita 1
965-9
8, ad
juste
d
for
init
ial in
co
me (
% p
er
year)
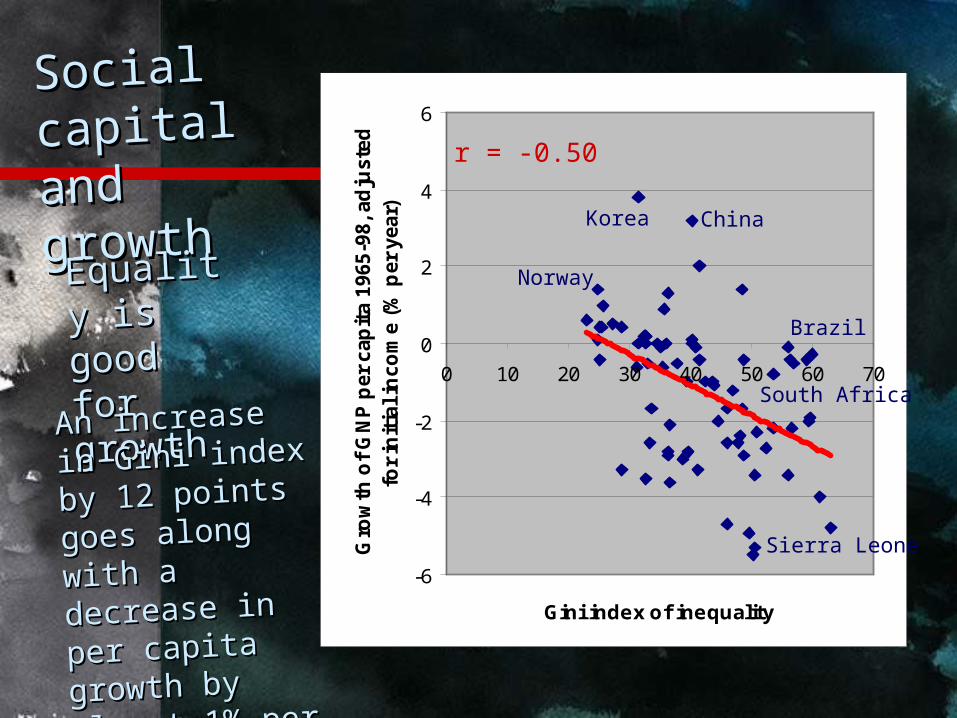
Equality Equality is good is good for for growth:growth:No sign No sign here that here that
too much too much
equality equality hurts hurts growthgrowth
Korea
Norway
China
Sierra Leone
r = -0.50
Brazil
South Africa
Social Social capital and capital and
growthgrowth
-6
-4
-2
0
2
4
6
0 10 20 30 40 50 60 70
Gini index of inequality
Gro
wth
of
GN
P p
er
cap
ita 1
965-9
8, ad
juste
d
for
init
ial in
co
me (
% p
er
year)
Equality Equality is good is good for for growthgrowth
Korea
Norway
China
Sierra Leone
r = -0.50
An increase in An increase in
Gini index by Gini index by
12 points goes 12 points goes
along with a along with a
decrease in per decrease in per
capita growth capita growth
by almost 1% by almost 1%
per yearper year
Brazil
South Africa

Interpretation of Interpretation of resultsresults
Growth
Inequality
Growth
Resources
Inequality
Resources
+ =
Social Social capital and capital and
growthgrowth
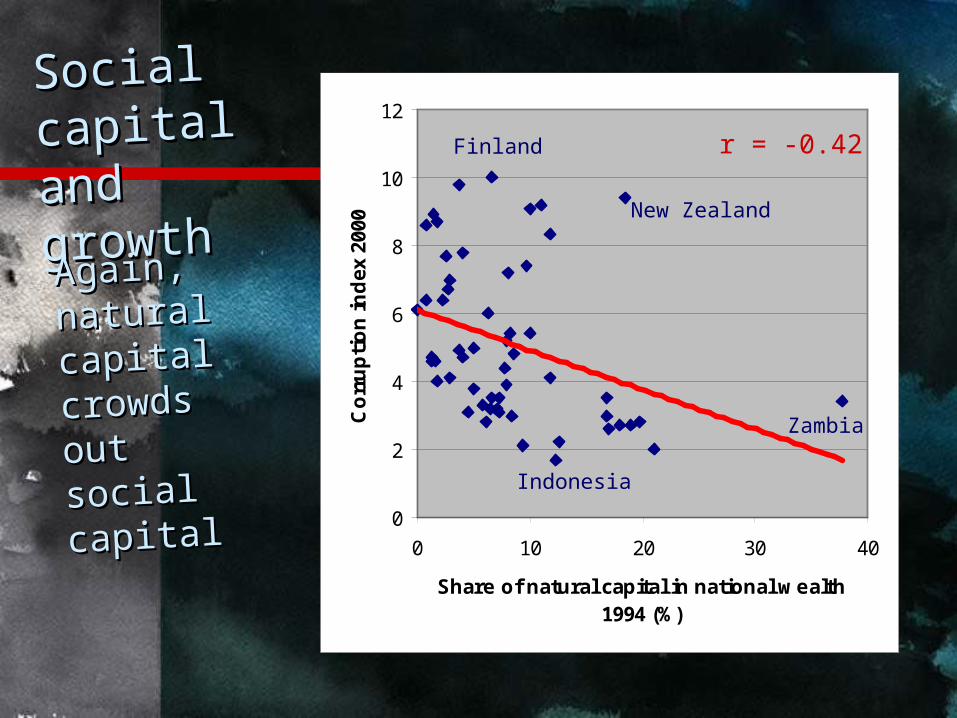
Again, Again, natural natural capital capital crowds crowds out out social social capitalcapital
0
2
4
6
8
10
12
0 10 20 30 40
Share of natural capital in national wealth 1994 (%)
Co
rru
pti
on
ind
ex 2
000
r = -0.42
Zambia
Indonesia
Finland
New Zealand
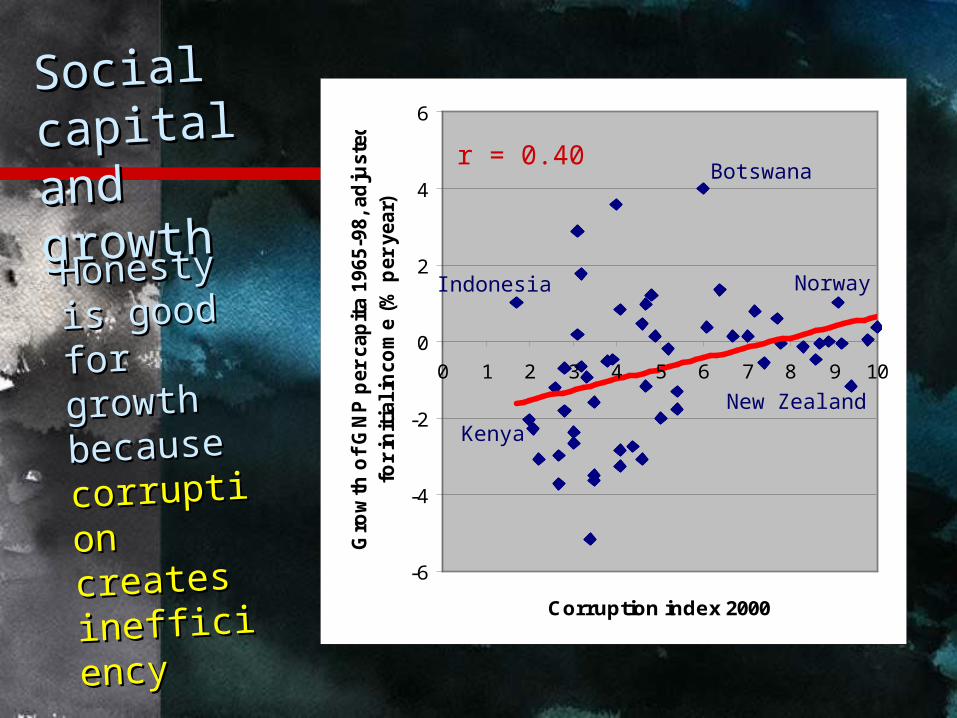
Social Social capital and capital and
growthgrowth
Honesty Honesty is good is good for for growth growth because because
corruptiocorruption creates n creates
inefficieninefficiencycy
-6
-4
-2
0
2
4
6
0 1 2 3 4 5 6 7 8 9 10
Corruption index 2000
Gro
wth
of
GN
P p
er
cap
ita 1
965-9
8, ad
juste
d
for
init
ial in
co
me (
% p
er
year)
Botswana
Kenya
Indonesia Norway
New Zealand
r = 0.40

Interpretation of Interpretation of resultsresults
Growth
Corruption
Growth
Resources
Corruption
Resources
+ =
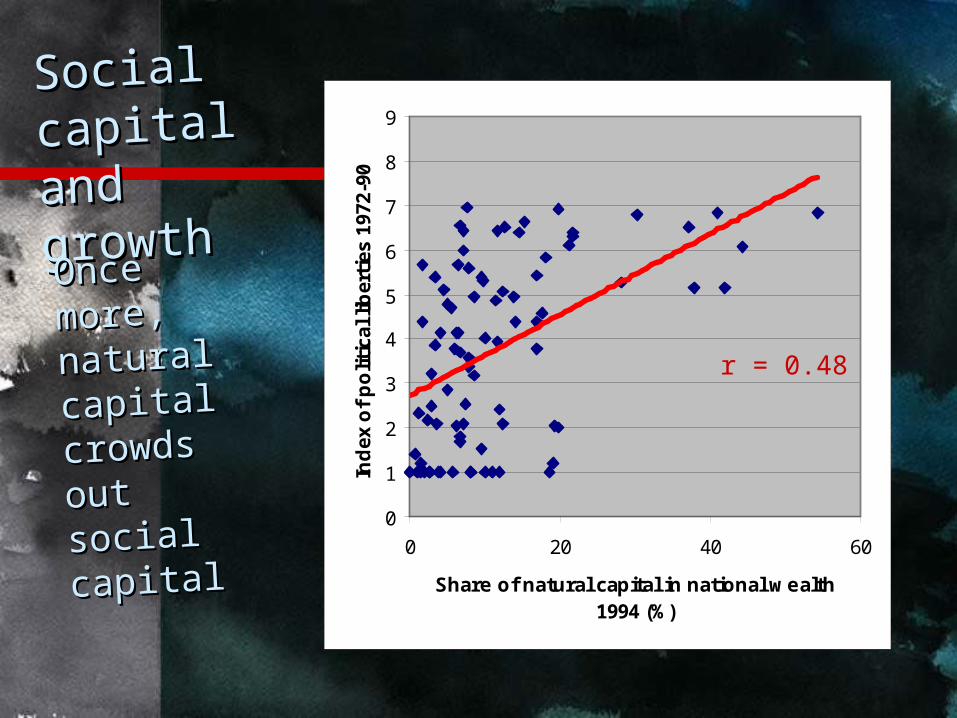
0
1
2
3
4
5
6
7
8
9
0 20 40 60
Share of natural capital in national wealth 1994 (%)
Ind
ex o
f p
olit
ical
lib
erti
es 1
972-
90
Social Social capital and capital and
growthgrowth
Once Once more, more, natural natural capital capital crowds crowds out out social social capitalcapital
r = 0.48
-8
-6
-4
-2
0
2
4
6
0 2 4 6 8
Index of political liberties 1972-90
Gro
wth
of
GN
P p
er c
apit
a 19
65-9
8, a
dju
sted
fo
r in
itia
l in
com
e (%
per
yea
r)
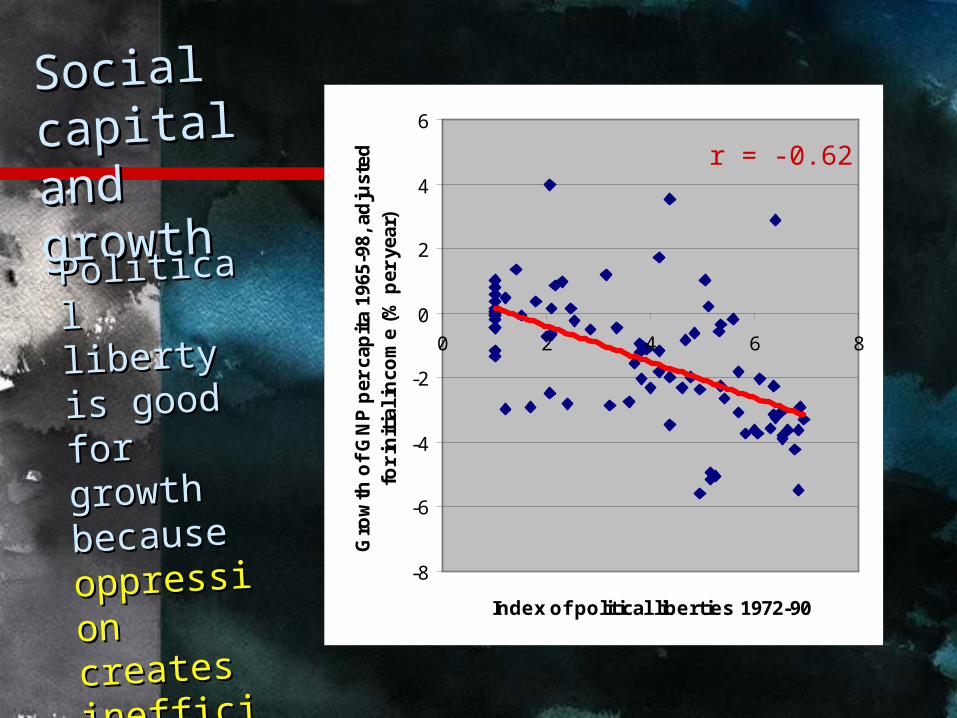
Social Social capital and capital and
growthgrowth
Political Political liberty is liberty is
good for good for
growth growth because because
oppressiooppressio
n creates n creates
inefficieninefficiencycy
r = -0.62

Interpretation of Interpretation of resultsresults
Growth
Oppression
Growth
Resources
Oppression
Resources
+ =
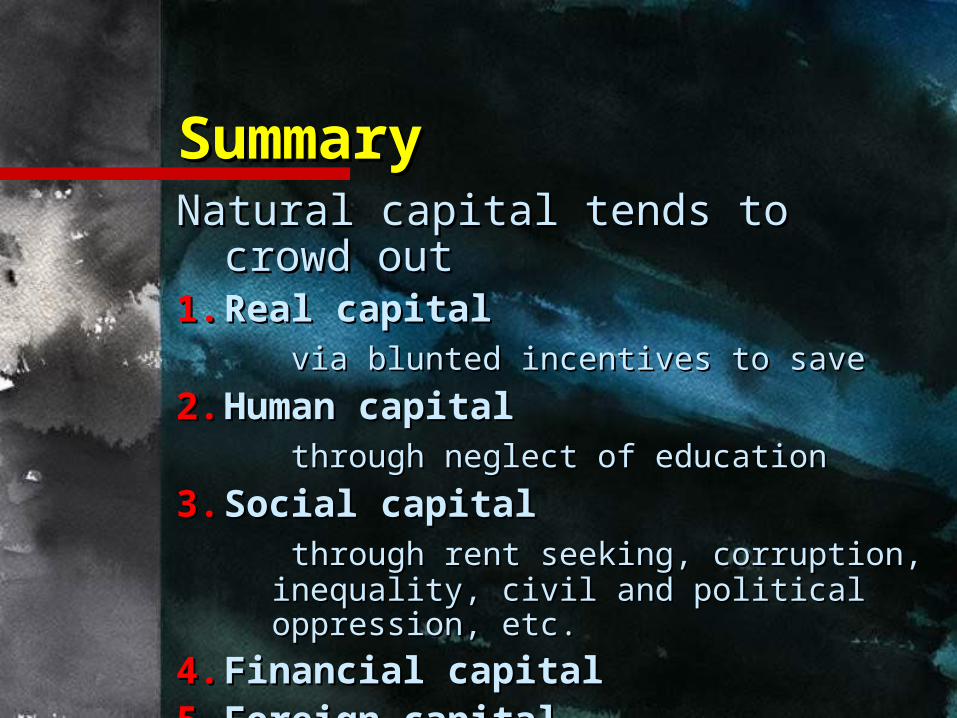
SummarySummaryNatural capital tends to crowd out Natural capital tends to crowd out 1.1. Real capitalReal capital
via blunted incentives to savevia blunted incentives to save
2.2. Human capitalHuman capital through neglect of educationthrough neglect of education
3.3. Social capitalSocial capital through rent seeking, corruption, through rent seeking, corruption,
inequality, civil and political oppression, inequality, civil and political oppression, etc.etc.
4.4. Financial capitalFinancial capital5.5. Foreign capitalForeign capital
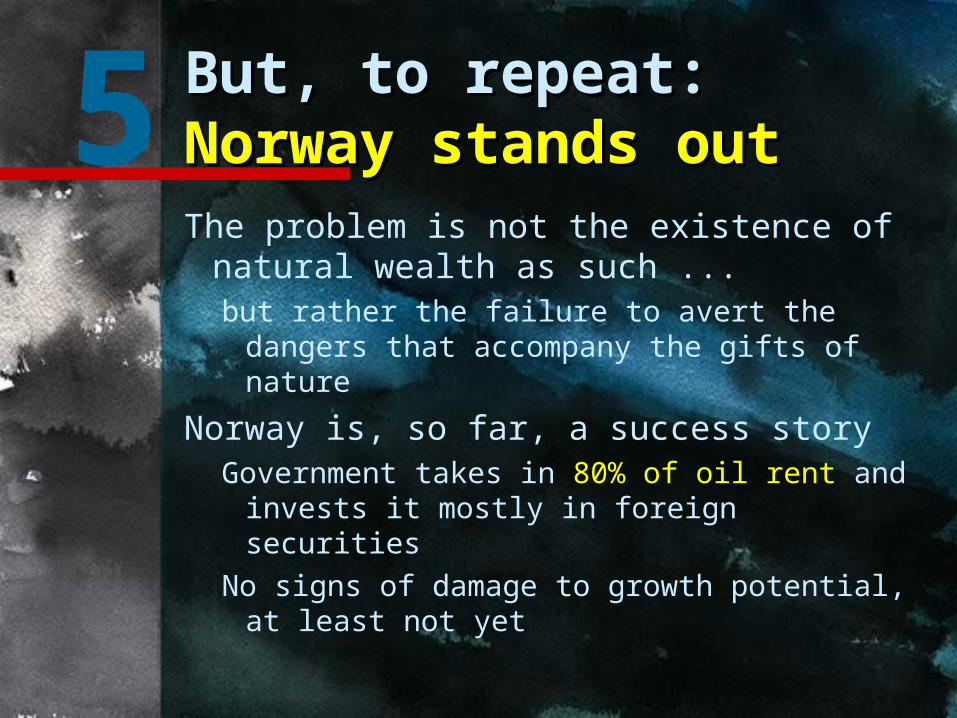
But, to repeat:But, to repeat: Norway stands outNorway stands outThe problem is not the existence of
natural wealth as such ... but rather the failure to avert the
dangers that accompany the gifts of nature
Norway is, so far, a success storyGovernment takes in 80% of oil rent and
invests it mostly in foreign securitiesNo signs of damage to growth potential,
at least not yet
5
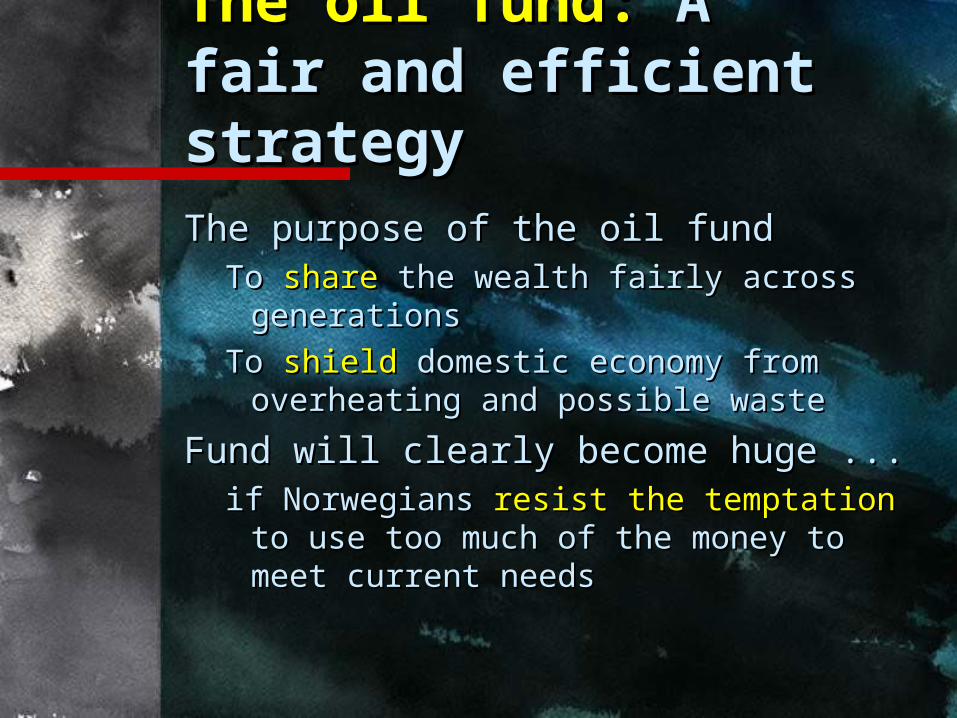
The oil fund: The oil fund: A fair A fair and efficient and efficient strategystrategy
The purpose of the oil fundThe purpose of the oil fundTo To shareshare the wealth fairly across the wealth fairly across
generationsgenerations
To To shieldshield domestic economy from domestic economy from overheating and possible wasteoverheating and possible waste
Fund will clearly become huge ...Fund will clearly become huge ...if Norwegians if Norwegians resist the temptationresist the temptation
to use too much of the money to to use too much of the money to meet current needsmeet current needs
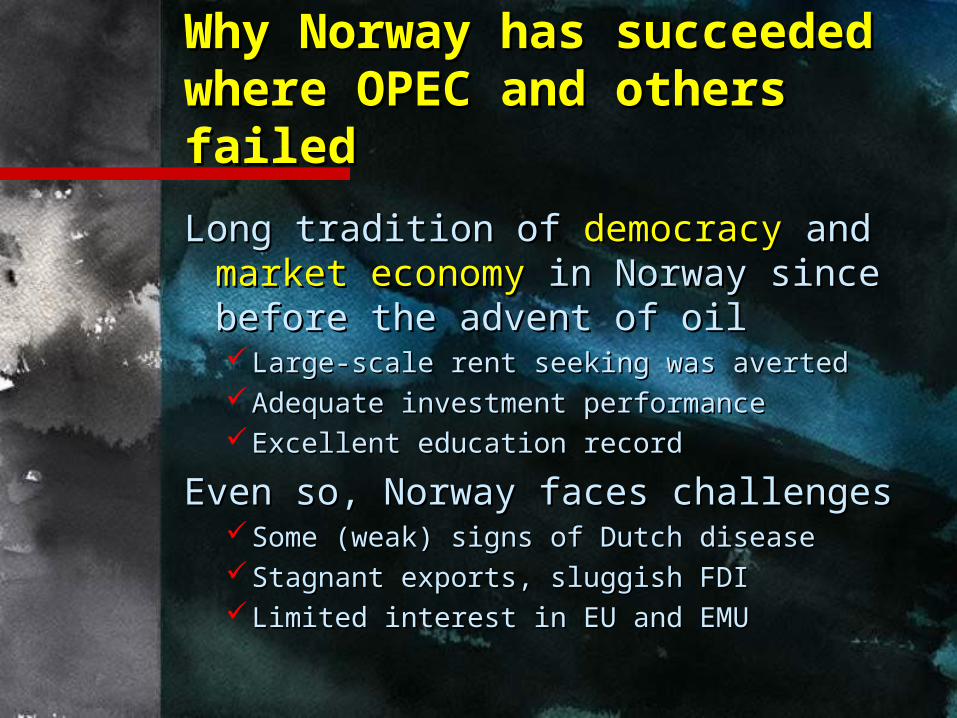
Why Norway has Why Norway has succeeded where OPEC succeeded where OPEC and others failedand others failed
Long tradition of Long tradition of democracydemocracy and and market economymarket economy in Norway since in Norway since before the advent of oilbefore the advent of oilLarge-scale rent seeking was averted Large-scale rent seeking was averted Adequate investment performanceAdequate investment performanceExcellent education recordExcellent education record
Even so, Norway faces challengesEven so, Norway faces challengesSome (weak) signs of Dutch diseaseSome (weak) signs of Dutch diseaseStagnant exports, sluggish FDIStagnant exports, sluggish FDILimited interest in EU and EMULimited interest in EU and EMU
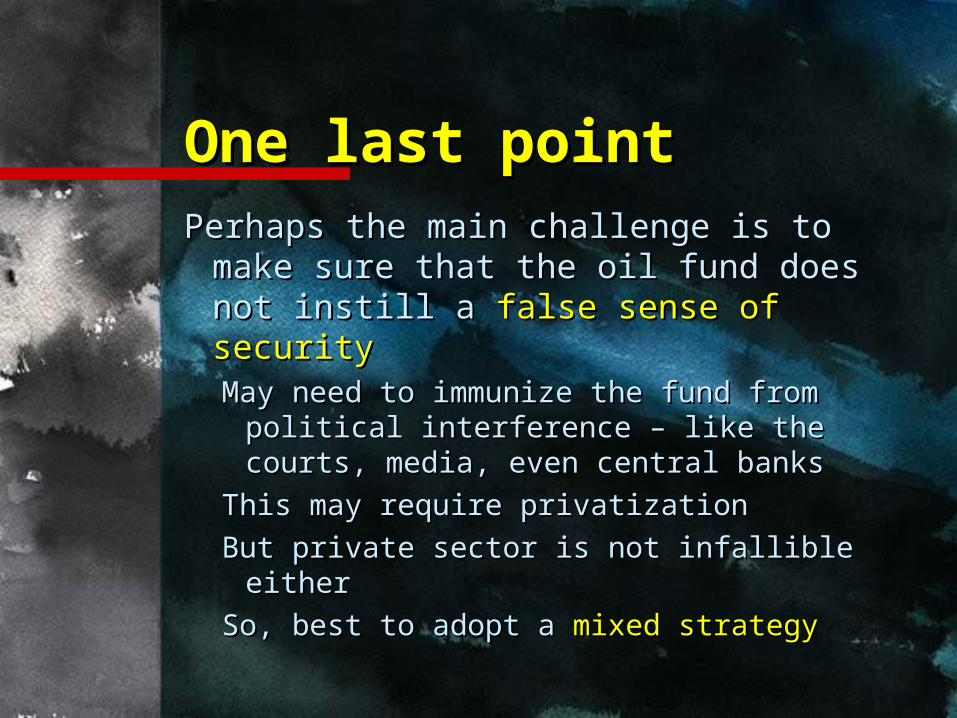
One last pointOne last pointPerhaps the main challenge is to Perhaps the main challenge is to
make sure that the oil fund does make sure that the oil fund does not instill a not instill a false sense of securityfalse sense of security May need to immunize the fund from May need to immunize the fund from
political interference – like the courts, political interference – like the courts, media, even central banksmedia, even central banks
This may require privatizationThis may require privatization
But private sector is not infallible eitherBut private sector is not infallible either
So, best to adopt a So, best to adopt a mixed strategymixed strategy
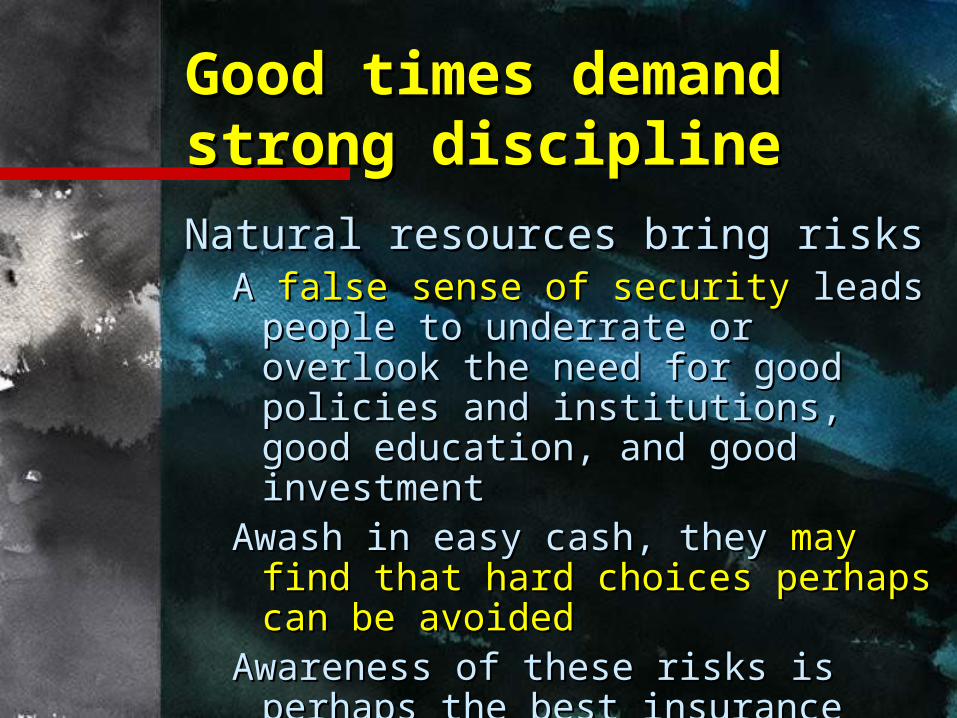
Good times demand Good times demand strong disciplinestrong discipline
Natural resources bring risksNatural resources bring risksA A false sense of securityfalse sense of security leads leads
people to underrate or overlook the people to underrate or overlook the need for good policies and need for good policies and institutions, good education, and institutions, good education, and good investmentgood investment
Awash in easy cash, they Awash in easy cash, they may find may find that hard choices perhaps can be that hard choices perhaps can be avoidedavoided
Awareness of these risks is perhaps Awareness of these risks is perhaps the best insurance policy against the best insurance policy against them them
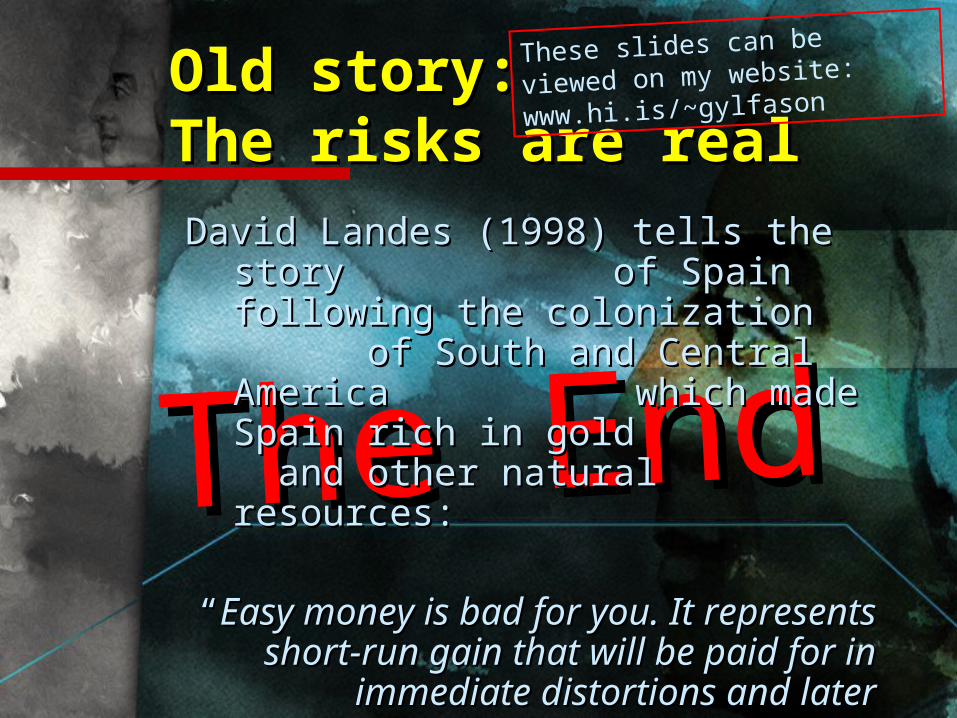
Old story: Old story: The risks are realThe risks are real
These slides can be viewed on
my website:
www.hi.is/~gylfason
The EndThe End
David Landes David Landes (1998) (1998) tells the story tells the story of Spain following the of Spain following the colonization of South and colonization of South and Central America which Central America which made Spain rich in gold made Spain rich in gold and other natural resources:and other natural resources:
““Easy money is bad for you.Easy money is bad for you. It It represents short-run gain that will represents short-run gain that will
be paid for in immediate be paid for in immediate distortions anddistortions and later regrets.later regrets.””