Embed Size (px)
Citation preview
DOE F 1325.B(8-89)
EFG (07-90)
DATE:
REPLY TO
ATTN OF:
SUBJECT:
TO:
October 6, 1997
EH-41
Natural Resource Valuation: A Primer on Concepts and Techniques
EH-41 Web site users
The following article document, Natural Resource Valuation: A Primer on Concepts andTechniques, discusses natural resource valuation and its role in the practice of cost-benefit analysis of health, safety, and environmental issues. The document, however, isnot official “DOE guidance, ” and is offered only as general information, which may beof use to our Web users.
Natural Resource Valuation:A Primer on
Concepts and Techniques
C.A. Ulibarri & K.F. Wellman
July 1997
Prepared forthe U.S. Department of Energy
under Contract DE-AC06-76RLO 1830
Acknowledgments
The authors wish to thank Drs. Heino Beckert and Andrew Wallo of theU.S. Department of Energy for supporting this research endeavor and Dr.Gordon Bilyard, Thomas Grant, and Thomas Marsh of the PacificNorthwest National Laboratory for helpful comments and suggestions. Additionally, the authors give thanks to Judy Danko, Joan Slavens, andMarlene Hale for editorial and technical assistance in preparing thisdocument.
The authors hold no one but themselves accountable for lapses ofjudgment and omissions in this effort.
Executive Summary
Natural resource valuation has always had a fundamental role in thepractice of cost-benefit analysis of health, safety, and environmentalissues. Today, this role is becoming all the more apparent in the conductof natural resource damage assessments (NRDA) and cost-benefitanalyses of environmental restoration (ER) and waste management (WM)activities. As such, environmental professionals are more interested inhow natural resource values are affected by ER and WM activities. Thisprofessional interest extends to the use of NRDA values as measures ofliability and legal causes of action under such environmental statues asthe Clean Water Act (CWA); the Comprehensive EnvironmentalResponse, Compensation, and Liability Act of 1980 (CERCLA, asamended); and the Oil Pollution Act (OPA) of 1990. Also,environmental professionals are paying closer attention to NRDA valuesin cost-benefit analyses of risk and pollution-abatement standards, and inmeeting environmental and safety standards — for instance, theattainment of dose limits as low as is reasonably achievable (ALARA). This handbook reviews natural resource valuation techniques that may beapplied to resources at DOE sites within the foregoing contexts.
At the onset, the authors wish to emphasize what this handbook is andwhat it is not. It is not an effort to provide a comprehensive review ofenvironmental benefit valuation studies. Rather, the selection of casematerial is an attempt to exemplify where field studies of natural resourcevalues can play an important role in ER and WM activities at federalfacilities. For this reason, the discussion is aimed at noneconomists andpays specific attention to the more basic economic principles andtechniques that are currently used by leading practitioners in theestimation of natural resource values. Box illustrations of case studies
vi / Executive Summary
are used to highlight the application of these methods by a number ofleading practitioners. The discussion does not recommend the use of anyone method over another, nor does it analyze the correctness of any oneapplication. Instead, the aim is to provide an overview of theapplicability of the various methods to particular situations that may berelevant to ER and WM activities at federal facilities.
Federal agencies and environmental contractors are in the process ofresponding to changing trends and protocols in assessing natural resourcedamages. Specifically, these include assessing “nonuse values” in theevaluation of restoration alternatives, estimating compensable values fordamages sustained by natural and environmental resources, andcomplying with risk and performance-based environmental standards. The new emphasis given to nonuse values as components of the naturalresource damage assessment process will no doubt motivate many state-of-the-art applications of resource valuation techniques. Environmentalprofessionals recognize the stakes of incorporating these unconventionalvalues in resource damage assessments and the role of state and federalgovernments in seeking damages from potentially responsible parties. Accordingly, the interest of the U.S. Department of Energy (DOE) in theapplicability of resource valuation techniques is well-founded.
In response to this interest, the authors provide an objective overview ofresource valuation techniques and describe their potential role inenvironmental restoration/waste management (ER/WM) activities atfederal facilities. With environmental professionals in mind, theobjectives of this work are to increase awareness of the viability ofresource valuation techniques; to explain the potential application ofNRDA values; and to describe, where appropriate, the potentialdifficulties and uncertainties associated with NRDA valuation techniques. This handbook considers five general classes of valuation techniques: 1)market-based techniques, which rely on historical information on marketprices and transactions to determine resource values; 2) nonmarkettechniques that rely on indirect estimates of resource values; 3)nonmarket techniques that are based on direct estimates of resource
vii
values; 4) cross-cutting valuation techniques, which combine elements ofone or more of these methods; and 5) ecological valuation techniquesused in the emerging field of ecological economics. Given the state of theart in applying these methods and the number and variety of successfulapplications to date, each one of these valuation methods is worthy ofconsideration at DOE sites.
The various valuation techniques under consideration are described byhighlighting their applicability in environmental management and regu-lation. As to coverage and level of technical detail, efforts are made toaddress the advantages and limitations of the techniques using illustrativecase studies of natural resources as defined under CERCLA; that is, land,water, fish, wildlife, biota, air, groundwater, and drinking water supplies. The handbook also addresses key unresolved issues in the application ofvaluation techniques generally, including discounting future values,incorporating environmental equity concerns, and concerns over theuncertainties in the measurement of natural resource values andenvironmental risk. These topics are discussed individually, recognizingthat economic theory offers no precise quantitative adjustment forhandling any one issue. A bibliography of the natural resource valuationliterature is provided, as are glossaries of relevant terms andenvironmental statutes.
Introduction
The Comprehensive Environmental Response, Compensation, andLiability Act (CERCLA) authorizes the President of the United States todesignate federal officials who would act as trustees of publicly ownednatural resources. In the case of the U.S. Department of Energy (DOE),Executive Order 12580 recognizes the Secretary of Energy as the primaryFederal Trustee for natural resources located on, over, or under landadministered by DOE. Consequently, as DOE proceeds with the cleanupof its sites across the nation under CERCLA and other environmentalprotection statutes, field offices must be sensitive to the impacts ofenvironmental restoration (ER) and waste management (WM) activitieson natural resources. Environmental professionals realize many of theirdecisions will affect the use of natural resources now and in the futureand are aware of the increase in public concern over potential injuriessustained by natural resources. They are paying closer attention tonatural resource values in cost-benefit analyses of risk and pollution-abatement standards, and in meeting environmental safety standards, forinstance, the attainment of dose limits as low as reasonably achievable(ALARA). The purpose of this handbook is to describe the key conceptsand techniques that are used in the valuation of natural resources andtheir application to resources at DOE facilities.
Background
Interest in natural resource valuation has been heightened by recentregulatory developments in resource damage assessments underCERCLA. Damage assessments are conducted to determine the extent ofinjury to natural resources and to calculate compensatory monetary
2 / Introduction
damages. The new protocols in the damage assessment process arehelping delineate appropriate measures of compensation for injury tonatural resources. In addition, they have also broken new ground byfocusing on injuries that may remain after site restoration activities arecompleted. These developments have increased the role of naturalresource valuation techniques in determining the magnitude of monetarydamage claims under CERCLA (as amended).
The original regulations for conducting resource damage assessmentsprescribed that public trustees of natural resources use the lesser ofrestoration costs or foregone use values as the basis of measuring naturalresource and environmental damages. Nonuse values were consideredonly as a last resort, when no use values could be measured. Theseconventions were rearranged by judicial decision in State of Ohio v. theU.S. Department of Interior (1989), which broadened the scope of nonusevalues to situations in which these values can be reliably measured. Thenew protocols include the recognition of nonuse values in the evaluationof restoration alternatives, compensable values, and preliminary estimatesof damage sustained by natural and environmental resources.
Analysts recognize the increased concern for nonuse values as acomponent of the natural resource damage assessments (NRDA) processand the stakes of incorporating nonuse values in damage assessments. Meanwhile, the greater public interest in preserving natural and environ-mental resources (environmental ethics) has led to new applications ofresource valuation methods that are increasingly sensitive to nonusevalues. Examples include the growing interest in preserving naturalresources for present and future generations through the American IndianReligious Freedom Act, the National Historic Preservation Act, and theArchaeological Resources Protection Act.
These social and cultural movements suggest increased opportunities forstakeholders to reflect their value for natural resources in public decision-making and the resolution of environmental conflicts.
Approach / 3
In complying with environmental statutes, DOE’s stewardship role inprotecting natural resources has become a public focal point. As theDOE recognizes the public interest in its environmental clean-upactivities, environmental contractors must remain responsive to theextensive set of rules that implement major federal environmentalstatutes, such as the National Environmental Policy Act, the Clean AirAct, and the Clean Water Act. In addition, DOE staff and contractorsinvolved in environmental restoration activities must remain responsiveto other administrative rules and actions, such as Executive Order 11988(Floodplain Management), Executive Order 11990 (Protection ofWetlands), and the Endangered Species Act. In complying with these andother policy initiatives, DOE and its environmental contractors will havea significant impact on the monetary value of natural and environmentalresources. Ultimately, the monetary value of such resources may reflecton how well DOE meets its trustee responsibilities as a steward of naturalresources as it remediates and restores sites and decontaminates facilities.
Approach
This handbook provides an overview of current natural resource valuationmethods, focusing on their applicability in the field operations of federalagencies. Unfortunately, much of what is written on resource valuationmethodology stems from a technical literature which field professionalsmay find difficult to apply. The authors attempt to bridge this gap bytargeting environmental managers and policy makers, the stewards ofnatural resources. No assumptions are made about the readers’familiarity with the conceptual underpinnings of economic valuationmethods or how applicable these valuation tools are in the preparation ofregulatory compliance documents.
By interpreting valuation methods in an applied context, the authorsintend to provide noneconomists with greater awareness of the techniquesthat are used and the current issues, trends, and decisions that affect theiruse. Examples of issues and concerns that DOE field offices could face
4 / Introduction
(a) Pacific Northwest National Laboratory is operated for the U.S. Department ofEnergy by Battelle under Contract DE-AC06-76RLO 1830.
in the near future include the following:
C valuation of cost-benefits in health, safety, andenvironmental risk standards
C valuation of ecological resources, such as wetlands orarid lands
C new approaches in resource valuation or the NRDAprocess
C growing awareness of stakeholders over health, safety,and environmental risks.
By explaining these valuation questions, the authors seek to give thereader a better feel for the use of economic valuation tools in qualitativeand quantitative assessments of natural resource values. Here, an effortis made to review natural resource valuation techniques from a federalagency perspective. Through its field offices, DOE is the steward of awide array of natural resources, encompassing large tracts of undevelopedlands, extensive watersheds and forests, and diverse wildlife.
Although the focus of this handbook is on conventional economic valua-tion methods, it is readily acknowledged that conventional economicsoffers only one approach to natural resource valuation. Alternativedisciplinary perspectives cannot be ignored. Therefore, the authorsinclude ecological economics as an emerging discipline. Overall, themethods and case studies considered here were chosen by the authors atthe Pacific Northwest National Laboratory and at the Battelle, Seattle(a)
Research Center.
Natural Resource ValuationTechniques
This section describes methods used in the valuation of natural andenvironmental resources and resource services. Examples are used toillustrate their potential applicability in a variety of situations, such asland valuation upon completion of restoration activities or water valua-tion following the prevention of toxic discharges. The key is to estimatethe demand for the beneficial uses or services that natural resourcesprovide individuals and communities. Where markets for the resource orits services exist, assessment is relatively straightforward. An examplewould be a local real estate market. Observations on the number andvalue of transactions provide information about the people’s willingnessto pay for land and the quantity of land changing hands. These marketdata provide a means through which to deduce the market demand curveand the actual payments made during a given period of time.
When a market such as this exists, it is relatively easy to apply market-based techniques to measure value. These techniques include the marketprice approach, the appraisal method, and the replacement costmethod. Otherwise, when market data is not available, valuation requiresthe use of nonmarket techniques to derive information on individualwillingness to pay. The most widely recognized nonmarket techniquesinclude the travel cost method, the hedonic price method, and thecontingent valuation method. Also, cross-cutting methods have beenused as a way to combine market-based and nonmarket methods ofvaluation, such as the benefit-transfer method or the unit-day valuemethod. Finally, other recent approaches have focused on the valuationof ecological functions. Table 1 provides an overview of these
6 / Valuation Techniques
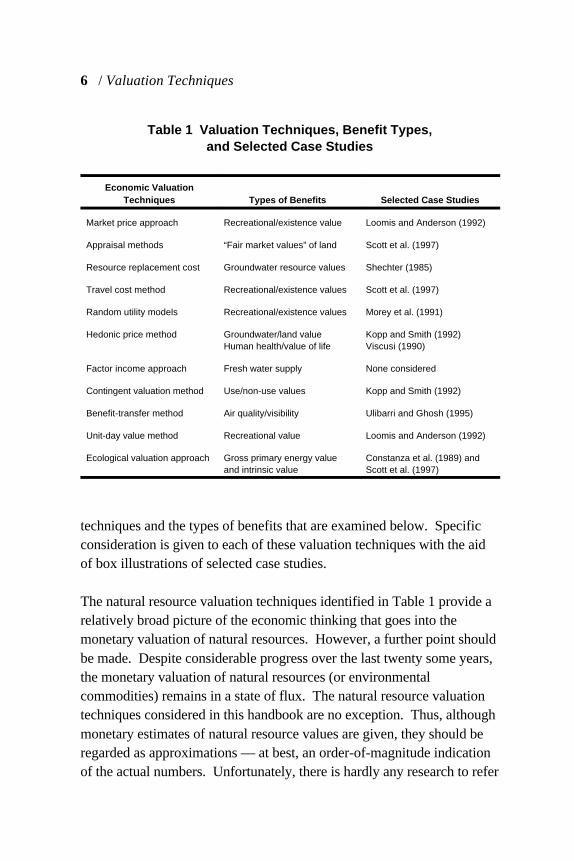
Table 1 Valuation Techniques, Benefit Types,and Selected Case Studies
Economic ValuationTechniques Types of Benefits Selected Case Studies
Market price approach Recreational/existence value Loomis and Anderson (1992)
Appraisal methods “Fair market values” of land Scott et al. (1997)
Resource replacement cost Groundwater resource values Shechter (1985)
Travel cost method Recreational/existence values Scott et al. (1997)
Random utility models Recreational/existence values Morey et al. (1991)
Hedonic price method Groundwater/land value Kopp and Smith (1992) Human health/value of life Viscusi (1990)
Factor income approach Fresh water supply None considered
Contingent valuation method Use/non-use values Kopp and Smith (1992)
Benefit-transfer method Air quality/visibility Ulibarri and Ghosh (1995)
Unit-day value method Recreational value Loomis and Anderson (1992)
Ecological valuation approach Gross primary energy value Constanza et al. (1989) andand intrinsic value Scott et al. (1997)
techniques and the types of benefits that are examined below. Specificconsideration is given to each of these valuation techniques with the aidof box illustrations of selected case studies.
The natural resource valuation techniques identified in Table 1 provide arelatively broad picture of the economic thinking that goes into themonetary valuation of natural resources. However, a further point shouldbe made. Despite considerable progress over the last twenty some years,the monetary valuation of natural resources (or environmentalcommodities) remains in a state of flux. The natural resource valuationtechniques considered in this handbook are no exception. Thus, althoughmonetary estimates of natural resource values are given, they should beregarded as approximations — at best, an order-of-magnitude indicationof the actual numbers. Unfortunately, there is hardly any research to refer
Market-Based Techniques / 7
to which has attempted to validate or compare the monetary valueestimates identified in this handbook. As such, it is difficult to measurethe range of uncertainties that underlie these estimates. For this reason,the authors have not adjusted any of the monetary values for inflation; forto do so would, in the words of Allen Kneese, “confer on them anunfounded degree of accuracy.”
Market-Based Techniques
The pioneers of natural and environmental resource valuation relied onthe “law of demand” as a way to measure the market values for naturalresources and environmental amenities. While the same is true today, thedegree of sophistication in the measurement of these values has increasedconsiderably. Three market-based techniques that have recorded asignificant history of natural and environmental resource valuations aredescribed here: the market price approach, the appraisal method, andresource replacement costing.
Market Price Approach
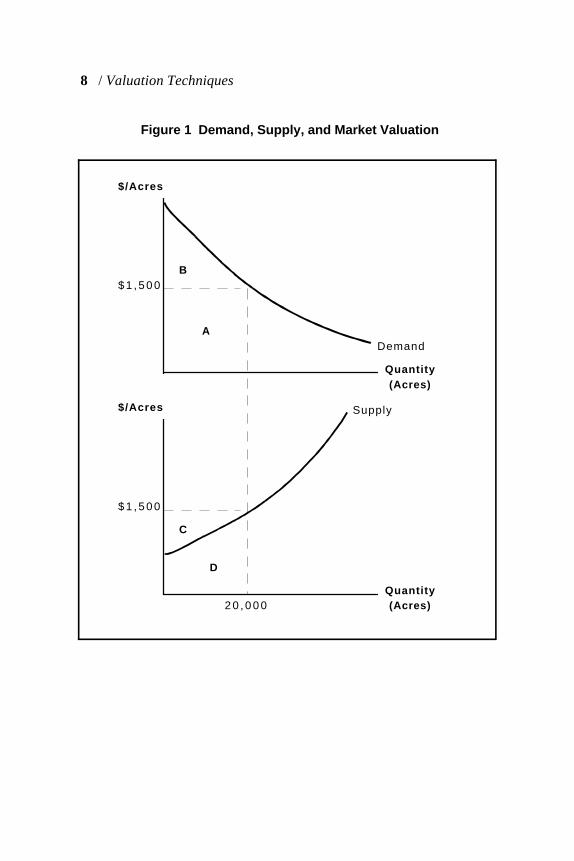
Demand for natural resources is measured on the assumption that manyfactors that might influence demand, such as personal income, the pricesof related goods and services, and individual tastes and preferences,remain unchanged during the study period. Under these assumptions, theestimated demand curve is a systematic measure of how people value theresource. To illustrate, Figure 1 shows that 20,000 acres of land weresold at a market price of $1500 per acre. In the course of these landtransactions, $30.0 million exchanged hands in the land market, i.e.,20,000 x $1500. Had land become increasingly scarce, this scarcitywould ultimately be reflected in higher land prices. Either fewer peoplewould purchase the land, or the same people would purchase less land.
$/Acres
$/Acres
Quantity (Acres)
Quantity (Acres)
B
A
C
D
$ 1 , 5 0 0
$ 1 , 5 0 0
Supply
Demand
2 0 , 0 0 0
8 / Valuation Techniques
Figure 1 Demand, Supply, and Market Valuation
Market-Based Techniques / 9
Now, consider the total area beneath the demand curve up to20,000 acres, as defined by A+B. This area measures the value ofthe resource in terms of the maximum willingness to pay for the20,000 acres of land. The total willingness to pay for 20,000 acres iscalculated by adding up what was actually spent in buying the land, A =$30 million, plus the additional triangular area B, which definesconsumer surplus. Consumer surplus is the difference between people’smaximum willingness to pay for 20,000 acres of land (A+B) and whatthey actually paid (A). In essence, the area gives a dollar measure ofsatisfaction that people received from the land, less what they actuallypay for it.
As a dollar measure of individual welfare, consumer surplus and expectedconsumer surplus are satisfactory for most studies, and many analystshave found them to be good empirical approximations of moretheoretically desirable measures. Evaluating consumer surplus requiresdata of market transactions for varying prices and quantities, as well asinformation on personal income and the prices of related goods andservices. People’s expenditures on resources would be an inappropriatemeasure of willingness to pay because it omits the consumer’s surplusfrom the overall valuation.
Producer surplus and economic rent are two other measures of thebenefits (or damages) associated with natural resources and resourceservices. Producer surplus measures monetary gains from the productionof natural resources, which is the difference between revenues (C+D) andthe economic costs of producing these resources (D). Similarly,economic rent measures monetary gains from using natural resources asfactors of production, which is the difference between the actualpayments made in using resources and the lowest payment that theirowners would have been willing to accept in supplying these resources orresource services. Thus, producer surplus refers to the sellers’ gains fromtrade in the product market, while economic rent measures the sellers’gains from trade in the input market. Accordingly, the use of producersurplus or economic rent in resource valuation problems depends on
10 / Valuation Techniques
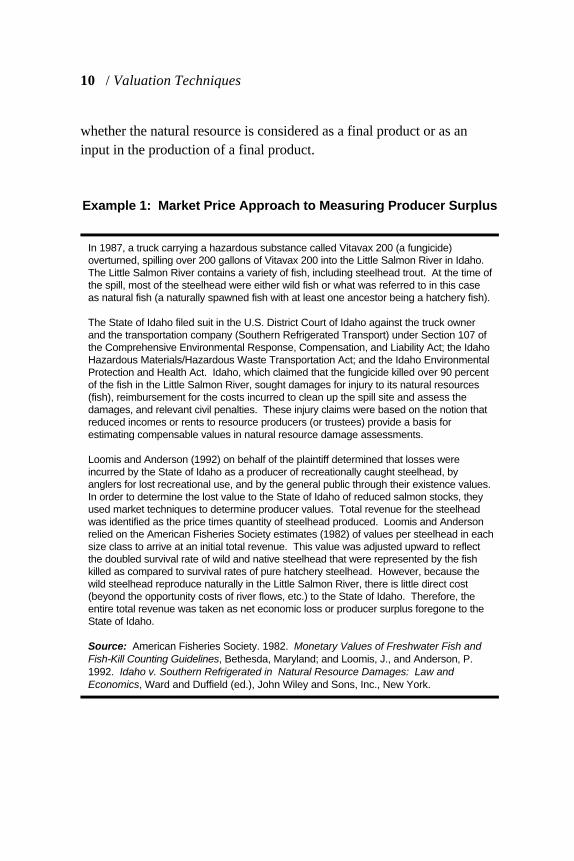
In 1987, a truck carrying a hazardous substance called Vitavax 200 (a fungicide)overturned, spilling over 200 gallons of Vitavax 200 into the Little Salmon River in Idaho. The Little Salmon River contains a variety of fish, including steelhead trout. At the time ofthe spill, most of the steelhead were either wild fish or what was referred to in this caseas natural fish (a naturally spawned fish with at least one ancestor being a hatchery fish).
The State of Idaho filed suit in the U.S. District Court of Idaho against the truck ownerand the transportation company (Southern Refrigerated Transport) under Section 107 ofthe Comprehensive Environmental Response, Compensation, and Liability Act; the IdahoHazardous Materials/Hazardous Waste Transportation Act; and the Idaho EnvironmentalProtection and Health Act. Idaho, which claimed that the fungicide killed over 90 percentof the fish in the Little Salmon River, sought damages for injury to its natural resources(fish), reimbursement for the costs incurred to clean up the spill site and assess thedamages, and relevant civil penalties. These injury claims were based on the notion thatreduced incomes or rents to resource producers (or trustees) provide a basis forestimating compensable values in natural resource damage assessments.
Loomis and Anderson (1992) on behalf of the plaintiff determined that losses wereincurred by the State of Idaho as a producer of recreationally caught steelhead, byanglers for lost recreational use, and by the general public through their existence values. In order to determine the lost value to the State of Idaho of reduced salmon stocks, theyused market techniques to determine producer values. Total revenue for the steelheadwas identified as the price times quantity of steelhead produced. Loomis and Andersonrelied on the American Fisheries Society estimates (1982) of values per steelhead in eachsize class to arrive at an initial total revenue. This value was adjusted upward to reflectthe doubled survival rate of wild and native steelhead that were represented by the fishkilled as compared to survival rates of pure hatchery steelhead. However, because thewild steelhead reproduce naturally in the Little Salmon River, there is little direct cost(beyond the opportunity costs of river flows, etc.) to the State of Idaho. Therefore, theentire total revenue was taken as net economic loss or producer surplus foregone to theState of Idaho.
Source: American Fisheries Society. 1982. Monetary Values of Freshwater Fish andFish-Kill Counting Guidelines, Bethesda, Maryland; and Loomis, J., and Anderson, P. 1992. Idaho v. Southern Refrigerated in Natural Resource Damages: Law andEconomics, Ward and Duffield (ed.), John Wiley and Sons, Inc., New York.
Example 1: Market Price Approach to Measuring Producer Surplus
whether the natural resource is considered as a final product or as aninput in the production of a final product.

Market-Based Techniques / 11
Referring again to Figure 1, producer surplus is shown by the area C,which is bordered by the resource supply curve and the market price ofthe resource, P = $1500. This measure reflects changes in the availabilityof the natural resource. For example, if the natural resource were dam-aged, its supply curve would shift leftward and producer surplus woulddiminish. A similar description could be given to natural resourcedamages that result in a reduction in economic rent. Here, the damageswould be incurred by the owners of the resources. As in the case ofmeasuring the consumer surplus, both producer surplus and economicrent require historical information on the market prices and quantities ofnatural resources. In addition, the measures of producer surplus andeconomic rent require information relating to the economic costs ofproducing and/or supplying the resource to the market.
Appraisal Method
Appraisal methods are particularly well suited to cases involving naturalresources that have been damaged. In the case of land, for example, theappraiser identifies the fair market value for comparable properties inboth the uninjured and injured conditions. The fair market value of theresource (land) is roughly defined as the amount a knowledgeable buyerwould pay a knowledgeable seller for the resources. This value shouldreflect, as closely as possible, the price at which the resource wouldactually sell in the market place at the time of the injury.
The application of appraisal methods would seem to hold particularpromise in DOE natural and environmental resource planning andguidance. Appraisal methods for resource valuation work have beenfound to be reliable under the Department of Interior’s and the NationalOceanic and Atmospheric Administration’s natural resource damageassessment regulations. However, the point to keep in mind is that themethod is, in fact, quite dependent on the appraiser’s judgment. It maybe very difficult to identify comparable sales, particularly for propertiesthat are “comparably” injured. In addition, the types of natural resources
12 / Valuation Techniques
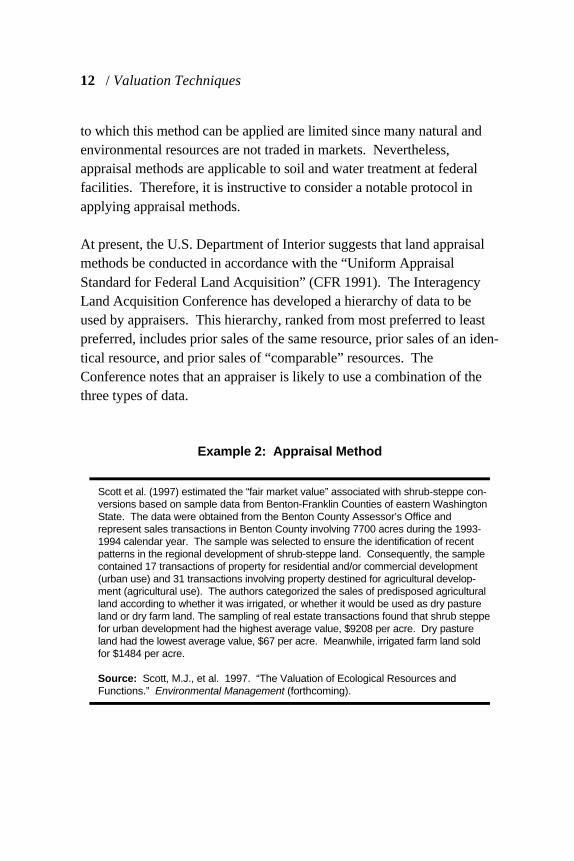
Scott et al. (1997) estimated the “fair market value” associated with shrub-steppe con-versions based on sample data from Benton-Franklin Counties of eastern WashingtonState. The data were obtained from the Benton County Assessor’s Office andrepresent sales transactions in Benton County involving 7700 acres during the 1993-1994 calendar year. The sample was selected to ensure the identification of recentpatterns in the regional development of shrub-steppe land. Consequently, the samplecontained 17 transactions of property for residential and/or commercial development(urban use) and 31 transactions involving property destined for agricultural develop-ment (agricultural use). The authors categorized the sales of predisposed agriculturalland according to whether it was irrigated, or whether it would be used as dry pastureland or dry farm land. The sampling of real estate transactions found that shrub steppefor urban development had the highest average value, $9208 per acre. Dry pastureland had the lowest average value, $67 per acre. Meanwhile, irrigated farm land soldfor $1484 per acre.
Source: Scott, M.J., et al. 1997. “The Valuation of Ecological Resources andFunctions.” Environmental Management (forthcoming).
Example 2: Appraisal Method
to which this method can be applied are limited since many natural andenvironmental resources are not traded in markets. Nevertheless,appraisal methods are applicable to soil and water treatment at federalfacilities. Therefore, it is instructive to consider a notable protocol inapplying appraisal methods.
At present, the U.S. Department of Interior suggests that land appraisalmethods be conducted in accordance with the “Uniform AppraisalStandard for Federal Land Acquisition” (CFR 1991). The InteragencyLand Acquisition Conference has developed a hierarchy of data to beused by appraisers. This hierarchy, ranked from most preferred to leastpreferred, includes prior sales of the same resource, prior sales of an iden-tical resource, and prior sales of “comparable” resources. TheConference notes that an appraiser is likely to use a combination of thethree types of data.
Market-Based Techniques / 13
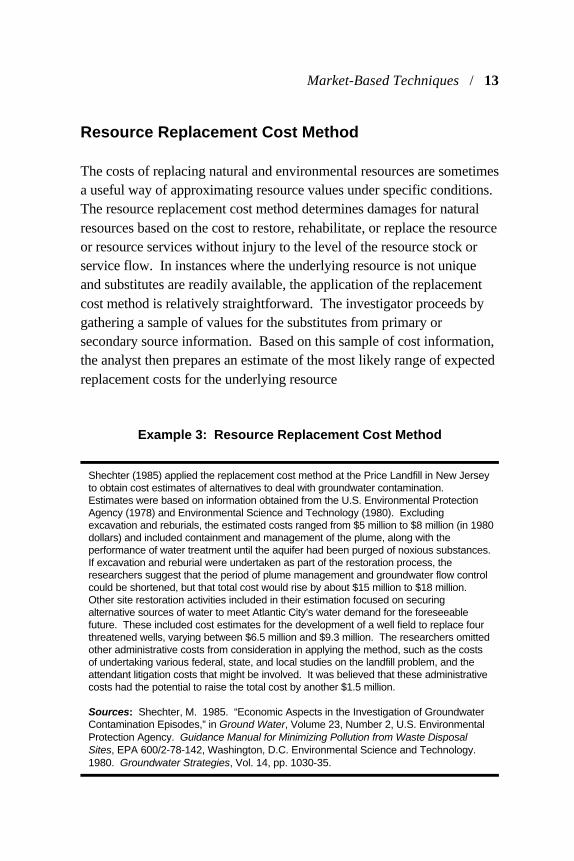
Shechter (1985) applied the replacement cost method at the Price Landfill in New Jerseyto obtain cost estimates of alternatives to deal with groundwater contamination. Estimates were based on information obtained from the U.S. Environmental ProtectionAgency (1978) and Environmental Science and Technology (1980). Excludingexcavation and reburials, the estimated costs ranged from $5 million to $8 million (in 1980dollars) and included containment and management of the plume, along with theperformance of water treatment until the aquifer had been purged of noxious substances. If excavation and reburial were undertaken as part of the restoration process, theresearchers suggest that the period of plume management and groundwater flow controlcould be shortened, but that total cost would rise by about $15 million to $18 million. Other site restoration activities included in their estimation focused on securingalternative sources of water to meet Atlantic City’s water demand for the foreseeablefuture. These included cost estimates for the development of a well field to replace fourthreatened wells, varying between $6.5 million and $9.3 million. The researchers omittedother administrative costs from consideration in applying the method, such as the costsof undertaking various federal, state, and local studies on the landfill problem, and theattendant litigation costs that might be involved. It was believed that these administrativecosts had the potential to raise the total cost by another $1.5 million.
Sources: Shechter, M. 1985. “Economic Aspects in the Investigation of GroundwaterContamination Episodes,” in Ground Water, Volume 23, Number 2, U.S. EnvironmentalProtection Agency. Guidance Manual for Minimizing Pollution from Waste DisposalSites, EPA 600/2-78-142, Washington, D.C. Environmental Science and Technology. 1980. Groundwater Strategies, Vol. 14, pp. 1030-35.
Example 3: Resource Replacement Cost Method
Resource Replacement Cost Method
The costs of replacing natural and environmental resources are sometimesa useful way of approximating resource values under specific conditions. The resource replacement cost method determines damages for naturalresources based on the cost to restore, rehabilitate, or replace the resourceor resource services without injury to the level of the resource stock orservice flow. In instances where the underlying resource is not uniqueand substitutes are readily available, the application of the replacementcost method is relatively straightforward. The investigator proceeds bygathering a sample of values for the substitutes from primary orsecondary source information. Based on this sample of cost information,the analyst then prepares an estimate of the most likely range of expectedreplacement costs for the underlying resource
14 / Valuation Techniques
or service. This process may be far more difficult to implement ininstances where resources possess unique characteristics. In these cases,little information exists to assemble a sample upon which to estimate theexpected value of the underlying resource.
While the replacement cost approach has been used in court settlementsfor damaged resources, there are problems concerning the interpretationof its meaning. For example, resource replacement cost can be viewed asmerely a convenient measure for compensation without implying actualrestoration of the natural resource to its previous state. Alternatively, itcan be viewed as including the costs of actually restoring the naturalresource habitat to its previous state and then replacing damagedorganisms. Another disadvantage of the replacement cost method is thatit is argued to be an arbitrary valuation of natural resources that may bearlittle relationship to true social value. The resource replacement costmethod requires data on the costs to restore, rehabilitate, or replaceinjured or lost resources and resource services.
Nonmarket Valuation: Indirect Techniques
Using market-based techniques to measure the monetary value of naturalresources is feasible provided there is sufficient market data. In manycases, however, market information relating to prices and quantities is notavailable to estimate the value of the resource or resource service. Inthese cases, researchers must employ what are referred to as nonmarketvaluation methods. These methods include indirect techniques that relyon observable behavior in order to deduce how much something is worthto individuals. Value estimates obtained using indirect nonmarketvaluation techniques are conceptually identical to the otherwiseunobservable market value. The indirect nonmarket valuation techniquesconsidered in this section include the travel cost method, the randomutility method, the hedonic pricing method, and the factor income method.
Nonmarket Valuation: Indirect Techniques / 15
Travel Cost Method
The travel cost method is popular for describing the demand for thenatural resource service(s) and environmental attributes of specificrecreational sites. Designated wilderness areas, ecological parks, fishingand hunting sites, and scenic sites are examples. People visit such sitesfrom diverse distances or points of origin. This observed “travelbehavior” is then used to evaluate the willingness to pay to visit the site;essentially, the different travel costs from these diverse points of originserve as proxies for willingness to pay to visit the site. Intuitively, onewould expect that the environmental attributes of sites influence the useof these sites. As such, changes in visitation rates may reflect changes inthe quality of natural resources particular to the site, thereby providing anestimate of the value of changes in natural resource and environmentalquality.
By gathering information on the number of visits to a particular site, theanalyst can estimate a demand function for the site that relates the num-ber of site visitations to the amount of travel costs incurred per visit,taking into consideration a set of independent household variables. Iffirst-hand information on individual visitation rates is not available to theanalyst, users of the site can often be grouped into travel zones around asite. Variations in visitation rates across zones can then be used toestimate the site demand function. In this way, travel cost modelsprovide benefit measures for changes in environmental quality found atsites, based on the observed behavior of recreational site users. Amongthe key advantages of applying the method at DOE sites is itsadaptability to many environmental quality issues where changes inquality affect the desirability of potential recreation sites.
In addition, the travel cost method can be easily implemented usingphone, onsite or mail surveys, or site registration data. In some cases,survey data may be available from local, state, and federal resourcemanagement agencies to obtain travel cost estimates of site values. Thetechnique is generally not perceived as being particularly controversial,
16 / Valuation Techniques
partly because of its long history in forestry economics, but mostlybecause it mimics common empirical techniques used elsewhere ineconomics. Analysts have tended to look favorably on the travel costapproach to natural resource valuation because it is based on actualbehavior rather than verbal responses to hypothetical scenarios. Individuals are actually observed spending money and time, and theireconomic values are deduced from their behavior. In appropriate circum-stances, travel cost models can often be applied without enormousexpense.
The greatest disadvantage of travel cost and other indirect techniques isthat they cannot be used unless there is some easily observable behaviorthat can be used to reveal values. In addition, travel cost models can betechnically and statistically complicated. Data must be employed tostatistically estimate increasingly sophisticated econometric models thattake into account sample selection problems and nonlinear consumersurplus estimates. In addition, the resulting estimates sometimes havebeen found to be rather sensitive to arbitrary choices of the functionalform of the estimating equation, the treatment of the value of an individ-ual’s time, the existence of multiple stops during the travel period, andthe recognition of substitute sites. Finally, the travel cost approachrequires that the analyst be in a position to correlate environmentalchanges with the behavior of visitors. Example 4 provides an illustrationof the method, taking these caveats into account.
Random Utility Models
Random utility models are conceptually linked with the travel cost modelsin that they seek the same sorts of values and use the same sort of logic. However, random utility models provide a different structure in which tomodel recreational demand, one which focuses attention on choicesamong substitute sites for any given recreational trip instead of thenumber of trips taken to a given site. These models are especially
Nonmarket Valuation: Indirect Techniques / 17
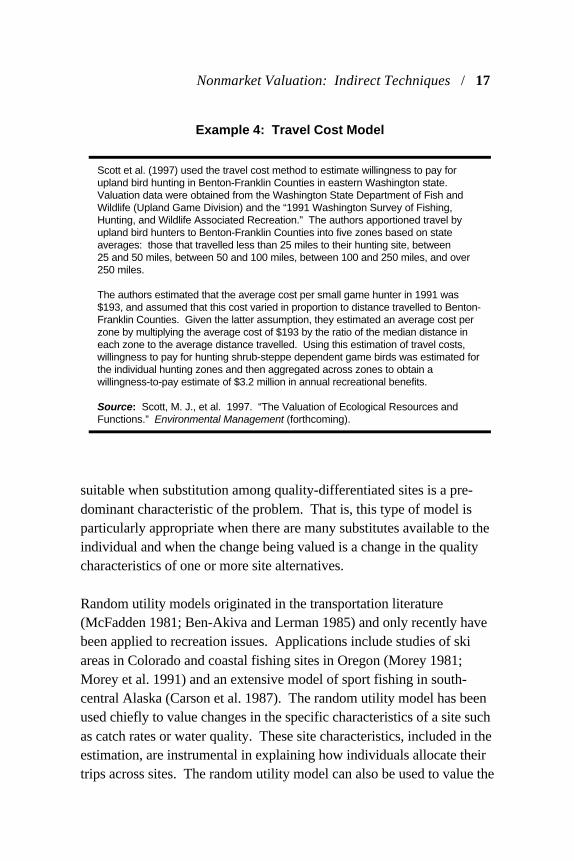
Scott et al. (1997) used the travel cost method to estimate willingness to pay forupland bird hunting in Benton-Franklin Counties in eastern Washington state. Valuation data were obtained from the Washington State Department of Fish andWildlife (Upland Game Division) and the “1991 Washington Survey of Fishing,Hunting, and Wildlife Associated Recreation.” The authors apportioned travel byupland bird hunters to Benton-Franklin Counties into five zones based on stateaverages: those that travelled less than 25 miles to their hunting site, between25 and 50 miles, between 50 and 100 miles, between 100 and 250 miles, and over250 miles.
The authors estimated that the average cost per small game hunter in 1991 was$193, and assumed that this cost varied in proportion to distance travelled to Benton-Franklin Counties. Given the latter assumption, they estimated an average cost perzone by multiplying the average cost of $193 by the ratio of the median distance ineach zone to the average distance travelled. Using this estimation of travel costs,willingness to pay for hunting shrub-steppe dependent game birds was estimated forthe individual hunting zones and then aggregated across zones to obtain awillingness-to-pay estimate of $3.2 million in annual recreational benefits.
Source: Scott, M. J., et al. 1997. “The Valuation of Ecological Resources andFunctions.” Environmental Management (forthcoming).
Example 4: Travel Cost Model
suitable when substitution among quality-differentiated sites is a pre-dominant characteristic of the problem. That is, this type of model isparticularly appropriate when there are many substitutes available to theindividual and when the change being valued is a change in the qualitycharacteristics of one or more site alternatives.
Random utility models originated in the transportation literature(McFadden 1981; Ben-Akiva and Lerman 1985) and only recently havebeen applied to recreation issues. Applications include studies of skiareas in Colorado and coastal fishing sites in Oregon (Morey 1981;Morey et al. 1991) and an extensive model of sport fishing in south-central Alaska (Carson et al. 1987). The random utility model has beenused chiefly to value changes in the specific characteristics of a site suchas catch rates or water quality. These site characteristics, included in theestimation, are instrumental in explaining how individuals allocate theirtrips across sites. The random utility model can also be used to value the
18 / Valuation Techniques
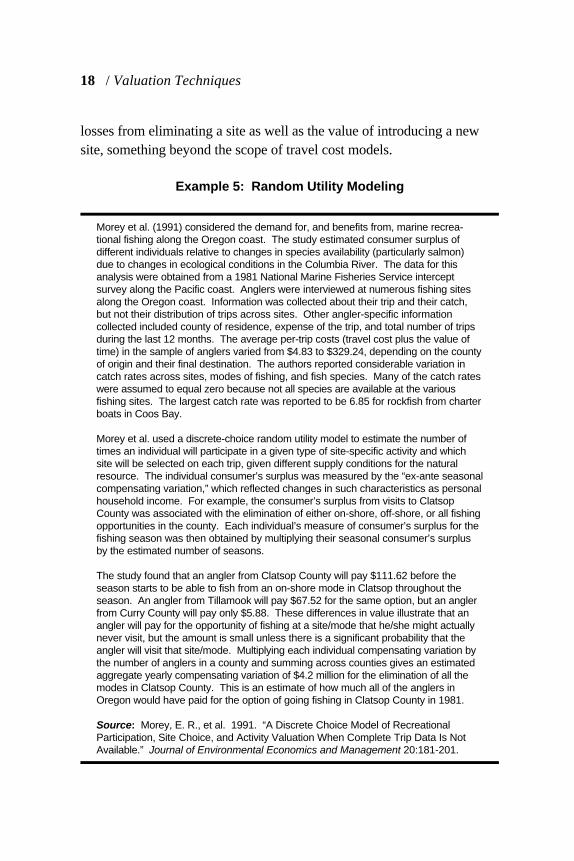
Morey et al. (1991) considered the demand for, and benefits from, marine recrea-tional fishing along the Oregon coast. The study estimated consumer surplus ofdifferent individuals relative to changes in species availability (particularly salmon)due to changes in ecological conditions in the Columbia River. The data for thisanalysis were obtained from a 1981 National Marine Fisheries Service interceptsurvey along the Pacific coast. Anglers were interviewed at numerous fishing sitesalong the Oregon coast. Information was collected about their trip and their catch,but not their distribution of trips across sites. Other angler-specific informationcollected included county of residence, expense of the trip, and total number of tripsduring the last 12 months. The average per-trip costs (travel cost plus the value oftime) in the sample of anglers varied from $4.83 to $329.24, depending on the countyof origin and their final destination. The authors reported considerable variation incatch rates across sites, modes of fishing, and fish species. Many of the catch rateswere assumed to equal zero because not all species are available at the variousfishing sites. The largest catch rate was reported to be 6.85 for rockfish from charterboats in Coos Bay.
Morey et al. used a discrete-choice random utility model to estimate the number oftimes an individual will participate in a given type of site-specific activity and whichsite will be selected on each trip, given different supply conditions for the naturalresource. The individual consumer’s surplus was measured by the “ex-ante seasonalcompensating variation,” which reflected changes in such characteristics as personalhousehold income. For example, the consumer’s surplus from visits to ClatsopCounty was associated with the elimination of either on-shore, off-shore, or all fishingopportunities in the county. Each individual’s measure of consumer’s surplus for thefishing season was then obtained by multiplying their seasonal consumer’s surplusby the estimated number of seasons.
The study found that an angler from Clatsop County will pay $111.62 before theseason starts to be able to fish from an on-shore mode in Clatsop throughout theseason. An angler from Tillamook will pay $67.52 for the same option, but an anglerfrom Curry County will pay only $5.88. These differences in value illustrate that anangler will pay for the opportunity of fishing at a site/mode that he/she might actuallynever visit, but the amount is small unless there is a significant probability that theangler will visit that site/mode. Multiplying each individual compensating variation bythe number of anglers in a county and summing across counties gives an estimatedaggregate yearly compensating variation of $4.2 million for the elimination of all themodes in Clatsop County. This is an estimate of how much all of the anglers inOregon would have paid for the option of going fishing in Clatsop County in 1981.
Source: Morey, E. R., et al. 1991. “A Discrete Choice Model of RecreationalParticipation, Site Choice, and Activity Valuation When Complete Trip Data Is NotAvailable.” Journal of Environmental Economics and Management 20:181-201.
Example 5: Random Utility Modeling
losses from eliminating a site as well as the value of introducing a newsite, something beyond the scope of travel cost models.
Nonmarket Valuation: Indirect Techniques / 19
Unlike travel cost models, however, random utility models cannot explainthe total number of trips an individual takes to a given site in a season. Nonetheless, random utility models would seem to provide a usefultechnique for comparing benefits of site restoration or decontaminationactivities across waste sites at federal facilities. To the best of ourknowledge, no such applications have been undertaken.
Hedonic Price Method - Amenity Value
Hedonic pricing is a useful tool in the assessment of amenity value. Earlyanalysis related residential property values to neighborhood amenities. These models provided an inferential measure of people’s willingness topay for the amenity under study. The method is used mostly to estimatethe willingness to pay for variations in property values due to thepresence or absence of specific environmental attributes, such as airquality, noise, and panoramic vistas. By comparing the market value oftwo properties having different degrees of a specific attribute, analystsextract the implicit value of the attribute to property buyers and sellers. A variation on the approach is to compare the price of a single piece ofproperty over successive sales. By correcting for other factors that mighthave influenced the value of the property, the analyst can isolate theimplicit price of an amenity or bundle of amenities that have changedover time.
Consider the impacts of the completion of a DOE environmental restora-tion activity on the price of neighboring land. At one time, the proximityof the parcel of private property to an abandoned DOE waste site mayhave reflected the disamenities of living in a hazardous environment. Years later, upon restoration of the site, the hedonic model would suggestan implicit value for DOE investments in environmental improvements. Similar analogies can be drawn in relation to the estimation of monetarydamages to natural resources from environmental disamenities, or the
20 / Valuation Techniques
monetary benefits of investing in their improvement. Accordingly,hedonic pricing methods appear to be well suited to DOE planning workinvolving Environmental Impact Statements (EISs) and Natural ResourceDamage Assessments.
However, the reader should be made aware of caveats pertaining to thevalues obtained from hedonic price functions. In particular, the resourcevalues that are obtained directly from the estimated hedonic price function are subject to fairly restrictive assumptions. It may benecessary to employ additional information from multiple commodity markets relating to the resource under consideration. Overall, the result-ing hedonic price will depend on the availability of market informationpertaining to the resource, and the revelation of buyer and sellerpreferences through market behavior. Market data on property sales andcharacteristics are available through real estate services and municipalsources and can be readily linked with other secondary data sources. Despite these positives, a guarded interpretation of the estimated welfarechanges is recommended. Estimation and interpretation of thesemeasures can be complex and the data requirements demanding, andthere is a need to control for many important socio-demographiccharacteristics.
Hedonic Price Method - Value of Life
Hedonic pricing methods have also been applied in the estimation ofeconomic damages associated with occupational health and safety risksand are becoming more widely accepted in the determination of personalinjury awards in liability cases. Application in this branch of the hedonicvaluation literature often refers to the “value of life” or the “hedonicvalue of life.” Clearly, there is no such thing as a unique value of life. Consequently, meaningful estimates of the hedonic value of life varyaccording to the specific context under consideration. For one, it must bemade clear whose value is under consideration: Is it a worker whounderstands and accepts a health/safety risk, or is it a
Nonmarket Valuation: Indirect Techniques / 21
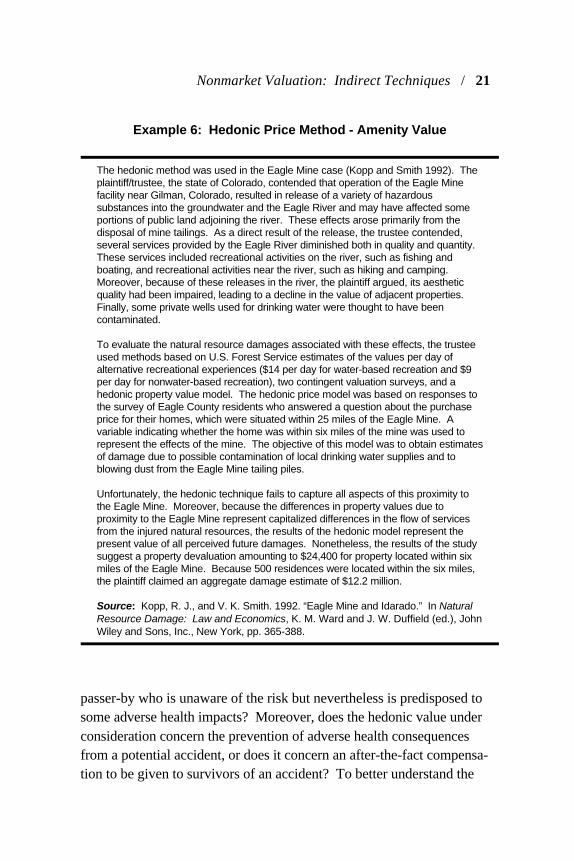
The hedonic method was used in the Eagle Mine case (Kopp and Smith 1992). Theplaintiff/trustee, the state of Colorado, contended that operation of the Eagle Minefacility near Gilman, Colorado, resulted in release of a variety of hazardoussubstances into the groundwater and the Eagle River and may have affected someportions of public land adjoining the river. These effects arose primarily from thedisposal of mine tailings. As a direct result of the release, the trustee contended,several services provided by the Eagle River diminished both in quality and quantity. These services included recreational activities on the river, such as fishing andboating, and recreational activities near the river, such as hiking and camping. Moreover, because of these releases in the river, the plaintiff argued, its aestheticquality had been impaired, leading to a decline in the value of adjacent properties. Finally, some private wells used for drinking water were thought to have beencontaminated.
To evaluate the natural resource damages associated with these effects, the trusteeused methods based on U.S. Forest Service estimates of the values per day ofalternative recreational experiences ($14 per day for water-based recreation and $9per day for nonwater-based recreation), two contingent valuation surveys, and ahedonic property value model. The hedonic price model was based on responses tothe survey of Eagle County residents who answered a question about the purchaseprice for their homes, which were situated within 25 miles of the Eagle Mine. Avariable indicating whether the home was within six miles of the mine was used torepresent the effects of the mine. The objective of this model was to obtain estimatesof damage due to possible contamination of local drinking water supplies and toblowing dust from the Eagle Mine tailing piles.
Unfortunately, the hedonic technique fails to capture all aspects of this proximity tothe Eagle Mine. Moreover, because the differences in property values due toproximity to the Eagle Mine represent capitalized differences in the flow of servicesfrom the injured natural resources, the results of the hedonic model represent thepresent value of all perceived future damages. Nonetheless, the results of the studysuggest a property devaluation amounting to $24,400 for property located within sixmiles of the Eagle Mine. Because 500 residences were located within the six miles,the plaintiff claimed an aggregate damage estimate of $12.2 million.
Source: Kopp, R. J., and V. K. Smith. 1992. “Eagle Mine and Idarado.” In NaturalResource Damage: Law and Economics, K. M. Ward and J. W. Duffield (ed.), JohnWiley and Sons, Inc., New York, pp. 365-388.
Example 6: Hedonic Price Method - Amenity Value
passer-by who is unaware of the risk but nevertheless is predisposed tosome adverse health impacts? Moreover, does the hedonic value underconsideration concern the prevention of adverse health consequencesfrom a potential accident, or does it concern an after-the-fact compensa-tion to be given to survivors of an accident? To better understand the
22 / Valuation Techniques
significance of these questions, it is instructive to clarify the concepts thatare involved by distinguishing between two basic hedonic damage values: the insurance value and the deterrence value.
Insurance value is the amount that an individual is willing to pay toensure a preferred level of welfare, assuming a) that they fully understandthe risk to which they are predisposed and b) that the costs of buyinginsurance are in perfect correspondence to the specific risk under con-sideration. Meanwhile, deterrence values are used by leading practi-tioners as the appropriate measure of compensation value that should becharged from the standpoint of the accident victim. The amounts gener-ally exceed the insurance value, as these tend to reflect individualattitudes towards all consequences of the risk. This would include thevalue that the individual has attached to the risk of experiencing theinjury, losing income as a result of the injury, and losing the ability toenjoy life.
Conceptually, these two hedonic value-of-life measures can be used todetermine the amount of compensation required to make the accidentvictim(s) whole by either restoring or maintaining a benchmark pre-accident level of welfare. One of the most important results identified inthe literature is that workers who are predisposed to a typical occupa-tional injury would select an amount of insurance compensation belowthat which would be required to completely restore their pre-accidentlevel of welfare.
To illustrate the potential applicability of hedonic value methods, con-sider the accompanying example, which involves estimating the monetarybenefits of meeting regulatory safety or compliance standards, such as theattainment of ALARA dose limits. In considering this example, thereader should keep in mind that there are added ambiguities in deter-mining hedonic value-of-life estimates in the context of human healthrisks accompanying environmental restoration and waste managementactivities. More specifically, there is apt to be a varying degree of onsite
Nonmarket Valuation: Indirect Techniques / 23
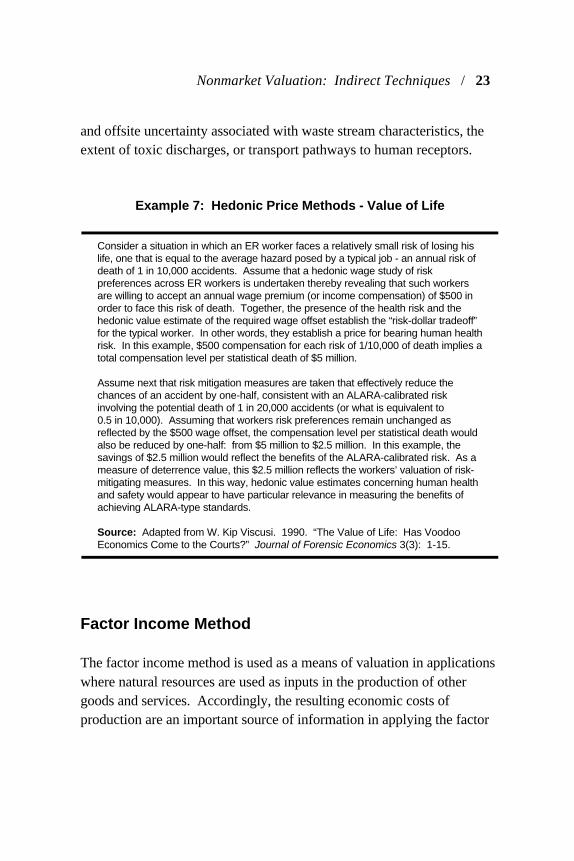
Consider a situation in which an ER worker faces a relatively small risk of losing hislife, one that is equal to the average hazard posed by a typical job - an annual risk ofdeath of 1 in 10,000 accidents. Assume that a hedonic wage study of riskpreferences across ER workers is undertaken thereby revealing that such workersare willing to accept an annual wage premium (or income compensation) of $500 inorder to face this risk of death. Together, the presence of the health risk and thehedonic value estimate of the required wage offset establish the “risk-dollar tradeoff”for the typical worker. In other words, they establish a price for bearing human healthrisk. In this example, $500 compensation for each risk of 1/10,000 of death implies atotal compensation level per statistical death of $5 million.
Assume next that risk mitigation measures are taken that effectively reduce thechances of an accident by one-half, consistent with an ALARA-calibrated riskinvolving the potential death of 1 in 20,000 accidents (or what is equivalent to 0.5 in 10,000). Assuming that workers risk preferences remain unchanged asreflected by the $500 wage offset, the compensation level per statistical death wouldalso be reduced by one-half: from $5 million to $2.5 million. In this example, thesavings of $2.5 million would reflect the benefits of the ALARA-calibrated risk. As ameasure of deterrence value, this $2.5 million reflects the workers’ valuation of risk-mitigating measures. In this way, hedonic value estimates concerning human healthand safety would appear to have particular relevance in measuring the benefits ofachieving ALARA-type standards.
Source: Adapted from W. Kip Viscusi. 1990. “The Value of Life: Has VoodooEconomics Come to the Courts?” Journal of Forensic Economics 3(3): 1-15.
Example 7: Hedonic Price Methods - Value of Life
and offsite uncertainty associated with waste stream characteristics, theextent of toxic discharges, or transport pathways to human receptors.
Factor Income Method
The factor income method is used as a means of valuation in applicationswhere natural resources are used as inputs in the production of othergoods and services. Accordingly, the resulting economic costs ofproduction are an important source of information in applying the factor
24 / Valuation Techniques
income approach. While the method of factor income is not as well-defined or widely referenced as the hedonic price or travel cost method-ologies, it is recognized by the U.S. Department of Interior’s naturalresource damage assessment regulations.
There are several types of resources for which the factor income approachis potentially well-suited, including surface water and groundwaterresources, forests, and commercial fisheries. Surface and groundwaterresources may be inputs to irrigated agriculture, to manufacturing, or toprivately owned municipal water systems. The products in these cases(agricultural crops, sawlogs, manufactured goods, and municipal water)may all have market prices. Similarly, commercial fishery resources (fishpopulations or stocks) are inputs to the production of a catch of saleablefish. A variation on this theme may be useful for valuing damages towater resources.
In cases involving damages to water resources that are used in productionprocesses, for example, one might identify the incremental cost oftreating water sufficiently to return it to the pre-release water qualitylevel. For example, a manufacturer who already engages in some form ofwater treatment as part of its production process might experienceincreased treatment costs because of hazardous substance releasesupstream. If all other things are unchanged (product price, the mix ofinputs in the production process, output levels), then the increased costper unit of “clean water” provides a measure of lost factor income. Thisapproach is convenient in that the costs of treating water are separatedfrom other production costs incurred in the manufacturing process. Similarly, the example suggests that treatment costs might be applicableto a wide variety of situations of interest to DOE field operations.
There are, however, potential problems in applying the factor incomeapproach. First, a particular treatment option might not be the least-costor optimal response on the part of the water-using entity. For example, itmight be cheaper to change the production process, buy municipal wateror otherwise obtain a different source of water, or make other changes to
Nonmarket Evaluation: Contingent Valuation / 25
the equipment or materials used. In this case, changes in water treatmentcosts may overstate damages. Second, it is possible that other things maychange, particularly price and output levels. These potential problemscan complicate the analysis and require the researcher to obtain additionaltechnical information concerning the supply and demand of theunderlying resource or resource service.
Nonmarket Valuation: Contingent Valuation
Given the potential shortcomings in applying indirect nonmarket valua-tion techniques, researchers have advanced the use of a more directapproach, namely contingent market valuation. Contingent marketanalysis has estimated a wide variety of use and nonuse values.
The most obvious way to measure nonmarket values is to ask people howmuch they would be willing to pay for the resource or avoid any damagesthat might be sustained by the resource. Alternatively, one could ask howmuch people would be willing to accept as compensation for damages tothe resource. Measures obtained using this technique rely on people’shypothetical willingness to pay rather than actual market-information ontheir behavior: hence, the term contingent valuation (CV). Thecontingent valuation method is a survey-based approach to the valuationof nonmarket goods and services. It uses questionnaires to elicitinformation about the preference-related value of the natural resource inquestion. The value is said to be contingent upon the existence of ahypothetical market as described in the survey put to respondents. Inprinciple, contingent valuation could be used to estimate the economicvalue of almost anything. By default, it is the only method that holds thepromise of measuring nonuse values since all other methods depend onobserving actual behavior associated with the natural resource.
26 / Valuation Techniques
Contingent valuation surveys may be conducted as face-to-face inter-views, telephone interviews, or mail surveys based on a randomlyselected sample or stratified sample of individuals. Face-to-faceinterviews are the most expensive survey administration format, but theyare generally considered the best, especially if visual material needs to bepresented. The central goal of the survey is to generate data onrespondents’ willingness to pay for (or willingness to accept) someprogram or plan that will impact their well-being.
Each respondent is given information about a particular problem. Each isthen presented with a hypothetical occurrence (e.g., specie endangerment)or a policy action that ensures against the disaster (e.g., specieprotection). Each respondent is asked how much he/she would be willingto pay either to avoid the negative occurrence or bring about the positiveoccurrence. The means of payment (i.e., the payment vehicle) can take onany number of different forms, including a direct tax, an income tax, oran access fee. The actual format may take the form of a direct question(“how much?”), a bidding procedure (a ranking of alternatives), orreferenda votes. Using a referendum to elicit values is preferred becauseit is the one that people are most familiar with. Resulting data are thenanalyzed statistically and extrapolated to the population that the samplerepresents. These responses are gathered along with socio-demographicinformation and test statistics required to determine the consistency ofresponses and the sensitivity to scope.
When conducted according to the exacting standards of the profession,these studies can be very expensive because of the extensive pre-testingand survey work. In addition, while this technique appears easy, itsapplication involves numerous technical challenges. For example, appli-cations of the method are prone to strategic biases on the part ofrespondents or to structural problems in the design of the questionnaire(Mitchell and Carson 1989). Question framing, mode of administration,payment formats, and interviewer interactions can all affect the results ofcontingent market valuation (Cummings et al. 1986).
Nonmarket Evaluation: Contingent Valuation / 27
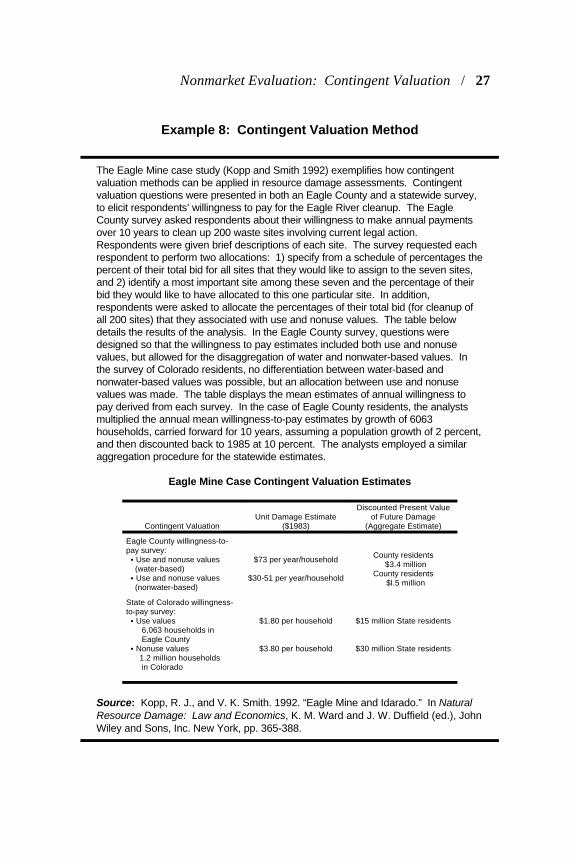
The Eagle Mine case study (Kopp and Smith 1992) exemplifies how contingentvaluation methods can be applied in resource damage assessments. Contingentvaluation questions were presented in both an Eagle County and a statewide survey,to elicit respondents’ willingness to pay for the Eagle River cleanup. The EagleCounty survey asked respondents about their willingness to make annual paymentsover 10 years to clean up 200 waste sites involving current legal action. Respondents were given brief descriptions of each site. The survey requested eachrespondent to perform two allocations: 1) specify from a schedule of percentages thepercent of their total bid for all sites that they would like to assign to the seven sites,and 2) identify a most important site among these seven and the percentage of theirbid they would like to have allocated to this one particular site. In addition,respondents were asked to allocate the percentages of their total bid (for cleanup ofall 200 sites) that they associated with use and nonuse values. The table belowdetails the results of the analysis. In the Eagle County survey, questions weredesigned so that the willingness to pay estimates included both use and nonusevalues, but allowed for the disaggregation of water and nonwater-based values. Inthe survey of Colorado residents, no differentiation between water-based andnonwater-based values was possible, but an allocation between use and nonusevalues was made. The table displays the mean estimates of annual willingness topay derived from each survey. In the case of Eagle County residents, the analystsmultiplied the annual mean willingness-to-pay estimates by growth of 6063households, carried forward for 10 years, assuming a population growth of 2 percent,and then discounted back to 1985 at 10 percent. The analysts employed a similaraggregation procedure for the statewide estimates.
Eagle Mine Case Contingent Valuation Estimates
Contingent ValuationUnit Damage Estimate
($1983)
Discounted Present Valueof Future Damage
(Aggregate Estimate)
Eagle County willingness-to-pay survey: C Use and nonuse values (water-based) C Use and nonuse values (nonwater-based)
$73 per year/household
$30-51 per year/household
County residents $3.4 million
County residents $l.5 million
State of Colorado willingness-to-pay survey: C Use values 6,063 households in Eagle County C Nonuse values 1.2 million households in Colorado
$1.80 per household
$3.80 per household
$15 million State residents
$30 million State residents
Source: Kopp, R. J., and V. K. Smith. 1992. “Eagle Mine and Idarado.” In NaturalResource Damage: Law and Economics, K. M. Ward and J. W. Duffield (ed.), JohnWiley and Sons, Inc. New York, pp. 365-388.
Example 8: Contingent Valuation Method
28 / Valuation Techniques
The quality of a contingent valuation survey questionnaire is sensitive tothe amount of information that is known beforehand about the waypeople think about the underlying natural resource. Certainly, priorinformation on the ecological attributes or environmental qualities of aparticular resource are critical factors in conducting a successful contin-gent valuation survey. The key point is that, while all the informationnecessary for assessing an individual’s value of the resource is collectedin the survey, the analyst must also be able to identify a truly representa-tive sample of well-informed respondents in order to allow extrapolationto the general subject population. Thus, information on who uses theresource and who knows about it is critical.
Cross-Cutting Methods
At the present time, there is considerable professional interest in naturalresource valuations that are based on cross-cutting methods. Thesevaluation techniques combine elements from market-based methods withpre-existing estimates of natural resource values based on either direct orindirect nonmarket valuation techniques. The interest in applying cross-cutting techniques is motivated by the relative simplicity of using a pre-existing study based on an accepted method, as well as the costconsiderations in undertaking a fresh natural resource valuation study. Two cross-cutting resource valuation techniques that have gainedincreased professional attention due to their simplicity and economy ofapplication are discussed here: benefit transfer and unit day value.
Benefit Transfer
Benefit transfer is the use of the estimated values or demand relationshipin existing studies to evaluate a site or event for which no site-specificstudy is available. Given the expense and time associated with theestimation of values of nonmarket natural resources and services,
Cross-Cutting Methods / 29
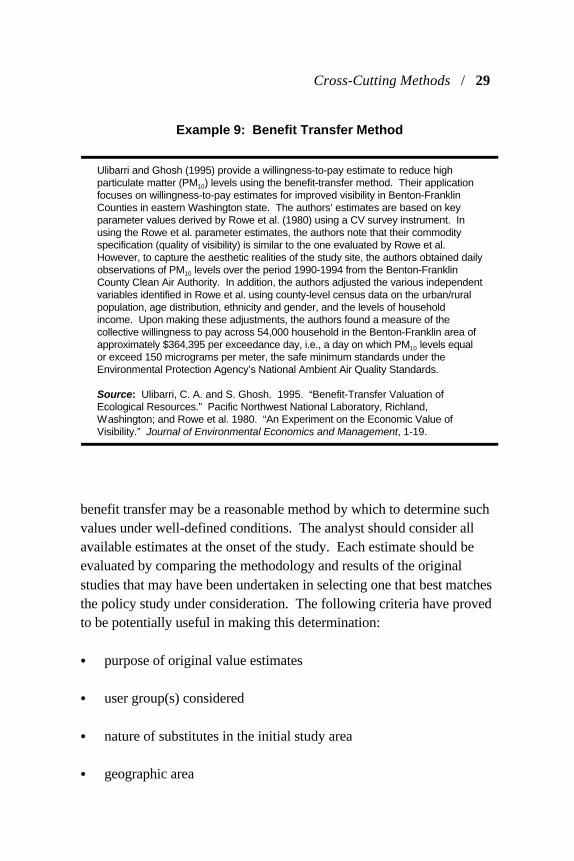
Ulibarri and Ghosh (1995) provide a willingness-to-pay estimate to reduce highparticulate matter (PM ) levels using the benefit-transfer method. Their application10
focuses on willingness-to-pay estimates for improved visibility in Benton-FranklinCounties in eastern Washington state. The authors’ estimates are based on keyparameter values derived by Rowe et al. (1980) using a CV survey instrument. Inusing the Rowe et al. parameter estimates, the authors note that their commodityspecification (quality of visibility) is similar to the one evaluated by Rowe et al. However, to capture the aesthetic realities of the study site, the authors obtained dailyobservations of PM levels over the period 1990-1994 from the Benton-Franklin10
County Clean Air Authority. In addition, the authors adjusted the various independentvariables identified in Rowe et al. using county-level census data on the urban/ruralpopulation, age distribution, ethnicity and gender, and the levels of householdincome. Upon making these adjustments, the authors found a measure of thecollective willingness to pay across 54,000 household in the Benton-Franklin area ofapproximately $364,395 per exceedance day, i.e., a day on which PM levels equal10
or exceed 150 micrograms per meter, the safe minimum standards under theEnvironmental Protection Agency’s National Ambient Air Quality Standards.
Source: Ulibarri, C. A. and S. Ghosh. 1995. “Benefit-Transfer Valuation ofEcological Resources.” Pacific Northwest National Laboratory, Richland,Washington; and Rowe et al. 1980. “An Experiment on the Economic Value ofVisibility.” Journal of Environmental Economics and Management, 1-19.
Example 9: Benefit Transfer Method
benefit transfer may be a reasonable method by which to determine suchvalues under well-defined conditions. The analyst should consider allavailable estimates at the onset of the study. Each estimate should beevaluated by comparing the methodology and results of the originalstudies that may have been undertaken in selecting one that best matchesthe policy study under consideration. The following criteria have provedto be potentially useful in making this determination:
C purpose of original value estimates
C user group(s) considered
C nature of substitutes in the initial study area
C geographic area
30 / Valuation Techniques
C demographic and socio-economic characteristics
C baseline conditions
C specific or unique problem that may be influenced bythe magnitude of the estimates
C general attitudes, perceptions, or levels of knowledge
C omitted variables described above.
Once a final set of values has been chosen, consideration should be givento the general magnitudes of the values. If the existing value estimatesdiffer significantly, or if values generated using alternative models differsignificantly from one another, consideration should be given to whetherthey differ in a predictable and consistent manner. In many cases, thedefensibility of the transferred economic benefit estimate will depend onthe quality of the underlying research. There are no globally accepted,standard criteria by which the quality of existing studies can be judged. Decision-makers should, therefore, seek the guidance of the professionaland academic economics community concerning the current minimumconditions for accurate use of the benefit transfer method.
Unit Day Value Method
The unit day value method is similar to the benefit transfer method,except that an average value is derived based on multiple value estimatesfrom existing studies. Consequently, the unit day value of the underlyingresource reflects a resource having average preference-related attributes,amenities, or qualities. Any of the valuation approaches described abovecan potentially serve as underlying studies from which unit day values aredrawn. The application of the unit day
Cross-Cutting Methods / 31
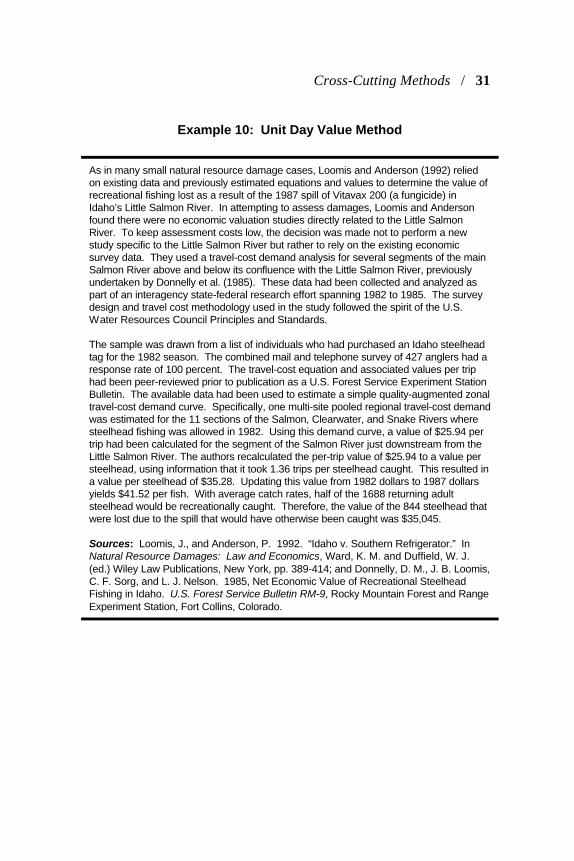
As in many small natural resource damage cases, Loomis and Anderson (1992) reliedon existing data and previously estimated equations and values to determine the value ofrecreational fishing lost as a result of the 1987 spill of Vitavax 200 (a fungicide) inIdaho’s Little Salmon River. In attempting to assess damages, Loomis and Andersonfound there were no economic valuation studies directly related to the Little SalmonRiver. To keep assessment costs low, the decision was made not to perform a newstudy specific to the Little Salmon River but rather to rely on the existing economicsurvey data. They used a travel-cost demand analysis for several segments of the mainSalmon River above and below its confluence with the Little Salmon River, previouslyundertaken by Donnelly et al. (1985). These data had been collected and analyzed aspart of an interagency state-federal research effort spanning 1982 to 1985. The surveydesign and travel cost methodology used in the study followed the spirit of the U.S.Water Resources Council Principles and Standards.
The sample was drawn from a list of individuals who had purchased an Idaho steelheadtag for the 1982 season. The combined mail and telephone survey of 427 anglers had aresponse rate of 100 percent. The travel-cost equation and associated values per triphad been peer-reviewed prior to publication as a U.S. Forest Service Experiment StationBulletin. The available data had been used to estimate a simple quality-augmented zonaltravel-cost demand curve. Specifically, one multi-site pooled regional travel-cost demandwas estimated for the 11 sections of the Salmon, Clearwater, and Snake Rivers wheresteelhead fishing was allowed in 1982. Using this demand curve, a value of $25.94 pertrip had been calculated for the segment of the Salmon River just downstream from theLittle Salmon River. The authors recalculated the per-trip value of $25.94 to a value persteelhead, using information that it took 1.36 trips per steelhead caught. This resulted ina value per steelhead of $35.28. Updating this value from 1982 dollars to 1987 dollarsyields $41.52 per fish. With average catch rates, half of the 1688 returning adultsteelhead would be recreationally caught. Therefore, the value of the 844 steelhead thatwere lost due to the spill that would have otherwise been caught was $35,045.
Sources: Loomis, J., and Anderson, P. 1992. “Idaho v. Southern Refrigerator.” InNatural Resource Damages: Law and Economics, Ward, K. M. and Duffield, W. J.(ed.) Wiley Law Publications, New York, pp. 389-414; and Donnelly, D. M., J. B. Loomis,C. F. Sorg, and L. J. Nelson. 1985, Net Economic Value of Recreational SteelheadFishing in Idaho. U.S. Forest Service Bulletin RM-9, Rocky Mountain Forest and RangeExperiment Station, Fort Collins, Colorado.
Example 10: Unit Day Value Method
32 / Valuation Techniques
value method may also involve groups of experts attempting to interpret from the existing set of estimates (regardless of method used in the origi-nal study) a best estimate for each of a set of generic types of envi-ronmental resources or activities. The unit day value approach then com-bines and converts these estimates into a standardized unit of measurethat reflects the average value of one unit of the resource on a per-daybasis.
In some cases, unit day values head part-way toward a reasonable benefittransfer approach by developing general categories across activity typesor geographical locations. However, unlike benefit transfer, there is noattempt to identify previous studies for comparable sites. For example,the U.S. Water Resources Council guidelines provide unit values acrossfairly broad activity types and settings. Similarly, the U.S. Forest Servicehas developed unit values that are specific for activity types and ForestService regions. However, the analyst must exercise caution whenapplying such unit day values, insofar as they may reflect a biasedselection of studies that reflect poorly on the existing economic value ofthe natural resource.
Ecological Valuation
The conventional natural resource valuation techniques described abovehave made little progress in providing a framework to assess the mone-tary value derived from ecological functions. One reason is that ecologi-cal functions are often overlooked in terms of providing preference-related value to humans. Thus, the state of the art in natural resourcevaluation is in search of a framework for addressing natural resourcevalues derived from ecological functions. This section first briefly dis-cusses the emerging field of ecological economics. It then considersgross primary energy valuation and non-glamorous resource valuation,which are two approaches to measure ecological values in the emergingfield of ecological economics.
Ecological Valuation / 33
Ecological Economics
Although controversial, some resource valuation professionals believethat changes in the service flows from ecological systems to humansociety can be valued in monetary terms, given existing knowledge,scientific data, and estimation techniques. They believe that this wouldbring such services into management discussions in terms symmetric withmarketed goods and services. As a general matter, this could improve theefficiency with which society uses resources. One reason for this view isthe belief that such pricing would encourage preservation by makingexplicit the opportunity cost of development and other economicactivities. These people support the continued refinement and extensionsof economic valuation techniques based on people’s preferences overecological resources.
Other experts express serious reservations about the prospects of deriv-ing willingness-to-pay estimates for ecological resources. Their distrustarises in part because of the potential lack of knowledge associated withpeople’s understanding of ecological functions and how ecological sys-tems are damaged through human activities. Without a firm under-standing of the ecological impacts of human intervention, there is noreliable way to estimate meaningful ecological damage. Accordingly,there is skepticism as to whether monetary values can be assigned todamages that might arise within the intricate web of ecological inter-dependencies in both small- and large-scale ecosystems. Nevertheless,monetary values are beginning to surface in the ecological economicsliterature. One approach is based on the energy valuation of gross pri-mary production, which incorporates both economic and ecologicalvalues in one index.
34 / Valuation Techniques
Gross Primary Energy Valuation
This procedure has been applied to the valuation of different wetlandtypes (Constanza et al. 1989). It is argued that estimates of gross pri-mary production have merit since the entire food chain depends upon thisprimary production. The methodology is not without its problems,however. For instance, it is not well understood whether those speciessupported by a particular food chain have equal social values. In general,the embodied energy approach measures only ecologically based values. Unlike an economic valuation approach, values for such functions andservices as storm protection, aesthetics, and water treatment arecompletely ignored.
Recently, an alternative cross-cutting approach to environmental issueshas come under the rubric of ecological-economic valuation. A team ofecologists and economists sponsored by the U.S. EnvironmentalProtection Agency (EPA) has undertaken the development of a cross-cutting model of an ecological-economic system (i.e., the MarylandPatuxent Watershed), with emphasis on wetlands. Preliminary work isbased on a coastal ecological landscape spatial simulation model devel-oped by Robert Costanza and colleagues from the University ofMaryland. Ultimately, the cross-cutting model may incorporate economicbehavior, thereby capturing interrelationships between human activities,the ecosystem, and ecological valuation. A related attempt at employingcross-cutting techniques in determining ecological values is based on therecognition that humans may have preferences relating to the functionsand services performed by ecological resources, referred to as ecologicalresource valuation.
Ecological Resource Valuation
The need for a framework addressing the value of ecological functions isparticularly acute in assessing policy choices that affect the integrity ofecological systems. Using the example of wind-blown dust, Ulibarri and
Ecological Valuation / 35
Ghosh (1995) suggest that these policy decisions require a weighting ofecological values based on two related subsets of information: what isvalued by humans as an eco-good (i.e., cleaner air) and what has intrinsicvalue to the natural eco-system (i.e., vegetative cover). Using the termecological resources, the authors focused attention on resource servicesthat are functionally important to ecosystems but frequently overlookedin terms of providing value to humans. Such resources have receivedvery little attention relative to their more glamorous cousins, such asendangered salmon runs or old-growth timber stands.
The authors note that the key objectives of ecological resource valuationare a) to provide a framework that aggregates the values of goods andservices rendered by selected ecological functions and b) to determinedefensible upper and lower limits on these values. The possibility ofinterpolating between these limits would enable a more robust estimationof the value of eco-goods and services, allowing policy makers to form amore complete understanding of the benefits and costs of ecologicalpreservation.
The preliminary work undertaken by Scott et al. (1997) considered socialvalues associated with undeveloped shrub-steppe sites; these are aridenvirons which are traditionally overlooked in land-use decisions. Rela-tive to the perceived values, the authors attempted applications of thebenefit transfer method, the travel cost method, and the method ofhedonic damage-pricing. In order to estimate the intrinsic values ofnatural ecosystems, they applied a replacement cost methodology basedon the idea of replacing the functions performed by the natural eco-system through a human engineered analog. Using these cross-cuttingresource valuation techniques, the authors maintained that the economicvalue of shrub-steppe sites reflects both their ecological services andrecreational uses. Given the uncertainty that exists as to the social ben-efits from preserving undeveloped shrub-steppe, they suggest the need forfurther analysis in order to establish credibility in ecological sitevaluations.
Unresolved Issues
The following discussion focuses on a series of distinct and challengingissues in the valuation of natural resources and the environment: a) thechoice of a discount rate in assessing the present and future values ofbenefits and costs; b) the individual’s time-preference in deriving ben-efits over the near term as opposed to later on; c) the role of equity andfairness in resource valuations involving present and future generations;d) the conceptual understanding of risk and uncertainty in the valuationof natural resources and the environment; and e) qualification of themeasurement errors in the application of the natural resource valuationtechniques discussed in this handbook. Without identifying the potentialimportance of these factors in the valuation process, the analysis ofnatural resource values will remain incomplete and contentious if used byDOE field operations as a basis for decision-making.
Discounting and Time Preference
Discount rates enable one to determine the present value of the benefitsand costs associated with the future use and enjoyment of naturalresources. If the analyst of future benefits and costs sets a high discountrate, say 10 percent, the present value of benefits in the distant futurebecomes insignificant when compared with the present value of benefitsin the near-term future. For example, using continuous discounting at therate of 10 percent, the present value of $1000 of benefits obtained 2 yearsin the future is $818.73, and in 10 years becomes $367.88, less than halfas much. By choosing a lower discount rate, say 2 percent, the analystreduces this temporal bias: $1000 of benefits 10 years hence becomes$818.73. Given the implications of this basic arithmetic on natural
38 / Unresolved Issues
resource valuations, it is no wonder there is so much controversy amongeconomists, scientists, and policy makers over the applications ofappropriate discount rates.
Despite the controversies that exist, discounting is part of applied ben-efit-cost analyses. Its main role is helping to evaluate a series of costs orbenefits that are strung out over the future. Discounting is a way ofadding up a series of future net benefits into an estimate of present value. However, as we have already seen, the outcome of this exercise dependson which particular discount rate we use. Under rates of 2 percent, weare essentially treating a dollar of benefits from a natural resource in oneyear as very similar in value to a dollar of benefits in any other year. Using very high rates, say above 7 percent, we are saying that a dollar ofnatural resource benefits in the near-term is much more valuable to usthan it would be later on. Thus, the higher the discount rate used in thecalculation of present values, the more we are favoring the near term useand/or enjoyment of natural resources relative to more distant future uses. To the contrary, the lower the discount rate used in present valuecalculations, the more equally we are weighing the benefits over time.
It follows that the choice of a discount rate is inextricably tied to thepresent generation’s concern for resource values that will accrue topresent and future generations. Consequently, resource stewardshiprequires consideration of subjective views on decisions which generateenvironmental benefits for present and future generations. This under-standing can be captured analytically by the rate of social time prefer-ence: the rate at which society is willing to exchange consumption andenjoyment opportunities in the present for similar opportunities in thefuture.
The rate of time preference is frequently cited as a kind of subjective rateof interest. To an individual, time preference depends largely on tastesand preferences, income levels, age, and even socio-cultural norms. Forexample, consider an individual who is willing to forego limited access toan open-space site over a one-year period (say, while an ecological
Discounting and Time Preference / 39
restoration is undertaken), with the understanding that he/she will becompensated by gaining additional access to the site upon completion ofthe restoration in the coming year. We mean by the word “compen-sation” that the individual is left feeling just as well off as if he/she hadnot given up access to the site — no more and no less. The degree oftime preference is defined by the benefits he/she requires in the comingyear in exchange for the benefits he/she will lose in the present year.
Beyond the level of the individual, however, the concept of time prefer-ence becomes all the more controversial by requiring us to make somevery strong assumptions about the collective preferences of individualsover present and future consumption/use of natural and environmentalresources. This difficulty has led economists to seek more practicablemeasures by relying on the following proposition: An individual willpostpone further material consumption in order to lend on the capitalmarket, provided the rate of interest exceeds his/her rate of time pref-erence. Under the ideal circumstances of equilibrium in capital markets,it has been shown that the rate of time preference will equal the rate ofinterest. However, the analysts must proceed with caution in usinginterest rates observed in capital markets in the calculation of presentvalues of natural and environmental resources. After all, there are likelyto be some highly significant differences of opinion when it comes to thevaluation of these resources as opposed to, say, a AAA-rated municipalbond.
The analyst must be aware that there are dozens of different interest ratesin use at any one time — rates on normal savings accounts, certificates ofdeposit, bank loans, government bonds, etc. Which rate should we use? There are essentially two schools of thought on this question. The first isthat the discount rate should reflect the way people themselves thinkabout time. Any person normally will prefer a dollar today to a dollar in10 years. In the language of economics, they have a positive rate of timepreference. We see people making savings decisions by putting money inbank accounts that pay certain rates of interest. These savings accountrates show what interest the banks have to offer in order to get people to
40 / Unresolved Issues
forego current consumption. We might, therefore, take the average banksavings account rate as reflecting the average person’s rate of timepreference.
The second approach to determining the “correct” rate of discount isbased on the notion of investment productivity. When investments aremade in productive enterprises, people anticipate that the value of futurereturns will offset today’s investment costs. Otherwise, these invest-ments would not be economically efficient. The thinking here is thatwhen resources are used in the public sector for natural resource andenvironmental programs, they ought to yield, on average, rates of returnto society equivalent to what they could have earned in the private sector. Private-sector productivity is reflected in the rates of interest bankscharge their business borrowers. Thus, by this reasoning, we should use,as our discount rate, a rate reflecting the interest rates that private firmspay when they borrow money for investment purposes. These aretypically higher than savings account interest rates.
Real rates of between zero and 8 percent appear regularly in the econ-omics literature. Some have even argued for negative discount rates toreflect the implicit interest of future generations in resource managementdecisions. The policy of the Office of Management and Budget (OMB),which provides guidance to most federal agencies on a discount rate forpublic investment and regulatory impact analyses, is based on the privateopportunity-cost principle. This rate was recently changed from 10percent to 7 percent. Some U.S. federal agencies responsible formanaging natural resources employ significantly lower discount rates. For example, the Bureau of Reclamation reportedly uses an 8.875 percentnominal rate, which translates to a real rate of between 3 percent and 5percent, depending on the assumptions made about the effective rate ofinflation. The U.S. Forest Service and Bureau of Land Managementemploy a 4 percent real rate of discount in natural resource assessments. The National Oceanic and Atmospheric Administration has recentlyadopted a 3 percent to 4 percent discount rate (based on the Treasuryrate) for natural resource damage assessments.
Equity and Fairness / 41
Equity and Fairness
The valuation of natural and environmental resources under ethicalcriteria diverges sharply from that of the conventional utilitarianapproach. Land or water values provide some perspective on this. Assume, for example, that a tract of land is privately owned. Its marketprice reflects the private benefits that it can provide. If we assume thereexists a well-specified system of property rights over the parcel of land,individual self-interest would lead to a negotiated settlement over therights to buy or lease the land according to the marginal values of the landin its various alternative uses. It would be in the owner’s self-interest toensure that the land would be allocated to those uses which commandhighest value before considering other uses which have lower marginalvalues. This typifies economically efficient resource allocations, wherebyrelatively lower-valued uses are effectively excluded from consideration. It makes no difference if the land were under public stewardship, becausea similar means of allocation could be achieved by administering anauction for land-use rights, thereby ensuring that the land was used whereit commanded highest value.
In contrast, applying the criteria of equity and fairness gives equalweighting to the various land uses. These criteria affect the applicationof existing property rights and give rise to shadow prices which reflectthe administrative goals of providing equal use to all concerned parties. The political distribution of natural resources to achieve equity andfairness displaces the utilitarian value of land. Accordingly, the applica-tion of equity and fairness in the distribution of resources is complicatedand controversial. Ultimately, distribution is a matter of who gets thebenefits and who pays the costs. In public-sector programs, distribu-tional matters must be considered along with efficiency issues, whichimplies that benefit-cost analyses must incorporate information on hownet benefits are distributed among different groups in society. Thedistribution of benefits and costs is primarily a matter of equity orfairness. There are two main types of equity: horizontal and vertical.
42 / Unresolved Issues
Horizontal equity is a case of treating similarly situated people the sameway. Vertical equity refers to how a policy impinges on people who arein different circumstances, in particular, on people who have differentincome levels.
There are well-known difficulties in estimating the distributional impactsof environmental programs, individually or in total. Doing so requiresvery specific data showing impacts by income groups, race, or otherfactors. In general, environmental data have not been routinely collectedby income and race. Thus, data on environmentally related issues do nottypically allow the comparison of welfare impacts across socioeconomicand racial groups. Nor is it easy to estimate how program costs aredistributed among these groups. This is because these welfare impactsdepend on complex factors related to tax collections, consumptionpatterns, the availability of alternatives, and so on. Despite thedifficulties, however, benefit-cost analyses should try to look as closelyas possible at the way in which the aggregates are distributed through thepopulation.
What happens when the distributional implications span generations? That is, how do we compare situations when one generation gains andanother loses? Discounting at some market-based rate of interest iscommonly used to express future costs and benefits in terms of presentmonetary value, assuming that a value received now is worth more thanthe same value provided at some future date. Obviously, standard dis-counting procedures will weight the effect on the current generation farmore heavily. Thus, some critics believe that discounting results ingreater resource exploitation or use of natural capital now, at the expenseof future generations. Controversies in using positive discount rates forenvironmental programs with long-run impacts are not easily resolved. Some suggest that for long-run environmental projects, the appropriatediscount rate is zero. But we have to be very careful here.
A great deal of harm has been done to natural and environmentalresources by using very low discount rates to evaluate development
Risk and Uncertainty / 43
projects. With low discount rates, it is often possible to justify verydisruptive public infrastructure projects because enough distant anduncertain benefits can be accumulated to outweigh the tremendousnear-term costs.
Risk and Uncertainty
Natural resource and environmental valuation is difficult, even whenthere is relative certainty over prevailing economic and environmentalconditions. In the “real world,” analysts must confront risky outcomes inproposing environmental decisions or taking regulatory actions underconditions of uncertainty about the benefits and costs of these actions. Consequently, the notions of risk and uncertainty are related: risk relatesto recurring events whose relative frequencies are known from pastexperience, while uncertainty relates to unique events whose probabilitiescan only be subjectively estimated.
Uncertainty over the outcomes of environmental actions and policies caninfluence the valuation of natural and environmental resources. Forinstance, can we say with certainty that the decontamination of DOE landwill increase property values? If not, the analyst may need to introduceprobability beliefs into the valuation process. The presence of risk anduncertainty affects both willingness to pay or willingness to acceptcompensation, with the extent of each depending on the degree ofeconomic and environmental uncertainty confronting individuals and ontheir attitudes towards risk and uncertainty. Together, risk anduncertainty affect the valuation of natural and environmental resourcesand are commonly examined by the analyst based on extensions of theuncertainty affect the valuation of natural and environmental resourcesand are commonly examined by the analyst based on extensions of theutilitarian concept of value vis-a-vis the model of expected utility.
The first element, the degree of risk or uncertainty confronting individ-uals, is often considered in terms of the variance associated with random
44 / Unresolved Issues
economic and/or environmental variables. For example, the valuation ofdecontaminated lands would very likely reflect the probability beliefs ofpotential buyers as to whether the land posed future human health and/orecological risks in its alternative uses. Intuitively, the model of expectedutility would predict that decontaminated land values increase asindividuals are more certain that the land poses no future ecologicaland/or human health risks. Correspondingly, the model of expectedutility predicts that a greater adversity to these risks on the part ofpotential buyers and/or users of the land depresses the valuation of thebenefits derived from the land. Consequently, to better understand howrisks and uncertainties impact natural and environmental resourcevaluation, it is necessary to scrutinize the methods used in the risk-assessment process and recognize how they affect the estimation of theprevailing attitudes towards risks and uncertainty.
Bearing the two related concerns in mind, the role of risk-benefit model-ing remains an unresolved matter in the valuation of natural andenvironmental resources. The many nontrivial sampling and measure-ment issues that ultimately affect the outcome of the valuation processcompound the difficulties in using a conceptual framework. Already, wehave seen how the choice of sampling and survey instruments caninfluence the willingness-to-pay information obtained by contingentvaluation analysts. These same considerations accompany the collectionand analysis of risk-benefit data. Without this data, little if anything canbe learned about the impacts of risk and uncertainty on the value ofnatural and environmental resources. By the same token, the risk anduncertainty faced by those who derive benefits from natural andenvironmental resources can only be reduced by the provision ofadditional information.
It is DOE policy that field operations provide individuals and com-munities with as much information as possible about the potentialoutcomes of their environmental policies and actions. Unfortunately, theanalyst has no “hard and fast rule” or “correct way” to incorporate thisinformation in risk-benefit models. However, the more we learn about
Risk and Uncertainty / 45
how these risk and uncertainties manifest themselves, the moreinformation the analyst has available to estimate the “most likely” or“least expected” values of natural and environmental resources. Forinstance, consider the problem of predicting the effects of certain policychanges on the occurrence of transportation accidents involving hazard-ous waste materials.
In any given year, we may have no transportation accidents, or one, orseveral; the exact number is uncertain. Yet, we may want a way to talkabout the annual number of transportation-related accidents in order toweigh the impact of different types of traffic-control policies on com-munity property values. One way of doing this is to estimate theexpected number of accidents in a year and then determine the cor-responding value of the damages that result. Where would we get theinformation to do this? If we have been collecting data over a long periodof time, we might know something about actual long-run averages. In alllikelihood, analysts don’t have information like this, and must fall backon estimates provided by engineers, scientists, or people familiar with theproblem. Based on information of this type, analysts can then develop aprobability distribution of the number of hazardous waste transportationaccidents and calculate the expected number of accidents in a year.
In effect, this is the average number of accidents one would experienceeach year over a period of time many years long. This probabilityparameter can then be multiplied by an estimate of resulting propertydamages to calculate the expected value of the damages that result fromaccidents involving the transportation of hazardous materials. As in thisexample, analysts may be able to estimate the expected number ofprobabilistic events and use this to calculate the impacts of increasedrisks on the expected value of natural resources. This approach is anappropriate one, provided there are reliable estimates of the probabilitiesof future events. Unfortunately, such estimates may not be available,particularly in those instances where we have little experience to analyzethe probabilities of different outcomes with any degree of confidence. For example, consider the siting of a hazardous waste dump.
46 / Unresolved Issues
Suppose the people of a nearby community rely on a freshwater aquiferfor their water supply. The analyst is asked to conduct a risk assessmentto characterize the risks that the proposed waste site poses to people inthe community. One part of the study is to determine the probable risksof chemicals contaminating the aquifer. This requires the expertise ofengineers, hydrologists, and others who can study the physical aspects ofthe landfill and surrounding area. A second part of the study is toestimate the likely impacts on community health if the aquifer iscontaminated. This involves using the predicted chemical levels to whichpeople in the community would be exposed if contamination occurred andestimating the resulting health effects, for example, the expected numberof increased cases of cancer. This would call on dose-responserelationships that scientists have developed in analyzing this particularsubstance. Often, this type of information will come from laboratorystudies with animals, the results of which are then extrapolated to humanbeings.
At this juncture of the study, economic valuation joins with the riskassessment to determine how much people value alternative situationsinvolving differing risk levels. In our terminology, this is the estimationof people’s willingness to pay to avoid the risk of damages sustained bynatural resources. Clearly, the prevailing attitudes of individuals towardrisk become a key determinant in the value associated with maintainingthe integrity of natural resources that are damaged by human activity. Tocomplicate matters, many natural resource and environmental risks canhave negative impacts that are irreversible; they can’t be undone bysubsequent actions. The possibility of irreversible effects makes currentpolicy decisions particularly important, inasmuch as recovery from baddecisions may be technologically impossible or prohibitively costly.
In certain circumstances, communities may have no option but to livewith the consequences of current policy choices without the possibility offuture rectification. Using the example of the contaminated aquifer, therewould be a permanent displacement of all water uses; effectively, thewater source would become economically worthless to all future
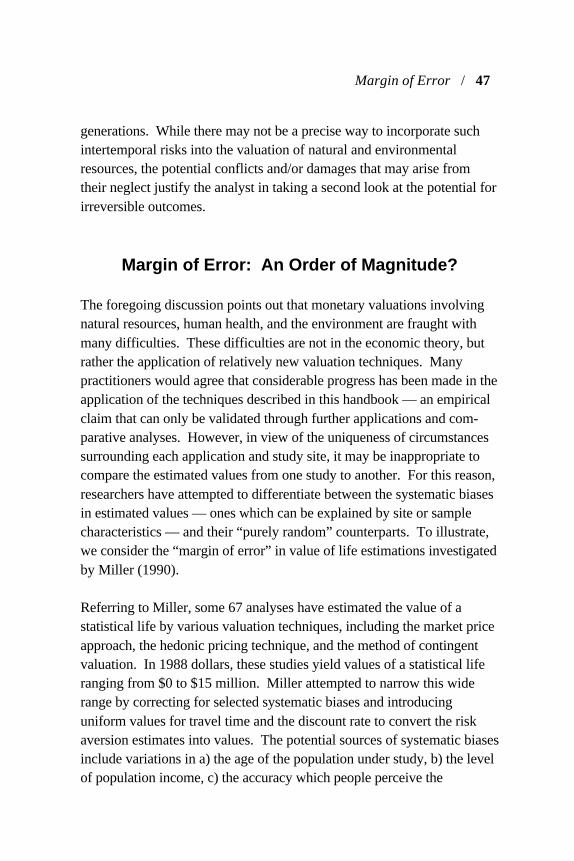
Margin of Error / 47
generations. While there may not be a precise way to incorporate suchintertemporal risks into the valuation of natural and environmentalresources, the potential conflicts and/or damages that may arise fromtheir neglect justify the analyst in taking a second look at the potential forirreversible outcomes.
Margin of Error: An Order of Magnitude?
The foregoing discussion points out that monetary valuations involvingnatural resources, human health, and the environment are fraught withmany difficulties. These difficulties are not in the economic theory, butrather the application of relatively new valuation techniques. Manypractitioners would agree that considerable progress has been made in theapplication of the techniques described in this handbook — an empiricalclaim that can only be validated through further applications and com-parative analyses. However, in view of the uniqueness of circumstancessurrounding each application and study site, it may be inappropriate tocompare the estimated values from one study to another. For this reason,researchers have attempted to differentiate between the systematic biasesin estimated values — ones which can be explained by site or samplecharacteristics — and their “purely random” counterparts. To illustrate,we consider the “margin of error” in value of life estimations investigatedby Miller (1990).
Referring to Miller, some 67 analyses have estimated the value of astatistical life by various valuation techniques, including the market priceapproach, the hedonic pricing technique, and the method of contingentvaluation. In 1988 dollars, these studies yield values of a statistical liferanging from $0 to $15 million. Miller attempted to narrow this widerange by correcting for selected systematic biases and introducinguniform values for travel time and the discount rate to convert the riskaversion estimates into values. The potential sources of systematic biasesinclude variations in a) the age of the population under study, b) the levelof population income, c) the accuracy which people perceive the
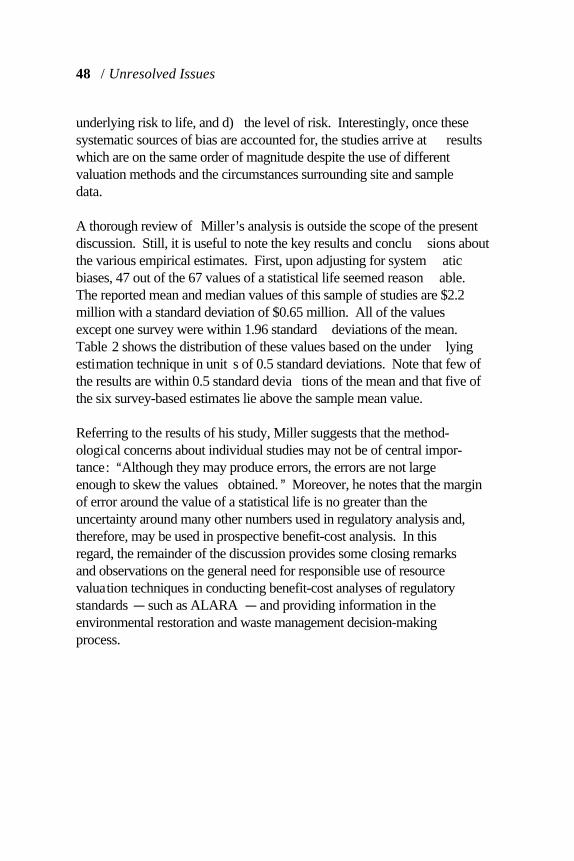
48 / Unresolved Issues
underlying risk to life, and d) the level of risk. Interestingly, once thesesystematic sources of bias are accounted for, the studies arrive at resultswhich are on the same order of magnitude despite the use of differentvaluation methods and the circumstances surrounding site and sampledata.
A thorough review of Miller s analysis is outside the scope of the presentdiscussion. Still, it is useful to note the key results and conclu sions aboutthe various empirical estimates. First, upon adjusting for system aticbiases, 47 out of the 67 values of a statistical life seemed reason able. The reported mean and median values of this sample of studies are $2.2million with a standard deviation of $0.65 million. All of the valuesexcept one survey were within 1.96 standard deviations of the mean. Table 2 shows the distribution of these values based on the under lyingestimation technique in unit s of 0.5 standard deviations. Note that few ofthe results are within 0.5 standard devia tions of the mean and that five ofthe six survey-based estimates lie above the sample mean value.
Referring to the results of his study, Miller suggests that the method-ological concerns about individual studies may not be of central impor-tance: Although they may produce errors, the errors are not largeenough to skew the values obtained. Moreover, he notes that the marginof error around the value of a statistical life is no greater than theuncertainty around many other numbers used in regulatory analysis and,therefore, may be used in prospective benefit-cost analysis. In thisregard, the remainder of the discussion provides some closing remarksand observations on the general need for responsible use of resourcevaluation techniques in conducting benefit-cost analyses of regulatorystandards such as ALARA and providing information in theenvironmental restoration and waste management decision-makingprocess.

Margin of Error / 49
Table 2 Distribution of Values Around the Mean by Type of Study
Value Range Wage-Risk Behavior Survey Total
-1.5 SD to -2 SD 1 2 -- 3
-1 to -1.5 SD 5 -- 1 6
-0.5 SD to -1 SD 6 1 -- 7
-0.5 SD to 0 3 4 -- 7
0 to 0.5 SD 4 -- 2 6
0.5 SD to 1 SD 6 2 2 10
1 SD to 1.5 SD 4 2 -- 6
1.5 SD to 2 SD 1 -- -- 1
2 SD to 2.5 SD -- -- 1 1
Source: Miller (1990), page 32, where mean value = $2.2 million and standarddeviation (SD) = $0.65 million (in 1980 dollars).
Conclusions
The application of natural resource valuation techniques is a growingscience; lessons are learned as new case studies are undertaken and thebenefits of additional information and experience are synthesized. Practitioners of the valuation techniques described in this handbook sharethe concern that dissatisfaction with technical results may lead to politicalinterference with the methods of technical analysis. Past examples ofsuch intervention include intervention in the benefit-cost procedures usedto estimate benefits of water transportation or the choice of discount ratesin federally funded water projects. The DOE must guard against makingsuch intrusions when considering the most appropriate scientific methodsto employ in the valuation of the many natural resources that are involvedin environmental restoration and waste management activities around thecountry.
The level of technical analysis required to perform NRDA and EIS workon behalf of government agencies requires a thorough understanding ofthe natural resource valuation techniques described above. Responsibleenvironmental professionals must realize that environmental restorationand waste management activities may affect many natural resources,numerous aspects of the environment, and both worker and public healthand safety. A number of technical issues related to valuation conceptsand techniques have been identified in the foregoing text. A shortsynthesis of this discussion is useful to paint a general picture of theapplications and fundamental concepts that are involved.
First, the authors have suggested that monetary valuations have to copewith many problems. Foremost is that actual market prices are generallynot available, so that indirect assessment procedures should be
52 / Conclusions
considered, e.g., the market price approach, the appraisal method, oridentification of a suitable resource replacement cost. Second, wherethere is an absence of demand curves or market price information,nonmarket methods should be considered as the only viable alternative,e.g, the travel cost method, the participation/unit day value methods,hedonic pricing, and the method of contingent market valuation. Further-more, in the application of these techniques, the authors suggest that non-use values (bequest and existence) and option value should be counted aspart of the total economic value of the underlying natural resources. Forthe moment, the authors conclude that ecological valuation techniquescan be seen as a contribution to the more traditional valuation methods,but that their reliability is rather weak due to several shortcomings andrestrictive assumptions.
Bibliography
Adams, R. M. et al. 1989. “User Fees and Equity Issues in PublicHunting Expenditures: The Case of Ring-Necked Pheasant in Oregon.” Land Economics 65(4):376-385.
American Fisheries Society. 1982. Monetary Values of FreshwaterFish and Fish-Kill Counting Guidelines, Bethesda, Maryland.
American Indian Religious Freedom Act. 1978. Public Law 95-341 asamended, 42 USC 1996 et seq.
Anderson, E., and D. Devereaux. 1986. “Testing for Two Kinds of Biasin a Contingent Valuation Survey of Anglers Using An Artificial Reef.” Paper Presented at the Annual Meeting of the Eastern EconomicAssociation, Philadelphia, Pennsylvania.
Anderson, R. J., and T. D. Crocker. 1971. “Air Pollution and Residen-tial Property Values.” Urban Studies 8:171-180.
Archaeological Resources Protection Act. 1979. Public Law 96-95 asamended, 16 USC 470aa et seq.
Bartik, T. J. 1988. “Measuring the Benefits of Amenity Improvementsin Hedonic Price Models.” Land Economics 64:172-183.
Berger, M. C., G. C. Blomquist, D. Kenkel, and G. S. Tolley. 1987. “Valuing Changes in Health Risks: A Comparison of AlternativeMeasures.” Southern Economic Journal 53:967-984.
54 / Bibliography
Bergstrom, J. C., H. K. Cordell, and D. Klinko. 1989. “RecreationalBenefits of Reservoir Water-Level Management.” Paper Presented at theAnnual USDA W-133 Meeting, San Diego, California.
Bergstrom, J. C., B. L. Dillman, and J. R. Stoll. 1985. “Public Environ-mental Amenity Benefits of Private Land: The Case of PrimeAgricultural Land.” Southern Journal of Agricultural Economics17(1):139-149.
Bergstrom, J. C., J. R. Stoll, J. P. Titre, and V. L. Wright. 1990. “Economic Value of Wetlands-Based Recreation.” EcologicalEconomics 2(2):129-147.
Binkley, C. S., and W.M. Hanemann. 1978. The Recreation Benefits ofWater Quality Improvement: Analysis of Day Trips in an UrbanSetting. Report to the U.S. Environmental Protection Agency,Washington, D.C.
Bishop, R. C., and K. J. Boyle. 1985. The Economic Value of IllinoisBeach State Nature Preserve. Final Report to Illinois Department ofConservation, Heberlein Baumgartner Research Services, Madison,Wisconsin.
Bishop, R. C., and K. Boyle. 1986. “The Economic Value ofEndangered Species of Wildlife.” In Transactions of the 51st NorthAmerican Wildlife and Natural Resources Conference.
Bishop, R. C., and K. J. Boyle. 1987. “Valuing Wildlife in Benefit-CostAnalysis: A Case Study Involving Endangered Species.” WaterResources Research 23(5):943-950.
Bishop, R. C., K. J. Boyle, and M. P. Welsh. 1987. “Toward TotalEconomic Valuation of Great Lakes Fishery Resources.” Transactionsof the American Fisheries Society 116:352-373.
Bibliography / 55
Bockstael, N. E., W. M. Hanemann, and C. L. Kling. 1987. “ModelingRecreational Demand in a Multiple Site Framework.” Water ResourcesResearch 23:951-960.
Bockstael, N. E., W. M. Hanemann, and C. L. Kling. 1987. “Estimatingthe Value of Water Quality Improvements in a Recreational DemandFramework.” Water Resources Research 23:951-960.
Boyle, K. J., and R. C. Bishop. 1979. “Toward the Total Valuation ofthe Great Lakes Fishery Resources.” Water Resources Research5:943-990.
Boyle, K. J., S. D. Reiling, and M. L. Phillips. 1990. “Species Substi-tution and Questions Sequencing in Contingent Valuation SurveysEvaluating the Hunting of Several Types of Wildlife.” Leisure Science12:103-118.
Braden, J., C. Kolstad, R. Woock, and J. Machado. 1992. “The Demandfor Synthetic Fuels: Contingent Valuation of Quality-DifferentiatedFactors of Production.” Paper Presented at the Annual Meeting of theEuropean Association of Environmental and Resource Economists,Cracow, Poland.
Brooks, R. 1991. Warm Water Fishing in Montana: A ContingentValuation Assessment of Angler Attitudes and Economic Benefits forSelected Waters Statewide. Report Prepared for State of MontanaDepartment of Fish, Wildlife and Parks, Helena, Montana.
Brookshire, D. S., R. C. d’Arge, W. D. Schulze, and M. A. Thayer. 1979. “Experiments in Valuing Non-Marketed Goods: A Case Study ofAlternative Benefit Measures of Air Pollution Control in the South CoastAir Basin of Southern California.” Methods Development for AssessingTradeoffs in Environmental Management, Vol. 2. National TechnicalInformation Service, Washington, D.C.
56 / Bibliography
Brookshire, D. S., L. S. Eubanks, and A. Randall. 1978. “ValuingWildlife Resources: An Experiment.” In 43rd Transactions of theNorth American Wildlife Conference, Wildlife Management Institute,Washington, D.C.
Brookshire, D. S., L. S. Eubanks, and A. Randall. 1983. “EstimatingOption Prices and Existence Values for Wildlife Resources.” LandEconomics 59:1-15.
Carson, R. T., W. M. Hanemann, and D. Steinberg. 1990. “A DiscreteChoice Contingent Valuation Estimate of the Value of Kenai KingSalmon.” Journal of Behavioral Economics 19(1):53-68.
Carson, R. T., R. C. Mitchell, and P. A. Ruud. 1990. “Valuing AirQuality Improvements: Simulating a Hedonic Pricing Equation in theContext of a Contingent Valuation Scenario.” In Visibility and FineParticles, C. V. Mathai, ed., Air and Waste Management Association,Pittsburgh, Pennsylvania.
Carson, R. T., and P. A. Ruud. 1991. Grand Canyon Visibility BenefitsCalculations. Report to W. E. Balson, Decision Focus, Los Altos,California.
Chestnut, L. G., et. al. 1988. Heart Disease Patients’ AvertingBehavior; Costs of Illness and Willingness to Pay to Avoid AnginaEpisodes. Final Report (EPA-230-10-88-042), Cooperative AgreementNo. CR-812826, Office of Policy Analysis, U.S. EnvironmentalProtection Agency, Washington, D.C.
Chestnut, L. G., L. R. Keller, W. Lambert, and R. D. Rowe. 1992. “Measuring Heart Patients’ Willingness to Pay for Changes in AnginaSymptoms: Some Methodological Implications.” Graduate School ofManagement, University of California, Irvine, California.
Bibliography / 57
Chestnut, L. G., and R. D. Rowe. 1990. “Review and Response to: Development and Design of a Contingent Value Survey for Measuringthe Public’s Value for Visibility Improvements at the Grand CanyonNational Park.” Draft Report Prepared by RCG/Hagler, Bailly, Inc. forEconomic Analysis Branch, Office of Air Quality Planning andStandards, U.S. EPA, Boulder, Colorado.
Chestnut, L. G., and R. D. Rowe. 1991. Economic Changes in Visi-bility: A State of the Science Assessment for NAPAP, SOS 27 for theNational Acidic Precipitation Assessment Program.
Clawson, M. 1959. Methods of Measuring the Demand for and Valueof Outdoor Recreation. Resources for the Future, Reprint No. 10,Washington, D.C.
Clawson, M., and J. L. Knetsch. 1966. Economics of OutdoorRecreation. Johns Hopkins University Press, Baltimore, Maryland.
Clean Water Act (Federal Water Pollution Control Act). 1948. 62 Stat 1155 as amended, 33 USC 1251 et seq.
Clean Air Act. 1986. Public Law 88-206 as amended, 42 USC 7401et seq.
Cocheba, D. J., and W. A. Langford. 1978. “Wildlife Valuation: The Collective Good Aspect of Hunting.” Land Economics54 (4): 490-504.
Comprehensive Environmental Response, Compensation, and LiabilityAct. 1980. Public Law 96-510 as amended, 42 USC 9601 et seq.
Crocker, T. D. 1985. “On the Value of the Condition of a Forest Stock.” Land Economics 61(3):244-254.
58 / Bibliography
Desvousges, W. H., M. C. Naughton, and G. R. Parsons. 1992. “BenefitTransfer: Conceptual Problems in Estimating Water Quality BenefitsUsing Existing Studies.” Water Resources Research 28(3) [SpecialSection: Problems and Issues in the Validity of Benefit TransferMethodologies.]
Desvousges, W. H., V. K. Smith, and M. P. McGivney. 1983. AComparison of Alternative Approaches for Estimating Recreation andRelated Benefits of Water Quality Improvements. EPAReport 230-05-83-001, U.S. Environmental Protection Agency, Office ofPolicy Analysis, Washington, D.C.
Diamond, D. B., Jr., 1980. “The Relationship Between Amenities andUrban Land Prices.” Land Economics 56(1):21-32.
Diamond, D. B., Jr., and G. Tolley, (ed.) 1982. The Economics ofUrban Amenities. Academic Press, New York.
Doane, M. J., R. S. Hartman, and C. K. Woo. 1988. “Household’sPerceived Value of Service Reliability: An Analysis of ContingentValuation Data.” Energy Journal 9:135-150.
Donnelly, D. M., J. B. Loomis, C. F. Sorg, and L. J. Nelson. 1985. “NetEconomic Value of Recreational Steelhead Fishing in Idaho.” U.S. Forest Service Bulletin RM-9, Rocky Mountain Forest and RangeExperiment Station, Fort Collins, Colorado.
Dragun, A. K. 1991. “An Economic Study of Commercial andRecreational Fishing Conflicts in Port Philip Bay and Western Port,Victoria, Australia.” Report Prepared for the Victorian Department ofConservation and Environment, Department of Legal Studies, La TrobeUniversity.
Bibliography / 59
Duffield, J. W. 1988. The Net Economic Value of Elk Hunting inMontana, Report to Montana Department of Fish, Wildlife, and Parks,Helena, Montana.
Duffield, J. W. 1991. “Existence and Nonconsumptive Values forWildlife: Application to Wolf Recovery in Yellowstone National Park.” Paper Presented at the Annual USDA W-133 Meeting, Monterey,California.
Duffield, J. W. 1991. “Total Valuation of Wildlife and FisheryResources: Applications in the Northern Rockies.” Paper Presented atthe National Conference on the Economic Value of Wilderness,U.S. Forest Service and Society of American Foresters, Jackson Hole,Wyoming.
Duffield, J. W., and C. Neher. 1991. Montana Waterfowl Hunting: A Contingent Valuation Assessment of Economic Benefits and HunterAttitudes. Report to Montana Department of Fish, Wildlife, and Parks,Helena, Montana.
Edwards, S. F. 1988. “Option Prices for Groundwater Protection.” Journal of Environmental Economics and Management 15(4):475-487.
Endangered Species Act. 1973. Public Law 93-205 as amended,16 USC 1531 et seq.
Environmental Science and Technology. 1980. Groundwater Strate-gies, Vol. 14, pp. 1030-35.
Executive Order 11988, “Floodplain Management.” May 24, 1977. 42 FR 26951.
Executive Order 11990, “Protection of Wetlands.” May 24, 1977. 42 FR 26961.
60 / Bibliography
Executive Order 12580, “Superfund Implementation.” January 23, 1987. 52 FR 2923.
Freeman, A. M., III. 1971. “Air Pollution and Property Values: AMethodological Comment.” Review of Economics and Statistics 53:415-416.
Freeman, A. M., III. 1974. “Air Pollution and Property Values: AFurther Comment.” Review of Economics and Statistics 56:554-556.
Freeman, A. M., III. 1974. “On Estimating Air Pollution ControlBenefits from Land Value Studies.” Journal of EnvironmentalEconomics and Management 1:277-288.
Guidance Manual for Minimizing Pollution from Waste Disposal Sites,EPA 600/2-78-142, U.S. Environmental Protection Agency, Washington,D.C.
Hoehn, J. P. 1987. “Contingent Valuation in Fisheries Management:The Design of Satisfactory Contingent Valuation Formats.” Transac-tions of the American Fisheries Society 116:412-419.
Hoehn, J. P., and G. Fishelson. 1987. “Measuring the Economic Impactof Visibility.” Staff Paper No. 87-21, Department of AgriculturalEconomics, Michigan State University.
Huppert, D. D. 1989. “Measuring the Value of Fish to Anglers: Application to Central California Anadromous Species.” MarineResource Economics 6:89-107.
Interagency Land Acquisition Conference. 1991. Uniform AppraisalStandards for Federal Land Acquisitions. Government Printing Office,Washington, D.C.
Bibliography / 61
Kneese, A. V. 1984. Measuring the Benefits of Clean Air and Water. Resources for the Future, Inc., Washington, D.C.
Kopp, R. J., and V. K. Smith. 1992. “Eagle Mine and Idarado.” In Nat-ural Resource Damage: Law and Economics, K. M. Ward and J. W.Duffield (ed.), John Wiley and Sons, Inc., New York, pp. 365-388.
Loehman, E. T., and D. Boldt. 1988. “Specification of Willingness toPay Benefit Functions for Air Quality: A Comparison of Theory andEmpirical Measurement.” Mimeo, Purdue University, Indiana.
Loomis, J., and Anderson, P. 1992. Idaho v. Southern Refrigerated in Natural Resource Damages: Law and Economics, Ward and Duffield(ed.), John Wiley and Sons, Inc., New York.
Loomis, J. B. 1987. An Economic Evaluation of Public TrustResources of Mono Lake. Institute of Ecology Report #30, College ofAgricultural and Environmental Sciences, University of California,Davis, California.
Loomis, J. B., and J. Cooper. 1988. The Net Economic Value ofAntelope Hunting in Montana. Report Prepared for MontanaDepartment of Fish, Wildlife, and Parks, Helena, Montana.
Loomis, J. B., J. Cooper, and S. Allen. 1988. The Montana Elk HuntingExperience: A Contingent Valuation Assessment of Economic Benefitsto Hunters. Report Prepared for Montana Department of Fish, Wildlife,and Parks, Helena, Montana.
Loomis, J. B., M. Creed, and J. C. Cooper. 1989. Economic Benefits ofDeer in California: Hunting and Viewing Values. Institute of EcologyReport #3, University of California, Davis, California.
62 / Bibliography
Loomis, J., and Anderson, P. 1992. “Idaho v. Southern Refrigerator.” In Natural Resource Damages: Law and Economics, Ward, K. M. andDuffield, W. J. (ed.), Wiley Law Publications, New York, pp. 389-414.
Luken, R. A., F. R. Johnson, and V. Kibler. 1992. “Benefits and Costsof Pulp and Paper Effluent Controls Under the Clean Water Act.” WaterResources Research 28(3):665-667.
Mathews, S. B., and G. M. Brown. 1970. Economic Evaluation of the1967 Sport Salmon Fisheries of Washington, Technical Report No. 2,Washington Department of Fisheries, Olympia, Washington.
McClelland, G. H., et al. 1991. Valuing Eastern Visibility: A FieldTest of the Contingent Valuation Method-Innovative Approaches forValuing Perceived Environmental Quality. U.S. EnvironmentalProtection Agency Cooperative Agreement #CR-815183-01-3, U.S.Environmental Protection Agency, Washington, D.C.
Meyer, P. A. 1978. Updated Estimates for Recreation and Preserva-tion Values Associated with the Salmon and Steelhead of the FraserRiver. Environment Canada, Vancouver, BC.
Meyer, P. A. 1979. “A Publicly Vested Values for Fish and Wildlife: Criteria in Economic Theory and Interface with the Law.” LandEconomics 55(2):223-235.
Meyer, P. A. 1980. Recreational/Aesthetic Values Associated withSelected Groupings of Fish and Wildlife in California’s Central Valley. Report to the U.S. Fish and Wildlife Service, Sacramento, California.
Meyer, P. A. 1987. The Value of King Salmon, Harbor Seals andWetlands of San Francisco Bay. The Bay Institute of San Francisco,San Francisco, California.
Bibliography / 63
Milon, J. W. 1986. “Economic Evaluation of Artificial Habitat forFisheries: Progress and Challenges.” Discussion paper, Food andResource Economics Department, University of Florida, Gainesville,Florida.
Mitchell, R. C. and R. T. Carson. 1988. Towards a Methodology forUsing Contingent Valuation to Value Air Visibility Benefits. DraftReport to the Electric Power Institute, Resources for the Future,Washington, D.C.
Mitchell, R. C., R. T. Carson, and P. A. Ruud. 1989. CincinnatiVisibility Valuation Study: Pilot Study Findings. Report submitted tothe Electric Power Research Institute, Resources for the Future,Washington, D.C.
Morey, E. R., et al. 1991. “A Discrete Choice Model of RecreationalParticipation, Site Choice, and Activity Valuation When Complete TripData Is Not Available.” Journal of Environmental Economics andManagement 20:181-201.
Nachtman, S. C. 1983. Valuation of the Maroon Valley Mass TransitSystem for Recreational Visitors. Thesis, Colorado State University,Colorado Springs.
National Environmental Policy Act. 1969. Public Law 91-190, 42 USC4321 et seq.
National Historic Preservation Act. 1966. Public Law 89-665 asamended, 16 USC 470 et seq.
Olsen, D., J. Richards, and D. R. Scott. 1991. “Existence and SportValues for Doubling the Size of Columbia River Basin Salmon andSteelhead Runs.” Rivers 2(1):44-56.

64 / Bibliography
Palmquist, R. B. 1983. “Estimating the Demand for Air Quality fromProperty Values Studies: Further Results.” Working Paper, NorthCarolina State University, Raleigh, North Carolina.
Palmquist, R. B., and L. E. Danielson. 1989. “A Hedonic Study of theEffects of Erosion Control and Drainage on Farmland Values.” American Journal of Agricultural Economics 71:55-62.
Polinsky, A. M., and S. Shavell. 1975. “The Air Pollution and PropertyValue Debate.” Review of Economics and Statistics 57(1):100-104.
Polinsky, A. M., and S. Shavell. 1976. “Amenities and Property Valuesin a Model of an Urban Area.” Journal of Public Economics 5:119-129.
Randall, A. 1979. “The Economic Value of Atmospheric Visibility.” InProceedings of the Workshop on Visibility Values, U.S. Forestry ServiceTechnical Report WO-18.
Randall, A., G. C. Blomquist, J. P. Hoehn, and J. R. Stoll. 1985. National Aggregate Benefits of Air and Water Pollution Control. Cooperative Agreement CR811056-01-0, Interim report to the U.S.Environmental Protection Agency, University of Kentucky, Lexington,Kentucky.
RCG/Hagler, Bailly, Inc. 1986. Value-Based Planning for ElectricUtilities. Prepared for California Energy Commission, Boulder,Colorado.
RCG/Hagler, Bailly, Inc. 1988. Optimal Selection of ReliabilityStandards in Practice and Theory. Prepared for Electric PowerResearch Institute, Boulder, Colorado.
RCG/Hagler, Bailly, Inc. 1989. Customer Value of Service Reliability: Volume 1: Summary. Prepared for Southern California EdisonCompany, Rosemead, California, Boulder, Colorado.
Bibliography / 65
RCG/Hagler, Bailly, Inc. 1989. Customer Value of Service Reliability: Volume 1: Summary. Prepared for Southern California EdisonCompany, Rosemead, California, Boulder, Colorado.
RCG/Hagler, Bailly, Inc. 1989. Customer Value of Service Reliability: Volume 2: Residential Customers. Prepared for Southern CaliforniaEdison Company, Rosemead, California, Boulder, Colorado.
RCG/Hagler, Bailly, Inc. 1989. Customer Value of Service Reliability:Volume 3: Commercial and Industrial Customers. FinalReport 1989-6012, prepared for Southern California Edison Company,Rosemead, California, Boulder, Colorado.
RCG/Hagler, Bailly, Inc. 1989. Customer Value of Service Reliability:Volume 4: Methodology. Final Report, prepared for Southern CaliforniaEdison Company, Rosemead, California; Boulder, Colorado.
RCG/Hagler, Bailly, Inc. 1990. Cost-Benefit Analysis of Power SystemReliability: Determination of Interruption Costs Volume 2: Measure-ment of Interruption Costs for the Bonneville Power Administration. Final Report Project 2878-1, Report Number EL-6791, prepared for theBonneville Power Administration and Electric Power Research Institute,Palo Alto, California.
RCG/Hagler, Bailly, Inc. 1990. Cost-Benefit Analysis of Power SystemReliability: Determination of Interruption Costs Volume 3: Measure-ment of Interruption Costs for a Major Southeast Utility. Final ReportProject 2878-1, Report Number EL-6791, prepared for the BonnevillePower Administration and Electric Power Research Institute, Palo Alto,California.
RCG/Hagler, Bailly, Inc. 1991. Economic Penalties IncludingCustomer Costs for Loss of Service Continuity. CEA No. SD-2730,Boulder, Colorado.
66 / Bibliography
RCG/Hagler, Bailly, Inc. 1991. Survey of Customer Outage Costs. 2 vol. Prepared for Southern Company Services, Inc., Boulder, Colorado.
Rowe, R. D., R. C. D Arge, and D. S. Brookshire . 1980. AnExperiment on the Economic Value of Visibility. Journal ofEnvironmental Economics and Management, 1-19.
Rowe, R. D., and L. G. Chestnut. 1986. Valuing Changes in MorbidityWTP versus COI Measures. Paper presented at the American EconomicAnnual Meetings, Dallas, Texas.
Sanghvi , A. P. 1990. Cost-Benefit Analysis of Power System Relia-bility: Determination of Interruption Costs Volume 1: MeasurementMethods and Potential Applications in Reliability Cost-BenefitAnalysis. Final Report Project 2878-1, Report Number EL -6791,prepared by RCG/ Hagler, Bailly, Inc., for the Electric Power ResearchInstitute, Palo Alto, California, Washington, D.C.
Schulze , W. D., et al. 1983. The Economic Benefits of PreservingVisibility in the National Parklands of the Southwest. NaturalResources Journal 23:149-173.
Schulze , W. D., D. S. Brookshire , and M. A. Thayer. 1981. NationalParks and Beauty : A Test of Existence Values. Paper presented at theAmerican Economic Association Annual Meeting, Washington, D.C.
Schulze , W. D., D. S. Brookshire , E. G. Walter, and K. Kelley. 1981. The Benefits of Preserving Visibility in the National Parklands of the
Southwest, Report to the U.S. Environmental Protection Agency. InMethods Development for Air Pollution Control Benefits Assessment. Resource & Environmental Economics Lab, University of Wyoming,Laramie, Wyoming.
Bibliography / 67
Schulze , W. D., T. Crocker, B-D. Shaul, and A. Kneese. 1979. MethodsDevelopment for Assessing Air Pollution Control Benefits. 5 vols. Report to the U.S. Environmental Protection Agency, Resource &Environmental Economic Lab, University of Wyoming, Laramie,Wyoming.
Scott, M., G. R. Bilyard, S. O. Link, P. F. Ricci, H. E. Sealy,C. A. Ulibarri, and H. E. Westerdahl. 1997. The Valuation ofEcological Resources and Functions. Environmental Management(forthcoming).
Shechter , M. 1985. Economic Aspects in the Investigation of Ground-water Contamination Episodes. Ground Water, Volume 23, Number 2,U.S. Environ mental Protection Agency.
Shechter , M., and M. Zeidner . 1990. Anxiety: Towards a DecisionTheoretic Perspective. The British Journal of Mathematical andStatistical Psychology 43:15-28.
Smith, V. K., and W. H. Desvousges . 1985. The Generalized TravelCost Model and Water Quality Benefits: A Reconsideration . SouthernEconomic Journal 52:371-381.
Smith, V. K. and W. H. Desvousges . 1986. Measuring Water QualityBenefits. Kluwer-Nijhoff Publishing, Boston, Massachusetts.
Smith, V. K. and Y. Kaoru. 1990. Signals or Noise? Explaining theVariation in Recreation Benefit Estimates. American Journal ofAgricultural Economics 72:419-433.
Smith, V. K., R. B. Palmquist and P. Jackus. 1989. A Non-ParametricHedonic Travel Cost Model for Valuing Estuarine Quality. Workingpaper, North Carolina State University, Raleigh, North Carolina.
Smith, V. K., and Y. S. Eom. 1992. Linking Revealed and StatedPreferences Data in Describing Consumer Responses to Risk : PesticideResidues on Food. Presented at the Annual Meeting of the Asso ciationof Environmental and Resource Economists.
68 / Bibliography
Sorg, C. F., and J. B. Loomis . 1984. Empirical Estimates of AmenityForest Values: A Comparative Review. General TechnicalReport RM-107, Rocky Mountain Forest and Range Experiment Station,U.S. Forest Service, Fort Collins, Colorado.
Sorg, C. F., and L. J. Nelson. 1986. Net Economic Value of ElkHunting in Idaho. U.S. Forest Service Resource Bulletin RM-12, RockyMountain Forest and Range Experiment Station, U.S. Forest Service,Fort Collins, Colorado.
Stoll, J. R. 1980. The Valuation of Hunting Related Amenities: AConceptual and Empirical Approach. Dissertation, DAI, Vol. 41, 4783,University of Kentucky.
Stoll, J., and L. Johnson. 1984. Concepts of Value, Non-MarketValuation, and the Case of the Whooping Crane. Transactions of theNorth American Wildlife and Natural Resources Conference 49.
Ulibarri , C. A. and S. Ghosh. 1995. Benefit-Transfer Valuation ofEcological Resources. Pacific Northwest National Laboratory,Richland, Washington.
United States Water Resources Research Council. 1983. Economic andEnvironmental Principles and Guidelines for Water and Related LandResources Implementation Studies. United States Government PrintingOffice, Washington, D.C.
68 / Bibliography
Report RM-107, Rocky Mountain Forest and Range Experiment Station,U.S. Forest Service, Fort Collins, Colorado.
Sorg, C. F., and L. J. Nelson. 1986. Net Economic Value of ElkHunting in Idaho. U.S. Forest Service Resource Bulletin RM-12, RockyMountain Forest and Range Experiment Station, U.S. Forest Service,Fort Collins, Colorado.
Stoll, J. R. 1980. The Valuation of Hunting Related Amenities: AConceptual and Empirical Approach. Dissertation, DAI, Vol. 41, 4783,University of Kentucky.
Stoll, J., and L. Johnson. 1984. “Concepts of Value, Non-MarketValuation, and the Case of the Whooping Crane.” Transactions of theNorth American Wildlife and Natural Resources Conference 49.
Ulibarri, C. A. and S. Ghosh. 1995. “Benefit-Transfer Valuation ofEcological Resources.” Pacific Northwest National Laboratory,Richland, Washington.
United States Water Resources Research Council. 1983. Economic andEnvironmental Principles and Guidelines for Water and Related LandResources Implementation Studies. United States Government PrintingOffice, Washington, D.C.
Bibliography / 69
vanRavensway, E. O., and J. P. Hoehn. 1991. “Contingent Valuationand Food Safety: The Case of Pesticide Residues in Food.” Staff PaperNo. 91-13, Department of Agricultural Economics, Michigan StateUniversity.
vanRavensway, E. O., and J. P. Hoehn. 1991. “Consumer Willingnessto Pay for Reducing Pesticide Residues in Fresh Produce.” Staff PaperNo. 91-18, Department of Agricultural Economics, Michigan StateUniversity.
Vaughn, W. J., and C. S. Russell. 1982. “Valuing a Fishing Day: AnApplication of a Systematic Varying Parameter Model.” LandEconomics 58:450-630.
Viscusi, W. K., W. A. Magat, and J. Huber. 1989. Pricing Environ-mental Health Risks: Survey Assessments of Risk-Risk and Risk-DollarsTrade-Off. Research report to U.S. Environmental Protection Agency,Washington, D.C.
Viscusi, W. Kip. 1990. “The Value of Life: Has Voodoo EconomicsCome to the Courts?” Journal of Forensic Economics 3(3):1-15.
Walsh, R. G. 1991. “Empirical Evidence on Benefits of Protecting OldGrowth Forests and the Spotted Owl.” Appendix B in EconomicAnalysis of Designation of Critical Habitat for the Northern SpottedOwl, U.S. Department of the Interior, Fish and Wildlife Service,Washington, D.C.
Walsh, R. G., R. D. Bjonback, R. A. Aiken and D. H. Rosenthal. 1990. “Estimating the Public Benefits of Protecting Forest Quality.” Journalof Environmental Management 30(2):1975-1989.
Walsh, R. G., and L. O. Gilliam. 1982. “Benefits of WildernessExpansion with Excess Demand for Indian Peaks.” Western Journal ofAgricultural Economics 7:1-12.
70 / Bibliography
Walsh, R. G., D. M. Johnson and J. R. McKean. 1988. Review ofOutdoor Recreation Research Economic Demand Studies withNonmarket Benefits Estimates: 1968-1988. Technical Report No. 54,Colorado Water Resources Research Institute, Colorado State University,Fort Collins, Colorado.
Walsh, R. G., D. M. Johnson, and J. R. McKean. 1990. “Non-MarketValues from Two Decades of Research on Recreational Demand.” InAdvances in Applied Microeconomics, A. N. Link and V. K. Smith,(ed.), vol. 5, pp.167-193, JAI Press, Greenwich.
Walsh, R. G., D. M. Johnson, and J. R. McKean. 1992. “BenefitTransfer of Outdoor Recreation Demand Studies, 1968-1988. “WaterResources Research 28 (3) [Special Section: Problems and Issues in theValidity of Benefit Transfer Methodologies.]
Walsh, R. G., J. B. Loomis and R. A. Gillman. 1984. “Valuing Option,Existence and Bequest Demands for Wilderness.” Land Economics60:14-29.
Ward, K. M., and J. W. Duffield. 1992. Natural Resource Damages:Law and Economics. Wiley Law Publications, New York.
Woo, C-K., and R. L. Pupp. 1992. “Costs of Service Disruptions toElectricity Consumers.” Energy 17:109-126.

Appendix A
Economics Glossary
Appendix A
Economics Glossary
benefit-cost analysis - a technique to compare the relative economic effi-ciency of different states of the world usually brought about by under-taking projects or policies. A comparison is made between gross benefitsof a project or policy and the opportunity costs of the action. Benefitsand costs are measured as changes in consumer and producer surplusesaccruing to individuals in society.
consumer surplus - a money measure of an individual’s or group’swelfare from consumption of a good or service or the existence of a par-ticular state of the world. This surplus is the difference between themaximum the individual is willing to pay for consumption of the goodand the amount that has to be paid.
consumptive use value - values held for the use of natural resource ser-vices which involve the physical use of the environment (e.g., fishing,duck hunting).
contingent valuation - a methodology to determine money measures ofchange in welfare by describing a hypothetical situation to respondentsand eliciting how much they would be willing to pay either to obtain or toavoid the situation.
A-2 / Appendix A
demand - in economics, the usual inverse relationship between quantityconsumed (or otherwise used or even preserved) and a person’s maxi-mum willingness to pay for incremental increases in quantity. Marketprices often (but not always) reveal the increments of willingness to pay. Other factors influencing willingness to pay include income, prices ofsubstitutes, and, in recreational fishing, catch rate. Unlike planning,where demand refers to the size of the quantity variable, economicdemand is a behavioral relationship.
discount rate - a measure of the opportunity cost of not having immedi-ate access to resources. Traditionally, discount rates may reflect theinterest rate on savings accounts, financial portfolios, or bonds. Discountrates may also reflect other social, psychological, and intertemporalconcerns.
discounting - a procedure to use when comparing value streams (benefitsor costs) occurring in different magnitudes at different dates in the future. The procedure “discounts” future values in order to obtain the presentvalue of the stream.
environmental valuation - procedures for valuing changes in environ-mental goods and services, whether or not they are traded in markets, bymeasuring the changes in the producer and consumer surpluses associatedwith these environmental goods.
existence value - see nonuse value.
gross domestic product - aggregate annual output of the economybefore deducting the value of the assets of the economy that have beenused up or depreciated in the production process during the year. Grossdomestic product provides a summary measure of the nation’s overalleconomic performance.
Economics Glossary / A-3
hedonic method - a methodology for estimating the relationship betweenthe price of a good (e.g., housing) and the characteristics of the good(e.g., number of bedrooms, air quality, proximity to amenities, etc.). Itcan sometimes be used to value changes in environmental characteristics.
input-output model - a methodology that models the linkages betweeninput supplies, outputs, and households in a regional economy that can beused to predict the impact of changes on economic activity within theregion (e.g., industry revenues and household incomes).
market benefits - benefits from goods or services bought and sold innormal commerce so that there is a revealed price that reflects consumers’willingness to pay for the quantity offered and suppliers’ marginalproduction costs.
nonconsumptive use values - values held for the use of natural resourceservices that do not imply actual harvest of any resource (e.g., canoeing,swimming, bird-watching).
nonmarket benefits - benefits that accrue to individuals for goods,services, experiences, or states of nature that are not normally traded incommerce.
nonuse value (see also use value) - the value of knowing that somethingexists in a particular state even though there is no sensory contact withthe resource. Nonuse values are often referred to as existence value,intrinsic value, or preservation or bequest value. A recent term of art ispassive use value.
opportunity cost - the highest value a productive resource, such as labor,capital, land or a natural resource, could return if placed in its bestalternative use.
passive use value - see nonuse value.
A-4 / Appendix A
producer surplus - total revenue minus the opportunity cost of produc-tion, including the opportunity costs of the entrepreneur’s skills, labor,capital, and ownership of natural resources.
random utility model - an extension of the travel cost method thatexplicitly considers individual’s participation decisions and the selectionamong alternative recreation sites.
supply - schedule of the quantities of goods and services that a businessis willing to sell at various prices. Other factors that affect supplyinclude input prices.
travel cost method - a methodology that relies on travel-related costs asa surrogate for price in a nonmarket situation in order to estimate demandand money measures of willingness to pay.
use value - value derived from either the consumption of a good or theutilization of a service or that otherwise involves some sensory contactwith the resource. For example, whale-watching is not consumptive, butinvolves visual contact with the whales.
value - what one is willing to give up in order to obtain a good, service,experience, or state of nature. Economists try to measure this in dollars.
welfare economics - a field of inquiry within the broad scope ofeconomics that is concerned with money measures of individual andsocial well-being, particularly in changes in well-being due to imple-mentation of public policies.
willingness to pay - the maximum sum of money an individual would bewilling to pay rather than do without an increase in some good such as anenvironmental amenity. This sum is the amount of money that wouldmake the individual indifferent to either a) paying for and having theimprovement or b) forgoing the improvement while keeping the money tospend on other things.
Economics Glossary / A-5
willingness to accept - the minimum sum of money an individual wouldrequire to voluntarily forgo an improvement that otherwise would beexperienced. It is the amount that would make a person indifferent toeither having the improvement and forgoing the improvement whilegetting extra money.

Appendix B
Regulatory Glossary
Appendix B
Regulatory Glossary
This appendix summarizes important state and federal environmentalprotection statues under which U.S. Department of Energy (DOE) fieldoperations are run and which can impact the value of the environment andnatural resources.
National Environmental Policy Act (NEPA) - designed to lessen oreliminate damages to the environment and to protect natural resources. Itrequires that the impacts to the environment of any major federal projectbe carefully reviewed and reported in environmental impact statements,environmental assessments, or other NEPA-generated documents(Arbuckle et al. 1989).
Clean Air Act (CAA) - designed to protect public health by establishingnational air quality standards. Although the primary regulatory controlfor the CAA rests with state and local governments, the CAA gave theU.S. Environmental Protection Agency (EPA) the authority to establishminimum air quality standards and outline air pollution control measuresfor state and local governments to achieve.
B-2 / Appendix B
Clean Water Act (CWA) - provides the basic framework for federalwater pollution control regulation. As stated in Section 101 of the Act,the CWA is designed to “restore and maintain the chemical, physical, andbiological integrity of the nation’s waters.” The five main elements of theact include a permit program, national effluent standards for specificindustries, water quality standards, provisions for occurrences such astoxic and oil spills, and a grant program for construction of publiclyowned treatment facilities (Arbuckle et al. 1989).
Resource Conservation and Recovery Act (RCRA) - establishesregulatory standards that are imposed on the generators and transportersof hazardous materials. It also provides regulatory standards for thetreatment, storage, and disposal of hazardous materials (Arbuckle et al.1989).
Comprehensive Environmental Response, Compensation, andLiability Act (CERCLA) - establishes a program that provides fundingand enforcement authority for the cleanup of sites contaminated byhazardous substances. The Superfund Amendments and ReauthorizationAct (SARA) broadened the scope of CERCLA to include provisions forfederal facilities. The CERCLA joins with RCRA to provide completeregulatory coverage of hazardous waste disposal. While RCRA focuseson a “cradle-to-grave” approach to present hazardous waste activities,CERCLA establishes a response program to past hazardous wasteactivities (Arbuckle et al. 1989).
Toxic Substance Control Act (TSCA) - gives the EPA authority torequire testing of substances that enter the environment, as well as theauthority to regulate those substances. This regulation supplements theClean Air Act and Clean Water Act regulatory control over toxic sub-stances (Arbuckle et al. 1989).

Regulatory Glossary / B-3
Endangered Species Act - provides for conservation, restoration,propagation, and protection of species that have been declared threatenedor endangered. The Act requires all federal agencies to conserveendangered wildlife and provides for the listing of critical habitatsessential to species survival.
American Indian Religious Freedom Act - requires that no federalagency interfere with the right of any Native American to exercise theirtraditional religious beliefs. This Act also states that the NativeAmerican’s right to worship includes access to religious sites andpossession and use of traditional religious objects.
National Historic Preservation Act - designed to protect, restore, andreconstruct sites, buildings, and objects that are significant to Americanhistory or culture. It also requires the study of impacts to any historicalor archaeological sites by any federal activity.
Archaeological Resources Protection Act - designed to protect andregulate the use of archaeological resources on federal and NativeAmerican lands by prohibiting excavation or removal of resourceswithout a permit.
Executive Order 11988 on Floodplain Management - designed tolessen or eliminate impacts to floodplains by regulating floodplain useand modification.
Executive Order 11990 on Protection of Wetlands - designed to lessenor eliminate damages to wetland areas by preventing new construction inwetland areas and by requiring any damages to be mitigated.

B-4 / Appendix B
Executive Order 12866 on Regulatory Planning and Review -designed to reform and make more efficient the regulatory process. Theobjectives are to enhance planning and coordination with respect to bothnew and existing regulations, to reaffirm the primacy of federal agenciesin the regulatory decision-making process, to restore the integrity andlegitimacy of regulatory review and oversight, and to make the processmore accessible and open to the public.