Embed Size (px)
Citation preview
UNIT-I PGDEM-02
WATER RESOURCES Written by Dr. Hardeep Rai Sharma,
SIM conversion by Prof. Narsi Ram Bishnoi
STRUCTURE
1.0 OBJECTIVES
1.1 INTRODUCTION
1.2 UNIQUE CHARACTERISTICS OF WATER
1.3 TYPES OF WATER RESOURCES
1.3.1 Surface Water
1.3.1.1 Rivers
1.3.1.2 Lakes
1.3.1.3 Ponds
1.3.1.4 Oceans
1.3.1.5 Glaciers.
1.3.2 Ground Water
1.3.3 Artesian Well
1.3.4 Springs.
1.4 WATER CONSERVATION PRACTICES
1.5 SUMMARY
1.6 KEY WORDS
1.7 SELF ASSESSMENT QUESTIONS
1.8 SUGGESTED READINGS
1.0 OBJECTIVES
After studying this unit, you will be able to understand:
1. The necessity of water and its characteristics.
2. Different type of methods adopted for conservation of water.

3. To know about the water resources and its Indian scenario.
1.1 INTRODUCTION
Water is the basic component of living beings. Human and plant body
consists of 60% and 90% water respectively. It is impossible to think life
without water, we require 3 to 5 liter of water a day; without water one can not
survive. It is some what difficult to discuss all uses of water, but some are
enlisted below:
1. Man uses water not only for drinking purposes but also for bathing,
washing, laundering, heating, air conditioning, agriculture, gardening,
industries (e.g. for power generation, steam generation and fire
protection, swimming and boating and other recreational purposes.
2. Most of the biochemical reactions that occur in the metabolism and
growth of living cells involve water, so Water is often termed as the
universal solvent.
3. Mammals require water to regulate their body temperature. Man's body
temperature remains fairly constant at 36.8ºC, and a rise of 3ºC may
prove fatal. This is regulated by water only. The history of human
civilization reveals that water occurrence and civilization are almost
synonymous. Several cities and civilization have disappeared due to
water shortages originating from climatic changes. Millions of people all
over the world particularly in the developing countries are losing their
lives every year from water borne diseases.
1.2 UNIQUE CHARACTERISTICS OF WATER
Water (H2O) has some unique characteristics/physical properties which
make it more useful and important than other solvents. These are:
1. Water has a boiling point of 100ºC and solid water (ice) has a milting
point of 0ºC. Otherwise, water at normal temperature would be a gas
rather than a liquid and the earth would have no oceans, lakes, rivers,
plants and animals.
2. Liquid water has a very high heat of vaporization. It means that water
absorbs large amount of heat when evaporated by solar radiation from
water bodies and releases the same when it return to earth surface as
precipitation. This ability to store and release large amounts of heat
during physical changes is a major factor distributing heat throughout
the world.
3. Liquid water is able to store large amount of heat without a large
temperature change i.e. it has high heat capacity. This property
prevents large bodies of water from warming or cooling rapidly,
help/protect living organisms from the shock of abrupt temperature
changes. This property also helps in keeping the earth's climate
moderate; makes water an effective coolant for car engines, power
plants and other heat producing industrial process.
4. Water is Able to dissolve large variety of compounds i.e. it is a superior
solvent. This makes water to help in transport of nutrient throughout the
tissues of plants and animals, to be a good cleaning agent for all
purpose -cleaner and to remove and dilute, the water soluble wastes of
civilization. This ability of water to act as a solvent also makes it easy
to pollute.
5. Water has an extremely high surface tension (the force that causes the
surface of a liquid to contract) and an even higher wetting ability. These
properties are responsible for liquid water's capillarity-the ability to rise
from tiny pores in the soil into thin, hollow tubes, called capillaries, in
the stems of plants.
6. Liquid water is the only common substance that expands rather than
contracts when freezes. Ice has a lower-density than liquid water and
thus ice floats on water. Water bodies thus freeze from the top down
instead of from the bottom up. Without this property, lakes and rivers in
cold climates would freeze solid and most known forms of aquatic life
would not exist. However, water expands on freezing it may also break
pipes, crack engine block and fracture streets and rocks, so we use
antifreeze agents.

Water Use: Water is mainly used in -two ways – in stream and off stream
use. Instream water use include the use of water for navigation, hydroelectric
power generati6n, fishing, wild life habitat and recreation.
Off stream use remove water from its source (surface water and
ground water). Water is used for various purposes like drinking, washing
clothes, bathing, cleaning, cooling, irrigation and in industry. Water is
consumed, it is no longer available for reuse in the local area because of
evaporation, storage in the living matter of plants and animals, contamination
or seepage into the ground. Almost three-fourths of the water withdrawn each
year throughout the world is used for irrigation. The remainder is used for
industrial processing, cooling electric power plants, in homes and business.
However, water use vary widely from one country to an other,
depending on the relative amounts of agricultural and industrial production.
People in more developed countries use more amount of water as compared
to people living in less developed countries. Worldwide, upto 90% of all water
withdrawn is returned to rivers and lakes for reuse and is not consumed.
Indian Scenario: In India total annual renewable freshwater resources are
estimated at 2085 billion cubic metres (Gm3). However, the annual average
water availability (AWR) in terms of utilizable water resources is estimated at
1086 Gm3, comprising 690 Gm3 of surface water and 395.6 Gm3 of
groundwater. In India 6.6 % of the total use of water is used for domestic
purposes. 78.5% in irrigation, 4% in energy production, 4.5% in industries and
6.2% for other purposes.
In the beginning of the century, India's per capita water availability was
45-55 cubic metres (m3) per year. It is reduced to 1283 m3 in the year 1991.,
As estimated India's population by the year 2010, 2025 and 2050 will be 1189
millions, 1392 millions and 1640 million respectively. Accordingly the per
capita water availability (AWR) will be 913 cum, 780 cum and 662 cum by the
year 2010, 2025 and 2050 respectively. In fact our country may likely to
experience "water stress" from the year 2007 onwards.
1.3 TYPES OF WATER RESOURCES

The earth's water resources consists of the oceans and seas, the ice
and snow of polar regions and mountain glaciers, the water contained in
surface soils, and underground, the water in lakes, rivers and streams. These
water resources collectively form hydrosphere. Less than 1% of these
resources consist of freshwater, about 2% is freshwater ice located mainly in
the polar regions and remaining 97% consists of sea water. The annual
evaporation of water from the hydrosphere and its return as rainfall amounts
to about 260 x 1012 m3. The total water content of the atmosphere is about
7x10¹²m3, indicating atmospheric water is replaced in an average about 37
times a year.
1.3.1 Surface water
The yearly amount of water flowing in streams in any region is directly
related to the annual rainfall. Most of the streams in arid or semiarid regions
are dry except right after the rare rains. On the average about 70% of the
rainfall evaporates directly or indirectly via plant transpiration of the remaining
30% travels through underground strata along rivers and streams and about
90% of the total run off reaches the oceans. The quantity of water remaining
on the surface water after losses due to evaporation, percolation and
transpiration etc. is known as runoff and forms the surface for all surface
water. Rivers, lakes, ponds, streams, oceans are example of surface water.
1.3.1.1 Rivers
Most of the surface runoff is dominated by the large stream network of
major rivers systems. Of the enormous number of streams on the continents,
only about seventy major systems carry one-half of the entire runoff from the
land areas of the world.
Large rivers are the main source of water supply for many cities and
towns. River may be perennial as well -as non-perennial. In perennial rivers
water flows for all the seasons because such rivers are snow fed. The
non-perennial rivers get dried in summer either partially or completely and in
monsoon, they are flooded with water. The total average annual water yield
(runoff) from rivers is approximately 47.000 km3 (1.2 x 10¹⁶gal). The natural
shape of the channel of a river at any point is determined the rate of flow

(discharge) of water and the topology and geology of the terrain through
which the river passes. The quality of water from a river depends mainly on
character and area of catchments; topography seasonal conditions and
various anthropogenic activities in the vicinity of the river catchments area.
Surface flow in our country takes place through 14 major river system
namely Brahmani, Brahmaputra, Cauvery, Ganga, Godavari, Indus, Krishna,
Mahanadi, Mati, Narmada, Perriar, Sabarmati, Subernarekha and Tapti.
Brahmaputra, Ganga, Mahanadi and Brahmani are perennial. Apart from
them there are 44 medium and 55 minor rivers system which are monsoon
fed, fast flowing and originate in the coastal mountains of the major rivers.
Most of the Indian rivers' have nearly 80% of their discharge during the
monsoon months (June - September). Water flows in some great rivers is
depicted in table- 1.
Table 1. Water flows in some great rivers (in m3/sec.).
River Location Annual Discharge
Amazon South America 175, 000
Congo Africa 39,200
Lena Russia 16,000
Parana Paraguay, Argentina 18,000
Bbramputra Asia, India 19,800
Ganges Asia, India 18,700
Mississippi North America 17,500
Yangtze Tibet, China 28,000
1.3.1.2 Lakes
Lakes owes their existence to depression in the landscape. The water
filling these depressions comes from runoff or ground water or both. Thus
some lakes are- rivers running into and out of them, some have only an outlet,
other have inlets only and some are filled only by groundwater. A lake can be
consequence of any one of a variety of geologic events i.e. earth quake,
volcanic activity and glaciations and some are due to the human activity.

Although lakes exist under different climatic conditions from arctic to
deserts to tropics and contain water that range, widely in both salinity and
acidity. They all share one characteristic they are relatively short lived in the
geological time. Lakes are maintained by springs or ground water seepage,
may disappear if the regional water table drops. For some lakes climatic shift
that results in increased evaporation, decreased rainfall or both may reduce
the water volume and may even cause them to completely dry up eventually.
Lakes may be natural or artificial. An artificial lake formed by the
construction of dam across a valley is known as storage reservoir. The
multipurpose reservoirs also make provisions for other uses in addition to
water supply like for power generation, irrigation and recreation purposes.
1.3.1.3 Ponds
Ponds are the man made bodies to collect water and are smaller than
lakes. The monsoon water is collected in the ponds which is used for different
purposes such as bathing, washing the clothes for cattle drinking throughout
the year. Large ponds also use water for irrigation of crops. The ponds as
rescharger of ground water table. Through these ponds act water seeks into
ground and cause improvement in water table gradually.
1.3.1.4 Oceans
Oceans are the earth's largest reservoir of water and are the prominent
feature of earth's surface. It covers 71% of the total area, to an average depth
of 4 kilometers. Seawater contains large amounts of dissolved salts, the most
abundant are sodium chloride and magnesium sulfate. The salts from
weathering and erosion of soils and rocks ultimately reach to oceans by
rivers. The salinity of sea water make it unable to drink. In fact, drinking of salt
water actually causes dehydration and an increased urge of water. The
salinity of sea water is remarkably uniform. It varies from 32,000 ppm (in rainy
climates or during melting of ice) to 38,000 pprn (sea ice formation or
excessive evaporation) with an average of 35,000 ppm. This salinity makes
sea water unfit for drinking as well as for cleaning and irrigation. Ocean
circulates heat energy through persistent currents, which redistribute the solar
energy that is absorbed by the surface waters. The circulation of surface

ocean currents is controlled by a coupling of winds with surface waters. The
sea is an essential reservoir in most of the cycles of materials and energy flow
on earth. Materials that are cycled into an ocean waters may remain there for
thousands even millions of years before being cycled out again. Thus it also
acts as a final dustbin for much of the water and air pollutants. Sea is also the
source of food and minerals also. The economically feasible raw materials
extracted from oceans' are sodium chloride, bromine and magnesium.
1.3.1.5 Glaciers
Glaciers which are really rivers of ice, represent another pathway taken
by the runoff components of the hydrological cycle in the journey of the sea.
Today, glaciers constitute the largest fresh water reservoir, although this
resource goes unused. Water in the form of glacial ice covers about 10% of
the earth's land surface
and is contained primarily in another(85,%), Greenland and some higher
mountain valley (4%)., If all of this, ice were to melt, the level of the seas
would rised by about 60 meters, sinking mainly all world's major coastal
cities.
In the earth history as a whole, the presence of any glacial ice at all
was a rare event. Yet during the post one or two million years, glaciers
alternatively expended and receded many times. As recently as 18000 year
ago, more then 30% of the earth's land surface was covered with ice. In North
America one ice sheet perhaps 3 km thick covered much of Canada and
Northern States. At that time sea level was about 100 meters lower than it is
now, because so much of ice tied up as ice.
Over geological time, the glaciers formed or receded depending on the
climate. Although greatly diminished in size, glacial ice, still represent the
earth's largest reservoir of fresh water.
1.3.2 Groundwater
The groundwater usually refers, to the water below the water table
where saturated conditions exist. Under the influence of gravity some
infiltrating water slowly percolates through pores in rock such as sand stone.
These water bearing layers of the earth's crust are called aquifers and the

water in them is known as groundwater. There are no open spaces under the
ground like rivers runs on the surface, except in cavernous limestone
networks and some open lava tubes in volcanic terrenes. The water travels by
twisting through the pore spaces between the sand grains. The' smaller the
pore spaces and the more difficult, fluids to pass through a solid is known as
permeability. The permeability depends largely on the amount of pore space
between the grains or crystals of the rock, the porosity. Thus the ground acts
like a sponge, seeking up rain in some places and leaking it out at other
places. The sandy or other kinds of beds that produce waters are called
aquifers.
There are two types of aquifers: confined and unconfined. An
unconfined aquifer forms when groundwater collects above a layer of
relatively impermeable rock or compacted clay. The top of the water saturated
portion of an unconfined aquifer is called water table. Shallow, unconfined
aquifers are recharged by water percolating downward from soils and
materials directly above the aquifer.
A confined or artesian aquifer forms when groundwater is sandwiched
between two layers of relatively impermeable rock such as clay or shade.
1.3.3 Artesian well
Confined aquifers are completely saturated with water under a
pressure greater than that of the atmosphere. In some cases the pressure is
so great that when a well is drilled into the confined aquifer, water is pushed
to the surface without the use of a pump. Such a well is called a flowing
artesian well. In other confined aquifers wells, known as non-flowing artesian
wells, pumps are used in order, to get water for various human purposes. In
these aquifers pressure is insufficient to force the water to the surface.
1.3.4 Springs
Springs arc places where a flow of water rises to the surface through
natural rock opening under hydraulic pressure from the depth. The aquifer is
either exposed at the surface or under lies a pervious material. The water of
springs will be either in plenty or scarce, depending on the area and the

thickness of the aquifer. A spring or chain of springs is common at the
junctions of permeable and impermeable rocks.
Hot springs and Geysers
They generally occur in regions of active or recent volcanism. The
ground water comes in contact with the heated or superheated steam inside,
the earth and emerges at the surface either as a hot spring or as a geysers. A
geyser is hot spring in which water is forced up by steam pressure at
intervals. As the opening at the surface is small, water and steam cannot flow
out regularly. The steam pressure forces the water to shoot out through the
openings. Mineral springs are hot springs in which minerals are dissolved and
water have unusual colour, taste or odours. The coldwater springs are found
in The Himalayas, the Western Ghats along Koukan coast and the Chota
Nagpur uplands. Hot springs are found in many parts of the country especially
in the hilly or mountainous parts of Jammu and Kashmir as well as in
Himachal Pradesh, Bihar and Assam. Some of the important hot springs are
the Manikaran (Kulu),Tatapani (Shimla) and Jwalamukhi (Kangra) in Himachal
Pmaish; Rajgier (Patna), sitakund (Munger) in Bihar.
1.3.5 Wetlands
Wet lands are bogs, swamps, wet meadows and marshes play a vital
and often unappreciated role in the hydrological cycle. Their bush plant growth
stabilizes soil and holds back surface runoff, allowing time for infiltration into
aquifers and producing even, year long stream flow. When wet lands are
disturbed their natural water absorbing capacity is reduced and surface water
runoff quickly, resulting in floods and erosion during the rainy season and low
stream flow the rest of the year.
1.4 WATER CONSERVATION
The following methods strategies can be adopted for the conservation
of water:
1.4.1 Reducing Irrigation losses:
Improved agricultural irrigation could reduced water losses by between
20 and 30% because agriculture is the biggest water user (80% of total fresh

water consumptive user), there would be a tremendous saving. Most irrigation
systems distribute water from a ground water well or surface canal by gravity
flow through unlined field ditches. Although this method is cheap, it provide far
more water than needed for crop growth, and at least 50% of the water is lost
by evaporation and seepage. Following suggestions can reduce the irrigation
losses
1. Fix price for some and agricultural water to encourage conservation as
subsidizing water may encourage overuse.
2. Use lined or covered canals that reduce seepage and cultivation.
Irrigation ditches can be lined with plastic sheets to prevent seepage
and water logging, and ponds can be constructed to store runoff for
later use.
3. Irrigate the fields at times when evaporation is minimal, such as night
or in the early morning.
4. Use improved irrigation systems, such as sprinklers or drip irrigation,
that more affectively apply water to crops. Sprinklers reduce water
wastage from 50% to 30%. In drip irrigation (micro-irrigation) is applied
at low rate over a long period of time, at frequent intervals directly into
the plant's root zone and also through a low pressure delivery system.
5. Proper use of available water sources. That is, irrigate with surplus
surface water to recharge groundwater aquifers by applying the surface
water to specially designed infiltration ponds or injection wells. When
surface water is in short supply, use more ground water
6. New hybrid crop varieties should be used which require less water or
are more tolerant to saline water.
7. Improve land for water application; i.e. improve the soil to increase
infiltration and, minimize runoff.
1.4.2 Water conservation in house holds
In our daily life, if we slightly modify our life style we can conserve good amount of water e.g. while during brushing and shaving some people left the tap open which will waste a lot of water without any use. 25% of the water

could be saved through simple measures such as water saving toilets, shower heads, leak control without noticeable impact on current life styles. Use of shower during bathing is more helpful as it consumes less water in case of bucket. In showers water breaks into droplets and thus less amount of water can give us complete bath. In our surroundings water taps are running as such as we pass by ignoring them. If we shut down the tap, it will help in saving water. In houses many times the water tanks is out of flow due to our ignorance. If we use less water containing flushes in our toilets it will save water. The old flushes tanks were of 10 Litre capacity, now with new techniques, small flushes tanks of 4-5 Litre capacity are available in market. In some foreign countries Govt. of providing subsidy on ML falling new flushes in toilets. Gray-water recycling systems are being adopted in some water-shortage areas. Gray-water, the slightly dirtied water from sinks, showers, bath-tubs and laundry tubs is collected in a holding tank and used for flushing toilets, watering lawns and washing cars. In many parts of the North America, domestic water use now exceeds 600 Litre per person per day, yet in dry African Nations people consumes only 8-20 Litre per person per day.
Each of us can consume much of water we use and avoid water pollution in many simple ways.
• Don’t flush every time you use the toilet. Take shorter showers, and shower instead of taking baths.
• Don’t let the faucet run while brushing your teeth or washing dishes. Draw a basin of water for washing and another for rinsing dishes. Don’t run the dishwater when half full.
• Use water conserving appliances: low-flow showers, low-flush toilets,
and aerated faucets.
• Fix leaking faucets, tubs, and toilets. A leaky toilet can waste 50 gal per
day. To check your toilet, and a few drops of dark food coloring to the
tank and wait 15 minutes. If the tank is leaking, the water in the bowl
will change color.
• Put a brick or full water bottle in your toilet tank to reduce the volume of
water in each flush.

• Dispose of used motor oil, household hazardous waste, batteries, etc.,
responsibly. Don’t dump anything down a storm sewer that you
wouldn’t want to drink.
• Avoid using toxic or hazardous chemicals for simple cleaning or
plumbing jobs. A plunger or plumber’s snake will often unclog a drain
just as well as caustic acids or lye. Hot water and soap can accomplish
most cleaning tasks.
• If you have a lawn, or know someone who does, use water, fertilizer,
and pesticides sparingly. Plant native, low-maintenance plants that
have low water needs.
• Use recycled water for lawns, house plants, and car washing.
1.4.3 Others
Treated wastewater (sewage water) can be used for irrigation and it will
also reduce pollution of receiving waters. We can use recycle water of an
industry or we can change the designing of the industrial process to save
water. One of the simplest and most effective measures available for water
conservation is metering and the consumer is billed for each unit of water
used. So called "increasing block" pricing in which the consumer pays a
proportionately higher rate with higher use, is a particularly effective way to
encourage water efficiency.
1.5 SUMMARY
The earth’s water resources consists of the oceans and seas, the ice, snow of polar regions, mountains and glaciers. The water also present in surface soil and underground, lakes, rivers and streams. Unnecessary loss of water can be overcome by decreasing evaporation loss of irrigated water, to encourage the public to reduce unnecessary wastage of water.
1.6 KEY WORDS
Resource: Any material which can be transformed in a way that it becomes more valuable and useful, can be termed a resources.

Glacier: A body of ice, consisting largely of recrystallized snow, that shows evidence of downslope or outward movement due to the stress of its own weight.
Aquifer: Water- bearing formation of rock or soil that will yield usable supplies of water. May be classified as confined or unconfined.
Artesian Aquifer: Aquifer in which water is field under pressure by confining layers, forcing water to rise in wells above the top of the aquifer.
Springs: Springs are places where a flow of water rises to the surface through natural rock opening under hydraulic pressure from the depth.
Geyser: A hot spring equipped with a system of plumbing and heating that causes intermittent eruptions of water and steam.
Wet Lands: Ecosystem of several types in which rooted vegetation is surrounded by standing water during part of the year.
1.7 SELF ASSESSMENT QUESTIONS
1. What are the main types of water use?
2. How can we reduce the water demands in agriculture and households?
3. Discuss the types of water resources present with earth.
4. Describe the path a molecule of water might follow through the hydrological cycle from the ocean to land and back again.
5. How can we use the earth’s water more substainably.
6. What percentage of the earth’s total volume of the water is easily
available for use by the people?
7. List unique properties of the water.
8. List four causes of water scarcity.
1.8 SUGGESTED READING
1. Birdie, G.S. and Birdie, J.S. (2006). Water Supply and Sanitary
Engineering. Dhanpat Rai Publishing Company, New Delhi.
2. Chatterjee, A.K. (2001). Water Supply, Water Disposal amnd
Environmental Engineering. Khanna Publisher, New Delhi.

3. Cunningham, W.P. and Cunningham, M.A. (2003). Principles of
Environmental Science. Tata McGraw Hill Edition, New Delhi.
4. Figuerer, C.M. (2005). Rethinking Water Management: Innovative
Approaches to Contemporary Issues. Earthscan, New York.
5. Kanchan, C. (2003). Water Resources, Sustainable, Livehood and
Ecosystem Services. Concept Publications, New Delhi.
6. Krishnamoorthy, B. (2005). Environmental Management. Prentice Hall
of India, New Delhi.
7. Miller, J.T. (2004). Environmental Science. 5th Edition. Thomas Press,
Australia.
8. Mohammad, K. (2003). Water Resources System and Analysis, Lewis
Publication, New York.
9. Rana, S.V.S. (2006). Environmental Pollution: Health and Toxicology.
Narosa, New Delhi.
10. Rubin, H. (2002). Water Resources and Quality, Springer, New York.
11. Singh, J.S., Singh, S.P. and Gupta, S.R. (2006). Ecology, Environment
and Resource Conservation. Anamaya Publication, New Delhi.
12. Vasudevan, N. (2006). Essentials of Environmental Science. Narosa,
New Delhi.

UNIT-I PGDEM-02
WATER MANAGEMENT
Written by Dr. Hardeep Rai Sharma
SIM conversion by Prof. Narsi Ram Bishnoi
STRUCTURE
2.0 OBJECTIVES
2.1 INTRODUCTION
2.2 WATER MANAGEMENT STRATEGIES
2.2.1 Build dams and reservoirs
2.2.2 Divert water from one part to another
2.2.3 Tap more groundwater
2.2.4 Tow freshwater icebergs from the Antarctic
2.3 WATER SHED MANAGEMENT
2.4 DESALINIZATION
2.5 RAINWATER HARVESTING
2.5.1 Types of rainwater harvesting
2.5.1.1 Traditional rainwater harvesting
2.5.1.2 Modern methods for rainwater harvesting
2.6 CLOUD SEEDING
2.7 SUMMARY
2.8 KEY WORDS
2.9 SELF ASSESSMENT QUESTIONS
2.10 SUGGESTED READINGS
2.0 OBJECTIVES
After studying this unit, you will be able to understand the various
techniques:
• To reduce unnecessary loss of water
• To conserve the rain water • Desalinization of salty water 2.1 INTRODUCTION
Water-Management aims to increase the supply of water and to reduce
unnecessary loss of water. Unnecessary loss of water can be overcome by
decreasing evaporation of irrigation water (reducing irrigation losses); Redesign
mining and industrial processes to use less water; Encourage the public to
reduce unnecessary water waste and use ; Increase, the price of water to
encourage water conservation.; Purify polluted water for reuse. Some of these
points are discussed in detail in above topic of water conservation.
Water supply can be increased by- building dams and reservoirs divert
water from one region to another; Tapping more ground water; converting salt
water to fresh water (desalinization) Seeds clouds to increase precipitation; Top
freshwater icebergs from the Antarctic to water short coastal regions.
2.2 WATER MANAGEMENT STRATEGIES
2.2.1 Build dams and reservoirs: Dams are built to conserve surface water
and regulate its availability. In monsoon season rivers carries huge
amount of water into oceans in a short span of 3-4 months. Many times
rivers cause a great loss to crops, animals and humans beings in form of
floods. Every year states like West Bengal; Bihar, Orissa and Uttar
Pradesh faces floods in monsoon seasons. If we conserved and collect
the water which otherwise goes to sea, is helpful to us by many ways.
Thus dams are built to collect excess water, The water collected in dams
is used for irrigation purposes, especially in drought prone regions by
making canals. Further can generate hydroelectric power, control floods,
protect fertile flood plains of rivers. Dams also create recreational
opportunities, such as bathing swimming and fishing. These are some
negative impacts of dams like high costs of construction; water logging on
adjacent land; rehabilitation problems, destroy vast areas of valuable
agricultural land, wildlife habitat and scenic beauty; interfere with
spawning migration of some fish and trapping of nutrients alongwith

sediments. Further more faulty construction or earthquakes can cause
dams to fail and water that floods from a damaged dam can cause a
huge loss to man lives and property.
2.2.2 Divert water from one part to another: In this method of increasing the
use of a limited water supply, water is transferred from an excess water
zone to an area having low water availability. The National Water Policy
1987 emphasizes a strategy for maximizing water resources availability,
transfer of water to water short areas from other areas as well as
transfers from one river basin to another, based on a national
perspective, after taking into account of the requirements of area/basins.
Against high per capita water availability of 18061 cu.m. in Brahmaputra
basin, there are river basins with per capita water availability as low as
360 cu.m. in Sabarmati basin and 72.8 cu.m. in Cauvery basin. Thus
water can be transferred from one area to another by making canals.
2.2.3 Tap more groundwater: The demand from ground water is mainly for
irrigation, domestic, municipal use, industries and power only. According to
the estimates made by the National Commission for Integrated Water
Resources Development Plan (NCIWRDP), the total requirements from
groundwater are 252 billion cubic meters (bm3) (year 2010), 282 bm3 (year
2025) and 428 bm3 (year 2050). The estimated utilizable ground water
being 396 bm3, it will be seen that by the year 2050, there will be heavy
exploitation from the ground water.
No doubt overexploitation of ground water is a measure to meet the
demand of water, but it is only for short term basis. Ground water resources can
also exhaust if not properly managed in space and time. It is observed that due
to excessive exploitation the water table is reaching downward in many parts of
the country like Mahesana district Gujarat, Coimbator district in Tamil Nadu and
Kolar district in Karnataka.
The increased use of ground water give rise to several problems:

1. Aquifer depletion or overdraft when groundwater is withdrawn faster than
it is recharged by precipitation.
2. Subsidence or sinking of the ground as groundwater withdrawn.
3. Salt water intrusion and freshwater aquifers in coastal areas as
groundwater is withdrawn faster than it is recharged.
4. Groundwater contamination from human activities.
2.2.4 Tow freshwater icebergs from the Antarctic, to water short coastal
regions: Some scientists believe that it may be economically feasible to
use a fleet of tugboats to tow huge, flat, floating Antarctic icebergs to
Southern California, Australia, Saudi Arabia and other dry coastal places.
But a number of unanswered questions and problems exists. How much
would be the scheme cost? How can most of the iceberg be prevented
from melting on its long journey through warm waters? If the towing
project is successful, how would the freshwater from the slowly melting
icebergs be collected and transmitted to shore? Who owns the icebergs
in the Antarctic, and how could international conflicts over ownership be
resolved?
2.3 WATER SHED MANAGEMENT
Water Shed is a physical unit in which water from all over the area flows
under gravity to a common drainage channel or hydrologically watershed is an
area which has only one outlet for draining runoff/surface flows. Watershed is
most appropriate unit for efficient handling of rainwater under different land use
activities. Protect, Conserve and improve the land and water resources of the
basin for efficient biomass production is the main motto of watershed
management programme.
Many of the watersheds are under severe strain due to excessive
deforestation for commercial purposes, hydroelectric power generation and
activities such as mining; industrial and tourism, with unplanned urbanization.
Like a basic functional unit of ecology, a watershed includes both organisms and
abiotic environment each influencing the properties of the other as both are
necessary for the maintenance of life.

Integrated treatment of all lands on watershed basis was first adopted
and implemented by Damodar Valley Corporation in 1949.
Cause of degradation of catchment are;
1. The absence of vegetation produces runoff and. to considerable extent
making the soil susceptible to erosion.
2. Grazing causes loss of vegetation and thus enhancing soil erosion.
3. Destruction of habitat area by local people due to over population and
over industrialization etc.
4. Winds also cause soil erosion in the naked hills.
5. Intense evaporation from the naked mountains causes dryness of the
watersheds.
6. Steepness of slope causes more erosion and intense runoff
7. Mining in the area causing overburden.
8. Hydroelectric project for irrigation also affect the watershed ecosystem.
Management
Agroforestry
This system of land management is applicable both to degraded farms,
forests and grazing lands. Agroforestry is a collective name for all land use
system and practice in which woody perennials are deliberately grown on some
land management unit as crops and or animals. It is helpful in soil conservation,
moisture retention and manage of watersheds.
In high rainfall areas of Dehradun on marginal soils, incorporation of trees
(Eucalyptus and Leucaena) and grass (Chrysopogon fulvus) along with crops
such as maize or wheat reduced runoff and soil loss substantially. The other
species used for forestation are: Dalbergia sissoo, Tectona grandis, Bombax
sp., Acacia nilotica for Yamuna watershed areas.
Maintenance of tree cover
Trees should be planted and should not be cut down near the watershed
areas so as to prevent soil erosion as we know root act as soil binder.

Mechanical measures
These measures includes bunds, graded terraces and bench terraces on
steep slopes which are adopted to supplement practices such as minimum
tillage and contour cultivation. In a watershed at Dehradun, 62% reduction in
runoff and 40% in peak rate was recorded as a result of bunding. Similar results
are available from Chandigarh (Siwaliks) where bunding of agricultural lands
reduced runoff, peak discharge and soil loss.
Proper Mining
Working of mines not only creates problem for the mines but also results
in poor water quality, destruction of vegetation cover, piling of waste material
and deposition of mineral dust on vegetation. The indirect effects include
reduced water infiltration and storage, enhanced erosion and production of acid
mine draining water which affects water quality both above and below the
ground.
Limestone quarrying at Dehradun and Mussorie by open coast method
resulted in ore-overburden. Stability of hills slopes due to excavation is
disturbed. The following steps are suggested for causing less destruction: i)
contour trenching at an interval of 1 m on overburden dump, ii) Planting cuttings
of Vitex negundo, Ipomoea camea at 15 cm interval, and iii) Draining of "Nala"
and water courses in the mined area.
Watershed Management in Himalayan Region
The Himalaya is characterized by subsurface flow system and has most
of Indian watersheds. Slope instability is the main cause where degree of hazard
is accelerated through deforestation, overgrazing and other human activities.
The following catchments based operations through treatment of sloping land
and water courses in stages proved beneficial.
i) Protecting watershed against biotic damage through closure.
ii) Culting down water courses through construction of retaining walls.
iii) Slope broken into contour wattling with species that could be vegetatively
propagated.
iv) Steeper slopes broken by retaining walls in sliding faces where moisture
is critical, straw mulching tied with thin wires, ropes helps in establishing
vegetation.
By proper managing our watersheds we can control floods, erosion and
silting problem to some extent and save the loss of precious water and soil.
2.4 DESALINIZATION
The partial or complete removal of the dissolved solids in sea or saline water to make it suitable for domestic Agricultural or industrial purposes is known as desalinization. Brackish (salty) waters are those water having total dissolved solid content ranging "in 3,000 ppm to 20,000 ppm. Water having total dissolved solids from, 20,000 to 50,000 ppm are classified as seawater. About 70 elements have been detected in seawater, some of them in very small amounts. The sodium, magnesium, calcium and potassium and their combining ions are present in high amounts as compared to others. Presently about 12 million m3 of freshwater is produced throughout the world daily by desalinization process.
Nature itself is the largest desalination plant as hydrological cycle on earth. The sun energy evaporates the waters from the oceans and the surface waters and reproduce/condense again on the earth's surface, as desalted water. This water is vital liquid for all creatures on the earth. The main processes used for desalinization are solar distillation, freezing, reverse osmosis and electrodialysis.
Distillation
Salt water when turns into vapor, become sweet and the vapors does not
form salt water again when it condenses wrote by Aristotle and is a true fact.
Sailors have used simple evaporation apparatus to make drinking water.
Desalinisation by solar energy is feasible or suitable in areas having abundant
solar energy and saline water and where water requirements are very small and
no other source of energy is available, that is mainly in arid and semiarid regions
of the country. Solar still distills saline water.
Freezing

The freezing of salt solution causes crystals of pure water to nucleate and
grow, leaving a brine concentrate behind. One commonly proposed freezing
method is the use of liquid refrigerants other than water. Butane is evaporated in
direct contact with sea water, resulting in the formation of ice crystals. Huge ice
masses were carried out by the ships and converted into fresh water. Freezing
process has basic advantages e.g. much lower latent heat of phase
transmission is required in the solid state than that required in evaporation state.
No scale formation from the usual impurities (as in distillation) and less corrosion
of steel at freezing point. However, the main disadvantage of the freezing
method is that water is required for washing of ice crystals and ice formation
takes more time than formation of water.
Reverse Osmosis
When salt water and fresh water are separated by a semipermeable
membrane, osmotic pressure causes the freshwater to flow through the
membrane to dilute the saline water until osmotic equilibrium is reached. If we
reverse the above phenomenon i.e. if a greater pressure is applied to the salt
water side of the membrane, then relatively pure water will pass out of salt
water. This is known as reverse osmosis. The membranes may be made of
plastic or of cellulose with extremely fine pores. For commercial use three types
of Composite membranes are best developed. Cellulose triacetate films
deposited on a polysulfane support and polyamide film on a polysulfane support.
The polyamide film membranes provide the best desalination performance. The
ideal reverse osmosis membrane would reject all salts contained in the salt
water and have a rejection ability of 95 to 97% (maximum 99.5%). Suspended
solids from the intake water, organisms, organics compounds, iron an dissolved
scaling elements in brackish water affect the membranes, causing scaling or
fouling thus degrading water permeability through the membrane with due
course of time. The largest sea water reverse osmosis plant is located at Char-
Lapsi, Malta with capacity of 20,000m3 /d.
Electrodialysis
An electric current is passed through- brackish or low salinity water in a
chamber in which many closely spaced ion-selective membranes are placed,

thus dividing the chamber into compartments. The electric current causes the
salts to be concentrated in alternate compartments, with reduced salt content in
the remainder. Membrane of synthetic resins have been developed some of
which are highly selective to the passage of positive ions and others which are
highly selective to the passage of negative ions. Since alternate membranes are
used the water streams lose sodium ions through the membrane on the one
side, and chloride ions on the other side. A principal disadvantage of
electrodialysis is that power consumption in proportional to salt concentration.
The main problem with all desalinization method is that they require large
amounts of energy and therefore are expensive. The main use of water is in
irrigation and thus it is not cheap to use desalted water in irrigation. Money and
energy are additionally required to pump salt water to and fro from desalinization
plants. Building and operating vast network of desalinization plants adds more
costs further and need trained man power. Mountains of salts produced from
plants has a problem of disposal, if these salts were again dumped into oceans,
they would increase the salt concentration near the coasts and affect sea
organisms. Desalinization, however, can provide fresh water in selected coastal
cities in arid regions like Saudi Arabia where the cost of obtaining fresh water by
any other method is high.
2.5 RAIN WATER HARVESTING
Rain water harvesting means capturing rainwater where it falls or
capturing the runoff in your own village or town and taking measures to keep
that water clean by not allowing polluting activities to take place in the
catchments. Water harvesting is proving to be a technology, fit for arid regions,
poor Nations, rich and prosperous ones as well. Prevailing of draught in many
parts of the country and continuously increasing demand for water made us to
think to utilize the rain.
Precipitation is, in general, the sole and thus the most important source
the replenishment of the water resources in India. Generally, the conservation
harvesting of water refers to collection and storage of rain water and other allied
activities aimed at prevention of losses through evaporation and seepage.

The annual average rainfall for India is 1200 mm. But only very few
places get rainfall throughout the year. In most of the places the duration of
rainfall is spread over only for few months i.e. June Sept. to October , December
in a year. Generally the rain water will flow rapidly and reaches to sea via rivers.
Ironically even Cherrapunji which receives about 11000 mm of rainwater
annually, suffers from acute shortage of drinking Water. The main factor in these
areas is the non-conservation of rain water that allowed it to drain away.
Broadly rain water can be harvested by two means
i) Rain water can be stored in containers/tanks above or below ground for
ready use.
ii) Rain water can be charged into soil for later utilization (ground water
recharge).
General principles for rain water harvesting
Rain water harvesting methods are site specific. Before a system is
installed one must know:
1. The soil characteristics (water holding capacity, runoff and eradability).
2. The topography (slope and the direction followed by natural runoff),
3. The precipitation characteristics (amount, reliability etc.)
4. The climate (wind, sunlight and temperature etc.)
Rain water harvesting techniques
Water harvesting techniques have two components:
a) Runoff areas: where the water is harvested from roofs of residential and
commercial buildings, packing lots industrial areas, green houses and other
surfaces as well as from intermittent water courses.
b) Run on areas: where the water is stored until needed which may be in
the form of small tanks of steel, concrete, fibre glass, earthen ponds or ground
water recharge.
2.5.1 Types of rain water harvesting

Rain water harvestings are of two types
1. Traditional rain water harvesting
2. Modern rainwater harvesting.
2.5.1.1 Traditional rain water harvesting
Since long the rain water harvesting has been the part of Indian
traditional and over centuries India have developed a range of techniques to
harvest rain water for eg.
i) In hilly and high rain fall areas, general practice of rainwater harvesting is
roof top collection and storage by construction dugs cum embankment
type of water storage structure on the foot hills to arrest flow from the
spring and streams.
ii) In Rajasthan, traditional water harvesting systems are tankas
(underground tanks) and Khadins (embankment in plain areas),
iii) Farmers in some areas stored rain water agricultural fields.
iv) In Eastern Himalayas and North Eastern hill ranges, simple bamboo
pipelines were built to carry water from, natural spring.
v) Ponds (Talab), Bawaries, Hauz, Oranies, Zohads are different name in
different states of water collecting devices.
2.5.1.2 Modern methods of rain water harvesting
Rain water harvesting by percolation tanks and infection wells
In areas of declining trend of ground water, the artificial recharge of
ground water is of greatest in water harvesting. Construction of percolation
tanks is a technique useful for arid and semi-arid regions in hard rock areas.
Percolation tanks or ponds are sallow depth tanks farmed at appropriate place's
in natural or diverted water courses, provided with a weir to allow the excess
water to continue its course.
Harvesting by check dams
Check dams of varying designs are constructed for the purpose of
stabilizing the grade and harvesting runoff water from large catchments, even

under arid conditions. Check dams are made of locally available materials like
brush, poles, woven wire, loose rocks, plants or slabs etc. Water harvesting
through check dams helps in ground water recharging more than water shed
development or well recharging.
Recharge tube wells
Recharging of tube wells have to be provided in percolation pond tanks
fed to hasten the percolation effect where the water table is very deep. The
purpose of tube well is to directly feed the deep aquifer with less evaporation
losses, besides protecting the water quality.
Ground water dams
Ground water dams are structure that intercept or obstruct the natural
flow of ground water and store water underground. The basic principles of the
ground water dams is that instead of storing the water in surface reservoir, water
is stored underground. The main advantages of water storage in ground water
dams is: i) evaporation losses are much less for water stored under ground; ii)
Risk of contamination of the stored water from the surface is reduced because
parasites can not breed in underground water.
Roof top rain water harvesting
In this system, rain water is collected on the roof of the building and
diverted to surface tank/pit through delivery system. The overflow of rain water
in surface tank/ pit can be diverted to abandoned dug well or bore well to
recharge underground aquifer system. The major advantage of the system is:
• Low cost of construction
• No operating cost and very little maintenance is required.
• By implementing this technique, a large portion of which generally goes
waste can be used for recharging well so that the steep decline in water
levels can be arrested by localized efforts of the communities.
Benefits of rain water harvesting
• The ground water level is increased.

• Recharging of well.
• Reduction in crack formation in walls and structures.
• Dilution of the salt content of water in the wells i.e. improvement in the
ground water quality.
• Improvement in moisture content in the soil.
• Aids the growth of plants and trees.
• Sea water intrusion into the land is arrested.
• Reduction in the soil erosion.
• Improvement in the groundwater quality.
2.6 CLOUD SEEDING
All air contains moisture. When warm air rises from the earth's surface
and begin to cool, some of the moisture condenses into tiny droplets that cause
clouds. More than 99% of a cloud is air. The tiny droplets combine with millions
of others to from raindrops or hailstones which are heavy enough to fall to
ground. For precipitation to form temperature inside the cloud have to be less
than the freezing point of water. When droplets of this super cooled water
encounter to dust, salt or sand they form small ice crystals. Water vapor in the
cloud then freezes directly into the surface of these crystals and they gain
weight and fall. Natural rainfall works in the same way. Cloud seeding involves
the addition of chemicals into clouds which enhance the formation of ice crystals
that are deficient in ice crystal nuclei. Silver iodide is generally used for cloud
seeding. This condensation and freezing releases a large amount of heat that
makes clouds more buoyant and may double their size and height. A clouds
grow taller, their updraft increases, they draw in more moist air from near the
surface, and their ability to process water efficiently increases.
The ability of a cloud to produce rain depends on the flow of air into the
clouds and the liquid water content. Planes take off and fly into and above the
clouds and release plumes of microscopic silver iodide particles using flares.
When the particles meet cool moisture in the clouds, they trigger the formation
of ice crystals and raindrops. The amount of silver iodide that is released is

small enough that it does not pose a pollution risk. Cloud seeding gave good
result in Texas where it was first performed in 1971.
2.7 SUMMARY
Watershed management and rain water harvesting are most perfect
technology for efficient handling of rain water. The main motto of watershed
management and rain water harvesting is to protect conserve and improve the
land and water resources of the basin for efficient biomass production.
2.8 KEY WORDS
Cloud Seedings: Cloud seeding involves the addition of chemicals into clouds
which enhance the formation of ice crystals that are deficient in ice crystal
nuclei, Silver iodides is generally used for cloud seeding.
Watershed: The land surface and groundwater aquifers drained by particular
river system.
Runoff: The excess of precipitation over evaporation, the main source of
surface water and broad terms, the water available for human use.
Desalinization: Removal of salt from water by distillation, freezing, or
ultrafiltration.
Rechargezone: Area where water infiltrates into an aquifers.
2.9 SELF ASSESSMENT QUESTIONS:
1. Discuss the problem arises due to excessive use of ground water.
2. What is water shed management? Enumerate the various techniques of
water shed management.
3. Define Desalinization. List various methods for desalinization of saline
water.
4. Define rain water harvesting. Enumerate various methods for rain water
harvesting.
5. Write short note on following:
(i) Reverse osmosis
(ii) Distillation

(iii) Cloud seeding
2.10 SUGGESTED READING
1. Birdie, G.S. and Birdie, J.S. (2006). Water Supply and Sanitary
Engineering. Dhanpat Rai Publishing Company, New Delhi.
2. Chatterjee, A.K. (2001). Water Supply, Water Disposal amnd
Environmental Engineering. Khanna Publisher, New Delhi.
3. Cunningham, W.P. and Cunningham, M.A. (2003). Principles of
Environmental Science. Tata McGraw Hill Edition, New Delhi.
4. Figuerer, C.M. (2005). Rethinking Water Management: Innovative
Approaches to Contemporary Issues. Earthscan, New York.
5. Kanchan, C. (2003). Water Resources, Sustainable, Livehood and
Ecosystem Services. Concept Publications, New Delhi.
6. Krishnamoorthy, B. (2005). Environmental Management. Prentice Hall of
India, New Delhi.
7. Miller, J.T. (2004). Environmental Science. 5th Edition. Thomas Press,
Australia.
8. Mohammad, K. (2003). Water Resources System and Analysis, Lewis
Publication, New York.
9. Rana, S.V.S. (2006). Environmental Pollution: Health and Toxicology.
Narosa, New Delhi.
10. Rubin, H. (2002). Water Resources and Quality, Springer, New York.
11. Singh, J.S., Singh, S.P. and Gupta, S.R. (2006). Ecology, Environment
and Resource Conservation. Anamaya Publication, New Delhi.
12. Vasudevan, N. (2006). Essentials of Environmental Science. Narosa,
New Delhi.

UNIT II PGDEM-02
MINERAL: USES, RESERVES AND THEIR CONSUMPTION PATTERNS
R. Baskar
Structure
1.0 Objectives
1.1 Introduction
1.2 Definition
1.3 Properties of minerals
1.4 Minerals and their uses
1.5 Common rock forming minerals
1.6 Resources and reserves
1.7 Availability and use of mineral resources
1.8 Types of mineral resources
1.9 Patterns of mineral consumption
1.10 Summary
1.11 Key words
1.12 Self assessment questions (SAQ s)
1.13 Further reading/ Suggested Reading
1.0 OBJECTIVES
After learning this unit, the student will be able:
• To understand the importance of minerals in modern society.
• To know the difference between a resource and a reserve
• To appreciate the consumption patterns of some minerals
1

1.1 INTRODUCTION
With the rapid increase in world population, a resource crisis is real possibility, and there is
fear that the earth may have reached its capacity to absorb environment degradation related to
mineral extraction, processing, and use. Minerals have become a critical part of our modern
life. Commonly, they are used in the construction of our buildings, roads, agriculture, in
making machines, for the production of energy, in medicines etc. Rocks are aggregates of one
or more minerals. The rocks, which form the Earth, the Moon and the planets, are made up of
minerals. Rocks can be formed from a combination of several different minerals or a single
mineral can make up the bulk of a rock, i.e, limestone or marble is mainly composed of the
mineral calcite. Minerals are chemical elements or compounds which occur naturally within
the crust of the Earth. They are the discrete crystalline particles of which nearly all rocks are
made. Minerals are solid substances made up of atoms with an orderly and regular
arrangement, which is the basis of their crystalline state. Because of their orderly atomic
arrangement it is also possible to express the composition of a mineral as a chemical formula.
Minerals are inorganic substances composed of elements like silica, oxygen, aluminium, iron,
etc. Minerals can also occur as aggregates of crystals that rarely show perfect crystal shapes.
This can be useful for identification, i.e. whether they are fibrous, dendritic, lamellar or
foliated, etc. Minerals provide the elements essential to life, the metals of industry and the
materials for building. Mineralogists are geologists who study minerals.
1.2 DEFINITIONS:
Mineral: They are naturally occurring, inorganic solids with an ordered atomic arrangement
and a chemical composition which is fixed or which varies only within well-defined limits.
2

Ore: It is a mineral or aggregate of minerals that is economically minable.
1.3 PROPERTIES OF MINERALS
• They occur naturally.
• They are inorganic solids.
• Atoms are arranged in a definite geometric pattern, which is reflected in the crystal
form and cleavage of the mineral.
• Their chemical composition is fixed or varies within well-defined limits.
• Variations in Composition and Crystalline Structure - Most minerals contain
impurities and several also display ionic substitution. There are other minerals,
which have identical chemical compositions, but different crystalline structures
due to the conditions under which they crystallized.
• Most minerals have non-structural ions trapped or included in the atomic structure
during growth of the structure as impurities.
• Polymorphs are minerals, which have the identical chemical composition, but
different internal structure. For example carbon polymorphs, diamond and
graphite, which are both, composed of pure carbon but have substantial differences
in their atomic packing and bonding.
• Crystal Form - the shape of a mineral when bounded by smooth, planar surfaces
which form regular geometric patterns.
• Hardness - measure of the mineral's ability to resist abrasion - Hardness reflects
the strength of the bond between atoms within the crystal structure.
• Cleavage – It is the tendency of minerals to break along parallel planes of
weaknesses (cleavage planes) within the crystal forming parallel planar surfaces
along broken fragments.
3

• Color – It is useful for some minerals (olivine is always green), but commonly too
variable for most (quartz can be almost any color).
• Luster – It is the appearance of the mineral in reflected light. Luster is described as
metallic or non-metallic. Sub metallic is further described as vitreous (glassy) or
non-vitreous.
• Streak – This is the colour of the mineral when it is powdered.
• Other Properties - magnetism (magnetite), taste (halite), and fluorescence (some
fluorites).
1.4 MINERALS AND THEIR USES
Modern society depends on the availability of mineral resources. Minerals are so important to
people that, of being equal, one's standard of living increase with increased availability of
minerals in useful forms. Minerals can be considered our non-renewable heritage from the
geologic past. Although new deposits are forming from present earth processes, these
processes are too slow to be of use to us today. Mineral deposits tend to occupy a small area
and to be hidden. Deposits must therefore be discovered, and unfortunately, most of the easy-
to-find deposits have already been exploited. If civilization were' to vanish, our descendants
would have a much harder time discovering minerals for technological advance than our
ancestors and we did. Unlike biological resources, minerals cannot be managed to produce a
sustained yield. Recycling and conservation will help, but eventually the supply will be
exhausted.
Humans in almost every facet of daily living have always used minerals. Ancient man used
rocks to make weapons and other useful tools in the Stone Age. Then, people discovered the
4

methods of isolating metals from their mineral ores, through the Copper, Bronze, Iron, Steel
and Atomic Ages. At every step, minerals assumed progressively greater importance.
Uses of Some Common Metallic Minerals
METAL ORE CHEMICAL FORMULA USES Aluminum, Al Bauxite Al2O3.2H2O Cooking utensils, beverage
and food cans, aluminium foil, furniture, buildings, electrical appliances, transport equipment.
Chromium, Cr Chromite FeCr2O4 Plating household appliances, vehicles, to strengthen steels and cast iron.
Copper, Cu Native Copper Chalcopyrite Chalcocite
Bornite
Cu
CuFeS2
Cu2S
Electrical appliances, telephone cables, electrical systems, motors, ornamental items made of brass and bronze, plumbing pipes.
Gold, Au Gold Au Currency, jewellery. Iron, Fe
and steel
Hematite Magnetite Limonite
Siderite
Fe2O3
Fe3O4
2Fe2O3.3H2O
FeCO3
Domestic appliances, motor vehicles, buildings, bridges, tools, machinery, transport equipment, building materials.
Lead, Pb Galena
Cerussite
PbS
PbCO3
Batteries, factory machinery, transport equipment, building materials.
Nickel, Ni Pentlandite
Garnierite
(Ni,Mg)SiO3.nH2O Stainless steel, motor vehicles plating, aircraft, transport equipment, household appliances, electrical machinery.
Silver, Ag Native Silver Argentite Ag
AgS
Photographic film and developing paper.
Tin, Sn Cassiterite SnO2 Tin plate, solder, in electrical equipment.
Titanium, Ti Ilmenite
Rutile
FeTiO3
TiO2
Ti metal for engines, Ti pigment for plastics, welding electrodes
5

Uranium, U Pitchblende or Uraninite,
Yellow-cake
UO3
U3O8
Power generation, radioisotopes for research.
Zinc, Zn Sphalerite
Smithsonite
ZnS
ZnCO3
Roofs, fences, car bodies, motor vehicle grills, household appliances, door handles, zinc oxides for tyres and paints, dry-cell batteries.
Uses of Some Non-Metallic Minerals
Name Uses
Asbestos Fireproof fabrics, brake linings Barite Oil-well drilling muds, glass, paint Borates Flux, glass, detergents and chemicals
Clays Bricks, pottery, fillers for paint, rubber
Diamond Drills, abrasives, precious gemstone
Feldspar Flux for glass manufacture, abrasives, toothpaste
Fluorite Glass, enamel Garnet Abrasives, semi-precious gems.
Graphite Pencils, batteries, crucibles, lubricants
Gypsum Wallboard, plaster, soil improvement
Halite Food, Chlorine for water treatment
Magnesia Cements, refractory brick
Mica Electronics, electrical insulation
Olivine Refractories, semi-precious gems Quartz Broadcast frequency control, silica glass
Sulphur Fertiliser, sulphuric acid, paper making, bleaches
Talc Toiletries, ceramics, paint, paper
Vermiculite Sound insulation in plaster and loose fill, plastics
1.5 COMMON ROCK-FORMING MINERALS
6

There are more than 3,500 known minerals, however, only a small number of these are
abundant. Minerals are grouped according to the anion or anion complex that they contain.
Example - silicates (SiO4)-4, carbonates (CO3)-2, sulfides (S), oxides (O-2), and halides (Cl-1 or
F-2). The minerals in each group often display similar properties and are commonly found
together due to their similar chemical composition.
Silicates – They are minerals whose crystalline structure contains the SiO4 tetrahedra. The
silica tetrahedra is the basic building block of all silicate minerals. Silica and oxygen make up
about 74% of the earth's crust. Silica (+4) bonds with four oxygen (-2) such that there is a
residual -4 charge. Other cations (like Ca, Na, Mg, and Fe) either link the tetrahedra together
or are incorporated in the tetrahedral structure, determining the mineral form.
Ferromagnesian Silicates – They are silicates with iron and/or magnesium in their structure.
Most ferromagnesium minerals are dark-colored and denser than the non-ferromagnesian
silicates.
Olivine – They are single tetrahedra silicates which show a continuous range in ionic
substitution. It is a major component of the mantle that is common in Fe- and Mg-rich igneous
rocks. Olivine is a high temperature mineral that lacks cleavage and has a greenish colored,
glassy luster, and conchoidal fracture.
Pyroxenes – They are solid solution series with 3 major end members: MgSiO3-FeSiO3 -
CaSiO3 and are single chain silicates. Pyroxenes are dark-colored, high- temperature minerals
with two well-developed cleavage planes at about 90o to each other.
Amphiboles – They are complex double-chain silicates which include several different solid
solution series. Amphiboles are dark-colored minerals that have two well-developed cleavage
planes at 56o and 124o to each other.
7

Garnet – They are a series of single tetrahedra silicates which characteristically occur in
well-formed near-spherical, twelve-sided crystals - Garnets show extensive variation in color.
They are very hard (7-7.5), lack cleavage, translucent to transparent and have a vitreous
luster.
Biotite – It is an iron-rich member of the micas (sheet silicates). Biotite is a dark-colored
mineral with a vitreous luster.
Non-ferromagnesian Silicates – As the name indicates they are silicate minerals without
substantial Fe and Mg in their crystalline structure. These are generally lighter-colored than
the ferromagnesian silicates.
Plagioclase Feldspars – They are solid solution series between anorthite (CaAl2Si2O8) and
albite (NaAlSi3O8). These are light-colored, framework silicates which have two directions of
cleavage at about 90o. The Na-rich albite is generally white, whereas the Ca-rich varieties are
often blue-gray. All plagioclases are characterized by fine, parallel lines along the cleavage
planes (striations).
Potassium Feldspars – They are solid solution series between albite (NaAlSi3O8) and
orthoclase (KAlSi3O8). The K-feldspars are also 3-dimensional framework silicates which
display 2 directions of cleavage at about 90o. The pink color of orthoclase is diagnostic.
Quartz – It is a three-dimensional silicate (SiO2) of almost pure silica and oxygen - It is one
of the most common minerals in the earth's crust. There is no residual charge in the silica
tetrahedra because all of the oxygen are shared by two silica atoms. This results in a very
resistant mineral which often survives after all the other components a the rock break down
forming river and beach sand. Quartz displays conchoidal fracture, hardness of 7, and a glassy
luster. Color is highly variable.
8

Muscovite – It is a white mica (sheet silicate) with the same characteristics as biotite, but with
a white to silver color and transparent to translucent nature.
Carbonates – They are minerals which contain the carbonate (CO3)-2 anion complex.
Calcite - CaCO3 - calcium carbonate which occurs as thick masses of limestone, chalk and
marble . It is relatively soft (3), has perfect rhombohedral cleavage (75o), and reacts with HCl.
Calcite is commonly precipitated from concentrated solutions or extracted from sea water by
marine organisms.
Sulfides - minerals which contain the sulfur anion (S).
1. Galena - PbS - lead sulfide which has a metallic luster, perfect cubic cleavage, and a high
specific gravity (7.5).
2. Pyrite - Fe2S - iron sulfide which is a yellow, metallic mineral which has a hardness of 6-
6.5 and lacks cleavage. It has a greenish-black streak.
Oxides - minerals which contain oxygen anions (O).
1.Hematite - Fe2O3 - iron oxide which is commonly dark red to steel blue-black - It gives a
deep red streak, lacks cleavage and has a moderately high specific gravity (5-6.5).
2. Limonite - Fe2O3.H2O - a yellowish-brown, hydrous iron oxide which usually forms by the
weathering of iron minerals - It is characterized by a yellow streak, absence of cleavage and a
dull rusted metallic texture.
Halides - minerals which contain Cl, F or any of the other halogen elements as anions.
1. Halite - NaCl - sodium chloride characterized by cubic cleavage, clear or transparent
nature, salty taste, and a resinous luster and forms by the precipitation from sea water.
9

2. Fluorite - CaF2 - calcium fluoride which has good cleavage in four directions, variable
color, hardness of 4 and a specific gravity of 3.
F. Others - Native elements ((Au, Ag, Cu, C), sulfates (CaSO4) anhydrite and CaSO4.2H2O
gypsum), and clay minerals (kaolinite)
1.6 RESOURCES AND RESERVES
Mineral resources can be defined broadly as elements, compounds, minerals, or rocks that are
concentrated in a form that can be extracted to obtain a usable commodity. This definition is
unsatisfactory from a practical viewpoint, however, because a resource will not normally be
extracted unless extraction can be accomplished at a profit. A more pragmatic definition is
that a resource is a concentration of a naturally occurring material (solid, liquid, or gas) in or
on the crust of the earth in such a form that economical extraction is currently potentially
feasible. A reserve is that portion of a resource that is identified and currently available, that
is, from which usable materials can be legally and economically extracted at the time of
evaluation. The distinction between resources and reserves, therefore, is based on current
geologic, economic, and legal factors. Resources include,
• Materials that are identified and legally and economically available (reserves)
• Materials that are identified but legally or economically unavailable (sub economic
resources)
• Undiscovered materials (hypothetical or speculative resources).
The main point about resources and reserves is that all resource categories are not reserves. It
is important for planning to estimate future resources. A simple periodical listing of the total
amount of material available or likely to become available is misleading when used for
planning purposes; what is required is a continual reassessment of all components of a total
resource by considering new technology, the probability of geologic discovery, and shifts in
10

economic and political conditions. Data for an identified resource such as gold or building
materials can be classified as follows:
• Measure-identified resources are those that are well known and measured and for
which the total tonnage or grade is well established.
• Indicated identified resources are not so well known and measured and therefore
cannot be outlined completely by tonnage or grade. Total tonnage or grade can be
estimated, but not as well as for measured identified resources.
• Inferred identified resources have quantitative estimates based on broad geologic
knowledge of the deposit. Total tonnage or grade can only be crudely estimated.
The category into which a particular identified resource fits is a function of available geologic
information. Obtaining this information involves testing, drilling, and mapping, all of which
become more expensive with greater depth. The example of silver will illustrate some
important points about resources and reserves. The earth's crust (to a depth of 1 km) contains
almost 2 million metric tons of silver- this is the earth's crustal resource of silver - an amount
much larger than the annual world use, which is approximately 10,000 metric tons. If this
silver existed as pure metal concentrated into large mine, it would represent a supply
sufficient for several hundred million years at current levels of use. Most of this silver,
however, exists in extremely low concentrations - too low to be-extracted economically with
current technology. The known reserve of silver, reflecting the amount we would obtain
immediately with known techniques, is about 200,000 metric tons, or a 20-year supply at
current use levels. The problem with silver, as with all mineral resources, is not abundance
but with its concentration and relative ease of extraction. Atom of silver is used, it is not
destroyed, but it is dispersed and may be unavailable. In theory all mineral resources would be
recycled, given enough energy, but this is not possible in practise. Consider lead, which is
11

mined and was for many years used in gasoline. This lead is now scattered along highways
across the world and deposited in low concentration in forests, fields, and salt marshes close
to these highways. Recovery of this lead is for all practical purposes impossible.
1.7 AVAILABILITY AND USE OF MINERAL RESOURCES
The availability of a mineral in a certain form, in a certain concentration, and in a certain total
amount at that concentration is determined by the earth's history. What a mineral resource is
and when it becomes limited are the associated technological and social questions.
1.8 TYPES OF MINERAL RESOURCES
Some mineral are necessary for life. An example is salt (sodium chloride). The primitive
people traveled long distances to obtain salt when it was not locally available. Other mineral
resources are desired for their beauty, and many more are necessary for maintaining a certain
level of technology. The earth's mineral resources can be divided into several broad categories
based on our use
• Elements for metal production and technology, which can be classified according to
their abundance. The abundant metals include iron, aluminium, chromium,
manganese, titanium, and magnesium. Scarce metals include copper, lead, zinc, tin,
gold, silver platinum; uranium, mercury, and molybdenum.
• Building materials such as aggregate for concrete, clay for tile, and volcanic ash far
cinder block.
12

• Minerals for the chemical industry - for example, the many minerals used in the
production of petrochemicals
• Minerals for agriculture - for example, fertilizers
When we think of mineral resources, we usually think of the metals used in structural
materials, but in fact (with the exception of iron) the predominant mineral resources are not of
this type.
1.9 PATTERNS OF MINERAL CONSUMPTION
Consider the annual world consumption of a few selected elements. Sodium and iron are used
at a rate of approximately 0.1 billion to 1 billion tons per year. Nitrogen, sulfur, potassium,
and calcium are used at a rate of approximately 10 million to 100 million tons per year. These
four elements are used primarily as soil conditioners as fertilizers. Zinc, copper, aluminum,
and lead have annual world consumption rates of about 3 million to 10 million tons, whereas
gold and silver have annual consumption rates of 10,000 tons or less. Of the metallic
minerals, iron makes up 95 percent of all the metals consumed and nickel, chromium, cobalt,
and manganese are used mainly in alloys of iron (as in stainless steel). Therefore, we can
conclude that the nonmetal minerals, with the exception of iron, are consumed at much
greater rates than elements used for their metallic properties.
As both the world population and the desire for a higher standard of living increase, the
demand for mineral resources expands at a faster rate. Ironically, the more developed
countries in the world, though only with 16 percent of the earth's population, consume a
highly disproportionate share of mineral resources. For example, 70 percent of the aluminum,
copper, and nickel extracted is used by the United States, Japan, and Western Europe. About
10,000 kg. (10 metric tons) of new mineral material (excluding energy resources) are required
each year for each person in the United States. As less-developed countries become more
13

affluent and use more resources than world per capita mineral consumption is expected to
increase. If the world per capita consumption rate of iron, copper, and consumption rate of
iron, copper, and lead were to rise to the U.S. level, production of these metals would have to
increase to several times the present rate. As such an increase in production is very unlikely,
affluent countries will have to find substitutes for some minerals or use a smaller proportion
of the world annual production. With the exception of construction materials (crushed stone,
sand, and gravel), this seems to be happening in the United States, where per capita
consumption of aluminum, copper and lead has decreased about 12 percent from the mid-
1970s to the late 1990s.
Domestic supplies of many mineral resources in the United States and other affluent nations
are insufficient for current use and must be supplemented by imports from other nations. The
deficiency of U.S. reserves for selected non-fuel minerals and major foreign sources for the
needed minerals. Of particular concern to industrial countries is the possibility that the supply
of a much desired or needed mineral may become interrupted by political, economic, or
military instability of the supplying nation. Today the United States, along with many other
nations, depends on a steady supply of imports to meet the mineral demand of industries. Of
course, the fact that a mineral is imported into a country does not mean that it does not exist in
quantities that could be mined within the country. Rather, it suggests that there are economic,
political, or environmental reasons that make it easier, more practical, or more desirable to
import the material.
1.10 SUMMARY
Minerals are naturally occurring inorganic solids and they have a number of uses in our day to
day living. The main rock forming mineral groups (silicates) are olivine, pyroxene,
amphiboles, mica, quartz and feldspar. Minerals resources are the materials that are identified
14

but legally or economically unavailable and materials that are identified, legally and
economically available are known as reserves.
1.11 KEY WORDS
Resources - Materials that are identified but legally or economically unavailable (sub
economic resources)
Reserves - Materials that are identified and legally and economically available (reserves)
Minerals - They are naturally occurring, inorganic solids with an ordered atomic
arrangement and a chemical composition, which is fixed, or which varies only within
well-defined limits.
1.12 SELF ASSESSMENT QUESTIONS (SAQ´s)
1. Define a mineral and discuss the properties of minerals.
2. List the number of minerals in your home and describe their uses.
3. Differentiate the terms reserves and resources.
1.1s3 FURTHER READING / SUGGESTED READING
Allison, I. S. & Palmer, D. F. 1980. Geology, the science of a changing Earth. VII Edition.
McGraw-Hill Inc.
Cox, K. G., Price, N. B. & Harte, B. 1974. An Introduction to the Practical Study of Crystals,
Minerals and Rocks. Rev. 1st ed., John Wiley & Sons Inc., New York.
Hamilton, W. R., Woolley, A. R. & Bishop, A. C. 1984. The Hamlyn Guide to Minerals,
Rocks and Fossils. The Hamlyn Publishing Group Ltd, London.
15

Lutgens, F.K and Tarbuck, E.J. 1998. Essentials of Geology. VI edition. Prentice Hall, Inc.
New Jersey.
Edward. A.Keller. 2000. Environmental Geology. VIII edition. Prentice Hall, Inc. New
Jersey.
16

UNIT II PGDEM-02
MINERALS: BIOLEACHING, RECYCLING AND OCEAN RESOURCES
R. Baskar
STRUCTURE
2.0 OBJECTIVES
2.1 INTRODUCTION
2.2 DEFINITION
2.3 ADVANTAGES AND DISADVANTAGES
2.4 FACTORS AFFECTING BIOLEACHING
2.5 MECHANISMS OF LEACHING
2.6 TYPES OF BIOLEACHING
2.6.1 TANK BIOLEACHING
2.6.2 HEAP BIOLEACHING
2.6.3 BIOLEACHING WITH FUNGI
2.7 COMPARISION OF BIOLEACHING TECHNOLOGIES TO OTHER PROCESSING TECHNOLOGIES 2.7.1 ROASTING (SMELTING) 2.7.2 PRESSURE OXIDATION
2.8 CASE STUDY
2.9 HARVESTING MINERALS FROM THE SEA
2.9.1 SULFIDE DEPOSITS
2.9.2 MANGANESE OXIDE NODULES
2.9.3 COBALT-ENRICHED MANGANESE CRUSTS
2.10 RECYCLING OF MINERAL RESOURCES: RESPONSES TO LIMITED
AVAILABILITY
1

2.10.1 RECYCLING SCRAP METAL
2.11 SUMMARY
2.12 Key words:
2.13 SELF ASSESSMENT QUESTIONS
2.14 SUGGESTED READING
2.0 OBJECTIVES
In this chapter the learning objectives include:
• Understanding bioleaching, its types and advantages and disadvantages
• Factors affecting microbial leaching
• Mechanisms of bioleaching and comparision of bioleaching to other processing
technologies
2.1 INTRODUCTION
Extraction of metals involving microorganisms is one of the latest approaches to obtain metals
from mineral resources, which are not accessible by conventional mining practices. Microbes
(such as bacteria and fungi) convert metal compounds into water-soluble products and are
biocatalysts of these leaching processes. For example, application of microbiological
solubilization processes is helpful to recover metals from industrial wastes that can serve as
secondary raw materials.
Bioleaching uses microorganisms to extract metals from ores in which they are embedded.
Bioleaching, an efficient and environmentally safe method is used when there are lower
concentrations of metal in the ore as an alternative to smelting or roasting. The microbes feed
on the nutrients in the ores, thereby separating the metal that leaves the microorganism´s
system; after which the metal can be collected in a solution. Microorganisms act as a catalyst
2

to speed up natural processes inside the ores. For example, bacteria convert metal sulphide
into sulfates and pure metals by oxidation. These constituent parts of ore are separated into
valuable metal and leftover sulphur and other acidic chemicals. Eventually, enough material
builds up in the waste solution to filter and concentrate it into metal.
Bioleaching of sulfide minerals is now an established industrial technology for the recovery of
gold from arsenical pyrite ores. Approximately 20% of the extracted copper in the world
currently comes from bioleaching processes. Bioleaching produces less air pollution and little
damage to geological formations, since the bacteria occur there naturally. An ideal metal
deposit must allow a certain amount of water into the rock to carry the bacteria. However, it
should be surrounded by rock that is impermeable to water to make sure no ground water gets
polluted.
2.2 DEFINITION
Bioleaching is the process of extraction of metals from ores or concentrates, using certain
naturally occurring microorganisms. Many bacterial species have been identified as having
bioleaching capabilities and those of commercial interest include species of Thiobacillus,
Leptospirillum, Sulfobacillus, and Sulfolobus. Thiobacillus ferrooxidans is the most
commercially useful species.
Commercial applications of bioleaching have been developed for the solution mining of
copper and uranium from low-grade ores and waste products. Uranium minerals are often
found associated with pyrite. Thiobacillus ferrooxidans is used to oxidize pyrite and release
the uranium. The ferric sulfate and sulfuric acid generated in this reaction then dissolve the
uranium.
2.3 ADVANTAGES AND DISADVANTAGES
3

The advantages associated with bioleaching are:
• Economical: bioleaching is generally simpler, cheaper to operate and maintain than
traditional processes.
• Eco-friendly: The process is more environmentally friendly than conventional
extraction methods. It results in less landscape damage, less SO2 emissions
The disadvantages associated with bioleaching are:
• The bacterial leaching process is very slow compared to smelting.
• Toxic chemicals are sometimes produced in the process, which can leak into the
ground and surface water turning it acidic, causing environmental damage.
2.4 FACTORS AFFECTING BIOLEACHING
1. Physicochemical parameters Temperature, pH, redox potential, water potential,
oxygen content and availability, carbon dioxide
content, nutrient availability, light, pressure,
surface tension
2. Microbiological parameters Microbial diversity, population density, microbial
activities, spatial distribution of microorganisms,
metal tolerance, adaptation abilities of
microorganisms
3. Processing leaching mode - (in situ, heap, dump, or tank
leaching) pulp density and stirring rate
4. Properties of the minerals to be leached Mineral type, mineral composition, mineral
dissemination, grain size, surface area, porosity,
4

hydrophobicity, galvanic interactions, formation
of secondary minerals
2.5 MECHANISMS OF LEACHING
The mineral dissolution effects of microbes (bacteria and fungi) is based on three methods:
acidolysis, complexolysis and redoxolysis. Microbes mobilize metals by the formation of
organic or inorganic acids, oxidation /reduction reactions and the excretion of complexing
agents. Sulfuric acid is the main inorganic acid found in leaching environments formed by
microorganism Thiobacilli. A series of organic acids are formed by microbial metabolism
resulting in organic acidolysis and chelates. Bacterial dissolution of sulfide minerals involves
two mechanisms: the direct and the indirect process.
Direct leaching –In direct leaching, the bacteria attach themselves to the metal
sulphide crystals within the rock. Through (a biochemical reaction) oxidation, the
bacteria change the metal sulphide into soluble sulfates, therby dissolving the metals.
Indirect leaching –In this case, the bacteria need not be in contact with the mineral
surface. Bacteria re-oxidize the ferrous iron back to the ferric form as well as
oxidizing the elemental suphur. The ferric iron then chemically oxidises the sulphide
minerals producing ferrous iron. The bacteria here only have a catalytic function
because they accelerate the re-oxidation of ferrous iron to ferric iron which takes place
very slowly in the absence of bacteria.
2.6 TYPES OF BIOLEACHING
There are presently two methods of bioleaching - tank bioleaching and heap bioleaching.
2.6.1 TANK BIOLEACHING
5

Bioleaching occurs rapidly, over 500,000 times faster as compared to the oxidation by natural
exposure to air and water in the absence of bacteria. Use of controlled conditions (such as
agitated, aerated tanks) results in rapid and highly effective oxidation of metal sulphides. For
example, an enhancement in gold recovery from 30% to 90% may be achieved with 3 to 5
days of bioleaching oxidation prior to cyanidation. The first step for bioleaching in tanks
involves feeding a continuous stream of slurried concentrate into primary reactors containing
a suspension of bacteria in a mildly acidic environment and most of the leaching occurs in
these primary reactors. As concentrate is added to the primary reactor partially oxidized
material flows into secondary stage reactors where the final oxidation occurs. The leached
material then flows from the secondary reactors into thickening tanks for solid / liquid
separation. Typically, separation of the solution and residue is carried out through a counter
current decantation circuit using thickeners. The solution is treated either for the recovery of
base metals or for disposal in an environmentally acceptable form. The residue is also treated,
either for the recovery of precious metals or for disposal as tailings. Bioleaching in tanks has
to date been used to treat high value concentrates. The cost of tank oxidation is influenced by
the following factors: The rate of reaction, the level of sulphide oxidation required for
acceptable metal recovery, the size and number of tanks and the aeration and agitation
requirements. The reagent usage for pH control and solution neutralization also affects the
operating costs. The salinity of site water and the requirement for acid resistant materials also
affects the capital costs.
2.6.2 HEAP BIOLEACHING
Heap bioleaching involves crushing ore, stacking it on plastic lined pads and spraying it with
a dilute sulphuric acid solution containing bacteria and nutrients. The solution drains through
the heap and is recovered and resprayed over the heap. Where the ore contains base metal
sulphides, the base metals are released into the solution and recovered by conventional
processes prior to the return of the solution to the heap. In case of gold-bearing ores, the
6

solution is recycled until sufficient sulphide has been oxidized to expose the gold. The ore is
washed with water to remove acid and metals, treated with lime to neutralize any remaining
acid and then sprayed with cyanide to recover the gold. If the ore contains sufficient gold,
better recoveries can be achieved by processing the oxidized ore through a conventional
milling and cyanidation circuit. As the ore in a heap leach configuration is quite coarse,
usually larger than 6.5 millimetres, the recovery is less than would be achieved in agitated and
aerated tanks. Bacterial heap leaching is, therefore, generally considered when the economics
cannot sustain the cost of making a concentrate or the mineralogy is such that the ore cannot
be concentrated.
2.6.3 BIOLEACHING WITH FUNGI
Several species of fungi can be used for bioleaching. They can be grown on electronic scrap
and fly ash from municipal waste incineration.
2.7 COMPARISION OF BIOLEACHING TECHNOLOGIES TO OTHER
PROCESSING TECHNOLOGIES
Crushing and/or grinding the ore and subjecting it to a hydrometallurgical treatment to
recover the metal of interest generally carry out-processing of precious and base metal oxide
ores. Gold ores are treated with cyanide to dissolve the gold which is recovered on activated
carbon, while base metal ores are leached with acid and the soluble metal is then recovered by
methods such as solvent extraction and electro winning. Due to the relative ease of
processing these materials, much of the world's metals have been produced from these ores.
As oxide resources are reduced, the remaining ores tend to be refractory in nature. Ores are
considered to be refractory when a significant portion contained metal cannot be recovered by
simple grinding and extraction and if the metal of interest is locked within other minerals or
elements such as sulphide, sulphur, or when elemental carbon is present which may interfere
7

with the extraction process. There are three principal pre-treatment processes for refractory
ores:
2.7.1 ROASTING (SMELTING)
Roasting involves heating to 600°C - 800°C and can be capital and operating cost intensive.
Roasting of ores and concentrates has conventionally been used to breakdown sulphide
minerals. In case arsenopyrite is present, a two-stage roaster is often required to drive off the
arsenic (as arsenic trioxide) and then oxidize the remaining sulphide. Gas scrubbers are
essential to contain sulphur dioxide and arsenic trioxide emissions, which are both of
environmental concern. Two-stage roasters and emission control devices greatly increase
capital costs. The only disposal alternative for recovered arsenic may be hazardous waste land
fills, because the purity standard of the arsenic and the existing global market surplus might
preclude sale. Land fill disposal increases operating costs and may result in perpetual liability
for the then current landowner. Roasting of arsenopyrite ores and concentrates also raises
health and safety issues that must be addressed with increased vigilance.
2.7.2 PRESSURE OXIDATION
If the grade is high enough, an autoclave process involving steam and oxygen injection under
pressure can be used to oxidize the sulphide minerals. Autoclaves are capital and maintenance
intensive because of the advanced materials needed for their construction and the need for an
oxygen plant. Autoclaves require long lead times for fabrication and installation. The high
level of operator training and skill which are necessary because of the complexity of operation
and maintenance required, and increased safety requirements required handling the high
pressures and temperatures, increasing the operating costs of this process.
2.8 CASE STUDY
The Home stake gold mine in South Dakota provides an interesting example of the
application of biotechnology to clean up the environment degraded by mining activity. The
8

objective of Home stake study is to test the use of bacterial bio oxidation to convert
contaminants in water to substances that are environmentally safe. The mining operation at
Home stake discharges water from the gold mine to a nearby stream, and the untreated
wastewater contains cyanide in concentrations harmful to the trout. The treatment process
developed at the Home stake mine uses bacteria that have a natural capacity to oxidize the
cyanide to harmless nitrates. The bacteria were collected from mine tailing ponds and cultured
to allow biological activity at higher cyanide concentrations. They were then colonized on
special rotating surfaces through which the contaminated water flowed before being
discharged to stream. The bacteria also extracted, precious metals from the wastewater that
could be recovered by further processing. The system at Home stake reduced the level of
cyanide in the wastewater from about l0 ppm to less than 0.2 ppm, which is below the level
required by water quality standards for discharge into the trout stream. Because the process of
reducing the cyanide produced excess ammonia in the water, a secondary bacteria treatment
was designed that converts the ammonia to nitrate compounds, so that the discharged water
now meets stream water quality criteria.
2.9 HARVESTING MINERALS FROM THE SEA
Mineral resources in seawater or on the bottom of the ocean are vast and, in some cases, such
as magnesium, nearly unlimited. For example, in the United States, magnesium was first
extracted from seawater in 1940. By 1972, one company in Texas produced 80 percent of
domestic magnesium, using seawater as its raw material source. In 1992, three companies in
Texas, Utah, and Washington extracted magnesium, respectively, from seawater, lake brines,
and dolomite (mineral composed of calcium and magnesium carbonate). The deep-ocean floor
may eventually be the site of a next mineral rush. Identified deposits include massive sulfide
deposits associated with hydrothermal vents, manganese oxide nodules, and cobalt-enriched
manganese crusts.
9

2.9.1 SULFIDE DEPOSITS
Massive sulfide deposits containing zinc, copper, iron and trace amounts of silver are
produced at oceanic ridges by the plate tectonic activity. Pressure created by several thousand
meters of water at ridges forces cold seawater deep into numerous rock fractures, where it is
heated by upwelling magma to temperatures of about 350°C. The pressure of the heated water
produced vents known as black smokers, from which the hot, dark colored, mineral-rich water
emerges as hot springs. Circulating seawater leaches the surrounding rocks, removing metals
that are deposited when the mineral-rich water is ejected into the cold sea. Sulfide minerals
precipitate near the vents, forming massive tower like formations rich in metals. The hot vents
are of immense biological significance because they support a unique assemblage of animals,
including tube worms, and white crabs. Ecosystems including these animals base their
existence of sulfide compounds extruded from black smokers, existing through a process
called chemosynthesis, as opposed to photosynthesis, which supports all other known
ecosystems on earth. The extent of sulfide mineral deposits along oceanic ridges is poorly
known, and although leases to some possible deposits are being considered, it seems unlikely
that such deposits will be extracted at a profit in the near future. Certainly potential
environmental degradation, such as decreased water quality and sediment pollution, will have
to be carefully evaluated prior to any mining activity. Study of the formation of massive
sulfide deposits at oceanic ridges is also helping geologists understand some of the mineral
deposits on land. For example, massive sulfide deposits being mined in Cyprus are believed to
have formed at an oceanic ridge and to have been later uplifted to the surface.
2.9.2 MANGANESE OXIDE NODULES
Mn-nodules cover vast areas of the deep-ocean floor and contain manganese (24%) and iron
(14%), with secondary copper, nickel, and cobalt. Nodules are found in the Atlantic Ocean of
10

Florida, but the richest and most extensive accumulations occur in large areas of the north-
eastern, central, and southern Pacific, where they cover 20 to 50 percent of the ocean floor.
Manganese oxide nodules are usually discrete, but are welded together locally to form a
continuous pavement. Although they are occasionally found buried in sediment, nodules are
usually surficial deposits on the seabed. Their size varies from a few millimeters to a few tens
of centimeter in diameter (many are marble to baseball sized). Composed primarily of
concentric layers of manganese and iron oxides mixed with a variety of other materials, each
nodule is formed around a nucleus of a broken nodule, a fragment of volcanic rock, or
sometimes a fossil. The estimated rate of nodular growth is 1 to 4 mm per million years. The
nodules are most abundant in those parts of the ocean where sediment accumulation is at a
minimum, generally at depths of 5 to 7 km. The origin of the nodules is not well understood.
The most probable theory is that they form from material weathered from the continents and
transported by rivers to the oceans where ocean currents carry the material to the deposition
site in the deep-ocean basins. The minerals from which the nodules form may also derive
from submarine volcanism, or may be released during physical and biochemical process and
reactions that occur near the water-sediment interface during and after deposition of the
sediments. Mining of manganese oxide nodules involves lifting the nodules off the bottom
and up to the mining ship; this may be done by suction or scraper equipment. Although
mining of the nodules appears to be technologically feasible, production would be expensive
compared to mining manganese on land. In addition, there are uncertainties concerning
ownership of the nodules, and nodule mining would cause significant damage to the seafloor
and local water quality, raising environmental concerns.
2.9.3 COBALT-ENRICHED MANGANESE CRUSTS
Oceanic crusts rich in cobalt and manganese are present in the mid-and southwest Pacific, on
flanks of seamounts, volcanic ridges, and islands. Cobalt concentration varies with water
depth; the maximum concentration of about 2.5 percent is found at water depths of 1 to 2.5
11

km. Thickness of the crust averages about 2 cm. The process of formation of cobalt-enriched
manganese crusts is not well understood. Geologists are studying both the nature and the
content of the crusts, which also contain nickel, platinum, copper, and molybdenum.
2.10 RECYCLING OF MINERAL RESOURCES: RESPONSES TO LIMITED
AVAILABILITY
The basic problem with availability of mineral resources is not actual exhaustion or
extinction, but the cost of maintaining an adequate reserve, or stock, within an economy
through mining and recycling. At some point, the costs of mining exceed the worth of the
material. When the availability of a particular mineral becomes a limitation, several solutions
are possible like
• Find more sources
• Find a substitute
• Recycle what has already been obtained
• Use less and make more efficient use of what we have
• Do without
Which choice or combination of choices is made depends on social, economic, and
environmental factors. We can use a particular mineral resource in several ways: rapid
consumption, consumption with conservation, or consumption and conservation with
recycling. Which option is selected depends in part on economic, political, and social
conditions. Historically, resources have been consumed rapidly, with the exception of
precious metals. However, as more resources become limited, increased conservation and
recycling are expected. Certainly the trend toward recycling is well established for such
metals as copper, lead, and aluminum.
2.10.1 RECYCLING SCRAP METAL
The practice of recycling metal is not new. Metals such as iron, aluminium, copper, and lead
have been recycled for many years. Of the million of motor vehicles discarded annually,
12

nearly all are dismantled by auto wreckers and scrap processors for metals to be recycled.
Recycling metals from discarded autos is a sound conservation practice, considering that 90
percent by weight of the average discarded vehicle is metal. Recycling of metals in 1977 was
a $22 billion business in the United States. About 90 percent of all secondary (recycled) metal
is iron (including steel). Aluminium is second, followed by copper, lead, and zinc. Large
amount of iron is recycled because the market is huge, allowing for a large scrap collection
and processing industry.
2.10.2 URBAN ORE
Materials (especially metals) that end up in landfills and other waste management facilities
are sometimes designated as urban ore because of the useful materials they may contain. The
concept of "urban ore" originated when it was discovered that ash from the incineration of
sewage in Palo Alto, California, contain large concentrations of gold (30ppm), silver
(660ppm), copper (8000 ppm), and phosphorus (6.6%) Each metric ton of the ash contained
approximately 1 ounce of gold and 20 ounces of silver. The gold was concentrated above
natural abundance by a factor of 75,000 making the "deposit" double the average grade that is
mined today. Silver in the ash had a concentration factor of 9400, similar to that of rich ore
deposits in Idaho, and copper had a concentration factor of 145, similar to that of a common
ore grade. Commercial phosphorous deposits vary from 2 to 16 percent, so the ash with 6.6
percent phosphorus had the potential of a high-value resource. The ash in the Palo Alto dump
represented a silver and gold deposit with a value of about $10 million, and gold and silver
worth approximately $2 million were being concentrated and delivered to the dump each year.
The sources of the metals in the Palo Alto sewage were the large electronics industry and the
photographic industry located in the area. Gold in significant amounts has been found in the
sewage of only one other city, and silver is usually present in much smaller concentrations
that at Palo Alto. Thus, Palo Alto's unique urban ore presented an unusual opportunity to
13

study and develop methods to recycle valuable materials concentrated in urban waste. The
city employed a private company to extract the gold and silver. By the early 1990s Palo alto's
industrial companies treated their wastewater to recover the gold and silver. Sludge that
contains high concentrations of heavy metals such as cadmium is a toxic material and
precludes the application of the sludge for uses such as land reclamation. More efficient
pretreatment of industrial wastewater and strict regulations are necessary to avoid production
of toxic sewage sludge from urban areas. Recycling may be one way to delay or partially
alleviate a possible resource crisis caused by the convergence of a rapidly rising population
and a finite resource base. However, the problem of integrated waste management is complex,
and before recycling can become more widespread, improved technology and ore economic
incentives is needed. Nevertheless, the trends are set and the volume of resources recycled
will continue to grow.
2.11 SUMMARY
Bioleaching, an efficient and environmentally safe method is used when there are lower
concentrations of metal in the ore as an alternative to smelting or roasting. The sea is a rich
source of manganese oxide nodules.
2.12 Key words:
Bio-leaching - Bioleaching uses microorganisms to extract metals from ores in which they are
embedded.
Manganese oxide nodules - Mn-nodules cover vast areas of the deep-ocean floor and contain
manganese (24%) and iron (14%), with secondary copper, nickel, and cobalt.
2.13 SELF ASSESSMENT QUESTIONS
1. Discuss the various minerals found in the oceans.
2. Explain how recycling of mineral resources would help in optimum utilization of
available metals.
14

3. Compare the bioleaching of minerals to other mineral processing technologies.
2.14 SUGGESTED READING
Brandl H. (2001) Microbial leaching of metals. In: Rehm H.J. (ed.) Biotechnology, Vol. 10.
Wiley-VCH, Weinheim, pp. 191-224
15

UNIT-III PGDEM-02
WILDLIFE AND BIODIVERSITY
Narsi R Bishnoi
STRUCTURE
1.0 OBJECTIVES
1.1 INTRODUCTION
1.2 LEVELS OF BIODIVERSITY
1.3 RED DATA BOOK
1.3.1 Vulnerable Species
1.3.2 Endangered Species
1.3.3 Rare Species
1.3.4 Extinct Species
1.3.5 Threatened Species
1.4. PROBLEMS OF BIODIVERSITY LOSS
1.4.1 Causes of biodiversity loss
1.4.2 Effects of biodiversity loss
1.5 SUMMARY
1.6 KEYWORDS
1.7 SELF ASSESSMENT QUESTIONS
1.8 SUGGESTED READINGS
1.0 OBJECTIVES
After studying this unit, you will be able to understand:
• About genetic, species and ecosystem levels of biodiversity.
• Problems, causes and effects of biodiversity.
• About the threatened plants and animal species.
1.1 INTRODUCTION
Wildlife is a collective term embracing several thousands of different
species of non-domesticated biota growing under wild conditions indifferent

habitats around the globe. It is important to say that India's biodiversity is one of
the most significant in the world. As many as 45,000 species of wild plants and
over 77,000 species of Wild animals have been recorded, which comprise about
6.5 per cent of the world's known wildlife.
Biodiversity refers to the variety and variability among living organisms
and the ecosystem complexes in which they occur. It includes diversity of forms
right from the molecular unit to the individual organism and then on to the
population, community, ecosystem, landscape and biospheric levels. In the
simplest sense, biodiversity may be defined as the sum total of species richness,
i.e. the number of species of plants, animals and micro-organisms occurring in a
given habitat.
According to the Convention of Biological Diversity, the definition of
biodiversity is given as under:
The variability among living organisms from all sources including, inter
alia, terrestrial, marine and other aquatic ecosystems and the ecological
complexes of which they are a part. This includes diversity within species,
between species and of ecosystems.
The traditional diversity was bred to meet diverse human needs of
nutrition, test, colour, ritual, smell, and to resist drought, flood and pests. It
provided several kinds of insurance against crop failure to the farmer. Modern
hybrids, on the other hand, while substantially increasing the grain yield and
monetary profits, have forced the farmer to look elsewhere for their other daily
needs, especially fodder, medicine and other non timber forest products.
1.2 LEVELS OF BIODIVERSITY
Scientists usually distinguish 3 levels of biodiversity:
• Genetic diversity: This is the diversity of basic units of hereditary
information which are passed down the generations, found within a
species (e.g. different varieties of the same rice species). This diversity is

expressed through terms like subspecies, breeds, races, varieties, and
forms.
• Species diversity: This is the population diversity of organisms that
interbreed, or are reproductively isolated from other such populations (e.g.
different crops like rice, wheat, tomato, maize …). Species diversity is the
most commonly discussed type of diversity found in different countries or
ecosystems. It represents the species richness which is based on species
number and their population. Some 1.7 million species have so far been
described worldwide, but there may be anywhere between 5 to 30 million,
the rest still awaiting discovery.
• Ecosystem diversity: This the diversity of ecological complexes, or biotic
communities, found in a given area (e.g. forests, waterbodies,
grasslands). Ecosystems comprise a biotic community (an inter-related
community of plants, animals, and microorganisms), along with its abiotic
(soil, water, air) habitat, with some identifiable boundary. These can
include very broad categories, e.g. a, forest is an ecosystem dominated by
trees; or they can be more specific categories, e.g. a wet evergreen
tropical forest is an ecosystem dominated by evergreen tree species and
high rainfall.
Some species may be commonly found in a wide variety of ecosystems,
others are highly specialized and restricted to a particular ecosystem. Another
way to analyse distribution is to assess whether a species belongs to a particular
area or ecosystem or is alien to it i.e., whether it is indigenous or exotic. For
instance, rice is indigenous to India, while chillies are exotic, having been brought
in from South America. However, even after such introduction, such exotic
species may diversify further; there are several varieties of chillies, which have
been developed in India and are not found in South America.
Also of critical conservation importance is endemism. It represents the
degree to which biodiversity components belong exclusively to a particular
geographical area. For instance, two-thirds of the frogs and toads found in India

are endemic. Such species are naturally more vulnerable to extinction, since their
disappearance from a single area could mean their disappearance from the
entire world. The phenomenon of endemism amongst India's biodiversity is high.
According to the Botanical Survey of India, about 33 per cent of the flowering
species, and 18 per cent of the total, are considered to be found only within our
boundaries. These are concentrated in the floristically rich areas of North-East
India, the Western ghats, North-West Himalayas, and the Andaman and Nicobar
Islands. Amongst animals, nearly two-thirds of amphibians (frogs. toads) are
confined to India; of these, a majority occur in the Western ghats. Amongst
reptiles, nearly half of the 153 species of lizards found in India are endemic, with
a large number being restricted, once again, in the Western ghats.
1.3 RED DATA BOOK
Red Data Book is the name given to the books dealing with threatened
plants or animals of any region. Many countries have prepared their own Red
Data Book (e.g. Britain, New Zealand, etc.). On the global level, the International
Union for Conservation of Nature and Natural Resources (IUCN) published Red
Data Book in two volumes. Its opposite is the Green Data Book, which lists rare
plants growing in protected areas like botanic gardens. It deals with about a
hundred rare plant species growing in garden of Botanical Survey of India (BSI).
The BSI has also compiled 3 volumes of Red Data Book having information on
endangered plant species. The IUCN has defined the following categories of
species in Red Data Book which specify the state of extinction process of these
species:
1.3.1 Vulnerable species: These are the species whose population numbers
are decreasing and are likely to become more severally threatened with time and
in near future, they may represent the category of endangered species, if
unfavourable conditions in the environment continue to operate.
1.3.2 Endangered species: The species with fewer individual because of
unfavourable environmental or human factors and that its natural regeneration is
not able to keep pace with exploitation or destruction by natural and unnatural

means. If the same factors continue to operate as before, the species would
become extinct soon, e.g. Indian Rhinoceros, Asiatic lion, and the great Indian
Bustard.
IUCN Red data book includes Bengal florican and cheer pheasant as
endangered bird species.
1.3.3 Rare species: The species (or taxa) small world population that are not at
present endangered or vulnerable, but are at risk are called rare. Such species
are usually localized within restricted geographical areas or habitats or are thinly
scattered over a more extensive range. Rare species have a population of less
than 20,000 individuals. Some species are naturally rare and have never
occurred in greater numbers, yet they are able to maintain these numbers. Other
species become rare through man’s action or other unnatural forces.
1.3.4 Extinct species: Species that are no longer known to exist in the wild but
survive in cultivation. Generally, the term Extinct is used for the species that are
no longer known to exist in the wild.
The cheetah, Indian rhinoceros have been extinct according to IUCN’s
Red Data Book. Other animals that appear on the list are: Asiatic lion, snow
leopard, swamp deer, elephant and tiger.
1.3.5 Threatened: It is a broader term that is used for species that fall into any
of the above categories. In any discussion on the status of species, those falling
in the ‘threatened’ category attract maximum concern. This category is a broad
one encompassing species which are at various stages of actual or potential
threat (extinct, critical, endangered, vulnerable, susceptible).
Indian wild ass, buffalo and Manipur brown antlered deer are among the
threatened mammals.
1.4 PROBLEMS OF BIODIVERSITY LOSS
The loss of biological diversity is a global crisis. There is hardly any region
on the earth that is not facing ecological catastrophes. Of the 1.5 million species
known to inhabit the earth (humans are one of them), one fourth to one third is

likely to extinct within the next few decades. Biological extinction has been a
natural phenomenon in geological history. But the rate of extinction was perhaps
one species every 1000 year. But man's intervention has speeded up extinction
rates all the more. Between 1600 and 1950, the rate of extinction went up to one
species every 10 years. Currently it is perhaps one species every year.
World's tropical forests, disappearing at an alarming rate have become is
one of today's most urgent global environmental issues. Tropical forests are
estimated to contain 50 to 90 percent of the world's biodiversity. According to the
report "People and Environmental” released recently by the US based WRI, the
current rate of biodiversity loss is faster than ever known. The report based on
studies carried out by FAO and WCS found that the tropical forests are shrinking
at the rate of 0.8 percent each year.
An assessment of wildlife habitat loss in tropical Asia in 1986 showed that
it had only 6,15,095 km2 wildlife habitat area out of its original of 30,17,009 km2
area i.e. there is a loss of about 20 per cent. In the last few decades, India has
lost at least half of its forests, polluted over 70 per cent of its water bodies, built
on or cultivated much of its grasslands, and degraded most of its coasts. Under
such circumstances, none can say how many species have already been lost.
1.4.1 Causes of biodiversity loss
The country has several problems such as overpopulation, large number
of cattleheads, growing demand for land, energy, and water supply. Unplanned
developmental works and overexploitation of resources have made its living
resources most vulnerable. Of the world's 12 top priority biodiversity hot spots,
India has two within its boundaries. Overexploitation has not only resulted in
shortages of various materials but also left our biodiversity exposed to various
ecological threats. Over emphasis on timber logging has affected many animal
species. Faunal losses have been mainly because of over-exploitation of certain
species for trading purposes; habitat alteration and destruction; and pollution of
streams, lakes and coastal zones.

1.4.2 Effects of biodiversity loss
Poverty and starvation, and several other ills facing humans, are often the
result of the destruction of biodiversity. Though we seldom realize it, biological
diversity and its components are the very basis of human survival providing food,
medicine, energy, ecosystem functions, scientific insights, and cultural
sustenance to over six billion people over the world.
1. Plants, animals, and even the invisible micro-organisms around us,
sustain and recreate the quality of the water we drink, the air we breathe,
and the soil on which we grow food. It is our forests, lakes, rivers,
grasslands, coasts, seas, and agricultural lands that provide us with
oxygen, water, and fertile soil, with food, medicine, clothing, housing,
energy, and other material needs. Most of the oxygen we breathe comes
form marine algae, whose existence is dependent on a complex chain of
diverse life forms and inanimate matter. Where would we be without all
this?
2. Wild plants and animals still constitute a substantial part of the diet of the
majority of the world's rural population. In case of people living near
forests and coastal regions, more than fifty per cent food resources are
wild plants or animals. These species are especially critical as ‘famine
foods’, available at times when crops fail or cannot be grown.
3. Three-fourths of the world's population is directly dependent on plants
animals for its medicinal needs. Even modem medicine continues to
depend on extracts from living organisms. In the United States, about 4.5
per cent of GDP is made up to economic benefits derived from wild
species, and one-fourth of all medicines contain active ingredients from
plants. The struggle against malaria was greatly aided by the Cinchona
tree of South America, which yielded quinine. Likewise, one insignificant
looking plant from Madagascar, the rosy periwinkle, has yielded cures for
certain forms of cancer.

4. Agriculture, which provides 32 percent of the gross domestic product in
low-income countries, may have of late become technologically
sophisticated, but it still depends on traditional crop varieties, and on wild
plant relatives of crops. In the 1970s, a wild rice species found in India
was found to be resistant to one to the most dangerous pests (a species
of plant hopper); genes from this plant were used to save millions of
hectares of cultivated rice in South and South-East Asia from being
destroyed by a major epidemic. Diversity within agricultural systems is
also crucial to the stability of farming systems.
5. Fisheries, which are heavily dependent on the maintenance of aquatic
biodiversity, contribute about 100 million tons of food worldwide (86 per
cent of this from marine areas), which is greater than the contribution
made by livestock or poultry.
Over centuries, knowledge and materials from wild plants and animals
have revolutionized agriculture (the cross-breeding of crops with wild relatives
which have resistance or other desired characteristics), industry (rubber, cotton
medicine (quinine), and other fields of human endeavour. Since the great
majority of the world's species remain unexplored for their potential, there is no
doubt that further revolutionary discoveries, such as cures for various kinds of
cancer, are in store. But we will be able to tap this potential only if we are able to
save these species.
1.5 SUMMARY
Indian’s biodiversity is one of the most significant in the world. It comprises
of about 45,000 species of wild plants and 77,000 species of wild animals, which
contribute about 6.5 percent of the world’s known wild life. The Phenomenon of
endemism amongst India’s biodiversity is high. According to the BSI, about 33%
of the flowering species, and 18% of the total are considered to be found only
within our boundaries. Amongst animals, nearly two-third of amphibians (frogs &
toads) are confined to India of these a majority occur in the Western ghats.
Amongst reptiles, nearly half of the 153 species of lizards found in India are

endemic, with a large number being restricted to Western ghats. Man’s
intervention has speed up extinction rates of the species. Between 1600 and
1950 the rate of extinction went upto one species every 10 year. Currently it is
perhaps one species every year. In tropical Asia, as assessment of wild life
habitat loss about 20 percent in 1986 over population, poverty and starvation are
the result of the destruction of biodiversity. Though we seldom realize it,
biological diversity and its components are the very basis of human survival
providing food, medicine, energy, ecosystem, scientific insights, and cultural
sustenance to over six billion people over the world.
1.6 KEYWORDS
Biodiversity: It may be defined as the sum total of species richness i.e. the
number of species of plants, animals and micro-organisms occurring in a given
habitat.
Endemism: It represents the degree to which biodiversity components belong
exclusively to a particular geographical area.
Red Data Book: It is name given to the books dealing with threatened plants or
animals of any region.
Extinct Species: Species that are no longer known to exist in the wild but
survive in cultivation.
Threatened species: Wild species that is still abundant in its natural range but is
likely to become endangered because of a decline in numbers.
1.7 SELF ASSESSMENT QUESTIONS
(1) What is Red data book ? Discuss various categories of wild life depending
upon their status of extinction process.
(2) Why is it important to conserve biodiversity. Discuss with suitable
examples.
(3) What are the causes and effects of biodiversity loss ?
(4) Define biodiversity environment. Discuss the various levels of biodiversity.

(5) Write down short note on following
a. Vulnerable Species
b. Endangered Species
c. Rare Species
d. Extinct Species
e. Threatened Species
1.8 SUGGESTED READINGS
Agrawal, K.C. 1996. Biodiversity. Agro Botanical Pub. New Delhi.
Agrawal, K.C. 2000. Wild Life of India – Conservation and Management. Nidhi
Publishers, New Delhi.
Dutt, A. 2001. Biodiversity and Ecosystem Conservation. Kalpaz Publications,
New Delhi.
Gaston, K.J. and Spicer, J.I. 2004. Biodiversity: An Introduction, Blackwell
Publishers, USA.
Hosett, B.B. and Venkatesh Warlu, M. 2001. Trends in Wildlife Biodiversity,
Conservation and Management, Daya Publishing House, New Delhi.
Khothari, A. 1997. Understanding Biodiversity. Orient Longman Limited. New
Delhi.
Singh, B.K. 2004. Biodiversity, Conservation and Management, Mangaldeep
Publishers, Jaipur.
Tondon, P. 2005. Biodiversity status and prospectus, Narosa Publication, New
Delhi.
Wilson, E.O. 1993. The Diversity of Life. W,W. Norton and Company, New York.

UNIT-III PGDEM-02
FORESTS Written by Dr. O.P.Toky
Sim conversion by Prof. Anubha Kaushik
STRUCTURE
2.0 OBJECTIVES
2.1 INTRODUCTION
2.2.1 DEFINITION
2.2.2 IMPORTANCE
2.2.2.1 Moderating effect on climatic conditions
2.2.2.2 Role in stabilizing soil conditions
2.2.2.3 Role in soil conservation
2.2.2.4 Environmental significance
2.2.2.5 Economically useful forest products
2.2.2.6 Recreational Importance
2.2.3 FOREST TYPES
2.2.4 FOREST RESOURCES
2.2.5 FOREST MANAGEMENT PRACTICES
2.3 SUMMARY
2.4 KEY WORDS
2.5 SELF ASSESSMENT QUESTIONS
2.6 SUGGESTED READINGS
2.0 OBJECTIVES
After studying this unit, you should be able to :
• Define a forest
• Understand the economic and ecological importance of forests.
• Know different forest resources.
• Know about various types of forests in India.
• Understand the practices used for management of forests.
1

2.1 INTRODUCTION
Nature has endowed India with rich forests which cover about 20
per cent of total geographic area of the country. These range from the
alpine meadows of Kashmir in the north to the rain forests of Kerala in
the south; the dry thorny forests of Rajasthan and evergreen forests of
north-east India. Over 40,000 species of plants are found in these forests
of which over 7,000 are endemic and not found anywhere in the world.
This represents about 12 per cent of the total global plant wealth. India
has about 3000 tree species.
2.2.1 DEFINITION
Generally, forest is defined as an area of land set aside for the
production of timber and other forest produce or maintained under
woody vegetation for certain indirect benefits such as climatic or
productive or both.
In terms of forestry, we define forest as an aggregation of trees
occupying a specific area sufficiently uniform in composition, age
gradation and distinguished from the vegetation of the surrounding
areas.
Ecologically forests may be defined as a plant community
comprised mainly of trees and associated woody vegetation, usually with
a closed canopy.
Legally forest may be defined as an area of land proclaimed to be a
forest under a forest law or act (According to Indian Forests Act, 1972).
2.2.2 IMPORTANCE
Other than forming a conspicuous part of the landscape, forests
have a profound impact on the lives of human beings. They have a
moderating effect on the local climatic conditions, regulate the water
2

cycle particularly in mountainous areas such as Himalayas, reduce soil
erosion and also form the source of many commercial and non-
commercial products such as fuelwood, fodder and industrial wood. The
major importance of forests are discussed below :
• Climatic Conditions
The broad climatic conditions prevailing in a region or locality in
primarily determined by its geographical location, altitude and the
meteorological forces that operate over the region. However, within the
broad limits of climatic conditions of a particular region or locality, there
may be local modifications known as microclimate. This is brought about
by a combination of the influence of the forest vegetation and the
topographic factors or a combination of both. The influence of forests on
climatic factors such as temperature, wind velocity, humidity and
precipitation are as under:
• Temperature
The tree leaves lose water through transpiration which has a
cooling effect. The moderating effect of forests on prevailing temperatures
is more in denser vegetation. It is cooler inside a dense forest as
compared to open areas in summer season, the difference may be as high
as 3°C.
• Prevailing winds
Forest vegetation have considerable effects on prevailing winds and
their movements due to physical obstacle offered by tree canopies. The
impact of forest in reducing wind speeds is seen not only inside a forest
but also upto a considerable distance on the leeward side. That is the
reason why rows of trees are often raised as shelterbelt against the
direction of prevailing winds along side crop fields. These shelter belts
serve to reduce the velocity of the prevailing winds, particularly in open,
arid and semi-arid areas prone to wind erosion.
3

• Humidity
In natural mixed forest, the relative humidity which varies with
temperature and amount of water vapour present in the air may be upto
10 percent more as compared to that in open areas.
• Precipitation
Forests have profound influence on rainfall. They increase rainfall
due to the fact that trees transpire large quantities of water into the
atmosphere and also serve as an obstacle for moisture laden winds, thus
causing precipitation in their vicinity.
2.2.2.2. Soil Conservation
• Soil temperature
In summer, the mean maximum temperature of the soil surface
may be lowered by up to 8°C due to the forest cover. The influence of
forest cover on soil temperature is due to reduction of insolation and
radiation within the forest, primarily as a result of the overhead cover
and also due to insulating effect of the litter and humus lying on the
forest floor.
There is a less pronounced increase in the minimum soil
temperature due to the effect of forest vegetation. This is seen more in the
winter season. In the sub-arctic tracts forest soils may remain unfrozen
though the soils in the adjoining open areas are frozen to a considerable
depth. The influence of forest cover varies inversely with depth. This
influence is recognizable up to a depth of 5 to 8 m.
• Soil composition and structure
Every year a considerable quantity of organic matter is added to
soil in the form of raw humus viz. leaves, twigs and branches most of
which gradually forms a part of soil and also supplies essential nutrients
to the layers down below which percolate with water.
4
• Evaporation
The quantity of water that evaporates from the soil is lowered by
the presence of a forest cover and up to a certain distance on the leeward
side of the forest belt. This is primarily due to the influence of forest on
movement of winds, air temperatures and relative humidity.
• Physical and chemical conditions of the soil
The roots of trees also help to improve the soil condition. As they
grow they tend to loosen up new parts of the soil. Forests also help to
improve the physical and chemical conditions of soil by adding significant
quantities of elements such as nitrogen, calcium, phosphorus and
potassium.
• Erosion and run-off
Reduction of soil erosion
In tracts devoid of a forest cover, erosion proceeds at an
increasingly faster rate as the upper and more absorptive layers of the
topsoil are successively removed. The upper layers of the top soil
containing humus are eroded at a slower rate than the layers below and
as erosion proceeds, the rate of erosion of the lower layers of the soil
increases.
All types of vegetation serve as a check against soil erosion though
well stocked forests are the most effective. This beneficial effect is due to
the ability of forest to reduce the amount and velocity of surface run-off
and to decrease the material being carried by the surface run-off.
Reduction of surface run-off
Surface run-off is that part of the total rainfall which flows on the
surface from an area or watershed after a part of the precipitation has
5
seeped into the soil; evaporated or transpired back into the atmosphere
by the vegetation. Forests also exert an influence on reducing the volume
of rainwater that flows as surface run-off.
Forest help to safely distribute the rainfall received in an area due
to the fact that there is an increase in the interception of rain water due
to the forest cover and more portion of the rainfall tends to seep into the
soil rather than flow on the surface. Also due to decrease in evaporation
of moisture from soil and increasing transpiration effect, forest tends to
reduce the surface run-off.
2.2.2.3 Floods
According to the National Floods Commission about 175 million
hectares of land area are prone to floods in India. The Commission has
emphasized that deforestation is a major cause of degradation of lands.
Forests are generally regarded as regulators of stream flow or in other
words they maintain low flows thus helping to reduce floods. However,
large floods are directly associated with saturated ground water
conditions and the forest cover may not directly prevent floods, rather it
will help to reduce erosion and retard the flow of debris into the rivers
and streams. In such situations the forest cover reduces the choking of
stream and river channels, thus preventing the water from over-flowing
the banks and flooding the low lying areas.
2.2.2.4 Environmental conservation
Forests also play a vital role in environmental conservation both at
local and region level. The major roles are as follows :
• Mitigation of air and noise pollution by absorbing various toxic
gases and by attenuating sound waves.
• Sequestering of carbons, as carbon dioxide is used up by forests
as a raw material for photosynthesis, thus reducing global
warming effect.
6

• Maintenance of hydrogical cycle
• Control of soil erosion by various agencies such as water, wind
and gravity by firmly holding the soil articles and acting as
shelter belts, thus reducing velocity of wind.
• Conservation of biological and genetic diversity by acting as
natural habitat for flora and fauna.
• Check against desertification and conditions of drought by
maintaining water sheds and checking soil erosion.
• Food and Ecological security by providing a variety of edible
products.
• Increasing the productivity of adjoining croplands.
2.2.2.5 Forest products
Forests also provide human beings with a wide variety of products
of everyday and commercial use. These include fuelwood, fodder, sandal
wood, grasses, tannins, resins, gums, mucilages, medicines and drugs,
food, fibre, commercial timber and raw material for many different end
products such as paper and matches. Thus they have a direct and
indirect influence on the lives of all human beings; irrespective of
whether they are living in the rural or urban areas.
2.2.2.6 Recreational and aesthetic importance
Forests also have many recreational and aesthetic influences
particularly for the people living in the urban and semi-urban areas. The
recreational and asthetic influence of forests has come to the fore in
recent decades with more and more people developing a liking for visiting
forest for recreation and relaxation. This influence is more profound in
larger cities and towns, where natural surroundings are scarce or absent.
2.2.3 FOREST TYPES
The principal forest types found in different parts of India have
been discussed as under :
7

a) GROUP 1 : TROPICAL WET EVERGREEN FOREST
Sub-group 1 : Southern tropical wet evergreen forests
The mean annual temperature is about 27°C and total annual
rainfall varies from 200 to 300 cm. This sub-group is comprised of the
following forest types :
Type : Giant evergreen forest
Type : Andaman tropical forest
Type : Southern hilltop evergreen forest
Type : West coast tropical evergreen forest
b) Sub-group 2 : Northern tropical wet evergreen forest
This forest group is distributed to entire north-east India, and in
parts of West Bengal and Orissa in tracts where the total annual rainfall
is over 250 cm. The main species found in this forest group are
Dipterocarpus, Mesua, Michelia and Shorea in the overwood; Bambusa,
Melocanna, Dendrocalamus hamiltonii, Vatica and Garcinia in the middle
storey and Clerodendron, Isora and Laportea as the undergrowth.
Type : Assam valley tropical evergreen forest
Type : Upper Assam valley tropical evergreen forest
Type : Cacher tropical evergreen forest
c) GROUP II : TROPICAL SEMI-EVERGREEN FORESTS
2.4.2.2 Sub-group I : Southern tropical evergreen forest
It is found along the Western ghats near Goa, Wynaad and Palghat,
Kerala adjoining the evergreen forests. Mean annual rainfall is between
200 to 300 cm.
The overwood is comprised mainly of Dipterocarpus, Balanocarus,
Hopea and Xylia. The Underwood is made up to Diospyros melanoxylon
and Schleichera oleosa. The undergrowth is made up to Clerodendron
arborium, Strabilanthes etc.
8

Type : Andamans semi-evergreen forest
Type : West coast semi-evergreen forest
Type : Tirnelveli semi-evergreen forest
Type : Secondary semi-evergreen Dipterocarp forest
Sub-group 2 : Northern tropical semi-evergreen forest
The forests of this sub-group occur in the heavy rainfall of north-
east India, West Bengal and Orissa. The average annual rainfall varies
from 150 to 300 cm.
The overwood is composed of Artocarpus, Dipterocarpus,
Cinnamomum, Michelia champaca, Shorea robusta and Syzygium cuminii.
The middle storey made up of Actinodaphne, Bambusa arundinaceae,
Dendrocalamus hamiltonii, Machilus, Melocanna bambusiodes, Mesua and
Phoebe lanceolata.
Type : Assam valley semi-evergreen forest
Type : Assam alluvial plain semi-evergreen forest
Type : Eastern sub-montane semi-evergreen forest
Type : Cachar tropical semi-evergreen forest
Type: Orissa tropical semi-evergreen forest
d) GROUP III : TROPICAL MOIST DECIDUOUS FORESTS
The forests of this group are found over a fairly wide tract in the
tropical parts in India. They are rich in species diversity and extent.
These forests may inturn be placed in the following sub-groups.
Sub-group I : Andamans moist deciduous forest
The forests of this sub-group are found in the Andaman and
Nicobar group of islands. The total annual precipitation is about 300 cm
and mean annual temperature is about 26°C. The main species found in
this forest are Adenanthera sp., Canarium sp., Cinnamomum sp.,
Pteracarpus dalbergioides, Terminalia sp.
9

Sub-group 2 : South Indian moist deciduous forest
These are teak bearing forests occurring in the central Indian belt
mainly in part of Gujarat, Maharashtra, Madhya Pradesh, Karnataka,
Kerala and Tamil Nadu. The mean annual temperature in this tract
varies from 24 to 27°C and mean annual rainfall is between 120 and 300
cm.
Type : Very moist teak forest
Type : Moist teak forest
Type : Slightly moist teak forest
Type : Southern moist deciduous forest
Sub-group 3 : North Indian moist deciduous forest
The forests of this sub-group are found in many parts of northern
India viz. in parts of Uttar Pradesh, Bihar, Orissa and West Bengal. The
mean annual temperatures ranges from 21 to 26°C. Mean annual rainfall
is between 100 to 200 cm.
Type : Very moist sal bearing forests
Type : Peninsular (Coastal) sal forest
Type : Moist peninsular sal forest
Type : Moist sal bearing forest
Type : Moist mixed deciduous forests
e) GROUP IV : LITTORAL AND SWAMP FORESTS
Sub-group 1 : Littoral forests
This forest is developed in many coastal tracts of the country. The
main annual temperature in the tract in which it occurs varies from 26 to
29°C. Rainfall is fairly heavy in this tract with the average annual rainfall
varying from 76 cm to 500 cm.
Type : Littoral forest Type : Mangrove scrub Type : Mangrove forest Type : Brackish water mixed forest
10

Sub-group 2 : Tropical freshwater swamp forest
The forests of this sub-group occur in swampy areas. They are
dominated by hydrophytes, as the locality conditions are typified by
excess of moisture.
Type : Tropical freshwater swamp forest
Sub-group 3 : Tropical seasonal swamp forest
The forest belonging to the sub-group occur in areas which
experience swampy conditions for only a part of the year. They in the
tropical parts of India and also in the sub-tropical foothill tract. They may
further be sub-divided into the following types :
Type : Low swamp forest
Type : Eastern seasonal swamp forest
Type : Eastern Dillenia swamp forest
f) GROUP V : TROPICAL DRY DECIDUOUS FORESTS
Sub-group 1 : Southern tropical dry deciduous forests
These forests occur in different parts of peninsular India with the
exception of the western ghats, where the rainfall is more than 190 cm. It
is thus found in the states of Madhya Pradesh, Maharashtra, Andhra
Pradesh, Tamil Nadu and Karnataka. The annual rainfall ranges from
100 to 130 cm.
Type : Dry teak bearing forest
Type : Red sanders bearing forest
Type : Southern dry mixed deciduous forest
Sub-group 2 : Northern dry deciduous forests
This is a dry deciduous forest in which the upper canopy is light
but probably fairly even. The forests of this sub-group are well
distributed all over northern India, mainly in parts of Bihar, Orissa, Uttar
Pradesh, Punjab, Haryana, Rajasthan and Madhya Pradesh.
11

Type : Dry sal bearing forest
Type : Northern dry mixed deciduous forest
g) GROUP VI : TROPICAL THORN FORESTS
Sub-group 1 : South tropical thorn forests
The forests of this sub-group are found in central, western and
southern India, mainly in parts of Madhya Pradesh, Maharashtra, Tamil
Nadu and Karnataka.
Type : Southern thorn forest
Type : Carnatic umbrella thorn forest
Type : Southern thorn scrub
Type : Southern Euphorbia scrub
Sub-group 2 : Northern tropical thorn forests
These are open thorny forests found extensively in Rajasthan and
Gujarat and also to a lesser extent in the semi-arid regions of Uttar
Pradesh, Punjab and Haryana.
Type : Desert thorn forest
Type : Ravine thorn forest
Type : Zizyphus scrub
Type : Tropical Euphorbia scrub
h) GROUP VII : TROPICAL DRY EVERGREEN FORESTS
This forest type is found along the east coast where unusual
climatic conditions prevail. These are near the coast from Tiruneleveli
northwards to Nellore under similar climatic conditions.
Type : Tropical dry evergreen forest
Type : Tropical dry evergreen scrub
12

i) GROUP VIII: SUBTROPICAL BROAD-LEAVED HILL FORESTS
Sub-group 1 : Southern sub tropical broad-lived hill forests
These are broad-leaved subtropical forests occurring between
elevation of 1000 and 1700 m in the hills of south India and 1000 m in
the higher tracts of central India including the outliers such as Mount
Abu though only in vestigial form :
Type : Southern sub-tropical hill forest
Type : South Indian subtropical hill savannah
Type : Ochlandra reed hill forests
Type : Western subtropical hill forest
Type : Central Indian subtropical hill forest
Sub-group : Northern Subtropical broad-leaved hill forests
Type : East Himalayan subtropical wet hill forests
Type : Khasi subtropical wet hill forests
j) GROUP IX : SUBTROPICAL PINE-FORESTS
This is primarily a forest dominated by chir pine (Pinus roxburghit).
Chir pine forests are found in the western and central Himalaya from the
Jammu hills in the west to Sikkim in the east between elevations of 1000
and 1800 m extending on ridges to 600 m and up to 2300 m in some
southern aspects.
Type : Lower of siwalik chir pine forest
Type : Upper Himalayan chir pine forest
Type : Assam subtropical pine forests
k) GROUP X : SUBTROPICAL DRY EVERGREEN FORESTS
These forests are found in the bhabar tracts, siwalik hills and
foothills of the western Himalaya up to an elevation of about 1000m.
13

Type : Olea caspidata scrub forest
Type : Acacia modesta scrub forest
Type : Dodoaea scrub
l) GROUP XI : MOTANE WET TEMPERATE FOREST
These forests occur in the temperate areas of India.
Type : East Himalayan wet temperate forests
Type : Naga hills wet temperate forest
m) GROUP XII : HIMALAYAN MOIST TEMPERATE FORESTS
These forests extend along the whole length of the Himalaya above
the subtropical forests and towards higher elevations. The altitudinal
range is from 1500 to 3300 m depending on the latitude, aspect and
configuration of the ground.
Type : Ban oak forest
Type : Moru oak forest
Type : Moist deodar forest
Type : Western mixed coniferous forest
Type : Moist temperate deciduous forest
Type : Low level blue pine forest
Type : Kharsu oak forest
Type : East Himalayan mixed coniferous forest
Type : Abies delayayi forest
n) GROUP XIII : HIMALAYAN DRY TEMPERATE FORESTS
These forests are found in the cold deserts of Ladakh, Lahaul, Spiti
and Pooh and in the inner dry valleys within the main Himalayan ranges
such as Bharmour, Kinnaur and Upper Darama tracts.
Type : Dry broad-leaved coniferous forests
14
Type : Chilgoza pine forest
Type : Dry deodar forest
Type : High level dry blue pine forest
Type : West Himalayan dry juniper forest
Type : East Himalayan dry temperate coniferous forest
Type : Larch forest
o) GROUP XIV : SUB-ALPINE FORESTS
These forests are the topmost tree forests of the Himalaya forming
the tree line at elevations of more than 2900 m and extending the over
3500 m.
Type : West Himalayan sub-alpine birch/fir forests
Type : East Himalayan sub-alpine birch/fir forest
p) GROUP XV : MOIST ALPINE SCRUB
This consists of the alpine zone vegetation found just below the
snowline and usually above the tree line in the moister tracts of the
Himalaya.
Type : Birch-Rhododendron scrub forest
Type : Deciduous alpine scrub
Type : Dwarf Rhododendron scrub
Type : Alpine pastures
q) GROUP XVI : DRY ALPINE SCRUB
This is the alpine vegetation of the cold and dry tracts of the trans-
Himalaya and the inner dry valleys of the main Himalayan ranges.
Type : Dry alpine scrub
Type : Dwarf Juniper scrub
15

2.2.4 FOREST RESOURCES
Area under forests : out of total 326,809 thousand hectares of
geographical area in India, forests cover 75,351 thousand hectares, just a
23 percent of the total. While the norm for forests varies according to the
terrain, 33 percent is recommended by the 1951 Forest Policy Resolution
for the country as a whole. The suggested norm for hill areas is 60 per
cent and for plains 20 per cent. It is seen that a little less than one-fourth
924.6 per cent) of the country’s forest area is in Madhya Pradesh. Next
are Andhra Pradesh, Maharashtra and Uttar Pradesh with about 10 per
cent, 9 per cent and 6.4 per cent forest cover, respectively. The shares of
Jammu and Kashmir and Kerala, which otherwise grow better species,
are 4.5 per cent and 1.8 per cent, respectively.
Even more important than the area under forest is the type of wood
they have. And the next consideration is of economic accessibility of
forests, i.e., in the context of present prices of wood and the cost of
extraction, in the area that is exploitable. In India, coniferous species
cover 3,765 thousand hectares and the remaining area is stocked with
broad-leaved species. By economic accessibility, the currently exploitable
area is 63.34 per cent.
Teak, Sal and Conifers
Madhya Pradesh has the maximum area (3119 thousand hectares)
under teak, followed by Maharashtra (1404 thousand hectares), Gujarat
(1176 thousand hectares) and Mysore (1000 hectares). These four states
account for about 92 per cent of the area under teak in the country. Sal
is predominantly found in Madhya Pradesh and Bihar. These two states
account for 80 per cent of the total area under sal. Conifers grow largely
in higher altitudes of Himachal Pradesh, Jammu and Kashmir and Uttar
Pradesh.
16

Value of forest products
About 79 per cent of the value of forest produce in the country
comes from major forest produce, and the remaining from minor
produces. The five states Madhya Pradesh, Jammu and Kashmir,
Himachal Pradesh, Andhra Pradesh and Uttar Pradesh contribute as
much as 64 per cent of total value of forest produce in the country.
Industrial wood
About 42 per cent of the annual recorded wood production from
the country’s forests is put to industrial uses, 58 per cent is used as fuel
including wood for charcoal. Except for Himachal Pradesh and Jammu &
Kashmir, where 80 per cent of the annual production consists of the
industrial variety of wood, in other states large tracts are used for fuel
wood.
Other commercial uses of forest wood include timber for various
purposes, mainly for building, furniture etc. Wood pulp is another
resource on which paper industry is dependent. A large variety of
medicines and drugs, rubber, gum, lac, fruits, fodder, condiments,
beverages, fibres etc. are also produced by forests.
Man made forests
Man made forests comprise just about 2 per cent of the total forest
area in the country. And out of this area a good deal is concentrated in
southern and south-eastern states of Karnataka and Tamilnadu. The
main species are teak and eucalyptus. Bamboo and sheesham
plantations have been taken up largely in the northern region. In north-
western parts of India among other varieties poplar is most popular.
2.2.5 FOREST MANAGEMENT PRACTICES
Forest management is defined as “that branch of forestry whose
17

function is the organization of a forest property for management and
maintenance, by ordering in time and place the various operations
necessary for the conservation, protection and improvement of the forest
on the one hand, and the controlled exploitation of the forest, on the
other hand. Since the discussion of forest management is beyond the
scope of this chapter, hence we are discussing some important terms –
Clear felling system : Also termed as the clear cutting system,
successive clearfelling and regeneration (artificial or natural) are carried
out in a particular area under this system. As a general rule, the coupe
or felling area should be completely cleared although pre-existing pole
and sapling crop which occurs in groups may be retained as a part of
the future crop.
Uniform Shelterwood system : It means a uniform opening of the
canopy for the purpose of obtaining regeneration and also the uniform or
evenaged condition of the young crop produced subsequently.
Selection system : Felling and regeneration operations are not confined
to any particular area. But are distributed all over it. Fellings comprises
of the removal of tree either singly or in small groups scattered all over
the forest. They form an unevenaged type of forest, in which all the age
classes occur. Such a forest has been termed as selection forest.
Irregular shelterwood system : It has been described as a system of
successive regeneration with a long and indefinite period of regeneration.
The aim being to produce crops of a somewhat evenaged type.
Strip system and the wedge system : A number of silvicultural system
differing in detail, but having one common character i.e. coupes are in
narrow strip; are classified under this heading. These system are :
1. Shelterwood strip system
2. Wagners’ blendersaumschlag
18

3. Strip and group system
4. Progressive clear strip system
5. Alternate clear strop system
Coppice systems : The forests worked under this system depend upon
coppice shoots for regeneration. These shoots come up from the
adventitious buds on the stumps of freshly felled trees.
2.3 SUMMARY
Forests are plant communities comprising mainly of trees,
associated with woody vegetation, usually with a closed canopy. They are
of immense commercial as well as environmental importance. Although
33 per cent of our geographic area should be covered under forests
according to our forest policy, but we have 28.8 per cent under forest
cover in our country. Besides providing timber, fuel wood, fodder, fruits,
fibres, drugs and medicines, beverages, rubber, lac, gums, resins etc. as
economically useful products, forests have tremendous ecological and
environmental value. They help in regulating hydrological cycle, reduce
atmospheric pollution and noise pollution, help prevent soil erosion and
floods, help conserve soil and water-sheds, provide natural habitat for a
large number of species and help to conserve genetic diversity. India has
a wide range of soil and climate variations. Thus, there are a number of
types of forests in our country ranging from Tropical wet evergreen
forests to dry alien scrubs, with several forest types in between having
sub-tropical, moist and dry conditions. In order to exploit the forest
resources in a sustainable manner forest management practices
including clear felling, shelterwood cutting, selection system, strip system
and coppice system are adopted.
2.4 KEY WORDS
Forest - Vegetation dominated by trees and woody
species
19

Precipitation - Rainfall, snow, dew etc.
Transpiration - Loss of water from plant leaves
Canopy - cover formed by leaves of trees
Soil erosion - Loss of top fertile soil layer
Evergreen forests - where trees bear leaf throughout
Deciduous forests - where trees shed their leaves seasonally
Littoral forests - which grow near coastal areas
Swamp forests - which grow in swampy, marshy areas
2.5 SELF-ASSESSMENT QUESTIONS
1. Discuss the economic and ecological significance of forests.
2. What are the major forest types of India?
3. What are the major forest management practices?
2.6 SUGGESTED READINGS
Negi, S.S. 1996. Mannual of Indian Forestry. Vol. I. M/S Bishen Singh
Mohender Singh Pub. Co. Dehradun.
Negi, S.S. 1996. Mannual of Indian Forestry, Vol. II. M/S Bishen Singh
Mohender Singh Pub. Co. Dehradun.
Thapar, S.D. 1975. India’s Forest Resources. McMillan Co. New Delhi.
20
UNIT-IV PGDEM-02
WILD LIFE : CONSERVATION AND MANAGEMENT STRATEGY
Narsi Ram Bishnoi
STRUCTURE 1.0. OBJECTIVES 1.1. INTRODUCTION 1.2. NEED FOR WILDLIFE CONSERVATION AND MANAGEMENT 1.3. CONSERVATION AND MANAGEMENT STRATEGY 1.4. ACTION PLAN FOR THE CONSERVATION AND MANAGEMENT OF
WILDLIFE IN THE COUNTRY 1.5. LEGISLATION FOR PROTECTION OF WILDLIFE 1.6. CROCODILE PROJECT
1.6.1. Reason for decline 1.6.2. Objectives of the project 1.6.3. Project implementation 1.6.4. Sanctuary development 1.6.5. Crocodile husbandry 1.6.7. Sanctuary declaration
1.7. SUMMARY 1.8. KEY WORDS 1.9. SELF ASSESSMENT QUESTIONS 1.8. SUGGESTED READING 1.0. OBJECTIVES
After studying this unit, you should be able to :
• Understand conservation and management strategies and their action
plan for the protection of wildlife.
• Know about the various Govt., Non-Govt., Voluntary, National and
International organizations actively dedicated to wildlife preservation.

2
• Crocodile breeding and management programme.
1.1. INTRODUCTION
Man because of his vanity and greed has become one of the greatest
enemies of the wildlife. He has tried to control all the adverse factors for his
survival without any concern for the other living forms around him. Increasing
human population with its increasing food requirements has resulted in
reduction of area under forest cover because large tracts of forest area have
been put under intensive agriculture. River valley projects, draining of marshes
for agriculture and urbanisation, over exploitation, excessive hunting of animals
for game, skin, ivory or horn have caused a great reduction in wildlife
population.
Besides, natural enemies like parasites and predators, various climatic
and accidental factors like floods, droughts, earthquakes and pollution
contributed greatly in limiting the wildlife population. A quarter of the earth’s total
wildlife resources which might be useful to mankind in one way or the other
would be in serious risk of extinction over the next 2-3 decades. The erosion of
wildlife resources that may threaten the very existence of human life has
awakened man to conserve it.
1.2. NEED FOR WILDLIFE CONSERVATION AND MANAGEMENT
i. Maintaining ecosystem stability. Each biotic component by virtue of
its position in food chain maintains the delicate balance of an
ecosystem. If a species is lost, in long run, it may upset the natural
balance and as a consequence makes the system vulnerable.
ii. Economic benefit. Wildlife is a source of income to recreation and
tourism industry. The most popular tourist attractions are the wildlife
sanctuaries and the National parks. Many plants have medicinal value.
For example, penicillin is obtained from Penicillium, quinine from
Cinchona, morphine from opium poppy and so on. A chemical obtained
from the skeleton of shrimps and crabs may serve as a preventive
medicine against the fungal infection.

3
iii. Tourism. Wildlife of the country may attract people from abroad and
cam foreign exchange. Trade in live as well as dead animals not only
supports thousands of people but also earn foreign exchange. For
example, the market price of rhino horn was 20,000 US $ per kg in
1990. Today, a 20 year-old crocodile easily fetches 1 lakh while even a
5 year-old has a value of nearly Rs. 30,000. Similarly, the ivory of
elephants, the glands of musk deer, the antlers of deer, etc., all
command high prices.
iv. Scientific value: Study of wildlife in biology and medicine are of direct
value for humans. For example, sea urchins have helped greatly in
understanding of human embryology, a desert toad in early
determination of pregnancy. Rhesus monkeys in presenting knowledge
of human blood groups and antlers of deer in determining the degree of
radioactive contamination of natural environment.
v. Aesthetic value. Aesthetic values such as the taste of wild berries,
softness of moss bed and refreshing fragrance of wild flowers compel us
to preserve them. A world without melodious birds, graceful beasts and
thick forest would be poorer place for humans to live in. People feel
pleasure and happiness in the presence of wildlife.
1.3. CONSERVATION AND MANAGEMENT STRATEGY Objectives for conservation and management of wildlife :
1. Maintenance of the ecological equilibrium between biotic and abiotic
components of the ecosystem.
2. Preservation of the total gene pools of the different species at the
global level.
3. Ensuring the optimum utilization of the present animal and plant
species.
To meet the aforementioned objectives the following important steps have been
proposed:
• Habitat destruction should be avoided by careful planning of urban and
other development activities.

4
• Special attention should be given to conserve the species which fall
under the category of endangered, vulnerable or rare.
• Attempts should be made at country level to identify natural habitats for
specific wildlife to be preserved.
• Proper planning of land and water utilization should be done to ensure
the protection of wildlife in their natural habitats or in man-made habitats.
• The ecosystem having endangered or vulnerable species should be
given priority with regard to their protection. The use of only such species
should be allowed which will not disturb the equilibrium of the ecosystem.
• The genetic diversity should be safeguarded keeping in mind the
international protection programmes e.g., MAB project of UNESCO and
setting up of national parks and protected areas as suggested by IUCN.
• Alternative measures should be adopted to allow the survival of a
species being exploited by a country or a community or an industry.
• Breeding programmes in captivity to raise endangered species, should
be initiated.
• Careful predator and pest control management programmes should be
designed to prevent indiscriminate elimination of non-target species.
• Public should be made aware of the value of wildlife and of the factors
that cause extinction. Stringent legal measures should be taken to
prevent the unnecessary and wasteful killing of animals.
Any conservation and management strategy, to be meaningful, should include
the following management measures:
• Protecting natural habitats through controlled exploitation of species.
• Maintaining their viable numbers in national parks, sanctuaries, game
reserves, botanical gardens, arboreta, etc.
• Survival of the most endangered species through maintenance of breed
stock in zoological parks. • Establishment of flora reserves and ecosystem reserves in the country.
• Protection through coordinated legislative measures.
Several development schemes can also be adopted simultaneously for
protection and enhancement of wildlife population:

5
1. The betterment of existing sanctuaries;
2. To create the buffer belts around the sanctuaries;
3. Imposition of restriction on export of rare animals and important plant
species;
4. Use of scientific methods of rearing for the enhancement of population
size, and;
5. Inclusion of "wildlife conservation and its benefit to the society", in
school and college/university curricula.
In order to manage natural wildlife populations successfully ecological data
pertaining to food habits, reproduction, habitat requirements, population-size
fluctuations and relationship with other species is essential.
1.4. ACTION PLAN FOR THE CONSERVATION AND MANAGEMENT OF
WILDLIFE IN THE COUNTRY
Realising the importance of wildlife resource and in order to prevent gene
erosion the steps taken for conservation and management are:
1. Formation of Bombay Natural History Society (BNHS, 1883)
2. Setting up of an Indian Board of wildlife (1952)
3. Institution of Trade Record Analysis of Flora and Fauna in Commerce
(TRAFFIC-India, 1991)
4. Enactments of various wildlife Protection Acts including the Wildlife
(Protection) Act of 1972.
5. Launching a national component of the UNESCO's Man and Biosphere
Programme (1971).
6. Becoming the Party to the CITES.
7. Starting conservation projects for individual endangered species like
Barasinga (1969), Hangul (1970), Lion (1972), Tiger (1973), Crocodile
(1975), Brow-antlered deer (1981), Rhino (1984), and Elephant (1992) .
8. Creation of National Parks, Wildlife Sanctuaries and Biosphere
Reserves.

6
WWF-International, IUCN, UNEP, ICBR IWRB, etc. arc closely concerned with
the problems of wildlife conservation at global level.
Bombay Natural History Society (BNHS). Founded in 1883. BNHS is
recognised as one of the foremost conservation research organisation in the
world. Efforts of naturalists of the organisation culminated in the establishment
of Indian Board of Wildlife (IBWL) and a network of National parks and
sanctuaries in the country.
BNHS is engaged in collection of information and specimen of flora and
fauna. It has undertaken a wide range of projects in conjunction with both local
and overseas counterpart organisations on birds, reptiles, mammals and their
natural history, and on the impact of development programmes on wildlife. The
organisation is represented on the IBWL, and on many State Wildlife Advisory
Boards.
Indian Board for Wildlife (IBWL). The Indian Board for Wildlife was first
constituted in 1952 as an advisory body under the name Central Board for
Wildlife. Later it was renamed as Indian Board for Wildlife. It works in close
cooperation with WWF and is mainly responsible for wildlife conservation with
the assistance of the central and state government. The functions of the IBWL,
among others are:
1. To devise ways and means for the preservation and control of wildlife
through coordinated legislative and practical measures;
2. To sponsor the setting up of national parks, wildlife sanctuaries and
zoological gardens;
3. To promote public interest in wildlife and the need for its preservation in
harmony with natural and human environments;
4. To advise the Government on policy in respect of export of plants and
animals;
5. To prevent cruelty to birds and beasts caught alive with or without injury.
IBWL is the main advisory body of the Government of India. At its first
meeting, the Board made a recommendation for unified legislation for wildlife

7
conservation in India. The enactment of Wildlife (Protection) Act, 1972 was the
result of this recommendation.
World Wildlife Fund-India (WWF-India). Now known as World Wide Fund for
Nature was established in India in 1969 at the XII General Assembly of the
IUCN, held at Delhi. It was founded as a branch of WWF-International formed in
1961 with its headquarters at Switzerland and is controlled by a Board of
International Trustees. It initiated specific conservation programmes in 24
countries with the important and endangered flora. Particular emphasis was on
a conservation strategy in India and protection of fragile islands.
WWF-India was founded with a Board of 8 Trustees and has its
headquarters in Bombay. With a network of 18 state and divisional offices, it is
the largest NGO of the country. WWF-India started as a wildlife conservation
�rganization and has, over the years, broadened the scope of its policy work
and field programmes to encompass conservation of ecosystems and support
the management of the country’s protected areas network.
Trade Record Analysis of Flora and Fauna in Commerce-India (TRAFFIC-India). This was instituted in 1991 as a part of TRAFFIC-International to be
based in the WWF-I headquarters, New Delhi. This division will monitor trade in
wildlife and its derivatives in the Indian context.
1.5. LEGISLATION FOR PROTECTION OF WILDLIFE
Realising the importance of wildlife resources and to prevent gene erosion
India has, from time to time, taken steps by way of enactment of various wildlife
acts. The important ones are:
• The Madras Wild Elephants Preservation Act. 1873 (State Act).
• The Nilgiris Games and Fish Preservation Act, 1879 (State Act).
• The U. P. Wild Birds and Animals Protection Act, 1912 (State Act).
• The Wild Birds and Animals Protection (Central Provinces and Berar
Amendment) Act, 1935 (State Act)
• The Jammu and Kashmir Game Preservation Act, 1941 (State Act).
• The Bombay Animals and Wild Birds Protection Act, 1951 (State Act).

8
• The Rajasthan Wild Animals and Birds Protection Act, 1951 (State Act).
• The Assam Rhinoceros Preservation Act, 1954 (State Act).
• The Assam Elephant's Preservation (Amendment) Act, 1959 (State Act).
• The West Bengal Wildlife Preservation Act, 1959 (State Act).
• The Gujarat Wild Birds and Animals Act, 1963 (State Act).
• The Punjab Wild Birds and Wild Animals Protection Act, 1963 (Delhi,
Punjab and Haryana).
• The Mysore Wild Animals and Birds Act, 1963 (State Act).
• The Goa, Daman & Diu Wild Animals and Wild Birds Protection Act,
1965 (State Act).
• Crocodile Breeding Project, 1975.
• The Wild Life (Protection) Act, 1972 (Central Act), amended in
1982.1986,1991 and 1993.
1.6. CROCODILE PROJECT Concerned over the very survival of salt water crocodile (Crocodylus
porosus) along with that of gharial (Gavialis gangeticus) and the marsh
crocodile (Crocodylus palustris). The Government of India launched “Project
Crocodile” the crocodile breeding and management project in 1975 with the
assistance of FAO/UNDP: The salt water crocodile, which grows to more than
7 metres and is restricted to coastal mangrove areas. The fresh water, swamp
crocodile, or mugger (Crocodylus palustris) is 3.5 metres, inhabits rivers, pools,
ponds, village tanks, lakes and reservoirs. The gharial (Gavialis gangeticus), an
unique long snouted fish-eating crocodilian is a riverine species of the North
Indian Himalayan fed river systems. It also occurs in Mahanandi river of Orissa.
The gharial attains a large size of more than 7 metres, and individuals of 6 to 7
metres were formerly common.
1.6.1. Reason for decline
The population of all three species has catastrophically declined as a
result of uncontrolled and all season hunting for skin, flash and sport. Loss of

9
habitats due to construction of dams, diversion of rivers and human interference
were some other factors that declined the crocodile population. The crocodile
hunting is now legally banned in India. The wild life (protection) Act, 1972 lists
both species of crocodile and the gharial under schedule 1 which affords total
protection at all times; Export 1 instruction No.46/73 forbids the export of
crocodiles and gharials, their hides, or products there from.
1.6.2. Objectives of the project The work-plan for project implementation’ comprised the following
objectives:
i) to locate the best crocodile areas within the country.
ii) collection of eggs as soon after laying as possible and transporting
them to a central protected area for hatchery incubation and rearing
the resultant young until they were of a size for release and back into
the wild.
iii) build up the required levels of technical competence in order to
achieve (ii) objective
iv) locate, set up, and manage a net work of sanctuaries in ideal habitat
for all three crocodilian species.
v) build up additional expertise not only in the operation of crocodile
sanctuaries but in the management of wild life sanctuaries throughout
the country.
1.6.3. Project implementation The project was brought into action on April 1, 1975 with the setting up of
three crocodile rearing centers. The one for the salt crocodile at Dangamal is
set on the fringe of the Bhitarkanika sanctuary in Orissa. The centers for gharial
and mugger have been set at Tikarpada, close to Similipal National Park in
Orissa and at Kukrail, Lucknow in Uttar Pradesh.
1.6.4. Sanctuary development Concurrent with the development of the husbandry centers, steps have
been taken to gazette and manage sanctuaries in ideal habitat area for all the

10
three Crocodian species into which individuals reared in and could be released
when they attain a length of 1.2 m. The first sanctuary to be gazetted in the
country were Satkoshia Gorge Sanctuary and Bhitar Kanika Sanctuary, both in
Orissa, Tristate Chambal Sanctuary of Madhya Pradesh, Rajasthan , Uttar
Pradesh and the Katernighat Sanctuary in northern Uttar Pradesh. With the
exception of Bhitar Kanika, declared for the salt water crocodile, these
sanctuaries were all for gharial, which due to its critically endangered status
was given prime attention during the early stages of the project.
An attempt was made not only to locate the best possible remaining
habitat areas, but also to demarcate biological boundaries which would ensure
that animals were protected throughout the course of any seasonal monuments
and also to apply modern management principles to these sanctuaries.
1.6.5. Crocodile husbandry A total of 23 crocodiles rearing centers have been developed in the
country in association with the project in 13 states, which have produced over
15,000 crocodiles and have reintroduced over 3,500 Indian crocodile species in
30 protected areas of the country by 1992 (H.T. 12.12.1992).
1.6.7. Sanctuary declaration Crocodilians are being managed by sanctuaries which have come up
under the project and also in existing sanctuaries and national park (such as
National Park in Gujarat). Eleven sanctuaries have been specially declared
under the project, few of which among the largest sanctuaries in the entire
country (Krishna Sanctuary in Andhra Pradesh – 3600 sq. kms and Tri-state
National Chambal Sanctuary in Uttar Pradesh, Madhya Pradesh and Rajasthan
– 5400 sq. kms). Among the various projects launched to prevent gharial, the
Chambal rearing project proved a major success. The center for herpetology,
popularly known as Madras crocodile bank is the largest in Asia started in 1976.
Andhra Pradesh has declared five sanctuaries under this project. The project
has thus secured conservation of crocodiles on a long term basis.

11
SCHEMES OF THE GOVERNMENT OF INDIA PROJECT. CROCODILE BREEDING
AND MANAGEMENT, OPERATING WITH FAOIUNDP TECHNICAL ASSISTANCE Name of Project
Nature of Project
Species
Location
Date of commence-ment
Satkoshia Gorge Gharial Scheme
Husbandry/rehabilitation
Gharial
Satkoshia Gorge Wildlife Sanctuary, Orissa
April 1975
Bhitarkanika Saltwater Crocodile Scheme
Husbandry/rehabilitation
Saltwater Crocodile
Bhitarkanika Wildlife Sanctuary, Orissa
May 1975
Kukrail National Scheme
Husbandry/rehabilitation
Gharial (extended to mugger)
Kukrail, Lucknow
1975
Chambal Sanctuary Gharial Scheme, Rajasthan
Husbandry/rehabilitation
Gharial
Kotah, Chambal River
1975
Nandankanan Captive Breeding Project
Captive breeding & husbandry
all three species
Nandankanan Biological Park, Orissa
1976
Katerniaghat Gharial Scheme
Husbandry/rehabilitation
Gharial
Katernia Ghat Wildlife Sanctuary, Bahraich.
1976
Sunderbans Saltwater Crocodile Scheme
Husbandry/rehabilitation in association with Tiger Project
Saltwater Crocodile
Sunderbans, West Bengal
March 1976
Madras Project
Husbandry/rehabilitation for release elsewhere
Mugger
Guindy Park, Madras
1976
1.7. SUMMARY
In this unit, strategy to maintain the ecological equilibrium between biotic
and abiotic components of the ecosystem and to preserve the total gene pools
of the different species at the global level and to ensure the optimum utilization
of the present animals and plant species as well as action plan for the
conservation and management of wildlife in the country are covered. Various
legislation for protection of wild life are listed The Government of India launched

12
"Project Crocodile" the Crocodile breeding and management in 1975 with the
assistance of FAO/UNDP is discussed.
1.8. KEY WORDS Wild life
Plants, animals and microbes that live independently of humans; plants,
animals and microbes that are not domesticated.
Wild life sanctuary It is dedicated to protect the wildlife, but it considers the conservation
only and also its boundary is not limited by state legislation.
Endangered species Those species that are present in such small numbers that they are in
immediate jeopardy of becoming extinct.
Protected area A geographically defined area which is designed or regulated and
managed to achieve specific conservation objectives.
Vulnerable species That’s may become endangered in the near future because populations
of the species are decreasing in size throughout its range.
CITES Convention on International Trade in Endangered Species of wild flora
and fauna. A convention which seeks to provide protection for certain species
(e.g. the peregrine against over exploitation through international trade.
BNHS Bombay Natural History Society (BMHS) founded in 1883. BNHS to
recognized as one of the foremost conservation research organization in the
world.
TRAFFIC India Trade Record Analysis of Flora and Fauna in commerce India. This was
instituted in 1991 to monitor trade in wild life and its denvatives in the Indian
context.
13
1.9. SELF ASSESSMENT QUESTIONS
1. What are the objectives for conservation and management of wildlife?
2. What managemental measures should be taken for conservation of
wildlife.
3. What are the schemes to be adopted to protect and enhance the
wildlife population?
4. Write down the action plan for conservation and management of
wildlife.
5. Write down the role of BNHS, IBWL, WWF-India. When these
organisations were established?
6. What are the objectives of Crocodile Project?
7. What is Crocodile Project and when it was implemented?
8. What were the reasons to start Crocodile Project?
9. Name the Crocodile Sanctuaries in India.
1.10. SUGGESTED READINGS
1. Aggarwal, K.C. (2000). Wildlife of India – conservation and
management. Nidhi Publishers, India.
2. Hosett, B.B. and Venkateshwarlu, M. (2001). Trends in wildlife
biodiversity, conservation and management. Daya Publishing
House, New Delhi.
3. Khoshov, T.N. (1991). Biological diversity – a case for conservation.
The Hindu Survey of Environment, Madras.
4. Tandon, P. (2005). Biodiversity-Status and Prospects. Narosa
Publications, New Delhi.
5. Saharia, V.B. (1998). Wildlife in India. Natraj Publishers, Dehradun,
India.

UNIT-IV PGDEM-02
NATIONAL PARKS, WILDLIFE SANCTUARIES AND BIOSPHERE RESERVES
Narsi Ram Bishnoi
STRUCTURE 2.0. OBJECTIVES 2.1. INTRODUCTION 2.2. NATIONAL PARKS AND SANCTUARIES 2.3. WILDLIFE SANCTURY 2.4. BIOSPHERE RESERVES 2.5. PROJECT TIGER
2.5.1. Project and its objectives 2.6. SUMMARY 2.7. KEY WORDS 2.8. SELF ASSESSMENT QUESTIONS 2.9. SUGGESTED READINGS 2.0. OBJECTIVES
After studying this unit, you will be able to understand :
• About the importance of National Parks, wildlife sanctuaries and biosphere
reserve.
• The opportunity for environmental educations training to provide
sustainable management of the available resources.
• The maintenance of viable populations of tigers for scientific, economic,
aesthetic cultural and ecological values.
2.1. INTRODUCTION
The creation of National Parks, Wildlife Sanctuaries and Biosphere Reserves
is an attempt to manage wildlife by defining protected areas. Wildlife therein is
regularly monitored and necessary management strategies for their perpetuation and

2
preservation are formulated and implemented. The Wildlife (Protection) Act, 1972
provides for setting up National Parks and Sanctuaries for protection of wildlife in
their natural environment. The basic idea for creation of such protected areas is to
provide natural habitats for the wildlife. These protected areas not only benefit
wildlife, but indirectly humans too. Their protection means the protection of entire
ecosystem which is necessary to continue to enjoy the benefits that we may now
receive from it.
2.2. NATIONAL PARKS AND SANCTUARIES
A National Park is an area dedicated to conserve the scenery (or
environment) and natural objects and the wildlife therein. In National parks, all
private rights are non-existent and all forestry operations and other usages such as
grazing of domestic animals are prohibited. However, the general public may enter it
for the purpose of observation and study. Certain parts of the park are developed for
tourism in such a way that enjoyment will not disturb or scare the animals.
The definition for National Park adopted by IUCN (1975) is as follows:
A national park is a relatively large area (a) where one or several ecosystems
are not materially altered by human exploitation and occupation, where plant
and animal species, geomorphological sites and habitats are of special
scientific, educative and recreative interest or which contains a natural
landscape of great beauty and (b) where the highest competent authority of
the country has taken steps to prevent or eliminate as soon as possible
exploitation or occupation in the whole area and to enforce effectively the
aspect of ecological, geomorphological or aesthetic features which have led to
its establishment and (c) where visitors are allowed to enter, under special
conditions, for inspirational, cultural and recreative purposes.
2.3. WILDLIFE SANCTURY
A Wildlife Sanctuary is dedicated to protect the wildlife, but it considers the
conservation of species only and also the boundary of it is not limited by state
legislation. Further, in the sanctuary, killing hunting or capturing of any species of
birds and mammals is prohibited except by or under the control of highest authority

3
in the department responsible for management of the sanctuary. Private ownership
may be allowed to continue in a sanctuary, and forestry and other usages permitted
to the extent that they do not adversely affect wildlife. The State Government may,
by notification, declare its intention to constitute any area other than area comprised
with any reserve forest or the territorial waters as a sanctuary if it considers that such
area is of adequate ecological, faunal, floral, geomorphological, natural or zoological
significance, for the purpose of protecting, propagating or developing wildlife or its
environment.
The number of National Parks (NP) and Wildlife Sanctuaries (WS) has
increased from 33 in 1952 to a total of 521 by 1997. covering an area of 148849.11
km2, i.e. 4.5 percent of the total geographical area, and around 19% of all forest
areas of the country (Table 2.1). It is proposed to increase the number of national
parks and sanctuaries to 600 covering 5 per cent of the total geographical area of
the country. Some of the important National parks and sanctuaries are listed in Table
2.2.
2.4. BIOSPHERE RESERVES
Biosphere reserves have been described as undisturbed natural areas for
scientific study as well as areas in which conditions of disturbance are under control.
They have been set aside for ecological research and habitat preservation. Ramade
(1984) described them "as the means to protect ecosystems, whether natural or
modified by human activity, in order to preserve ecological evidence for the purpose
of scientific research". Indeed, biosphere reserves are very good means for
implementation of the WCE, 1980)
Biosphere Reserve Network Programme was launched by UNESCO in 1971. The
objectives of the programme are:
• Conserve biotic diversity for ecological evidence.
• Safeguard genetic diversity for the process of evolution to act upon.
• Provide natural areas for basic and applied research in ecology and
environmental biology
• Provide opportunity for environmental education and training.
• Promote international cooperation.

4
TABLE 2.1. NATIONAL PARKS AND WILDLIFE SANCTUARIES OF INDIA
State/Union Territory National Parks Wildlife Sancturies
Number Area (sq. km) Number Area (sq. km)1. Andhra Pradesh 1 352.62 20 12084.59 2. Arunachal Pradesh 2 2468.23 9 6777.75 3. Assam 2 930.00 9 1381.58 4. Bihar 2 567.32 19 4624.30 5. Goa 1 107.00 4 335.43 6. Gujarat 4 479.67 21 16744.27 7. Haryana 1 1.43 9 229.18 8. Himachal Pradesh 2 1295.00 29 4567.92 9. Jammu & Kashmir 4 3810.07 16 10163.67 10. Karnataka 5 2472.18 20 4229.21 H Kerala 3 536.52 12 1810.36 12. Madhya Pradesh 11 6143.12 32 10847.29 13. Maharashtra 5 956.45 24 14309.51 14. Manipur 2 81.80 1 184.85 15. Meghalaya 2 386.70 3 34.21 16. Mizoram 2 250.00 3 720.00 17. Nagaland 1 202.02 3 34.35 18. Orissa 2 1212.70 17 6175.49 19. Punjab Nil Nil 6 294.82 20. Rajasthan 4 3856.53 22 5694.02 21. Sikkim 1 850.00 4 161.10 22. Tamil Nadu 5 307.86 13 2527.29 23. Tripura Nil Nil 4 603.62 24. Uttar Pradesh 7 5409.05 28 8078.52 25. West Bengal 5 1692.65 16 1064.29 26. Andaman & Nicobar 6 315.61 94 437.16 27. Chandigarh Nil Nil 1 25.42 28. Dadra & Nagar Haveli Nil Nil Nil Nil 29. Daman & Diu Nil Nil I 2.18 30. Delhi Nil Nil 1 13.20 31. Lakshadweep Nil Nil Nil Nil 32. Pondicherry Nil Nil Nil Nil
Total 80 34684.53 441 114164.58
Source: Forest Survey of India: The State of Forest Report 1995
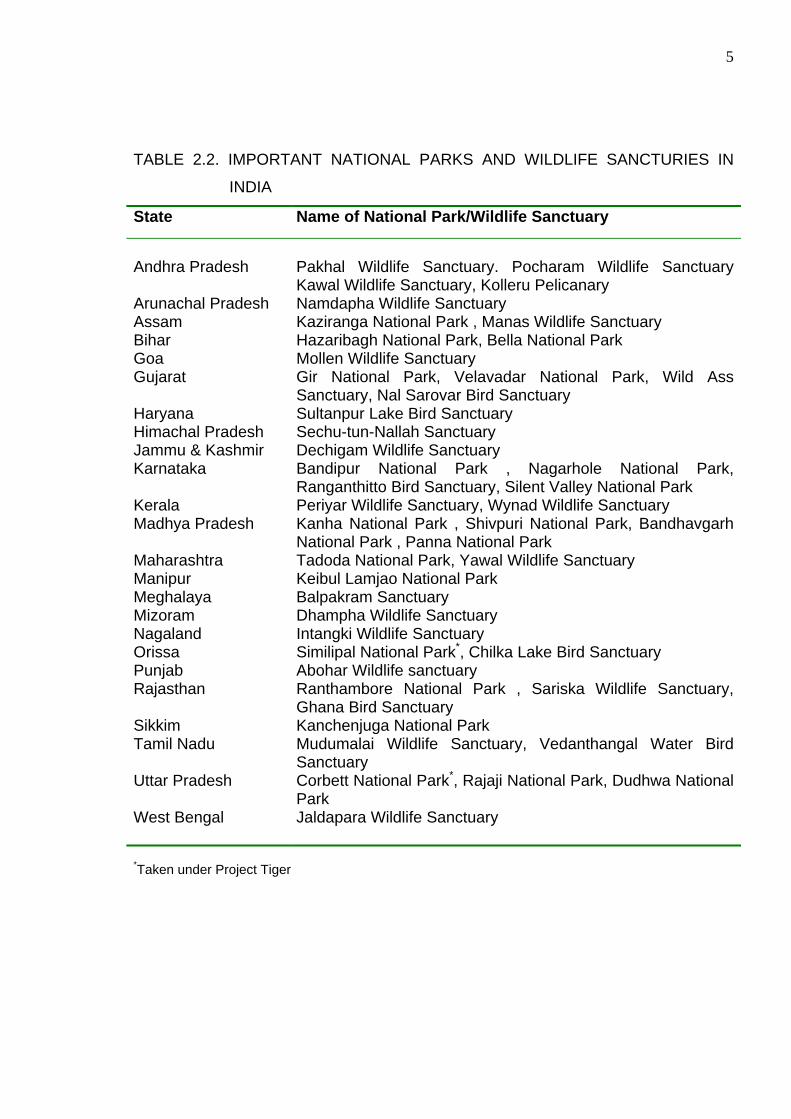
5
TABLE 2.2. IMPORTANT NATIONAL PARKS AND WILDLIFE SANCTURIES IN
INDIA
State Name of National Park/Wildlife Sanctuary
Andhra Pradesh Arunachal Pradesh Assam Bihar Goa Gujarat Haryana Himachal Pradesh Jammu & Kashmir Karnataka Kerala Madhya Pradesh Maharashtra Manipur Meghalaya Mizoram Nagaland Orissa Punjab Rajasthan Sikkim Tamil Nadu Uttar Pradesh West Bengal
Pakhal Wildlife Sanctuary. Pocharam Wildlife Sanctuary Kawal Wildlife Sanctuary, Kolleru Pelicanary Namdapha Wildlife Sanctuary Kaziranga National Park , Manas Wildlife Sanctuary Hazaribagh National Park, Bella National Park Mollen Wildlife Sanctuary Gir National Park, Velavadar National Park, Wild Ass Sanctuary, Nal Sarovar Bird Sanctuary Sultanpur Lake Bird Sanctuary Sechu-tun-Nallah Sanctuary Dechigam Wildlife Sanctuary Bandipur National Park , Nagarhole National Park, Ranganthitto Bird Sanctuary, Silent Valley National Park Periyar Wildlife Sanctuary, Wynad Wildlife Sanctuary Kanha National Park , Shivpuri National Park, Bandhavgarh National Park , Panna National Park Tadoda National Park, Yawal Wildlife Sanctuary Keibul Lamjao National Park Balpakram Sanctuary Dhampha Wildlife Sanctuary Intangki Wildlife Sanctuary Similipal National Park*, Chilka Lake Bird Sanctuary Abohar Wildlife sanctuary Ranthambore National Park , Sariska Wildlife Sanctuary, Ghana Bird Sanctuary Kanchenjuga National Park Mudumalai Wildlife Sanctuary, Vedanthangal Water Bird Sanctuary Corbett National Park*, Rajaji National Park, Dudhwa National Park Jaldapara Wildlife Sanctuary
*Taken under Project Tiger

6
• Promote appropriate sustainable management of the available biotic
resources.
• Disseminate the experience so as to promote sustainable development
elsewhere.
A protected area that can be declared as a biosphere should satisfy the following
essential criteria :
• Provides a network of protected terrestrial and coastal environments which
form a coherent system on a world scale;
• Occurs in each of the 193 biogeographical provinces of the world
distinguished in the classification of Udvardy (1975), so as to exhibit the
maximum genetic diversity;
• Shows a complete range of the different types of human interference, from
ecosystems untouched to those which have been degraded by humans;
• Structure and size should ensure the efficient conservation of the desired
ecosystems;
• Has sufficient resources available for ecological education, training and.
research to be carried on in respect to conservation of nature. If possible,
should have geographical continuity with other types of protected areas; and
• Has an adequate long-term legal protection.
As of January 1989, 274 biosphere reserves have been established in 68
countries. The list includes the 14 sites proposed as biosphere reserves in India.
These sites are; Nilgiris, Namdapha, Nanda Devi, Uttarakhand (Valley of Flowers),
North Islands of Andamans, Gulf of Mannar, Kaziranga, Sunderbans, Thar Desert,
Manas, Kanha, Nokrek, Little Rann of Kutch and Great Nicobar Island (Fig. 2.1). The
first 13 sites were identified by the National MAB Committee in 1973, the fourteenth
one, the Great Nicobar Island was added to the list in 1989. From the biospheric
point of view each of the 14 sites proposed/set up as biosphere reserves falls into
anyone of the 9 Indian biogeographical provinces: Ladakh, Himalayan highlands,
Malabar rain forest, Bengal rain forest, Indus-Ganga monsoon forest, Assam-Burma
monsoon forest, Mahanadian, Coromandel Deccan thorn forest, Thar Desert,
Lakshadweep Islands, and Andman and Nicobar Islands. The first two provinces

7
belong to the Palaearctic realm while the remaining to the Indo-Malayan (Khoshoo,
1991).
The country's first biosphere reserve came into being in 1986 in Nilgiri,
covering 5520 km2 in Tamil Nadu, Kerala and Karnataka. Table 2.3 list the biosphere
reserves set-up up-to 1997 in the country.
TABLE 2.3. BIOSHPERE RESERVES OF INDIA (Out of 14 proposed only 9 have
been declared as Biosphere Reserves)
Name of the biosphere reserve and states
Biographic zone Year of setting up
Area (million h t )Nilgiri (Karnataka, Kerala and
Tamil Nadu) Western Ghats
1986
5.520
Nandadevi (Uttar Pradesh) West Himalaya 1988 0.016 Nokrek (Meghalaya) Northeast India 1988 0.008 Manas (Assam) Northeast India 1989 0.284 Sundarbans (West Bengal) Gongetic plains 1989 0.963 Gulf of Mannar (Tamil Nadu) Coastal 1989 1.050 Great Nicobar Islands 1989 0.086 Similipal (Orissa) Deccan Peninsular 1994 0.437 Dibru Saikhowa (Assam)
Northeast India 1997 NA
Note : NA : Not available.
Source: State of India’s Environment : The Citizen’s Fifth Report. Pt. II CSE, 1999, New Delhi.
Biosphere reserves of the country qualify the essential criteria i.e. they:
• represent an ecological protectorate,
• occur in a definite biogeographic province (biosphere reserves cover 9 out of
the 12 biogeographical provinces),
• contain abundant genetic diversity (India harbours nearly 45,000 plant and
65,000 animal species),
• have complete range of human interference,
• have structure and size sufficient to ensure efficient conservation,

8
• have ample opportunities for research in ecology/environment, population,
genetics, evolutionary biology, plant-animal interaction, eco-development,
etc.,
• receive adequate long-term legal protection.
Fig. 2.1. Map showing the sites of proposed/set up Biosphere Reserves in the
country.
Basically the Biosphere Reserve consists of two zones- (i) Core zone forming
the sanctum sanctorum, and (ii) Buffer zone that concentrically surrounds the core
zone (Fig 2.2). The core zone invariably encompasses watershed areas along with
specific habitats to be conserved in its original form and therefore to be protected
from non-native or exotic plants and animals. The entry is opened only for scientists,
researchers and conservation authorities to supervise and carry on research work.
Buffer zone bears the necessary as well as inevitable

9
human stress and also meets the research, education and where possible aesthetic
needs of society too. In this zone controlled exploitation of natural resources is
possible. Besides these two zones there could be some more zones depending upon
the geographical, ecological and cultural situations, such as Forestry zone, Tourism
zone, Agriculture zone and Restoration or Reclamation zone. Sometimes, two or
more core areas are to be protected forming cluster type of biosphere reserve (Fig.
2.3)
A COMPARISON OF NATIONAL PARKS, WILDLIFE SANCTUARIES AND BIOSPHERE RESERVES
National Park (NP) Sancturay (WS) Biosphere Reserve (BR) Attention is not given on biotic community as a whole, i.e. conservation being hitched to habitat for particular wild animal species like tiger, lion, rhino, etc. The approach is not based on scientific principles. The size of NP ranges from 0.04 to 3162 km2: the usual size being between 100 and 500 km2 (in about 39%) and between 500 and 1000 km2 (in about 16%). Boundaries circumscribed by state legislation. No biotic interference except in buffer zone. Tourism is not only permissible, but often encouraged. Research and scientific management lacking. Due attention to gene pool and conservation of economic species, particularly of plants, has not been given.
Attention on biotic community not given; conservation, being species oriented, e.g. citrus, pitcher plant. Great Indian Bustard. Not based on scientific principles. Size of WS ranges from 0.61 to 7818 km2; usual size being between 100 and 500 km2 (in about 39%, between 500 and 1000 km2 (in about 24%) Limits are not sacrosanct Limited biotic interference. Permissible Lacking. Lacking
Attention is focused on biotic community as a whole, i.e. conservation being ecosystem oriented. Based on sound scientific principles. Size of BR well over 5670 km2
Boundaries circumscribed by state legislation
No biotic interference, except in buffer zone. Normally not permissible. Carried on Due attention being given to conservation of plants as well as animal species

10
Figure 2.2. Simple Biosphere Reserve
Figure 2.3. Cluster Biosphere Reserve
2.5. PROJECT TIGER
Organised poaching, trading in tiger skins and bones, pressure of growing
human population and the subsequent need for housing and agricultural expansion,
unregulated tourism and pockets of insurgency in tiger habitats are posing a serious
threat to the majestic tiger, which once roamed from Turkey to Asia's Pacific shore
and from Siberia to the island of Ball. Today, there are only 4,600 to 7,700 tigers left
in the wild.
According to World Conservation Union report, the Bali tiger disappeared in
the 1940s; there has been no sign of Caspian tiger since the early 1970s; no
confirmation of survival of the Javan tiser since 1980; the South China tiger has
become virtually extinct with scattered individuals numbering fewer than 50; almost
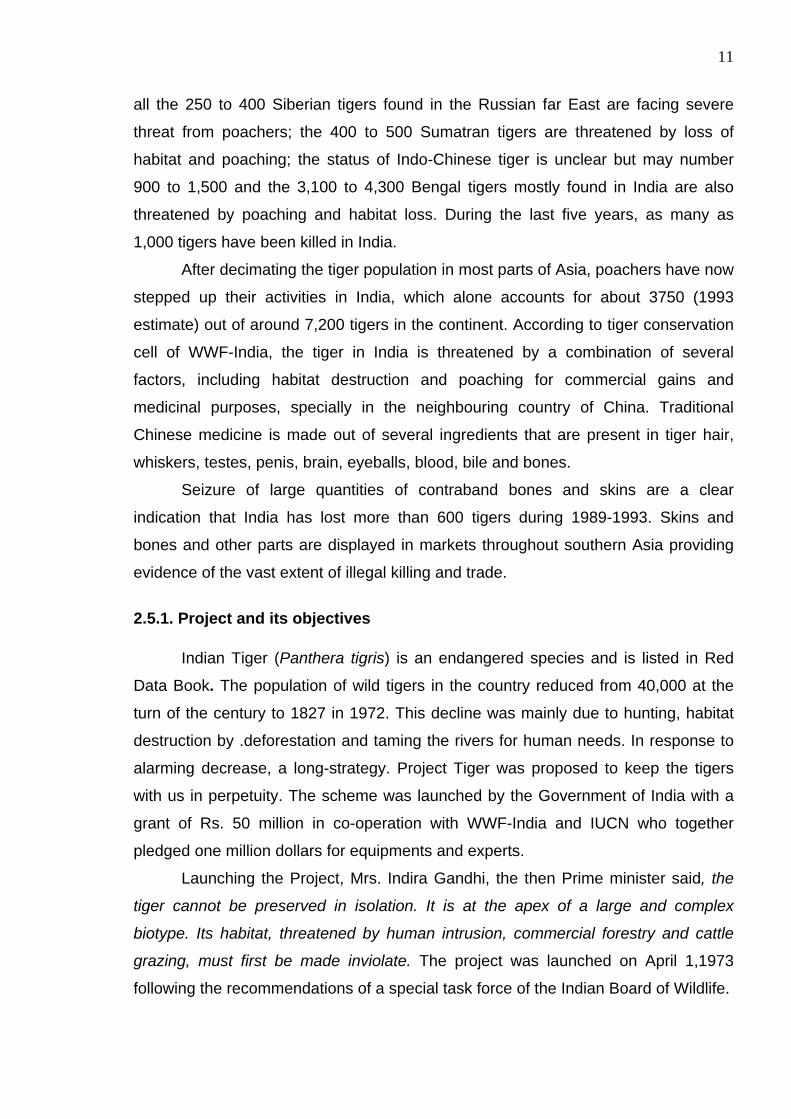
11
all the 250 to 400 Siberian tigers found in the Russian far East are facing severe
threat from poachers; the 400 to 500 Sumatran tigers are threatened by loss of
habitat and poaching; the status of Indo-Chinese tiger is unclear but may number
900 to 1,500 and the 3,100 to 4,300 Bengal tigers mostly found in India are also
threatened by poaching and habitat loss. During the last five years, as many as
1,000 tigers have been killed in India.
After decimating the tiger population in most parts of Asia, poachers have now
stepped up their activities in India, which alone accounts for about 3750 (1993
estimate) out of around 7,200 tigers in the continent. According to tiger conservation
cell of WWF-India, the tiger in India is threatened by a combination of several
factors, including habitat destruction and poaching for commercial gains and
medicinal purposes, specially in the neighbouring country of China. Traditional
Chinese medicine is made out of several ingredients that are present in tiger hair,
whiskers, testes, penis, brain, eyeballs, blood, bile and bones.
Seizure of large quantities of contraband bones and skins are a clear
indication that India has lost more than 600 tigers during 1989-1993. Skins and
bones and other parts are displayed in markets throughout southern Asia providing
evidence of the vast extent of illegal killing and trade.
2.5.1. Project and its objectives
Indian Tiger (Panthera tigris) is an endangered species and is listed in Red
Data Book. The population of wild tigers in the country reduced from 40,000 at the
turn of the century to 1827 in 1972. This decline was mainly due to hunting, habitat
destruction by .deforestation and taming the rivers for human needs. In response to
alarming decrease, a long-strategy. Project Tiger was proposed to keep the tigers
with us in perpetuity. The scheme was launched by the Government of India with a
grant of Rs. 50 million in co-operation with WWF-India and IUCN who together
pledged one million dollars for equipments and experts.
Launching the Project, Mrs. Indira Gandhi, the then Prime minister said, the
tiger cannot be preserved in isolation. It is at the apex of a large and complex
biotype. Its habitat, threatened by human intrusion, commercial forestry and cattle
grazing, must first be made inviolate. The project was launched on April 1,1973
following the recommendations of a special task force of the Indian Board of Wildlife.

12
Fig 2.4. Map showing locations of 23 Tiger Reserves in India.
Initially 9 Tiger Reserves were created in nine different states with a total area
of 13,017 km2 and tiger population of 268. These were Bandipur, Corbett, Kanha,
Manas, Melghat, Palmau, Ranthambore, Similipal and Sunderbans. Two more were
added in 1978-1979 viz., Periyar and Sariska, and subsequently four additional
reserves were created in 1982-1983 viz., Namdapha, Indravati, Nagarjunasagar and
Buxa. Three more were added later By 1993 with the addition of five more (viz.
Pench, Bandhavagarh, Tadoba-Andheri, Panna and Dampha), 23 tiger reserves
have been established in the country. The locations of tiger reserve in the country is
shown in Fig 2.4 and the estimated tiger population as per 1997 census is shown in
Table 2.4. They cover around 31,000 km2 forest area, the largest area in the world.
In effect, the entire home range of tiger in the country has been covered, viz. from
Corbett in the foothills of the Himalayas; in the north to Periyar in the southern State

13
of Karnataka; the eastern most tiger reserve is the Namdapha in Arunachal Pradesh;
and the westernmost tiger reserve is Melghat in Maharashtra. So far as the
population of tiger in reserves is concerned, there is continuous increase in tiger
population from 268 in 1973 to 1458 in 1997 as is given in Table 2.4.
TABLE 2.4. TIGER POPULATON IN 23 TIGER RESERVES OF THE COUNTRY
Name of the Reserve Tiger Population 1973 1979 1984 1989 1994 19971. Bandipur (Orissa) 10 39 53 50 66 752. Corbett (UP) 44 84 90 91 123 1383. Kanha (MP) 43 71 109 97 100 1144. Manas (Assam) 31 69 123 92 81 1255. Melghat (Maharashtra) 27 63 80 77 72 736. Palamau (Bihar) 22 37 62 55 44 447. Ranthambore (Raj.) 14 25 38 44 36 448. Similipal (Orissa) 17 65 71 93 95 989. Sunderbans (WB) 60 205 264 269 251 26310. Periyar (Kerala) - 34 44 45 30 -11. Sariska (Raj.) . 19 26 19 24 2412. Buxa (WB) - - 15 33 29 3213. Indravati (MP) - - 38 28 18 1514. NagarJunasagar (AP) - - 65 94 44 3915. Namdapha - - 43 47 47 57 (Arunachal Pradesh) 16. Dudhwa (UP) - - 80 90 94 10417. Kalakad-Mundanthurai (TN) - - 20 22 17 2818. Valmiki (Bihar) - - - 81 49 5319. Pench (MP) - - - - 39 2920. Tadoba Andheri - - - - 34 42 (Maharashtra) 21. Panna (MP) - - - - 25 2222. Dampha (Mizoram) - - - - 7 523. Bandhavgarh (MP) ' - - 41 41 46 Total 268 711 1223 1327 1366 1458
Source: The State of India’s Environment : Forestry Statistics of India, 1995, T.1. 16.11.98
More than half of the world's population, that is 3750 (1993-estimate) out of
around 7,200 tigers, resides in India (Table 2.5). The State of Madhya Pradesh alone accounts for 912 (Census 1993), which is the home of big cats. Being the largest in the population of the tigers in the world the Slate government declared itself the Tiger State. Out of the total 23 tiger reserves, 5 are located in this state.

14
The main objectives of the Project Tiger were:
(i) To ensure the maintenance of viable population of tigers for scientific,
economic, aesthetic, cultural and ecological values; and
(ii) To preserve the habitats of biological importance as a national heritage for
the benefits, education and enjoyment of the people.
The project tiger, therefore, concentrates its activities on protecting good tiger
habitats, by creating new ones and extending the existing ones. Indirectly, the
Project helps to preserve and multiply some other animal species too, such as
swamp deer, elephant, rhino, wild buffalo, hispid hare, pigmy hog, Bengal florican
and gharial. The floral diversity of the tiger reserves has also shown a significant
improvement. The Project Tiger programme has thus had a direct impact on conser-
vation of biodiversity. The tiger is super-predator and is at the apex of food chain,
and so its growth symbolises the health of natural ecosystem. Project Tiger has also
opened a control room with a site on Internet to improve the thrust of the project. The
latest tiger update of the WWF stated that the population of big cats in reserves as
well as in forests outside, in 1997, to be 3232 in 16 states. Out of these 16 states,
Madhya Pradesh recorded a maximum of 927 followed by Uttar Pradesh with 475
and Assam listing 458 (Hindustan Times 15.12.98)
The Ministry of Environment and Forest is planning to create the largest tiger
habitat in the country covering more than 5,000 km2 in central India. The Mega Tiger
Reserve is to be built by creating three new tiger reserves- Satpura, Bori and
Pachmarhi which has already been declared as tiger reserves. These new tiger
reserves would provide an important link between Melghat TR in Maharashtra and
the Kanha TR in Madhya Pradesh. With the addition of three new tiger reserves, the
country would have 26 TRs covering more than 35,000 km2 area under the Project
Tiger. Plans are also afoot to link Nagarhole NP in Karnataka to Bandipur TR to
create a bigger domain for the big cat. Pakhuri and Nameri wildlife sanctuaries in
Assam were also upgraded to the status of TRs (Times of India, 25.11.99).
However, experts feel that if we want to have about 4,000 tigers in the country
(at present we have about 3500 of which around 1600 are within TRs). then we
should have at least 60,000 km2 area under the project tiger. In the Ninth Plan, Rs.

15
75 crore (Rs. 15 crore per year) have been allocated for the project tiger (Hindustan
Times, 11.8.1999).
TABLE 2.5. STATE-WISE TIGER POPULATION IN THE COUNTRY Name of State Years % change in tiger 1989 1993 population 1. Andhra Pradesh 235 197 - 16.17 2. Arunachal Pradesh 135 180 • + 33.33 3. Assam 376 325 - 13.56 4. Bihar 157 137 - 12.74 5. Goa 2 3 + 50.00 6. Gujarat 9 5 - 44.44 7. Karnataka 257 305 + 18.68 8. Kerala 45 57 + 26.67 9. .Madhya Pradesh 985 912 - 7.41 10. Maharashtra 417 276 - 33.81 11. Manipur 31 @ 12. Meghalaya 34 53 + 55.88 13. Mizoram 18 28 + 55.56 14. Nagaland 104 83 - 20.19 15. Orissa 243 226 - 7.00 16. Rajasthan 99 64 - 35:35 17. Sikkim 4 2 - 50.00 18.l Tamil Nadu 95 97 + 2.11 19. Unar Pradesh 735 465 - 36.73 20. West Bengal 353 335 - 5.10 Total 4334 3750* - 13.47*
Source: Forestry Statistics India, 1995 @ Census could not be concluded in 1993. * Does not include tiger population in Manipur.
A Steering Committee (Project Tiger) under the Chairmanship of the Prime
Minister provides guidelines for the management of the Tiger Reserves. The Project is reviewed biannually by non-official members of the Committee and the four scientific institutions nominated for the purpose.
The Second Phase of the Project Tiger is being launched to refocus, restructure
and reformulate its strategies to save not only the tiger and its habitat but also
conserve the entire biodiversity, rich in flora and fauna. The enhanced programme
introduced in the second phase of Project Tiger includes:
(i) Establishment of guidelines for tourism in the tiger reserves;
(ii) Management of buffer areas to ensure availability of adequate firewood and
fodder for the people around the reserve.

16
(iii) Integration of the local population through ecological developmental
programmes and
(iv) Establishment of Natural Interpretation Centres.
2.6. SUMMARY
The basic idea for creation of national park, wildlife sanctuaries and
biosphere reserve is to provide natural habitats for the wildlife. In protected areas,
killing, hunting or capturing of any species of birds and mammals are prohibited.
These protected areas are used to protect ecosystems, to preserve ecological
evidence for basic and applied research in ecology and environmental biology.
The number of national parks and wildlife sanctuaries has increased from 33 in
1952 to a total of 521 by 1997. Area covered by these is 4.5 per cent of the total
geographical area.
2.7. KEY WORDS National parks
A National park is an area dedicated to conserve the environment and natural
objects and wildlife there in.
Biodiversity The variety of types of organisms, habitats, and ecosystems on earth or in a
particular place.
Biological Resources Include genetic resources, organisms or part these of, populations, or any
other biotic component of ecosystems with actual or potential use or value for
humanity.
Biosphere The planet earth along with its living organisms and atmosphere which
sustains life.
Biosphere Reserve There are described as undisturbed natural or modified by human activity
areas; in order to preserve ecological evidence for the purpose of scientific research.

17
2.8. SELF ASSESSMENT QUESTIONS
1. Define National Parks. How many National Parks are in India and what are
its area?
2. What is wild life sanctuary? How many wild life sanctuaries are in India
and which Indian State has maximum number of wild life sanctuaries?
3. Define Biosphere Reserve. What are the objectives of Biosphere
Reserve?
4. Write down the names of Biosphere Reserves in India.
5. What are the essential criteria for Biosphere Reserves?
6. Write down a comparison on National Parks, Sanctuaries and Biosphere
Reserves.
7. What are the objectives of the Tiger Project?
8. Write down the reasons for determining the tiger population.
9. Discuss in brief the Tiger Project Scheme.
10. Write down the names of Tiger Project in India.
11. Write down the state-wise population of tiger reserve in India.
12. Write down the total population both in the tiger reserve and other areas
of wildlife.
2.9. FURTHER READINGS
1. Aggarwal, K.C. (2000). Environmental laws - Indian perspective. Nidhi
Publishers, India.
2. Hosett, B.B. and Venkateshwarlu, M. (2001). Trends in wildlife
biodiversity, conservation and management. Daya Publishing House,
New Delhi.
3. Khoshov, T.N. (1991). Biological diversity – a case for conservation. The
Hindu Survey of Environment, Madras.
4. Saharia, V.B. (1998). Wildlife in India. Natraj Publishers, Dehradun,
India.