Embed Size (px)
Citation preview
Natural Radioactivity measurement and Radiological
hazards of Sand Samples used as building material in
Tiruvannamalai district, Tamilnadu, India
Y.Raghu1, A.Chandrasekaran
2, M.Selvapandiyan
3, N.Harikrishnan
4,
R.Ravisankar4*
1Department of Physics, Aarupadai Veedu Institute of Technology, Paiyanoor,
Kanchipuram-603 104, Tamilnadu, India, 2Department of Physics, SSN College of Engineering, Kalavakkam, Chennai-603110,
Tamilnadu, India, 3Department of Physics, Periyar University, PG Extension Center, Dharmapuri-
636011; Tamilnadu, India, 4Post Graduate and Research Department of Physics, Government Arts College,
Thiruvanamalai-606603, Tamilnadu, India. *Email: [email protected]; Tel: +91-9840807356
Abstract
Objectives: To study the naturally occurring radioactivity level of the sand samples
and its radiological hazards while it is used as a building construction material.
Materials and methods: Fifteen sand samples were collected from different sand
quarries from Tiruvannamalai district for the purpose of investigation of natural
radioactivity measurement and their associated radiation hazards using gamma-ray
spectrometry system.
Results: The activity concentrations of 226
Ra, 232
Th and 40
K in sand samples were
measured using NaI (Tl) detector and it is found that mean activity concentrations that 226
Ra is lower by a factor of 7.66 and 40
K is lower by a factor of 1.03 while 232
Th is
higher by a factor of 3.98 226
Ra, 232
Th and 40
K when compared with world average
values. The radiological hazards associated with the sand samples were computed
using radiation indices to assess its suitability for building constructions. Results
showed that the investigated sand can be used in construction of dwellings in the
study area.
Conclusion: The studied sands in this works are recommended for building
constructions without any radiological sequences. This analysis will be very much
useful to assess the radiation hazards in sand used as building material in dwelling and
it is an initiate step to obtain database as well as radiological map of the area at stake.
Key words: Gamma-ray spectrometry, activity concentration, radiation hazards
1. Introduction
International Journal of Materials Science ISSN 0973-4589 Volume 12, Number 2 (2017) © Research India Publications http://www.ripublication.com
335
Human population is always exposed to ionizing radiation from natural
sources. Natural radioactivity is widespread in the earth environment and it exists in
various geological formations such as earth crust, rocks, soils, plants, water, air and
also traces level in construction materials, which may contribute significantly towards
an increased radiation dose received by human beings [1-2].
Building materials are the main source of indoor gamma radiation, besides
terrestrial and cosmic radiation [2]. Measurement of natural radioactivity in different
types of building materials was reported by many authors in different parts of the
world [1-7].
Among the various building materials, sand (riverbed) is one of the essential
and important materials for building constructions in different parts of the world and
also in India. In Tamilnadu it is frequently used as binder in cement for construction
purposes. A considerable amount of natural radionuclides can be found in sand as the
end result of fertilizer washing, industrial activities and human activities [8].
Building and industrial materials like sand contribute to environmental
radioactivity in two ways. First, by gamma radiation mainly due to 226
Ra, 232
Th, 40
K
and their progenies to a whole body dose and in some cases by beta radiation to a skin
dose, and secondly by releasing the noble gas radon, its radioactive daughters, which
are deposited in the human respiratory tract [9].
Based on the above discussion, it is expected that ionizing radiation from sand
due to the natural radionuclides. Knowledge of natural radioactivity present in sand
(river beds) enables one to assess any possible radiological hazard to mankind. The
main goal of the present work is to study the naturally occurring radioactivity level in
sand samples and its relevant dose and radiological hazards while it is used as a
building construction material.
2. Materials and Methods
2.1. Sample collection and preparation
Fifteen sand samples of different locations in and around Tiruvannamalai Dist
of Tamilnadu were collected from sand quarries and river beds and were prepared by
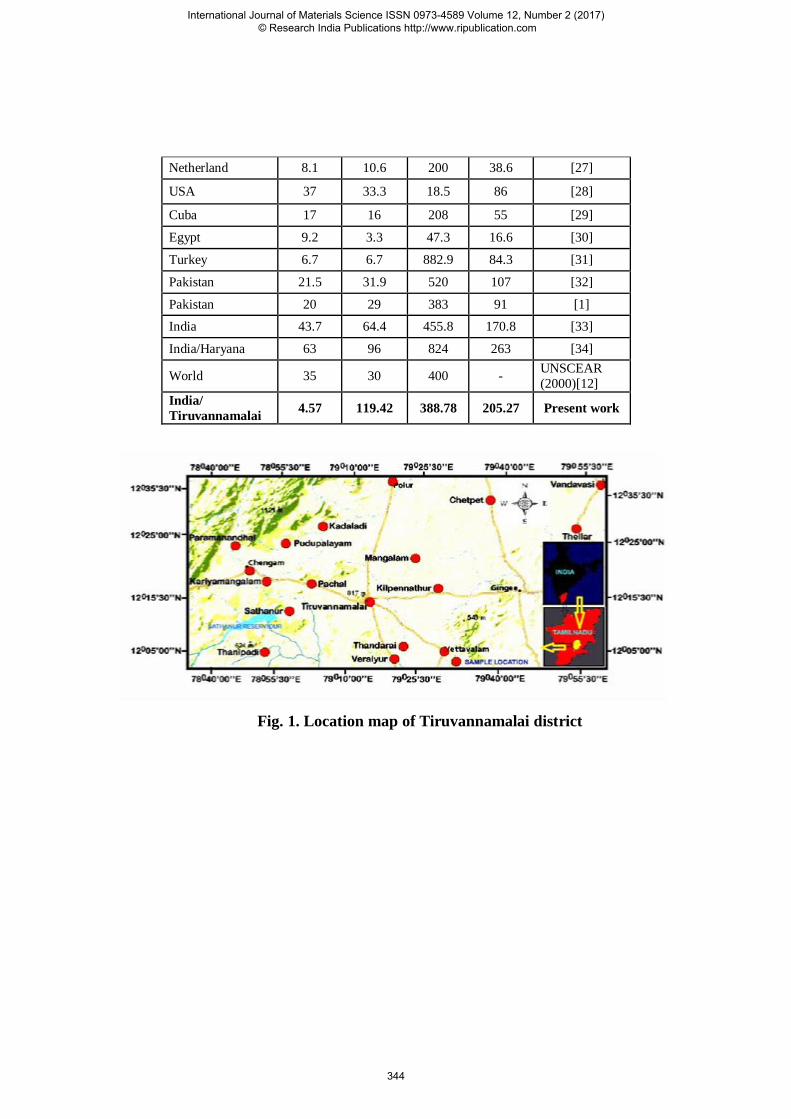
a standard method of IAEA Technical Report 295 [10]. The location map of the study
area is shown in Fig 1. Samples were cleaned and grounded into powder form using a
ball mill grinder machine. Samples then were dried in the oven at 110ºc until the
sample weight became constant. Samples were left to cool at room temperature and
fine quality was obtained using a scientific sieve of 150 micron mesh to obtain
uniform size particles. All the samples were sealed in radon-impermeable plastic
containers. The samples were then stored for more than 40 days to bring 222
Rn and its
short-lived daughter products into equilibrium with 226
Ra [11].
2.2. Gamma ray Spectroscopic Analysis
All the selected samples were subjected to gamma spectral analysis with a
counting time of 20,000 secs. A 3" x 3" NaI(Tl) detector was employed with adequate
lead shielding which reduced the background by a factor of about 95%. The
concentrations of various nuclides of interest were determined in Bq Kg-1
using the
count spectra. The samples were then counted in the same source-to-detector
geometry used for the establishment of the efficiency calibration. The spectra were
acquired for 20,000 sec and the photo peaks were evaluated by the MCA software.
International Journal of Materials Science ISSN 0973-4589 Volume 12, Number 2 (2017) © Research India Publications http://www.ripublication.com
336
The gamma- ray photo peaks corresponding to 1.46 MeV (40
K), 1.76 MeV (214
Bi) and
2.614 MeV (208
Tl) were considered in arriving at the activity of 40
K, 226
Ra and 232
Th
in the samples. The detection limit of NaI (Tl) detector system for 40
K, 226
Ra and 232
Th are 8.5, 2.21 and 2.11 in Bq Kg-1
respectively for a counting time of
20,000 secs. [6].
3. Results and Discussion
3.1. Specific activity concentration
The activity concentrations of the detected radionuclides of 226
Ra 232
Th and 40
K in 15 sand samples from different locations of Tiruvannamalai district are
tabulated in 2nd
, 3rd
and 4th
column of Table 1. The highest values observed for the
specific activities of 226
Ra, 232
Th and 40
K are 15.33 (SA-6), 358.56 (SA-1) and 633.94
(SA-1) in Bq Kg-1
respectively while the lowest values of the same radionuclides are
≤ 2.21 (BDL), 12.99 (SA-12) and 262.11 (SA-10) in Bq Kg-1
respectively. It was also
found that the arithmetic mean activity concentrations of 226
Ra, 232
Th and 40
K are
4.57, 119.42 and 388.78 in Bq Kg-1
respectively. To compare the values of mean
activity concentrations of 226
Ra, 232
Th and 40
K of the present study with the world
average values (which are 35, 30 and 400 in Bq Kg-1
) [12], 226
Ra is lower by a factor
of 7.66 and 40
K is lower by a factor of 1.03 while 232
Th is higher by a factor of 3.98.
3.2. Radium equivalent activity (Raeq)
The distribution of 226
Ra, 232
Th and 40
K in the sand samples was not uniform.
With respect to the radiation exposure, the radioactivity has been defined in terms of
radium equivalent activity Raeq in Bq Kg-1
to compare the specific activity of
materials containing different amounts of 226
Ra, 232
Th and 40
K.
The Raeq is related to the external gamma dose and the internal dose due to
radon and its daughters [13]. It was calculated through the following relation [14]. Raeq Bq Kg−1 = ARa + 1.43ATh + 0.077AK -- (1)
Where ARa, ATh, and AK are the activity concentrations in Bq Kg-1
of 226
Ra, 232
Th, and 40
K, respectively. It may be noted that 238
U has been replaced with decay
product 226
Ra because there may be disequilibrium between 238
U and 226
Ra. While
defining Raeq activity according to the above equation, it has been assumed that 10
Bq of 226
Ra, 7 Bq of 232
Th, and 130 Bq of 40
K produce the same gamma doses [15].
The estimated Raeq activity for all investigated sand samples is given in the 5th
column of Table 1. The lowest and higher values of Raeq are 59.11 (SA-12) and
561.55 (SA-1) in Bq Kg-1
with an average of 205.27 Bq Kg-1
.
The values of Raeq in building materials must be less than the 370 Bq Kg-1
for
safe use [16-18]. All the values of Raeq for the present study (except SA-1) showed
lower than recommended safety value and do not pose any radiological hazard when
used for the construction of buildings.
Table 3 is used to compare the activity concentrations and radium equivalent
activities (Bq Kg-1
) of sand samples between the present study and different areas of
the world.
3.3. The absorbed gamma dose rate (DR)
The outdoor absorbed dose rate (nGy h-1
) in air from terrestrial gamma
radiation at 1m above the ground is calculated after applying the conversion factors
(in nGy h-1
per Bq Kg-1
) to transform specific activities ARa, ATh and AK into absorbed
International Journal of Materials Science ISSN 0973-4589 Volume 12, Number 2 (2017) © Research India Publications http://www.ripublication.com
337
dose rate. According to the formula provided by UNSCEAR[12] and European
Commission [19], the absorbed dose rate is calculated.
In the UNSCEAR and European Commission reports, the resulting dose
coefficients were found to be 0.92 nGy h-1
per Bq Kg-1
for 226
Ra, 1.1 nGy h-1
per Bq
Kg-1
for 232
Th and 0.080 nGy h-1
per Bq Kg-1
for 40
K and the formula for the absorbed
gamma dose rate can be written as: DR nGyh−1 = 0.92ARa + 1.1ATh + 0.0807AK -- (2)
Where ARa, ATh and AK are the activities of 226
Ra, 232
Th and 40
K respectively in the
units of Bq Kg-1
.
The results of absorbed dose rate for the present study are given in the 6th
column of Table 1. Its values are ranging from 56.40 (SA-12) to 445.13 (SA-1) with
an average of 166.67 in nGy h-1
. The obtained mean value of DR in the studied
samples is greater than the world average (populated-weighted) indoor absorbed
gamma dose rate of 84 nGy h-1
. This is may be due to high activity concentrations of 232
Th and 40
K in the samples.
3.4. The annual effective dose rate (HR)
To estimate the annual effective dose rates, the conversion coefficient from
absorbed dose in air to effective dose (0.7 svGy–1
) and outdoor occupancy factor (0.2)
proposed by UNSCEAR (2000) [12] were used. The effective dose rate in units of
mSv y-1
was calculated according to Arafa, (2004) [20] using the following formula.
HR (mSv y-1
) = DR (nGy h-1
) × 24 h × 365.25 d × 0.2 (outdoor occupancy
factor) × 0.7 Sv Gy-1
(conversion factor) × 10-6
HR mSv y−1 = DR nGy h−1 × 8766 × 0.2 × 0.7 × 10−6 (OR)
HR mSv y−1 = DR nGy h−1 × 0.00123 -- (3)
Where DR (nGy h-1
) is given by equation (2). The obtained values of annual
effective dose rate for all sand samples are listed in the 7th
column of Table 1. Its
values varied between 0.0694 (SA-12) and 0.547 (SA-1) with a mean value of 0.205
in mSv y-1
. The estimated mean value of HR is lower than the world average value
which is 0.45 mSv y-1
[12]. It indicated that sand samples can be used safely for
building constructions.
3.5. Criteria formula
Based on models suggested by Krisiuk et al., 1971[21] and Stranden, 1976
[22], a value of 1.5 mGy was obtained by Kreiger, 1981 [23] when evaluating the
annual external radiation dose inside dwellings constructed of building materials with
a Raeq value of 370 Bq Kg-1
. These authors later corrected their calculations by taking
into consideration a wall of finite thickness and applying a weighing factor of 0.7 [24]
to account for the presence of windows and doors.
Their results can be used as a criterion to limit the annual radiation dose from
building materials based on the formula
CF =ARa
740 Bq /kg+
ATh
520 Bq /kg+
AK
9620 Bq /kg
---(4)
Where ARa, ATh and AK are the activities of 226
Ra, 232
Th and 40
K respectively
in units of Bq Kg-1
.
The calculated CF values from the sum of the three quotients for the annual
radiation dose associated with the studied samples are given in the 5th
column of
Table 2. The criteria formula values are ranging from 0.0797 (SA-12) to 0.7554
International Journal of Materials Science ISSN 0973-4589 Volume 12, Number 2 (2017) © Research India Publications http://www.ripublication.com
338
(SA-1) with an average of 0.2762. All the studied samples are well below the
recommended maximum value (<1). This indicates that the gamma activities in the
studied sand samples do not exceed the proposed criterion level and the sand can be
used for constructions purpose.
3.6. Radiation Hazard Indices
Beretka and Mathew, (1985) [13] defined two indices that represent (i) the
external radiation hazard, Hex, and (ii) the internal radiation hazard, Hin, which are
discussed in the following section. The prime objective of these indices is to limit the
radiation dose to a dose equivalent limit of 1 mSv y-1
.
3.6.1. External radiation hazard (Hex)
The external hazard index is defined as exposure of gamma rays emitted from
radionuclides and also to assess the radiological suitability of a material. Beretka and
Mathew (13) introduced a hazard index for the external gamma radiation dose from
building materials as given below:
--- (5)
Where ARa, ATh and AK are the activities of 226
Ra, 232
Th and 40
K respectively
in the units of Bq kg-1
.
The calculated external hazard is listed in 6th
column of Table 2 and its
minimum and maximum values are ranging from 0.1596 (SA-12) to 1.5162 (SA-1)
with the mean value of 0.5543. All the values of Hex are less than unity except (SA-1)
indicating that the radiation hazard to be negligible and the studied samples can be
used for construction purposes.
3.6.2. Internal radiation hazard (Hin)
The internal hazard index (Hin) gives the internal exposure to carcinogenic
radon and its short-lived progeny and it is given by the following formula [13, 17]:
The value of Hin must also be less than unity to have negligible hazardous effects of
radon and its short-lived progeny to the respiratory organs [12]. The calculated values
of this index are given in7th column of Table 2.
It was found that the internal hazard index values are varied between 0.1596
(SA-12) to 1.5162 (SA-1) with the mean value of 0.5666. The hazard indices (Hin) in
most of the samples are less than unity (permissible level) [25]. This indicated that
studied samples can be used as a construction material in the building of houses.
Conclusion
The average specific activity concentration of 226
Ra and 40
K is lower and 232
Th
is higher in sand samples when compared with world average value. The potential
radiological hazards associated with sand samples were identified by computing
radiation indices. All the radiation indices are well below their recommended limits.
Hence the investigated sand in this study can be recommended for safe usage for
dwelling construction.
International Journal of Materials Science ISSN 0973-4589 Volume 12, Number 2 (2017) © Research India Publications http://www.ripublication.com
339
Acknowledgement
Authors are wishes to express their high gratitude and sincere thanks to
Dr. B. Venkatraman, Group Director, Health, Safety & Environmental Group, Indira
Gandhi Centre for Atomic Research (IGCAR), Kalpakkam, Tamilnadu, India for
giving permission to use the nuclear counting facility in Radiological safety division.
Our special thanks to Dr. M. T. Jose, Head, RSS, RSD, IGCAR for his keen help,
constant encouragements in Gamma ray spectroscopic measurements and also
Mr.R.Mathiyarasu, Head, RDS, RSD, IGCAR for his technical help in counting the
samples.
One of the authors (Mr.Y.Raghu) is also highly indebted to the management
of Aarupadai Veedu Institute of Technology, Paiyanoor, Tamilnadu, India for
constant encouragement and support for this research work.
Reference
[1] Faheem, M. et al. Assessment of radiological hazards due to the natural
radioactivity in soil and building material samples collected from six districts of the
Punjab province-Pakistan, Radiation Measurements, 43, (2008), pp. 1443 - 1447.
[2] Sonkawade, R.G. et al. Natural radioactivity in common building construction and
radioactive shielding materials, Atmospheric Environment, 42, (2008), pp. 2254 -
2259.
International Journal of Materials Science ISSN 0973-4589 Volume 12, Number 2 (2017) © Research India Publications http://www.ripublication.com
340
[3] Krstic, D. et al. 2007. Radioactivity of some domestic and imported building
materials from South Eastern Europe, Radiation Measurements, 42, (2007), pp. 1731 -
1736.
[4] Tsabaris, C. et al. 2007. Radioactivity levels of recent sediments in the Butrint
Lagoon and the adjacent coast of Albania, Applied Radiation and Isotopes, 65,
(2007), pp. 445 - 453.
[5] Papaefthymiou, H., and Gouseti, O. 2008. Natural radioactivity and associated
radiation hazards in building materials used in Peloponnese, Greece, Radiation
Measurements, 43, 8, (2008), pp. 1453 - 1457.
[6] Ravisankar, R. et al. 2014. Multivariate statistical analysis of radiological data of
building materials used in Tiruvannamalai, Tamilnadu, India, Applied Radiation and
Isotopes, 85, (2014), pp. 114 - 127.
[7] Raghu, Y. et al. Assessment of natural radioactivity and radiological hazards in
brick samples used in Tiruvannamalali district, Tamilnadu, India, with a statistical
approach, Health Physics, 111, 3, (2016), pp. 265 - 280.
[8] Krmar, M. et al. Correlations of natural radionuclides in sediment from Danube,
Journal of Geochemical Exploration, 100, (2009), pp. 20 - 24.
[9] Quindos, L.S. et al. 1987. Building materials as source of exposure in houses. In:
Seifert, B. Esdorn H. (Eds.), Indoor Air, Institute for water, soil and air hygiene,
Berlin, 87, 2, (1987), pp. 365.
[10] IAEA Technical Report No. 295, Measurement of radionuclides in Food and the
Environment, International Atomic Energy Agency, Vienna (1989).
[11] Ravisankar, R. et al. 2011. Measurement of natural radioactivity in brick samples
of Namakkal, Tamilnadu, India using gamma-ray spectrometry, Archieves of Physics
Research, 2, (2011), pp. 95 - 99.
[12] United National Scientific Committee on the Effects of Atomic Radiation
(UNSCEAR), Sources and Risks of Ionizing Radiation. Report to the General
Assembly with annexes, New York, United Nations (2000).
[13] Beretka, J. and Mathew, P.J. Natural radioactivity of Australian building
materials, industrial wastes and by-product, Health Physics, 48, (1985), pp. 87 - 95.
[14] Yu, K.N. et al. The assessment of the natural radiation dose committed to the
Hong Kong people, Journal of Environmental Radioactivity, 17, (1992), pp. 31 - 48.
[15] El-Arabi, A.M. 226
Ra, 232
Th and 40
K concentrations in igneous rocks from eastern
desert, Egypt and its radiological implications, Radiation Measurements, 42, (2007),
pp. 94 - 100.
[16] Ramasamy, V. et al. Natural activity concentration and radiological hazards of
Palar river sediments, Tamilnadu, India. Indian Minerals, 40, (2006), pp. 9 - 23.
[17] Orgun, Y. et al. 2007. Natural and anthropogenic radionuclides in rocks and
beach sands from Ezine region (canakkale), Western Anatolia, Turkey, Applied
Radiation Isotopes, 65, (2007), pp. 739 - 747.
[18] NEA-OECD. Exposure to radiation from natural radioactivity in building
materaials. Report by NEA group of Experts of the Nuclear Energy Agency. OECD,
Paris, France, (1979).
International Journal of Materials Science ISSN 0973-4589 Volume 12, Number 2 (2017) © Research India Publications http://www.ripublication.com
341
[19] EC (European Commission), Radiation Protection, 112-Radiological Protection
Principles Concerning the Natural Radioactivity of Building Materials. Directorate-
General Environment, Nuclear Safety and Civil Protection (1999).
[20] Arafa, W. Specific activity and hazards of granite samples collected from the
Eastern Desert of Egypt, Journal of Environmental Radioactivity, 75, (2004), pp.
315 - 327.
[21] Krisiuk, E.M. et al. A Study of Radioactivity in Building Materials, Research
Institute of Radiation Hygiene Leningrad, (1971).
[22] Stranden, E. Some aspects on radioactivity of building materials, Physics
Norvegica. 8, (1976), pp. 167 - 173.
[23] Krieger, R. 1981. Radioactivity of construction materials. Betonwerk Fertigteil
Technik. 47, (1981), pp. 468 - 473.
[24] Keller, G. and Muth, H. Natural radioadiation exposure and medical radiology.
In: Scherer, E., Streffer, Ch., Tolt, K.R. (Eds.), Radiation Exposure and Occupational
Risks, Springer-Verlag, Berlin (1990).
[25] Singh, J. et al. 2009. Comparative study of natural radioactivity levels in soil
samples from the upper Siwaliks and Punjab, India using gamma-ray spectrometry,
Journal of Environmental Radioactivity, 100, (2009), pp. 94 - 98.
[26] Malanca, A. et al. Assessment of the natural radioactivity in the Brazillian state
of Rio Grande do Norte, Health Physics, 65, (1993), pp. 298 - 302.
[27] Ackers, J.G. et al. Radiation and radon exhalation rates of building materials in
the Netherlands. Science of Total Environment, 45, (1985), pp. 151 - 156.
[28] Ingersoll, G.J. 1983. A survey of radionuclide contents and radon emanation
rates in building materials in USA. Health Physics. 45, (1983), pp. 363 - 368.
[29] Brigido Flores, O. et al. Natural radionuclide content in building materials and
gamma dose rate in dwellings in Cuba, Journal of Environmental Radioactivity,
99, (2008), pp. 1834 - 1837.
[30] Sharaf, M. et al. Natural radioactivity and radon exhalation rates in building
materials used in Egypt, Radiation Measurements, 31, (1999), pp. 491 - 495.
[31] Oktay Baykara, et al. Assessments of natural radioactivity and radiological
hazards in construction materials used in Elazig, Turkey, Radiaton Measurements, 46,
(2011), pp. 153 - 158.
[32] Tufail, M. et al. Natural radioactivity hazards of building bricks fabricated from
saline soil of two districts of Pakistan, Journal of Radiation Protection, 27, (2007),
pp. 481 - 492.
[33] Vireshkumar et al. Natural radioactivity of Indian building materials and by-
products, Applied Radiation and Isotopes, 51, (1999), pp. 93 - 96.
[34] Gupta, M. et al. Estimation of radioactivity in some sand and soil samples, Indian
Journal of Pure and Applied Physics, 48, (2010), pp. 482 - 485.
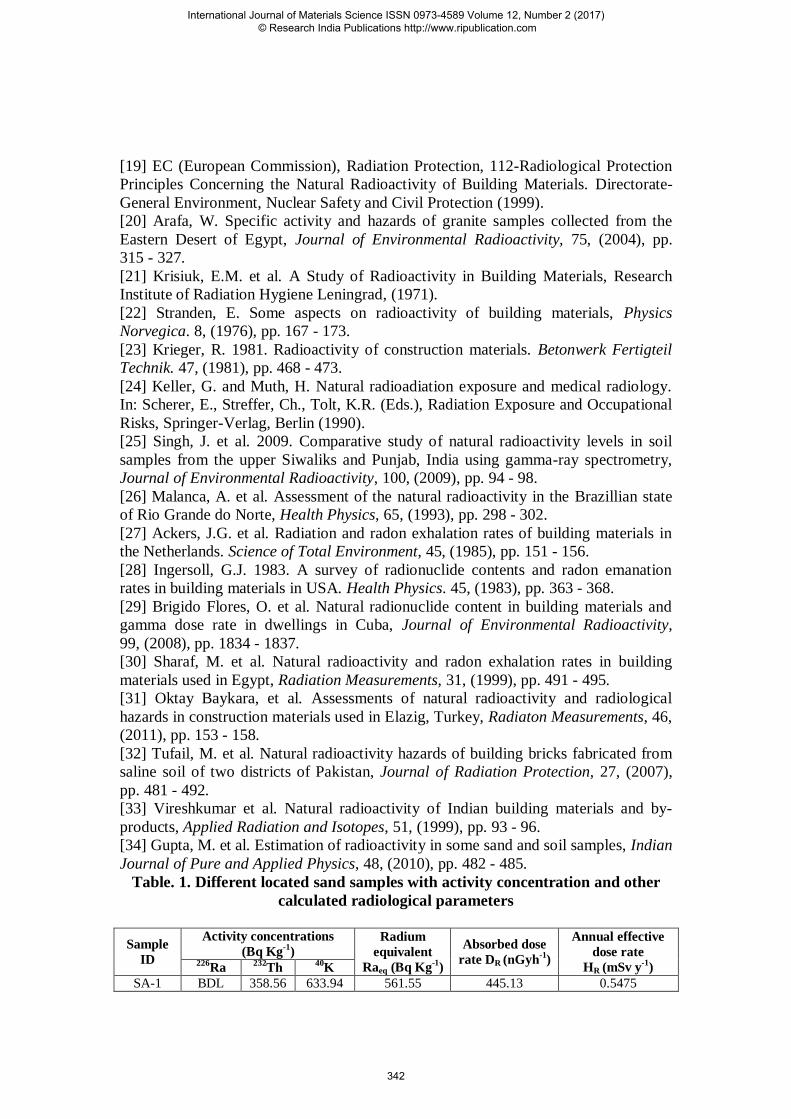
Table. 1. Different located sand samples with activity concentration and other
calculated radiological parameters
Sample
ID
Activity concentrations
(Bq Kg-1
)
Radium
equivalent
Raeq (Bq Kg-1
)
Absorbed dose
rate DR (nGyh-1
)
Annual effective
dose rate
HR (mSv y-1
) 226
Ra 232
Th 40
K
SA-1 BDL 358.56 633.94 561.55 445.13 0.5475
International Journal of Materials Science ISSN 0973-4589 Volume 12, Number 2 (2017) © Research India Publications http://www.ripublication.com
342
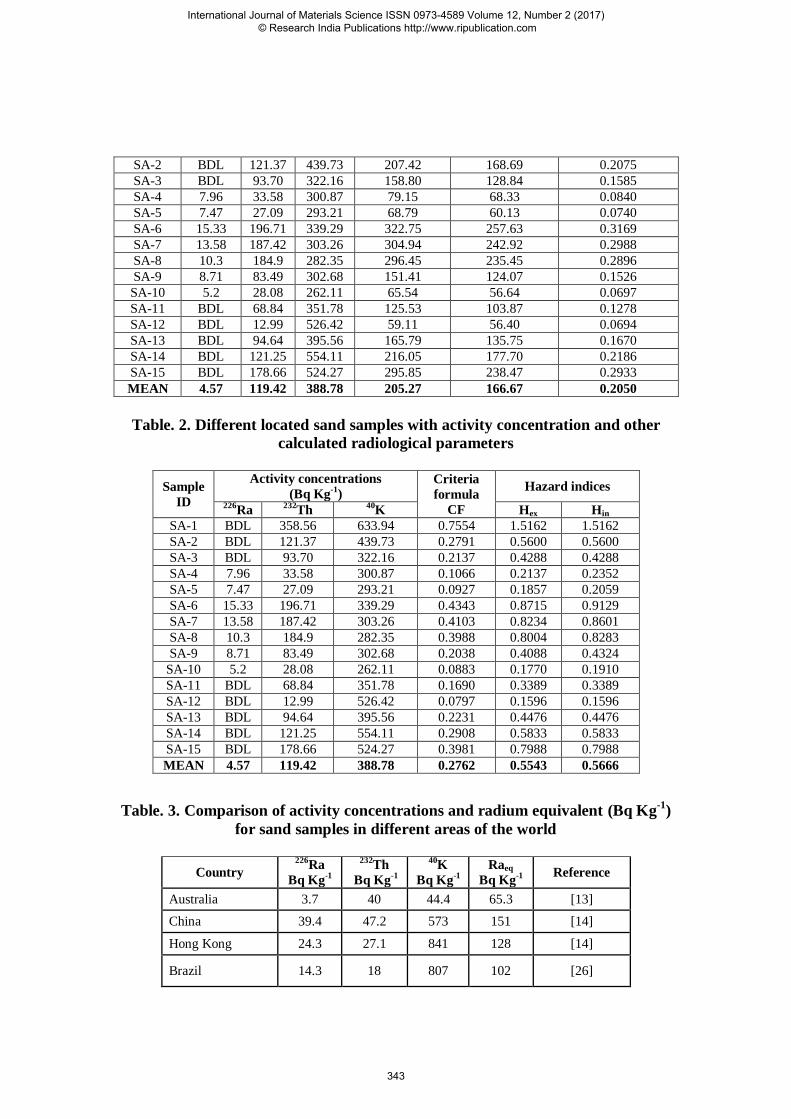
SA-2 BDL 121.37 439.73 207.42 168.69 0.2075
SA-3 BDL 93.70 322.16 158.80 128.84 0.1585
SA-4 7.96 33.58 300.87 79.15 68.33 0.0840
SA-5 7.47 27.09 293.21 68.79 60.13 0.0740
SA-6 15.33 196.71 339.29 322.75 257.63 0.3169
SA-7 13.58 187.42 303.26 304.94 242.92 0.2988
SA-8 10.3 184.9 282.35 296.45 235.45 0.2896
SA-9 8.71 83.49 302.68 151.41 124.07 0.1526
SA-10 5.2 28.08 262.11 65.54 56.64 0.0697
SA-11 BDL 68.84 351.78 125.53 103.87 0.1278
SA-12 BDL 12.99 526.42 59.11 56.40 0.0694
SA-13 BDL 94.64 395.56 165.79 135.75 0.1670
SA-14 BDL 121.25 554.11 216.05 177.70 0.2186
SA-15 BDL 178.66 524.27 295.85 238.47 0.2933
MEAN 4.57 119.42 388.78 205.27 166.67 0.2050
Table. 2. Different located sand samples with activity concentration and other
calculated radiological parameters
Sample
ID
Activity concentrations
(Bq Kg-1
)
Criteria
formula
CF
Hazard indices
226Ra
232Th
40K Hex Hin
SA-1 BDL 358.56 633.94 0.7554 1.5162 1.5162
SA-2 BDL 121.37 439.73 0.2791 0.5600 0.5600
SA-3 BDL 93.70 322.16 0.2137 0.4288 0.4288
SA-4 7.96 33.58 300.87 0.1066 0.2137 0.2352
SA-5 7.47 27.09 293.21 0.0927 0.1857 0.2059
SA-6 15.33 196.71 339.29 0.4343 0.8715 0.9129
SA-7 13.58 187.42 303.26 0.4103 0.8234 0.8601
SA-8 10.3 184.9 282.35 0.3988 0.8004 0.8283
SA-9 8.71 83.49 302.68 0.2038 0.4088 0.4324
SA-10 5.2 28.08 262.11 0.0883 0.1770 0.1910
SA-11 BDL 68.84 351.78 0.1690 0.3389 0.3389
SA-12 BDL 12.99 526.42 0.0797 0.1596 0.1596
SA-13 BDL 94.64 395.56 0.2231 0.4476 0.4476
SA-14 BDL 121.25 554.11 0.2908 0.5833 0.5833
SA-15 BDL 178.66 524.27 0.3981 0.7988 0.7988
MEAN 4.57 119.42 388.78 0.2762 0.5543 0.5666
Table. 3. Comparison of activity concentrations and radium equivalent (Bq Kg-1
)
for sand samples in different areas of the world
Country 226
Ra
Bq Kg-1
232Th
Bq Kg-1
40K
Bq Kg-1
Raeq
Bq Kg-1
Reference
Australia 3.7 40 44.4 65.3 [13]
China 39.4 47.2 573 151 [14]
Hong Kong 24.3 27.1 841 128 [14]
Brazil 14.3 18 807 102 [26]
International Journal of Materials Science ISSN 0973-4589 Volume 12, Number 2 (2017) © Research India Publications http://www.ripublication.com
343
Netherland 8.1 10.6 200 38.6 [27]
USA 37 33.3 18.5 86 [28]
Cuba 17 16 208 55 [29]
Egypt 9.2 3.3 47.3 16.6 [30]
Turkey 6.7 6.7 882.9 84.3 [31]
Pakistan 21.5 31.9 520 107 [32]
Pakistan 20 29 383 91 [1]
India 43.7 64.4 455.8 170.8 [33]
India/Haryana 63 96 824 263 [34]
World 35 30 400 - UNSCEAR
(2000)[12]
India/
Tiruvannamalai 4.57 119.42 388.78 205.27 Present work
Fig. 1. Location map of Tiruvannamalai district
International Journal of Materials Science ISSN 0973-4589 Volume 12, Number 2 (2017) © Research India Publications http://www.ripublication.com
344