Embed Size (px)
Citation preview
1
Synthesis of acyl-amide natural products using a versatile natural product biocatalyst
Supplementary Information
Piera M. Marchetti, Shona M. Richardson, Noor M. Kariem, and Dominic J. Campopiano*
Electronic Supplementary Material (ESI) for MedChemComm.This journal is © The Royal Society of Chemistry 2019

2
Materials and Methods:
TamA ANL Cloning and Expression Test
TamA was cloned from Pseudoalteromonas tunicata D2 genomic DNA. The ACP domain was deleted from the adenylation domain completely and the TamA ANL was cloned from the TamA plasmid into the pETHisTev vector (cite) using NcoI and XhoI restriction sites to yield recombinant TamA ANL with a Tobacco Etch Virus (TEV) protease cleavable N-terminal 6xHis-tag. Several constructs of differing lengths in pEHISTEV were produced (576, 581, 586 and 591 residues). The constructs were transformed into competent E. coli BL21 (DE3) cells. Test expressions were carried out on a small scale to determine optimal conditions of expression prior to large scale expression. A single colony of E. coli cells containing an expression plasmid was inoculated in 10 mL LB medium with Kanamycin and grown for ~18 h at 37 °C with orbital shaking. The optical density of the cells at 600 nm (OD600) was measured and this culture added to 250 mL LB with appropriate antibiotic for a final OD600 of 0.1. The new culture was grown to an OD600 between 0.6-0.8 at 37 °C with shaking. Sterile filtered stock solution of IPTG (0.5 M) was added to 18x 5 mL aliquots of the culture for a final concentration of 0.1 mM, 0.5 mM and 1 mM IPTG for six cultures each. Half of each of the cultures were further shaken at 16 and 30 °C respectively for 3 h, 5 h and ~18 h time points before harvesting by centrifugation at 3500 xg for 10 min. The cell pellet was resuspended in 1 mL of phosphate buffered saline (PBS) and lysed by sonication for 1.5 min (10 sec on and 10 sec off). The pellet and supernatant were separated by centrifugation at 24000 xg with a Heraeus Multifuge X3R equipped with an F15-8x50 rotor. Each fraction was tested by denaturing 12% or 15% SDS-PAGE gels run at 200 V. Optimal conditions for expression were determined and applied to large scale expression.
TamA ANL Expression and Purification
A single colony of E. coli cells containing an expression plasmid were grown in 1 LB media with Kanamycin. Once the cultures reached OD600 ~ 0.8 they were induced to express the gene using 0.1mM IPTG and left shaking at 16°C overnight. The cells were then harvested by centrifugation at 3500 xg for 10 min before being stored at -20oC. Purification was carried out on ice or at -4oC. Resuspension of the cells in the binding buffer (50 mM Tris pH 8, 250 mM NaCl, 10 mM imidazole, 10% glycerol) and lysed by sonication for 10 minutes (30 secs on and 30 secs off). This was then centrifuged at 14,000xg for 30 minutes to separate the pellets and supernatant and filtered through at 45μM filter. The cell-free extract was loaded onto a 1mL HisTrap Nickel affinity column (GE Healthcare) at 1mL/min. The column was washed with the binding buffer before eluting the protein by increasing the imidazole gradient (10 to 500mM). The fractions containing the protein were combined and dialysed with 1mg TEV against the dialysis buffer (50mM Tris pH8, 250mM NaCl and 10% glycerol) for 2h. The dialysed protein was then run through the HisTrap again to remove the cleaved HisTag, collecting the protein as flow through. The protein fractions was combined and concentrated down before loading onto a 120mL Superdex S200 gel filtration column with GFC buffer (50mM Tris pH8, 250mM NaCl and 10% glycerol). Those containing clean protein of interest were combined and concentrated for use or flash frozen at -80 °C. Purification was monitored by SDS-PAGE.

3
TamA Cloning, Expression and Purification
The tamA gene was cloned from P. tunicata D2 genomic DNA into the pEHISTEV vector to express the protein with a TEV-cleavable N-terminal 6xHis tag. This gene was expressed in 2L of BL21 (DE3) E. coli cells at 16 °C for ~18 h with 0.1 mM isopropyl β-D-1-thiogalactopyranoside (IPTG). TamA was then purified from the cell lysate using the same method described above. This includes nickel immobilized metal affinity chromatography (IMAC) followed by 6xHis tag cleavage by TEV protease. An additional step is the insertion of the 4’-phosphopantetheine (4’-PP) arm onto the ACP domain of TamA. This was done by adding the concentrated protein to 10 mL reaction containing 10 μM Sfp, 10 mM MgCl2 and 500 μM CoASH in dialysis buffer. This reaction was left shaking for 18h at 4 °C. Protein purification was then continued as before by collecting the run through of the second HisTap, removing the sfp and TEV protease, before concentrating down and loading onto the HiLoad 16/60 Superdex S200 column.
Intact Protein LC ESI-MS Bradford assay was used to determine protein concentration for liquid chromatography electrospray-MS (LC ESI-MS). Protein was diluted to a concentration of 10 μM and centrifuged for 10 min at 17000 xg. 5 μL of the supernatant was subjected to LC ESI-MS on a Synapt G2-Si Q-TOF (Waters) instrument with Phenomenex C4 3.6 μm LC column coupled to an ESI source. The LC gradient ran from 5% acetonitrile and water with 0.1% formic acid to 95% acetonitrile over 15 min. The MS source was set at 120 °C, backing pressure 2 mbar and sampling cone voltage of 54 V. Protein spectra are presented after subtraction using MassLynx V4.1 software. Peak m/z annotations were extracted from smoothed and centroided data which was also used in the component algorithm to extract the protein average masses.
TamA ANL Reactions Reactions were carried out according to the methodology of the Flitsch group.210 They contained 10 μg ANL, 1 mM fatty acid (from a 25 mM stock in DMSO), 5 mM ATP, 10 mM MgCl2 and 100 mM amine (pH 9) in 100 mM sodium carbonate-sodium bicarbonate buffer (pH 9).
Amines and Amides LC ESI-MS Amine or amide producing reactions were quenched with a 1:1 volume of acetonitrile with 0.01% TFA and centrifuged at 17000 xg. 5 μL of supernatant was subjected to LC ESI-MS on a Synapt G2-Si Q-TOF (Waters) instrument with Phenomenex Jupiter C18 5 μm 300 Å LC column coupled to an ESI source. The LC gradient ran from 5% acetonitrile and 95% water with 0.1% formic acid to 95% acetonitrile over 30 min. The MS source was set at 120 °C, backing pressure 2 mbar and sampling cone voltage of 54 V. Extracted ion chromatograms (EICs) and masses were determined on MassLynx V4.1 software.
High Performance Liquid Chromatography (HPLC) to determine conversionAmide forming reactions were quenched by addition of a 1:1 volume of acetonitrile with 0.1% TFA. Standard samples were also made up in a 1:1 volume of acetonitrile to water. The samples were centrifuged at 17000 xg for 10 min before injection of 10 μL of the supernatant onto a Phenomenex Luna 5 μm C18 100 Å HPLC column. Samples were eluted with water and 0.1% TFA for 5 min followed by a 30 min gradient to 95% acetonitrile and 0.1% TFA. This concentration was maintained for 5 min and then returned to 100% water and 0.1% TFA for an additional 5 min. The eluent was monitored at 215 nm.

4
N-Dodecanoyl-L-Histidine (N-C12-L-His) FormationNMR Spectra (1H and 13C) were recorded on an Avance III 500MHz spectrometer and DMSO-d6 was used as the solvent. J values given in Hz. MS analysis recorded on a Synapt G2-Si Q-TOF (Waters) instrument and a Bruker Ultraflex MALDI TOF.
Chemical SynthesisThere are two published methods for the synthesis of the N-acyl His molecules- (1) Lei etal., Langmuir 2010 which couples L-His and the C12 acid chloride at 10g scale (L-His). The product was recrystallized and analysed with no further purification. (2) In contrast, Torring et al, ChemBioChem 2017, used Fmoc-His(Trt)-Wang resin and coupled this with the C6, C8 and C10 fatty acids but no scale and detailed reaction conditions were given. The resulting amide was isolated by HPLC-purification using a semi-prep C18 column but no solvent conditions and yield were reported. We decided to follow the Lei et all method at ~1/10th scale.
L-Histidine (5.52mmol, 857mg) and NaOH (6.62 mmol, 265mg) were dissolved in a mixture of water (30 ml) and THF (10 ml) on ice. Dodecanoyl Chloride (5.03 mmol, 1.100 g) in THF (5 ml) was slowly added to the mixture. After 6 hours, a white precipitate had formed which was isolated and washed with water and ethanol. The reaction solution was then washed with petroleum ether (x 3), before the aqueous pH was altered to pH 5 upon which a white precipitate formed. The white precipitates were combined and recrystallized with 95% to give the final product N-Dodecanoyl-L-Histidine (90 mg g, 5.2%). δ H (500 MHz, DMSO-d6) 8.00 (d, J 7.9, 1H), 7.57 ( s, 1 H), 6.80 (s, 1 H), 4.40 (td, J 5.2 and 8.2, 1 H), 2.90 (m, 2H), 2.10 (t, J 7.4 2H),1.46 (m, 2H), 1.25 (s, 16 H), 0.86 (t, J 6.9, 3 H). δ 13C (500 MHz, DMSO-d6) 174.96, 173.67, 135.09, 52.57, 35.62, 31.76, 29.51- 22.56, 14.42. m/z (ESI) for the [M+H]+ is [C18H32N3O3] predicted: 338.24, observed: 338.3. See Figures S9, S10 and S11.
Solubility issues with product isolation
In our hands we found the N-C12-L-His product to be insoluble in a range of solvents and only partially soluble (e.g. 100% DMSO). Therefore it was not possible to prepare a sufficiently concentrated stock to use preparative HPLC to further purify the compound. Nevertheless we characterised the TamA ANL catalysed product using NMR and MS (Figures S12).
NH
OO
OH
HNNNH2
O
OH
HNN
O
Cl
+
Lauric Acid (C12)
L-Histidine
Chemical Formula: C18H31N3O3Exact Mass: 337.24

5
TamA ANL BiotransformationA scaled up reaction was attempted, which contained a total of 5 mg ANL in which 1mg was added every hour for 5 hours, 1 mM fatty acid (from a 25 mM stock in DMSO), 5 mM ATP, 10 mM MgCl2 and 10 mM amine (pH 9) in 100 mM sodium carbonate-sodium bicarbonate buffer (pH 9). Reactions were shaken at 37oC for a total of 24 hours. After 24h, a white precipitate had formed which was isolated and washed with water and ethanol. The crude white precipitate of the final product N-Dodecanoyl-L-Histidine (0.029 g, 86%). δ H (500 MHz, DMSO-d6) 8.00 (d, J 4.8, 1H), 7.57 ( s, 1 H), 6.81 (s, 1 H), 4.25 (m, 1 H), 2.93 (m, 2H), 2.06 (t, J 7.4 2H), 1.50 (m, 2H), 1.25 (s, 16 H), 0.86 (t, J 6.8, 3 H). m/z (MALDI) for [M+H]+ is [C18H32N3O3] predicted: 338.24, observed: [M+H]+ 338.239, 339.242 and 340.244
Supplementary Figures:
GAMECEASSLIDLLAFDARNKPSQEVFRFVSDNGESEASYDYQTLSQEISRIAIGLQALIKT 60
SHNQDQALIVLPQGVQFVTAFYGCMAANVIAVPSFPPKSQLQIERLQFAITDLGNPIVITNR 122
DILPKLQEHIALDSVRWLLIEDLASVIAQPLSDFRTHEHSIALLQYSSGTTGKPKGVIITNQ 184
NIMENSELIRQSFGHKEDHTRMMLWLPPHHDMGLVGGVMQGVYTGYPTLLMPTDLFLRSQYR 146
WLKAVSDYRATTTGAPNFAYELAVKNIRESRLAELDLSSLENLFCGAEPINSHSINQFLDKF 308
APCGLKPEAFLPCYGMAEATLMVSGKPHGQQYKQLCIDEPLLKHGMVKPLNTPNAHSLWLVS 370
SGVVHSSLQARIVNPETGTEVAQGQVGEIWLQGSSISPGYWQDAERTAINFGLPLAGYEETF 432
HRTGDLGFYHQDELFITGRLKEVVIIRGANFYPQDLEYETTLAFPELNNCRSAAFSVPKEGK 494
EQLIMAIEVPRNVTEFNQYAKILNGRLVERFGIRADIILFLPRKTIKITSSGKLQRVAIKKA 556
YEEQQLPVYFQYQLQGEQIAPREVSLDISNQDSVAKWLVARVSELTGVAIAQISEHEPLTNV 618
GLDSVLAMEILFRLEQQTGVYLAPDVLYSCNTPSLLAEQIIKVAGNVAEKELNLSC 674
Figure S1: Shown here is the TamA recombinant protein sequence from pEHISTEV expression construct. The truncated TamA ANL576 sequence is shown in blue, the ANL to ACP domain linker is underlined and in red is the ACP domain.

6
TamA ANL Homology Model
Figure S2: (a) Homology model of the TamA ANL domain structure constructed with Phyre2. We compare this with the fatty acid AMP ligase (FAAL) from Legionella pneumophila (blue, Uniprot code Q5ZTD3, PDB Code 3KXW) with the adenylate intermediate bound (multi-coloured). The TamA model is rendered with ANL domain (pink), the ATP-binding P-loop (orange), the hinge region (green) and the FAAL insertion loop (red). (b) The overlayed structures were then used to identify conserved active site residues between TamA ANL and FAAL and allowed a prediction of the TamA ANL active site residues less than 4Å away from the C12 acyl-adenylate intermediate. In particular residues Ile195, Phe 199 and Phe266 are predicted to be involved in binding the acyl chain. The figures were made using Pymol Molecular Graphics System, Version 1.8.
(a)
(b)
N-Terminus
Truncated C-terminus
(where ACP domain has
been deleted)
Phe199
Ile195
Phe266
Leu331
Gly219
Gly325
Tyr324
Ala295Ile450
Thr451
Leu440
Asp439
Arg453

7
Sequence Alignment
Figure S3: TamA ANL sequence alignment with closest homologue fatty acid AMP ligase .
8
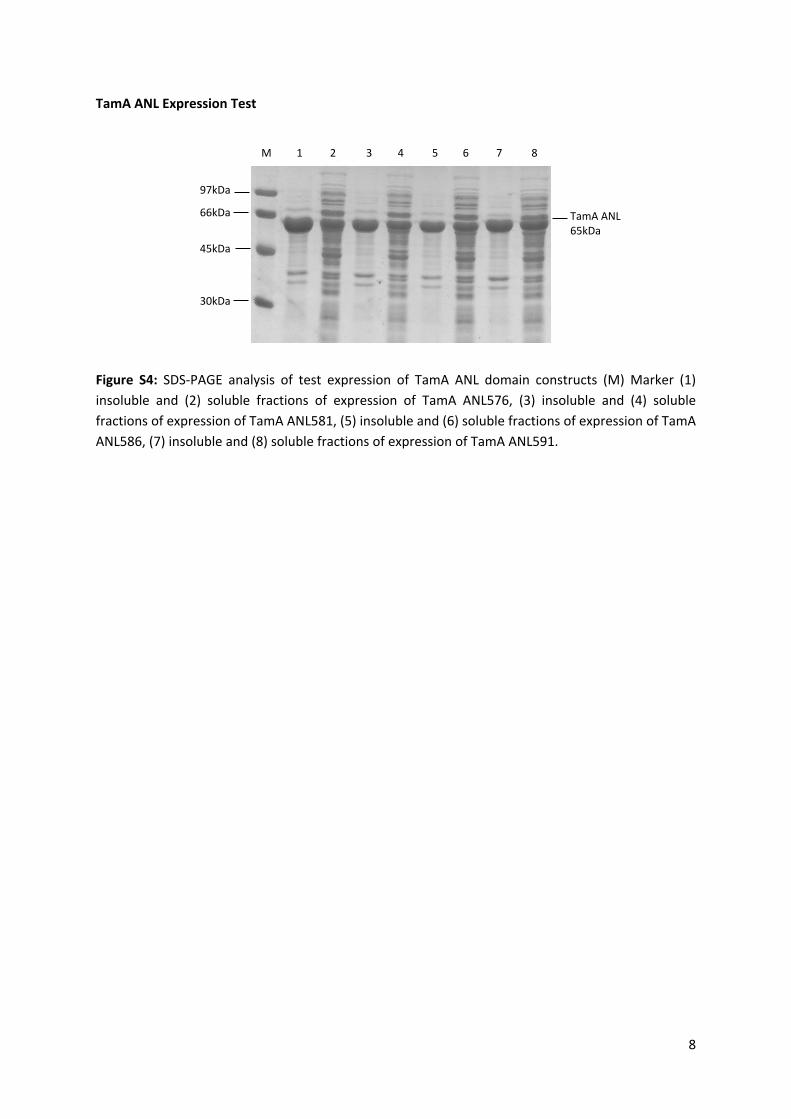
TamA ANL Expression Test
Figure S4: SDS-PAGE analysis of test expression of TamA ANL domain constructs (M) Marker (1) insoluble and (2) soluble fractions of expression of TamA ANL576, (3) insoluble and (4) soluble fractions of expression of TamA ANL581, (5) insoluble and (6) soluble fractions of expression of TamA ANL586, (7) insoluble and (8) soluble fractions of expression of TamA ANL591.
97kDa
66kDa
M 1 2 3 4 5 6 7 8
45kDa
30kDa
TamA ANL65kDa

9
TamA ANL576 Purification
Figure S5: TamA ANL576 purification (a) SDS-PAGE gel showing (M) marker, (1) insoluble and (2) soluble fractions of the cell pellet (3-6) 3mL fractions from nickel IMAC purification, (7) wash of TEV-cleaved TamA ANL, (8) elution of uncleaved TamA ANL and TEV protease (9-13) 3 mL fractions from the Superdex S200 GFC, (b) chromatogram of Superdex S200 GFC monitored at 280 nm showing peak elution at 76.3 mL consistent with the protein monomer (c) denaturing ESI-MS spectrum with a deconvoluted mass of 64653 ± 1 Da consistent with the predicted mass of 64651 Da.
0 10 20 30 40 50 60 70 80 90 100 110 1200
200
400
600
800
1000
Absorbance (mAU)
Elution Volume (mL)
97kDa
66kDa
987M 1 2 3 4 5 6 10 11 12 13
45kDa
30kDa
(a)
(b)
1255.57 (60+)
1394.47 (54+)
500 1000 1500 2000 25000
50
100
Relative Intensity (%)
m/z
1032.14 (73+)
(c)

10
TamA Purification
Figure S6: TamA purification (a) chromatogram of Superdex S200 GFC monitored at 280 nm showing peak elution at 70 mL consistent with the protein monomer (b) denaturing ESI-MS spectrum with a deconvoluted mass of 75789.95 ± 1.85 Da consistent with the predicted mass of the acylated enzymes 75270 Da + 4’-PP +C12.
500 1000 1500 2000 2500
0
20
40
60
80
100 1354.5 (56+)
1431.04 (53+)
1185.35 (64+)
m/z
Relative Intensity (%)
0 20 40 60 80 100 1200
500
1000
1500
2000Absorbance (mAU)
Elution Volume (mL)
(a)
(b)

11
C9-C14 Amide Products ESI-MS
Figure S7: ESI-MS chromatograms of TamA ANL catalysed amide synthesis with fatty acid lengths C9-C14 and ammonia.
H2N
O158.15 [M+H]+
150 200 250 300 350 400 450 500
0
20
40
60
80
100
Rel
ativ
e In
tens
ity (%
)
m/z
C9H19NO157.26
H2N
O172.17 [M+H]+
150 200 250 300 350 400 450 500
0
20
40
60
80
100
Rel
ativ
e In
tens
ity (%
)
m/z
C10H21NO171.28
H2N
O186.19 [M+H]
+
150 200 250 300 350 400 450 500
0
20
40
60
80
100
Rel
ativ
e In
tens
ity (%
)
m/z
C11H23NO185.31
H2N
O200.20 [M+H]
+
150 200 250 300 350 400 450 500
0
20
40
60
80
100
Rel
ativ
e In
tens
ity (%
)
m/z
C13H25NO199.34
214.22 [M+H]+
H2N
O
150 200 250 300 350 400 450 500
0
20
40
60
80
100
Rel
ativ
e In
tens
ity (%
)
m/z
C13H27NO213.37
228.24 [M+H]+
H2N
O
150 200 250 300 350 400 450 500
0
20
40
60
80
100
Rel
ativ
e In
tens
ity (%
)
m/z
C14H29NO227.39

12
L-C12 Amide Products ESI-MS
290.31 [M+H]+
0 500
0
20
40
60
80
100
Rel
ativ
e In
tens
ity (%
)m/z
C19H31NO289.46
NH
O
244.28 [M+H]+
0 500
0
20
40
60
80
100
Rel
ativ
e In
tens
ity (%
)
m/z
C14H29NO2
243.39
NH
OHO
NH
OO
OH314.27 [M+H]
+
0 500 1000
0
20
40
60
80
100
Rel
ativ
e In
tens
ity (%
)
m/z
C18H35NO3
313.48NH
OO
OH
HO
0 500 1000
0
20
40
60
80
100
Rel
ativ
e In
tens
ity (%
)
m/z
302.22 [M+H]+
C16H31NO4
301.43
N
OOHO
298.24 [M+H]+
0 500
0
20
40
60
80
100
Rel
ativ
e In
tens
ity (%
)
m/z
C17H31NO3
297.44
0 200 400 600 800 1000
0
20
40
60
80
100
Rel
ativ
e In
tens
ity (%
)
m/z
NH
OO
OH
S332.21 [M+H]+
C17H33NO3S331.52

13
Figure S8: ESI-MS chromatograms of TamA ANL catalysed amide formation with fatty acid length C12 with a series of amines.
338.25 [M+H]+
339.31
NH
OO
OH
HNN
0 500
0
20
40
60
80
100
Rel
ativ
e In
tens
ity (%
)
m/z
C18H31N3O3
337.46
0 500
0
20
40
60
80
100
Rel
ativ
e In
tens
ity (%
)
m/z
NH
OO
OH
HNN
338.24 [M+H]+
339.25
C18H31N3O3
337.46
14
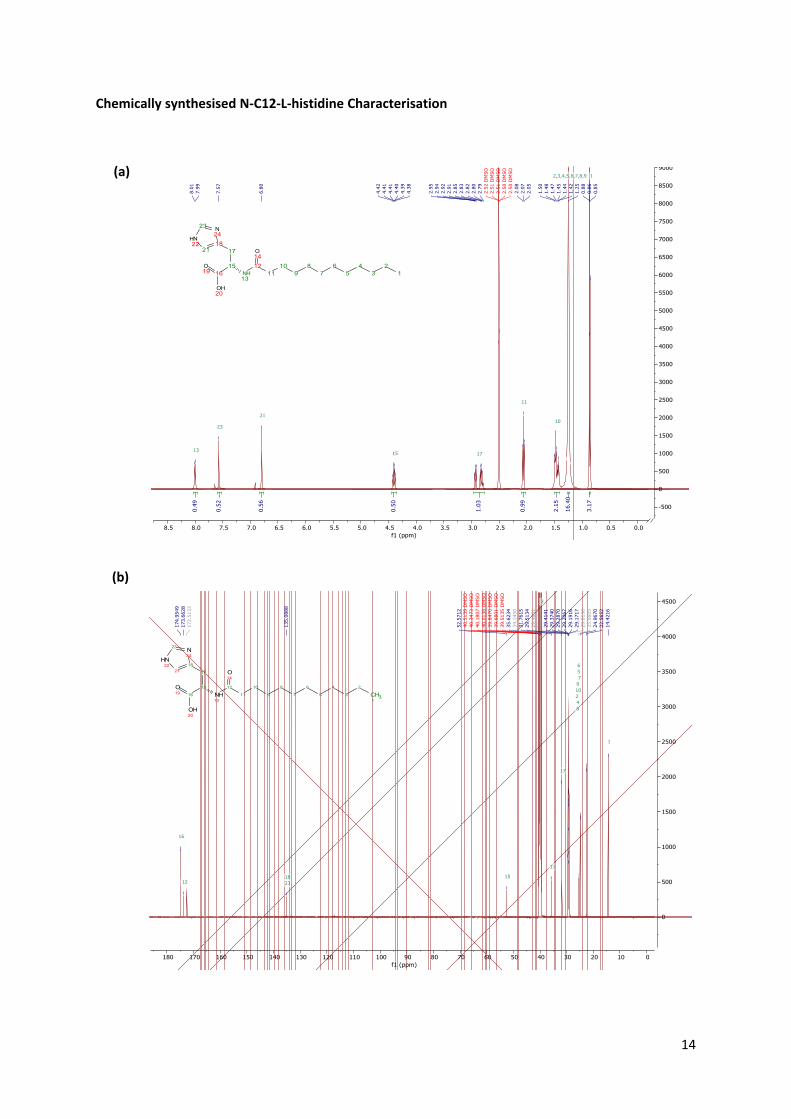
Chemically synthesised N-C12-L-histidine Characterisation
0.00.51.01.52.02.53.03.54.04.55.05.56.06.57.07.58.08.5f1 (ppm)
-500
0
500
1000
1500
2000
2500
3000
3500
4000
4500
5000
5500
6000
6500
7000
7500
8000
8500
9000
3.17
16.4
0
2.15
0.99
1.03
0.50
0.56
0.52
0.49
0.85
0.86
0.88
1.25
1.42
1.44
1.45
1.47
1.48
1.50
2.05
2.07
2.08
2.50
DM
SO2.
50 D
MSO
2.51
DM
SO2.
51 D
MSO
2.52
DM
SO2.
792.
802.
822.
832.
852.
912.
922.
942.
95
4.38
4.39
4.40
4.41
4.41
4.42
6.80
7.57
7.99
8.01
2,3,4,5,6,7,8,9 1
11
2110
23
1315 17
12
34
56
78
910
1112
NH13
O14
1516
1718
O19
OH20
21
NH22
23 N24
(a)
0102030405060708090100110120130140150160170180f1 (ppm)
0
500
1000
1500
2000
2500
3000
3500
4000
450014
.421
622
.565
224
.967
025
.660
529
.013
629
.171
729
.191
629
.206
729
.287
029
.374
029
.414
129
.461
529
.485
129
.513
431
.761
534
.145
035
.623
439
.513
5 D
MSO
39.6
801
DM
SO39
.847
0 D
MSO
40.0
138
DM
SO40
.180
7 D
MSO
40.3
473
DM
SO40
.513
9 D
MSO
52.5
712
135.
0888
172.
5133
173.
6628
174.
9549
3
842109756
1
17
16
11
1512 23
18
CH31
2
3
4
5
6
7
8
9
10
11
12
NH13
O14
15
16
17
18
O19
OH20
21
NH22
23 N24
(b)

15
Figure S9: Characterisation of N-C12-L-histidine synthetic standard
(a) 1H NMR, (b) 13C NMR, (C) Positive mode ESI Mass Spectrometry (ESI-MS).
(c)

16
HPLC Data
Figure S10: a) HPLC calibration of synthetic N-C12-L-histidine at various concentrations (0.0625-1.0 mM) prepared from a 2mM stock in 4% DMSO/96% AcCN. Each measurement was done in triplicate. b) Product conversion determined using the calibration at different time points taken during the reaction.
Time Conversion10 min 1.5 %30 min 5.6 %1 hour 9.6 %2 hours 12.6 %4 hours 12.7 %24 hours 12.7 %
(a)
(b)
0.0 0.2 0.4 0.6 0.8 1.00
200000
400000
600000
800000
1000000
1200000
1400000
HPLC Calibration curve of N-C12-L-histidine
Inte
nsity
(mA
U)
[N-C12-L-His] (mM)
Equation y = a + b*x
Plot IntensityWeight InstrumentalIntercept -2937.58138 ± 2040.92205Slope 1.26029E6 ± 7410.00688Residual Sum of Squares 54.68086Pearson's r 0.99986R-Square (COD) 0.99972Adj. R-Square 0.99969

17
Figure S11: HPLC analysis of TamA ANL reaction stopped at different timepoints.
17.5 17.6 17.7 17.8 17.9 18.0
10000
20000
Inte
nsity
(mA
U)
Time (min)
10 min 30 min 1 hour 2 hours 4 hours 24 hours
18
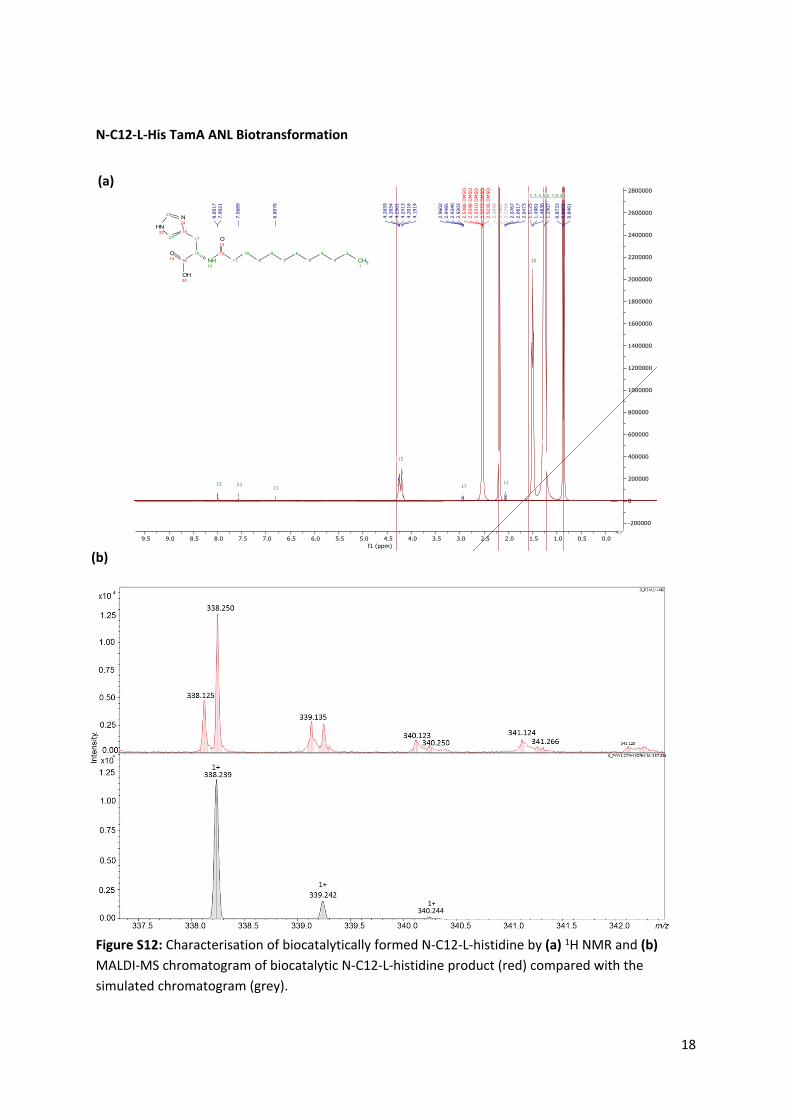
N-C12-L-His TamA ANL Biotransformation
Figure S12: Characterisation of biocatalytically formed N-C12-L-histidine by (a) 1H NMR and (b) MALDI-MS chromatogram of biocatalytic N-C12-L-histidine product (red) compared with the simulated chromatogram (grey).
(b)
340.2441+
0.00.51.01.52.02.53.03.54.04.55.05.56.06.57.07.58.08.59.09.5f1 (ppm)
-200000
0
200000
400000
600000
800000
1000000
1200000
1400000
1600000
1800000
2000000
2200000
2400000
2600000
2800000
0.84
610.
8602
0.87
33
1.25
071.
4836
1.49
811.
5125
2.04
732.
0617
2.07
672.
1754
2.19
022.
2049
2.52
36 D
MSO
2.52
72 D
MSO
2.53
10 D
MSO
2.53
48 D
MSO
2.53
86 D
MSO
2.92
032.
9340
2.94
852.
9602
4.19
144.
2016
4.24
134.
2501
4.26
544.
2659
6.80
76
7.56
89
7.99
218.
0017
2,3,4,5,6,7,8,9 1
10
15
1113 23 1721
CH31
2
3
4
5
6
7
8
9
10
11
12
NH13
O14
15
16
17
18
O19
OH20
21
NH22
23 N24
(a)
19
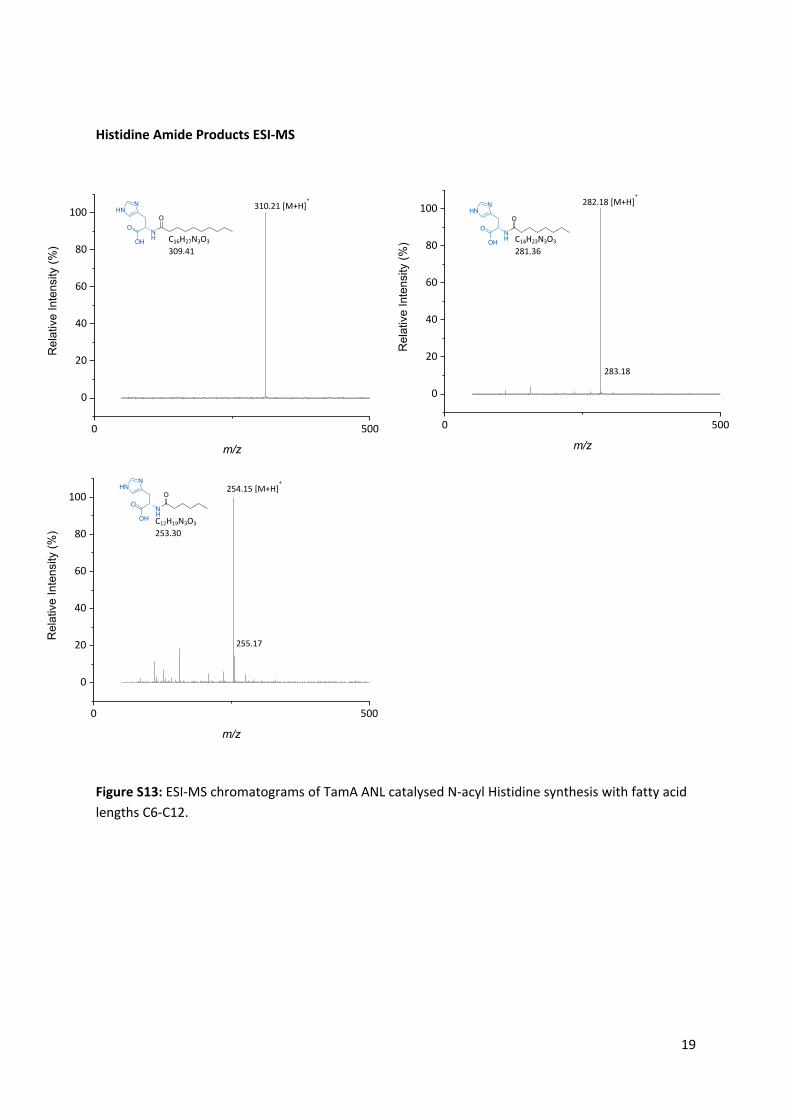
Histidine Amide Products ESI-MS
Figure S13: ESI-MS chromatograms of TamA ANL catalysed N-acyl Histidine synthesis with fatty acid lengths C6-C12.
NH
OO
OH
HNN 310.21 [M+H]
+
0 500
0
20
40
60
80
100
Rel
ativ
e In
tens
ity (%
)
m/z
C16H27N3O3
309.41
NH
OO
OH
HNN
283.18
282.18 [M+H]+
0 500
0
20
40
60
80
100
Rel
ativ
e In
tens
ity (%
)
m/z
C14H23N3O3
281.36
NH
OO
OH
HNN
254.15 [M+H]+
255.17
0 500
0
20
40
60
80
100
m/z
Rel
ativ
e In
tens
ity (%
)
C12H19N3O3
253.30
![· Indicator, IP 40 Product can differ from the current configuration. Dimensions [mm] H = Universal terminal 2.0 x 0.5 mm, L = Solder terminal, L1 = Solder terminal 2.8 x 0.5 mm](https://img.pdfslide.us/doc/110x75/5ea10d0f19728302e976ebe0/indicator-ip-40-product-can-differ-from-the-current-configuration-dimensions-mm.jpg)


![Dimensions: [mm] Recommended Land Pattern: [mm] Electrical … · 2020. 2. 26. · Dimensions: [mm] P L H W G F Properties Value Unit Tol. Pitch P 10 mm ±0.5 Length L 13 mm ±0.5](https://img.pdfslide.us/doc/110x75/6002623a85f8c02d7a3d3cbe/dimensions-mm-recommended-land-pattern-mm-electrical-2020-2-26-dimensions.jpg)