Embed Size (px)
Citation preview
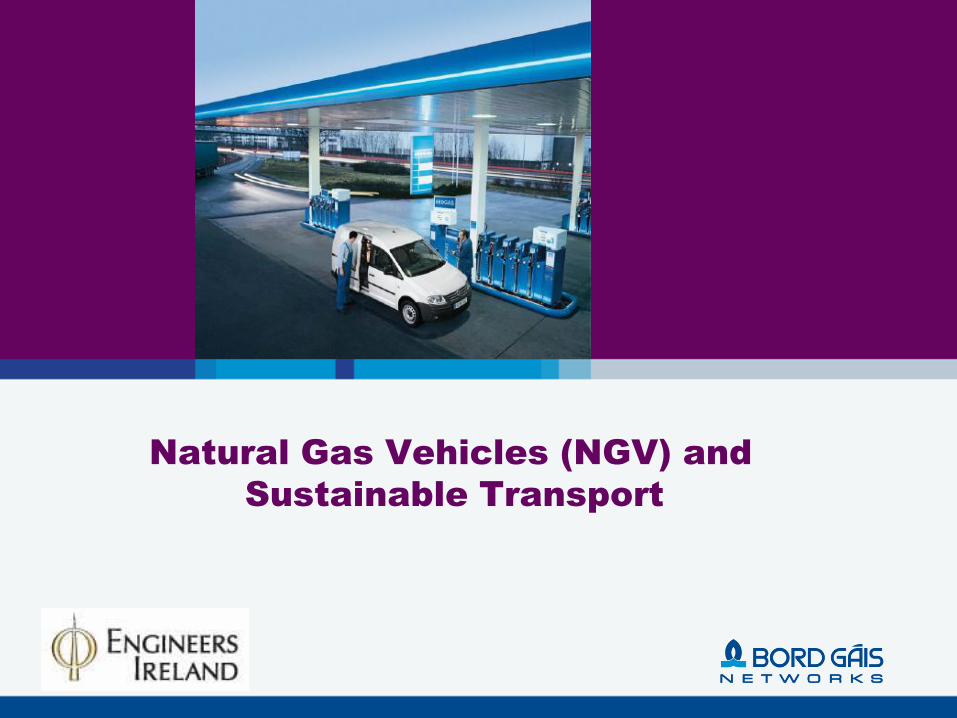
Natural Gas Vehicles (NGV) and
Sustainable Transport
2
Bord Gáis Networks
● Bord Gáis Networks develop, operate and maintain natural gas network in the Republic of Ireland
● Provide a gas transportation service to over 650,000 customers in the Republic of Ireland in more than 150 population centres
● Networks consists of 13,150km of pipelines
● Bord Gáis Networks connect all customers to the natural gas network regardless of supplier
3
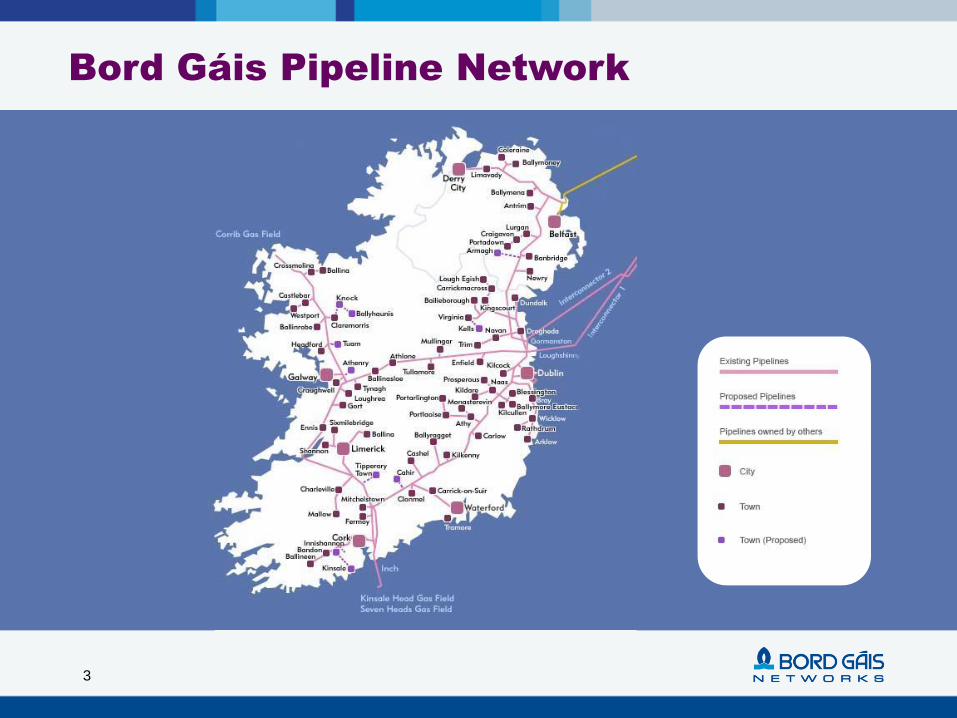
Bord Gáis Pipeline Network
4
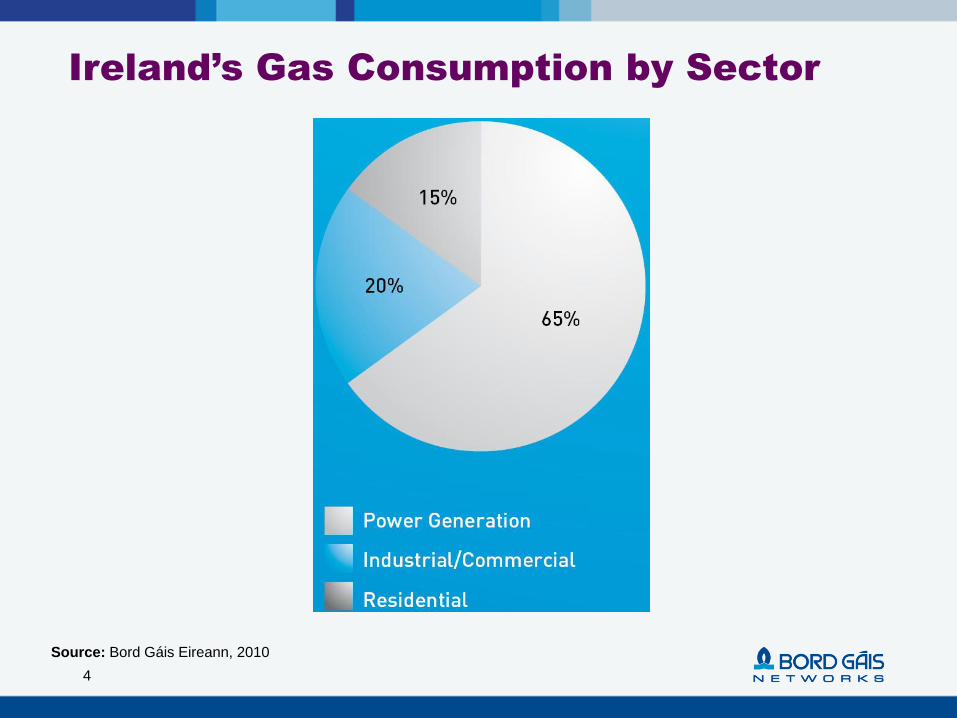
Ireland’s Gas Consumption by Sector
Source: Bord Gáis Eireann, 2010
5
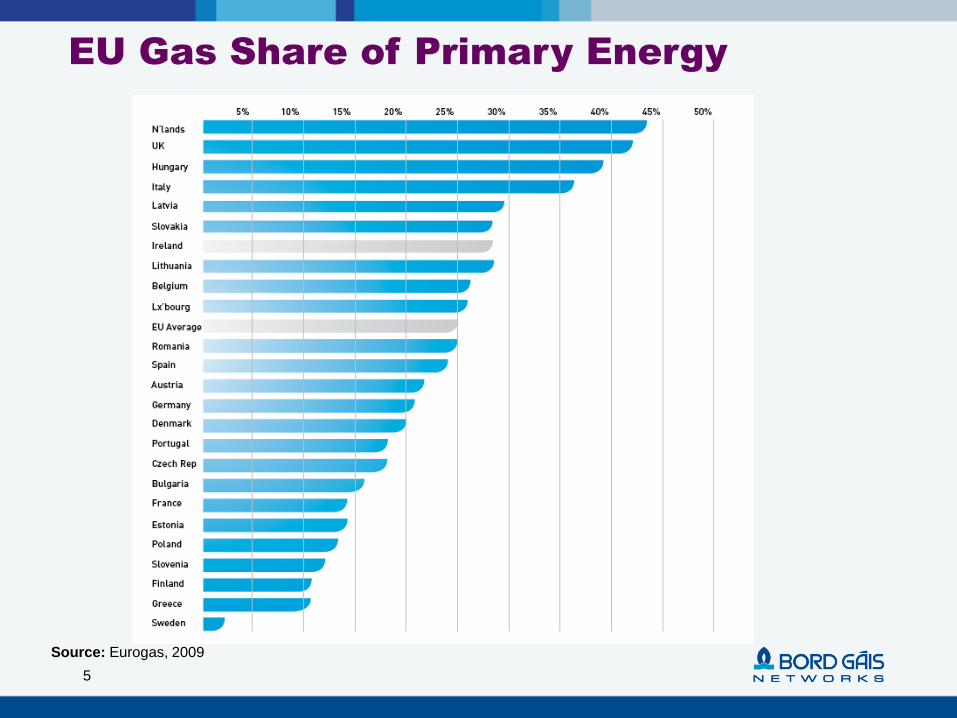
EU Gas Share of Primary Energy
Source: Eurogas, 2009
6
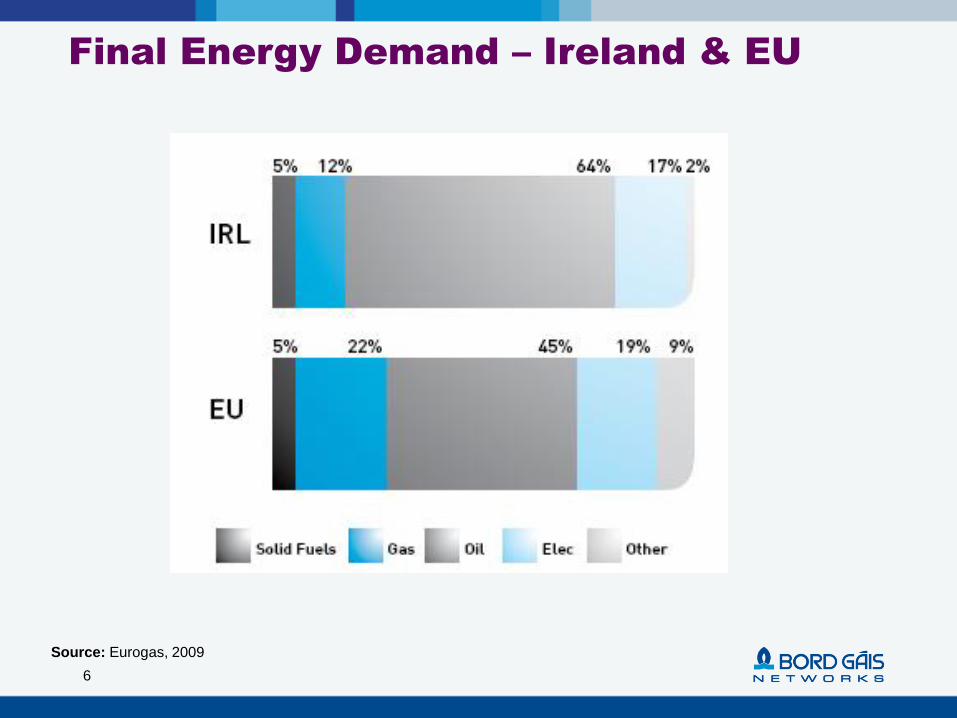
Final Energy Demand – Ireland & EU
Source: Eurogas, 2009
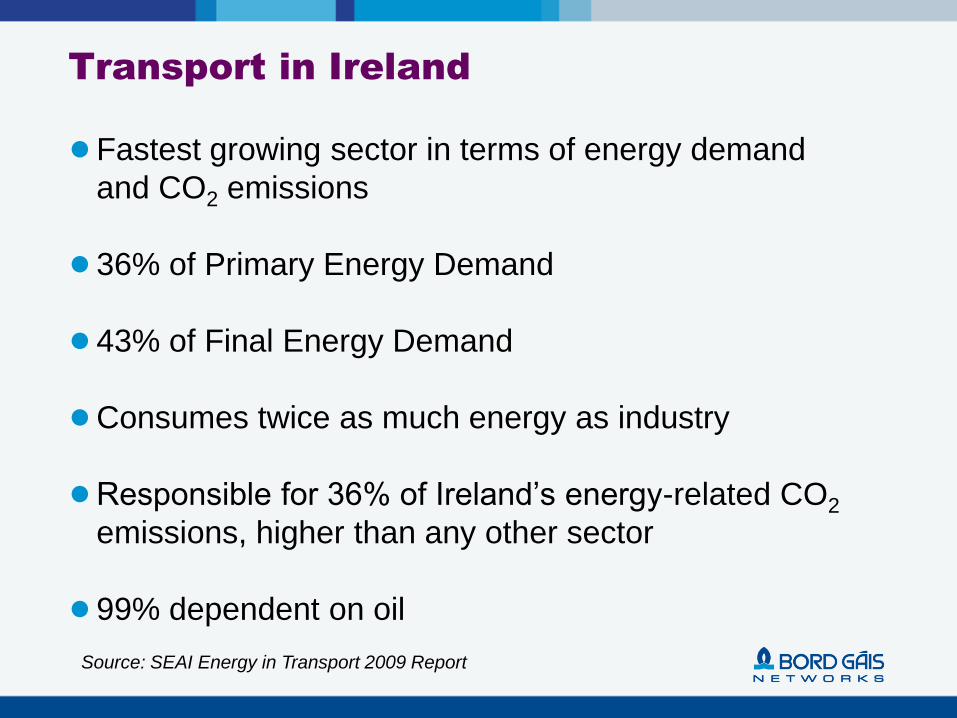
Transport in Ireland
● Fastest growing sector in terms of energy demand
and CO2 emissions
● 36% of Primary Energy Demand
● 43% of Final Energy Demand
● Consumes twice as much energy as industry
● Responsible for 36% of Ireland‟s energy-related CO2
emissions, higher than any other sector
● 99% dependent on oil
Source: SEAI Energy in Transport 2009 Report
8
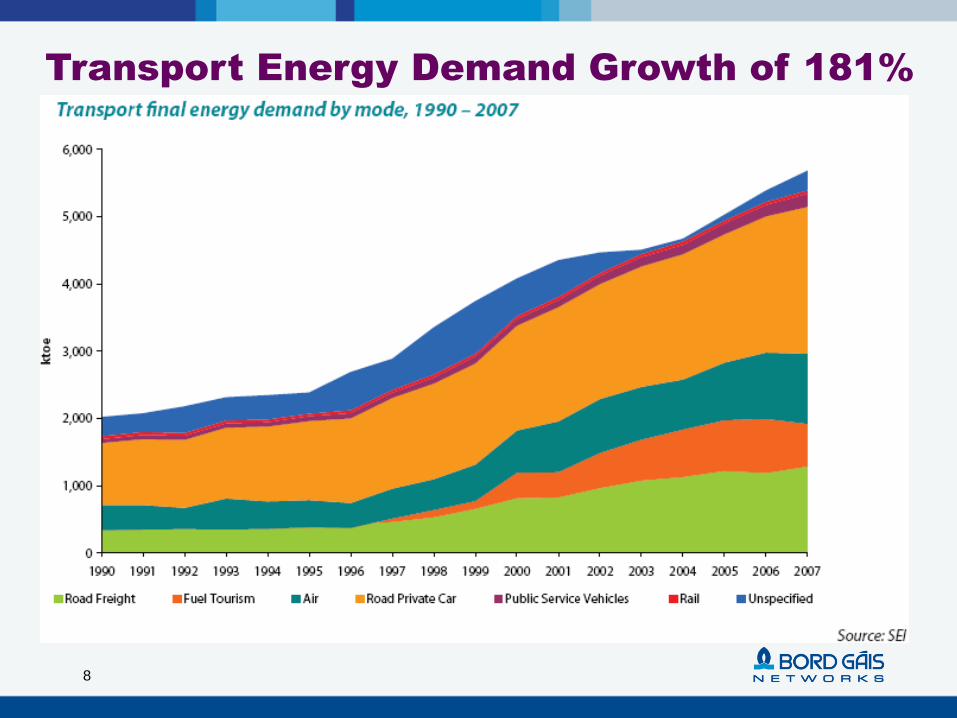
Transport Energy Demand Growth of 181%
9
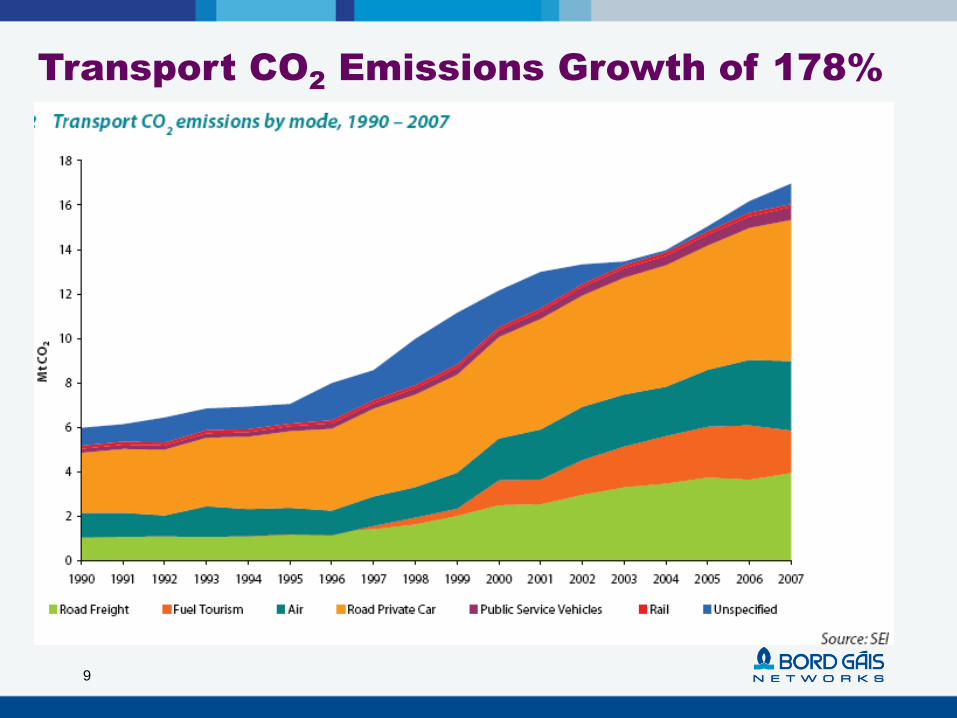
Transport CO2
Emissions Growth of 178%
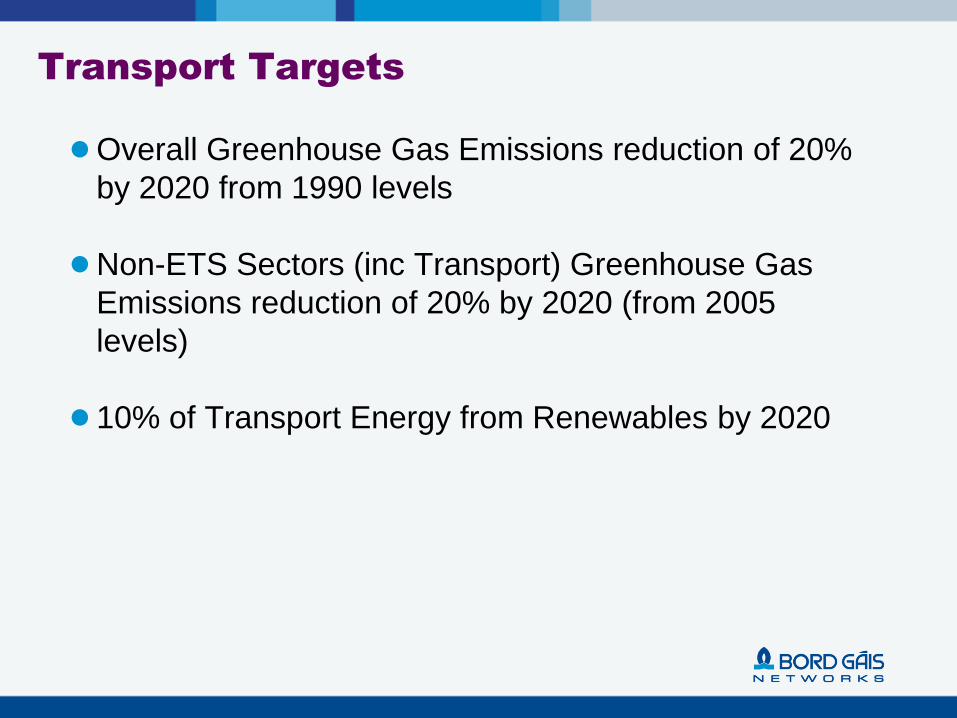
Transport Targets
● Overall Greenhouse Gas Emissions reduction of 20%
by 2020 from 1990 levels
● Non-ETS Sectors (inc Transport) Greenhouse Gas
Emissions reduction of 20% by 2020 (from 2005
levels)
● 10% of Transport Energy from Renewables by 2020
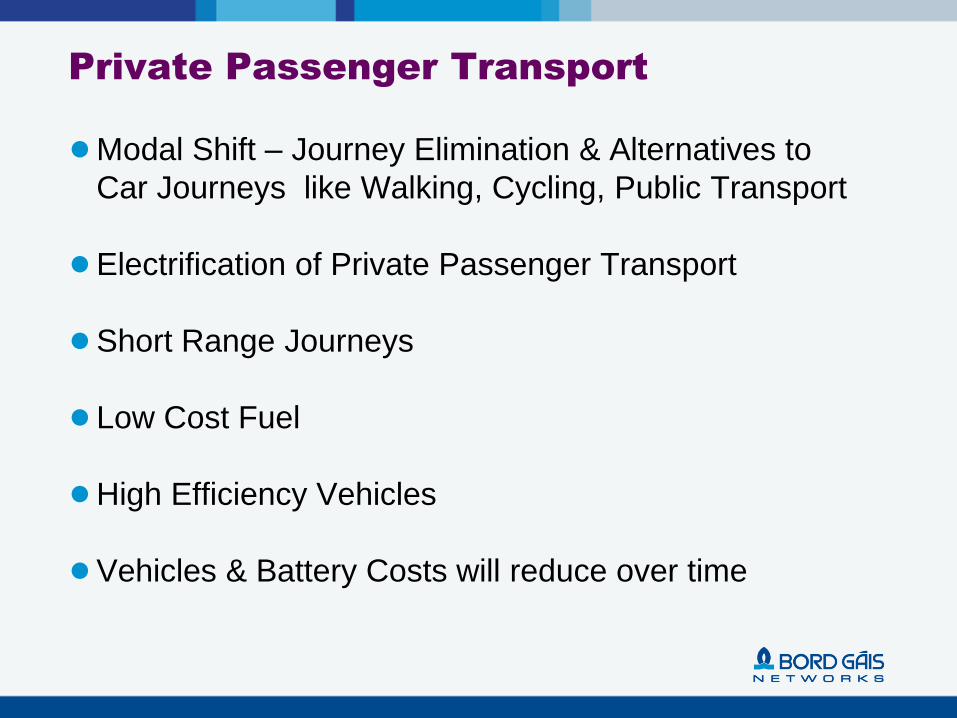
Private Passenger Transport
● Modal Shift – Journey Elimination & Alternatives to
Car Journeys like Walking, Cycling, Public Transport
● Electrification of Private Passenger Transport
● Short Range Journeys
● Low Cost Fuel
● High Efficiency Vehicles
● Vehicles & Battery Costs will reduce over time
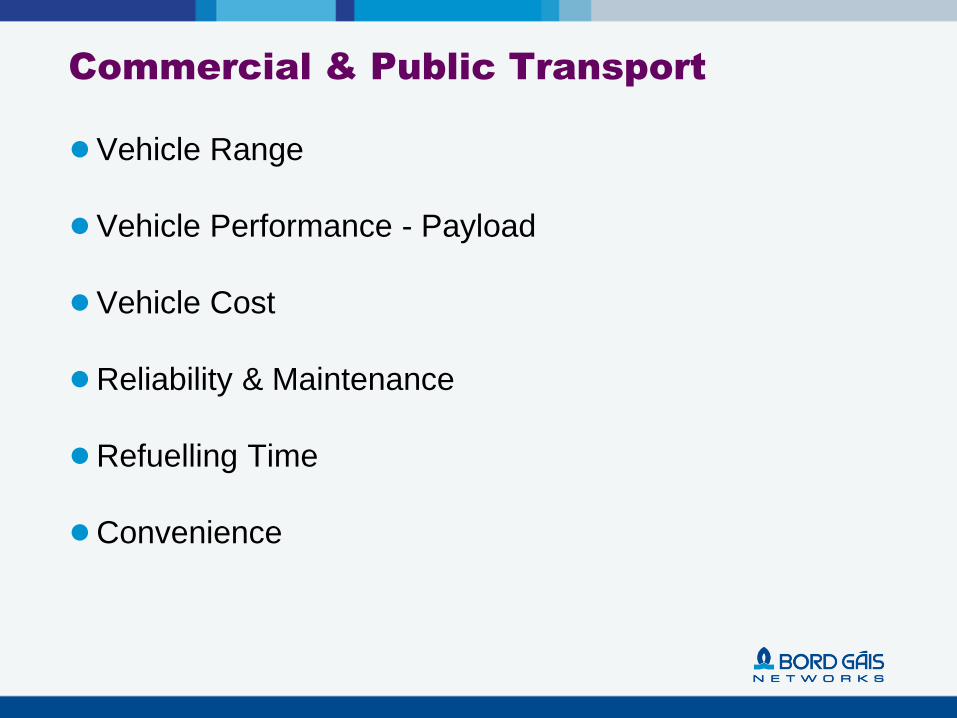
Commercial & Public Transport
● Vehicle Range
● Vehicle Performance - Payload
● Vehicle Cost
● Reliability & Maintenance
● Refuelling Time
● Convenience
13
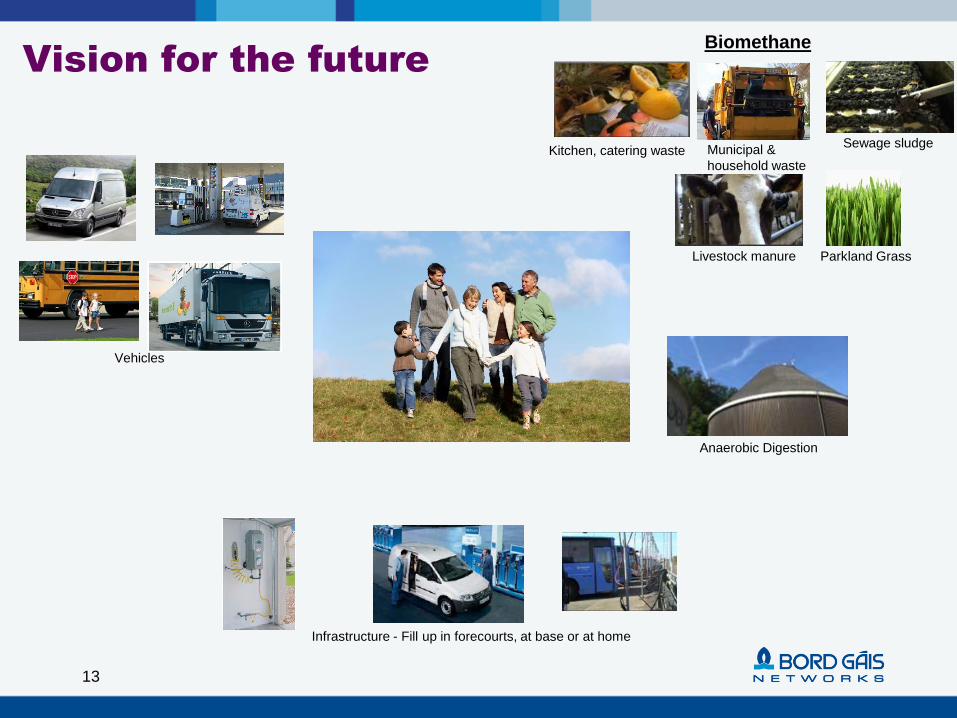
Vision for the futureBiomethane
Kitchen, catering waste Municipal &
household waste
Sewage sludge
Parkland Grass Livestock manure
Anaerobic Digestion
Vehicles
Infrastructure - Fill up in forecourts, at base or at home

How do we get there?
15
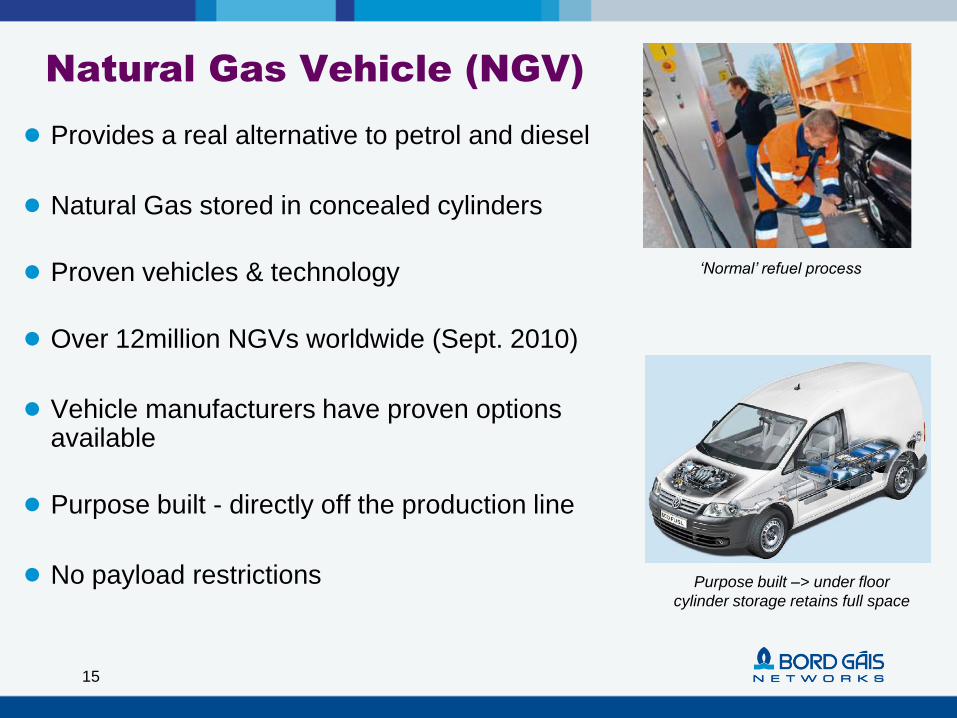
Natural Gas Vehicle (NGV)
● Provides a real alternative to petrol and diesel
● Natural Gas stored in concealed cylinders
● Proven vehicles & technology
● Over 12million NGVs worldwide (Sept. 2010)
● Vehicle manufacturers have proven options available
● Purpose built - directly off the production line
● No payload restrictions
‘Normal’ refuel process
Purpose built –> under floor
cylinder storage retains full space
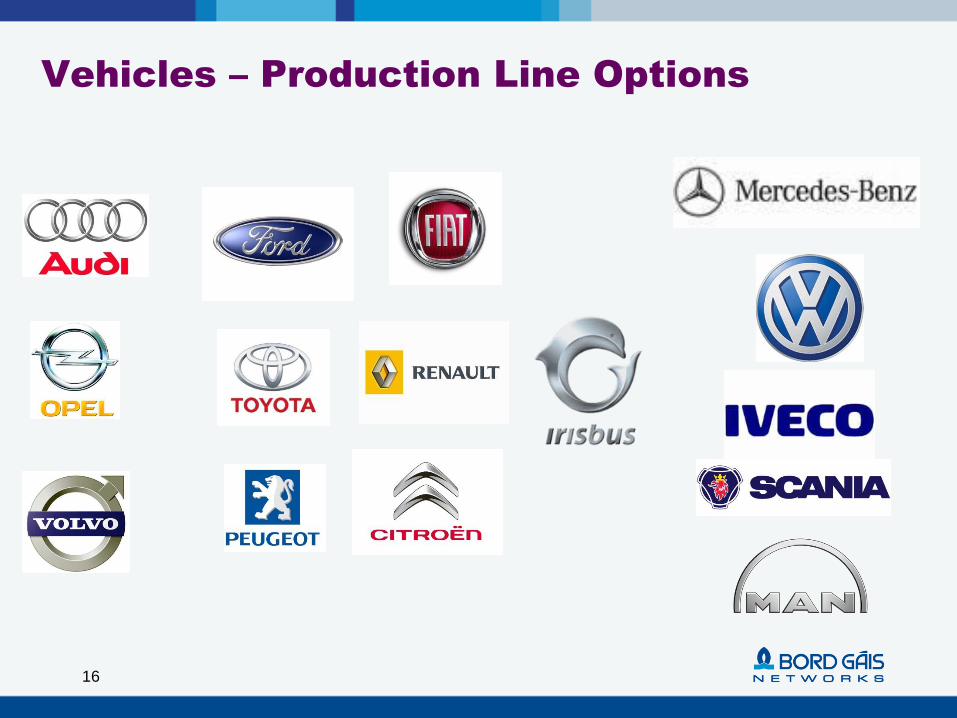
Vehicles – Production Line Options
16
17
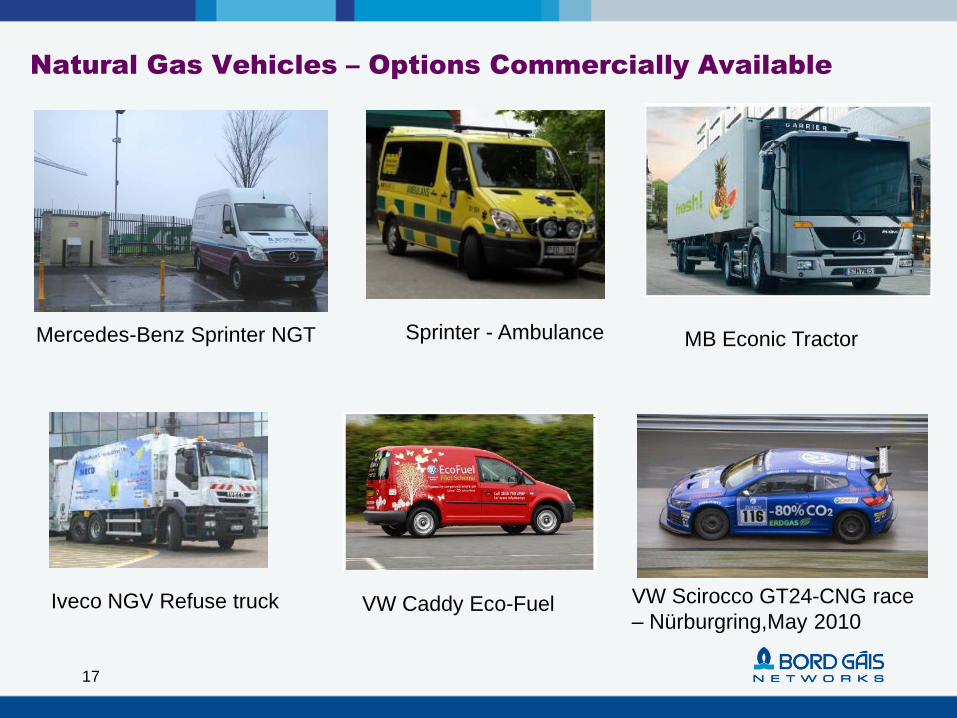
Natural Gas Vehicles – Options Commercially Available
VW Caddy Eco-Fuel
Mercedes-Benz Sprinter NGT
Iveco NGV Refuse truck
MB Econic TractorSprinter - Ambulance
VW Scirocco GT24-CNG race
– Nürburgring,May 2010
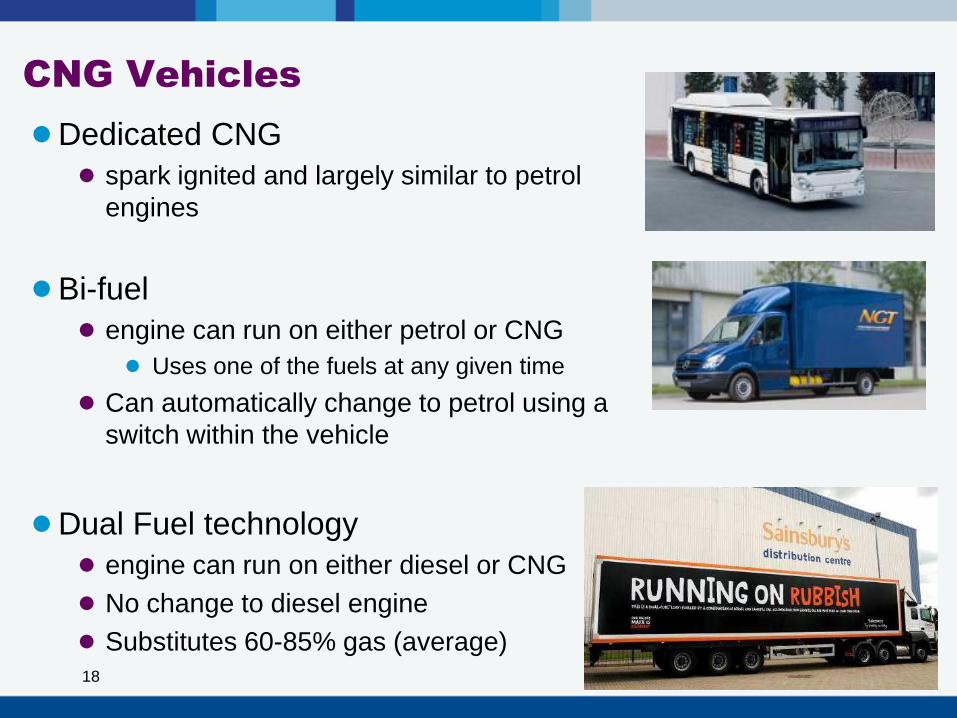
CNG Vehicles
● Dedicated CNG
● spark ignited and largely similar to petrol
engines
● Bi-fuel
● engine can run on either petrol or CNG
● Uses one of the fuels at any given time
● Can automatically change to petrol using a
switch within the vehicle
● Dual Fuel technology
● engine can run on either diesel or CNG
● No change to diesel engine
● Substitutes 60-85% gas (average)18
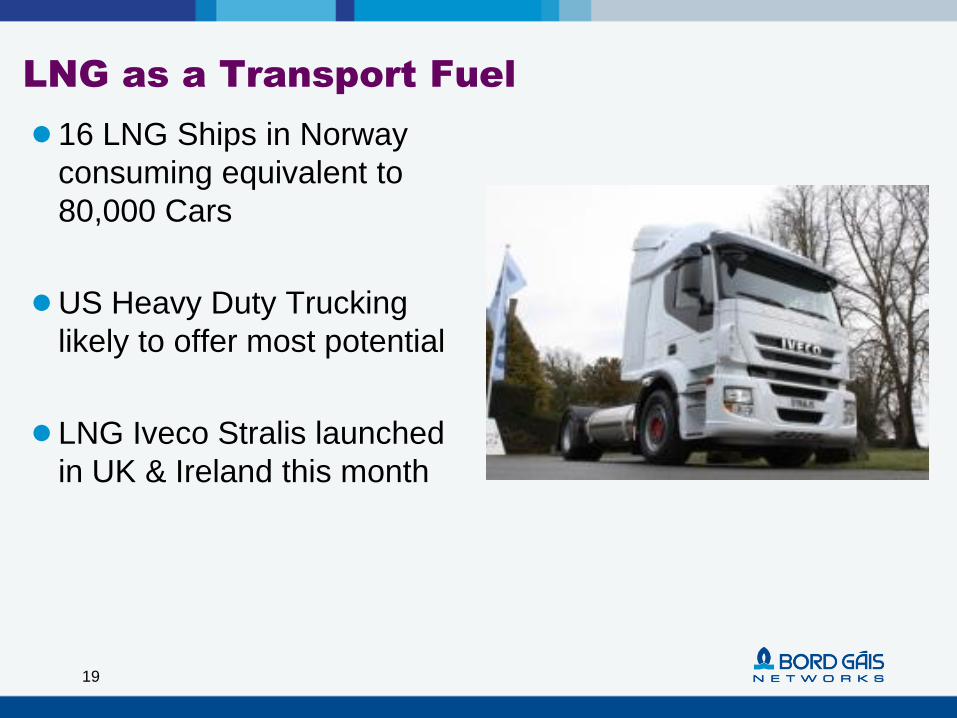
LNG as a Transport Fuel
● 16 LNG Ships in Norway
consuming equivalent to
80,000 Cars
● US Heavy Duty Trucking
likely to offer most potential
● LNG Iveco Stralis launched
in UK & Ireland this month
19
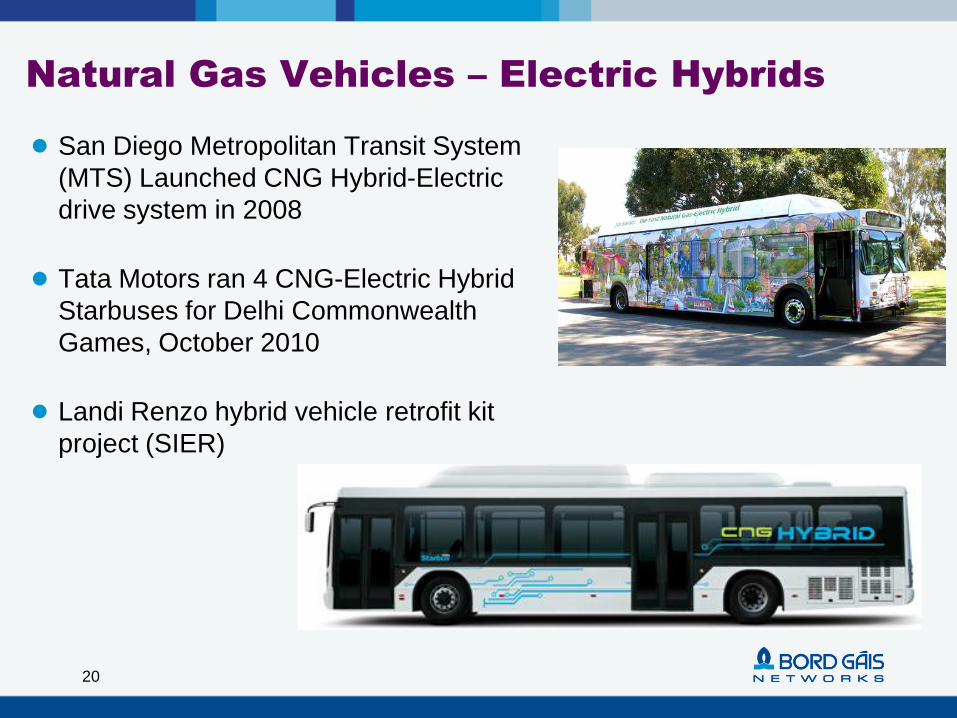
Natural Gas Vehicles – Electric Hybrids
● San Diego Metropolitan Transit System
(MTS) Launched CNG Hybrid-Electric
drive system in 2008
● Tata Motors ran 4 CNG-Electric Hybrid
Starbuses for Delhi Commonwealth
Games, October 2010
● Landi Renzo hybrid vehicle retrofit kit
project (SIER)
20
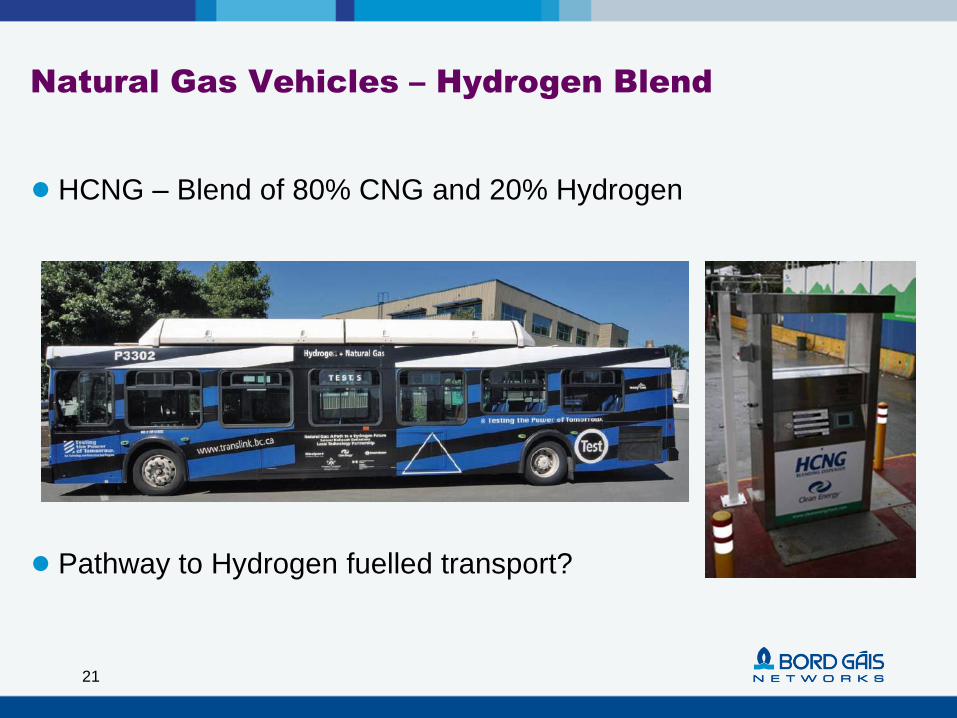
Natural Gas Vehicles – Hydrogen Blend
● HCNG – Blend of 80% CNG and 20% Hydrogen
21
● Pathway to Hydrogen fuelled transport?
22
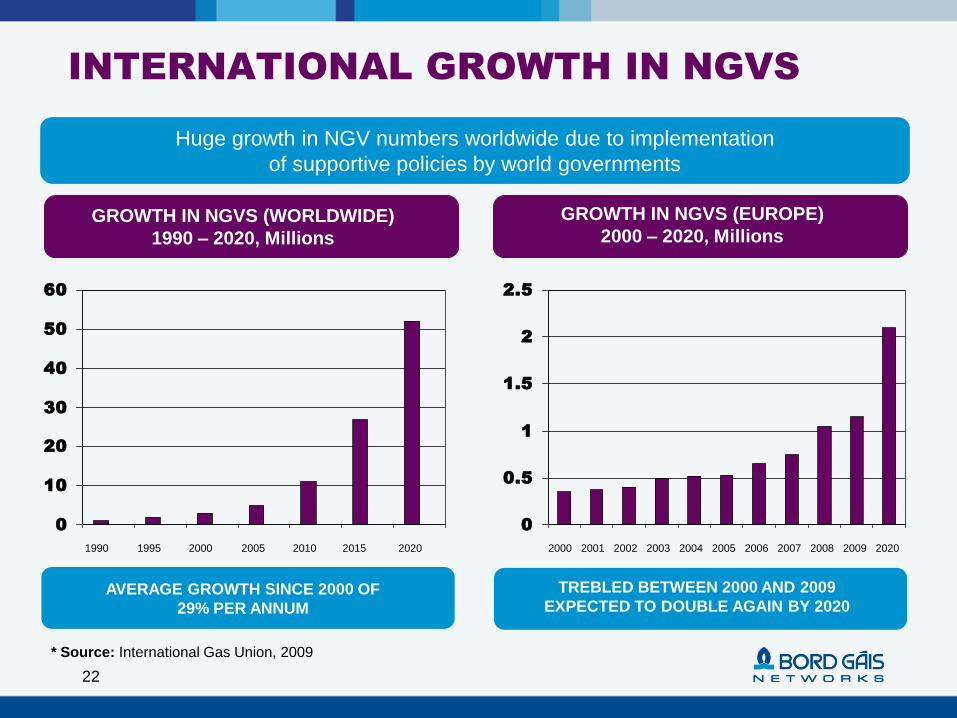
INTERNATIONAL GROWTH IN NGVS
GROWTH IN NGVS (WORLDWIDE)
1990 – 2020, Millions
GROWTH IN NGVS (EUROPE)
2000 – 2020, Millions
Huge growth in NGV numbers worldwide due to implementation
of supportive policies by world governments
* Source: International Gas Union, 2009
0
10
20
30
40
50
60
0
0.5
1
1.5
2
2.5
1990 1995 2000 2005 2010 2015 2020 2000 2001 2002 2003 2004 2005 2006 2008 202020092007
AVERAGE GROWTH SINCE 2000 OF
29% PER ANNUM
TREBLED BETWEEN 2000 AND 2009
EXPECTED TO DOUBLE AGAIN BY 2020
23
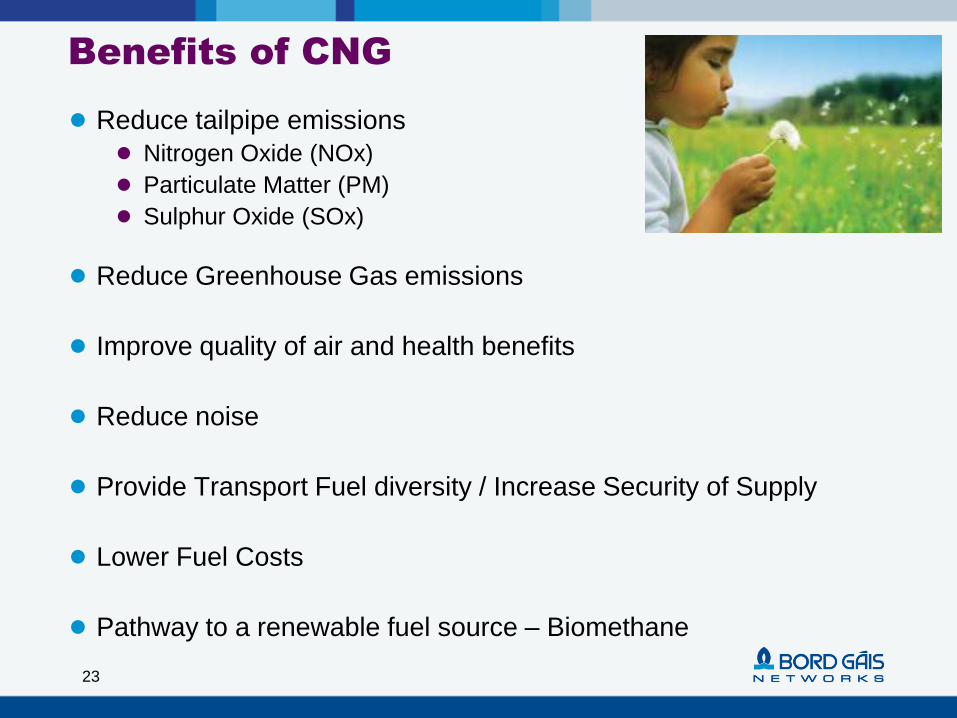
Benefits of CNG
● Reduce tailpipe emissions
● Nitrogen Oxide (NOx)
● Particulate Matter (PM)
● Sulphur Oxide (SOx)
● Reduce Greenhouse Gas emissions
● Improve quality of air and health benefits
● Reduce noise
● Provide Transport Fuel diversity / Increase Security of Supply
● Lower Fuel Costs
● Pathway to a renewable fuel source – Biomethane
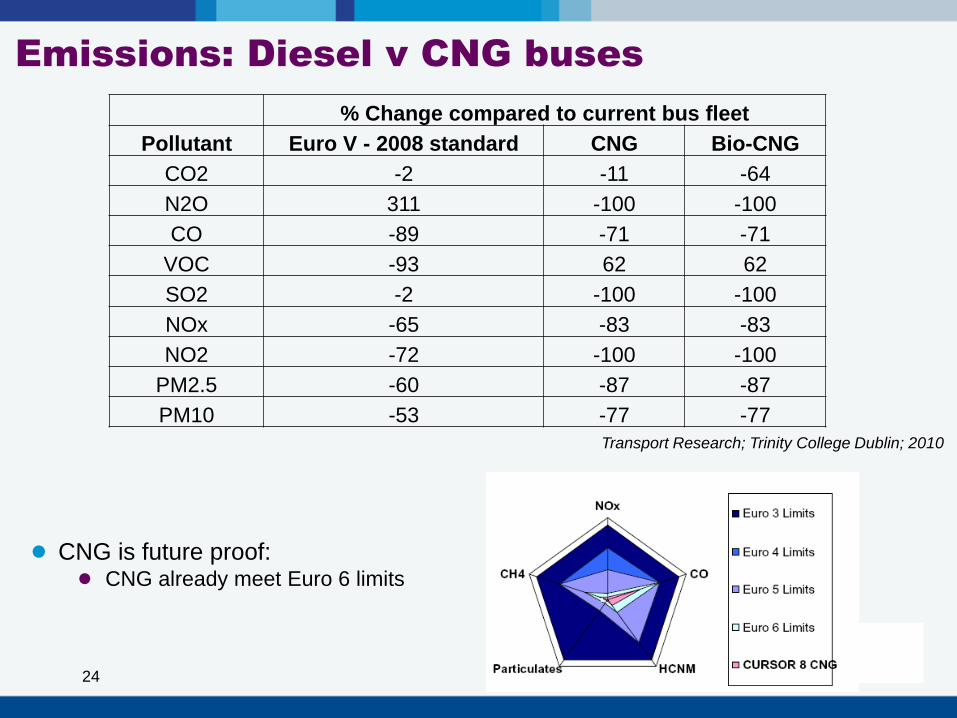
Emissions: Diesel v CNG buses
24
% Change compared to current bus fleet
Pollutant Euro V - 2008 standard CNG Bio-CNG
CO2 -2 -11 -64
N2O 311 -100 -100
CO -89 -71 -71
VOC -93 62 62
SO2 -2 -100 -100
NOx -65 -83 -83
NO2 -72 -100 -100
PM2.5 -60 -87 -87
PM10 -53 -77 -77
Transport Research; Trinity College Dublin; 2010
● CNG is future proof:● CNG already meet Euro 6 limits
25
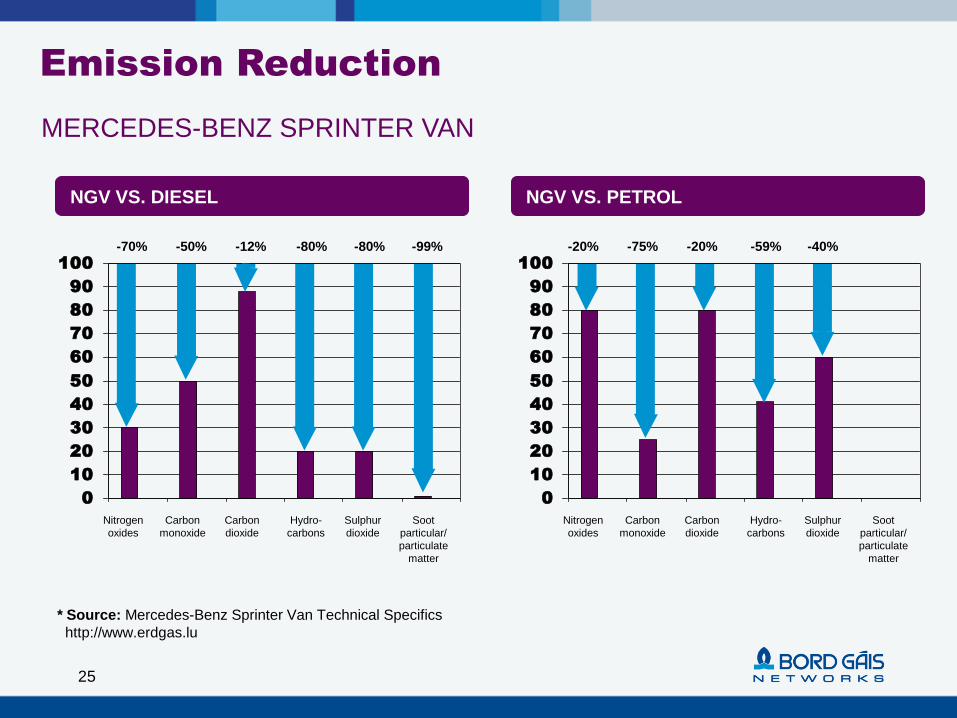
Emission Reduction
NGV VS. DIESEL
0
10
20
30
40
50
60
70
80
90
100
Nitrogen
oxides
Carbon
monoxide
Carbon
dioxide
Hydro-
carbons
Sulphur
dioxide
Soot
particular/
particulate
matter
-70% -50% -12% -80% -80% -99%
* Source: Mercedes-Benz Sprinter Van Technical Specifics
http://www.erdgas.lu
MERCEDES-BENZ SPRINTER VAN
0
10
20
30
40
50
60
70
80
90
100
NGV VS. PETROL
Nitrogen
oxides
Carbon
monoxide
Carbon
dioxide
Hydro-
carbons
Sulphur
dioxide
Soot
particular/
particulate
matter
-20% -75% -20% -59% -40%
26
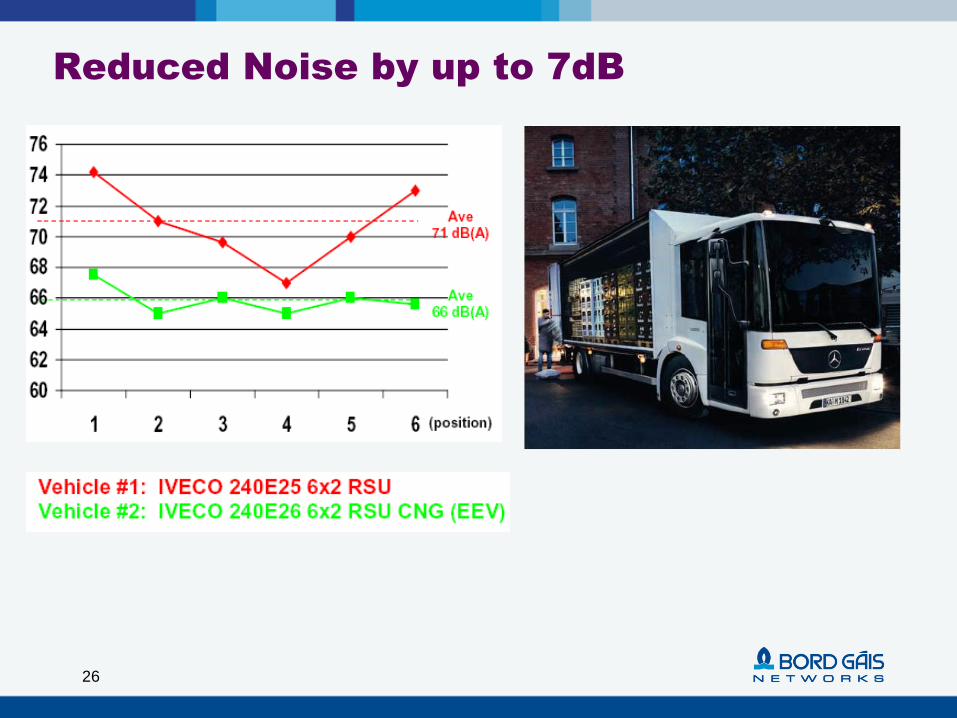
Reduced Noise by up to 7dB
Enhances Security of Supply
● Reduces dependency on oil
● Creates transport fuel diversity
● Reduces risk to potential shocks in oil market
● Natural gas - different supply sources via different
infrastructure
27
28
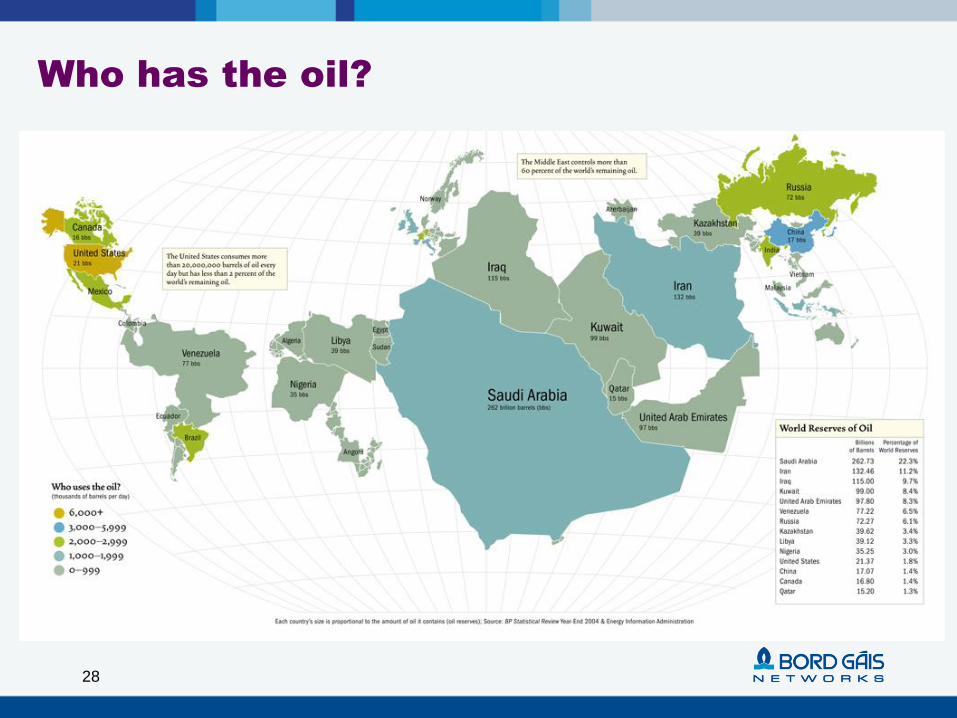
Who has the oil?
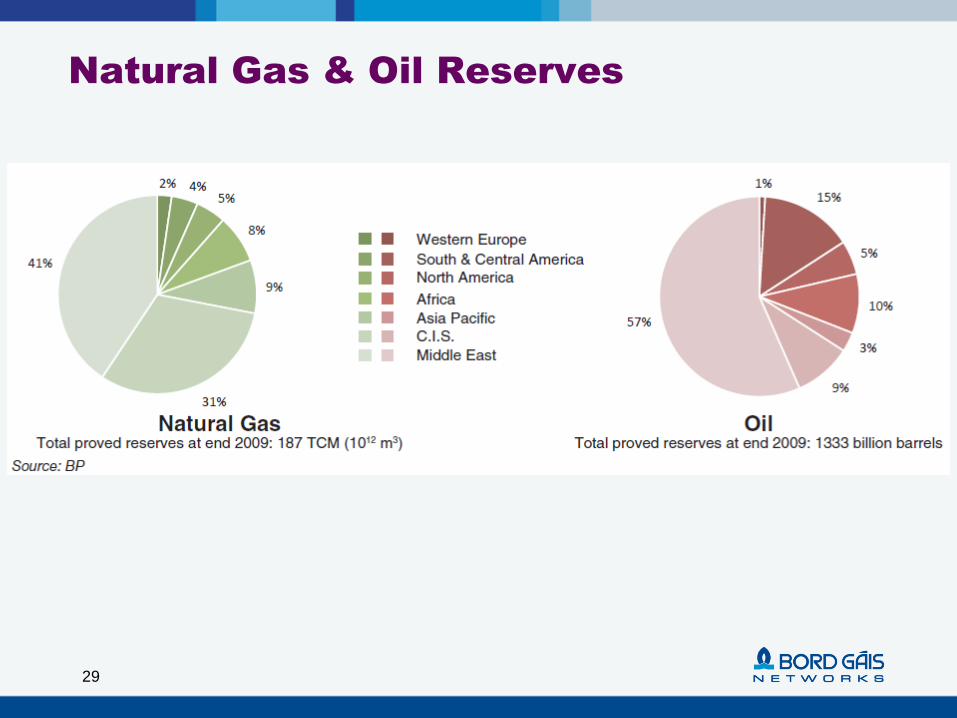
Natural Gas & Oil Reserves
29
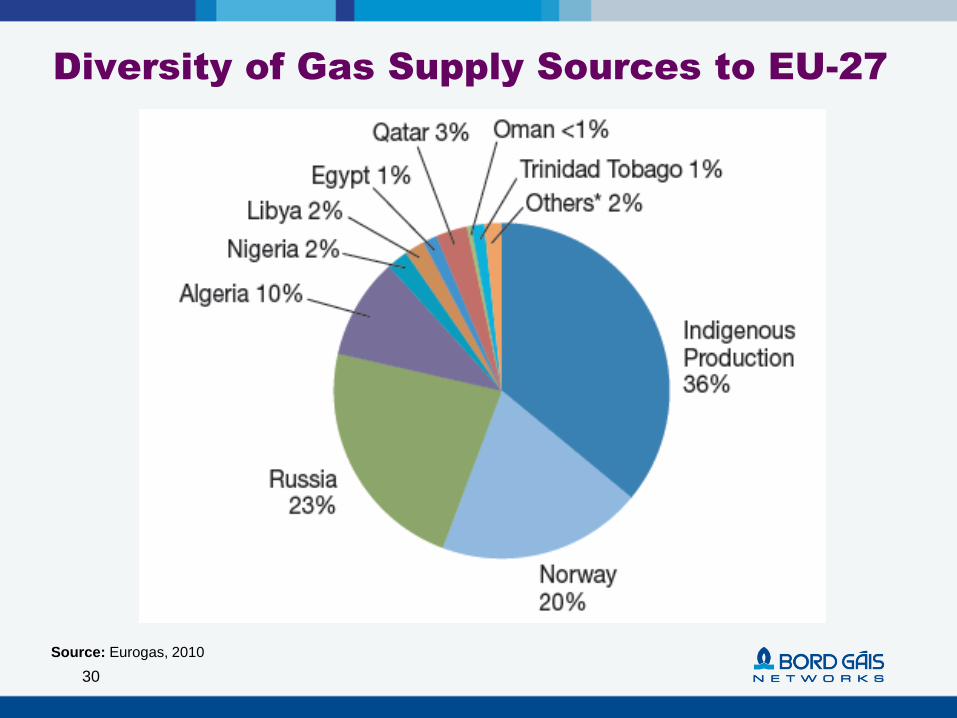
Diversity of Gas Supply Sources to EU-27
30
Source: Eurogas, 2010
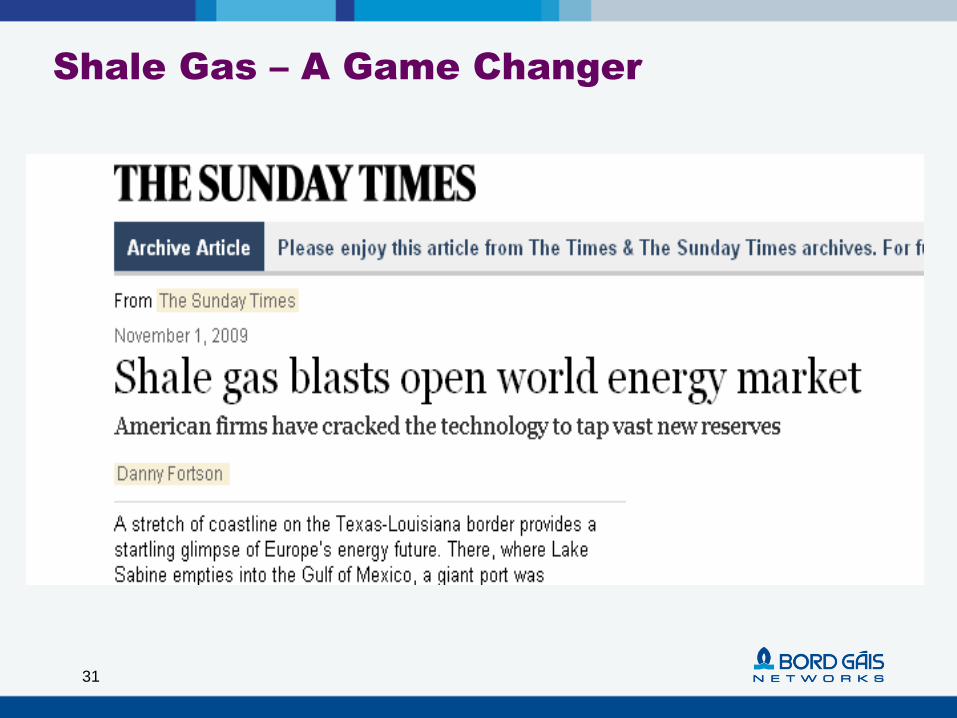
Shale Gas – A Game Changer
31
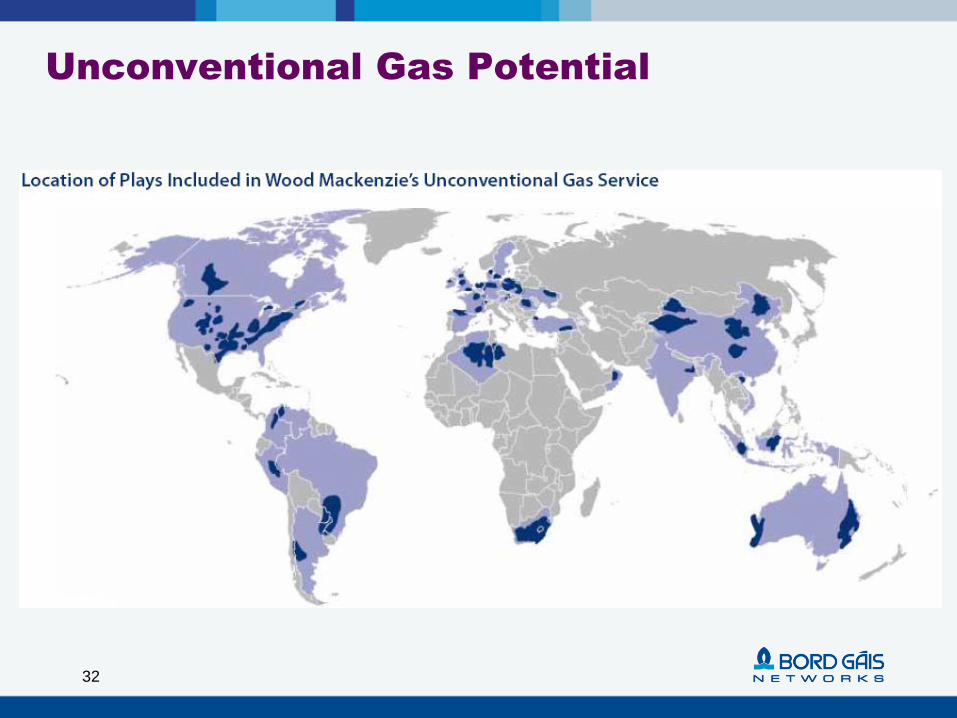
Unconventional Gas Potential
32
33
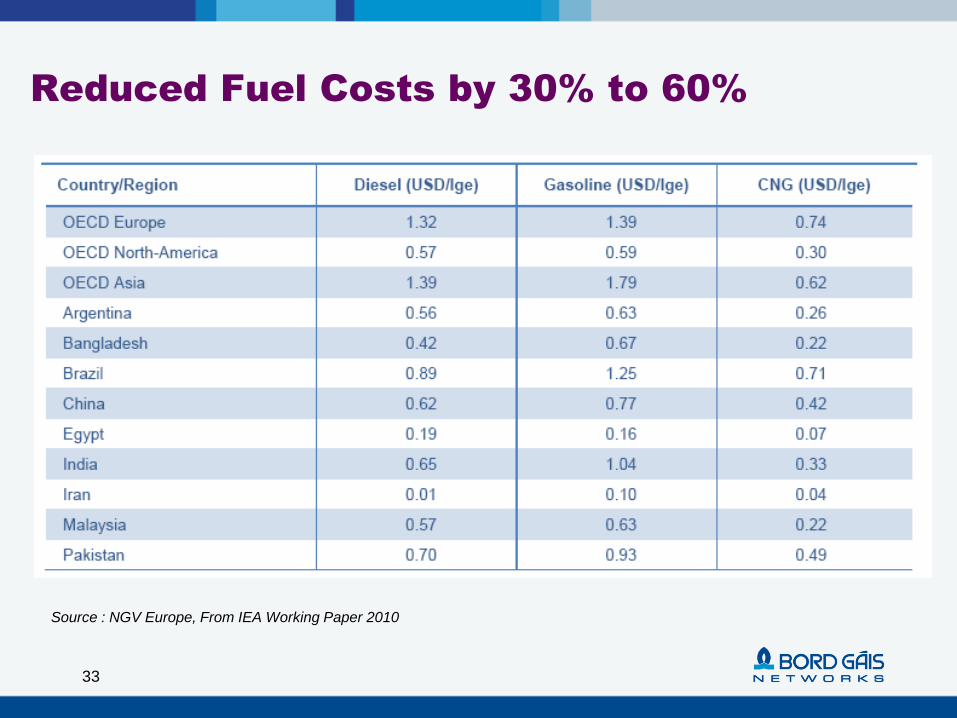
Reduced Fuel Costs by 30% to 60%
Source : NGV Europe, From IEA Working Paper 2010
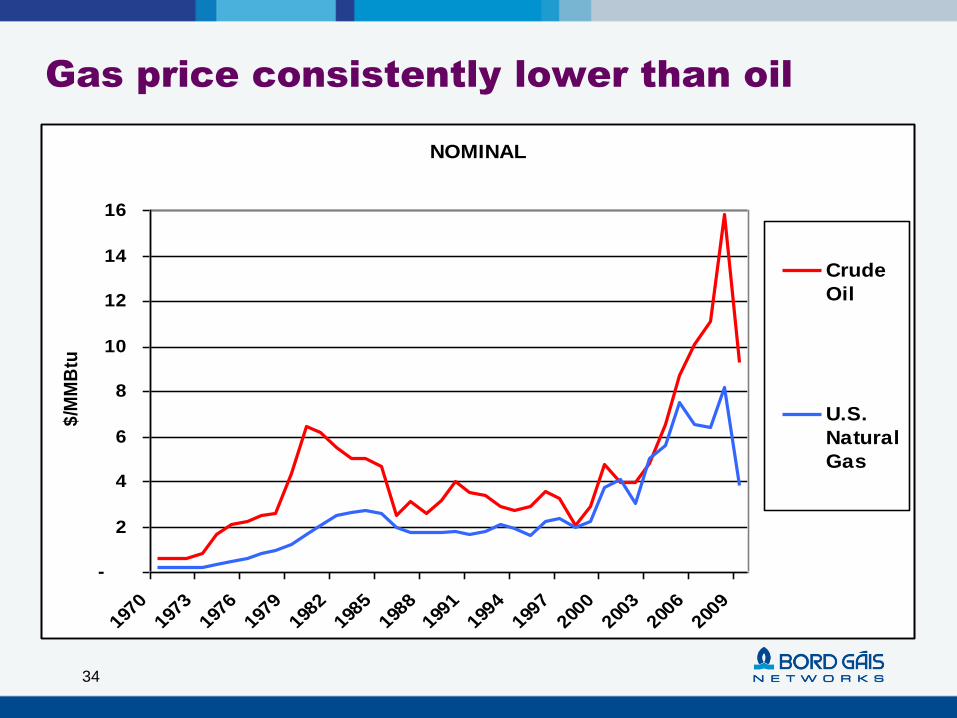
Gas price consistently lower than oil
34
NOMINAL
-
2
4
6
8
10
12
14
16
1970
1973
1976
1979
1982
1985
1988
1991
1994
1997
2000
2003
2006
2009
$/M
MB
tu
Crude
Oil
U.S.
Natural
Gas
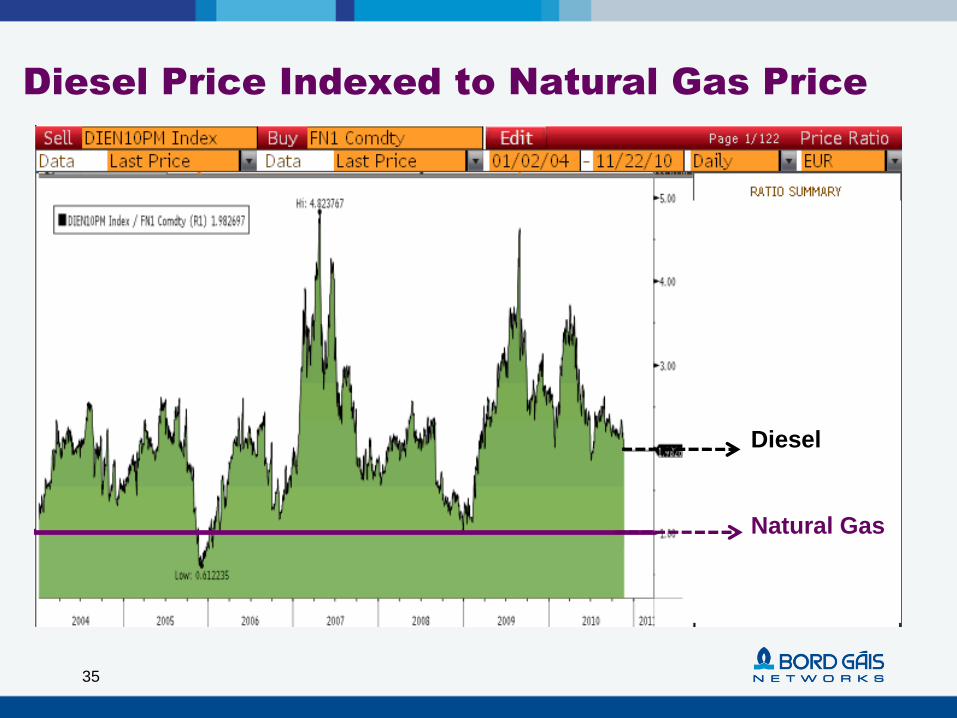
Diesel Price Indexed to Natural Gas Price
35
Diesel
Natural Gas
36
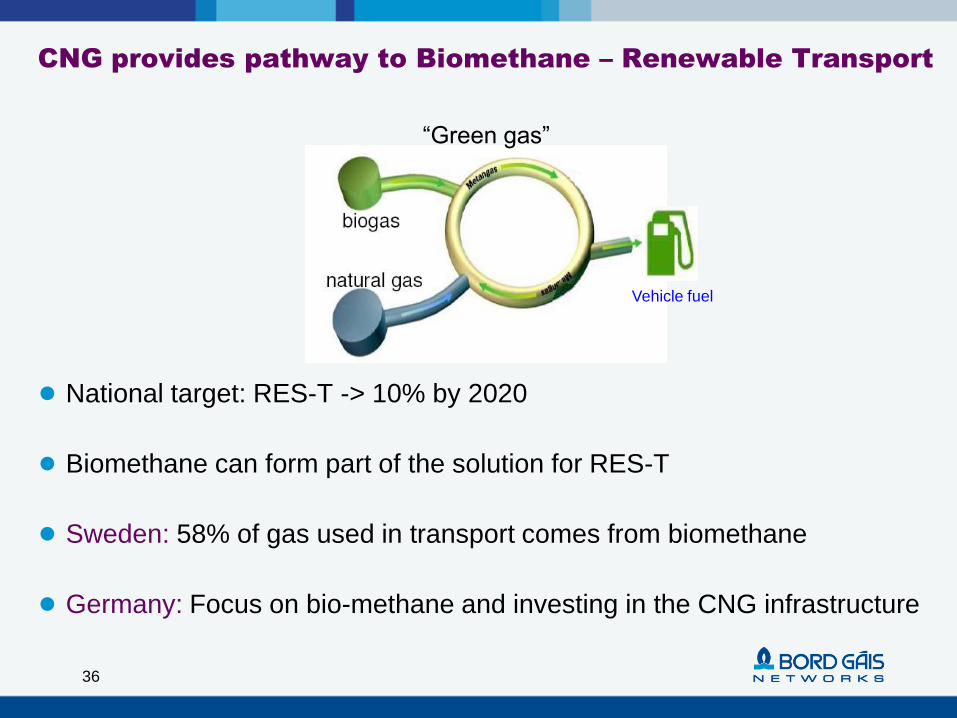
CNG provides pathway to Biomethane – Renewable Transport
● National target: RES-T -> 10% by 2020
● Biomethane can form part of the solution for RES-T
● Sweden: 58% of gas used in transport comes from biomethane
● Germany: Focus on bio-methane and investing in the CNG infrastructure
“Green gas”
Vehicle fuel
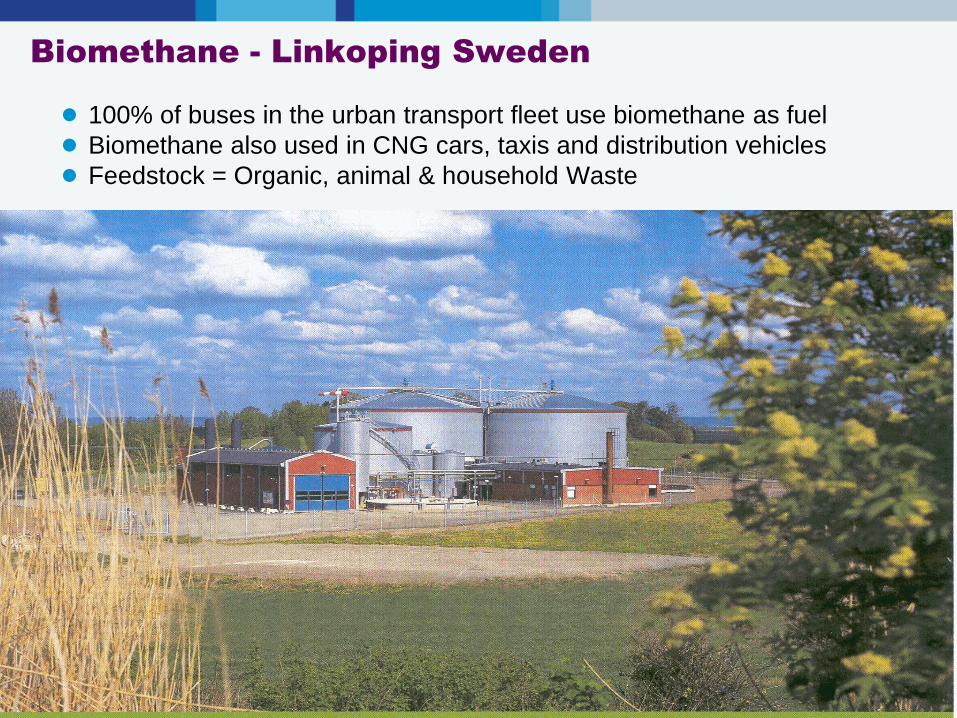
Biomethane - Linkoping Sweden
Bord Gáis Networks37
● 100% of buses in the urban transport fleet use biomethane as fuel
● Biomethane also used in CNG cars, taxis and distribution vehicles
● Feedstock = Organic, animal & household Waste
38
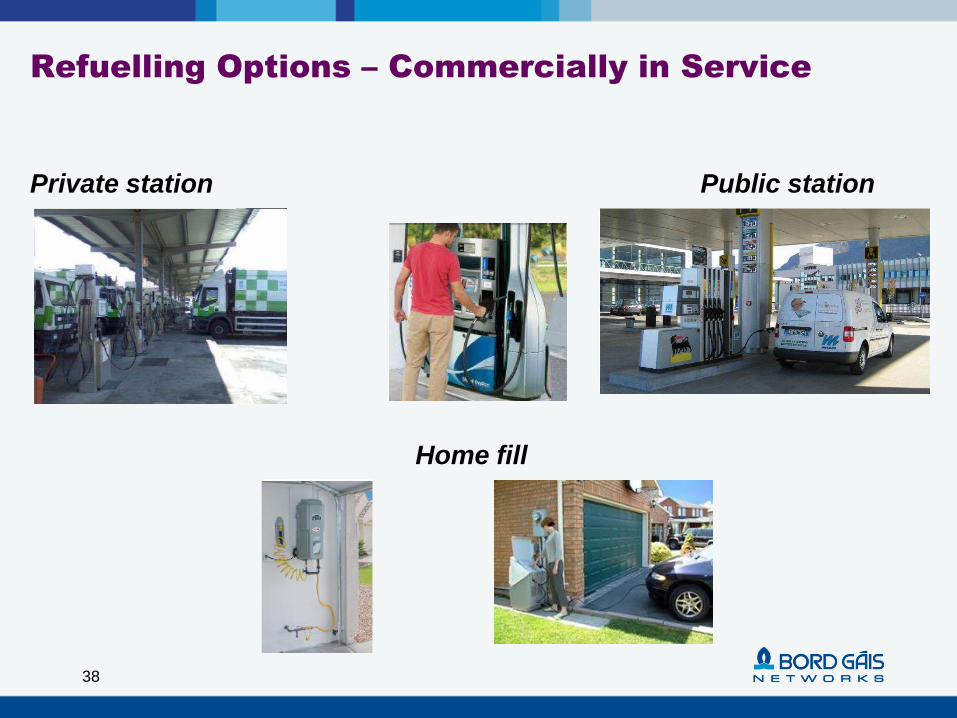
Refuelling Options – Commercially in Service
Private station Public station
Home fill
39
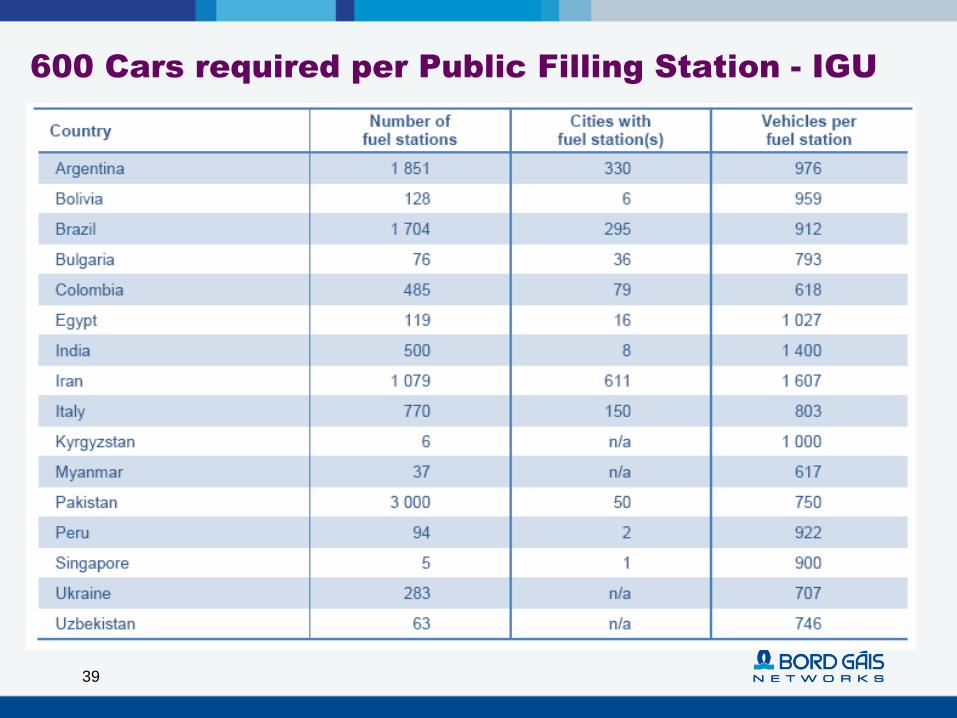
600 Cars required per Public Filling Station - IGU
40
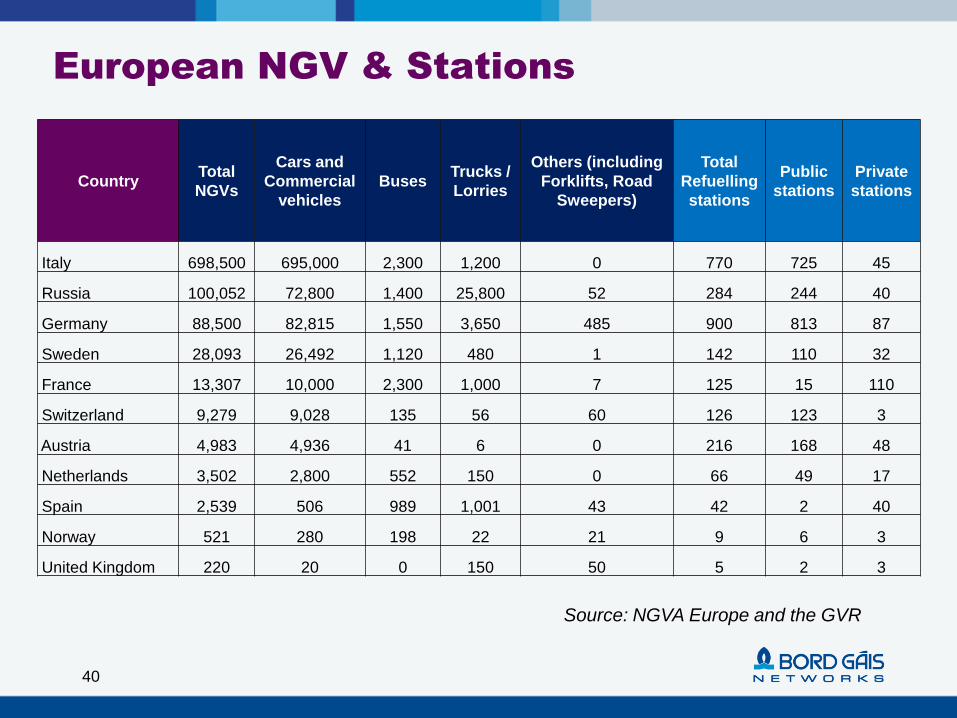
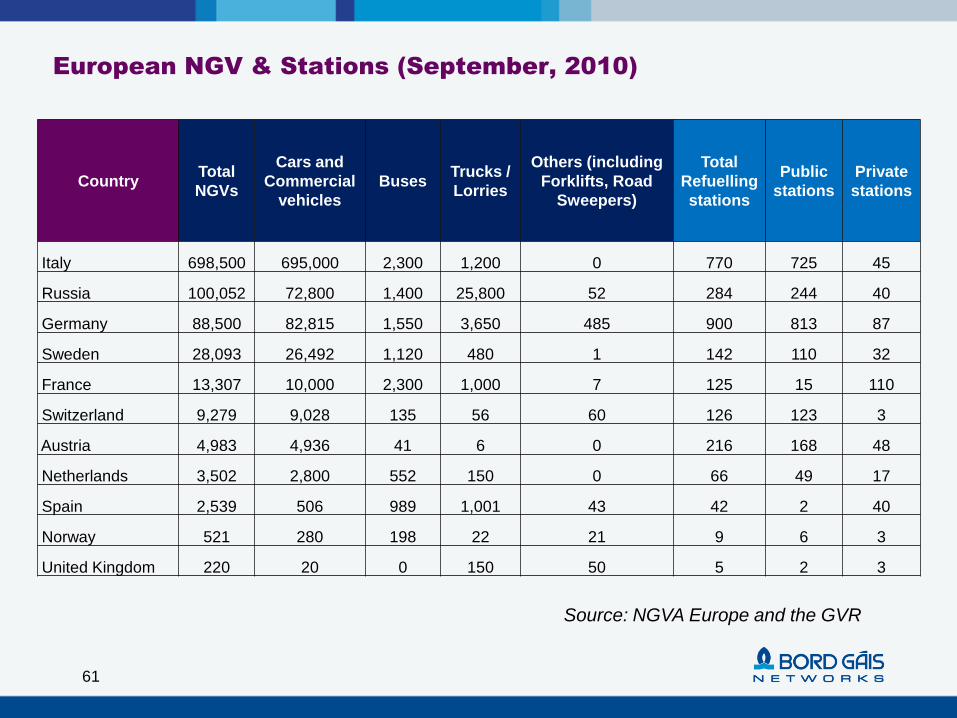
European NGV & Stations
Source: NGVA Europe and the GVR
CountryTotal
NGVs
Cars and
Commercial
vehicles
BusesTrucks /
Lorries
Others (including
Forklifts, Road
Sweepers)
Total
Refuelling
stations
Public
stations
Private
stations
Italy 698,500 695,000 2,300 1,200 0 770 725 45
Russia 100,052 72,800 1,400 25,800 52 284 244 40
Germany 88,500 82,815 1,550 3,650 485 900 813 87
Sweden 28,093 26,492 1,120 480 1 142 110 32
France 13,307 10,000 2,300 1,000 7 125 15 110
Switzerland 9,279 9,028 135 56 60 126 123 3
Austria 4,983 4,936 41 6 0 216 168 48
Netherlands 3,502 2,800 552 150 0 66 49 17
Spain 2,539 506 989 1,001 43 42 2 40
Norway 521 280 198 22 21 9 6 3
United Kingdom 220 20 0 150 50 5 2 3
41
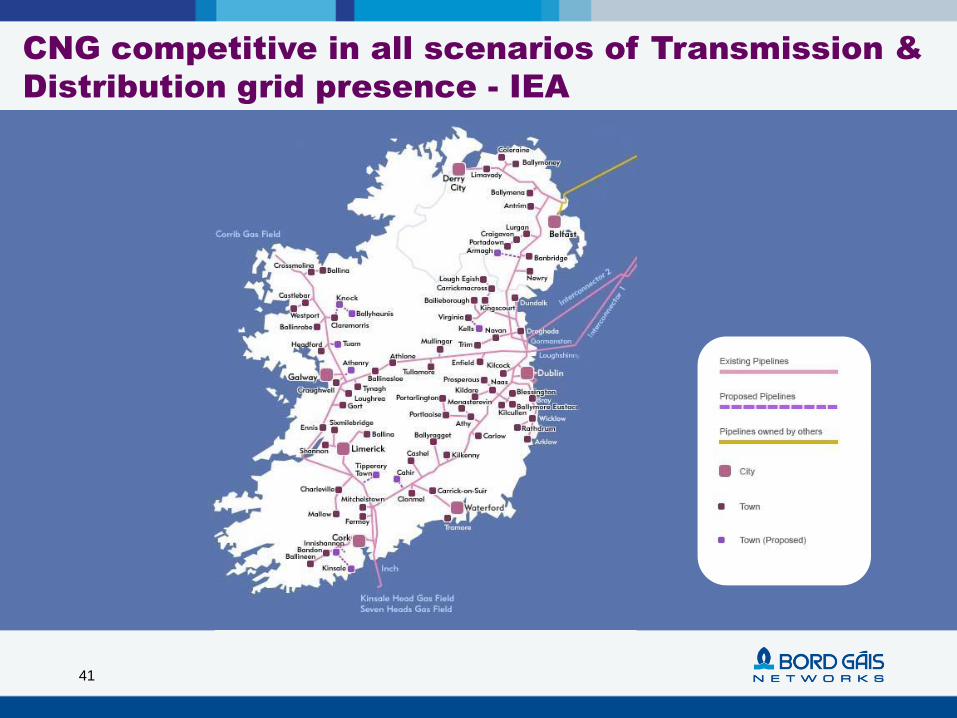
CNG competitive in all scenarios of Transmission &
Distribution grid presence - IEA
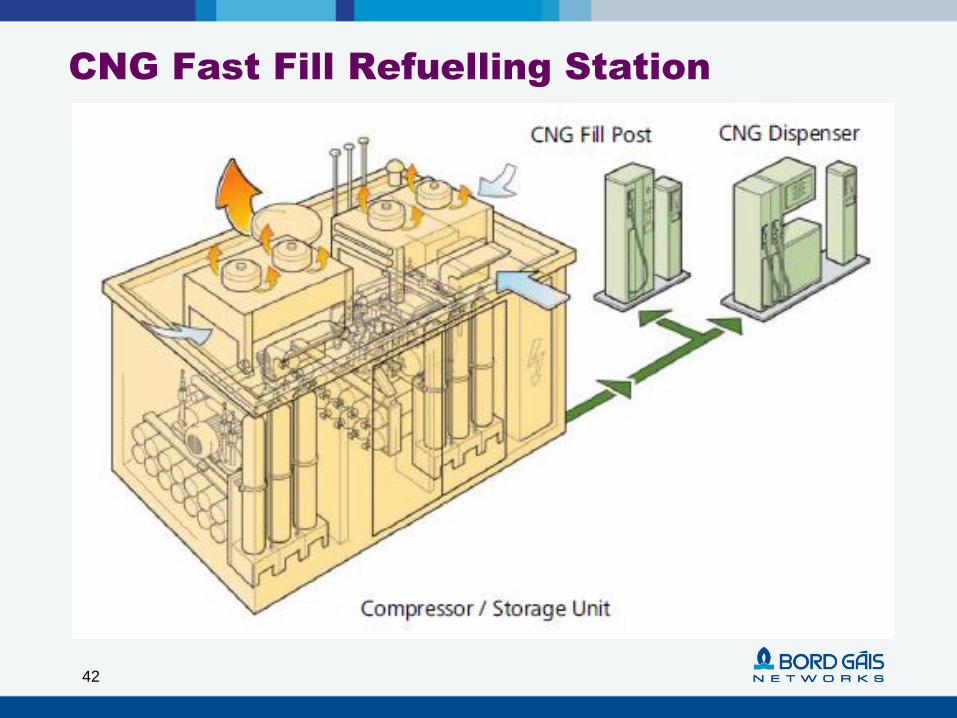
CNG Fast Fill Refuelling Station
42
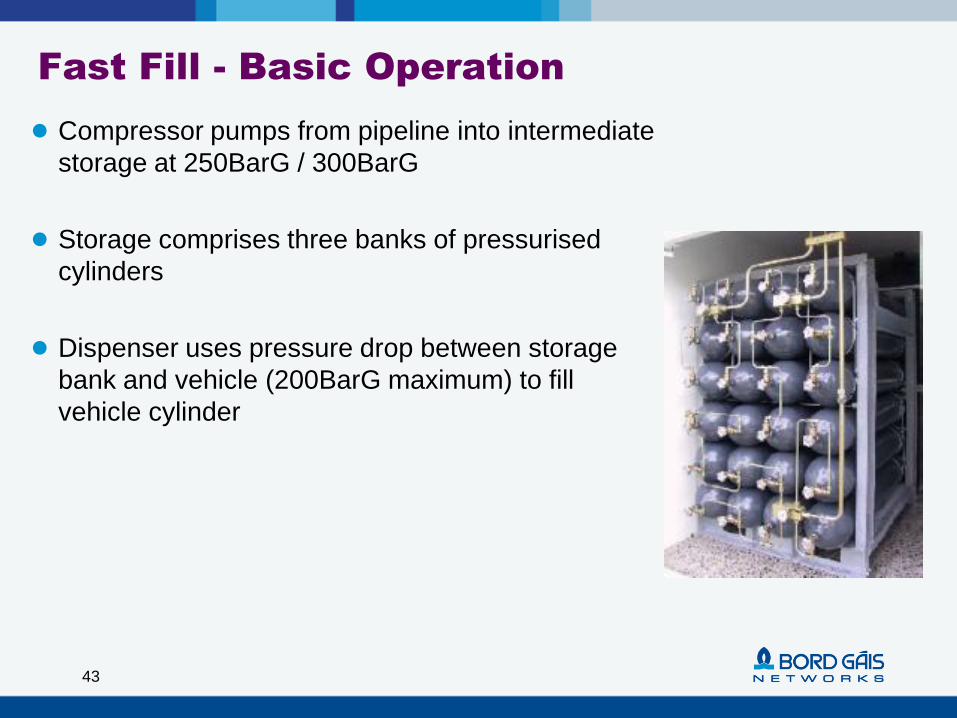
Fast Fill - Basic Operation
● Compressor pumps from pipeline into intermediate
storage at 250BarG / 300BarG
● Storage comprises three banks of pressurised
cylinders
● Dispenser uses pressure drop between storage
bank and vehicle (200BarG maximum) to fill
vehicle cylinder
43
Refuelling Station Design
● Meet Operations / Fleet Requirements
● Fast Fill vs Slow Fill
● Type of Vehicles
● Number of Vehicles
● Average Mileage
● Refuelling Frequency
● Dispenser Requirements
44
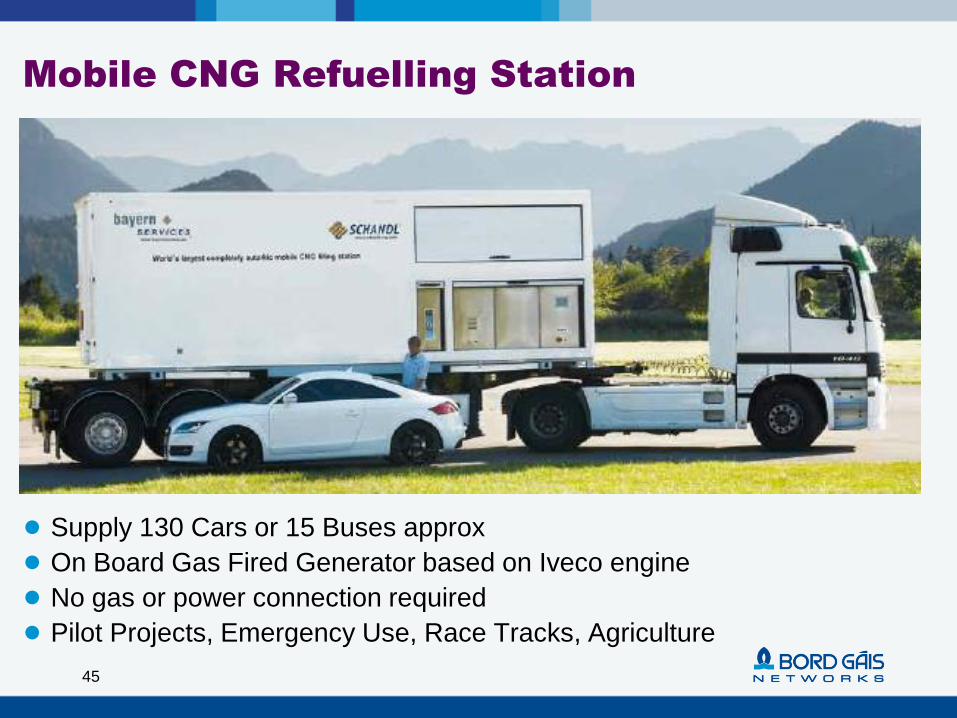
Mobile CNG Refuelling Station
45
● Supply 130 Cars or 15 Buses approx
● On Board Gas Fired Generator based on Iveco engine
● No gas or power connection required
● Pilot Projects, Emergency Use, Race Tracks, Agriculture
CNG Cylinders – Four Types
46
● Type 1 - All Metal
● Aluminium or Steel
● Type 2 - Hoop Wrapped
● Metal liner reinforced by composite wrap (glass or carbon fiber) around middle
● Type 3 - Full Wrapped Metal
● Metal liner reinforced by composite wrap around entire tank
● Type 4 - Full Wrapped Plastic
● Plastic gas-tight liner reinforced by composite wrap around entire tank
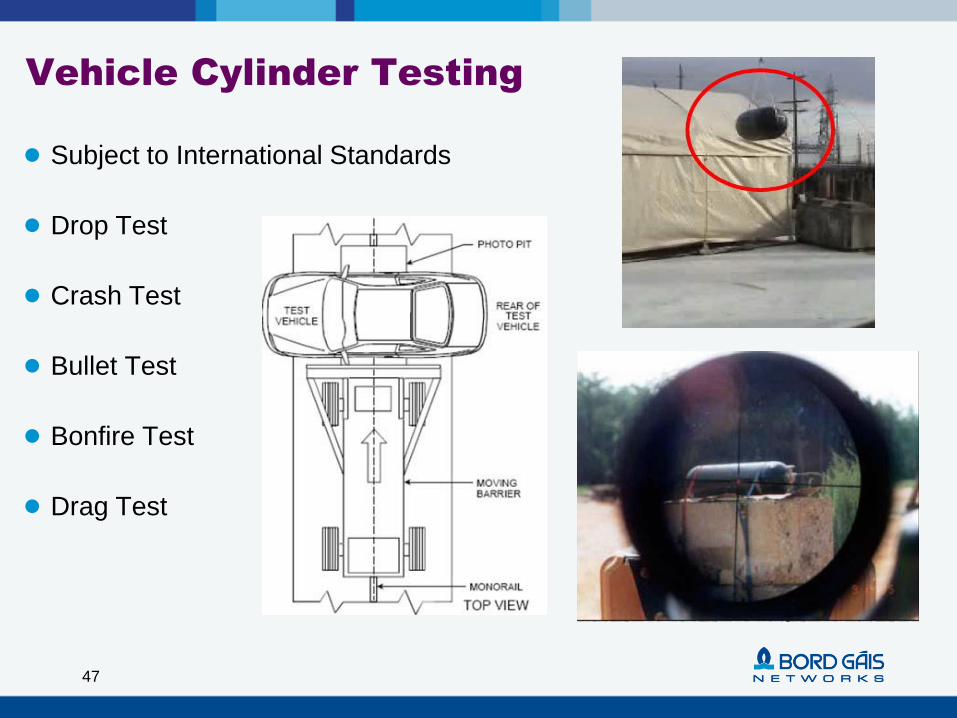
Vehicle Cylinder Testing
47
● Subject to International Standards
● Drop Test
● Crash Test
● Bullet Test
● Bonfire Test
● Drag Test
Bord Gáis Networks48
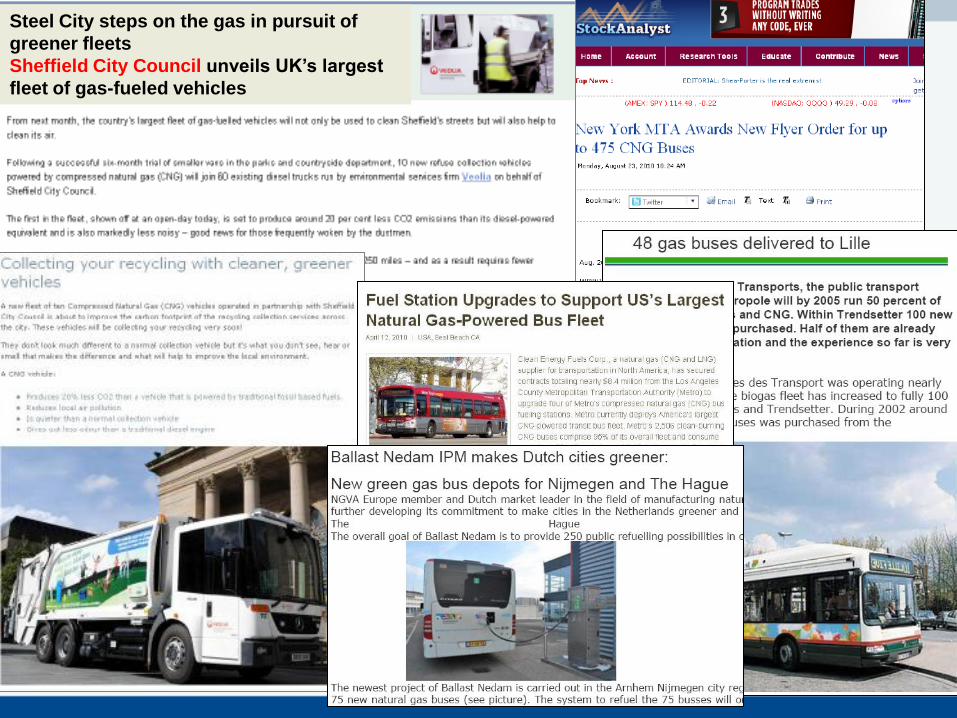
Steel City steps on the gas in pursuit of
greener fleets
Sheffield City Council unveils UK’s largest
fleet of gas-fueled vehicles
49
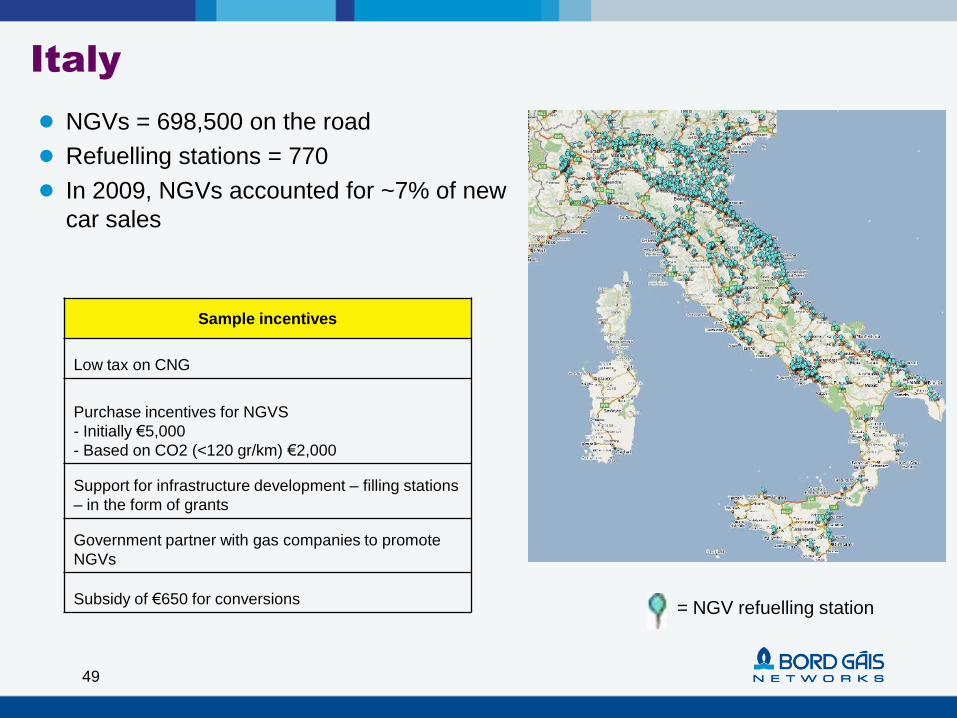
Italy
● NGVs = 698,500 on the road
● Refuelling stations = 770
● In 2009, NGVs accounted for ~7% of new
car sales
Sample incentives
Low tax on CNG
Purchase incentives for NGVS
- Initially €5,000
- Based on CO2 (<120 gr/km) €2,000
Support for infrastructure development – filling stations
– in the form of grants
Government partner with gas companies to promote
NGVs
Subsidy of €650 for conversions= NGV refuelling station
50
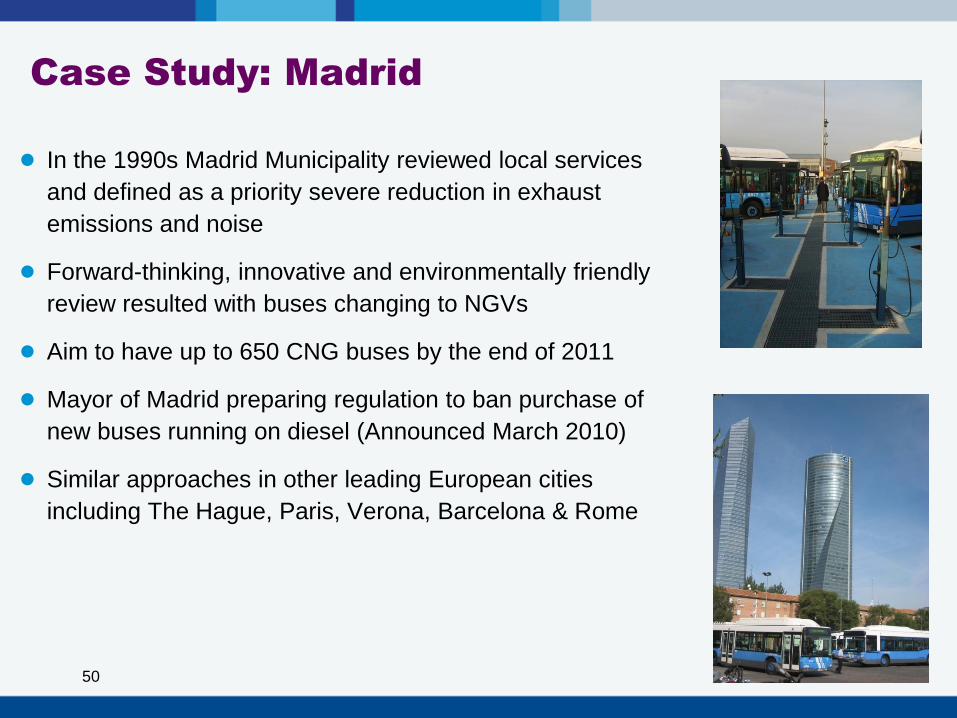
Case Study: Madrid
● In the 1990s Madrid Municipality reviewed local services
and defined as a priority severe reduction in exhaust
emissions and noise
● Forward-thinking, innovative and environmentally friendly
review resulted with buses changing to NGVs
● Aim to have up to 650 CNG buses by the end of 2011
● Mayor of Madrid preparing regulation to ban purchase of
new buses running on diesel (Announced March 2010)
● Similar approaches in other leading European cities
including The Hague, Paris, Verona, Barcelona & Rome
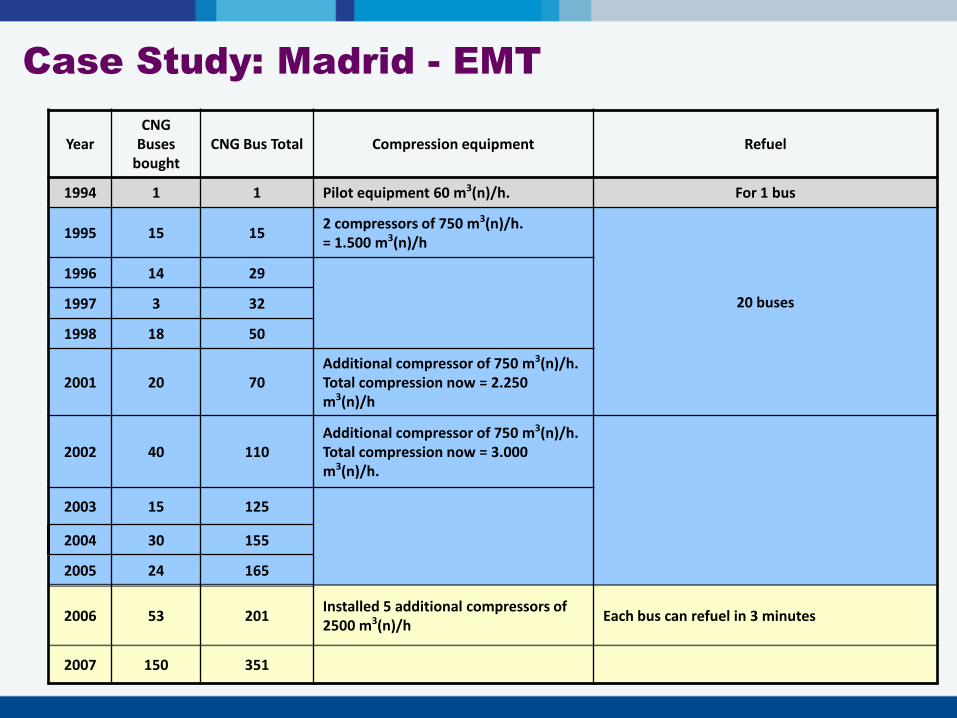
Case Study: Madrid - EMT
Bord Gáis Networks51
YearCNG
Buses bought
CNG Bus Total Compression equipment Refuel
1994 1 1 Pilot equipment 60 m3(n)/h. For 1 bus
1995 15 152 compressors of 750 m3(n)/h. = 1.500 m3(n)/h
20 buses
1996 14 29
1997 3 32
1998 18 50
2001 20 70Additional compressor of 750 m3(n)/h. Total compression now = 2.250 m3(n)/h
2002 40 110Additional compressor of 750 m3(n)/h. Total compression now = 3.000 m3(n)/h.
2003 15 125
2004 30 155
2005 24 165
2006 53 201Installed 5 additional compressors of 2500 m3(n)/h
Each bus can refuel in 3 minutes
2007 150 351
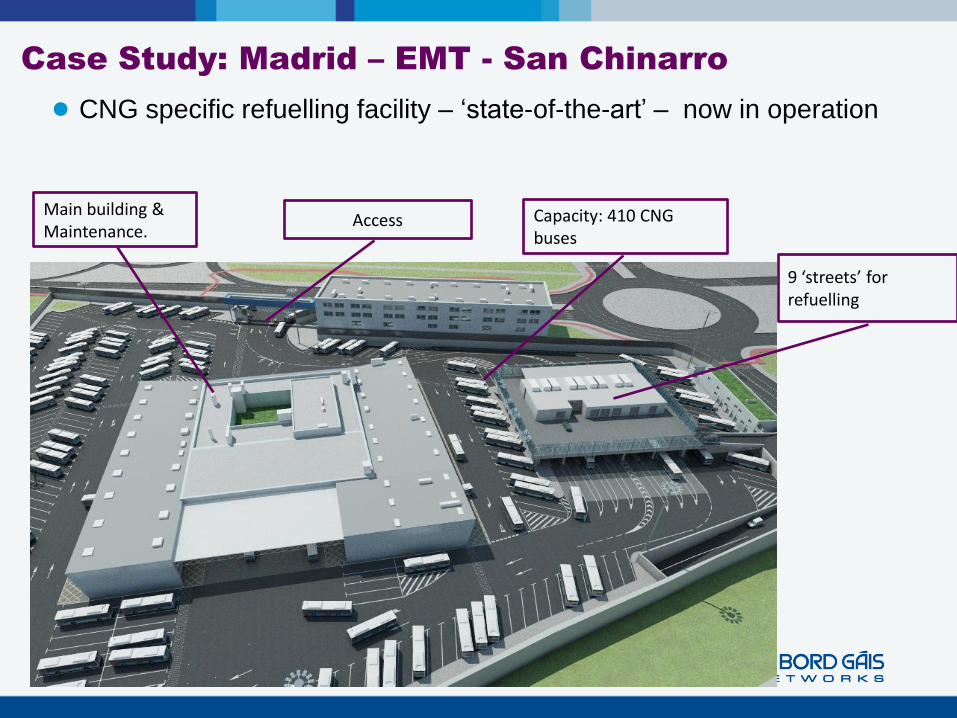
9 ‘streets’ forrefuelling
Capacity: 410 CNG buses
Main building & Maintenance.
Access
● CNG specific refuelling facility – „state-of-the-art‟ – now in operation
Case Study: Madrid – EMT - San Chinarro
53
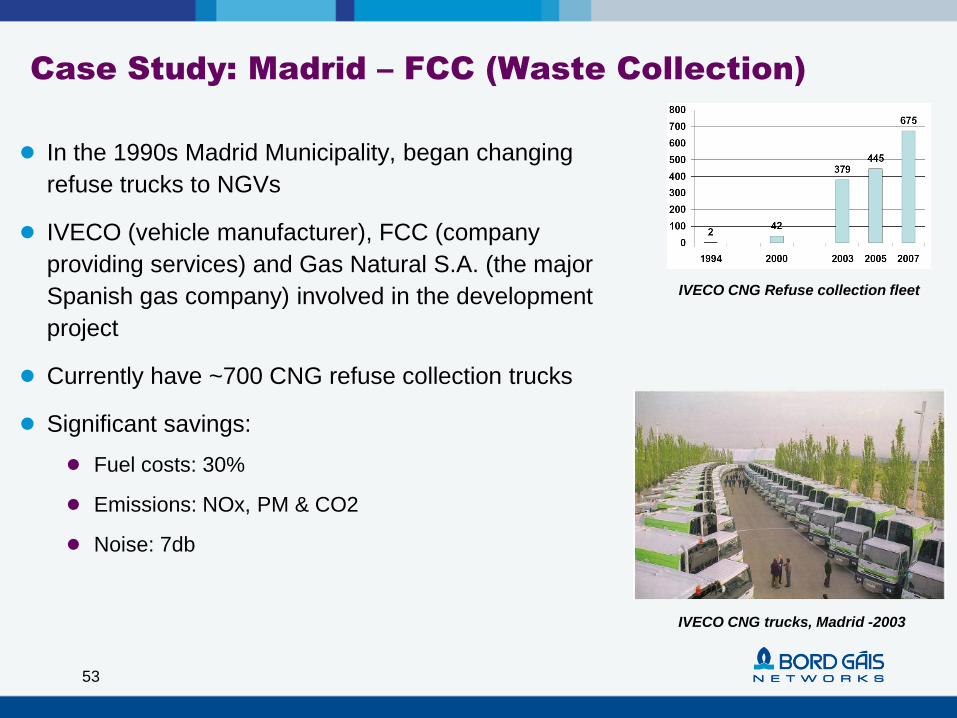
Case Study: Madrid – FCC (Waste Collection)
● In the 1990s Madrid Municipality, began changing
refuse trucks to NGVs
● IVECO (vehicle manufacturer), FCC (company
providing services) and Gas Natural S.A. (the major
Spanish gas company) involved in the development
project
● Currently have ~700 CNG refuse collection trucks
● Significant savings:
● Fuel costs: 30%
● Emissions: NOx, PM & CO2
● Noise: 7db
IVECO CNG trucks, Madrid -2003
IVECO CNG Refuse collection fleet
54
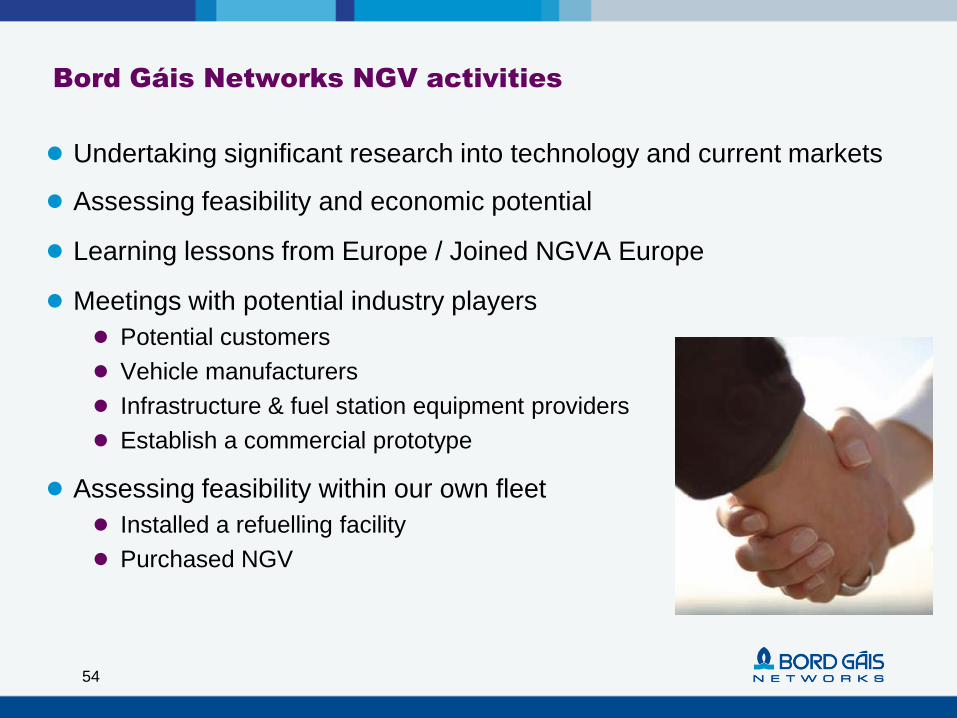
Bord Gáis Networks NGV activities
● Undertaking significant research into technology and current markets
● Assessing feasibility and economic potential
● Learning lessons from Europe / Joined NGVA Europe
● Meetings with potential industry players
● Potential customers
● Vehicle manufacturers
● Infrastructure & fuel station equipment providers
● Establish a commercial prototype
● Assessing feasibility within our own fleet
● Installed a refuelling facility
● Purchased NGV
55
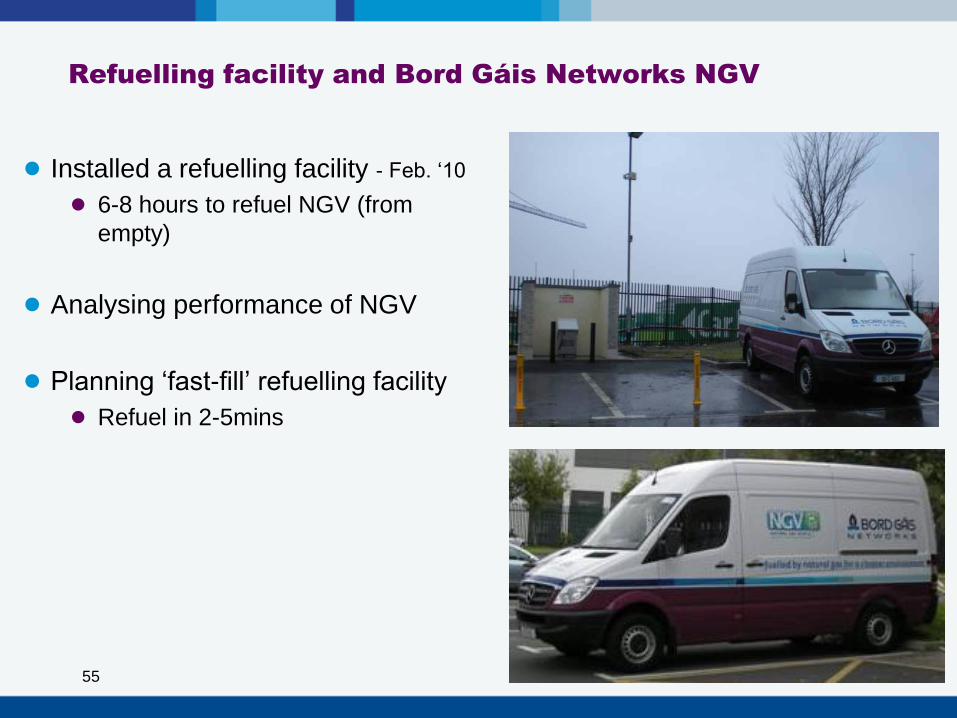
Refuelling facility and Bord Gáis Networks NGV
● Installed a refuelling facility - Feb. „10
● 6-8 hours to refuel NGV (from
empty)
● Analysing performance of NGV
● Planning „fast-fill‟ refuelling facility
● Refuel in 2-5mins
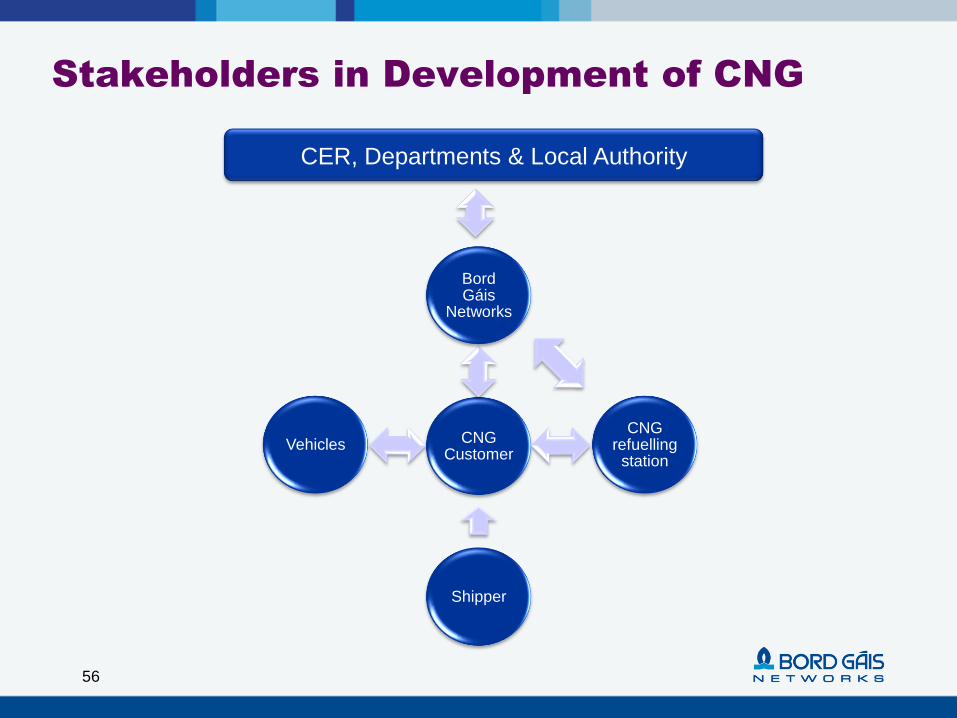
Stakeholders in Development of CNG
CNG Customer
Bord Gáis
Networks
CNG refuelling
station
Shipper
Vehicles
CER, Departments & Local Authority
56
57
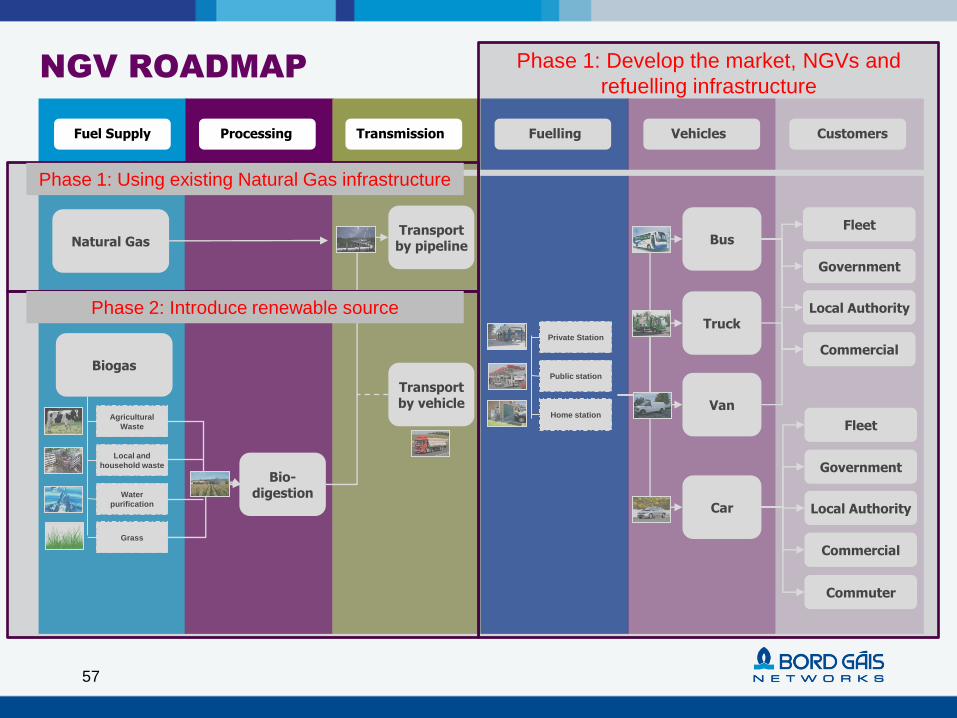
NGV ROADMAP
Fuel Supply Processing Transmission Fuelling Vehicles Customers
Biogas
Natural Gas
Agricultural
Waste
Local and
household waste
Water
purification
Grass
Bio-digestion
Transportby vehicle
Private Station
Public station
Home station
Bus
Truck
Van
Car
Fleet
Government
Local Authority
Commercial
Fleet
Government
Local Authority
Commercial
Commuter
Transportby pipeline
Phase 1: Develop the market, NGVs and
refuelling infrastructure
Phase 1: Using existing Natural Gas infrastructure
Phase 2: Introduce renewable source
57
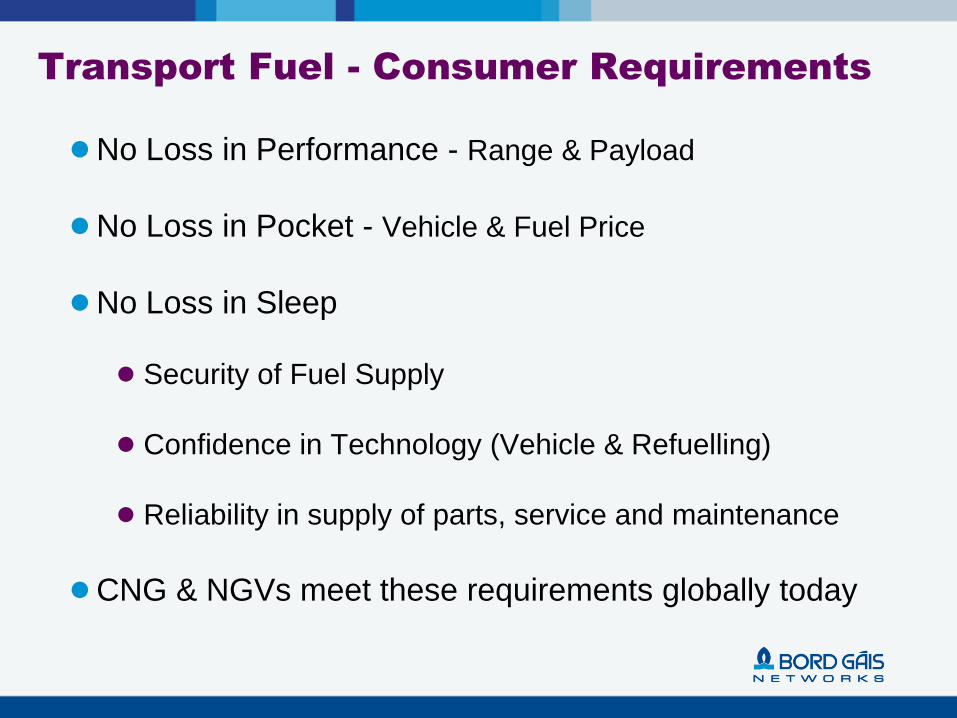
Transport Fuel - Consumer Requirements
● No Loss in Performance - Range & Payload
● No Loss in Pocket - Vehicle & Fuel Price
● No Loss in Sleep
● Security of Fuel Supply
● Confidence in Technology (Vehicle & Refuelling)
● Reliability in supply of parts, service and maintenance
● CNG & NGVs meet these requirements globally today

Thank you
59
Appendix
60
61
European NGV & Stations (September, 2010)
Source: NGVA Europe and the GVR
CountryTotal
NGVs
Cars and
Commercial
vehicles
BusesTrucks /
Lorries
Others (including
Forklifts, Road
Sweepers)
Total
Refuelling
stations
Public
stations
Private
stations
Italy 698,500 695,000 2,300 1,200 0 770 725 45
Russia 100,052 72,800 1,400 25,800 52 284 244 40
Germany 88,500 82,815 1,550 3,650 485 900 813 87
Sweden 28,093 26,492 1,120 480 1 142 110 32
France 13,307 10,000 2,300 1,000 7 125 15 110
Switzerland 9,279 9,028 135 56 60 126 123 3
Austria 4,983 4,936 41 6 0 216 168 48
Netherlands 3,502 2,800 552 150 0 66 49 17
Spain 2,539 506 989 1,001 43 42 2 40
Norway 521 280 198 22 21 9 6 3
United Kingdom 220 20 0 150 50 5 2 3
62
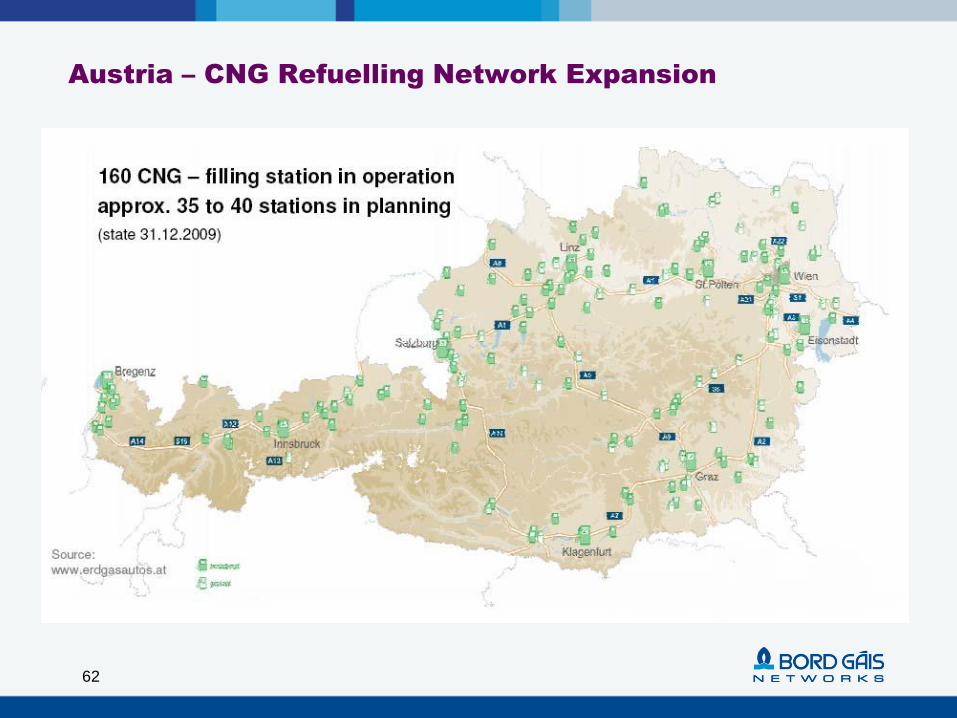
Austria – CNG Refuelling Network Expansion
63
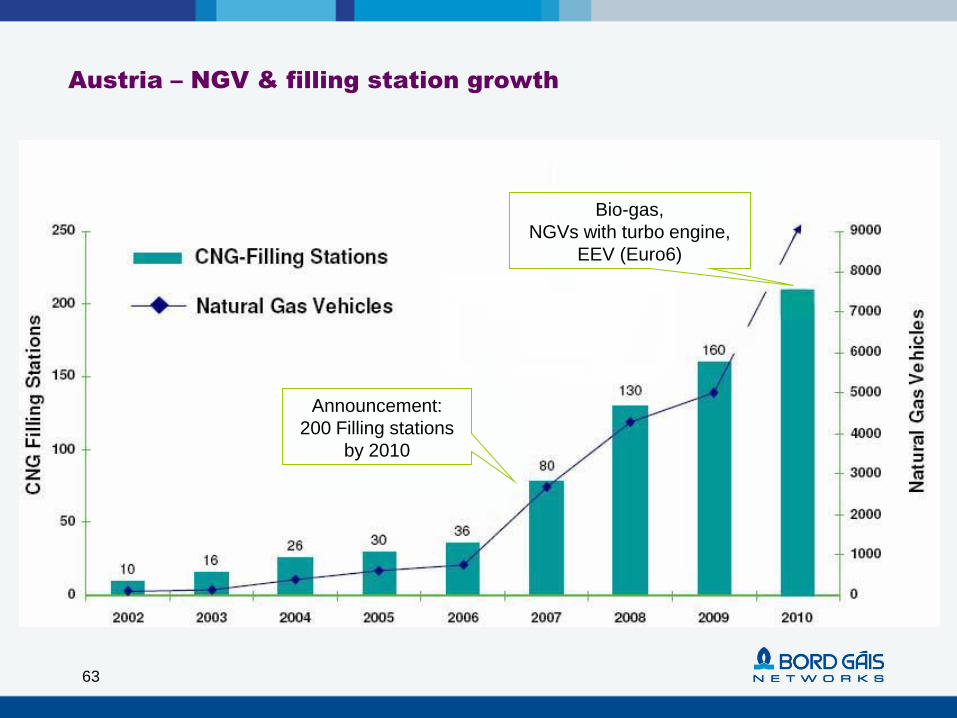
Austria – NGV & filling station growth
Announcement:
200 Filling stations
by 2010
Bio-gas,
NGVs with turbo engine,
EEV (Euro6)
64
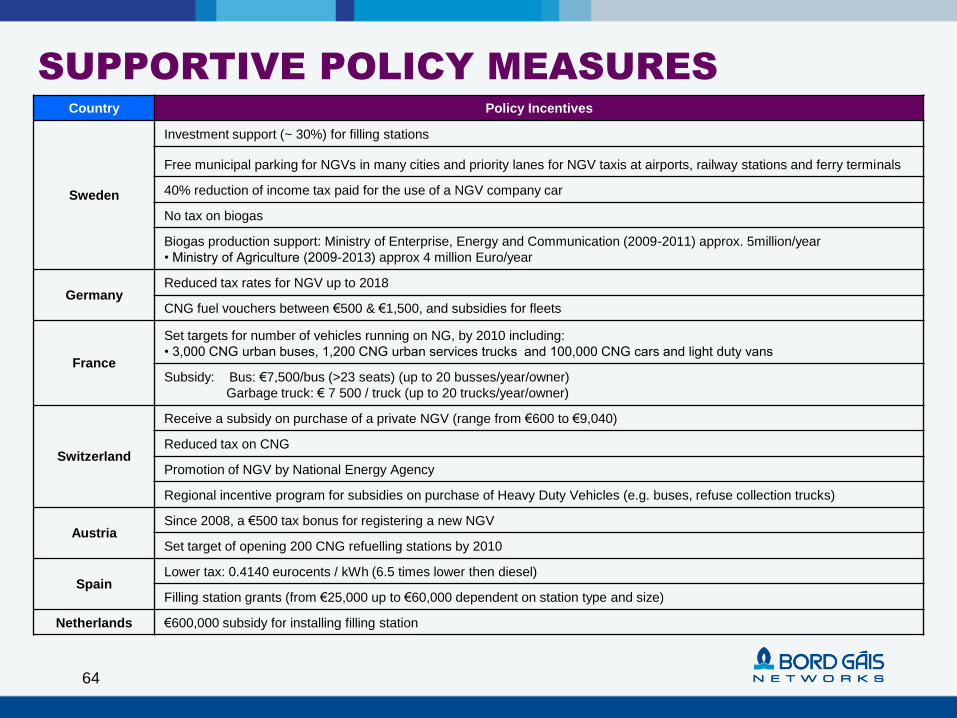
Country Policy Incentives
Sweden
Investment support (~ 30%) for filling stations
Free municipal parking for NGVs in many cities and priority lanes for NGV taxis at airports, railway stations and ferry terminals
40% reduction of income tax paid for the use of a NGV company car
No tax on biogas
Biogas production support: Ministry of Enterprise, Energy and Communication (2009-2011) approx. 5million/year
• Ministry of Agriculture (2009-2013) approx 4 million Euro/year
GermanyReduced tax rates for NGV up to 2018
CNG fuel vouchers between €500 & €1,500, and subsidies for fleets
France
Set targets for number of vehicles running on NG, by 2010 including:
• 3,000 CNG urban buses, 1,200 CNG urban services trucks and 100,000 CNG cars and light duty vans
Subsidy: Bus: €7,500/bus (>23 seats) (up to 20 busses/year/owner)
Garbage truck: € 7 500 / truck (up to 20 trucks/year/owner)
Switzerland
Receive a subsidy on purchase of a private NGV (range from €600 to €9,040)
Reduced tax on CNG
Promotion of NGV by National Energy Agency
Regional incentive program for subsidies on purchase of Heavy Duty Vehicles (e.g. buses, refuse collection trucks)
AustriaSince 2008, a €500 tax bonus for registering a new NGV
Set target of opening 200 CNG refuelling stations by 2010
SpainLower tax: 0.4140 eurocents / kWh (6.5 times lower then diesel)
Filling station grants (from €25,000 up to €60,000 dependent on station type and size)
Netherlands €600,000 subsidy for installing filling station
SUPPORTIVE POLICY MEASURES