Embed Size (px)
Citation preview

NATURAL GAS – SECURE ENERGY FOR THE FUTURE
IEI EVENING LECTURE
DENIS TWOMEY, COMMERCIAL OPERATIONS MANAGER, BORD GÁIS NETWORKS
FEBUARY 21ST, 2006
CONTENTS
GLOBASLISED GAS MARKET
SECURITY OF SUPPLY• Infrastructure• Fuel Diversity
THE IRISH SITUATION
GAS PRICING• Transportation Tariffs• International Wholesale Gas Prices
ENVIRONMENT
SUMMARY
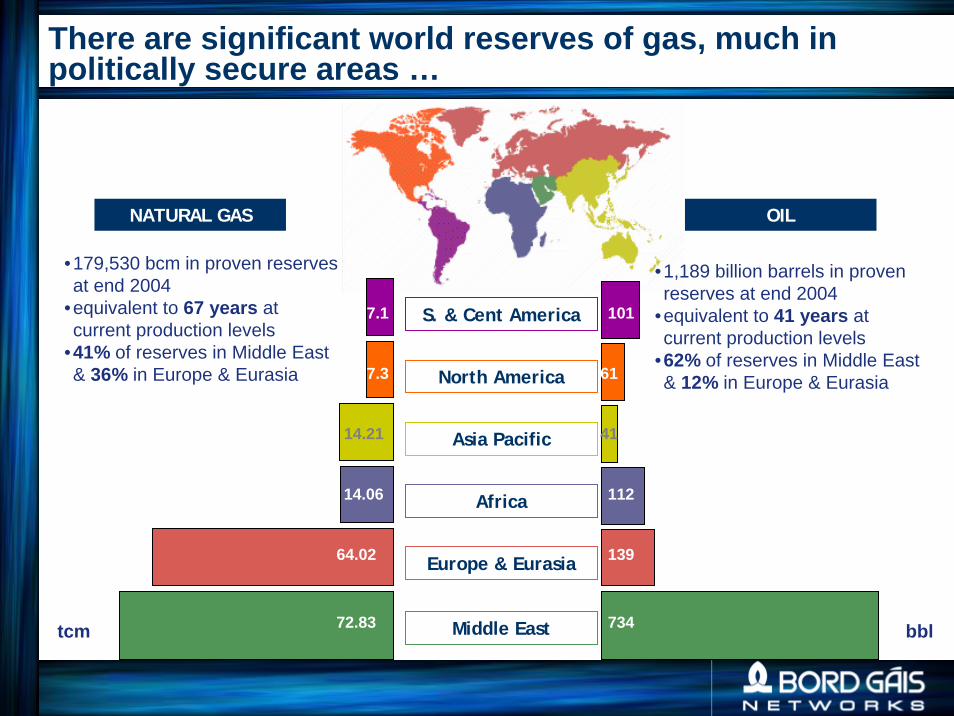
There are significant world reserves of gas, much in politically secure areas …
S. & Cent America
Europe & Eurasia
Middle East
Asia Pacific
North America
Africa
NATURAL GAS OIL
•179,530 bcm in proven reserves at end 2004
•equivalent to 67 years at current production levels
•41% of reserves in Middle East & 36% in Europe & Eurasia
•1,189 billion barrels in proven reserves at end 2004
•equivalent to 41 years at current production levels
•62% of reserves in Middle East & 12% in Europe & Eurasia
72.83tcm bbl
7.3
14.21
14.06
64.02
7.1
734
61
41
112
139
101

Gas was a regional commodity. Now a global market is emerging …

Over one-third of world gas reserves are in Europe and Eurasia …
ArzewSkikda
Cordoba
Lyon
St. Petersburg
Rom
Helsinki
Ljubljana
Oslo
StavangerKårsto
Kollsnes
Algier
Madrid
London
Kopenhagen
Prag
Berlin
BratislavaWien
Stockholm
Athen
Paris
Essen
Emden
Lissabon
Huelva
SinesCartagena
Barcelona
Fos-sur-Mer
Bilbao
Krk
Istanbul
La Spezia
Montoir
Zeebrügge
TyraEkofisk
TrollGullfaksStatfjord
HeimdalFrigg
Sleipner
Budapest
Tunis
Brüssel
Sofia
Bern
Belgrad
Dublin
Belfast
Warschau
Minsk
Bukarest
Oseberg
W'haven
ZagrebRovigo
El Ferrol
Valencia
Brindisi
Isle ofGrain
MilfordHaven
under construction orplanned
existingPipelines/LNG-Terminals
• Ireland uses c. 4.1 bcm per annum, which is less than 1% of the 466.9 bcm used in the EU 25.• In 2004 European Countries, including Norway, supplied about 60% of the gas used in Europe. Imports came primarily from Russia and Algeria. Liquefied Natural Gas (LNG) represents about 14% of total EU 25 gas imports.
•The EU is already heavily interconnected with further pipeline and LNG infra-structure being built
Proven Reserves 2004 in bcm
1490
590
Russia Fed. & Eurasia
57130
2390
5000Nigeria
Algeria
Norway
UK
NL
Iran27500
Qatar25780
UAE
6060
Libya1490
4550
Egypt1850
SaudiArabia6750

Current & Planned Transmission Infrastructure
Bord Gáis Networks currently include 1,965km of on-shore Ireland, two sub-sea Interconnectors, Isle of Man spur and North-West pipeline from Belfast to Derry City completed in 2004.
Mayo-Galway pipeline construction commenced in May 2005, 150km to be laid over two seasons for completion by autumn 2006, to facilitate delivering Corrib gas into grid.
South-North pipeline of 155km from Gormanston in Co. Meath to Belfast is scheduled for construction during 2006 with completion by October 2006, linking gas grids North & South.
PTL own SNIP, with BGE awarded contract to operate for 3 years
Phoenix own and operate transmission infrastructure adjacent to their network

Current & Planned Distribution Infrastructure
Bord Gáis Networks currently includes 8,915km of Distribution networks.
Natural Gas is available in over 100 population centres in 17 counties in Ireland, with over 500,000 gas users
Five new towns connected to Network and almost 40,000 new residential and 1,000 commercial gas users were added in 2004
New connections are subject to economic test, policy currently under review
BGE was awarded the licence to supply gas to towns along the pipeline routes in NI, construction roll-out started in 2005 with first customers now connected
Phoenix has over 2,650 km of gas pipelines in Greater Belfast area and serves over 93,000 gas customers

The regimes in both jurisdictions have developed separately reflecting local market conditions. Significant recent developments include:
Northern Ireland– Introduction of Postalised Transmission Tariff in NI among three pipeline owners
• Required changes to contractual terms and licences, and new processes e.g. Common Fund• Facilitated gas to Coolkeeragh & towns along routes
– Mutualisation of SNIP• Required stronger regulatory underpinning of risk• Facilitated lower tariffs – lower capital returns, projected lower opex
– Market Developments• Market open to 75,000 therms level in Greater Belfast area• BGE bringing gas to ten new towns along routes of new pipelines
Republic of Ireland– Entry/Exit transportation regime
• More flexibility for shippers• Facilitates sale of gas at IBP
– Unified Code of Operations for Transmission & Distribution• Streamlined service to shippers, e.g. single code
– Market Developments• Market open to non-household level, plans developed for full market opening due mid 2006
Current Commercial & Operational regimes
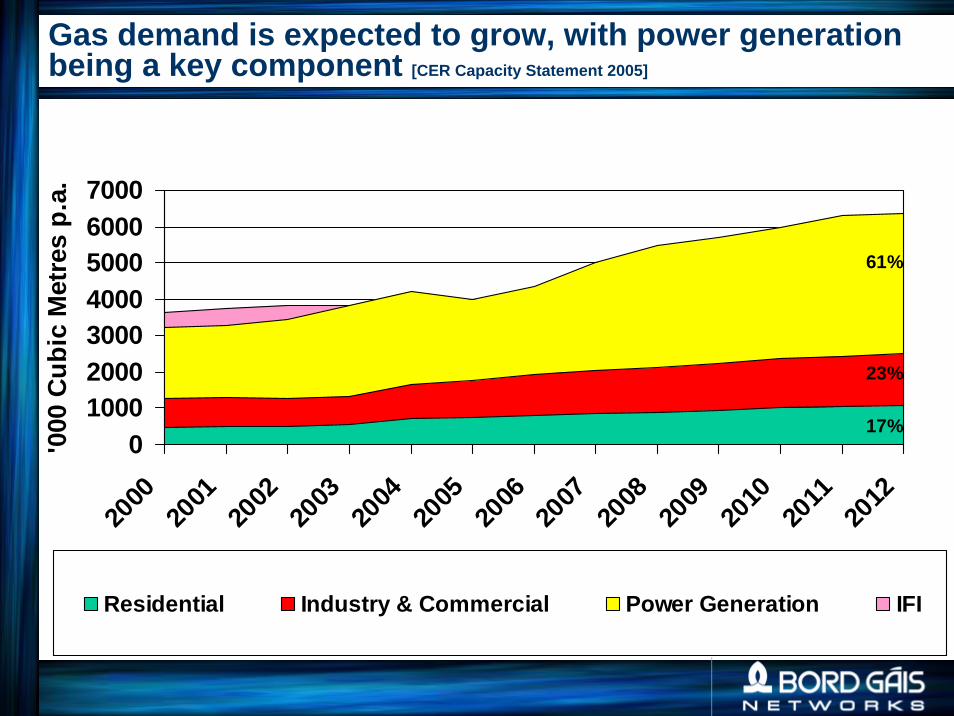
Gas demand is expected to grow, with power generation being a key component [CER Capacity Statement 2005]
01000200030004000500060007000
2000
2001
2002
2003
2004
2005
2006
2007
2008
2009
2010
2011
2012
'000
Cub
ic M
etre
s p.
a.
Residential Industry & Commercial Power Generation IFI
61%
23%
17%

0
5
10
15
20
25
30
35
40
45
50
NLHun
gary UKIta
lyLati
viaLith
uania
Slovakia
Belgium
Lithuan
iaIre
land
EU 25 av
erage
Austri
aDen
mark
German
yCze
ch R
ep.
Spain
France
Estonia
Portugal
Poland
Finalnd
Slovenia
Switzerl
and
Greec
eSwed
en
Share of Natural Gas in Primary Energy Consumption (%) 2004
The share of natural gas in Ireland at c. 25% of Primary Demand is in line with the EU average…

Role of Gas in Irish Fuel Mix
There has been commentary on ‘over-dependence’ of gas in Ireland. Some facts….
In 2004, Gas accounted for 11% of final energy demand, compared to an EU average of 24%.
By the end of 2004, 60% of total gas was used for power generation, 24% by the commercial and industrial sector and 16% by the residential sector.
Ireland’s current and projected levels of gas usage do not appear excessive against EU comparators
There’s scope for further growth…which will bring tariffs down. As gas Transporter, we encourage gas growth.
Source: SEI, Eurogas
6%
11%
64%
17%
2%
6%
24%
44%
19%
7%
0%
10%
20%
30%
40%
50%
60%
70%
80%
90%
100%
Solid Fuels Natural Gas Oil Electricity Other
IRELAND EU-25
FINAL ENERGY DEMAND 2004

Security of Gas Supplies
Security of Gas Supplies depends on:– Infrastructure Capacity being adequate– Diversity and Volumes of supply being available– Confidence in long-term pricing
We believe that measured against each of the above criteria, gas users in Ireland can be confident regarding security of gas supplies. So there shouldn’t be any reticence about increasing utilisation of gas from a security of supply perspective.
Infrastructure Capacity:– CER produces annual Gas Capacity Statement– Has concluded that there is sufficient capacity in the current transmission system to allow
reasonable expectations of demand to be met in medium term and we concur. Capacity is available on a firm and reliable basis throughout the year.
Diversity and Volumes of Supply:– Ireland’s gas supply infrastructure has a robust configuration. The construction of the South-North
pipeline will also add to this robustness of the all-Island system
– The development of the Corrib gas field will further enhance the security of gas supplies
– The source of longer-term supplies is becoming clearer, with investment in additional import capacity to the UK, enabling access to currently remote or stranded gas fields, and including LNG facilities giving diversity of sources and security of volumes.

ENHANCING SECURITY OF SUPPLY
INFRASTRUCTURE ADEQUATE FOR CURRENT DEMAND
DEVELOPMENT OF THE CORRIB FIELD COULD MAKE A BIG CONTRIBUTION
TWINNING OF SINGLE SECTION OF PIPELINE IN SCOTLAND, TIMING DEPENDENT ON CORRIB PROJECT
HOT SWITCHING FOR POWER GENERATION STATIONS
INTERCONNECTOR SYSTEM CAN BE UPGRADED AT LOW MARGINAL COSTS TO DELIVER ADDITIONAL ENERGY CAPACITY
DEVELOPING A BROADLY DEFINED SECURITY OF SUPPLY STANDARD
THEREFORE THE INCREASING USE OF GAS IN POWER GENERATION, IN LINE WITH EU TRENDS, SHOULD NOT CAUSE UNDUE CONCERN

GAS PRICING

The final price of gas is made up of a transportation charge plus commodity …
0
5
10
15
20
25
30
35
00/01 2001/2 2002/3 2003/4 2004/5 2005/6
€ / M
Wh
Transportation Gas Forward Gas
14% 20% 22% 19% 13% 10%

Households: Natural Gas prices July 2005*average usage 83.7 GJ/23,260 kWh/786 therms
* Prices expressed in Purchasing Power Standards and including taxes* Ireland’s prices include 25% increase in October 2005 – price increases in other countries since July 2005 are not recorded here
Source: Eurostat
02468
10121416182022
UK
L'bo
urg
Irel
and
Latv
ia
Lith
uani
a
Fran
ce
Hun
gary
Belg
ium
Ger
man
y
Aust
ria
Esto
nia
Czec
h
Spai
n
Slov
akia
N'la
nds
Pola
nd
Port
ugal
Slov
enia
Swed
en
Denm
ark
€ PP
S pe
r G
J
EU Average
Eurostat (D3) Gas Heating Pricesincluding taxes

Small Business: Natural Gas prices July 2005*average usage 418.6 GJ/0.1163 GWh/3.968 therms - no load factor
Source: Eurostat
Eurostat I1excluding VAT
0
2
4
6
8
10
12
14
L'bo
urg
Fran
ce
Irel
and
UK
Lith
uani
a
Latv
ia
Belg
ium
Esto
nia
Spai
n
Aust
ria
Czec
h
Ger
man
y
Denm
ark
Hun
gary
Slov
akia
N'la
nds
Swed
en
Pola
nd
Port
ugal
€ PP
S pe
r G
J EU Average
Prices expressed in Purchasing Power Standards and excluding VAT* Ireland’s prices include 25% increase in October 2005 – price increases in other countries since July 2005 are not recorded here

Medium Business: Natural Gas prices July 2005*average usage 4,186 GJ/1.163 GWh/39,679 therms - 200 days modulation
Source: Eurostat
0
2
4
6
8
10
12
14
Spai
n
Esto
nia
Irel
and
Fran
ce
L'bo
urg
Belg
ium UK
Latv
ia
Lith
uani
a
Aust
ria
Denm
ark
N'la
nds
Slov
akia
Ger
man
y
Czec
h
Hun
gary
Port
ugal
Pola
nd
€ PP
S pe
r G
J
EU Average
Eurostat I2excluding tax
Prices expressed in Purchasing Power Standards and excluding VAT* Ireland’s prices include 25% increase in October 2005 – price increases in other countries since July 2005 are not recorded here

The UK (NBP) increase in gas prices has been experienced on the Continent and even more so in the US …

However, we expect various market forces will put downward pressure on prices in the medium term …
2004 2007 2010
60p
40p
20p
Increasingprices Medium Price Zone
OilLinkage
UK SupplySqueeze
US GasDemand
High Price Zone
NBP
Price
NewPipelineSupplies
New LNGSupplies
LowerOil
Prices

UK Gas Supply Sources
•The availability of gas supplies from the UK or markets further afield is important to the Irish gas market, as long-term gas supplies are most likely to be delivered to Ireland through our Interconnectors with the UK. •This availability depends both on the level of gas reserves and the adequacy of gas transportation or storage infrastructure.•Using c. 100 bcm of gas per annum, the UK is the largest gas market in the EU. By 2010, imports are expected to account for 40%-50% of UK demand. This projected demand for imports has led to numerous new import infrastructure projects being planned, currently totalling over 100 bcm per annum capacity.•These projects remove any disconnect between UK & European markets. Ireland has strong interconnectivity with the UK and therefore Europe.
UK: Planned New Gas Supply and LNG Projects
Project Operator Route Import Volume
Expected Completion
Ormen Lange field
Norsk
Hydro/Shell/Statoil
Ormen Lange (Norway) to
Easington 20 2006/7
Statfjord field Shell/ExxonMobil Statfjord (NY) to St. Fergus 4 2006Interconnector
compression Interconnector-UK Zeebrugge (BL) to Bacton +20 2006Bacton-Balgzand
Line
Gas Transport
Services Balgzand (NL) to Bacton 16 2007Isle of Grain (2
phases) NGT LNG Import facility 5-15 2005-08
Milford Haven Petroplus/BG LNG Import facility 6 2007
Milford Haven
ExxonMobil/Qatar
Pet. LNG Import facility 20 2007North European
Pipeline Gazprom/E.On
Russia via continental
Europe to Bacton 20-30 post- 2010
TOTAL 125 bcm

Positive outlook on UK Demand Supply Position over the next few years …
Forecast UK Demand

Wholesale Gas Prices
Many LNG & Pipeline projects being developedLNG projected to account for one-third of supply capacity to western Europe by 2012Middle East LNG can reach virtually all markets for c. US$4/mmbtu (22p/therm)Expectation that this will effectively be price limit for pipeline gas in longer-termNew investment in pipes and LNG gives strong security of supply volumes and diversity of sourcesShort-term demand/supply squeeze in UK will ease over next few years
6
$/MMBtu
2013 20150
5
4
3
2
1
ItalyUK - NBP
NW EuropeIberia
HighOil Price
UK Exportsto Continentre-emerge
UKOvercapacity
More Non-OPEC ProductionOil Prices < $40/bbl
20112009200720052003
SignificantCaspian Supplies
Source: Cambridge Energy Research Associates.50501-37

Finally, in environmental terms natural gas is the cleanest fossil fuel with low carbon emissions …
Natural gas is by far the cleanest fossil fuel and is a major contributing factor in the reduction of atmospheric emissions of pollutants such as:
– sulphur dioxide– nitrogen oxides and – smoke
Carbon dioxide emissions from natural gas are up to 30% less than oil and 50% less than coal - for the same energy input
CCGT units - 50% greater efficiency compared with 37% for coal
Greenhouse gas emissions for Ireland are 29% above 1990 levels.
Greater utilisation of gas will contribute to meeting the Kyoto targets and also reduce the total cost of carbon permits
0.01.02.03.04.05.0
CO2 Per TOE
Peat Coal Oil - Heavy Oil - Light Natural Gas

GOING FORWARD
SECURITY OF SUPPLYEU has economic access to significant long term sourcesIreland has adequate gas infrastructureIreland’s gas dependence in line with EU averageCorrib can make a big contributionComplete twinning of pipeline in Scotland, timing to depend on CorribGenerators to retain back-up fuel stocks as per licencesJoint approach to gas and electricity security and emergency planning
PRICESRemaining high near termProspects for reductions in the medium term due to developing pipeline and LNG infrastructure in the UK and wider EUGas prices will be a key influence on Irish and European power prices for the foreseeable future
ENVIRONMENTGreater gas utilisation contributes to energy efficiency and to the environment

Questions and Discussion