Embed Size (px)
Citation preview

Natural Gas pipelines distribution: analysis of risk, design and maintenance to improve the safety performance
Augusto Bianchini*, Filippo Donini*, Alessandro Guzzini*, Marco Pellegrini*, Cesare Saccani*
*Department of Industrial Engineering, University of Bologna, Viale Risorgimento 2, 40136 - Bologna – Italy([email protected], [email protected], [email protected],
[email protected], [email protected])
Abstract: The paper shows an overview of general characteristics, design, maintenance and hazards of natural gas transportation systems. Paper analysis starts from the description of the natural gas distribution systems, which represent the final section of the natural gas transportation. Since accidents on distribution gas system could threatening the urban safety, risk analysis needs to be assessed. For this purpose, the main hazardous consequences that may happen after a failure of the natural gas pipeline are defined. Correct design, installation and maintenance are required to reduce both frequency and impact of these accidents: a brief description of the principal technical requirements is reported.
Keywords: Natural Gas pipeline, Risk assessment, Release rate, Natural gas pipeline design.
1.The Natural Gas Distribution System
1.1 Main characteristics and components
Natural Gas (NG) transport from wellhead to residential or business as clean and efficient source of energy needs of a complex transportation system that have to be safety and reliable.
NG moves through a complex pipeline system, which includes elements like pipes, valves, compression stations, pressure regulation stations, metering stations, pressure vessels, pulsation dampeners and relief valves that vent NG when safety conditions are not assured.
Figure 1: NG compression station.
There are three major type of NG pipelines ranging in size and inside pressure: gathering systems, transmission systems and distribution systems. Gathering pipelines
gather raw NG from production wells; transmission pipeline transport NG to pre-processing plants or storage facilities. Distribution system is the last part of the transportation system and distributes NG to the end-users.
Figure 2: NG distribution system.
In Italy, Gas distribution system is composed by:
1. A first pressure reducing station (REMI): NG comesfrom the national transportation system, conducted by
XX Summer School "Francesco Turco" - Industrial Systems Engineering
243
SNAM, at a pressure in the range 12-64 barg and reduce it down to 5 barg.
2. Pipelines at medium pressure: NG is transported at apressure in the range 0.5-5 barg.
3. A second pressure reducing station: NG pressure isfurther reduced down to 40 mbarg (GRF).
4. Pressure reducing stations for industrial utilities (GRI).5. GN distribution networks: NG is transported at a
pressure in the range 18-40 mbarg.6. Components like valves, vents, meters, piping, joints,
etc…7. Corrosion control systems.8. Remote control system.
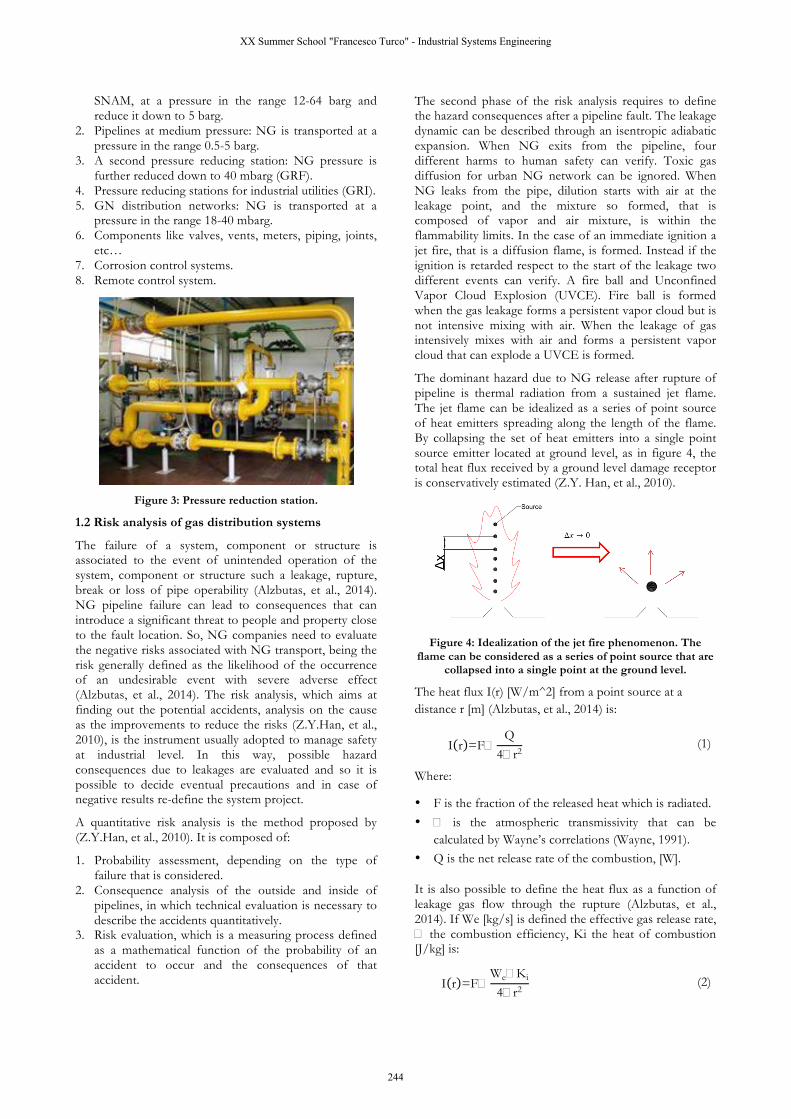
Figure 3: Pressure reduction station.
1.2 Risk analysis of gas distribution systems
The failure of a system, component or structure is associated to the event of unintended operation of the system, component or structure such a leakage, rupture, break or loss of pipe operability (Alzbutas, et al., 2014). NG pipeline failure can lead to consequences that can introduce a significant threat to people and property close to the fault location. So, NG companies need to evaluate the negative risks associated with NG transport, being the risk generally defined as the likelihood of the occurrence of an undesirable event with severe adverse effect (Alzbutas, et al., 2014). The risk analysis, which aims at finding out the potential accidents, analysis on the cause as the improvements to reduce the risks (Z.Y.Han, et al., 2010), is the instrument usually adopted to manage safety at industrial level. In this way, possible hazard consequences due to leakages are evaluated and so it is possible to decide eventual precautions and in case of negative results re-define the system project.
A quantitative risk analysis is the method proposed by (Z.Y.Han, et al., 2010). It is composed of:
1. Probability assessment, depending on the type offailure that is considered.
2. Consequence analysis of the outside and inside ofpipelines, in which technical evaluation is necessary todescribe the accidents quantitatively.
3. Risk evaluation, which is a measuring process definedas a mathematical function of the probability of anaccident to occur and the consequences of thataccident.
The second phase of the risk analysis requires to define the hazard consequences after a pipeline fault. The leakage dynamic can be described through an isentropic adiabatic expansion. When NG exits from the pipeline, four different harms to human safety can verify. Toxic gas diffusion for urban NG network can be ignored. When NG leaks from the pipe, dilution starts with air at the leakage point, and the mixture so formed, that is composed of vapor and air mixture, is within the flammability limits. In the case of an immediate ignition a jet fire, that is a diffusion flame, is formed. Instead if the ignition is retarded respect to the start of the leakage two different events can verify. A fire ball and Unconfined Vapor Cloud Explosion (UVCE). Fire ball is formed when the gas leakage forms a persistent vapor cloud but is not intensive mixing with air. When the leakage of gas intensively mixes with air and forms a persistent vapor cloud that can explode a UVCE is formed.
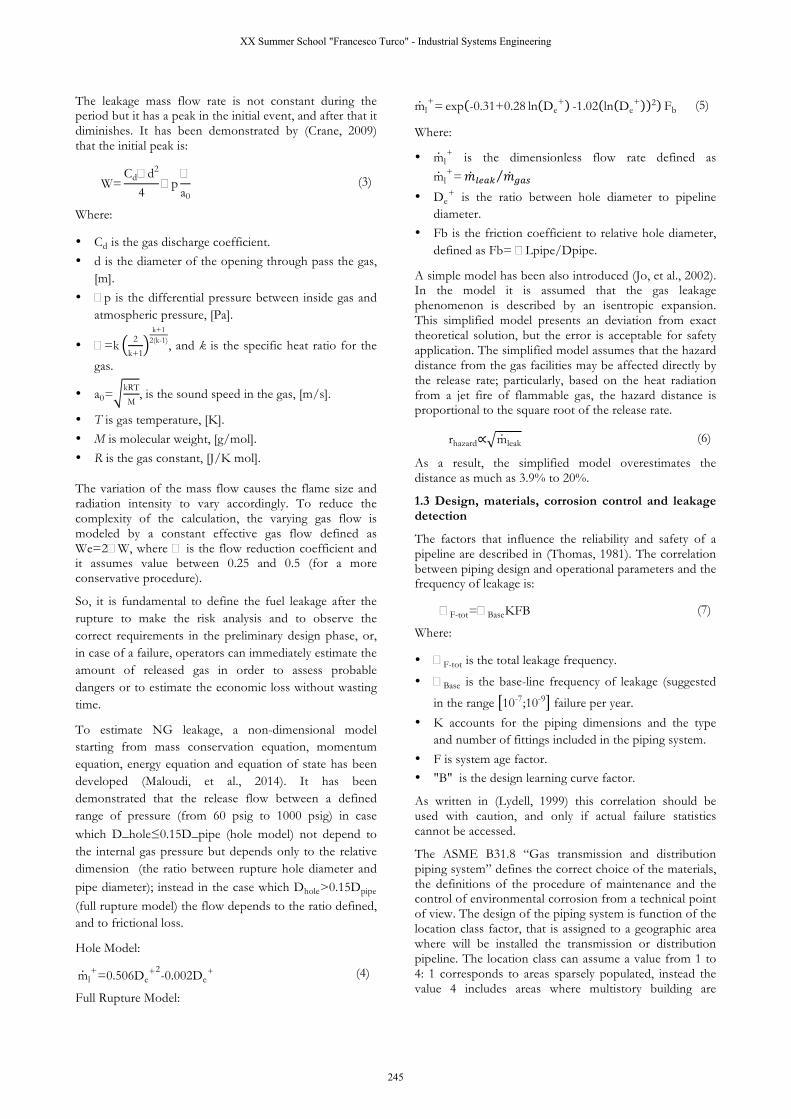
The dominant hazard due to NG release after rupture of pipeline is thermal radiation from a sustained jet flame. The jet flame can be idealized as a series of point source of heat emitters spreading along the length of the flame. By collapsing the set of heat emitters into a single point source emitter located at ground level, as in figure 4, the total heat flux received by a ground level damage receptor is conservatively estimated (Z.Y. Han, et al., 2010).
Figure 4: Idealization of the jet fire phenomenon. The flame can be considered as a series of point source that are
collapsed into a single point at the ground level.
The heat flux I(r) [W/m^2] from a point source at a distance r [m] (Alzbutas, et al., 2014) is:
I r =F�Q4�r2
(1)
Where:
• F is the fraction of the released heat which is radiated.• � is the atmospheric transmissivity that can be
calculated by Wayne’s correlations (Wayne, 1991).• Q is the net release rate of the combustion, [W].
It is also possible to define the heat flux as a function of leakage gas flow through the rupture (Alzbutas, et al., 2014). If We [kg/s] is defined the effective gas release rate, � the combustion efficiency, Ki the heat of combustion [J/kg] is:
I r =F�We�Ki4�r2
(2)
XX Summer School "Francesco Turco" - Industrial Systems Engineering
244
The leakage mass flow rate is not constant during the period but it has a peak in the initial event, and after that it diminishes. It has been demonstrated by (Crane, 2009) that the initial peak is:
W=Cd�d
2
4�p�a0
(3)
Where:
• Cd is the gas discharge coefficient.• d is the diameter of the opening through pass the gas,
[m].• �p is the differential pressure between inside gas and
atmospheric pressure, [Pa].
• �=k 2
k+1
k+12(k-1), and k is the specific heat ratio for the
gas.
• a0=kRT
M, is the sound speed in the gas, [m/s].
• T is gas temperature, [K].• M is molecular weight, [g/mol].• R is the gas constant, [J/K mol].
The variation of the mass flow causes the flame size and radiation intensity to vary accordingly. To reduce the complexity of the calculation, the varying gas flow is modeled by a constant effective gas flow defined as We=2�W, where � is the flow reduction coefficient and it assumes value between 0.25 and 0.5 (for a more conservative procedure).
So, it is fundamental to define the fuel leakage after the rupture to make the risk analysis and to observe the correct requirements in the preliminary design phase, or, in case of a failure, operators can immediately estimate the amount of released gas in order to assess probable dangers or to estimate the economic loss without wasting time.
To estimate NG leakage, a non-dimensional model starting from mass conservation equation, momentum equation, energy equation and equation of state has been developed (Maloudi, et al., 2014). It has been demonstrated that the release flow between a defined range of pressure (from 60 psig to 1000 psig) in case which D_hole≤0.15D_pipe (hole model) not depend to the internal gas pressure but depends only to the relative dimension (the ratio between rupture hole diameter and pipe diameter); instead in the case which Dhole>0.15Dpipe (full rupture model) the flow depends to the ratio defined, and to frictional loss.
Hole Model:
ml+=0.506De
+2-0.002De+ (4)
Full Rupture Model:
ml+= exp -0.31+0.28 ln De
+ -1.02 ln De+ 2 Fb (5)
Where:
• ml+ is the dimensionless flow rate defined as
ml+=𝑚!"#$ 𝑚!"#
• De+ is the ratio between hole diameter to pipeline
diameter.• Fb is the friction coefficient to relative hole diameter,
defined as Fb= �Lpipe/Dpipe.
A simple model has been also introduced (Jo, et al., 2002). In the model it is assumed that the gas leakage phenomenon is described by an isentropic expansion. This simplified model presents an deviation from exact theoretical solution, but the error is acceptable for safety application. The simplified model assumes that the hazard distance from the gas facilities may be affected directly by the release rate; particularly, based on the heat radiation from a jet fire of flammable gas, the hazard distance is proportional to the square root of the release rate.
rhazard∝ mleak (6)
As a result, the simplified model overestimates the distance as much as 3.9% to 20%.
1.3 Design, materials, corrosion control and leakage detection
The factors that influence the reliability and safety of a pipeline are described in (Thomas, 1981). The correlation between piping design and operational parameters and the frequency of leakage is:
�F-tot=�BaseKFB (7)
Where:
• �F-tot is the total leakage frequency.
• �Base is the base-line frequency of leakage (suggested
in the range 10-7;10-9 failure per year.
• K accounts for the piping dimensions and the typeand number of fittings included in the piping system.
• F is system age factor.• "B" is the design learning curve factor.
As written in (Lydell, 1999) this correlation should be used with caution, and only if actual failure statistics cannot be accessed.
The ASME B31.8 “Gas transmission and distribution piping system” defines the correct choice of the materials, the definitions of the procedure of maintenance and the control of environmental corrosion from a technical point of view. The design of the piping system is function of the location class factor, that is assigned to a geographic area where will be installed the transmission or distribution pipeline. The location class can assume a value from 1 to 4: 1 corresponds to areas sparsely populated, instead the value 4 includes areas where multistory building are
XX Summer School "Francesco Turco" - Industrial Systems Engineering
245
prevalent and where it possible to find other service pipeline underground.
This factor is fundamental to design the pipeline system, and particularly to identify the piping thickness for a certain gas internal pressure and for a certain external diameter of steel pipe:
p=2StDFET (8)
Where:
• p is the piping design pressure, in psig.
• D is the external diameter, in.
• t is the wall thickness, in.
• S is the specified minimum yield strength of thematerial, psi.
• F is the location class factor (values in table 1).
• E is the longitudinal joint factor .
• T is the temperature derating factor(values in table 2).
Location class Design Factor
Location Class 1, Division 1
0.80
Location Class 1, Division 2
0.72
Location Class 2 0.60
Location Class 3 0.50
Location Class 4 0.40
Table 1: Location class factor values.
The wall thickness calculated by the correlation above should resist to gas internal pressure but also it should resist to other load without damage. As it can be seen in table 1, for the same design conditions and the same external diameter, a pipeline that will be installed in Class 1 should have a thickness that is the half of a pipe that will be installed in Class 4.
Temperature, [°C]
Derating Factor
120 or less 1.000
150 0.967
176 0.933
204 0.900
232 0.867
Table 2: Temperature derating factors
The minimum distances from other underground pipelines, roads railroads are defined in the code. Also the minimum requirements for the installation, particularly for
system that are installed where they will be subject to natural hazards, such as earthquake-related events or other conditions that may cause serious movement, are described; reasonable precautions should be taken in mind to protect the line as increase the wall thickness, constructing revetments and installing anchors.
Because the principal cause of rupture is due to intervention of the people along the line, the Code define the depth of installation that is function of the type of ground and of the location Class.
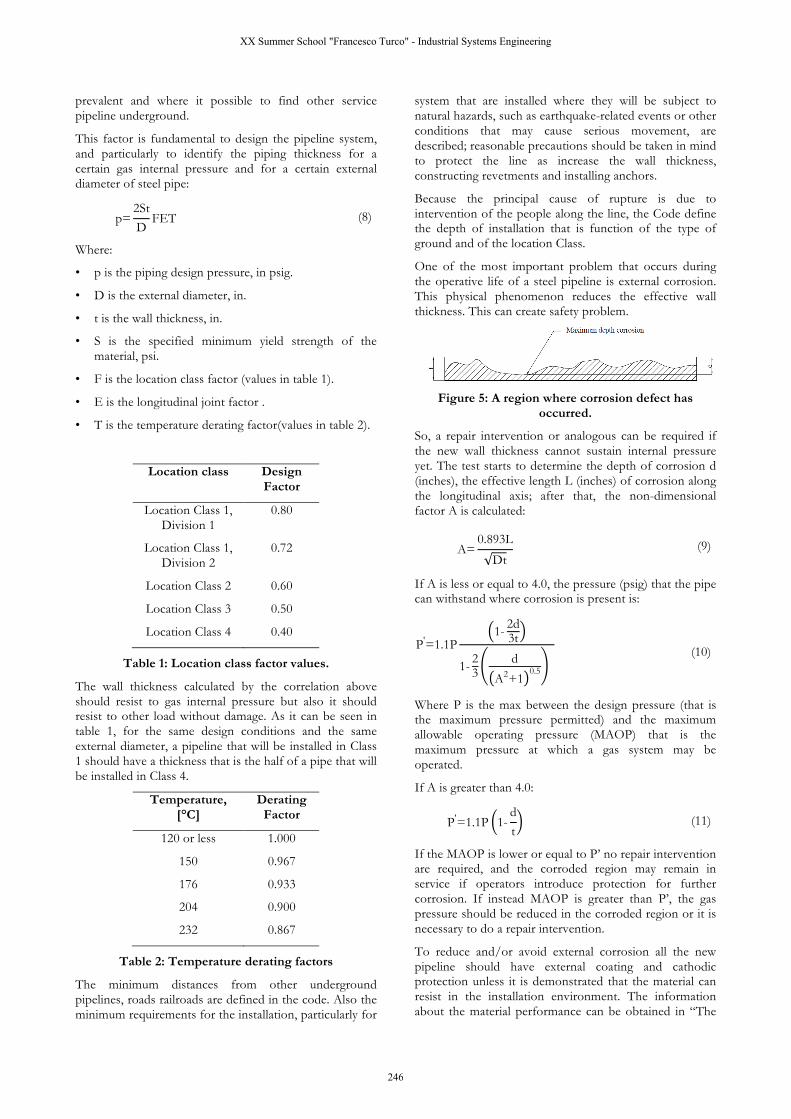
One of the most important problem that occurs during the operative life of a steel pipeline is external corrosion. This physical phenomenon reduces the effective wall thickness. This can create safety problem.
Figure 5: A region where corrosion defect has occurred.
So, a repair intervention or analogous can be required if the new wall thickness cannot sustain internal pressure yet. The test starts to determine the depth of corrosion d (inches), the effective length L (inches) of corrosion along the longitudinal axis; after that, the non-dimensional factor A is calculated:
A=0.893L
Dt(9)
If A is less or equal to 4.0, the pressure (psig) that the pipe can withstand where corrosion is present is:
P'=1.1P1- 2d3t
1- 23d
A2+10.5
(10)
Where P is the max between the design pressure (that is the maximum pressure permitted) and the maximum allowable operating pressure (MAOP) that is the maximum pressure at which a gas system may be operated.
If A is greater than 4.0:
P'=1.1P 1-dt
(11)
If the MAOP is lower or equal to P’ no repair intervention are required, and the corroded region may remain in service if operators introduce protection for further corrosion. If instead MAOP is greater than P’, the gas pressure should be reduced in the corroded region or it is necessary to do a repair intervention.
To reduce and/or avoid external corrosion all the new pipeline should have external coating and cathodic protection unless it is demonstrated that the material can resist in the installation environment. The information about the material performance can be obtained in “The
XX Summer School "Francesco Turco" - Industrial Systems Engineering
246
Corrosion Data Survey” published by the NACE (National Association of Corrosion Engineers).
However it is also important to monitoring the phenomenon during the life of the system. The frequency of the inspections is defined by the following:
• Pipeline conditions.
• Type of cathodic corrosion method used.
• Corrosiveness of the installation environment.
• Probability of loss or interruption of protection.
• Operating experience, including inspection and leakinvestigations.
• Public or employee safety.
Other materials, different from steel, can be used. Ductile iron, that is iron in which spheroidal graphite is in a granular form, is one of them. Plastic materials is limited to mains and service lines in typical distribution systems operating at a pressure of 100 psi or less.
Like for the steel the wall thickness design for plastic materials is:
p=2StD-t
×0.32 (12)
Where S, for thermoplastic pipe and tubing, is the long term hydrostatic strength determined in accordance with the listed specification at a design temperature; instead for thermosetting plastic pipe 11,000 psi is used.
Copper, like plastic, can be used only when pressure is less than 100 psig and when there hydrogen sulfide concentration in the gas stream is lower than a limit value.
As described in the previous section, gas leakage can be responsible of human deaths and economic loss. To avoid them the Code define simple requirements to find a gas leakage.
1. Surface gas detection survey: this survey consists of acontinuous sampling of the atmosphere at or nearground level. This test is inefficient in adverseconditions.
2. Subsurface gas detection survey: it consists in thesampling of the subsurface atmosphere with acombustible gas indicator (CGI) or other devicecapable of detecting 0.5% gas in air at the samplepoint.
3. Vegetation survey: it uses visual observations to detectabnormal or unusual indications in vegetation.
4. Pressure drop test: the test determines if an isolatedsegment of the pipeline loses pressure due to aleakage.
5. Bubble leakage test: a soapy water solution is appliedon exposed piping to determine the existence of aleak.
6. Ultrasonic leakage test: the ultrasonic energy due to agas leakage is determined. It is difficult to use this
method when there is present an ultrasonic background.
To obtain correct results, the choice of the instrument to use is fundamental; however instruments must be used in the correct way defined by the manufacturer in the manual of the instrument.
2. Future developments and industrial implementation
To minimize the probability and the hazard consequent to a gas pipeline failure is necessary to understand what are its principal causes. These are briefly explained in 1.2; particularly, with those information and with research activity it is possible to define the actions that must be implemented in case of a gas accident. In fact an accurate plan to actuate in the first moments of a gas accident can save human lives and improve network operators and firefighters intervention.
As described in 1.3, it is also important to size and design gas pipelines without reduce safety of the system. During service different phenomena interact with each other; between these we recall the following: gas pressure inside pipeline, corrosion, earthquakes and other external loads due to third parties. When the interactions between these different phenomena are not known, the solution adopted by gas distribution network operators is commonly to oversize the pipeline. This solution produces an increase in costs and therefore prolongs the payback period of the investment. Furthermore the maintenance program cannot be optimized and it is possible that network operators plan maintenance service before necessary time to reduce risk; this contributes to increase the variable costs of annual services. For this reason, future developments of research activity should be focalized to analyze interactions between different phenomena so to define sizing correlations more accurate than those currently present in the state of the art.
Finally, several failures can be identified before them occur implementing a complex monitoring and acquisition data system, that provide the operator with real-time information across the network. When an unusual condition occur, network operators can take more correct decision thanks to this system; particularly gas network operators may send teams of specialized workers on site to assess the criticality of the situation. This system is composed, simplify, by a central interface for the operator that analyzes data, and by process instruments that are located along the line. To improve network monitoring a lot of instruments should be installed along the pipelines. However this solution implies the rising of capital cost due to the instruments purchase. From an industrial point of view, it is so important to perform a feasibility study that compared the rising of cost to the reduction due to the fewer failures that occur and the optimization of maintenance plan that can be obtained.
3. Conclusions
In this paper NG transportation system and particularly the distribution system is described. The principal hazards
XX Summer School "Francesco Turco" - Industrial Systems Engineering
247
for safety, that are consequences of gas leakage, are reported. As in the literature presented, the principal harm to human safety for NG leakage is due to jet fire. For this reason, a simple model to evaluate thermal radiation for a jet fire is described, and it is observed that it depends to leakage flowrate. The mass flow rate can be obtained by three different methods, that are reported, and that overestimates the leakage respect the theoretical solution. In one of these, it is demonstrated that for jet fire, hazard distance is proportional to the square root of the leakage.
Finally ASME B31.8 is considered and some requirements for the preliminary design of NG distribution system is highlighted, as material specification, wall thickness calculation, corrosion control and gas leaks detection. Particularly it is defined a method to estimates the necessity of repair interventions in case of the presence of a corrosion defect.
References
Alzbutas, R., Iesmantas, T., Povilaitis, M. & Vitkutè, J. (2014). Risk and uncertainty analysis of gas pipeline failure and gas combustion consequence. Stochastic Environmental Research and Risk Assessment, Volume 28, pp. 1431-1446.
Casal, J. et al. (1998). Design of a computer tool for the evaluation of the consequences of an accidental natural gas releases in distribution pipes. Journal of Loss Prevention in the Process Industries, Volume 11, pp. 135-148.
Cheng, L. et al. (2015). Fire spread simulation using GIS: Aiming at urban natural gas pipeline. Safety Science, Volume 75, pp. 23-35.
Cimellaro, G., Villa, O. & Bruneau, M. (2015). Resilience-based design of natural gas distribution networks. Journal of Infrastructure Systems, Volume 21, pp. 1-14.
Engineers, A. S. o. M. (2003). Asme Code for Pressure Piping, B31.8. Gas Transmission and Distribution Piping System. Ney York: s.n.
Han, Z. & Weng, W. (2010). An integrated quantitative risk analysis method for natural gas pipeline network. Journal of Loss Prevention in the Process Industries, Volume 23, pp. 428-436.
Herràn-Golnzàlez, A., De La Cruz, J., De Andrès-Toro, B. & Risco-Martin, J. (2009). Modeling and simulation of a gas distribution pipeline network. Applied Mathematical Modelling, Volume 33, pp. 1584-1600.
Jo, Y.-D. & Ahn, B. J. (2005). A method of quantitative risk assessment for transmission pipeline carrying natural gas. Journal of Hazardous Materials, Volume A123, pp. 1-12.
Jo, Y.-D. & Crowl, D. A. (2008). Individual risk analysis of high-pressure natural gas pipelines. Journal of Loss Prevention in the Process Industries, Volume 21, pp. 589-595.
Lydell, B. (2000). Pipe failure probability. Reliability Engineering & System Safety, Volume 68, pp. 207-217.
Metropolo, P. & Brown, A. (2004). Natural Gas Pipeline Accident Consequences Analysis. Process Safety Progress, Volume 23, pp. 307-310.
Moloudi, R. & Esfahani, J. A. (2014). Modeling a gas release following pipeline rupture: Proposing non-dimensional correlation. Journal of Loss Prevention in the Process Industries, Volume 32, pp. 207-217.
Jo, Young-Do; Ahn, Bum Jong (2003). A simple model for the release rate of hazardous gas from a hole on high-pressure pipelines. Journal of Hazardous Materials, Volume A97, pp. 31-46.
Rìos-Mercado, R. Z. & Borraz-Sàanchez, C. (2015). Optimization problems in natural gas transportation systems: A state-of-the-art review. Applied Energy, Volume 147, pp. 536-555.
Thomas, H. (1981). Pipe and vessel failure probability. Reliability Engineering, Volume 2, pp. 83-124.
Wayne, F. (1991). An economical formula for calculating atmospheric infrared transmissivities. Journal of Loss Prevention in the Process Industries, Volume 4, pp. 86-92.
XX Summer School "Francesco Turco" - Industrial Systems Engineering
248


![Condition Based Maintenance optimization for a service plantsummerschool-aidi.it/edition-2015/images/ancona2013/... · 2015. 9. 25. · condition based maintenance (CBM). CBM [9][10][11]](https://img.pdfslide.us/doc/110x75/60db21983529ec225d072b92/condition-based-maintenance-optimization-for-a-service-plantsummerschool-aidiitedition-2015imagesancona2013.jpg)