Embed Size (px)
Citation preview

TO: FMPA Executive Committee FROM: Mark Larson/Jim Arntz DATE: February 1, 2017 RE: Executive Committee Telephonic Rate Workshop Thursday, February 9, 2017 at 2:00PM PLACE: Florida Municipal Power Agency, 8553 Commodity Circle, Orlando, FL
1st Floor Conference Room, Orlando, Florida
DIAL-IN INFORMATION: 855-831-5534, Access Code 13254# (If you have trouble connecting via phone, please call 407-355-7767)
Chairman Howard McKinnon, Presiding
AGENDA 1. Call to Order and Roll Call 2. Information Items:
a. Natural Gas Markets Update b. Liquidity Update c. Pool Operations Update for January d. Overview of January Loads e. Review of January Costs f. Review of January ARP Rate Calculation g. Estimated Rate Ranges for February 2017 – March 2017
3. Member Comments
4. Adjournment
The participants in the above referenced public meeting will conduct the public meeting by telephone, via a telephone conference hookup. There will be a speaker telephone made available for any interested person to attend this public meeting and be fully informed of the discussions taking place by telephone conference hookup at FMPA’s headquarters, located at 8553 Commodity Circle, Orlando, Florida 32819-9002. If anyone chooses to appeal any decision that may be made at this public meeting, such person will need a record of the proceedings and should accordingly ensure that a verbatim record of the proceedings is made, which includes the oral statements and evidence upon which such appeal is based. This public meeting may be continued to a date and time certain, which will be announced at the meeting. Any person requiring a special accommodation to participate in this public meeting because of a disability, should contact FMPA at (407) 355-7767 or 1-(888)-774-7606, at least two (2) business days in advance to make appropriate arrangements. Any interested person may contact FMPA for more information on this public meeting by calling (850) 297-2011 or (877) 297-2012 or writing to: Open Government Law Compliance Coordinator, Florida Municipal Power Agency, 2061-2 Delta Way, Post Office Box 3209, Tallahassee, Florida 32315-3209.
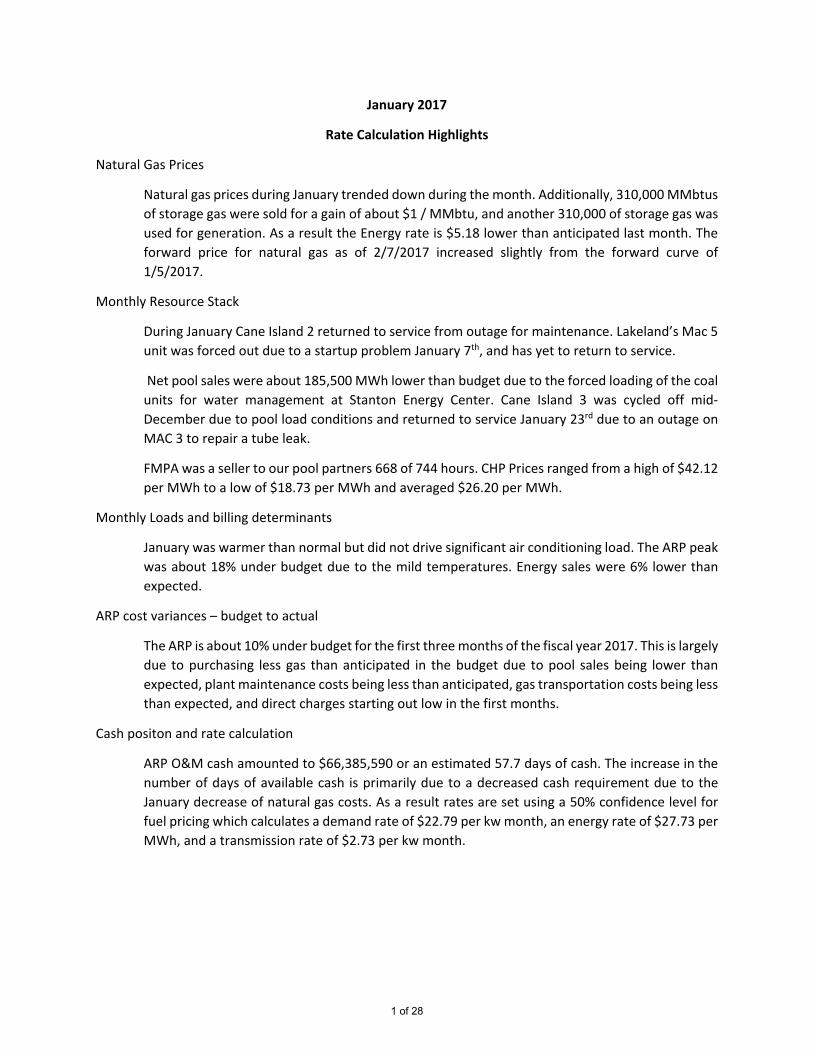
January 2017
Rate Calculation Highlights
Natural Gas Prices
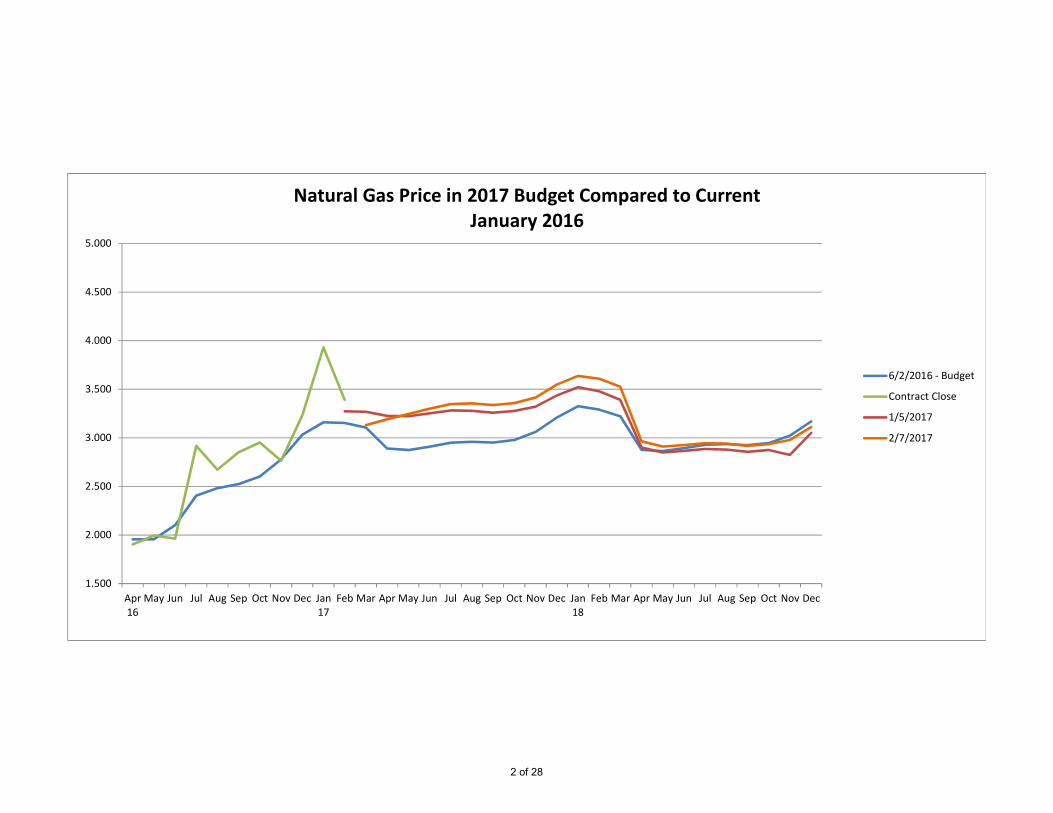
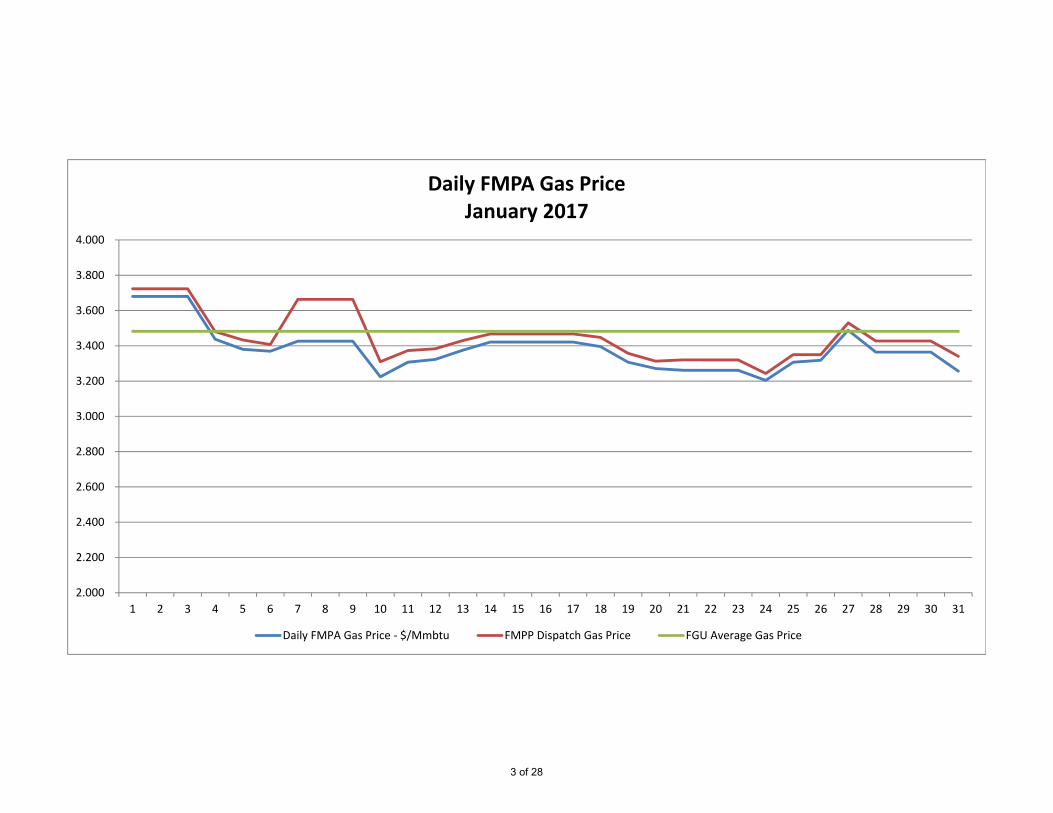
Natural gas prices during January trended down during the month. Additionally, 310,000 MMbtus of storage gas were sold for a gain of about $1 / MMbtu, and another 310,000 of storage gas was used for generation. As a result the Energy rate is $5.18 lower than anticipated last month. The forward price for natural gas as of 2/7/2017 increased slightly from the forward curve of 1/5/2017.
Monthly Resource Stack
During January Cane Island 2 returned to service from outage for maintenance. Lakeland’s Mac 5 unit was forced out due to a startup problem January 7th, and has yet to return to service.
Net pool sales were about 185,500 MWh lower than budget due to the forced loading of the coal units for water management at Stanton Energy Center. Cane Island 3 was cycled off mid‐December due to pool load conditions and returned to service January 23rd due to an outage on MAC 3 to repair a tube leak.
FMPA was a seller to our pool partners 668 of 744 hours. CHP Prices ranged from a high of $42.12 per MWh to a low of $18.73 per MWh and averaged $26.20 per MWh.
Monthly Loads and billing determinants
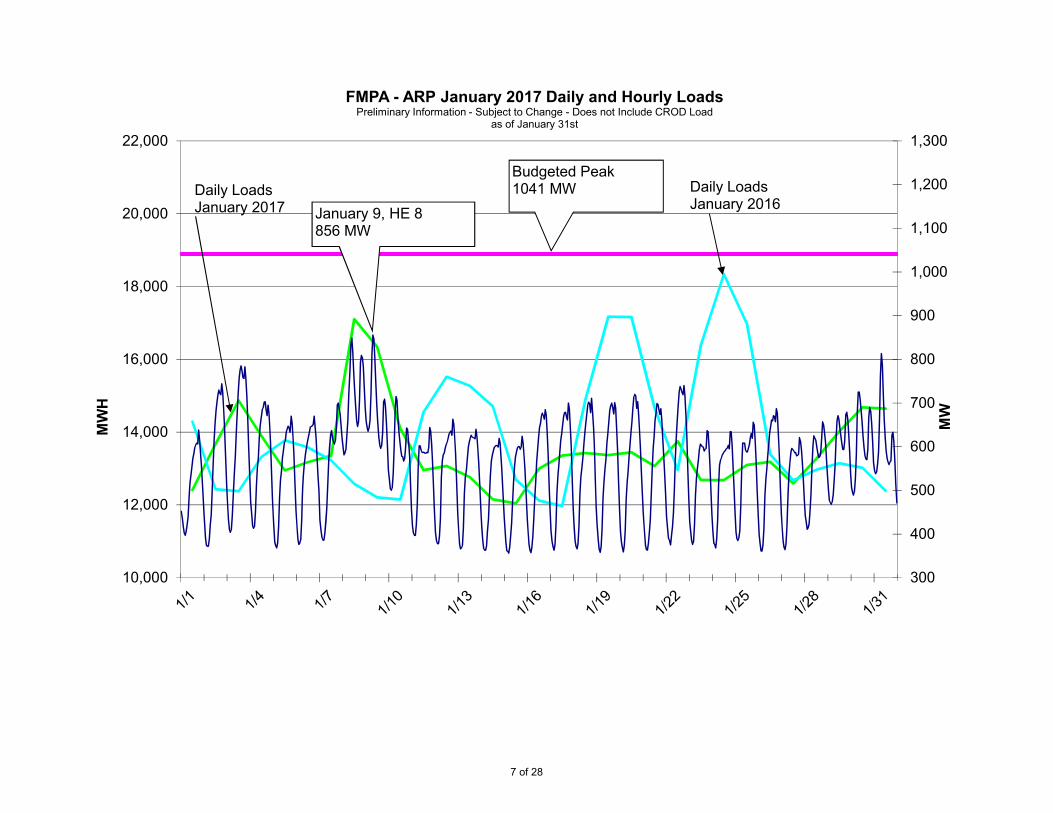
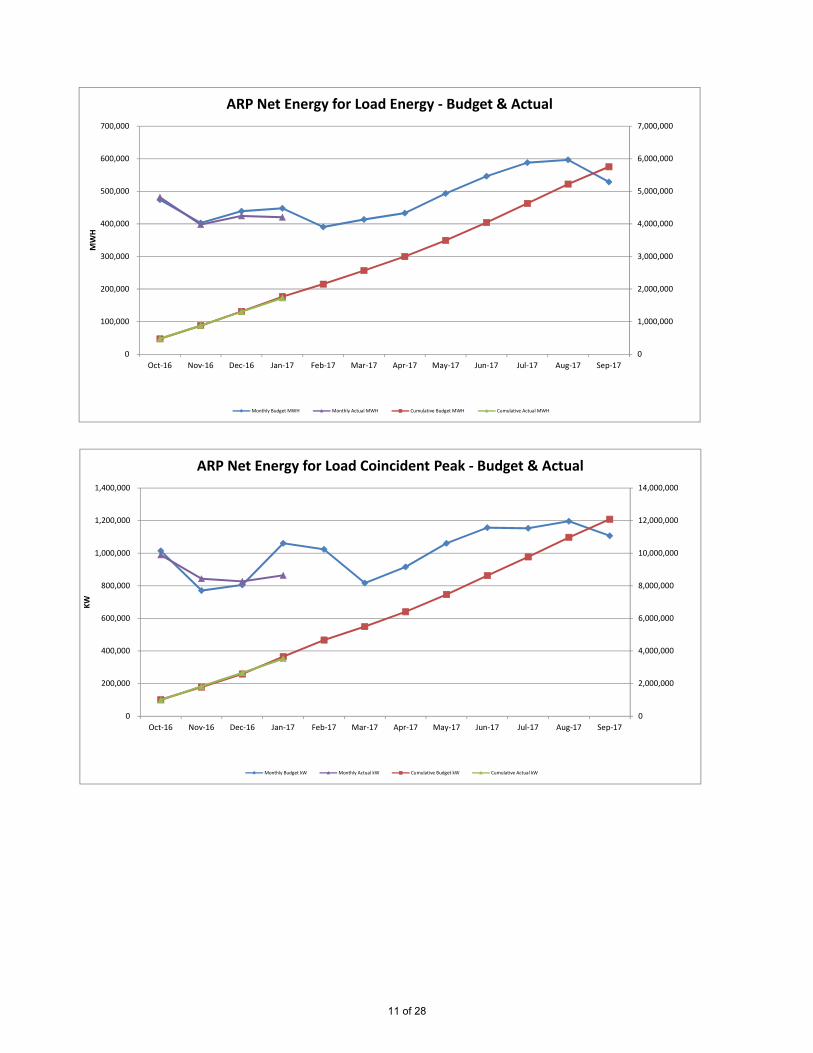
January was warmer than normal but did not drive significant air conditioning load. The ARP peak was about 18% under budget due to the mild temperatures. Energy sales were 6% lower than expected.
ARP cost variances – budget to actual
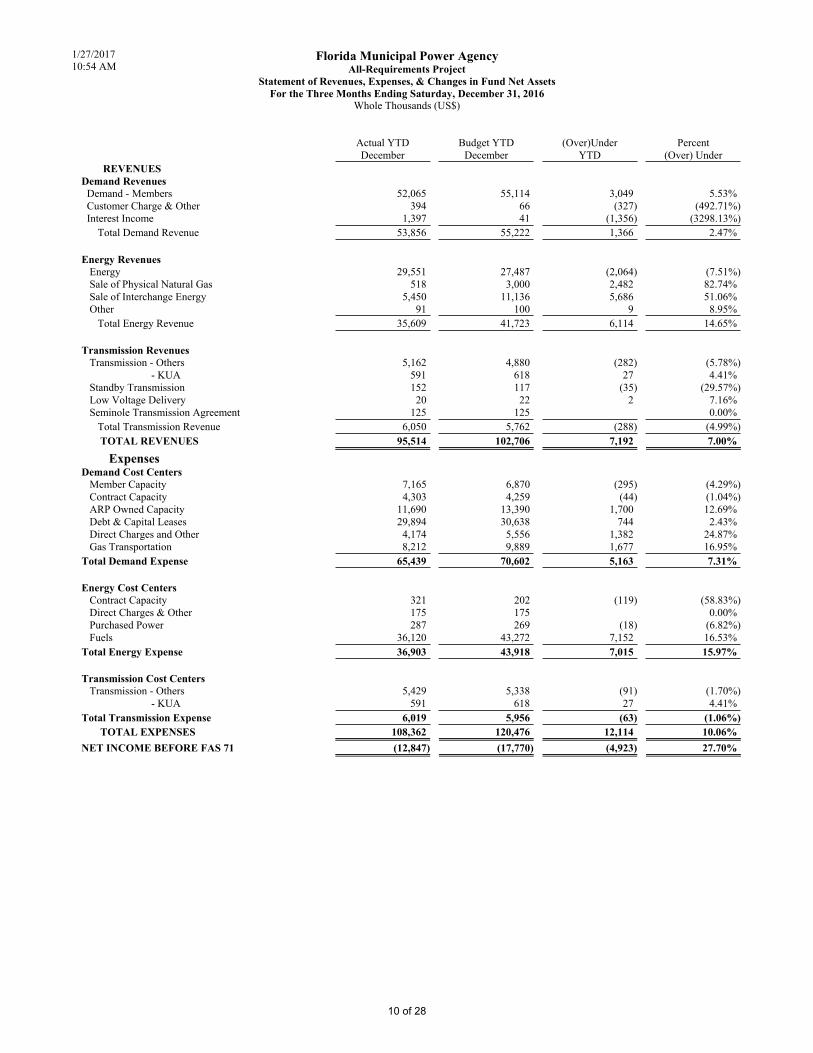
The ARP is about 10% under budget for the first three months of the fiscal year 2017. This is largely due to purchasing less gas than anticipated in the budget due to pool sales being lower than expected, plant maintenance costs being less than anticipated, gas transportation costs being less than expected, and direct charges starting out low in the first months.
Cash positon and rate calculation
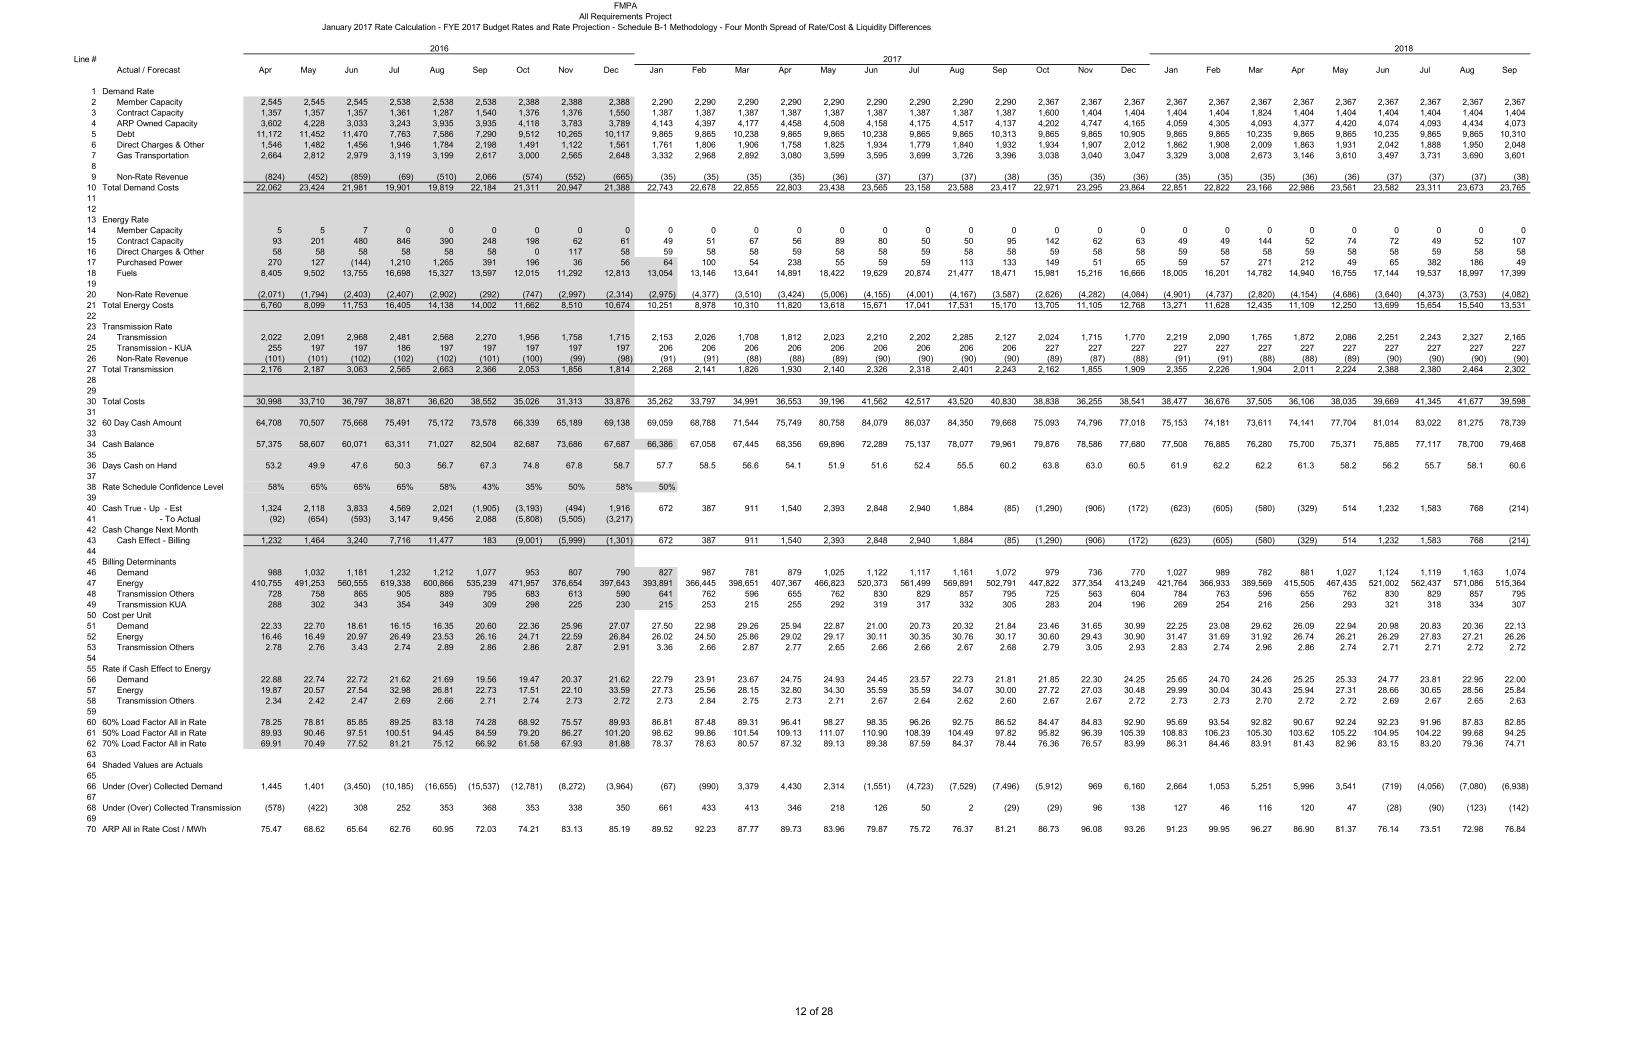
ARP O&M cash amounted to $66,385,590 or an estimated 57.7 days of cash. The increase in the number of days of available cash is primarily due to a decreased cash requirement due to the January decrease of natural gas costs. As a result rates are set using a 50% confidence level for fuel pricing which calculates a demand rate of $22.79 per kw month, an energy rate of $27.73 per MWh, and a transmission rate of $2.73 per kw month.
1 of 28
1.500
2.000
2.500
3.000
3.500
4.000
4.500
5.000
Apr16
May Jun Jul Aug Sep Oct Nov Dec Jan17
Feb Mar Apr May Jun Jul Aug Sep Oct Nov Dec Jan18
Feb Mar Apr May Jun Jul Aug Sep Oct Nov Dec
Natural Gas Price in 2017 Budget Compared to CurrentJanuary 2016
6/2/2016 ‐ Budget
Contract Close
1/5/2017
2/7/2017
2 of 28
2.000
2.200
2.400
2.600
2.800
3.000
3.200
3.400
3.600
3.800
4.000
1 2 3 4 5 6 7 8 9 10 11 12 13 14 15 16 17 18 19 20 21 22 23 24 25 26 27 28 29 30 31
Daily FMPA Gas PriceJanuary 2017
Daily FMPA Gas Price ‐ $/Mmbtu FMPP Dispatch Gas Price FGU Average Gas Price
3 of 28
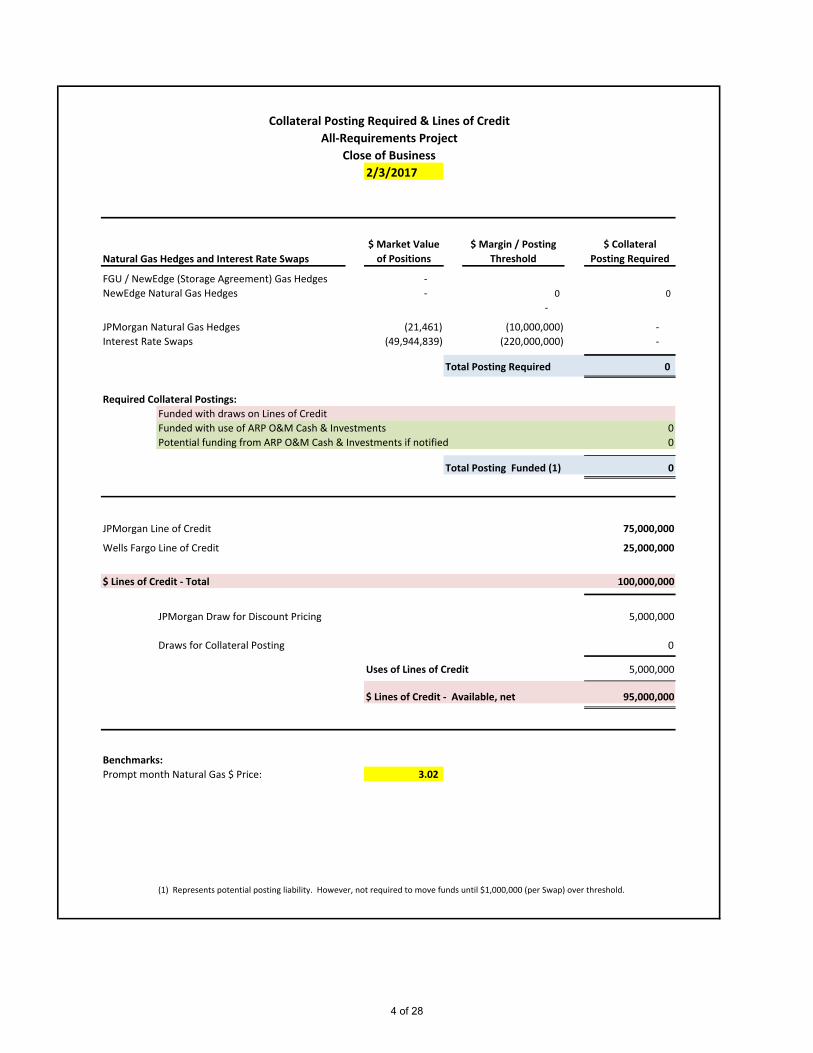
Collateral Posting Required & Lines of Credit
All-Requirements Project
Close of Business
2/3/2017
$ Market Value
of Positions
$ Margin / Posting
Threshold
$ Collateral
Posting Required
FGU / NewEdge (Storage Agreement) Gas Hedges -
NewEdge Natural Gas Hedges - 0 0
-
JPMorgan Natural Gas Hedges (21,461) (10,000,000) -
Interest Rate Swaps (49,944,839) (220,000,000) -
Total Posting Required 0
Required Collateral Postings:
Funded with draws on Lines of Credit
Funded with use of ARP O&M Cash & Investments 0
Potential funding from ARP O&M Cash & Investments if notified 0
Total Posting Funded (1) 0
JPMorgan Line of Credit 75,000,000
Wells Fargo Line of Credit 25,000,000
$ Lines of Credit - Total 100,000,000
JPMorgan Draw for Discount Pricing 5,000,000
Draws for Collateral Posting 0
Uses of Lines of Credit 5,000,000
$ Lines of Credit - Available, net 95,000,000
Benchmarks:
Prompt month Natural Gas $ Price: 3.02
(1) Represents potential posting liability. However, not required to move funds until $1,000,000 (per Swap) over threshold.
Natural Gas Hedges and Interest Rate Swaps
4 of 28
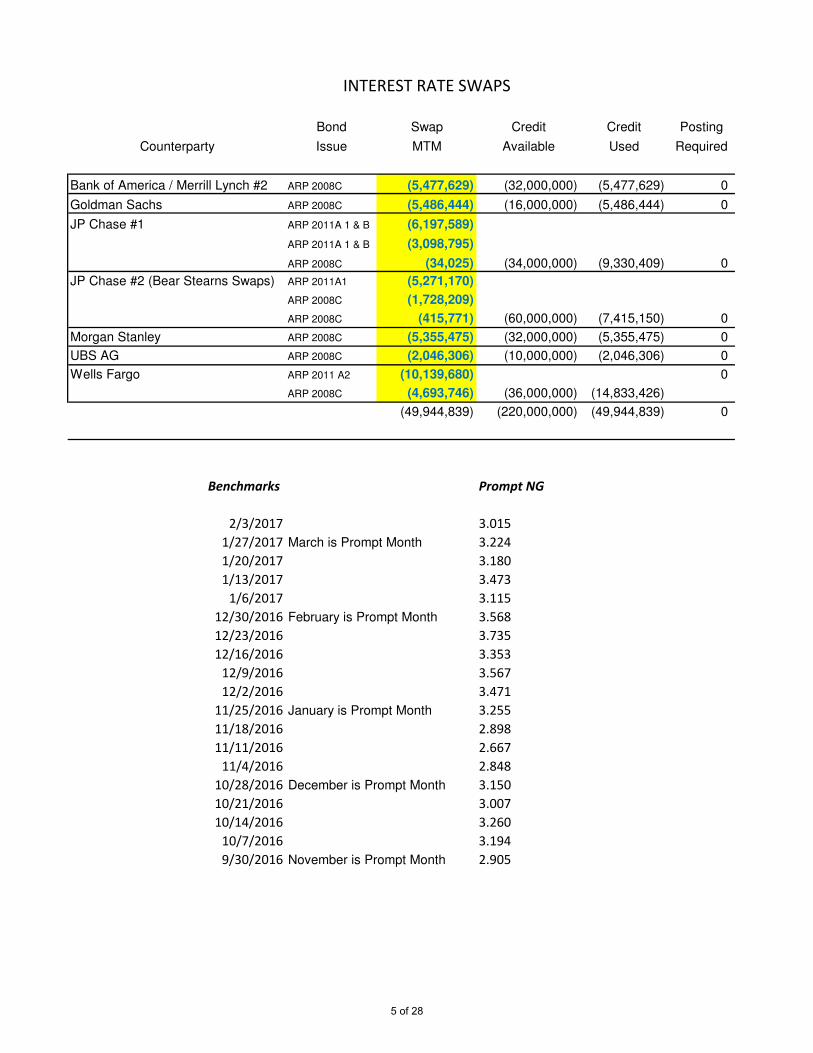
INTEREST RATE SWAPS
Bond Swap Credit Credit Posting
Counterparty Issue MTM Available Used Required
Bank of America / Merrill Lynch #2 ARP 2008C (5,477,629) (32,000,000) (5,477,629) 0
Goldman Sachs ARP 2008C (5,486,444) (16,000,000) (5,486,444) 0
JP Chase #1 ARP 2011A 1 & B (6,197,589)
ARP 2011A 1 & B (3,098,795)
ARP 2008C (34,025) (34,000,000) (9,330,409) 0
JP Chase #2 (Bear Stearns Swaps) ARP 2011A1 (5,271,170)
ARP 2008C (1,728,209)
ARP 2008C (415,771) (60,000,000) (7,415,150) 0
Morgan Stanley ARP 2008C (5,355,475) (32,000,000) (5,355,475) 0
UBS AG ARP 2008C (2,046,306) (10,000,000) (2,046,306) 0
Wells Fargo ARP 2011 A2 (10,139,680) 0
ARP 2008C (4,693,746) (36,000,000) (14,833,426)
(49,944,839) (220,000,000) (49,944,839) 0
Benchmarks Prompt NG
2/3/2017 3.015
1/27/2017 March is Prompt Month 3.224
1/20/2017 3.180
1/13/2017 3.473
1/6/2017 3.115
12/30/2016 February is Prompt Month 3.568
12/23/2016 3.735
12/16/2016 3.353
12/9/2016 3.567
12/2/2016 3.471
11/25/2016 January is Prompt Month 3.255
11/18/2016 2.898
11/11/2016 2.667
11/4/2016 2.848
10/28/2016 December is Prompt Month 3.150
10/21/2016 3.007
10/14/2016 3.260
10/7/2016 3.194
9/30/2016 November is Prompt Month 2.905
5 of 28
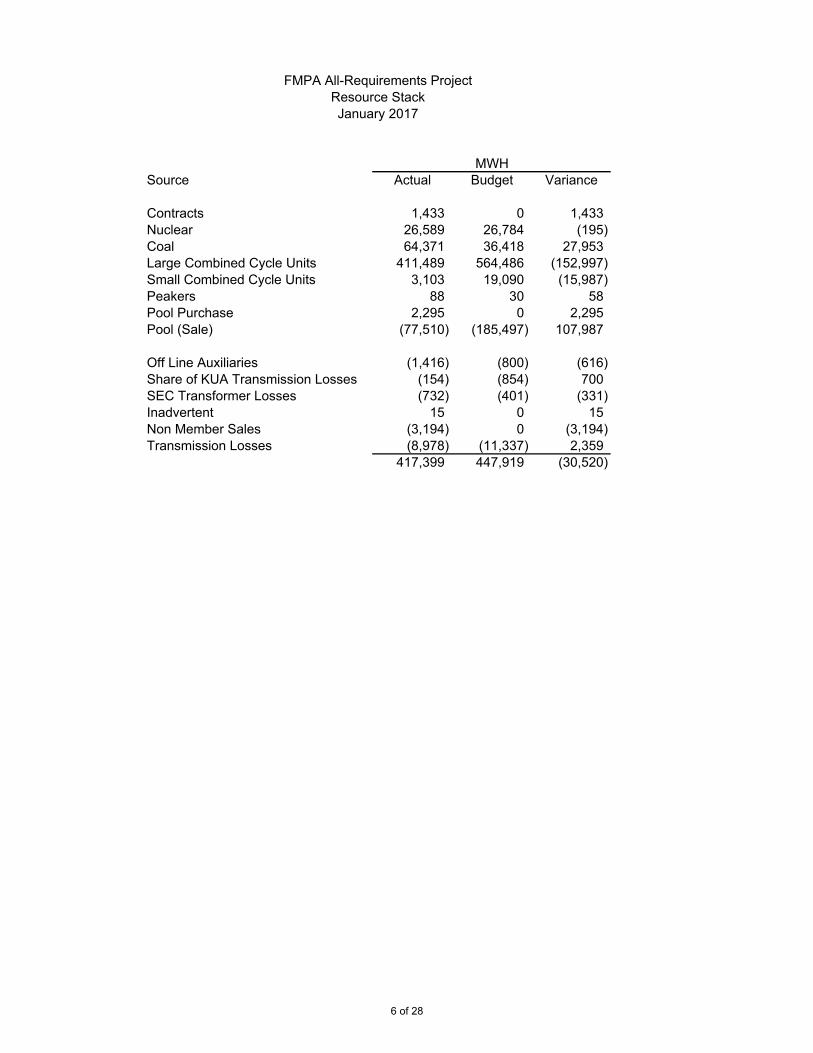
Source Actual Budget Variance
Contracts 1,433 0 1,433Nuclear 26,589 26,784 (195)Coal 64,371 36,418 27,953Large Combined Cycle Units 411,489 564,486 (152,997)Small Combined Cycle Units 3,103 19,090 (15,987)Peakers 88 30 58Pool Purchase 2,295 0 2,295Pool (Sale) (77,510) (185,497) 107,987
Off Line Auxiliaries (1,416) (800) (616)Share of KUA Transmission Losses (154) (854) 700SEC Transformer Losses (732) (401) (331)Inadvertent 15 0 15Non Member Sales (3,194) 0 (3,194)Transmission Losses (8,978) (11,337) 2,359
417,399 447,919 (30,520)
FMPA All-Requirements ProjectResource StackJanuary 2017
MWH
6 of 28
300
400
500
600
700
800
900
1,000
1,100
1,200
1,300
10,000
12,000
14,000
16,000
18,000
20,000
22,000
MW
MW
HFMPA - ARP January 2017 Daily and Hourly Loads
Preliminary Information - Subject to Change - Does not Include CROD Loadas of January 31st
January 9, HE 8 856 MW
Budgeted Peak 1041 MWDaily Loads
January 2017Daily LoadsJanuary 2016
7 of 28
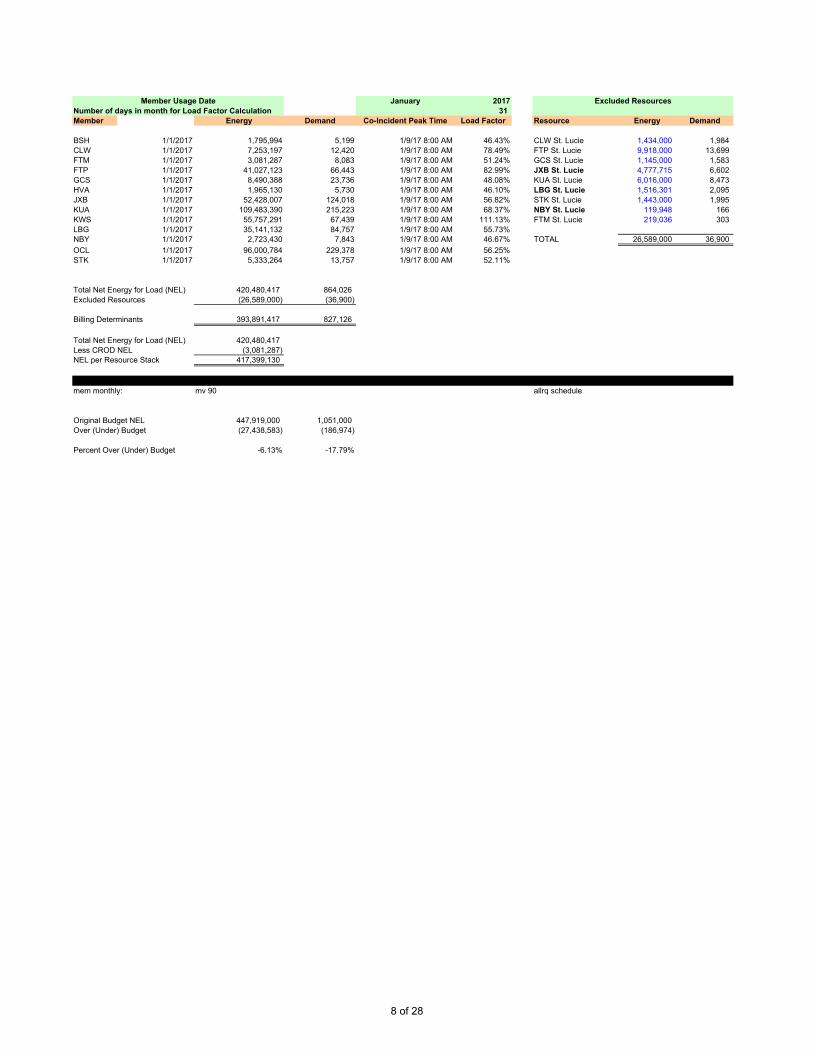
January 2017Number of days in month for Load Factor Calculation 31 Member Energy Demand Co-Incident Peak Time Load Factor Resource Energy Demand
BSH 1/1/2017 1,795,994 5,199 1/9/17 8:00 AM 46.43% CLW St. Lucie 1,434,000 1,984CLW 1/1/2017 7,253,197 12,420 1/9/17 8:00 AM 78.49% FTP St. Lucie 9,918,000 13,699FTM 1/1/2017 3,081,287 8,083 1/9/17 8:00 AM 51.24% GCS St. Lucie 1,145,000 1,583FTP 1/1/2017 41,027,123 66,443 1/9/17 8:00 AM 82.99% JXB St. Lucie 4,777,715 6,602GCS 1/1/2017 8,490,388 23,736 1/9/17 8:00 AM 48.08% KUA St. Lucie 6,016,000 8,473HVA 1/1/2017 1,965,130 5,730 1/9/17 8:00 AM 46.10% LBG St. Lucie 1,516,301 2,095JXB 1/1/2017 52,428,007 124,018 1/9/17 8:00 AM 56.82% STK St. Lucie 1,443,000 1,995KUA 1/1/2017 109,483,390 215,223 1/9/17 8:00 AM 68.37% NBY St. Lucie 119,948 166KWS 1/1/2017 55,757,291 67,439 1/9/17 8:00 AM 111.13% FTM St. Lucie 219,036 303LBG 1/1/2017 35,141,132 84,757 1/9/17 8:00 AM 55.73%NBY 1/1/2017 2,723,430 7,843 1/9/17 8:00 AM 46.67% TOTAL 26,589,000 36,900
OCL 1/1/2017 96,000,784 229,378 1/9/17 8:00 AM 56.25%STK 1/1/2017 5,333,264 13,757 1/9/17 8:00 AM 52.11%
Total Net Energy for Load (NEL) 420,480,417 864,026 Excluded Resources (26,589,000) (36,900)
Billing Determinants 393,891,417 827,126
Total Net Energy for Load (NEL) 420,480,417Less CROD NEL (3,081,287)NEL per Resource Stack 417,399,130
mem monthly: mv 90 allrq schedule
Original Budget NEL 447,919,000 1,051,000Over (Under) Budget (27,438,583) (186,974)
Percent Over (Under) Budget -6.13% -17.79%
Member Usage Date Excluded Resources
8 of 28
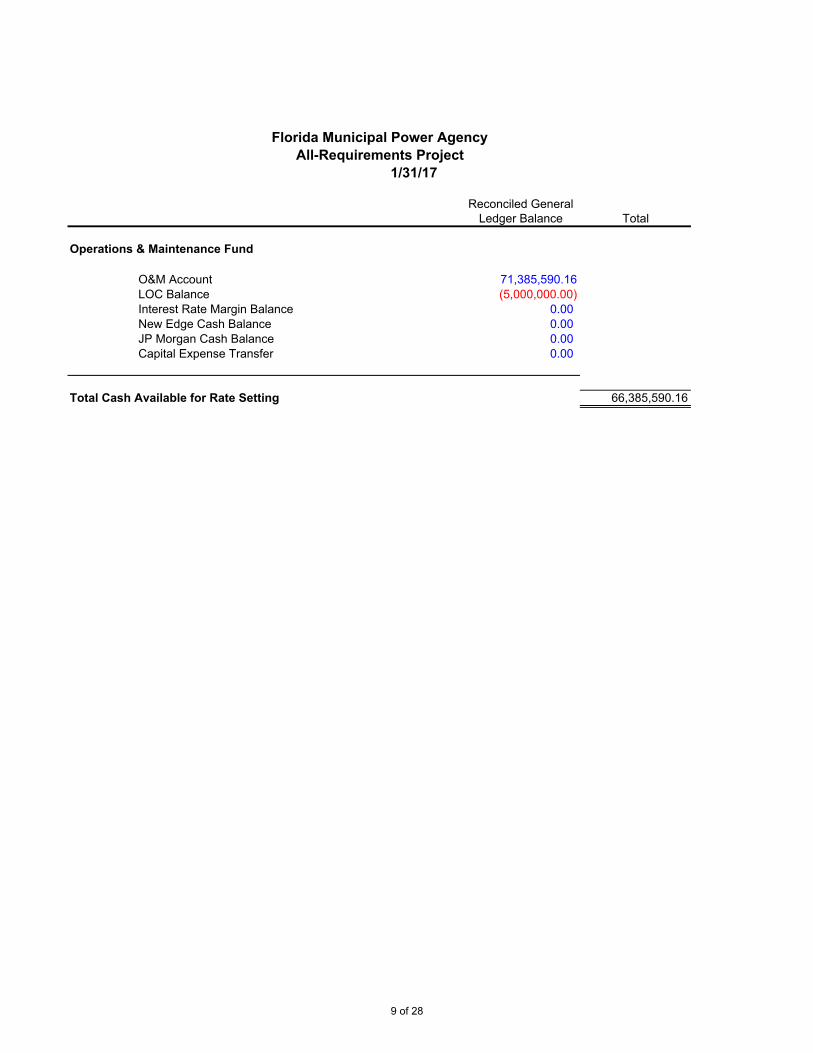
Florida Municipal Power AgencyAll-Requirements Project
1/31/17
Reconciled GeneralLedger Balance Total
Operations & Maintenance Fund
O&M Account 71,385,590.16LOC Balance (5,000,000.00)Interest Rate Margin Balance 0.00New Edge Cash Balance 0.00JP Morgan Cash Balance 0.00Capital Expense Transfer 0.00
Total Cash Available for Rate Setting 66,385,590.16
9 of 28
Actual YTDDecember
Budget YTDDecember
(Over)UnderYTD
Percent(Over) Under
REVENUESDemand Revenues
Demand - Members 52,065 55,114 3,049 5.53%Customer Charge & Other 394 66 (327) (492.71%)Interest Income 1,397 41 (1,356) (3298.13%)
Total Demand Revenue 53,856 55,222 1,366 2.47%
Energy RevenuesEnergy 29,551 27,487 (2,064) (7.51%)Sale of Physical Natural Gas 518 3,000 2,482 82.74%Sale of Interchange Energy 5,450 11,136 5,686 51.06%Other 91 100 9 8.95%
Total Energy Revenue 35,609 41,723 6,114 14.65%
Transmission RevenuesTransmission - Others 5,162 4,880 (282) (5.78%)
- KUA 591 618 27 4.41%Standby Transmission 152 117 (35) (29.57%)Low Voltage Delivery 20 22 2 7.16%Seminole Transmission Agreement 125 125 0.00%
Total Transmission Revenue 6,050 5,762 (288) (4.99%)TOTAL REVENUES 95,514 102,706 7,192 7.00%
ExpensesDemand Cost Centers
Member Capacity 7,165 6,870 (295) (4.29%)Contract Capacity 4,303 4,259 (44) (1.04%)ARP Owned Capacity 11,690 13,390 1,700 12.69%Debt & Capital Leases 29,894 30,638 744 2.43%Direct Charges and Other 4,174 5,556 1,382 24.87%Gas Transportation 8,212 9,889 1,677 16.95%
Total Demand Expense 65,439 70,602 5,163 7.31%
Energy Cost CentersContract Capacity 321 202 (119) (58.83%)Direct Charges & Other 175 175 0.00%Purchased Power 287 269 (18) (6.82%)Fuels 36,120 43,272 7,152 16.53%
Total Energy Expense 36,903 43,918 7,015 15.97%
Transmission Cost CentersTransmission - Others 5,429 5,338 (91) (1.70%)
- KUA 591 618 27 4.41%Total Transmission Expense 6,019 5,956 (63) (1.06%)
TOTAL EXPENSES 108,362 120,476 12,114 10.06%
NET INCOME BEFORE FAS 71 (12,847) (17,770) (4,923) 27.70%
1/27/201710:54 AM
Florida Municipal Power AgencyAll-Requirements Project
Statement of Revenues, Expenses, & Changes in Fund Net AssetsFor the Three Months Ending Saturday, December 31, 2016
Whole Thousands (US$)
10 of 28
0
1,000,000
2,000,000
3,000,000
4,000,000
5,000,000
6,000,000
7,000,000
0
100,000
200,000
300,000
400,000
500,000
600,000
700,000
Oct‐16 Nov‐16 Dec‐16 Jan‐17 Feb‐17 Mar‐17 Apr‐17 May‐17 Jun‐17 Jul‐17 Aug‐17 Sep‐17
MWH
ARP Net Energy for Load Energy ‐ Budget & Actual
Monthly Budget MWH Monthly Actual MWH Cumulative Budget MWH Cumulative Actual MWH
0
2,000,000
4,000,000
6,000,000
8,000,000
10,000,000
12,000,000
14,000,000
0
200,000
400,000
600,000
800,000
1,000,000
1,200,000
1,400,000
Oct‐16 Nov‐16 Dec‐16 Jan‐17 Feb‐17 Mar‐17 Apr‐17 May‐17 Jun‐17 Jul‐17 Aug‐17 Sep‐17
KW
ARP Net Energy for Load Coincident Peak ‐ Budget & Actual
Monthly Budget kW Monthly Actual kW Cumulative Budget kW Cumulative Actual kW
11 of 28
Line #Actual / Forecast Apr May Jun Jul Aug Sep Oct Nov Dec Jan Feb Mar Apr May Jun Jul Aug Sep Oct Nov Dec Jan Feb Mar Apr May Jun Jul Aug Sep
1 Demand Rate2 Member Capacity 2,545 2,545 2,545 2,538 2,538 2,538 2,388 2,388 2,388 2,290 2,290 2,290 2,290 2,290 2,290 2,290 2,290 2,290 2,367 2,367 2,367 2,367 2,367 2,367 2,367 2,367 2,367 2,367 2,367 2,3673 Contract Capacity 1,357 1,357 1,357 1,361 1,287 1,540 1,376 1,376 1,550 1,387 1,387 1,387 1,387 1,387 1,387 1,387 1,387 1,387 1,600 1,404 1,404 1,404 1,404 1,824 1,404 1,404 1,404 1,404 1,404 1,4044 ARP Owned Capacity 3,602 4,228 3,033 3,243 3,935 3,935 4,118 3,783 3,789 4,143 4,397 4,177 4,458 4,508 4,158 4,175 4,517 4,137 4,202 4,747 4,165 4,059 4,305 4,093 4,377 4,420 4,074 4,093 4,434 4,0735 Debt 11,172 11,452 11,470 7,763 7,586 7,290 9,512 10,265 10,117 9,865 9,865 10,238 9,865 9,865 10,238 9,865 9,865 10,313 9,865 9,865 10,905 9,865 9,865 10,235 9,865 9,865 10,235 9,865 9,865 10,3106 Direct Charges & Other 1,546 1,482 1,456 1,946 1,784 2,198 1,491 1,122 1,561 1,761 1,806 1,906 1,758 1,825 1,934 1,779 1,840 1,932 1,934 1,907 2,012 1,862 1,908 2,009 1,863 1,931 2,042 1,888 1,950 2,0487 Gas Transportation 2,664 2,812 2,979 3,119 3,199 2,617 3,000 2,565 2,648 3,332 2,968 2,892 3,080 3,599 3,595 3,699 3,726 3,396 3,038 3,040 3,047 3,329 3,008 2,673 3,146 3,610 3,497 3,731 3,690 3,60189 Non-Rate Revenue (824) (452) (859) (69) (510) 2,066 (574) (552) (665) (35) (35) (35) (35) (36) (37) (37) (37) (38) (35) (35) (36) (35) (35) (35) (36) (36) (37) (37) (37) (38)
10 Total Demand Costs 22,062 23,424 21,981 19,901 19,819 22,184 21,311 20,947 21,388 22,743 22,678 22,855 22,803 23,438 23,565 23,158 23,588 23,417 22,971 23,295 23,864 22,851 22,822 23,166 22,986 23,561 23,582 23,311 23,673 23,765111213 Energy Rate14 Member Capacity 5 5 7 0 0 0 0 0 0 0 0 0 0 0 0 0 0 0 0 0 0 0 0 0 0 0 0 0 0 015 Contract Capacity 93 201 480 846 390 248 198 62 61 49 51 67 56 89 80 50 50 95 142 62 63 49 49 144 52 74 72 49 52 10716 Direct Charges & Other 58 58 58 58 58 58 0 117 58 59 58 58 59 58 58 59 58 58 59 58 58 59 58 58 59 58 58 59 58 5817 Purchased Power 270 127 (144) 1,210 1,265 391 196 36 56 64 100 54 238 55 59 59 113 133 149 51 65 59 57 271 212 49 65 382 186 4918 Fuels 8,405 9,502 13,755 16,698 15,327 13,597 12,015 11,292 12,813 13,054 13,146 13,641 14,891 18,422 19,629 20,874 21,477 18,471 15,981 15,216 16,666 18,005 16,201 14,782 14,940 16,755 17,144 19,537 18,997 17,3991920 Non-Rate Revenue (2,071) (1,794) (2,403) (2,407) (2,902) (292) (747) (2,997) (2,314) (2,975) (4,377) (3,510) (3,424) (5,006) (4,155) (4,001) (4,167) (3,587) (2,626) (4,282) (4,084) (4,901) (4,737) (2,820) (4,154) (4,686) (3,640) (4,373) (3,753) (4,082)21 Total Energy Costs 6,760 8,099 11,753 16,405 14,138 14,002 11,662 8,510 10,674 10,251 8,978 10,310 11,820 13,618 15,671 17,041 17,531 15,170 13,705 11,105 12,768 13,271 11,628 12,435 11,109 12,250 13,699 15,654 15,540 13,5312223 Transmission Rate24 Transmission 2,022 2,091 2,968 2,481 2,568 2,270 1,956 1,758 1,715 2,153 2,026 1,708 1,812 2,023 2,210 2,202 2,285 2,127 2,024 1,715 1,770 2,219 2,090 1,765 1,872 2,086 2,251 2,243 2,327 2,16525 Transmission - KUA 255 197 197 186 197 197 197 197 197 206 206 206 206 206 206 206 206 206 227 227 227 227 227 227 227 227 227 227 227 22726 Non-Rate Revenue (101) (101) (102) (102) (102) (101) (100) (99) (98) (91) (91) (88) (88) (89) (90) (90) (90) (90) (89) (87) (88) (91) (91) (88) (88) (89) (90) (90) (90) (90)27 Total Transmission 2,176 2,187 3,063 2,565 2,663 2,366 2,053 1,856 1,814 2,268 2,141 1,826 1,930 2,140 2,326 2,318 2,401 2,243 2,162 1,855 1,909 2,355 2,226 1,904 2,011 2,224 2,388 2,380 2,464 2,302282930 Total Costs 30,998 33,710 36,797 38,871 36,620 38,552 35,026 31,313 33,876 35,262 33,797 34,991 36,553 39,196 41,562 42,517 43,520 40,830 38,838 36,255 38,541 38,477 36,676 37,505 36,106 38,035 39,669 41,345 41,677 39,5983132 60 Day Cash Amount 64,708 70,507 75,668 75,491 75,172 73,578 66,339 65,189 69,138 69,059 68,788 71,544 75,749 80,758 84,079 86,037 84,350 79,668 75,093 74,796 77,018 75,153 74,181 73,611 74,141 77,704 81,014 83,022 81,275 78,7393334 Cash Balance 57,375 58,607 60,071 63,311 71,027 82,504 82,687 73,686 67,687 66,386 67,058 67,445 68,356 69,896 72,289 75,137 78,077 79,961 79,876 78,586 77,680 77,508 76,885 76,280 75,700 75,371 75,885 77,117 78,700 79,4683536 Days Cash on Hand 53.2 49.9 47.6 50.3 56.7 67.3 74.8 67.8 58.7 57.7 58.5 56.6 54.1 51.9 51.6 52.4 55.5 60.2 63.8 63.0 60.5 61.9 62.2 62.2 61.3 58.2 56.2 55.7 58.1 60.63738 Rate Schedule Confidence Level 58% 65% 65% 65% 58% 43% 35% 50% 58% 50%3940 Cash True - Up - Est 1,324 2,118 3,833 4,569 2,021 (1,905) (3,193) (494) 1,916 672 387 911 1,540 2,393 2,848 2,940 1,884 (85) (1,290) (906) (172) (623) (605) (580) (329) 514 1,232 1,583 768 (214)41 - To Actual (92) (654) (593) 3,147 9,456 2,088 (5,808) (5,505) (3,217)42 Cash Change Next Month43 Cash Effect - Billing 1,232 1,464 3,240 7,716 11,477 183 (9,001) (5,999) (1,301) 672 387 911 1,540 2,393 2,848 2,940 1,884 (85) (1,290) (906) (172) (623) (605) (580) (329) 514 1,232 1,583 768 (214)4445 Billing Determinants46 Demand 988 1,032 1,181 1,232 1,212 1,077 953 807 790 827 987 781 879 1,025 1,122 1,117 1,161 1,072 979 736 770 1,027 989 782 881 1,027 1,124 1,119 1,163 1,07447 Energy 410,755 491,253 560,555 619,338 600,866 535,239 471,957 376,654 397,643 393,891 366,445 398,651 407,367 466,823 520,373 561,499 569,891 502,791 447,822 377,354 413,249 421,764 366,933 389,569 415,505 467,435 521,002 562,437 571,086 515,36448 Transmission Others 728 758 865 905 889 795 683 613 590 641 762 596 655 762 830 829 857 795 725 563 604 784 763 596 655 762 830 829 857 79549 Transmission KUA 288 302 343 354 349 309 298 225 230 215 253 215 255 292 319 317 332 305 283 204 196 269 254 216 256 293 321 318 334 30750 Cost per Unit51 Demand 22.33 22.70 18.61 16.15 16.35 20.60 22.36 25.96 27.07 27.50 22.98 29.26 25.94 22.87 21.00 20.73 20.32 21.84 23.46 31.65 30.99 22.25 23.08 29.62 26.09 22.94 20.98 20.83 20.36 22.1352 Energy 16.46 16.49 20.97 26.49 23.53 26.16 24.71 22.59 26.84 26.02 24.50 25.86 29.02 29.17 30.11 30.35 30.76 30.17 30.60 29.43 30.90 31.47 31.69 31.92 26.74 26.21 26.29 27.83 27.21 26.2653 Transmission Others 2.78 2.76 3.43 2.74 2.89 2.86 2.86 2.87 2.91 3.36 2.66 2.87 2.77 2.65 2.66 2.66 2.67 2.68 2.79 3.05 2.93 2.83 2.74 2.96 2.86 2.74 2.71 2.71 2.72 2.725455 Rate if Cash Effect to Energy56 Demand 22.88 22.74 22.72 21.62 21.69 19.56 19.47 20.37 21.62 22.79 23.91 23.67 24.75 24.93 24.45 23.57 22.73 21.81 21.85 22.30 24.25 25.65 24.70 24.26 25.25 25.33 24.77 23.81 22.95 22.0057 Energy 19.87 20.57 27.54 32.98 26.81 22.73 17.51 22.10 33.59 27.73 25.56 28.15 32.80 34.30 35.59 35.59 34.07 30.00 27.72 27.03 30.48 29.99 30.04 30.43 25.94 27.31 28.66 30.65 28.56 25.8458 Transmission Others 2.34 2.42 2.47 2.69 2.66 2.71 2.74 2.73 2.72 2.73 2.84 2.75 2.73 2.71 2.67 2.64 2.62 2.60 2.67 2.67 2.72 2.73 2.73 2.70 2.72 2.72 2.69 2.67 2.65 2.635960 60% Load Factor All in Rate 78.25 78.81 85.85 89.25 83.18 74.28 68.92 75.57 89.93 86.81 87.48 89.31 96.41 98.27 98.35 96.26 92.75 86.52 84.47 84.83 92.90 95.69 93.54 92.82 90.67 92.24 92.23 91.96 87.83 82.8561 50% Load Factor All in Rate 89.93 90.46 97.51 100.51 94.45 84.59 79.20 86.27 101.20 98.62 99.86 101.54 109.13 111.07 110.90 108.39 104.49 97.82 95.82 96.39 105.39 108.83 106.23 105.30 103.62 105.22 104.95 104.22 99.68 94.2562 70% Load Factor All in Rate 69.91 70.49 77.52 81.21 75.12 66.92 61.58 67.93 81.88 78.37 78.63 80.57 87.32 89.13 89.38 87.59 84.37 78.44 76.36 76.57 83.99 86.31 84.46 83.91 81.43 82.96 83.15 83.20 79.36 74.716364 Shaded Values are Actuals6566 Under (Over) Collected Demand 1,445 1,401 (3,450) (10,185) (16,655) (15,537) (12,781) (8,272) (3,964) (67) (990) 3,379 4,430 2,314 (1,551) (4,723) (7,529) (7,496) (5,912) 969 6,160 2,664 1,053 5,251 5,996 3,541 (719) (4,056) (7,080) (6,938)6768 Under (Over) Collected Transmission (578) (422) 308 252 353 368 353 338 350 661 433 413 346 218 126 50 2 (29) (29) 96 138 127 46 116 120 47 (28) (90) (123) (142)6970 ARP All in Rate Cost / MWh 75.47 68.62 65.64 62.76 60.95 72.03 74.21 83.13 85.19 89.52 92.23 87.77 89.73 83.96 79.87 75.72 76.37 81.21 86.73 96.08 93.26 91.23 99.95 96.27 86.90 81.37 76.14 73.51 72.98 76.84
20182017
FMPAAll Requirements Project
January 2017 Rate Calculation - FYE 2017 Budget Rates and Rate Projection - Schedule B-1 Methodology - Four Month Spread of Rate/Cost & Liquidity Differences
2016
12 of 28
Line #Actual / Forecast Apr May Jun Jul Aug Sep Oct Nov Dec Jan Feb Mar Apr May Jun Jul Aug Sep Oct Nov Dec Jan Feb Mar Apr May Jun Jul Aug Sep
1 Demand Rate2 Member Capacity 2,545 2,545 2,545 2,538 2,538 2,538 2,388 2,388 2,290 2,290 2,290 2,290 2,290 2,290 2,290 2,290 2,290 2,290 2,367 2,367 2,367 2,367 2,367 2,367 2,367 2,367 2,367 2,367 2,367 2,3673 Contract Capacity 1,357 1,357 1,357 1,361 1,287 1,540 1,376 1,376 1,387 1,387 1,387 1,387 1,387 1,387 1,387 1,387 1,387 1,387 1,600 1,404 1,404 1,404 1,404 1,824 1,404 1,404 1,404 1,404 1,404 1,4044 ARP Owned Capacity 3,602 4,228 3,033 3,243 3,935 3,935 4,118 3,783 4,247 4,143 4,397 4,177 4,458 4,508 4,158 4,175 4,517 4,137 4,202 4,747 4,165 4,059 4,305 4,093 4,377 4,420 4,074 4,093 4,434 4,0735 Debt 11,172 11,452 11,470 7,763 7,586 7,290 9,512 10,265 10,908 9,865 9,865 10,238 9,865 9,865 10,238 9,865 9,865 10,313 9,865 9,865 10,905 9,865 9,865 10,235 9,865 9,865 10,235 9,865 9,865 10,3106 Direct Charges & Other 1,546 1,482 1,456 1,946 1,784 2,198 1,491 1,122 1,912 1,761 1,806 1,906 1,758 1,825 1,934 1,779 1,840 1,932 1,934 1,907 2,012 1,862 1,908 2,009 1,863 1,931 2,042 1,888 1,950 2,0487 Gas Transportation 2,664 2,812 2,979 3,119 3,199 2,617 3,000 2,565 3,329 3,332 2,968 2,892 3,080 3,599 3,595 3,699 3,726 3,396 3,038 3,040 3,047 3,329 3,008 2,673 3,146 3,610 3,497 3,731 3,690 3,60189 Non-Rate Revenue (824) (452) (859) (69) (510) 2,066 (574) (552) (36) (35) (35) (35) (35) (36) (37) (37) (37) (38) (35) (35) (36) (35) (35) (35) (36) (36) (37) (37) (37) (38)
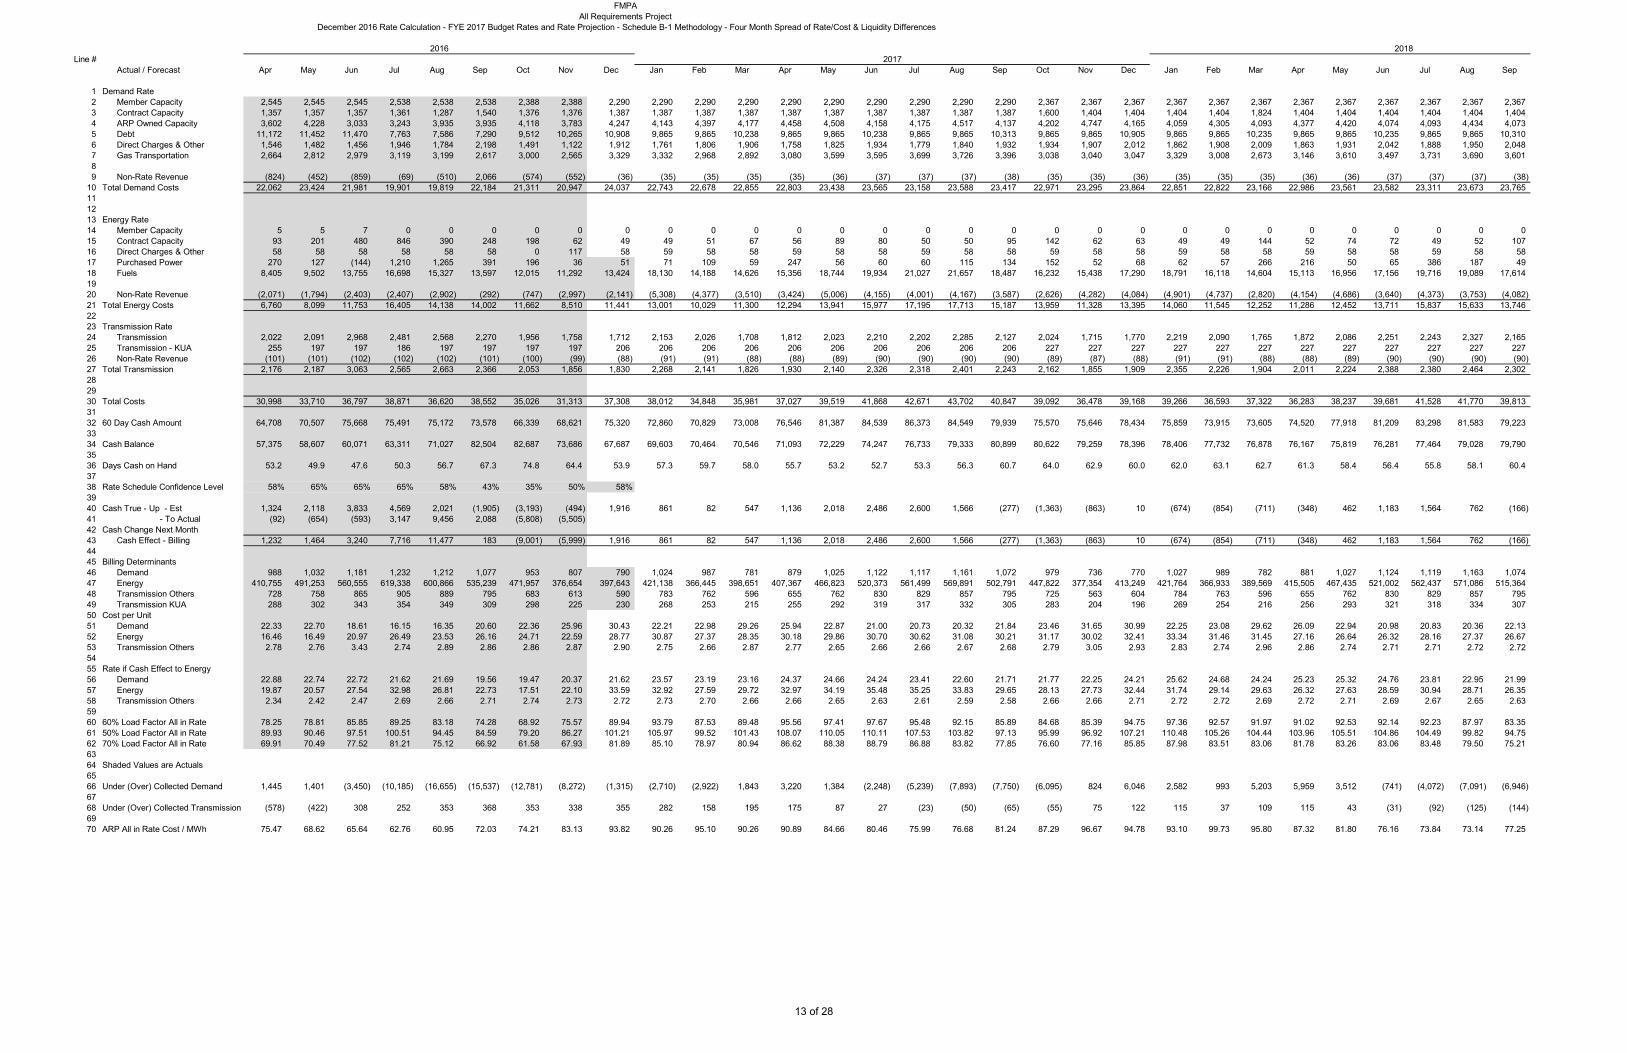
10 Total Demand Costs 22,062 23,424 21,981 19,901 19,819 22,184 21,311 20,947 24,037 22,743 22,678 22,855 22,803 23,438 23,565 23,158 23,588 23,417 22,971 23,295 23,864 22,851 22,822 23,166 22,986 23,561 23,582 23,311 23,673 23,765111213 Energy Rate14 Member Capacity 5 5 7 0 0 0 0 0 0 0 0 0 0 0 0 0 0 0 0 0 0 0 0 0 0 0 0 0 0 015 Contract Capacity 93 201 480 846 390 248 198 62 49 49 51 67 56 89 80 50 50 95 142 62 63 49 49 144 52 74 72 49 52 10716 Direct Charges & Other 58 58 58 58 58 58 0 117 58 59 58 58 59 58 58 59 58 58 59 58 58 59 58 58 59 58 58 59 58 5817 Purchased Power 270 127 (144) 1,210 1,265 391 196 36 51 71 109 59 247 56 60 60 115 134 152 52 68 62 57 266 216 50 65 386 187 4918 Fuels 8,405 9,502 13,755 16,698 15,327 13,597 12,015 11,292 13,424 18,130 14,188 14,626 15,356 18,744 19,934 21,027 21,657 18,487 16,232 15,438 17,290 18,791 16,118 14,604 15,113 16,956 17,156 19,716 19,089 17,6141920 Non-Rate Revenue (2,071) (1,794) (2,403) (2,407) (2,902) (292) (747) (2,997) (2,141) (5,308) (4,377) (3,510) (3,424) (5,006) (4,155) (4,001) (4,167) (3,587) (2,626) (4,282) (4,084) (4,901) (4,737) (2,820) (4,154) (4,686) (3,640) (4,373) (3,753) (4,082)21 Total Energy Costs 6,760 8,099 11,753 16,405 14,138 14,002 11,662 8,510 11,441 13,001 10,029 11,300 12,294 13,941 15,977 17,195 17,713 15,187 13,959 11,328 13,395 14,060 11,545 12,252 11,286 12,452 13,711 15,837 15,633 13,7462223 Transmission Rate24 Transmission 2,022 2,091 2,968 2,481 2,568 2,270 1,956 1,758 1,712 2,153 2,026 1,708 1,812 2,023 2,210 2,202 2,285 2,127 2,024 1,715 1,770 2,219 2,090 1,765 1,872 2,086 2,251 2,243 2,327 2,16525 Transmission - KUA 255 197 197 186 197 197 197 197 206 206 206 206 206 206 206 206 206 206 227 227 227 227 227 227 227 227 227 227 227 22726 Non-Rate Revenue (101) (101) (102) (102) (102) (101) (100) (99) (88) (91) (91) (88) (88) (89) (90) (90) (90) (90) (89) (87) (88) (91) (91) (88) (88) (89) (90) (90) (90) (90)27 Total Transmission 2,176 2,187 3,063 2,565 2,663 2,366 2,053 1,856 1,830 2,268 2,141 1,826 1,930 2,140 2,326 2,318 2,401 2,243 2,162 1,855 1,909 2,355 2,226 1,904 2,011 2,224 2,388 2,380 2,464 2,302282930 Total Costs 30,998 33,710 36,797 38,871 36,620 38,552 35,026 31,313 37,308 38,012 34,848 35,981 37,027 39,519 41,868 42,671 43,702 40,847 39,092 36,478 39,168 39,266 36,593 37,322 36,283 38,237 39,681 41,528 41,770 39,8133132 60 Day Cash Amount 64,708 70,507 75,668 75,491 75,172 73,578 66,339 68,621 75,320 72,860 70,829 73,008 76,546 81,387 84,539 86,373 84,549 79,939 75,570 75,646 78,434 75,859 73,915 73,605 74,520 77,918 81,209 83,298 81,583 79,2233334 Cash Balance 57,375 58,607 60,071 63,311 71,027 82,504 82,687 73,686 67,687 69,603 70,464 70,546 71,093 72,229 74,247 76,733 79,333 80,899 80,622 79,259 78,396 78,406 77,732 76,878 76,167 75,819 76,281 77,464 79,028 79,7903536 Days Cash on Hand 53.2 49.9 47.6 50.3 56.7 67.3 74.8 64.4 53.9 57.3 59.7 58.0 55.7 53.2 52.7 53.3 56.3 60.7 64.0 62.9 60.0 62.0 63.1 62.7 61.3 58.4 56.4 55.8 58.1 60.43738 Rate Schedule Confidence Level 58% 65% 65% 65% 58% 43% 35% 50% 58%3940 Cash True - Up - Est 1,324 2,118 3,833 4,569 2,021 (1,905) (3,193) (494) 1,916 861 82 547 1,136 2,018 2,486 2,600 1,566 (277) (1,363) (863) 10 (674) (854) (711) (348) 462 1,183 1,564 762 (166)41 - To Actual (92) (654) (593) 3,147 9,456 2,088 (5,808) (5,505)42 Cash Change Next Month43 Cash Effect - Billing 1,232 1,464 3,240 7,716 11,477 183 (9,001) (5,999) 1,916 861 82 547 1,136 2,018 2,486 2,600 1,566 (277) (1,363) (863) 10 (674) (854) (711) (348) 462 1,183 1,564 762 (166)4445 Billing Determinants46 Demand 988 1,032 1,181 1,232 1,212 1,077 953 807 790 1,024 987 781 879 1,025 1,122 1,117 1,161 1,072 979 736 770 1,027 989 782 881 1,027 1,124 1,119 1,163 1,07447 Energy 410,755 491,253 560,555 619,338 600,866 535,239 471,957 376,654 397,643 421,138 366,445 398,651 407,367 466,823 520,373 561,499 569,891 502,791 447,822 377,354 413,249 421,764 366,933 389,569 415,505 467,435 521,002 562,437 571,086 515,36448 Transmission Others 728 758 865 905 889 795 683 613 590 783 762 596 655 762 830 829 857 795 725 563 604 784 763 596 655 762 830 829 857 79549 Transmission KUA 288 302 343 354 349 309 298 225 230 268 253 215 255 292 319 317 332 305 283 204 196 269 254 216 256 293 321 318 334 30750 Cost per Unit51 Demand 22.33 22.70 18.61 16.15 16.35 20.60 22.36 25.96 30.43 22.21 22.98 29.26 25.94 22.87 21.00 20.73 20.32 21.84 23.46 31.65 30.99 22.25 23.08 29.62 26.09 22.94 20.98 20.83 20.36 22.1352 Energy 16.46 16.49 20.97 26.49 23.53 26.16 24.71 22.59 28.77 30.87 27.37 28.35 30.18 29.86 30.70 30.62 31.08 30.21 31.17 30.02 32.41 33.34 31.46 31.45 27.16 26.64 26.32 28.16 27.37 26.6753 Transmission Others 2.78 2.76 3.43 2.74 2.89 2.86 2.86 2.87 2.90 2.75 2.66 2.87 2.77 2.65 2.66 2.66 2.67 2.68 2.79 3.05 2.93 2.83 2.74 2.96 2.86 2.74 2.71 2.71 2.72 2.725455 Rate if Cash Effect to Energy56 Demand 22.88 22.74 22.72 21.62 21.69 19.56 19.47 20.37 21.62 23.57 23.19 23.16 24.37 24.66 24.24 23.41 22.60 21.71 21.77 22.25 24.21 25.62 24.68 24.24 25.23 25.32 24.76 23.81 22.95 21.9957 Energy 19.87 20.57 27.54 32.98 26.81 22.73 17.51 22.10 33.59 32.92 27.59 29.72 32.97 34.19 35.48 35.25 33.83 29.65 28.13 27.73 32.44 31.74 29.14 29.63 26.32 27.63 28.59 30.94 28.71 26.3558 Transmission Others 2.34 2.42 2.47 2.69 2.66 2.71 2.74 2.73 2.72 2.73 2.70 2.66 2.66 2.65 2.63 2.61 2.59 2.58 2.66 2.66 2.71 2.72 2.72 2.69 2.72 2.71 2.69 2.67 2.65 2.635960 60% Load Factor All in Rate 78.25 78.81 85.85 89.25 83.18 74.28 68.92 75.57 89.94 93.79 87.53 89.48 95.56 97.41 97.67 95.48 92.15 85.89 84.68 85.39 94.75 97.36 92.57 91.97 91.02 92.53 92.14 92.23 87.97 83.3561 50% Load Factor All in Rate 89.93 90.46 97.51 100.51 94.45 84.59 79.20 86.27 101.21 105.97 99.52 101.43 108.07 110.05 110.11 107.53 103.82 97.13 95.99 96.92 107.21 110.48 105.26 104.44 103.96 105.51 104.86 104.49 99.82 94.7562 70% Load Factor All in Rate 69.91 70.49 77.52 81.21 75.12 66.92 61.58 67.93 81.89 85.10 78.97 80.94 86.62 88.38 88.79 86.88 83.82 77.85 76.60 77.16 85.85 87.98 83.51 83.06 81.78 83.26 83.06 83.48 79.50 75.216364 Shaded Values are Actuals6566 Under (Over) Collected Demand 1,445 1,401 (3,450) (10,185) (16,655) (15,537) (12,781) (8,272) (1,315) (2,710) (2,922) 1,843 3,220 1,384 (2,248) (5,239) (7,893) (7,750) (6,095) 824 6,046 2,582 993 5,203 5,959 3,512 (741) (4,072) (7,091) (6,946)6768 Under (Over) Collected Transmission (578) (422) 308 252 353 368 353 338 355 282 158 195 175 87 27 (23) (50) (65) (55) 75 122 115 37 109 115 43 (31) (92) (125) (144)6970 ARP All in Rate Cost / MWh 75.47 68.62 65.64 62.76 60.95 72.03 74.21 83.13 93.82 90.26 95.10 90.26 90.89 84.66 80.46 75.99 76.68 81.24 87.29 96.67 94.78 93.10 99.73 95.80 87.32 81.80 76.16 73.84 73.14 77.25
20182017
FMPAAll Requirements Project
December 2016 Rate Calculation - FYE 2017 Budget Rates and Rate Projection - Schedule B-1 Methodology - Four Month Spread of Rate/Cost & Liquidity Differences
2016
13 of 28
60% Load Factor
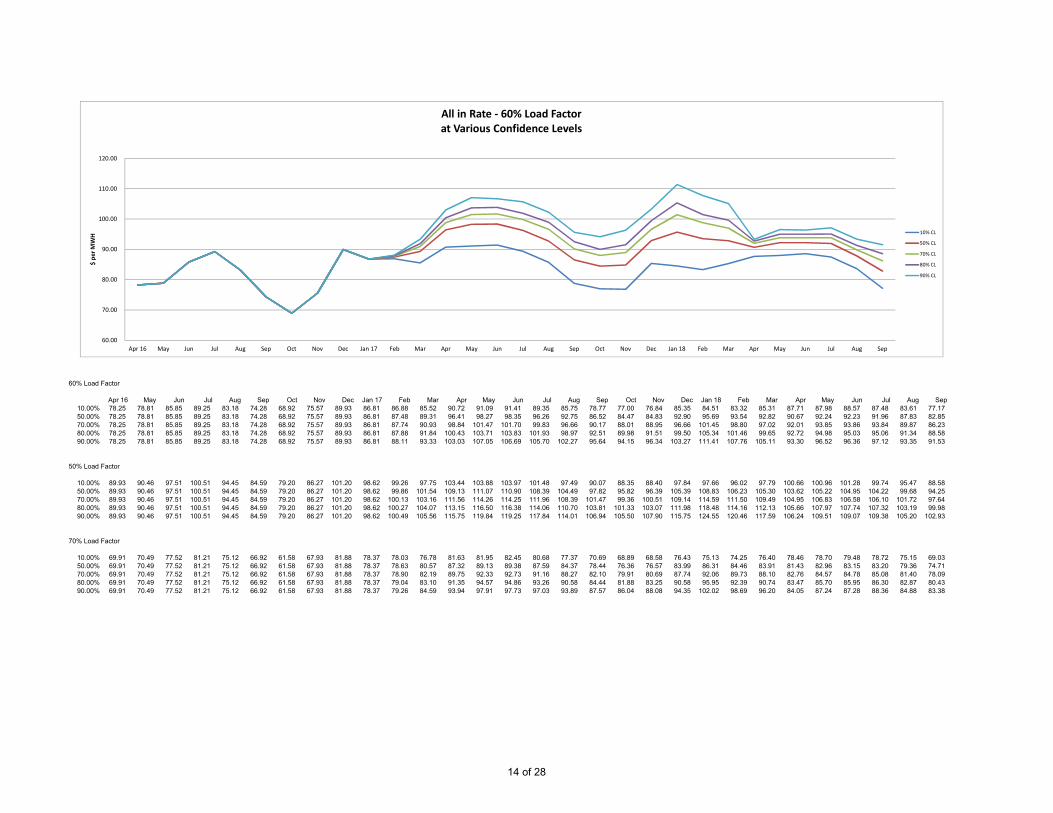
Apr 16 May Jun Jul Aug Sep Oct Nov Dec Jan 17 Feb Mar Apr May Jun Jul Aug Sep Oct Nov Dec Jan 18 Feb Mar Apr May Jun Jul Aug Sep10.00% 78.25 78.81 85.85 89.25 83.18 74.28 68.92 75.57 89.93 86.81 86.88 85.52 90.72 91.09 91.41 89.35 85.75 78.77 77.00 76.84 85.35 84.51 83.32 85.31 87.71 87.98 88.57 87.48 83.61 77.1750.00% 78.25 78.81 85.85 89.25 83.18 74.28 68.92 75.57 89.93 86.81 87.48 89.31 96.41 98.27 98.35 96.26 92.75 86.52 84.47 84.83 92.90 95.69 93.54 92.82 90.67 92.24 92.23 91.96 87.83 82.8570.00% 78.25 78.81 85.85 89.25 83.18 74.28 68.92 75.57 89.93 86.81 87.74 90.93 98.84 101.47 101.70 99.83 96.66 90.17 88.01 88.95 96.66 101.45 98.80 97.02 92.01 93.85 93.86 93.84 89.87 86.2380.00% 78.25 78.81 85.85 89.25 83.18 74.28 68.92 75.57 89.93 86.81 87.88 91.84 100.43 103.71 103.83 101.93 98.97 92.51 89.98 91.51 99.50 105.34 101.46 99.65 92.72 94.98 95.03 95.06 91.34 88.5890.00% 78.25 78.81 85.85 89.25 83.18 74.28 68.92 75.57 89.93 86.81 88.11 93.33 103.03 107.05 106.69 105.70 102.27 95.64 94.15 96.34 103.27 111.41 107.76 105.11 93.30 96.52 96.36 97.12 93.35 91.53
50% Load Factor
10.00% 89.93 90.46 97.51 100.51 94.45 84.59 79.20 86.27 101.20 98.62 99.26 97.75 103.44 103.88 103.97 101.48 97.49 90.07 88.35 88.40 97.84 97.66 96.02 97.79 100.66 100.96 101.28 99.74 95.47 88.5850.00% 89.93 90.46 97.51 100.51 94.45 84.59 79.20 86.27 101.20 98.62 99.86 101.54 109.13 111.07 110.90 108.39 104.49 97.82 95.82 96.39 105.39 108.83 106.23 105.30 103.62 105.22 104.95 104.22 99.68 94.2570.00% 89.93 90.46 97.51 100.51 94.45 84.59 79.20 86.27 101.20 98.62 100.13 103.16 111.56 114.26 114.25 111.96 108.39 101.47 99.36 100.51 109.14 114.59 111.50 109.49 104.95 106.83 106.58 106.10 101.72 97.6480.00% 89.93 90.46 97.51 100.51 94.45 84.59 79.20 86.27 101.20 98.62 100.27 104.07 113.15 116.50 116.38 114.06 110.70 103.81 101.33 103.07 111.98 118.48 114.16 112.13 105.66 107.97 107.74 107.32 103.19 99.9890.00% 89.93 90.46 97.51 100.51 94.45 84.59 79.20 86.27 101.20 98.62 100.49 105.56 115.75 119.84 119.25 117.84 114.01 106.94 105.50 107.90 115.75 124.55 120.46 117.59 106.24 109.51 109.07 109.38 105.20 102.93
70% Load Factor
10.00% 69.91 70.49 77.52 81.21 75.12 66.92 61.58 67.93 81.88 78.37 78.03 76.78 81.63 81.95 82.45 80.68 77.37 70.69 68.89 68.58 76.43 75.13 74.25 76.40 78.46 78.70 79.48 78.72 75.15 69.0350.00% 69.91 70.49 77.52 81.21 75.12 66.92 61.58 67.93 81.88 78.37 78.63 80.57 87.32 89.13 89.38 87.59 84.37 78.44 76.36 76.57 83.99 86.31 84.46 83.91 81.43 82.96 83.15 83.20 79.36 74.7170.00% 69.91 70.49 77.52 81.21 75.12 66.92 61.58 67.93 81.88 78.37 78.90 82.19 89.75 92.33 92.73 91.16 88.27 82.10 79.91 80.69 87.74 92.06 89.73 88.10 82.76 84.57 84.78 85.08 81.40 78.0980.00% 69.91 70.49 77.52 81.21 75.12 66.92 61.58 67.93 81.88 78.37 79.04 83.10 91.35 94.57 94.86 93.26 90.58 84.44 81.88 83.25 90.58 95.95 92.39 90.74 83.47 85.70 85.95 86.30 82.87 80.4390.00% 69.91 70.49 77.52 81.21 75.12 66.92 61.58 67.93 81.88 78.37 79.26 84.59 93.94 97.91 97.73 97.03 93.89 87.57 86.04 88.08 94.35 102.02 98.69 96.20 84.05 87.24 87.28 88.36 84.88 83.38
60.00
70.00
80.00
90.00
100.00
110.00
120.00
Apr 16 May Jun Jul Aug Sep Oct Nov Dec Jan 17 Feb Mar Apr May Jun Jul Aug Sep Oct Nov Dec Jan 18 Feb Mar Apr May Jun Jul Aug Sep
$ pe
r MWH
All in Rate ‐ 60% Load Factorat Various Confidence Levels
10% CL
50% CL
70% CL
80% CL
90% CL
14 of 28
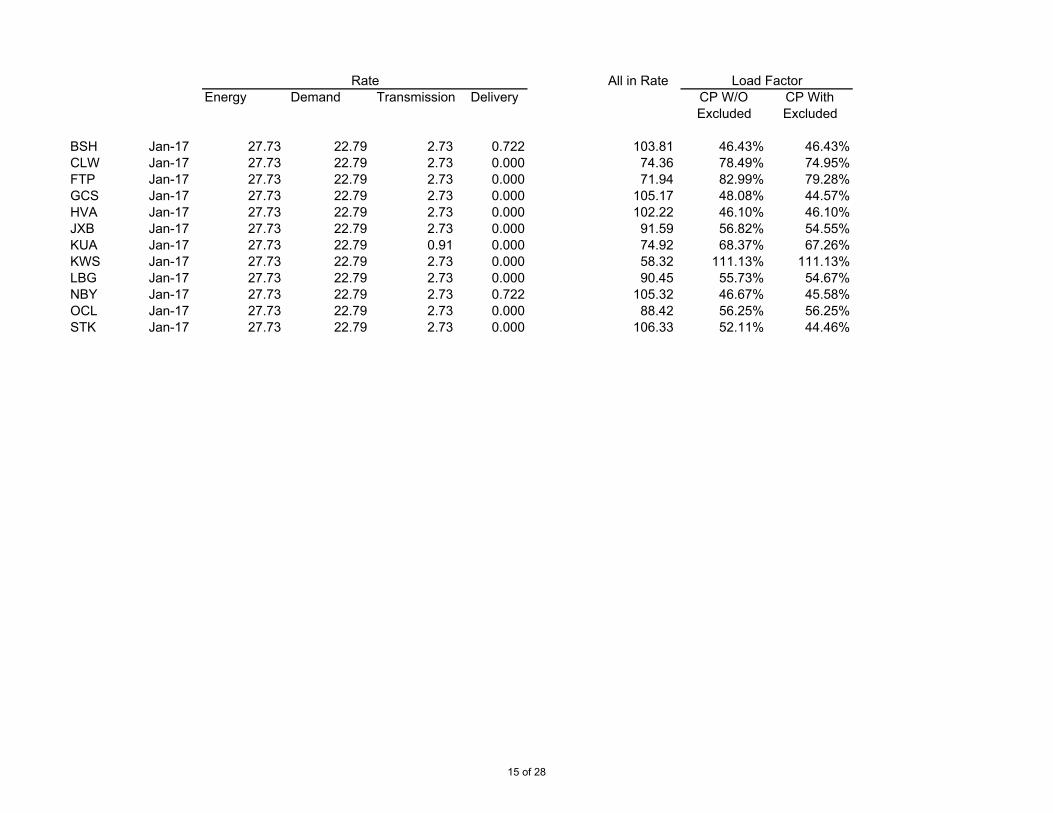
All in RateEnergy Demand Transmission Delivery CP W/O CP With
Excluded Excluded
BSH Jan-17 27.73 22.79 2.73 0.722 103.81 46.43% 46.43%CLW Jan-17 27.73 22.79 2.73 0.000 74.36 78.49% 74.95%FTP Jan-17 27.73 22.79 2.73 0.000 71.94 82.99% 79.28%GCS Jan-17 27.73 22.79 2.73 0.000 105.17 48.08% 44.57%HVA Jan-17 27.73 22.79 2.73 0.000 102.22 46.10% 46.10%JXB Jan-17 27.73 22.79 2.73 0.000 91.59 56.82% 54.55%KUA Jan-17 27.73 22.79 0.91 0.000 74.92 68.37% 67.26%KWS Jan-17 27.73 22.79 2.73 0.000 58.32 111.13% 111.13%LBG Jan-17 27.73 22.79 2.73 0.000 90.45 55.73% 54.67%NBY Jan-17 27.73 22.79 2.73 0.722 105.32 46.67% 45.58%OCL Jan-17 27.73 22.79 2.73 0.000 88.42 56.25% 56.25%STK Jan-17 27.73 22.79 2.73 0.000 106.33 52.11% 44.46%
Rate Load Factor
15 of 28
0
100
200
300
400
500
600
700
800
900
1,000
0
1
2
3
4
5
6
Jan 1 Jan 3 Jan 5 Jan 7 Jan 9 Jan 11 Jan 13 Jan 15 Jan 17 Jan 19 Jan 21 Jan 23 Jan 25 Jan 27 Jan 29 Jan 31
ARP MW
Bushne
ll MW
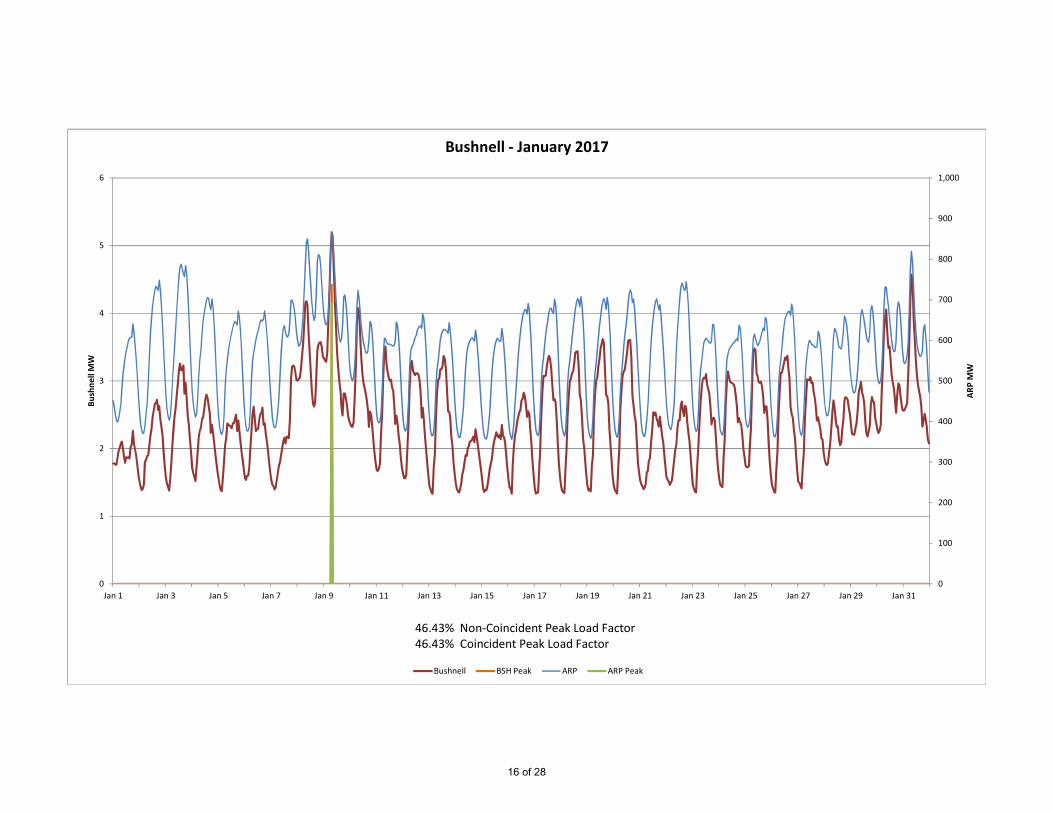
Bushnell ‐ January 2017
Bushnell BSH Peak ARP ARP Peak
46.43% Non‐Coincident Peak Load Factor 46.43% Coincident Peak Load Factor
16 of 28
0
100
200
300
400
500
600
700
800
900
1,000
0
5
10
15
20
25
Jan 1 Jan 3 Jan 5 Jan 7 Jan 9 Jan 11 Jan 13 Jan 15 Jan 17 Jan 19 Jan 21 Jan 23 Jan 25 Jan 27 Jan 29 Jan 31
ARP MW
Clew
iston
MW
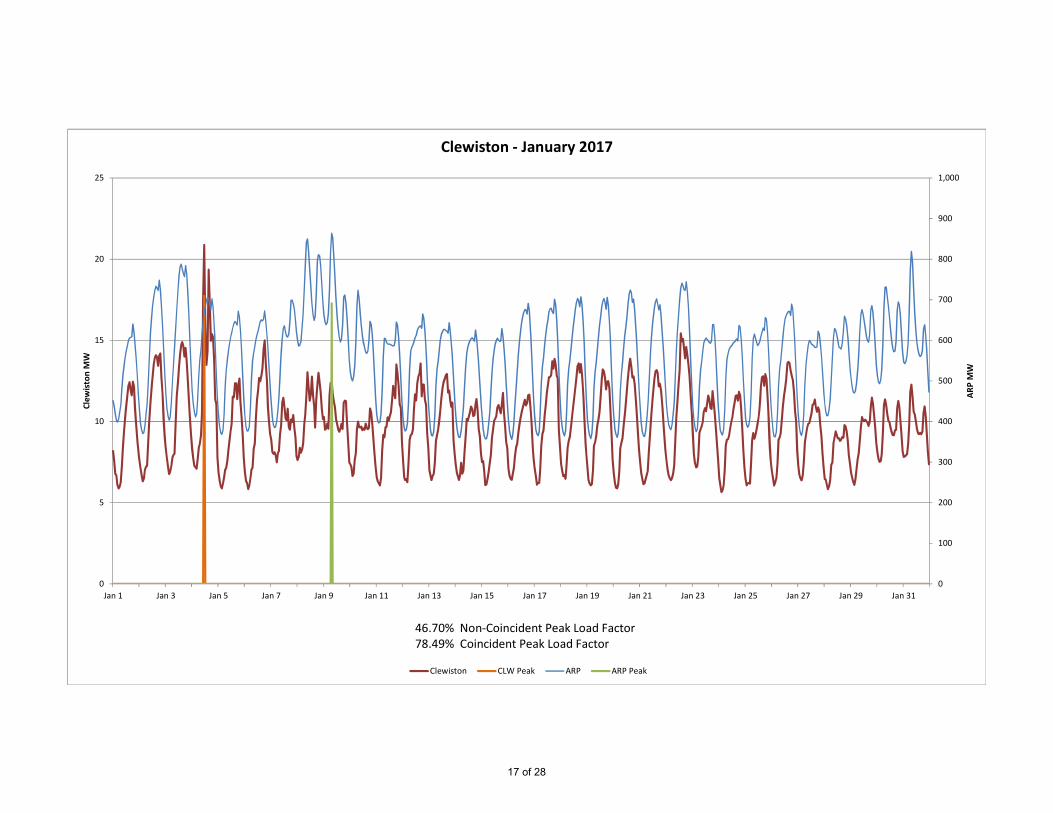
Clewiston ‐ January 2017
Clewiston CLW Peak ARP ARP Peak
46.70% Non‐Coincident Peak Load Factor 78.49% Coincident Peak Load Factor
17 of 28
0
100
200
300
400
500
600
700
800
900
1,000
0
1
2
3
4
5
6
7
8
9
Jan 1 Jan 3 Jan 5 Jan 7 Jan 9 Jan 11 Jan 13 Jan 15 Jan 17 Jan 19 Jan 21 Jan 23 Jan 25 Jan 27 Jan 29 Jan 31
ARP MW
Fort M
eade
MW
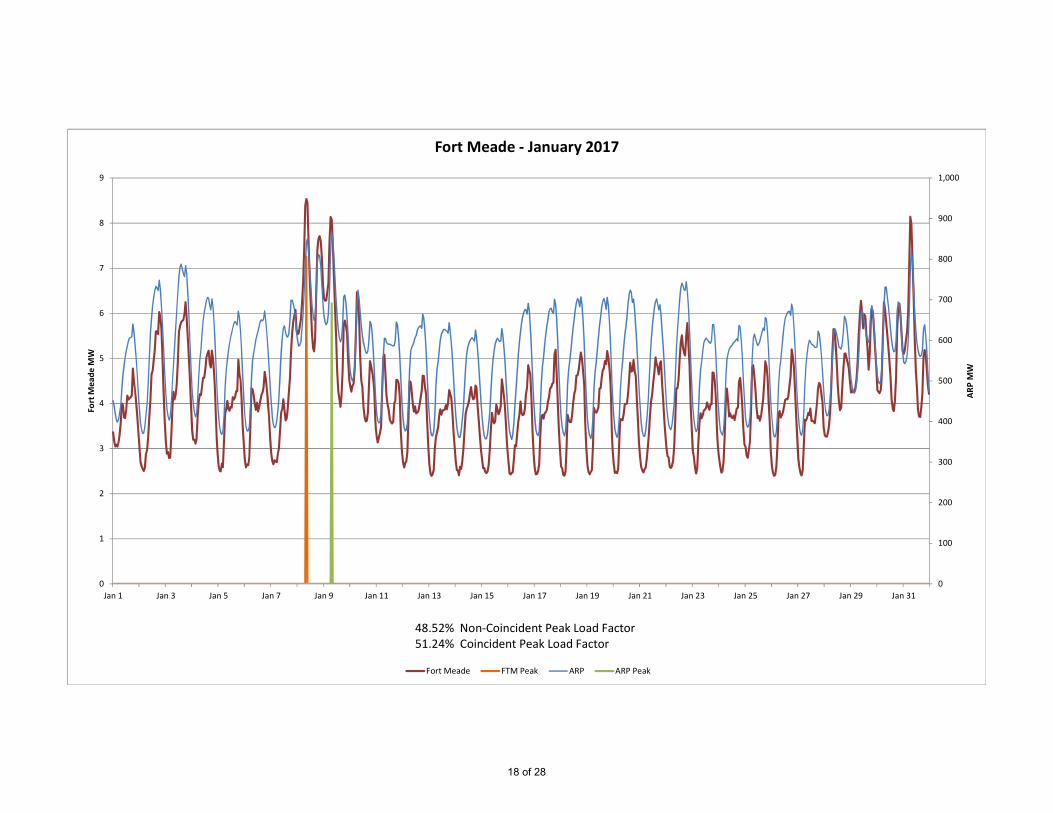
Fort Meade ‐ January 2017
Fort Meade FTM Peak ARP ARP Peak
48.52% Non‐Coincident Peak Load Factor 51.24% Coincident Peak Load Factor
18 of 28
0
100
200
300
400
500
600
700
800
900
1,000
0
10
20
30
40
50
60
70
80
90
Jan 1 Jan 3 Jan 5 Jan 7 Jan 9 Jan 11 Jan 13 Jan 15 Jan 17 Jan 19 Jan 21 Jan 23 Jan 25 Jan 27 Jan 29 Jan 31
ARP MW
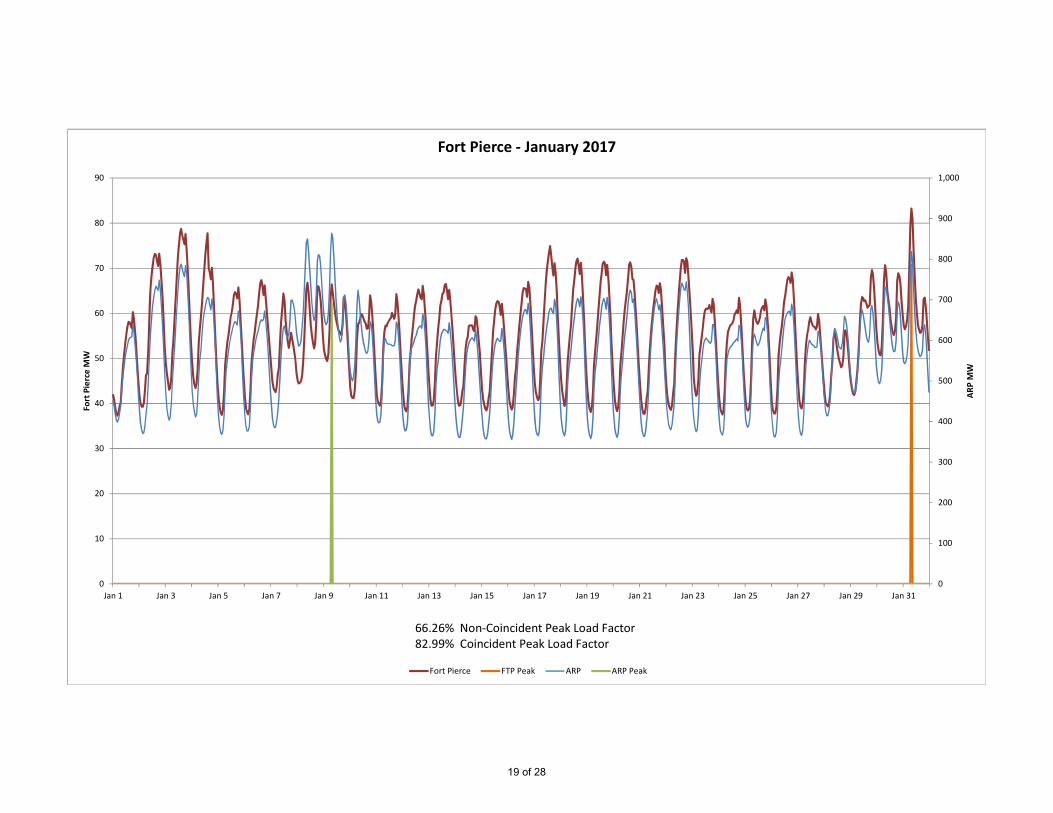
Fort Pierce MW
Fort Pierce ‐ January 2017
Fort Pierce FTP Peak ARP ARP Peak
66.26% Non‐Coincident Peak Load Factor 82.99% Coincident Peak Load Factor
19 of 28
0
100
200
300
400
500
600
700
800
900
1,000
0
5
10
15
20
25
30
Jan 1 Jan 3 Jan 5 Jan 7 Jan 9 Jan 11 Jan 13 Jan 15 Jan 17 Jan 19 Jan 21 Jan 23 Jan 25 Jan 27 Jan 29 Jan 31
ARP MW
Green
Cov
e Sp
rings M
W
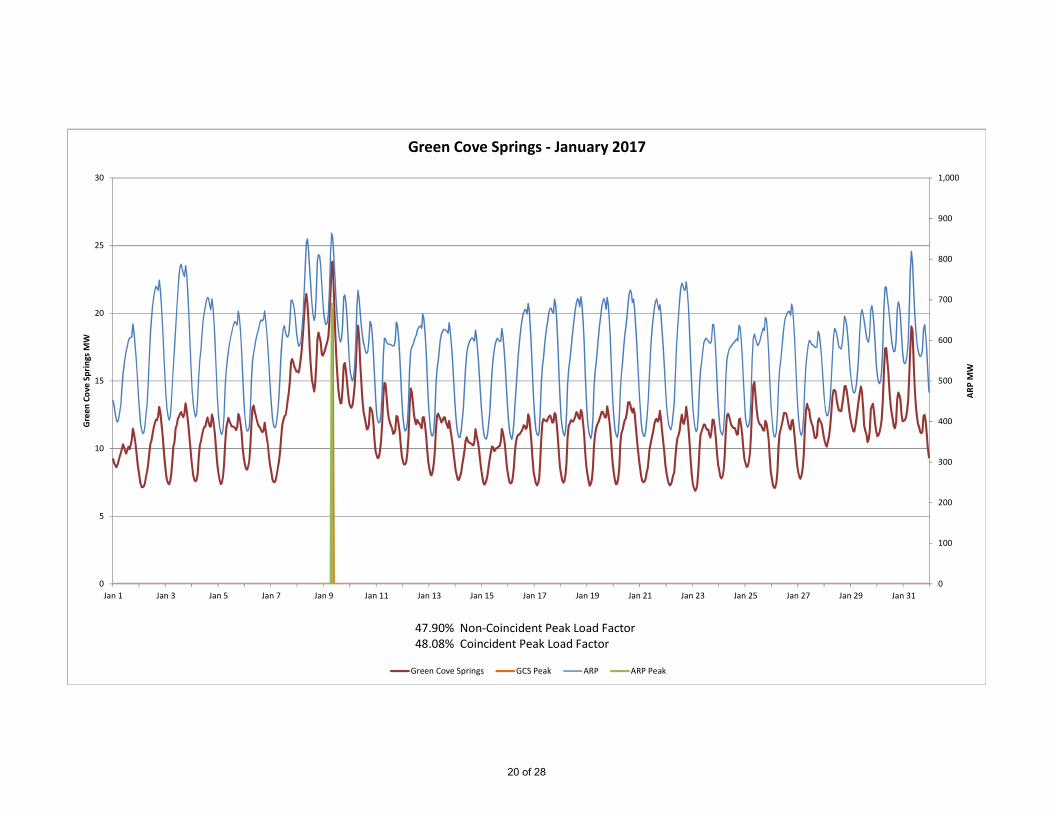
Green Cove Springs ‐ January 2017
Green Cove Springs GCS Peak ARP ARP Peak
47.90% Non‐Coincident Peak Load Factor 48.08% Coincident Peak Load Factor
20 of 28
0
100
200
300
400
500
600
700
800
900
1,000
0
1
2
3
4
5
6
7
Jan 1 Jan 3 Jan 5 Jan 7 Jan 9 Jan 11 Jan 13 Jan 15 Jan 17 Jan 19 Jan 21 Jan 23 Jan 25 Jan 27 Jan 29 Jan 31
ARP MW
Havan
a MW
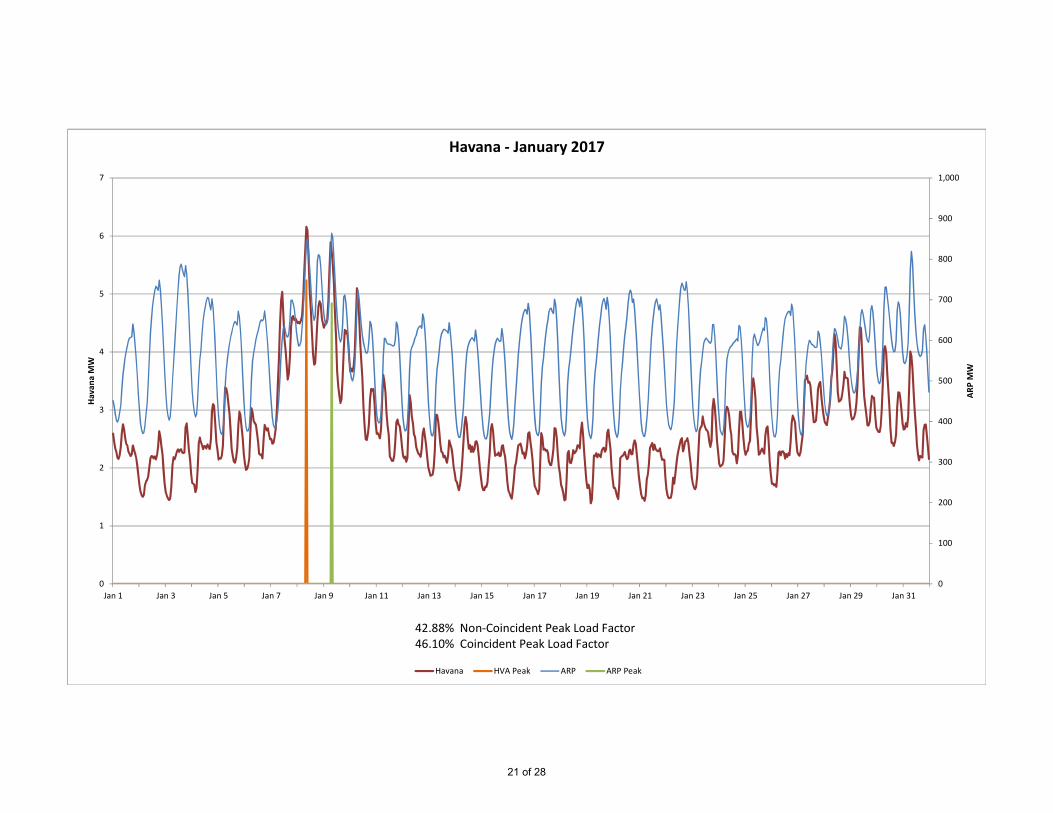
Havana ‐ January 2017
Havana HVA Peak ARP ARP Peak
42.88% Non‐Coincident Peak Load Factor 46.10% Coincident Peak Load Factor
21 of 28
0
100
200
300
400
500
600
700
800
900
1,000
0
20
40
60
80
100
120
140
160
180
Jan 1 Jan 3 Jan 5 Jan 7 Jan 9 Jan 11 Jan 13 Jan 15 Jan 17 Jan 19 Jan 21 Jan 23 Jan 25 Jan 27 Jan 29 Jan 31
ARP MW
Beache
s Ene
rgy MW
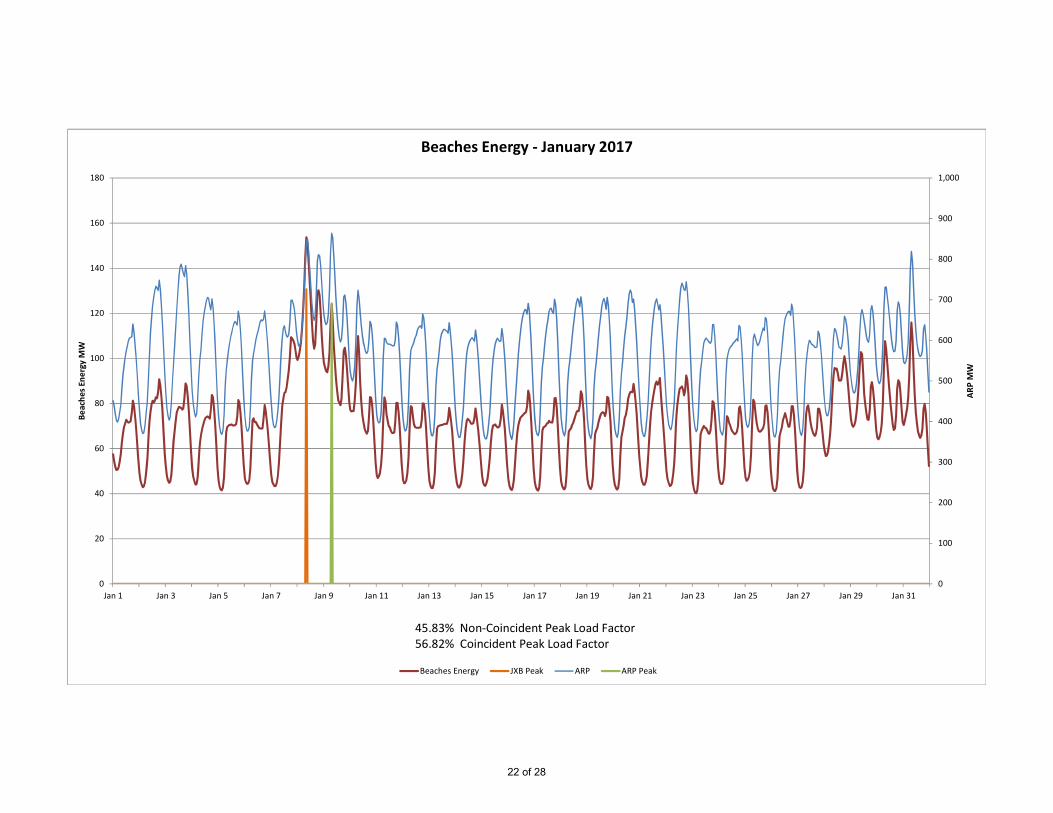
Beaches Energy ‐ January 2017
Beaches Energy JXB Peak ARP ARP Peak
45.83% Non‐Coincident Peak Load Factor 56.82% Coincident Peak Load Factor
22 of 28
0
100
200
300
400
500
600
700
800
900
1,000
0
50
100
150
200
250
Jan 1 Jan 3 Jan 5 Jan 7 Jan 9 Jan 11 Jan 13 Jan 15 Jan 17 Jan 19 Jan 21 Jan 23 Jan 25 Jan 27 Jan 29 Jan 31
ARP MW
Kissim
mee
Utility
Autho
rity MW
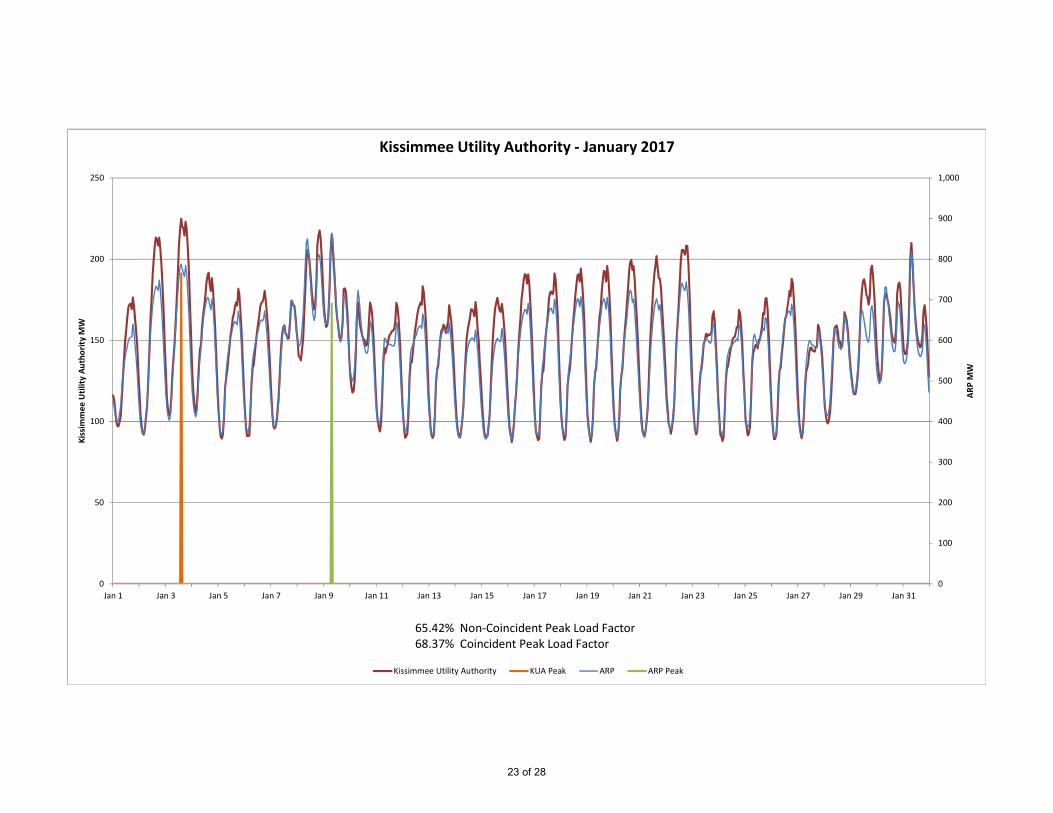
Kissimmee Utility Authority ‐ January 2017
Kissimmee Utility Authority KUA Peak ARP ARP Peak
65.42% Non‐Coincident Peak Load Factor 68.37% Coincident Peak Load Factor
23 of 28
0
100
200
300
400
500
600
700
800
900
1,000
0
20
40
60
80
100
120
140
Jan 1 Jan 3 Jan 5 Jan 7 Jan 9 Jan 11 Jan 13 Jan 15 Jan 17 Jan 19 Jan 21 Jan 23 Jan 25 Jan 27 Jan 29 Jan 31
ARP MW
Keys Ene
rgy Services M
W
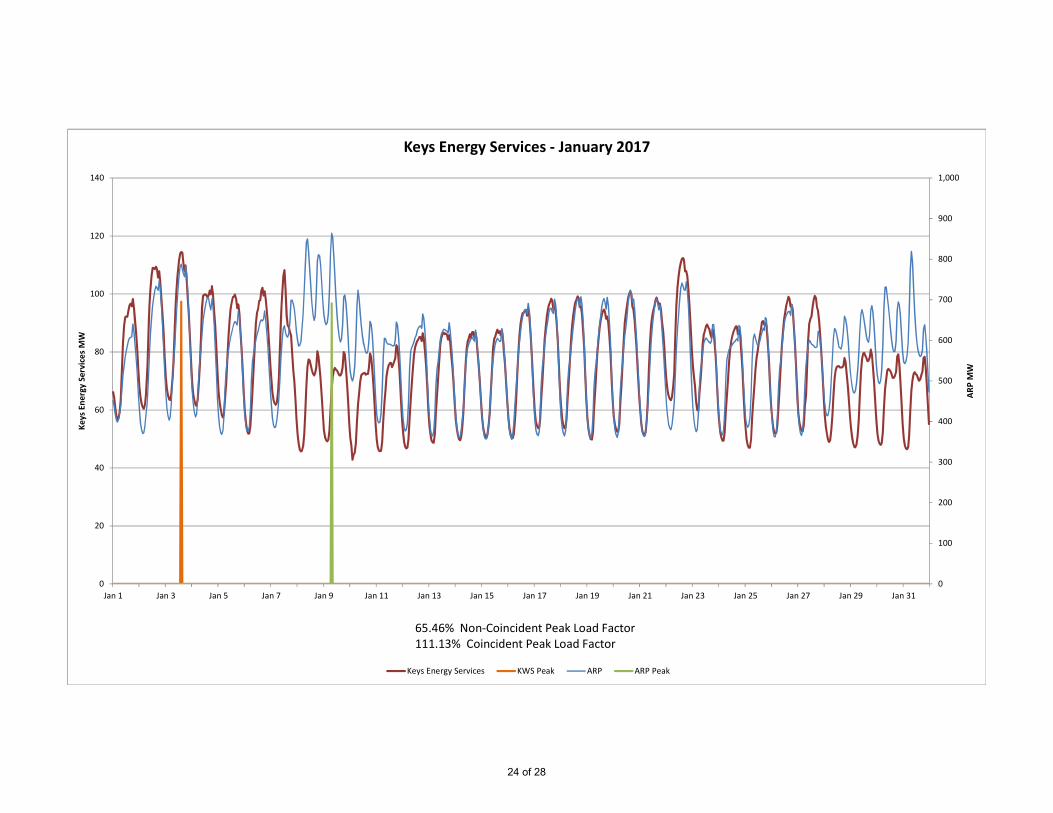
Keys Energy Services ‐ January 2017
Keys Energy Services KWS Peak ARP ARP Peak
65.46% Non‐Coincident Peak Load Factor 111.13% Coincident Peak Load Factor
24 of 28
0
100
200
300
400
500
600
700
800
900
1,000
0
10
20
30
40
50
60
70
80
90
Jan 1 Jan 3 Jan 5 Jan 7 Jan 9 Jan 11 Jan 13 Jan 15 Jan 17 Jan 19 Jan 21 Jan 23 Jan 25 Jan 27 Jan 29 Jan 31
ARP MW
Leesbu
rg M
W
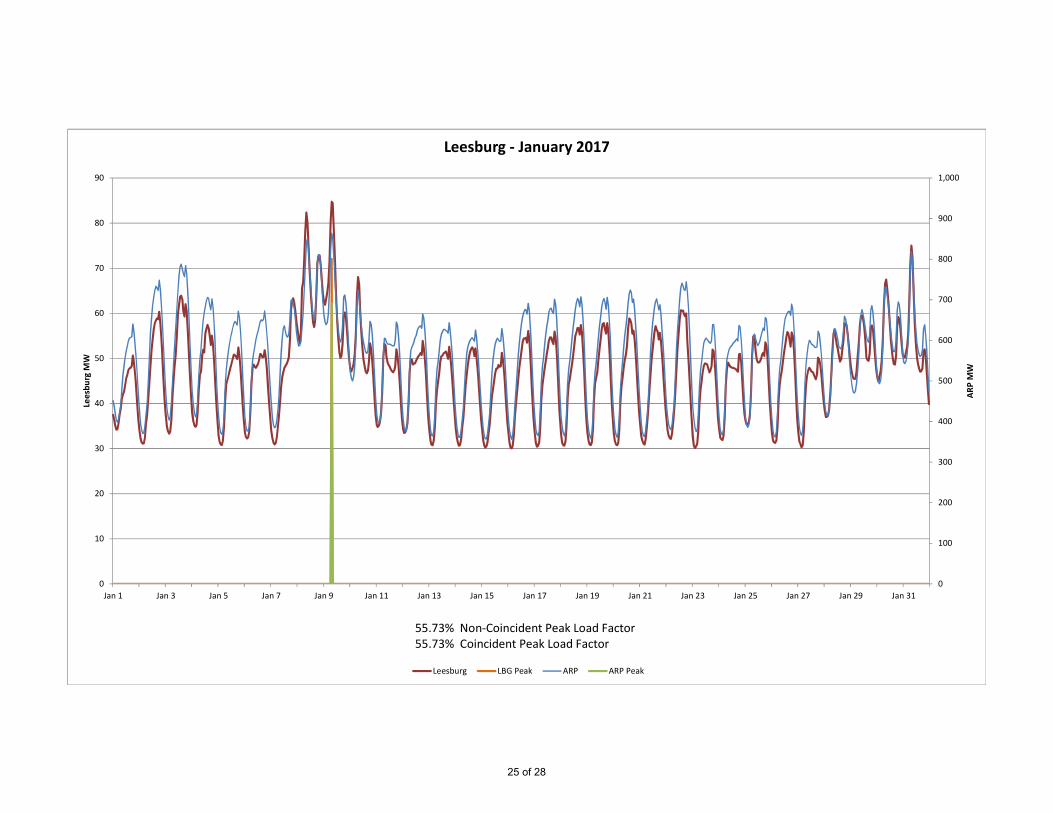
Leesburg ‐ January 2017
Leesburg LBG Peak ARP ARP Peak
55.73% Non‐Coincident Peak Load Factor 55.73% Coincident Peak Load Factor
25 of 28
0
100
200
300
400
500
600
700
800
900
1,000
0
1
2
3
4
5
6
7
8
9
Jan 1 Jan 3 Jan 5 Jan 7 Jan 9 Jan 11 Jan 13 Jan 15 Jan 17 Jan 19 Jan 21 Jan 23 Jan 25 Jan 27 Jan 29 Jan 31
ARP MW
New
berry MW
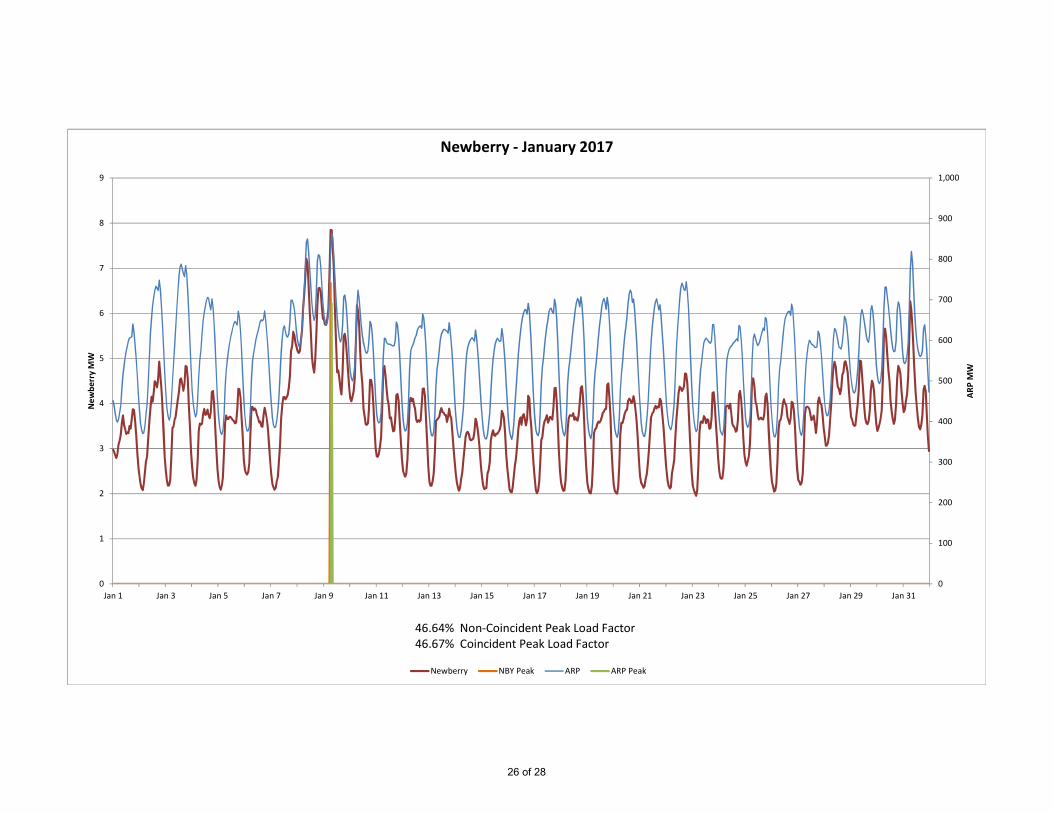
Newberry ‐ January 2017
Newberry NBY Peak ARP ARP Peak
46.64% Non‐Coincident Peak Load Factor 46.67% Coincident Peak Load Factor
26 of 28
0
100
200
300
400
500
600
700
800
900
1,000
0
50
100
150
200
250
Jan 1 Jan 3 Jan 5 Jan 7 Jan 9 Jan 11 Jan 13 Jan 15 Jan 17 Jan 19 Jan 21 Jan 23 Jan 25 Jan 27 Jan 29 Jan 31
ARP MW
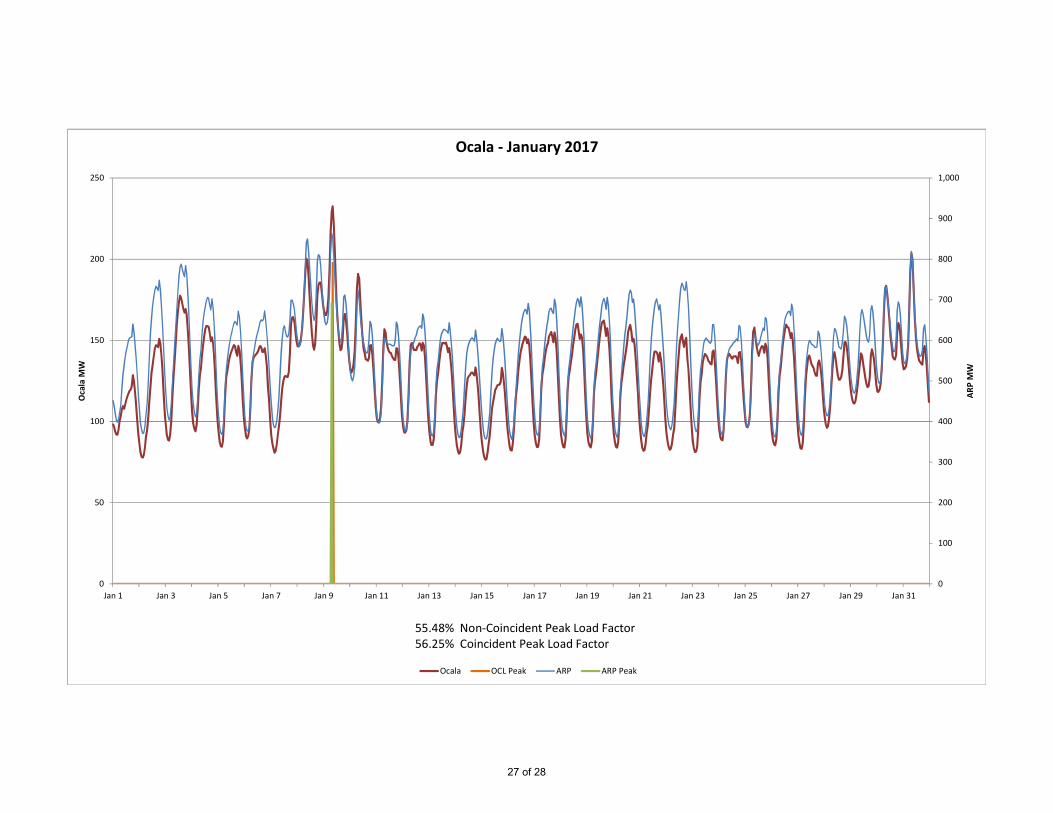
Ocala M
W
Ocala ‐ January 2017
Ocala OCL Peak ARP ARP Peak
55.48% Non‐Coincident Peak Load Factor 56.25% Coincident Peak Load Factor
27 of 28
0
100
200
300
400
500
600
700
800
900
1,000
0
2
4
6
8
10
12
14
16
Jan 1 Jan 3 Jan 5 Jan 7 Jan 9 Jan 11 Jan 13 Jan 15 Jan 17 Jan 19 Jan 21 Jan 23 Jan 25 Jan 27 Jan 29 Jan 31
ARP MW
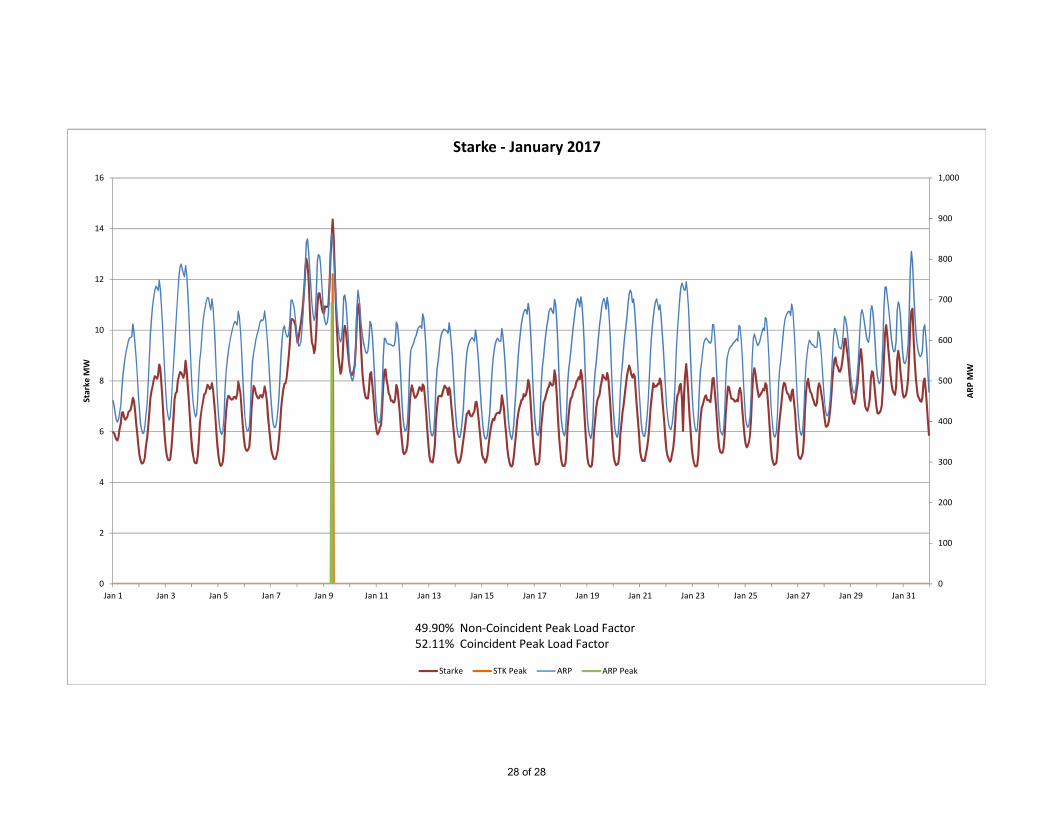
Starke
MW
Starke ‐ January 2017
Starke STK Peak ARP ARP Peak
49.90% Non‐Coincident Peak Load Factor 52.11% Coincident Peak Load Factor
28 of 28