Embed Size (px)
Citation preview

Draft 1/25/2009
PowerSouth Energy Cooperative
Sandestin FL 22 January 2008
Natural Gas and
the Jackrabbit Jesse H. Ausubel
Director, Program for the Human Environment
The Rockefeller University, 1230 York Avenue, New York NY 10021
1 212 327 7917
http://phe.rockefeller.edu
1

Draft 1/25/2009
Thanks to Gary Smith and the PowerSouth Energy Cooperative for
the opportunity to speak with you about the energy business viewed through
a green lens. [Slide 1]. In the end my green lens will focus you on natural
gas, methane, not so-called renewables. My task is to explain why methane
is green and destiny, and why renewables are neither green nor destiny.
First, let me comment on a current temptation. The sudden crash of
the US and world economies during the last year tempts us to have faith in
revolutionary change. For energy systems, we should resist the belief that in
a short time everything can be different. Very stable trends characterize the
energy system. In fact, the stable trends finally appear to go unscathed
through economic depressions, wars, and, for better or worse, fashions in
public policy.
Let me begin with an extreme example of public policy, the central
planning that followed a famous revolution, the Bolshevik Revolution of
1917 in Russia. The Russian Revolution and later World War II literally
drove Russians back into the woods to collect their fuel. Yet, these extreme
political and economic shocks were later entirely absorbed. A “business as
usual” extrapolation of market substitution using logistic curves for the
period 1890-1915 predicts market shares of primary fuels in the USSR in
1950 very nicely. By 1950 one sees no visible effect on the energy system
of World War I, the Bolshevik Revolution, the Great Depression, or World
War II. Wood was disappearing right on schedule, coal peaking, oil
growing, and soon gas would be soaring, and nuclear penetrating.
2

Draft 1/25/2009
I would say the energy system had arrived at its genetic destiny.
Along the way, the leaders of Russia and its adversaries had made the
population miserable. Yet, the so-called leaders and planners made no
lasting effect on the USSR energy system.
America’s experience in energy systems differs little from Soviet
Russia. Consider for the US the change of four variables -- population,
affluence, consumer behavior, and technological efficiency -- that together
cause emissions of sulfur dioxide and carbon dioxide. Slide 2 charts the
changes of combinations of these variables against growing affluence
between 1900 and 2007. In particular, look at the effect of intervals of
economic depression and recession. For sulfur, in the Depression of 1930-
1935 the system backtracked and then resumed its trajectories, barely
affected. The chaotic fluctuations during the post-War recession of 1945-
1952 were similarly soon absorbed. For sulfur, the system worked its way
through a 100-year program of growing and then declining emissions.
Richer was first dirtier, but then richer became cleaner, in a great arc
economists call a Kuznets curve, for the American economist Simon
Kuznets.
What differs between sulfur and carbon is the duration of the life or
product cycle. For carbon, completing the arc, the Kuznets curve, will take
three hundred rather than the one hundred years sulfur took. Carbon will
weigh in the energy system for another 75 years or so.
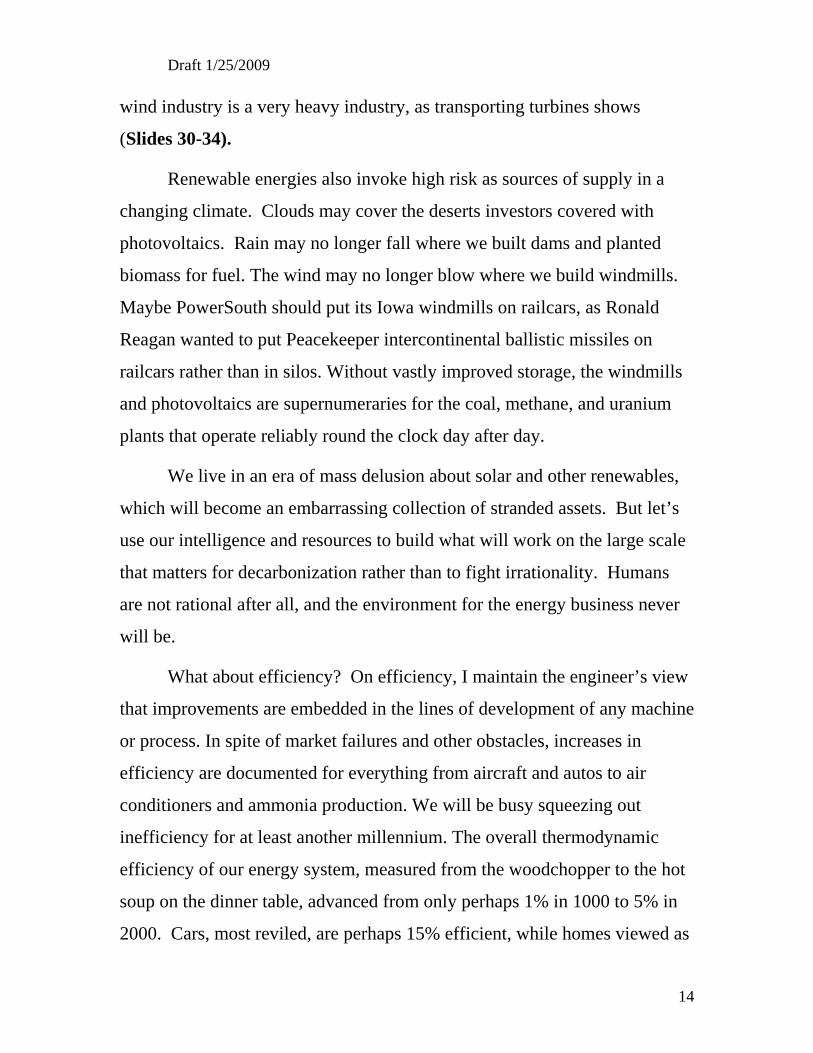
Returning to the regressive effects of economic turmoil, a zoom into
the carbon dioxide emission story during the Depression in Slide 3 shows
the effects in detail. The system darts this way and that before regaining its
3

Draft 1/25/2009
long-run orientation. A 20-second animation (Slide 4) shows the jackrabbit
behavior of the system in a depression. To summarize, periods of
depression and other forms of shock such as war do not revolutionize an
energy system, though they do release lots of hot air from politicians and
pundits.
Here let me introduce the most important trend in the environment for
the energy business, namely decarbonization. Hydrocarbons are of course a
mix of hydrogen (H) and carbon (C) [Slide 5]. Each combines with oxygen
to release energy, with the hydrogen converted to water H2O, and the carbon
mostly converted to carbon dioxide, CO2, which is food for plants but also a
greenhouse gas that now worries a lot of people. On average, when one
removes the water, biomass fuels such as wood, hay, and oats have a ratio of
about 40 Cs to 4 H. Charcoal is essentially pure C. Coal comes in many
shades but typically has about 8 Cs for each 4 H. Popular liquid products,
like gasoline and jet fuel, average about 2 C for each 4 H. Methane, CH4,
burns only 1 carbon for each 4 hydrogens, 1/40th the ratio of wood.
Tweny-five years ago, my colleagues and I put all the hydrocarbons
humans used each year for the past two centuries in a hypothetical gigamixer
and plotted the history of fuel in terms of the ratio of C to H [Slide 6]. To
our surprise we found a monotonic trend, namely the ascent of hydrogen.
We named the trend decarbonization for the concomitant descent of carbon.
The history of hydrocarbons is an evolutionary progression from biomass to
coal to oil to natural gas and on to hydrogen, eventually derived from non-
fossil fuels in order to keep the primary mix clean of carbon. The figure
shows carbon losing market share to hydrogen as horses losing to cars or
typewriters losing to word processors. The slow process to get from 90% C
4

Draft 1/25/2009
to 90% H in the fuel mix should take about 300 years and pass the 90%
mark about 2085. Let’s say 2100 so as not to appear overconfident.
Some decades have lagged and some accelerated but the inexorable
decline of carbon seems clear. Times make the man. The patron of my
University, John D. Rockefeller, surfed on this long wave by standardizing
oil. Al Gore surfed the wave to a Nobel Peace Prize. Over the past 20 years
decarbonization has entered the vernacular, and a New York money manager
even has a decarbonization mutual fund. Successful people and companies
ride the wave of history and arrogate fame and money. I hope people in this
room do so.
A variation of decarbonization as a competition between carbon and
hydrogen (Slide 7) shows the kilos of carbon per unit of energy, thus
integrating fuel switching with increases in efficiency, that is, technical
progress, for example better motors. The global kilos of carbon per joule of
energy slide inexorably downward. The variation of carbon per GDP further
integrates energy with consumer behavior, that is, whether consumers favor
energy with their marginal dollar. The US is not an exception to the world
trend. Slide 8 shows that the US will soon celebrate its centennial of falling
carbon per dollar. In summary, long-term decarbonization lines always
point down for C and up for H.
One naturally asks why. The explanation is that the overall evolution
of the energy system is driven by the increasing spatial density of energy
consumption at the level of the end user, that is, the energy consumed per
square meter, for example, in a city. Finally, fuels must conform to what the
end user will accept, and constraints become more stringent as spatial
density of consumption rises. The spatial density of consumption in vertical
5

Draft 1/25/2009
cities like Shanghai is soaring. Such rich, dense cities accept happily only
electricity and gases, now methane and later hydrogen. These are the fuels
that reach consumers easily through pervasive infrastructure grids, right to
the burner tip in your kitchen.
Ultimately the behavior of the end user drives the system. When the
end user wants electricity and hydrogen, the primary energy sources that can
produce on the needed scale while meeting the ever more stringent
constraints that attend growth will eventually and inexorably win.
Economies of scale are a juggernaut over the long run.
One contributor to economies of scale is the heat value of the fuel per
kilo [Slide 9]. Replacing brown coal with methane raises the energy per ton
of fuel as it decarbonizes. Thirteen railroad cars of biomass such as
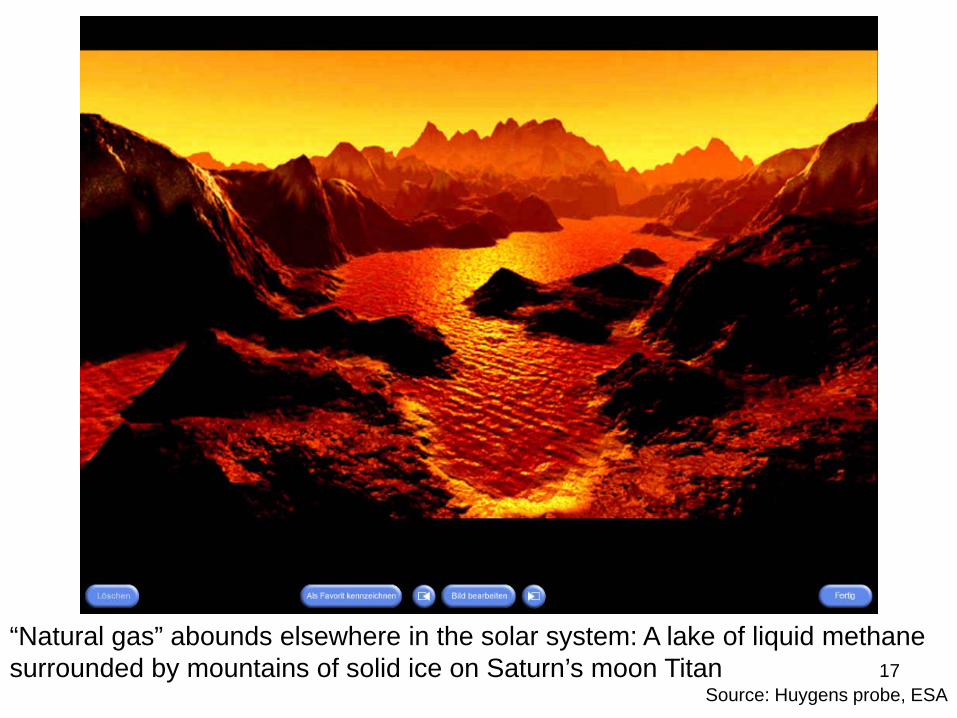
switchgrass equal about one railcar of coal and half a car of oil. Economies
of scale match best with technologies that grow smaller even as they grow
more powerful, as computer chips, electric motors, and power plants all have
done (Slide 10). Miniaturization matters because it multiplies the potential
market, as laptops show compared to main frame computers. Moreover,
miniaturization is green. It shrinks our footprint.
Miniaturization also matters because, notwithstanding the present
depression, over the long-turn energy use will keep rising. One reason is
that computer chips could well go into 1000 objects per capita, or 10 trillion
objects worldwide, as China and India log into the game. By the way, some
studies suggest the total energy system demand of a cell phone is not unlike
a refrigerator, because the telecom system must flood the skies with waves
and always be on. PowerSouth managers probably know exactly how its
6

Draft 1/25/2009
customers have increased demand by filling homes, hotels, and offices with
wifi and flat screens even as lamps and appliances became more efficient.
What is the most promising way for the energy system to meet
fluctuating and then again rising consumer demand amidst green fears? For
electricity, the obvious and destined route is methane, and PowerSouth is
about halfway there. Methane is inherently good for reasons now well-
established, but it can be even better. The next big trick is to take rocket
engines and turn them into power plants. One might say take a cruise
missile or even the space shuttle and turn it upside down and operate it for a
few hundred thousand hours. While methane consumption grows, we won’t
permit ourselves to dispose much of its carbon in the air. So, we will also
capture the emissions and make a methane-fueled Zero Emission Power
Plant or ZEPP.
Operating on methane, a ZEPP puts out electricity and carbon dioxide
that can easily be sequestered. From an engineering point of view, the key is
air separation or abundant cheap oxygen so that the fuel can be burned
neatly with the O2 and leave streams only of CO2 and water (Slide 11).
While in principle any fuel could be an input to such a machine, the theme
of clean-up on the front end favors methane. Coal is a minestrone with
sulfur, mercury, cadmium, and other headaches. Why buy rocks that will
leave piles of these elements that will likely cause a plant site to become a
regulated toxic waste dump, when one can purchase methane that is already
almost purely C and H? Chemical engineers appreciate the benefits of fine
feedstock.
ZEPP technology is exemplified by a company called Clean Energy
Systems in Bakersfield, California, which already has operated for 4 years a
7

Draft 1/25/2009
prototype ZEPP of 20 MW, which I visited myself (Slide 12). Some day the
Kimberlina plant may become an environmental world heritage site for its
contribution to decarbonization. Operating at high temperatures and
pressures, the plant, or rocket one might say, is delightfully compact.
Clean Energy Systems is also working on a 200 MW generator, whose
dimensions are even more striking (Slide 13, 14, 15). Think of a 200 MW
generator or turbine as a mobile home and the power park as half a dozen
trailers. The “All in” efficiency of the ZEPP including compressed CO2 as a
by-product should be about 50%. The CO2 can be sequestered underground
in a saline formation or used lucratively for enhanced oil recovery or
enhanced gas recovery,
Pushing the envelope on pressure and temperature, Japanese
colleagues calculate (Slide 16) a ZEPP a few decades hence could reach
70% efficiency, green indeed compared to the 30% of today’s coal plants.
Doubling the efficiency of power plants attracts me as a way to spare carbon
emission. My dream is a 5 GW ZEPP, super fast, operating at high
temperatures and high pressures and thus super compact. A single machine
the size of a locomotive would more than double PowerSouth capacity and
fit comfortably within the existing infrastructure!
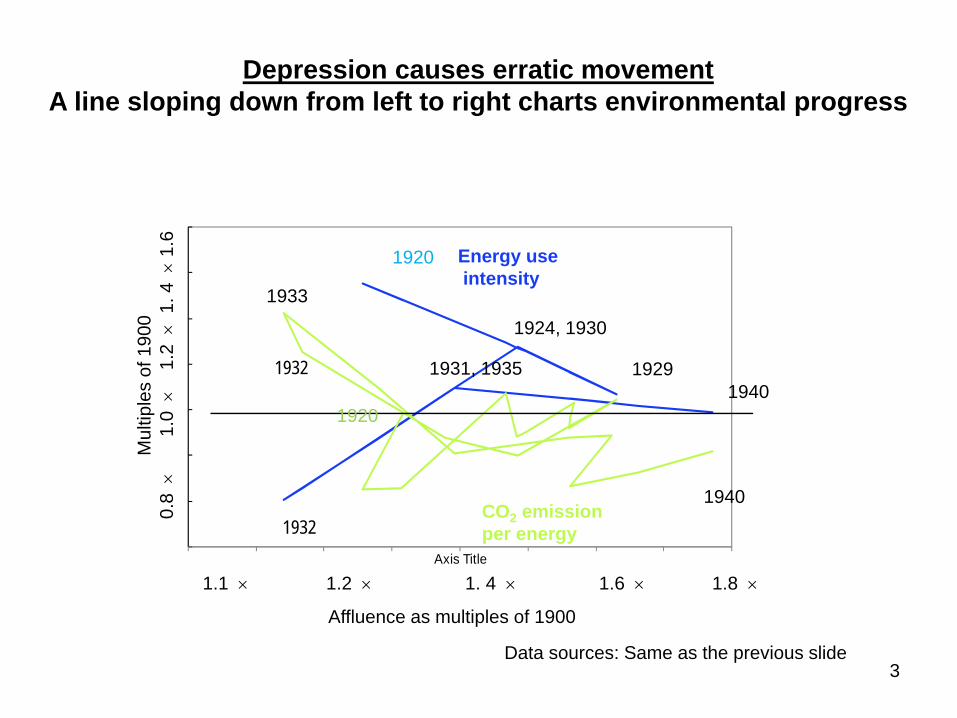
Where will the methane come from? Here let me introduce a heresy.
[Slide 17] I reject the notion of “fossil” fuels, which implies that all or most
oils and natural gases derive from the buried and chemically transformed
remains of once-living cells. Think of Earth instead as a steaming plum
pudding, outgassing since ever. Primordial, non-biological carbon comes in
the first place from the meteorites that help form Earth and other planetary
bodies. Abiogenic carbon clearly abounds on such planetary bodies as
8

Draft 1/25/2009
Titan, which enjoyed no Carboniferous or Jurassic eras with giant ferns and
dinosaurs. Now we sniff outgassing methane on Mars, too (Slide 18).
Water also abounds inside Earth, perhaps 10 times as much as in the
oceans. Suppose the carbon is upwelling from the core and mantle of the
planet and then, through a range of interactions with hydrogen and oxygen at
high temperatures and pressures, enters the crust from below as a carbon-
bearing fluid such as methane, butane, or propane. Continual loss of the
very light hydrogen brings it closer to what we call petroleum or even coal.
Emissions from volcanoes and earthquakes give further evidence of very
deep hydrocarbons eager to outgas.
The fossil theory relies on the long unquestioned belief that life can
exist only at the surface of Earth. In one of the most exciting scientific
developments of recent years, science has now established the existence of a
huge, deep, hot biosphere of microbes flourishing within Earth’s crust, down
to the deepest levels we drill. In fact, humanity has never drilled deeper than
life. Mud from the deepest holes of 30,000 and 40,000 feet bears life. These
deep microbes can best be explained by diffuse methane welling from the
depths on which methane-loving bugs thrive. Oil, too, is very desirable to
microbes.
So, the alternate concept is that the deep hot biosphere adds its
products to the upwelling hydrocarbons. The bioproducts have caused us to
uphold the belief that the so-called fossil fuels are the stored energy of the
Sun. I believe much, maybe most, of the oil and gas is not the stored energy
of the Sun but primordial hydrocarbons from deep in Earth. And they keep
refilling oil and gas reservoirs from below, as reported in fields deep under
the Gulf of Mexico. Alternate theories of the origins of gas, oil, and coal
9

Draft 1/25/2009
may well revolutionize Earth sciences over the next 2-3 decades, and lift
estimates of resource abundance. Methane may more truly be an
inexhaustible and renewable fuel, generated continually deep in Earth, than
forests, which humanity managed to eliminate from much of North Africa,
for example, for about 2,000 years.
New theory will also help reveal methane resources in little explored
places, such as the continental margins, where the sea floor slopes from a
few hundred meters deep to a few thousand. [Slide 19]. Now frequent
discoveries of communities of life that live around cold seeps of methane on
continental margins suggest that margins have lots of fracture zones where
gas upwells. Methane seeps are plentiful on the slopes of Powersouth’s
service area in the Gulf of Mexico [Slide 20]), near the potentially giant Jack
Field touted in September 2006. A more embracing theory of the margins
in which outgassing methane occurs all along their extent creates not only
startling life on the margins but vast ribbons of opportunity for offshore
exploration. Israel just proved the opportunity by finding deep carbon 16
thousand feet beneath 5000 feet of water on its continental margin. (Slide
21) The abundance of deep carbon, especially accessible offshore, and its
possible explanation, is a big story for the energy industry. The big news
from Brazil is not the few gallons of alcohol from sugar cane that provide
less than 10% of that nation’s primary energy, but the plans of Petrobras to
expand offshore natural gas extraction from astonishingly rich and surprising
superdeep wells from 7 million cubic meters per day in 2013 to 40 million
per day in 2020.
Working in the oceans brings immense responsibility. The oceans are
beautiful beyond imagination, as a selection of Arctic jellies show [Slide
10

Draft 1/25/2009
22]. But we have already squandered many riches of the oceans, and we do
not want to squander or harm more. The energy industries, including
PowerSouth, should become leading stewards of marine life, supporting
creation of protected areas, research, and monitoring, while operating
perfectly where society does permit operation. Florida and other states in
the Gulf Region can see the example of operators in places such as Norway,
where gas extraction activities minimally impact the environment (Slide 23).
Returning to the land, shale formations such as the Barnett and
Marcellus also harbor vast amounts of methane. The recent documentation
of the US reserves of about 2,000 tcf, comparable or larger than the fabled
Russian reserves, should limit methane price volatility, a widely cited
objection to the growth of methane’s market share.
Methane is compact, but uranium is 10,000 to 100,000 times more so
[Slide 24] Small is beautiful, and nuclear is very small. It is, after all,
atomic power. While the competition will take another century or so, finally
nuclear energy remains the overwhelming favorite to produce the hydrogen
and electricity that Alabama and Florida, not to mention Bangalore and
Shanghai, will demand. The important point is nuclear’s environmental
superiority to so-called renewables.
The reason, as hinted already, is that efficiency must be reckoned in
space as well as energy and carbon. To me the essence of green is No New
Structures, or at least few new visible ones, in the Gulf of Mexico or South
Alabama. I repeat that, like computers and the internet, the energy system to
be deeply green should become more powerful and smaller. [Repeat slide 10
as Slide 25] During the 20th century, electric generators grew from 10 to 1
11

Draft 1/25/2009
million kW, scaling up an astonishing 100,000 times. Yet a power station
today differs little in the space it occupies from that of 50 or 100 years ago.
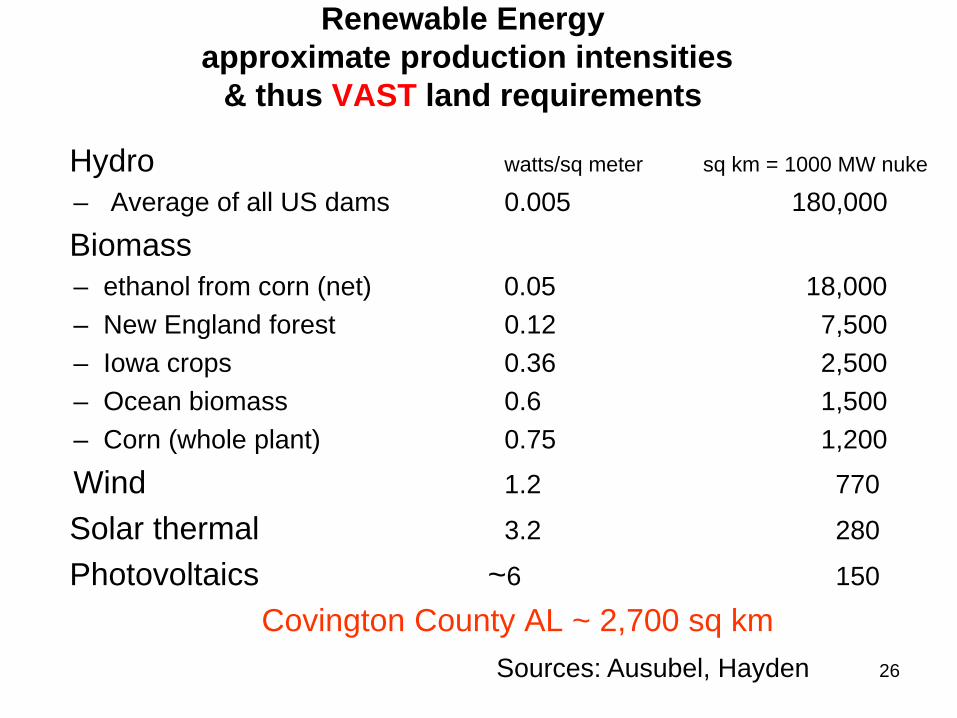
What about the so-called renewable forms of energy? They may be
renewable, but calculating spatial density proves they are not green. The
best way to understand the scale of destruction that hydro, biomass, wind,
and solar promise is to denominate each in watts per square meter that the
source could produce [Slide 26].
In a well-watered area like the Southeast, a square kilometer produces
enough hydroelectricity for about a dozen Americans, while severely
damaging life in its rivers. In any case, one needs catchment areas of
hundreds of thousands of square kilometers to provide gigawatts of
electricity, and no such areas remain in the Southeast.
The Southeast abounds in forest, more productive than the forest of
New England mentioned in Slide 26, but Powersouth would need to harvest
from every acre of three typical Alabama counties to provide kilowatts equal
to those generated by a single 1000 MW nuclear power plant on a square
kilometer or two.
Shifting from logs to corn, a biomass power plant requires about 2500
sq km of prime Iowa farmland to equal the output of a single 1000 MW
nuclear power plant on few hectares. PowerSouth would need to farm every
acre of Covington County to generate the kilowatts you would get from a
nuclear power plant.
Windmills to equal the same nuclear plant cover almost 800 square
km in a very favorable climate. (Slide 27)
12

Draft 1/25/2009
Photovoltaics require less but still a carpet of 150 sq km to match the
nuclear plant. (Slide 26 repeated as 28)
The spatial ratio for a Toyota rather than a large power plant is
equally discouraging. A car requires a pasture of a hectare or two to run on
biofuels, unwise as the world’s vehicle population heads toward 1 billion.
Biofuels, wind, solar, and other so-called renewable massacre
habitat. I want to spare land for nature, not burn, shave, or toast it.
No economies of scale adhere to any of the solar and renewable
sources (Slide 29), including by the way the sources of ocean energy, such
as tides, waves, and the thermal gradient, which also suffer from
combinations of dilution and intermittency. If you need another megawatt,
you site and build yet another windmill, another structure. Supplying more
customers or more demanding customers requires matching increases in
infrastructure, indeed potentially larger areas, as one will probably have used
the most fertile, wavy, windiest, sunniest, and wettest sites first.
Moreover, bridging the cloudy and dark as well as calm and gusty
weather takes storage batteries and their heavy metals. The photovoltaics
raise nasty problems of hazardous materials. Burning crops inflates the
price of food. Wind farms irritate with low-frequency noise and thumps,
blight landscapes, and whack birds and bats.
And, solar and renewables in every form require large and complex
machinery to produce many megawatts. Per average MW(e), a natural-gas
combined cycle plant uses 3.3 MT steel and 27 m3 concrete, while a typical
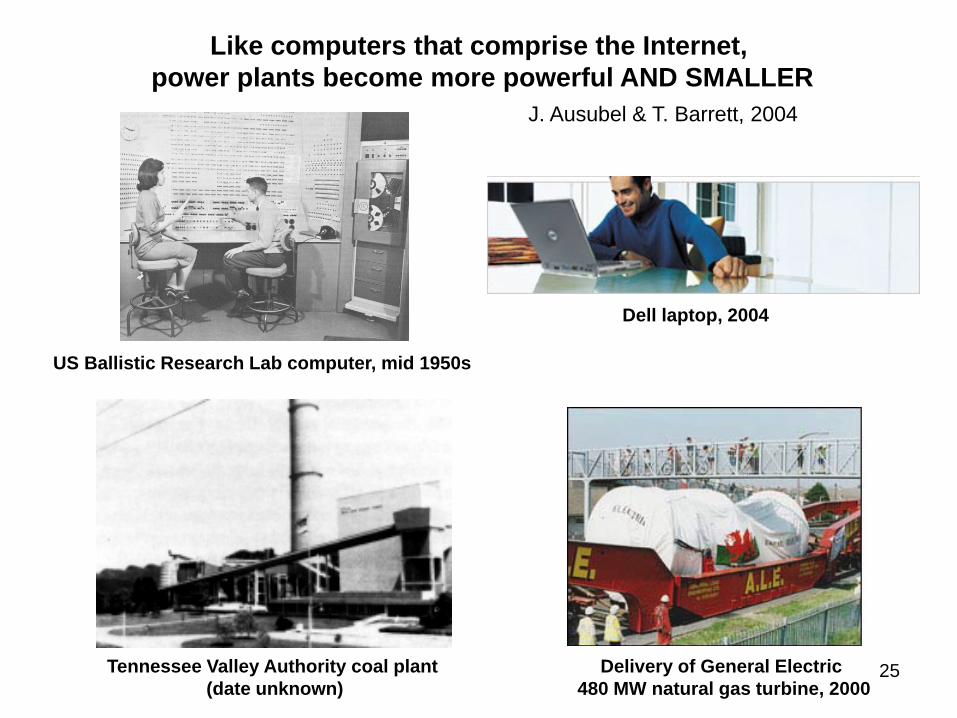
wind energy system requires construction inputs of 460 MT of steel and 870
m3 of concrete per average MW(e), about 130 and 30 times as much. The
13
Draft 1/25/2009
wind industry is a very heavy industry, as transporting turbines shows
(Slides 30-34).
Renewable energies also invoke high risk as sources of supply in a
changing climate. Clouds may cover the deserts investors covered with
photovoltaics. Rain may no longer fall where we built dams and planted
biomass for fuel. The wind may no longer blow where we build windmills.
Maybe PowerSouth should put its Iowa windmills on railcars, as Ronald
Reagan wanted to put Peacekeeper intercontinental ballistic missiles on
railcars rather than in silos. Without vastly improved storage, the windmills
and photovoltaics are supernumeraries for the coal, methane, and uranium
plants that operate reliably round the clock day after day.
We live in an era of mass delusion about solar and other renewables,
which will become an embarrassing collection of stranded assets. But let’s
use our intelligence and resources to build what will work on the large scale
that matters for decarbonization rather than to fight irrationality. Humans
are not rational after all, and the environment for the energy business never
will be.
What about efficiency? On efficiency, I maintain the engineer’s view
that improvements are embedded in the lines of development of any machine
or process. In spite of market failures and other obstacles, increases in
efficiency are documented for everything from aircraft and autos to air
conditioners and ammonia production. We will be busy squeezing out
inefficiency for at least another millennium. The overall thermodynamic
efficiency of our energy system, measured from the woodchopper to the hot
soup on the dinner table, advanced from only perhaps 1% in 1000 to 5% in
2000. Cars, most reviled, are perhaps 15% efficient, while homes viewed as
14

Draft 1/25/2009
machines may be only 3%-5% efficient. The difficulty is no one has found a
way to sustain improvements in efficiency beyond the 1-2%/yr that seem
built into most processes. A big problem seems to be user’s time budgets.
Efficiency strategies like car-pooling that conflict by even a few minutes
with people’s convenience are discarded.
While we have not discovered durable ways to multiply our rate of
increase of energy efficiency, the past year has reminded us broadly of the
virtues of thrift. Thrift and frugality have not been prominent values in
world society in recent decades. Indeed, one may attribute the present
economic crisis to worldwide growth of what is aptly called the Debt
Culture. Fortunately, PowerSouth, rooted in rural economy in the best
sense, did not join the Debt Culture. In the USA debt soared to 3 times GDP
(Slide 35), as individuals, households, companies of all sizes, and
governments at all levels basically decided they could print money a go go.
The adjustment will likely create jackrabbit behavior in the energy system,
as Stalin or the Great Depression did, but does not change the fundamentals,
like the destiny of natural gas. But it may make finding capital for pipelines
and ZEPPs harder.
Now let me return to strategies and fate. We know during the last
decade that almost all orders for new US power plants were gas, and that gas
will become dominant in the next 10-20 years. In the end, the system wins.
Don't forget the System; it won't forget you.
So, what is left for strategy, of businessmen or politicians? To
minimize waste and unproductive debt, to be on the right side of fate. Waste
in the US energy play comes, for example, from the failure to separate
natural gas from oil. As an environmentalist, each time I hear "oil & gas"
15

Draft 1/25/2009
talked about like Siamese twins, I hear missed opportunity. Oil and gas are
very different fuels. I spend most of my time with Greens of various kinds,
and I believe many Greens would accept drilling for natural gas, whether
off-shore Florida or in upstate New York, if natural gas is the exclusive
target, if it isn’t a cover for drilling for more oil and the problems that come
with oil.
Politicians could help, or could recognize reality and ratify and
legitimize it, by forming state and national energy policy directly about
natural gas and not "oil & gas" or “fossil energy”. The rights of way for
pipelines are the sorts of problems that the political system has to deal with,
and should deal with. So are LNG terminals; LNG adds flexibility to the
system. So are safety of transport and storage of gas, and underground
sequestration of CO2. Oil will remain a big product for another thirty or
forty years, but oil is not a growth industry, whereas enormous need and
room exist for growth in thoroughbred natural gas. Keep in mind that
natural gas can penetrate oil’s stronghold, the market for mobility. CH4 can
provide both the gigawatts to charge batteries and other forms of electrified
transport and the hydrogen to power fuel cells. We might be surprised how
civil the energy discussion would become if a Natural Gas First policy were
decisively promoted.
Let me now summarize. Very stable trends, particularly those of
decarbonization and miniaturization, appear finally to go unscathed through
economic depressions, wars, and central planning. (Slide 36) Fortunately,
the trends are green, or perhaps they persist as trends precisely because they
are green, that is, they meet constraints of the system associated with
increasing spatial density of energy consumption. Renewables may be
16

Draft 1/25/2009
renewable but they are not green. Failing to benefit from economies of
scale, they offer few watts per square meter and demand more space and
volume from nature than the system finally will permit.
Planning, strategy, and R&D should essentially support the
invariants in the system. Symmetrically, one should avoid the wasteful,
painful excursions around the long-term trends organized by Lenin and
Stalin, or the US coal and renewable interests, whom I lump together. For a
trillion dollar industry like energy, jackrabbit search strategies are very
costly. (Slide 37) For PowerSouth, the strategic green prescription is
simple: with due attention to environment and safety, favor methane and
compact new machines that use it efficiently.
Thanks to Cesare Marchetti, Keith Pronske, Smriti Rao, and Paul
Waggoner
17

Draft 1/25/2009
18

1
PowerSouth Energy CooperativeAnnual Meeting, Destin, Florida
22 January 2009
Natural Gas and the Jackrabbit
Jesse H. AusubelProgram for the Human Environment
The Rockefeller University, New York City
http://phe.rockefeller.edu
Acknowledgements: C. Marchetti, K Pronske, S. Rao, P. Waggoner

2
0.0
1.0
2.0
3.0
4.0
5.0
6.0
0.0 0.5 1.0 1.5 2.0 2.5 3.0 3.51 × 2 × 4 × 8 ×
Affluence to 2007 as multiples of 1900
1 ×
4 ×
16 ×
64 ×
Population plusaffluence
Energy use
CO2 emission
SO2 emission
1940/60
1920/40
Data Sources: U.S. Census Bureau. 1975. Historical Statistics of the U.S. and various years Statistical Abstract of the U.S.;Energy Information Agency, various years; Carbon Dioxide Information Analysis Center. 2008; and U. S. Environmental Protection Agency. 1985 and 2008.
Multiples of U.S. emissions, energy use & population plus affluence (GDP)Economic slumps of the Great Depression & post World War II Recession
appear as switchbacks that fundamentally do not change trajectories
3
Depression causes erratic movementA line sloping down from left to right charts environmental progress
Axis Title
1.1 × 1.2 × 1. 4 × 1.6 × 1.8 ×
Affluence as multiples of 1900
Mul
tiple
s of
190
00.
8 ×
1.0
×1.
2 ×
1. 4
×1.
6
1932
1932
1920
1929
1924, 1930
1931, 1935
1940
1933
Energy useintensity
CO2 emission per energy
Data sources: Same as the previous slide
19201940

4
The Jackrabbit of Depression(animation)

5
Carbon atoms per hydrogen atom in hydrocarbonsEvolution from wood to methane decarbonizes
Source: Ausubel, 2007
(water removed; charcoal pure C)

6
0.01
0.1
1
10
100
1800 1850 1900 1950 2000 2050 2100 2150
Source: Ausubel 2007, after Ausubel, 1996 and Marchetti, 1985
C:HLog scale
Global DecarbonizationEvolution of C:H ratio in global fuel mix
Wood C:H = 10:1
Coal C:H = 2:1
Oil C:H = 1:2Methane C:H = 1:4 Methane Economy
Hydrogen Economy
Viewed as market substitution, decarbonization is a 300-year process for C to fall from 90% to 10% market share, with midpoint in year 1935
90% C
90% H

7Data sources: IIASA, BP (1965-2001), CDIAC http://cdiac.esd.ornl.gov/trends/emis/em_cont.htm
Decarbonization of Global Primary EnergyViewed as declining carbon intensity of all primary energy
Carbon/Energykg /GJ
0
5
10
15
20
25
30
35
1850 1870 1890 1910 1930 1950 1970 1990 2010 2030 2050

8
U.S. rise & fall of carbon/GDPfrom coal, oil, gas since 1900
-1.
00
2.00
3.
00
4.00
1900 1910 1920 1930 1940 1950 1960 1970 1980 1990 2000
C/GDP (Tg/ billion $)
Data source: Carbon Dioxide Information Analysis Center

9Source: N. Victor & J. Ausubel, 2003
Fuel Mass per Energy of HydrocarbonsEconomies of scale favor fuels suited to higher power density and thus decarbonization
Fuel/Energykg/GJ
0
20
40
60
80
100
120
140
Brown C
oal B
Brown C
oal A
Firewoo
dBlac
k Coa
l DBlac
k Coa
l CBlac
k Coa
l BBlac
k Coa
l ACrud
e Oil L
HVCrud
e Oil H
HV
LPG
Natural G
as

10
Like computers that comprise the Internet,power plants become more powerful AND SMALLER
US Ballistic Research Lab computer, mid 1950s
Dell laptop, 2004
Tennessee Valley Authority coal plant (date unknown)
Delivery of General Electric480 MW natural gas turbine, 2000
J. Ausubel & T. Barrett, 2004

11
Zero Emission Power Plant designClean Energy Systems, Inc.
Recycle Water
C.W.
Cond.
FuelProcessing
Plant
CrudeFuel
AirSeparation
PlantAir
N2
Coal, RefineryResidues, or
Biomass
NG, Oil orLandfill Gas
HP IP LP
O2
Fuel*
CO2Recovery
* CH4, CO, H2, etc.
ExcessWater
EOR, ECBM, orSequestration
DirectSales
HX
ElectGen.
Multi-stageTurbines
Gas Generator
CO2
RH
Recycle Water
C.W.
Cond.
FuelProcessing
Plant
CrudeFuel
FuelProcessing
Plant
CrudeFuel
AirSeparation
PlantAir
N2
AirSeparation
PlantAir
N2
AirSeparation
PlantAir
N2
Coal, RefineryResidues, or
Biomass
NG, Oil orLandfill Gas
HP IP LP
O2
Fuel*
CO2Recovery
CO2Recovery
* CH4, CO, H2, etc.
ExcessWater
EOR, ECBM, orSequestration
DirectSales
HX
ElectGen.
Multi-stageTurbines
Gas Generator
CO2
RH

12
Kimberlina Test Facility – 20 MWtBakersfield CA (in idled 5 MWe biomass plant)
•Online Feb 2005
•2,000 hrs & 400 starts
•Nat Gas, simulated syngas & liquid fuels with sulfur
•Funding from California Energy Commission, US DOE, Air Liquide, & Air Products
Gas generator only 2 meters long

13
CES 200 MWt Gas Generator

14
CES (J79-LM 1500) First Generation Turbine – 920oC

15
CES Test Facility (idled 5 5We biomass plant)200 MWt Gas Generator/J79 Turbine
Gas Generator
Oxygen System
Vent Stack
Liquid Fuel System
Water Tank
J79 Turbine

16
Power Generation Efficiencies for Power Plants
100
500
1000
1500
1700
600 800200 400 1000
ZEPP 63% (projected)
ZEPP 59% (projected)
ZEPP 70% (projected)
Gas Turbine 50~55%
Gas Turbine 48%
Gas Turbine 43%
Steam Turbine (Ultra Supercritical) 42~43%
Steam Turbine (Conventional) 38~40%Tem
pera
ture
, Cel
sius
Pressure, atmospheres Source: After Ichihara
Zero Emission Power Plants achieve efficiency at very high pressure & temperature
17
“Natural gas” abounds elsewhere in the solar system: A lake of liquid methane surrounded by mountains of solid ice on Saturn’s moon Titan
Source: Huygens probe, ESA

18
Natural gas on MarsSimple explanation: outgassing abiotic methane, not capturedfossil sunlight

19
Shelf break: Continental marginsthe methane frontier?

20
Life on methane: Census of Marine Life Expedition 2006 to Gulf of Mexico deep margin
Ian MacDonaldBruce Strickrott AquaPix, Bob Carney Ian MacDonald
First systematic exploration of hydrocarbon seep communities deeper than 1000m Source: ChEss

Huge gas reserves discovered off HaifaJan. 18, 2009JPost.com Staff , THE JERUSALEM POST
Three massive gas reservoirs have been discovered 80 kilometers off the Haifa coast, at the Tamar prospect, Noble Energy Inc. announced on Sunday.
The Tamar-1 well, located in approximately 5,500 feet of water, was drilled to a total depth of 16,076 feet.
Speaking on Army Radio Sunday morning, an exhilarated Yitzhak Tshuva, called the discovery "one of the biggest in the world," promising that the find would present a historic land mark in the economic independence of Israel. "We will no longer be dependent [on foreign sources] for our gas, and will even export. We are dealing with inconceivably huge quantities," Tshuva added.
An ecstatic Infrastructures Minister Binyamin Ben-Eliezer said before the weekly….
Average oil & gas well only 5,000 feet subsurface: DEEP CARBON ABOUNDS

22
There are no ocean deserts!Beautiful life abounds everywhere. Conserve it.

23
Storegga, Norway120 km offshore, 1000 m deepOrmen Lange gas field
without conventional offshore platforms
in production October 2007
Extracting natural gas from the sea floor with no surface structures to harm vistas or annoy boaters

24
1.00E+00
1.00E+01
1.00E+02
1.00E+03
1.00E+04
1.00E+05
1.00E+06
1.00E+07
1.00E+08
Brown C
oals
Firewoo
dBlac
k Coa
lsCrud
e Oils
LPG
Natural G
asHyd
rogen
Natural LW
RNatural
CANDU
Enrich
ed 3.
5% LWR
Natural F
BR
fuel mass per energy including nuclear fuelseconomies of scale favor fuels suited to higher power density, thus decarbonization
& thus finally nuclear sources 10,000 X more compact than hydrocarbons
Uranium
Source: N. Victor & J. Ausubel, 2003
100
10-1
10-2
10-3
10-4
10-5
10
1Fuel/Energykg/GJ
To produce with solar cells the energy generated in 1 liter of coreof a nuclear reactor, one needs ~ 1 hectare (10,000 square meters) of solar cells!
25
Like computers that comprise the Internet,power plants become more powerful AND SMALLER
US Ballistic Research Lab computer, mid 1950s
Dell laptop, 2004
Tennessee Valley Authority coal plant (date unknown)
Delivery of General Electric480 MW natural gas turbine, 2000
J. Ausubel & T. Barrett, 2004
26
Renewable Energyapproximate production intensities
& thus VAST land requirements
Hydro watts/sq meter sq km = 1000 MW nuke
– Average of all US dams 0.005 180,000
Biomass– ethanol from corn (net) 0.05 18,000 – New England forest 0.12 7,500– Iowa crops 0.36 2,500– Ocean biomass 0.6 1,500– Corn (whole plant) 0.75 1,200
Wind 1.2 770
Solar thermal 3.2 280
Photovoltaics ~6 150
Covington County AL ~ 2,700 sq kmSources: Ausubel, Hayden

27
Spatial scale: Nuclear and WindCalifornia Coast
10% Wind Equivalent
5 Miles
Diablo Canyon2200 MW nuke plant
Source: P. Grant

28
Renewable Energyapproximate production intensities
& thus VAST land requirements
Hydro watts/sq meter sq km = 1000 MW nuke
– Average of all US dams 0.005 180,000
Biomass– ethanol from corn (net) 0.05 18,000 – New England forest 0.12 7,500– Iowa crops 0.36 2,500– Ocean biomass 0.6 1,500– Corn (whole plant) 0.75 1,200
Wind 1.2 770
Solar thermal 3.2 280
Photovoltaics ~6 150
Covington County AL ~ 2,700 sq kmSources: Ausubel, Hayden

29
Windmills in rural Pennsylvania
Transforming thelandscape by vegetation removal,access roads,affecting flyways andvistas
No economies of scale:More watts demandequally more mills
Dozen mills = 2 meterCES ZEPP!

30
July 3, 2008
First GE load from Port of Houston. Finally got the show on the road. Six loads a week to Casper for the next 8 weeks, I hope.
David WaggonerThe Waggoners Trucking9330 Jack Rabbit Road Houston, TX
Wind Power – a heavy industry, not a soft path

31
Blades

32Oversize, indeed!
Blades

33
Windmill Towerssections in Tulsa shipping yard
Photo Sent October 02, 2008 by David Waggoner

34
A German exampleshows how the partsfit together.
Green, no,Monsters, yes

35
The Debt CultureCausing slump & reminding us of virtues of thrift

36
Bankside Power Station, LondonOpened for power generation in 1953, became Tate Art Gallery in 2000
Comparably powerful natural gas plant built today could fit in 1/10th the space
“Footprint” covers 3.5 hectares
Green is a small footprint
100m tall
Source: Ausubel 2004

37
Endless sea of methane photographed from Titan’s surface by probe Huygens, 14 January 2005 (ESA).
http://phe.rockefeller.edu
Efficient use of abundant methaneThe key to green evolution of energy systems for century 21