Embed Size (px)
Citation preview
Natural Gas 101: The Basics of
Natural Gas Production,
Transportation, and Markets
David E. Dismukes, Ph.D.
Center for Energy Studies
Louisiana State University
Center for Energy Studies
Center for Energy Studies
What Is Natural Gas?
2 © LSU Center for Energy Studies
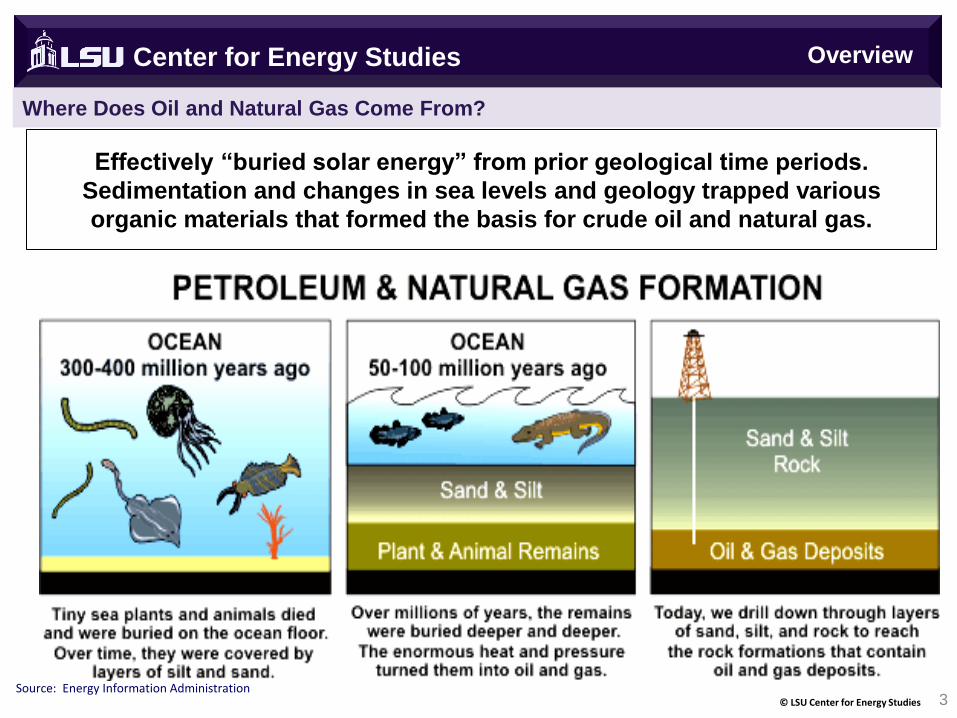
Where Does Oil and Natural Gas Come From?
Center for Energy Studies
3 © LSU Center for Energy Studies
Overview
Effectively “buried solar energy” from prior geological time periods.
Sedimentation and changes in sea levels and geology trapped various
organic materials that formed the basis for crude oil and natural gas.
Source: Energy Information Administration
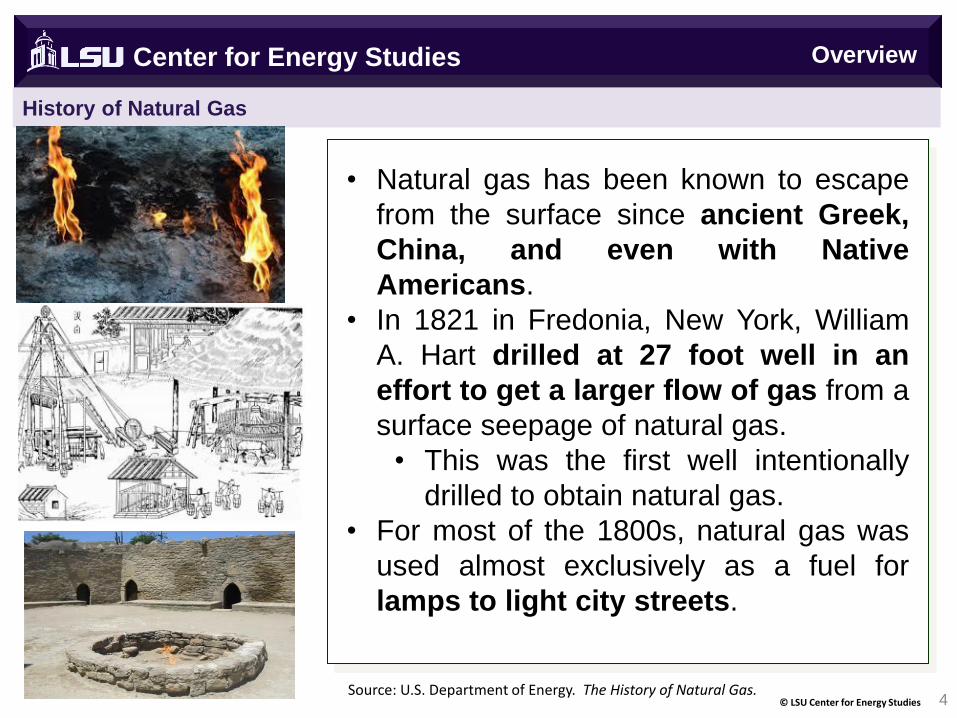
History of Natural Gas
4 © LSU Center for Energy Studies
Overview Center for Energy Studies
• Natural gas has been known to escape
from the surface since ancient Greek,
China, and even with Native
Americans.
• In 1821 in Fredonia, New York, William
A. Hart drilled at 27 foot well in an
effort to get a larger flow of gas from a
surface seepage of natural gas.
• This was the first well intentionally
drilled to obtain natural gas.
• For most of the 1800s, natural gas was
used almost exclusively as a fuel for
lamps to light city streets.
Source: U.S. Department of Energy. The History of Natural Gas.
History of Natural Gas
5 © LSU Center for Energy Studies
Center for Energy Studies
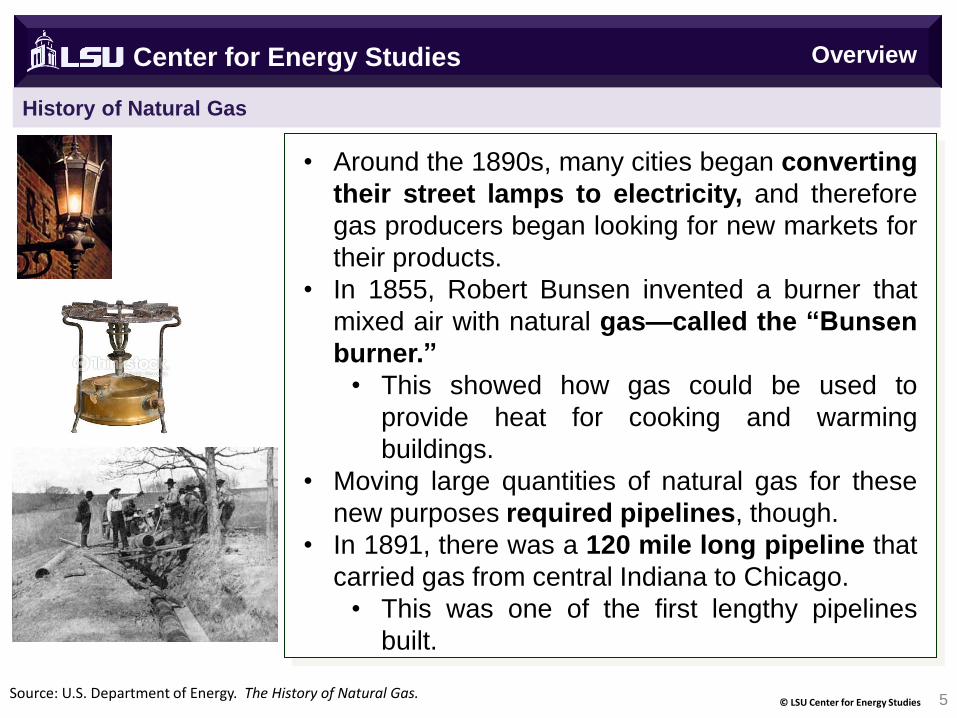
• Around the 1890s, many cities began converting
their street lamps to electricity, and therefore
gas producers began looking for new markets for
their products.
• In 1855, Robert Bunsen invented a burner that
mixed air with natural gas—called the “Bunsen
burner.”
• This showed how gas could be used to
provide heat for cooking and warming
buildings.
• Moving large quantities of natural gas for these
new purposes required pipelines, though.
• In 1891, there was a 120 mile long pipeline that
carried gas from central Indiana to Chicago.
• This was one of the first lengthy pipelines
built.
Source: U.S. Department of Energy. The History of Natural Gas.
Overview
History of Natural Gas
6 © LSU Center for Energy Studies
Center for Energy Studies
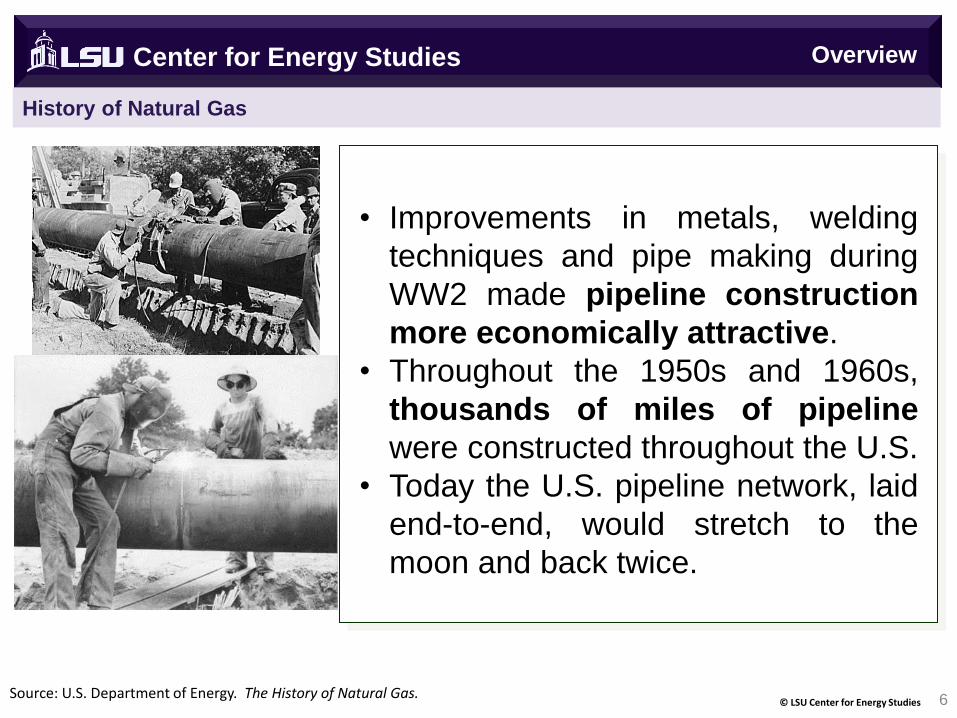
• Improvements in metals, welding
techniques and pipe making during
WW2 made pipeline construction
more economically attractive.
• Throughout the 1950s and 1960s,
thousands of miles of pipeline
were constructed throughout the U.S.
• Today the U.S. pipeline network, laid
end-to-end, would stretch to the
moon and back twice.
Source: U.S. Department of Energy. The History of Natural Gas.
Overview
Industry Organization – Natural Gas
Center for Energy Studies
7 © LSU Center for Energy Studies
Overview
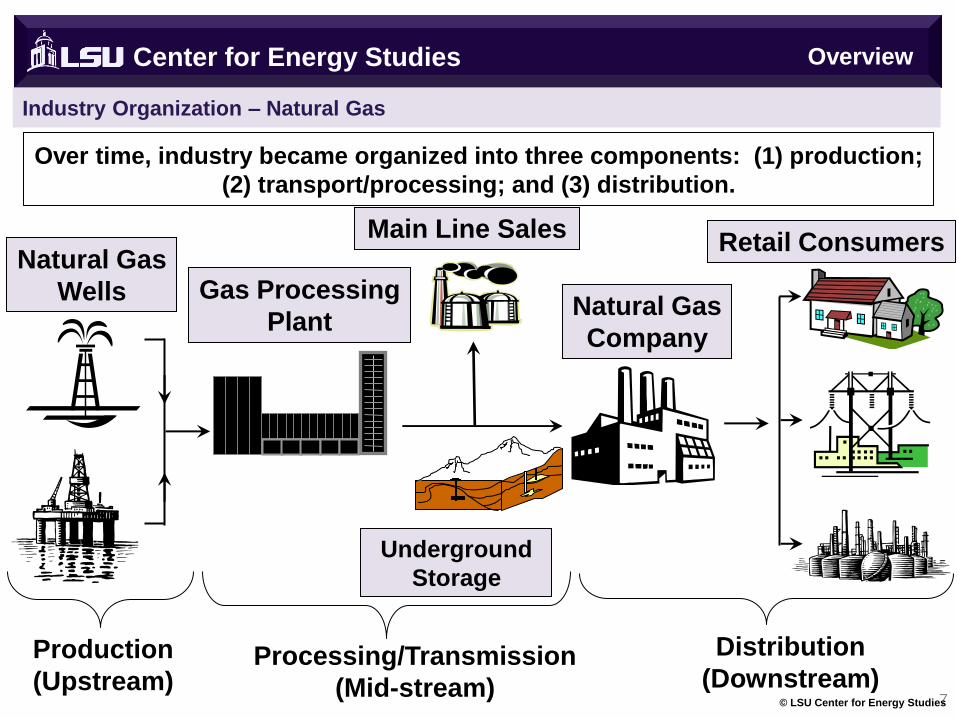
Over time, industry became organized into three components: (1) production;
(2) transport/processing; and (3) distribution.
Natural Gas
Wells Gas Processing
Plant Natural Gas
Company
Main Line Sales
Production
(Upstream) Processing/Transmission
(Mid-stream)
Distribution
(Downstream)
Retail Consumers
Underground
Storage
Center for Energy Studies
Natural Gas Drilling and Production
8 © LSU Center for Energy Studies
How is Petroleum Developed?
Center for Energy Studies
9 © LSU Center for Energy Studies
Drilling/Production
Petroleum is recovered mostly through drilling activities. This can
occur at a few thousand feet to over 20,000 feet.
Drilling comes after a considerable amount of geological
research and analysis that considers the structural geology (at the
reservoir scale), sedimentary basin analysis, reservoir
characterization (mainly in terms of the porosity and permeability
of the target structures.
Porosity refers to the void space, or the ability of the formation to
hold hydrocarbons. Permeability refers to ability of a material to
allow fluids to flow.
So – how much oil can a structure hold and how does the
petroleum flow through the structure.
High porosity and permeability, generally, is a good thing.
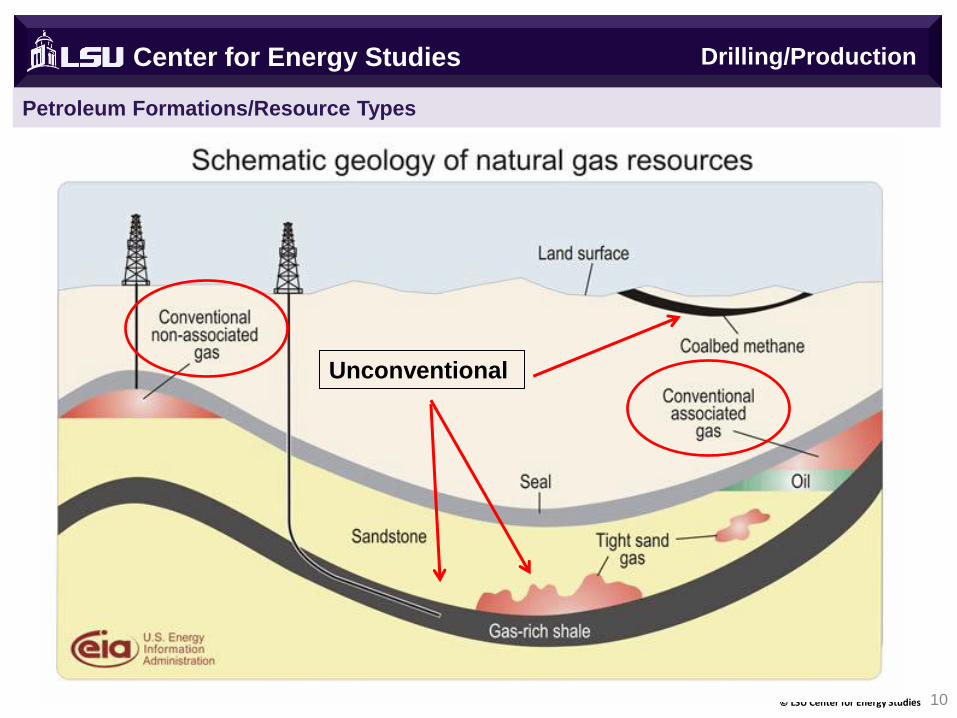
Petroleum Formations/Resource Types
Center for Energy Studies
10 © LSU Center for Energy Studies
Unconventional
Drilling/Production
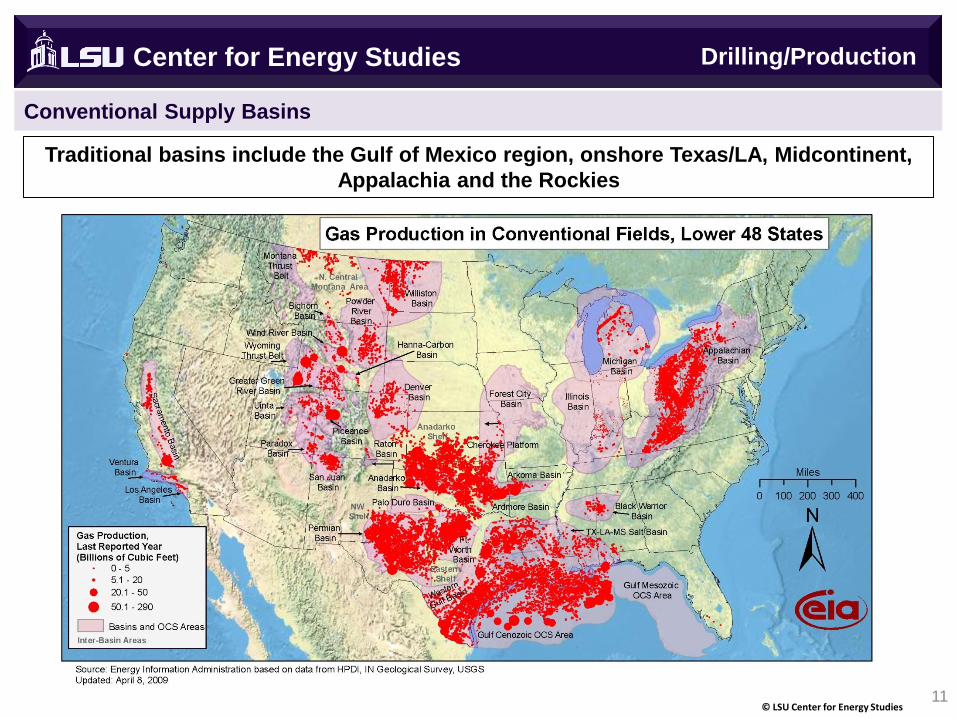
Conventional Supply Basins
Center for Energy Studies
11 © LSU Center for Energy Studies
Traditional basins include the Gulf of Mexico region, onshore Texas/LA, Midcontinent,
Appalachia and the Rockies
Drilling/Production
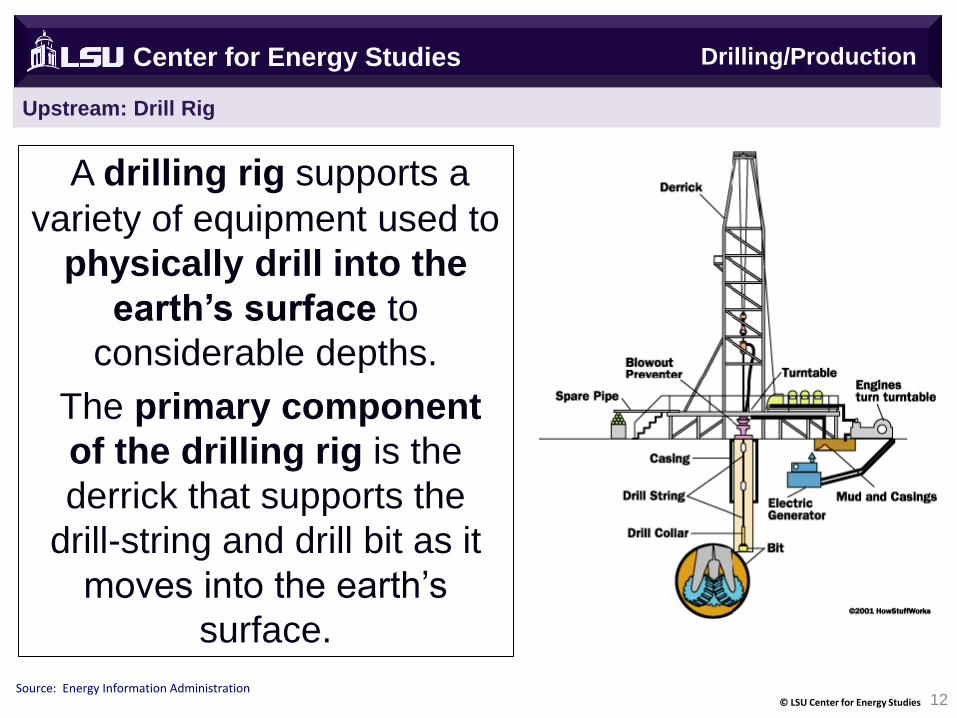
Upstream: Drill Rig
Center for Energy Studies
12 © LSU Center for Energy Studies
A drilling rig supports a
variety of equipment used to
physically drill into the
earth’s surface to
considerable depths.
The primary component
of the drilling rig is the
derrick that supports the
drill-string and drill bit as it
moves into the earth’s
surface.
Source: Energy Information Administration
Drilling/Production
Drilling Schematic
Center for Energy Studies
13 © LSU Center for Energy Studies
Source: Energy Information Administration
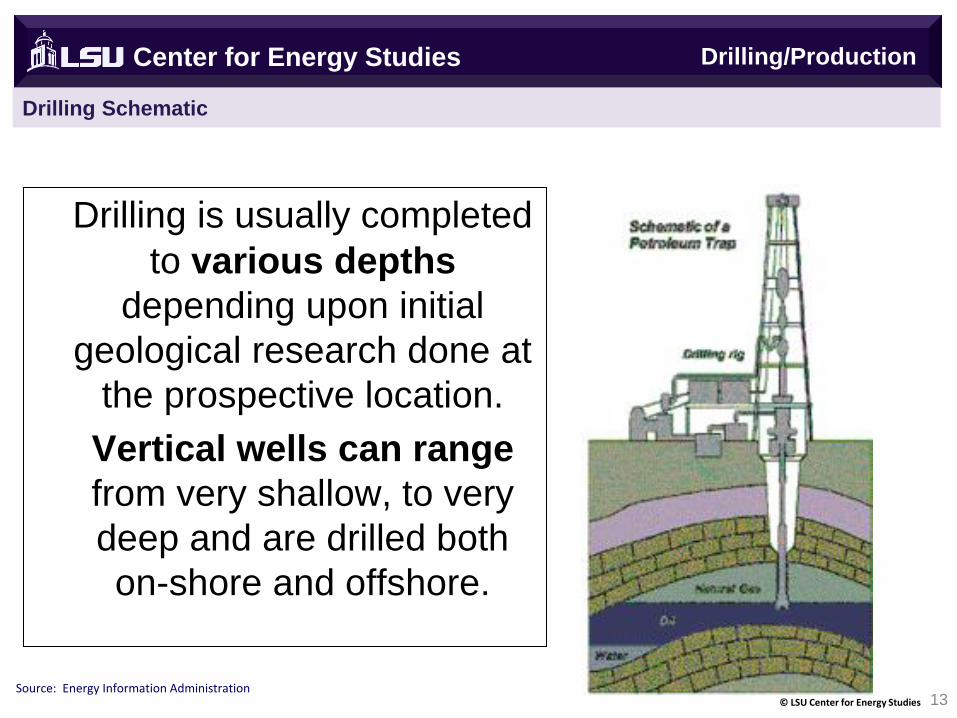
Drilling is usually completed
to various depths
depending upon initial
geological research done at
the prospective location.
Vertical wells can range
from very shallow, to very
deep and are drilled both
on-shore and offshore.
Drilling/Production
Wellhead and Downhole Equipment
Center for Energy Studies
14 © LSU Center for Energy Studies
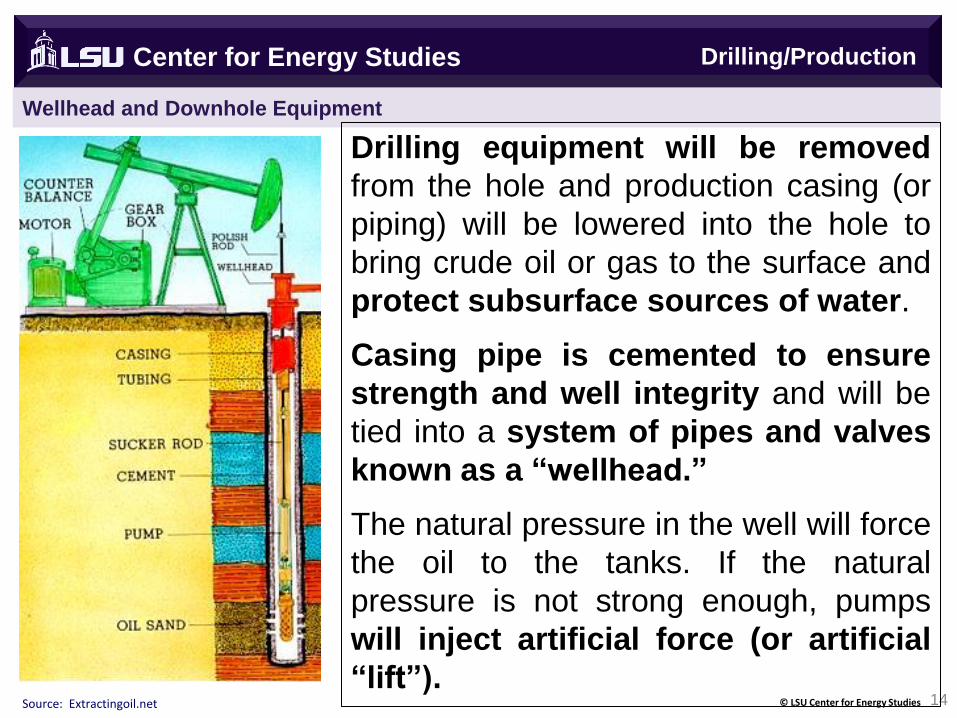
Drilling equipment will be removed
from the hole and production casing (or
piping) will be lowered into the hole to
bring crude oil or gas to the surface and
protect subsurface sources of water.
Casing pipe is cemented to ensure
strength and well integrity and will be
tied into a system of pipes and valves
known as a “wellhead.”
The natural pressure in the well will force
the oil to the tanks. If the natural
pressure is not strong enough, pumps
will inject artificial force (or artificial
“lift”). Source: Extractingoil.net
Drilling/Production
Qualitative Differences in Natural Gas
15 © LSU Center for Energy Studies
Center for Energy Studies
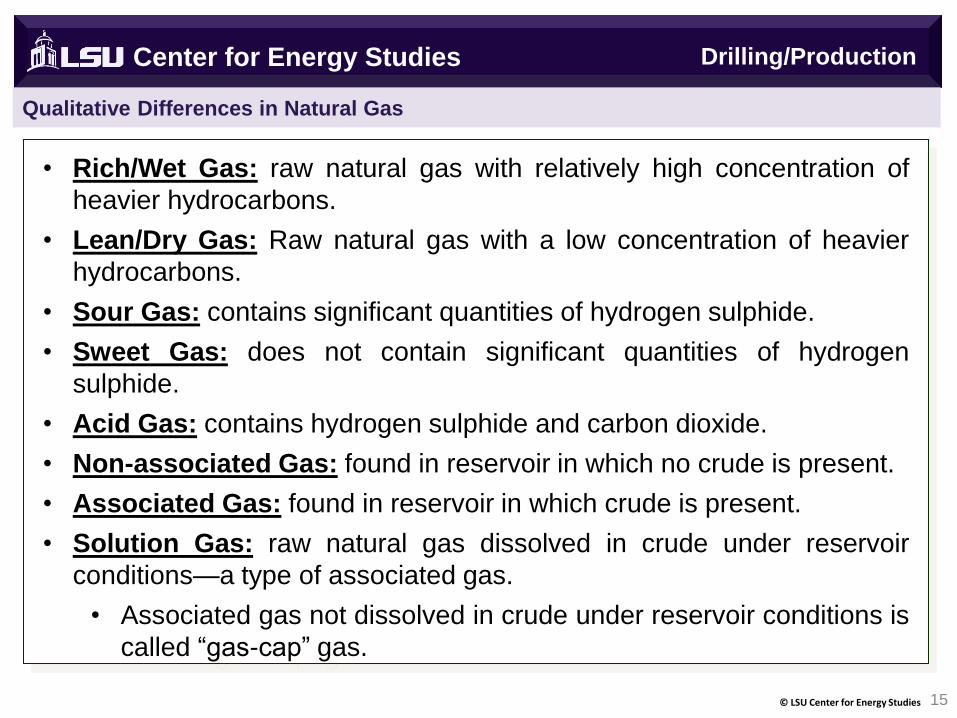
• Rich/Wet Gas: raw natural gas with relatively high concentration of
heavier hydrocarbons.
• Lean/Dry Gas: Raw natural gas with a low concentration of heavier
hydrocarbons.
• Sour Gas: contains significant quantities of hydrogen sulphide.
• Sweet Gas: does not contain significant quantities of hydrogen
sulphide.
• Acid Gas: contains hydrogen sulphide and carbon dioxide.
• Non-associated Gas: found in reservoir in which no crude is present.
• Associated Gas: found in reservoir in which crude is present.
• Solution Gas: raw natural gas dissolved in crude under reservoir
conditions—a type of associated gas.
• Associated gas not dissolved in crude under reservoir conditions is
called “gas-cap” gas.
Drilling/Production
Center for Energy Studies
Unconventional Supplies
16 © LSU Center for Energy Studies
Source: Energy Information Administration, U.S. Department of Energy
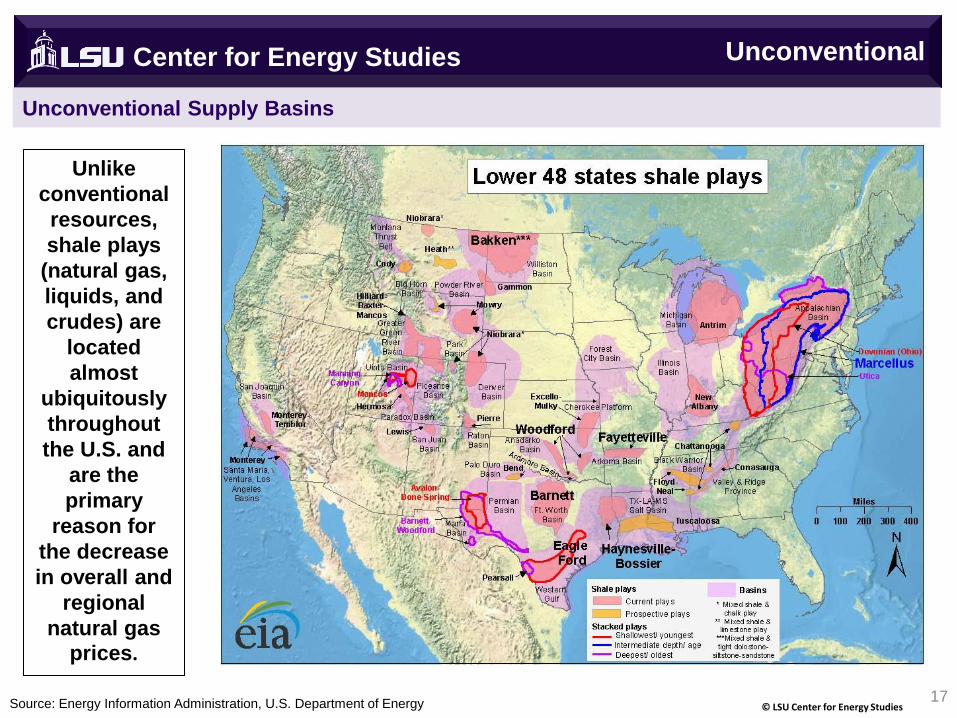
Unconventional Supply Basins
Center for Energy Studies
17 © LSU Center for Energy Studies
Unlike
conventional
resources,
shale plays
(natural gas,
liquids, and
crudes) are
located
almost
ubiquitously
throughout
the U.S. and
are the
primary
reason for
the decrease
in overall and
regional
natural gas
prices.
Unconventional
Source: Energy Tomorrow.
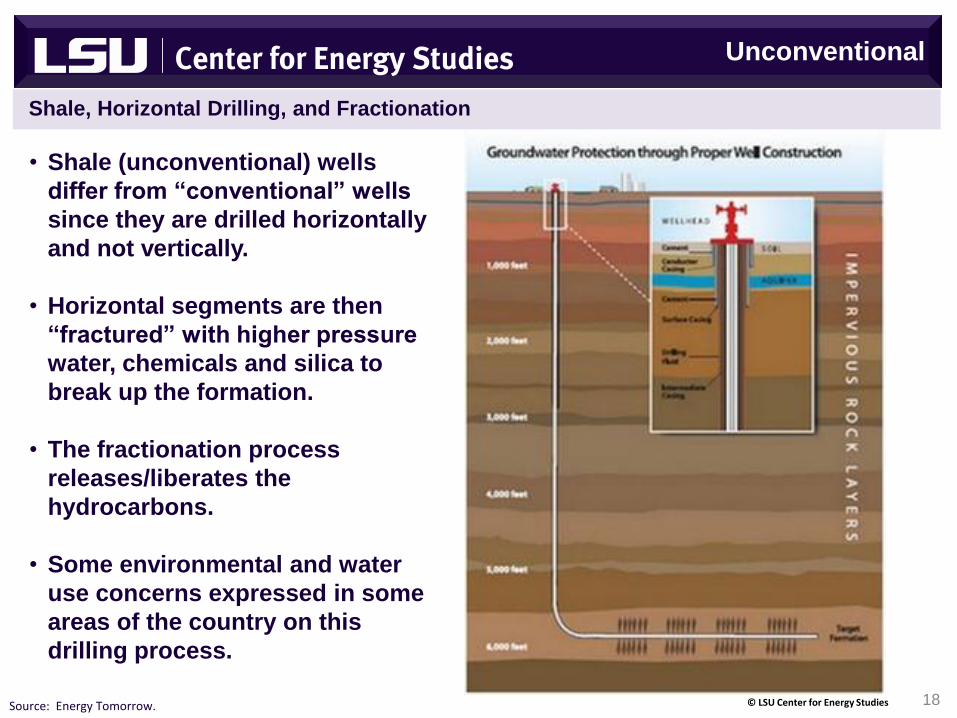
Shale, Horizontal Drilling, and Fractionation
• Shale (unconventional) wells
differ from “conventional” wells
since they are drilled horizontally
and not vertically.
• Horizontal segments are then
“fractured” with higher pressure
water, chemicals and silica to
break up the formation.
• The fractionation process
releases/liberates the
hydrocarbons.
• Some environmental and water
use concerns expressed in some
areas of the country on this
drilling process.
18 © LSU Center for Energy Studies
Unconventional
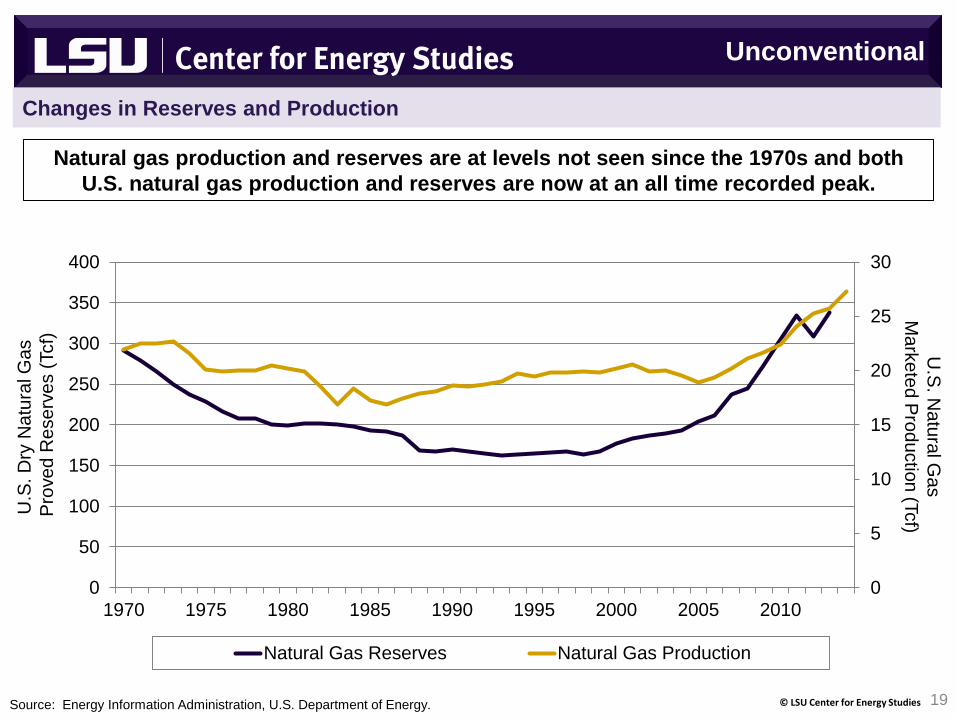
Changes in Reserves and Production
Natural gas production and reserves are at levels not seen since the 1970s and both
U.S. natural gas production and reserves are now at an all time recorded peak.
U.S
. D
ry N
atu
ral G
as
Pro
ve
d R
ese
rve
s (
Tcf)
U.S
. Natu
ral G
as
Ma
rke
ted P
rod
uctio
n (T
cf)
Source: Energy Information Administration, U.S. Department of Energy. 19 © LSU Center for Energy Studies
2012 reserve
estimates mark the
first decline in 14
years.
0
5
10
15
20
25
30
0
50
100
150
200
250
300
350
400
1970 1975 1980 1985 1990 1995 2000 2005 2010
Natural Gas Reserves Natural Gas Production
Unconventional
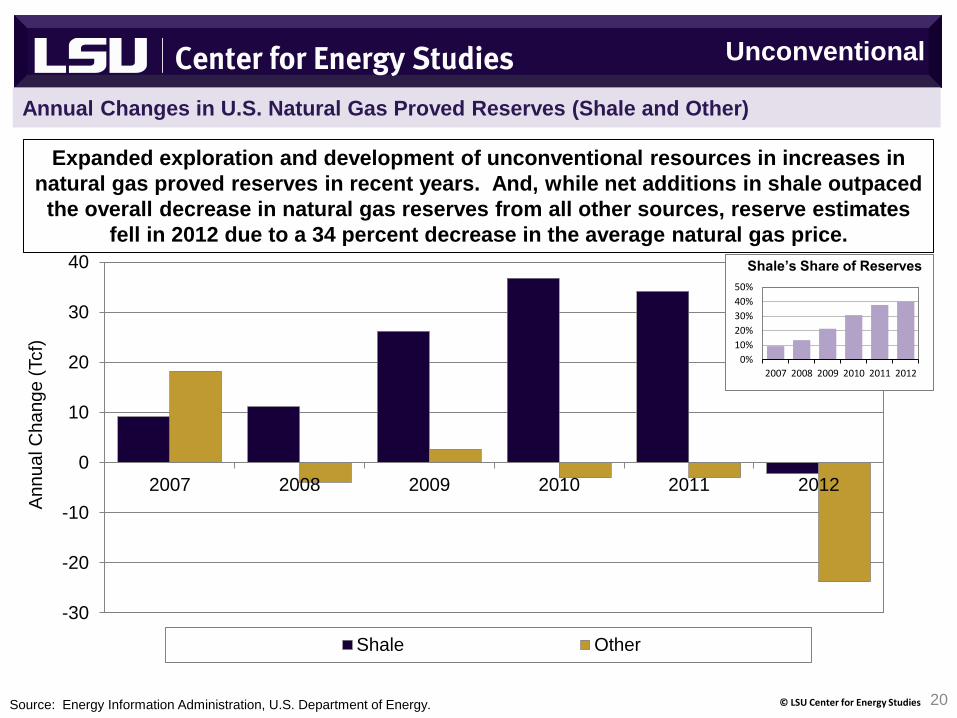
Annual Changes in U.S. Natural Gas Proved Reserves (Shale and Other)
Expanded exploration and development of unconventional resources in increases in
natural gas proved reserves in recent years. And, while net additions in shale outpaced
the overall decrease in natural gas reserves from all other sources, reserve estimates
fell in 2012 due to a 34 percent decrease in the average natural gas price.
-30
-20
-10
0
10
20
30
40
2007 2008 2009 2010 2011 2012
Shale Other
An
nu
al C
ha
ng
e (
Tcf)
Source: Energy Information Administration, U.S. Department of Energy. 20 © LSU Center for Energy Studies
0%
10%
20%
30%
40%
50%
2007 2008 2009 2010 2011 2012
Shale’s Share of Reserves
Unconventional
Re
se
rve
s, Tcf
Source: Energy Information Administration, U.S. Department of Energy
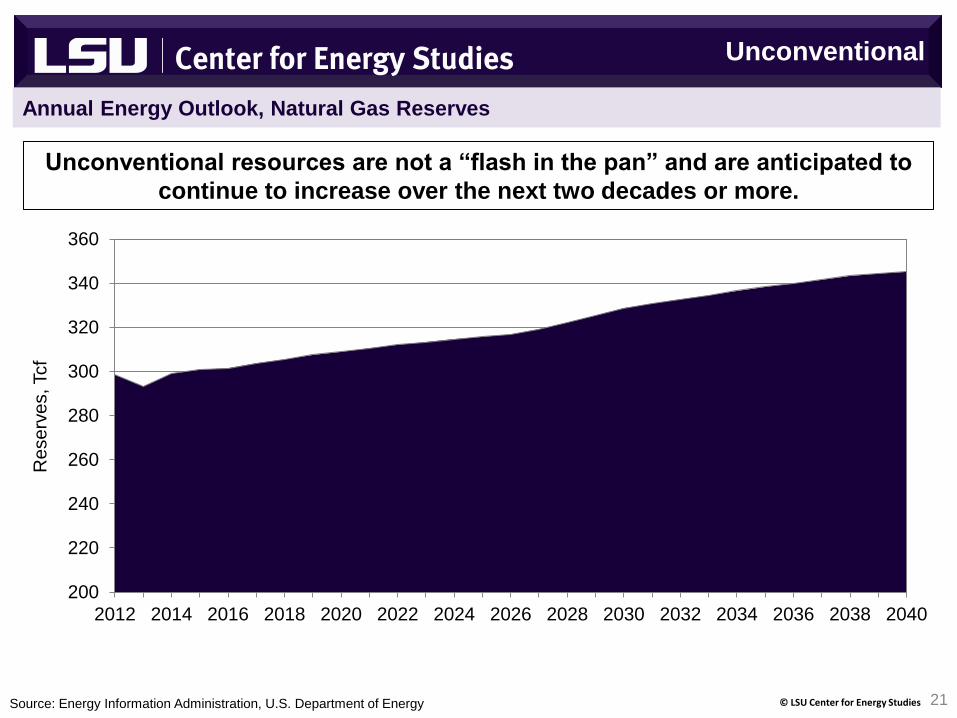
Annual Energy Outlook, Natural Gas Reserves
Unconventional resources are not a “flash in the pan” and are anticipated to
continue to increase over the next two decades or more.
21 © LSU Center for Energy Studies
200
220
240
260
280
300
320
340
360
2012 2014 2016 2018 2020 2022 2024 2026 2028 2030 2032 2034 2036 2038 2040
Unconventional
Changes in Well Costs and Productivity
11.9
10.3 9.9 9.3 9.0
15.6
9.6 9.0
$0
$2
$4
$6
$8
$10
$12
$14
$16
$18
2006 2007 2008 2009 2010 2008 2009 2010
Well Cost (million $)
9.5
17.7 18.9
23.6 23.6
8.0
10.5
15.0
$0
$5
$10
$15
$20
$25
2006 2007 2008 2009 2010 2008 2009 2010
East Texas Deep Bossier Haynesville
Well Performance (MMcfe/d)
East Texas Deep Bossier Haynesville
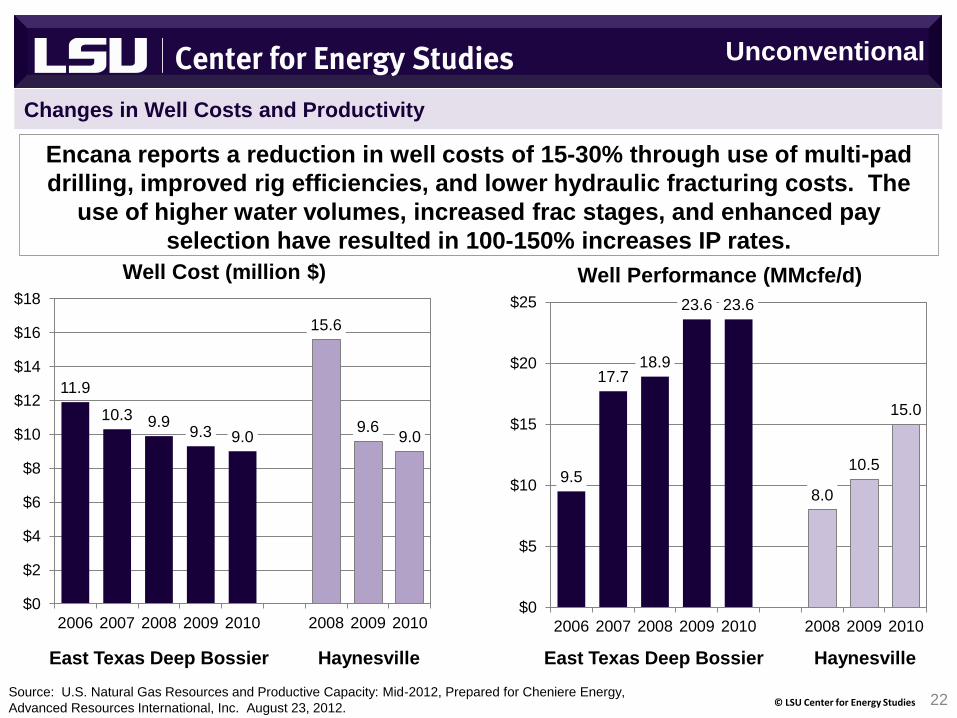
Encana reports a reduction in well costs of 15-30% through use of multi-pad
drilling, improved rig efficiencies, and lower hydraulic fracturing costs. The
use of higher water volumes, increased frac stages, and enhanced pay
selection have resulted in 100-150% increases IP rates.
Source: U.S. Natural Gas Resources and Productive Capacity: Mid-2012, Prepared for Cheniere Energy,
Advanced Resources International, Inc. August 23, 2012. 22 © LSU Center for Energy Studies
Unconventional
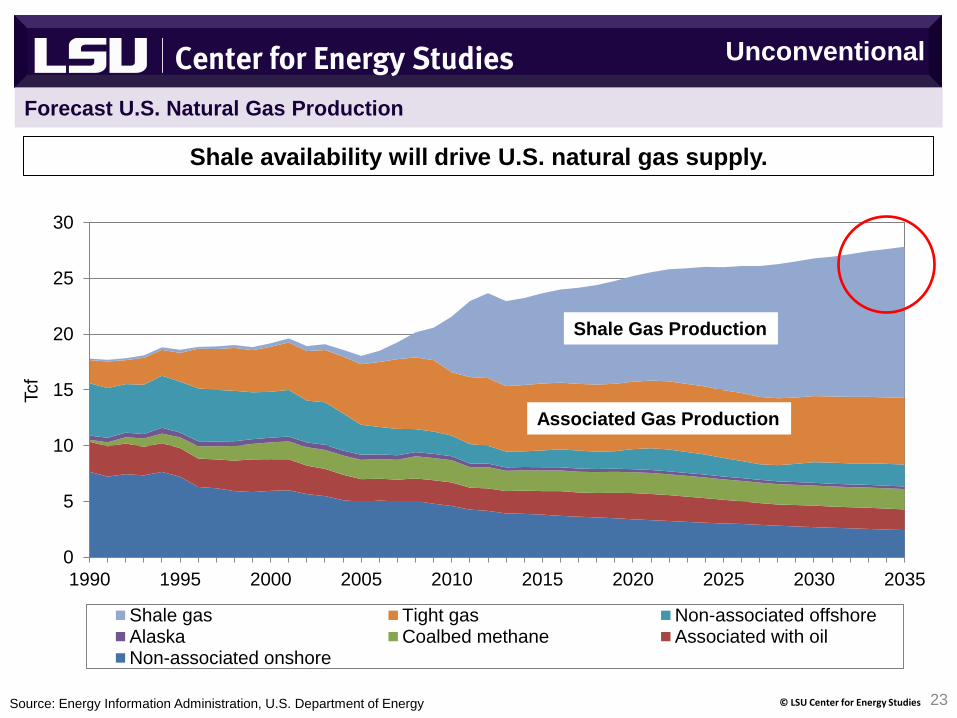
Forecast U.S. Natural Gas Production
23 © LSU Center for Energy Studies
0
5
10
15
20
25
30
1990 1995 2000 2005 2010 2015 2020 2025 2030 2035
Shale gas Tight gas Non-associated offshoreAlaska Coalbed methane Associated with oilNon-associated onshore
Tcf
Shale availability will drive U.S. natural gas supply.
Shale Gas Production
Associated Gas Production
Source: Energy Information Administration, U.S. Department of Energy
Unconventional
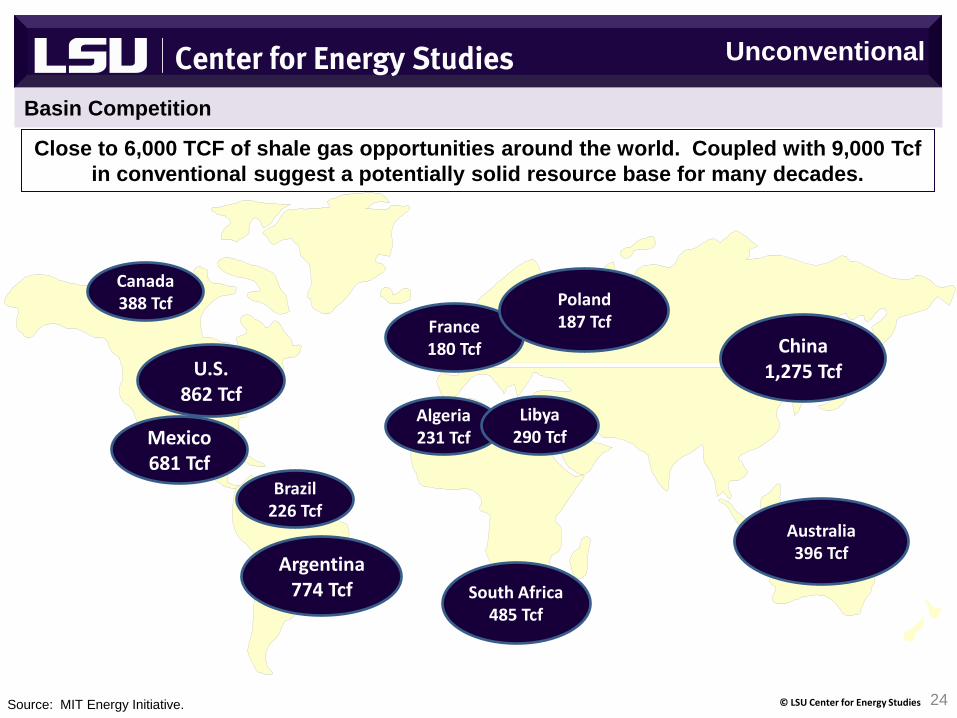
Basin Competition
Source: MIT Energy Initiative. 24 © LSU Center for Energy Studies
China 1,275 Tcf
Australia 396 Tcf
South Africa 485 Tcf
Argentina 774 Tcf
Brazil 226 Tcf
Mexico 681 Tcf
Canada 388 Tcf
U.S. 862 Tcf
France 180 Tcf
Poland 187 Tcf
Algeria 231 Tcf
Libya 290 Tcf
Close to 6,000 TCF of shale gas opportunities around the world. Coupled with 9,000 Tcf
in conventional suggest a potentially solid resource base for many decades.
Unconventional

Center for Energy Studies
Market Organization
25 © LSU Center for Energy Studies
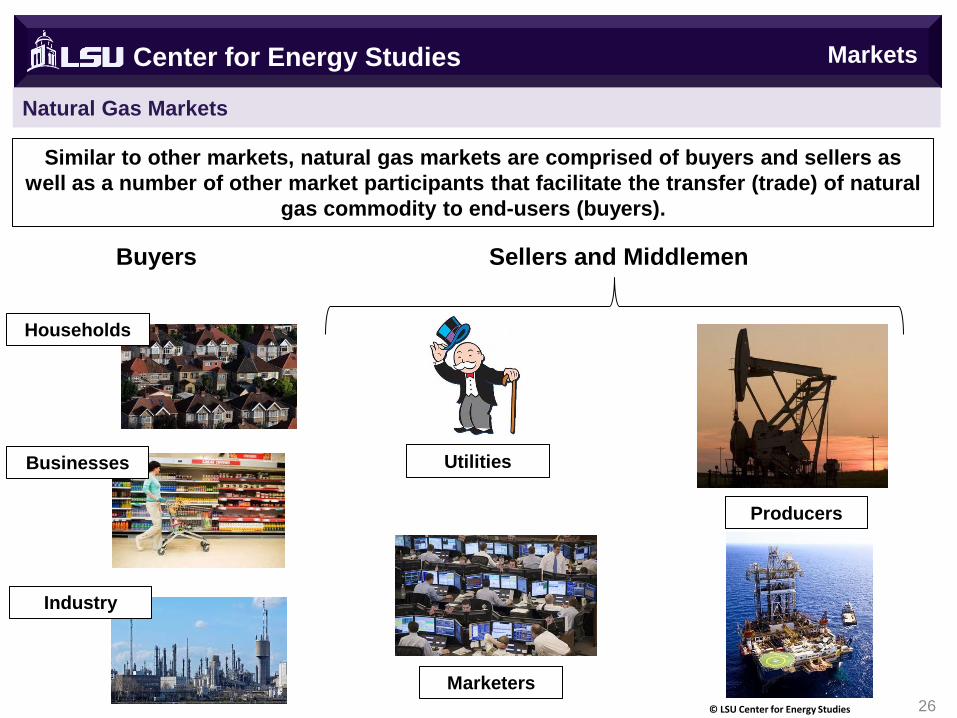
Natural Gas Markets
26 © LSU Center for Energy Studies
Markets
Similar to other markets, natural gas markets are comprised of buyers and sellers as
well as a number of other market participants that facilitate the transfer (trade) of natural
gas commodity to end-users (buyers).
Center for Energy Studies
Buyers Sellers and Middlemen
Households
Businesses
Industry
Utilities
Marketers
Producers
Center for Energy Studies
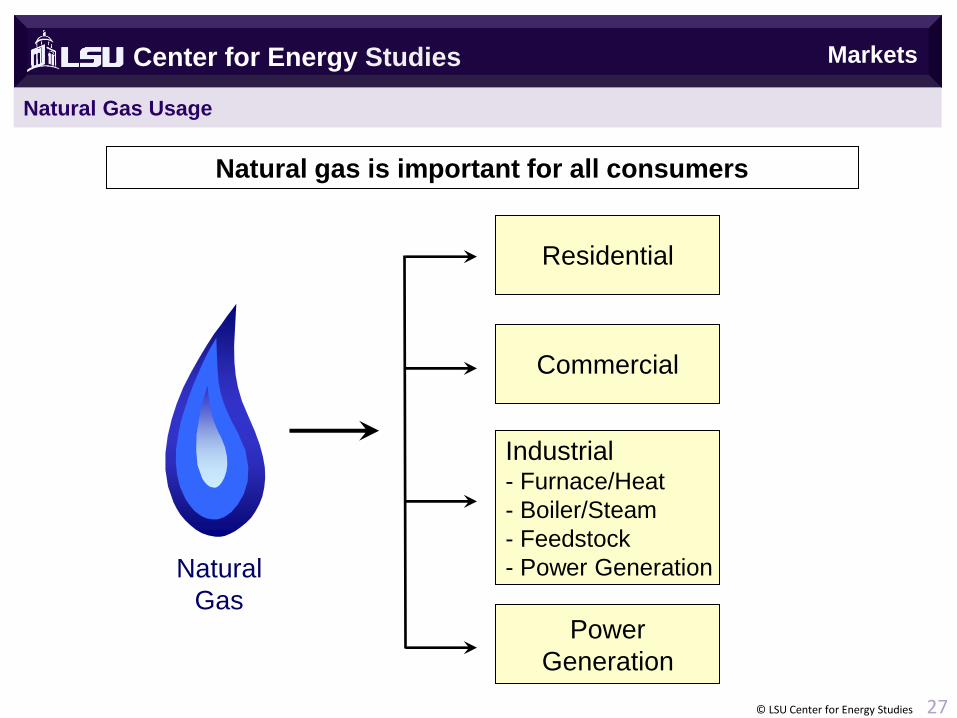
Natural Gas Usage
Residential
Commercial
Industrial - Furnace/Heat
- Boiler/Steam
- Feedstock
- Power Generation
Power
Generation
Natural
Gas
Natural gas is important for all consumers
© LSU Center for Energy Studies 27
Markets
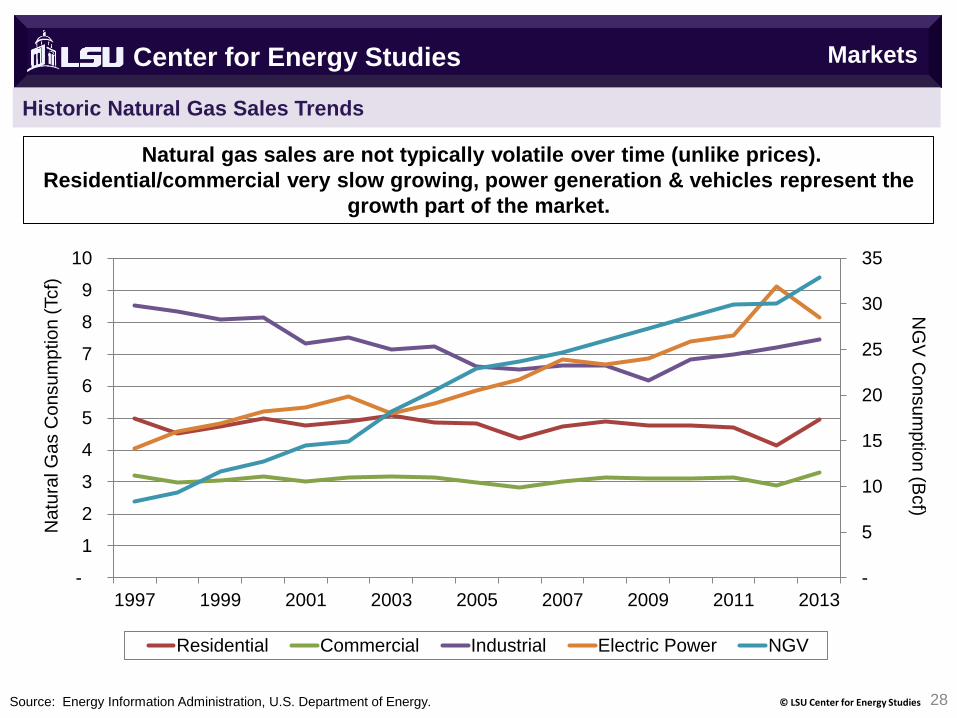
Historic Natural Gas Sales Trends
28 © LSU Center for Energy Studies
Natural gas sales are not typically volatile over time (unlike prices).
Residential/commercial very slow growing, power generation & vehicles represent the
growth part of the market.
Center for Energy Studies
-
5
10
15
20
25
30
35
-
1
2
3
4
5
6
7
8
9
10
1997 1999 2001 2003 2005 2007 2009 2011 2013
Residential Commercial Industrial Electric Power NGV
Na
tura
l G
as C
on
su
mp
tio
n (
Tcf)
N
GV
Co
nsu
mp
tion
(Bcf)
Source: Energy Information Administration, U.S. Department of Energy.
Markets
Center for Energy Studies
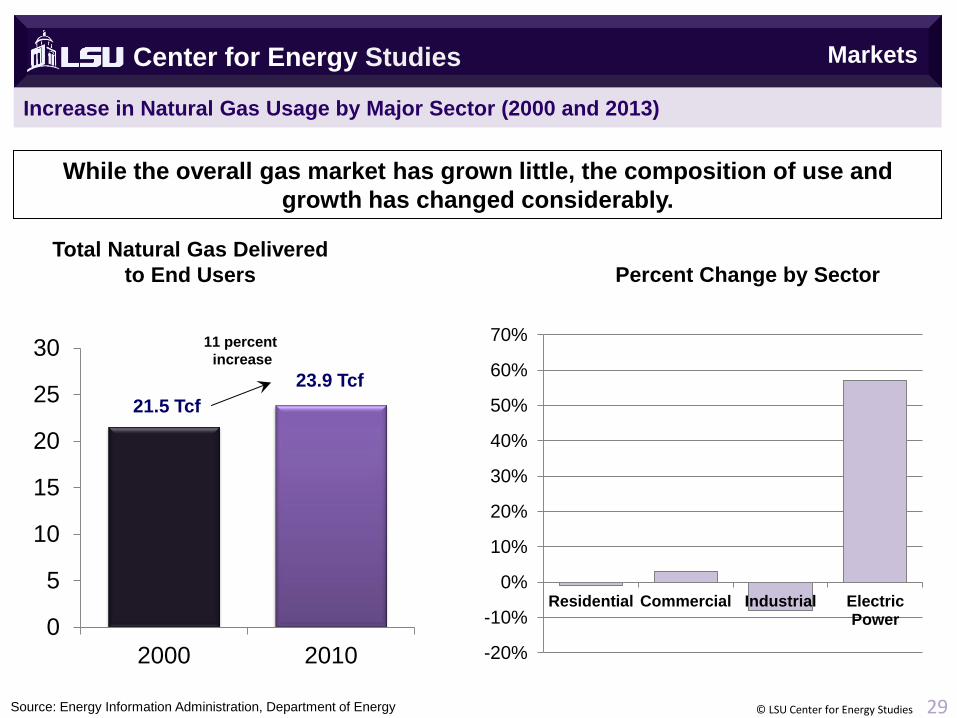
Increase in Natural Gas Usage by Major Sector (2000 and 2013)
0
5
10
15
20
25
30
2000 2010
Source: Energy Information Administration, Department of Energy
21.5 Tcf
23.9 Tcf
11 percent
increase
Total Natural Gas Delivered
to End Users Percent Change by Sector
© LSU Center for Energy Studies 29
-20%
-10%
0%
10%
20%
30%
40%
50%
60%
70%
Residential Commercial Industrial ElectricPower
While the overall gas market has grown little, the composition of use and
growth has changed considerably.
Markets
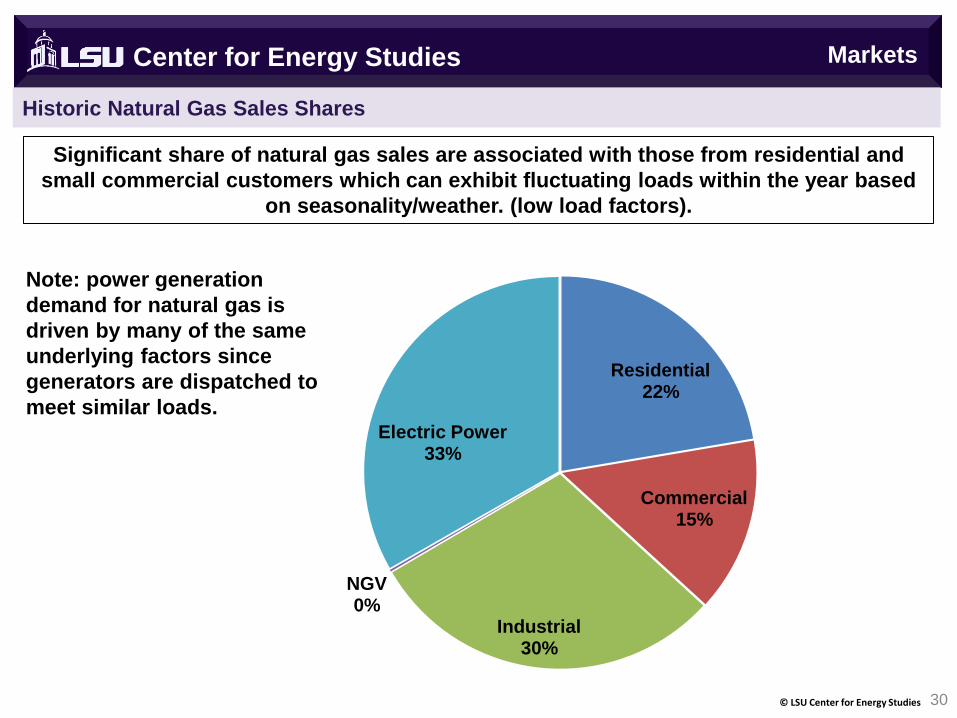
Historic Natural Gas Sales Shares
30 © LSU Center for Energy Studies
Significant share of natural gas sales are associated with those from residential and
small commercial customers which can exhibit fluctuating loads within the year based
on seasonality/weather. (low load factors).
Center for Energy Studies
Residential 22%
Commercial 15%
Industrial 30%
NGV 0%
Electric Power 33%
Note: power generation
demand for natural gas is
driven by many of the same
underlying factors since
generators are dispatched to
meet similar loads.
Markets
Center for Energy Studies
Natural Gas Demand Determinants
Natural gas demand is influenced by many of the
same factors that drive the demand for other goods
and services. There are some important differences,
however, since natural gas demand is seasonal and
highly influenced by the weather.
Natural gas demand determinants include:
• Weather (Heating Degree Days or “HDDs”)
• Overall Economic Conditions
• Natural Gas Prices
• Electricity Prices
• Other Factors
Markets
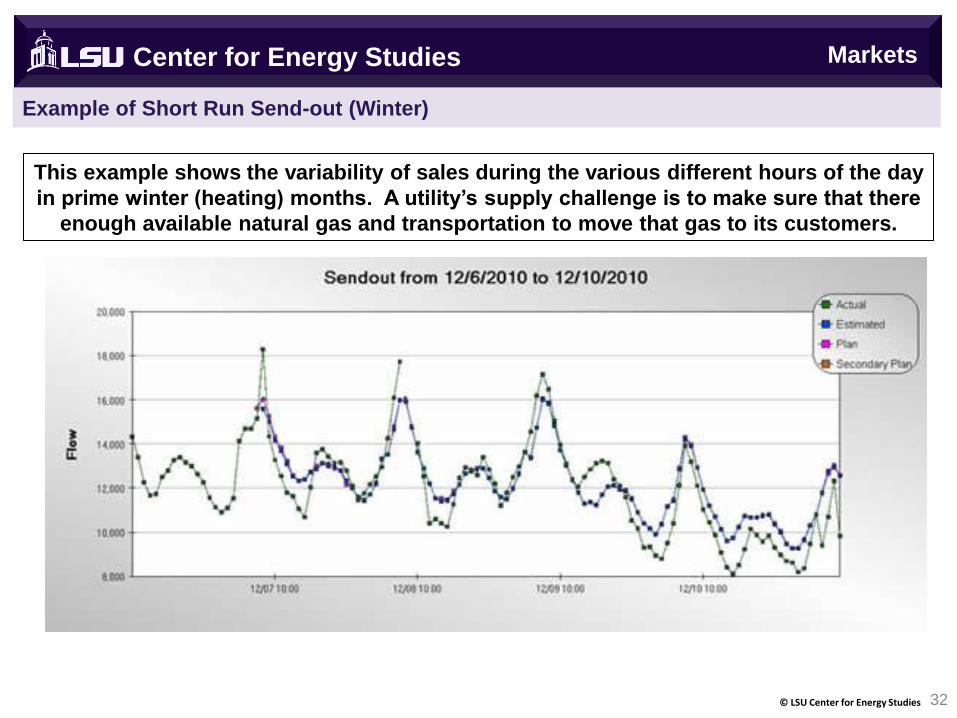
Example of Short Run Send-out (Winter)
32 © LSU Center for Energy Studies
This example shows the variability of sales during the various different hours of the day
in prime winter (heating) months. A utility’s supply challenge is to make sure that there
enough available natural gas and transportation to move that gas to its customers.
Center for Energy Studies Markets
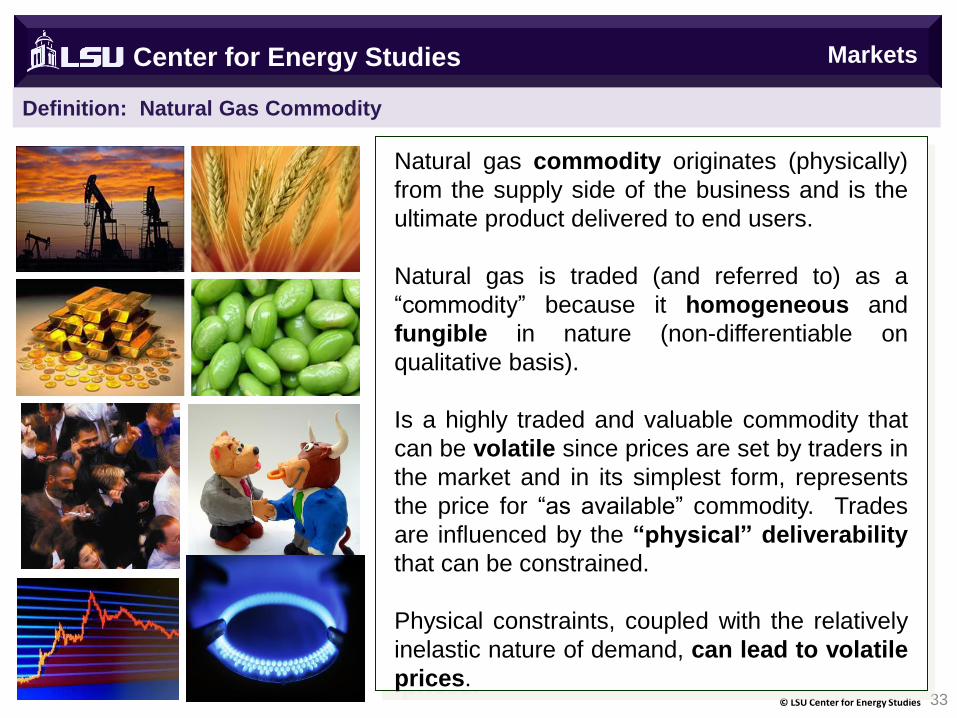
Definition: Natural Gas Commodity
Center for Energy Studies
33 © LSU Center for Energy Studies
Natural gas commodity originates (physically)
from the supply side of the business and is the
ultimate product delivered to end users.
Natural gas is traded (and referred to) as a
“commodity” because it homogeneous and
fungible in nature (non-differentiable on
qualitative basis).
Is a highly traded and valuable commodity that
can be volatile since prices are set by traders in
the market and in its simplest form, represents
the price for “as available” commodity. Trades
are influenced by the “physical” deliverability
that can be constrained.
Physical constraints, coupled with the relatively
inelastic nature of demand, can lead to volatile
prices.
Markets
Definition: Natural Gas Capacity
Center for Energy Studies
34 © LSU Center for Energy Studies
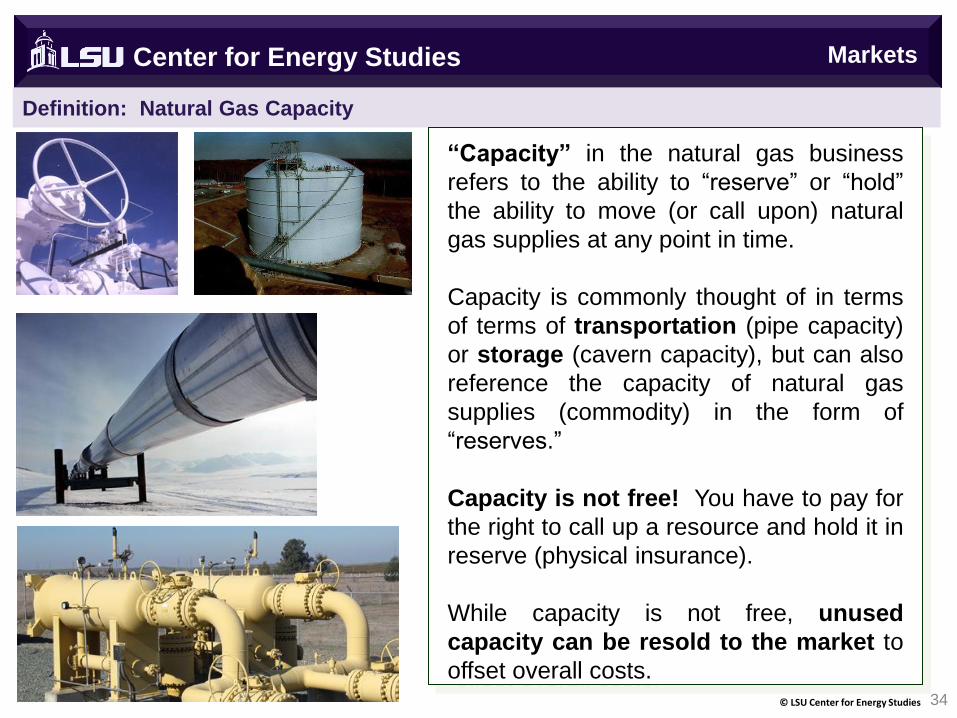
“Capacity” in the natural gas business
refers to the ability to “reserve” or “hold”
the ability to move (or call upon) natural
gas supplies at any point in time.
Capacity is commonly thought of in terms
of terms of transportation (pipe capacity)
or storage (cavern capacity), but can also
reference the capacity of natural gas
supplies (commodity) in the form of
“reserves.”
Capacity is not free! You have to pay for
the right to call up a resource and hold it in
reserve (physical insurance).
While capacity is not free, unused
capacity can be resold to the market to
offset overall costs.
Markets
Center for Energy Studies
Natural Gas Transportation &
Storage
35 © LSU Center for Energy Studies
What is Natural Gas Transmission/Transportation?
36 © LSU Center for Energy Studies
Capacity Markets (Transportation) Center for Energy Studies
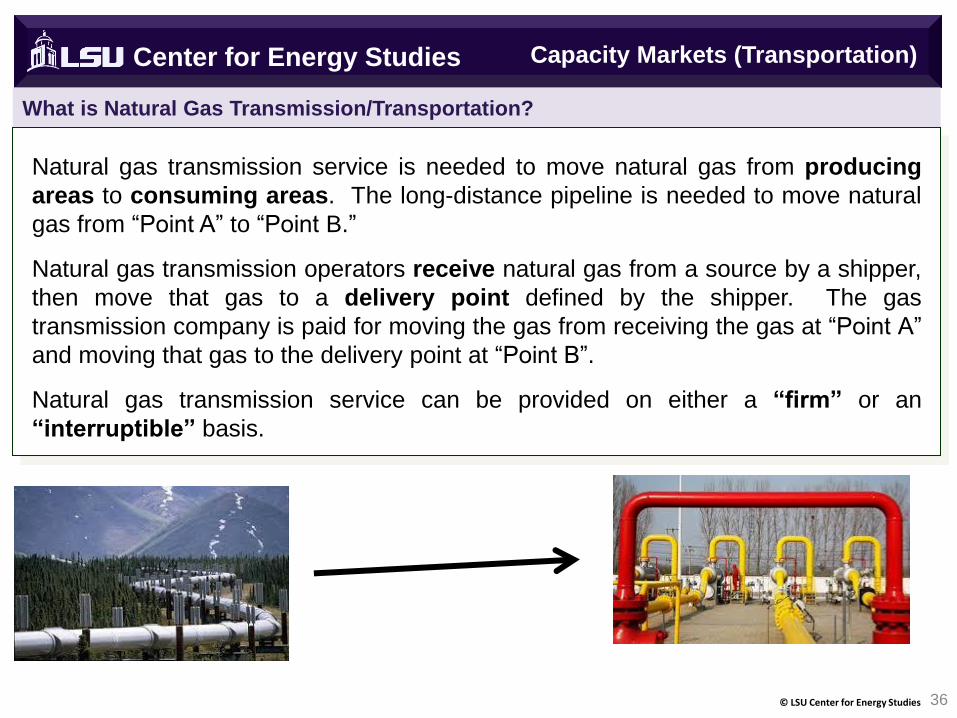
Natural gas transmission service is needed to move natural gas from producing
areas to consuming areas. The long-distance pipeline is needed to move natural
gas from “Point A” to “Point B.”
Natural gas transmission operators receive natural gas from a source by a shipper,
then move that gas to a delivery point defined by the shipper. The gas
transmission company is paid for moving the gas from receiving the gas at “Point A”
and moving that gas to the delivery point at “Point B”.
Natural gas transmission service can be provided on either a “firm” or an
“interruptible” basis.
Center for Energy Studies
Natural Gas Pipeline and Storage Facilities
© LSU Center for Energy Studies 37
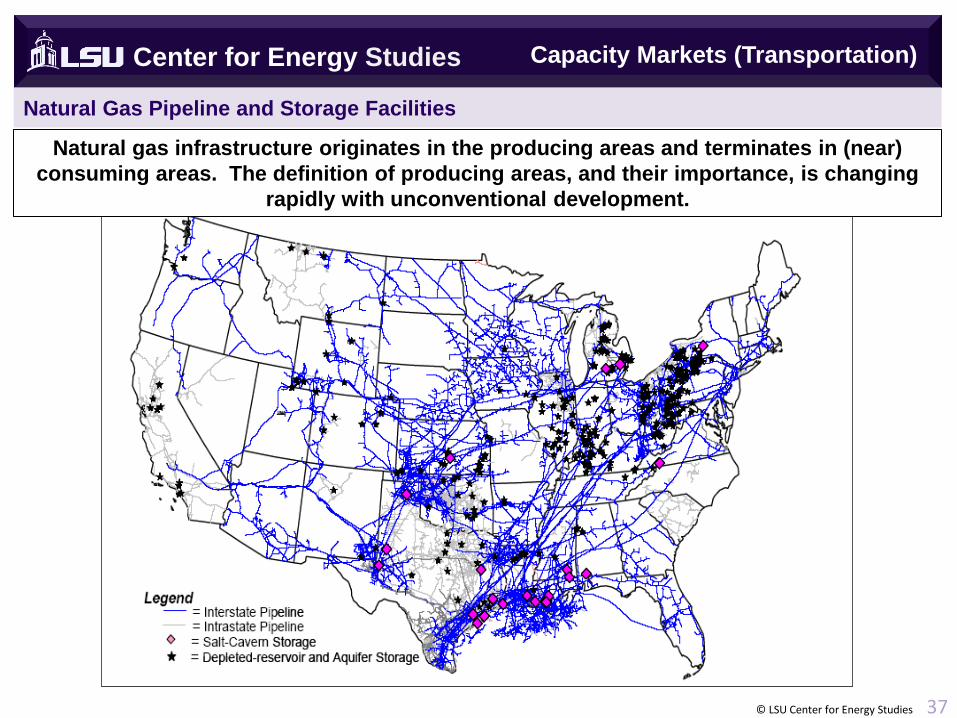
Natural gas infrastructure originates in the producing areas and terminates in (near)
consuming areas. The definition of producing areas, and their importance, is changing
rapidly with unconventional development.
Capacity Markets (Transportation)
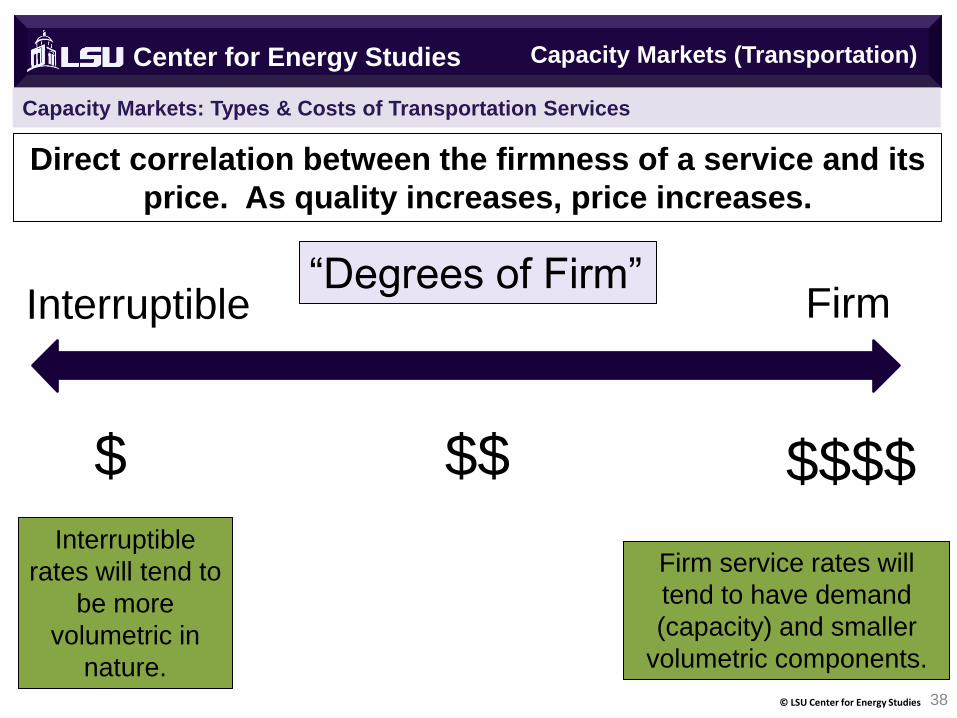
Capacity Markets: Types & Costs of Transportation Services
38 © LSU Center for Energy Studies
Center for Energy Studies
Interruptible Firm
$$$$ $
“Degrees of Firm”
$$
Direct correlation between the firmness of a service and its
price. As quality increases, price increases.
Interruptible
rates will tend to
be more
volumetric in
nature.
Firm service rates will
tend to have demand
(capacity) and smaller
volumetric components.
Capacity Markets (Transportation)
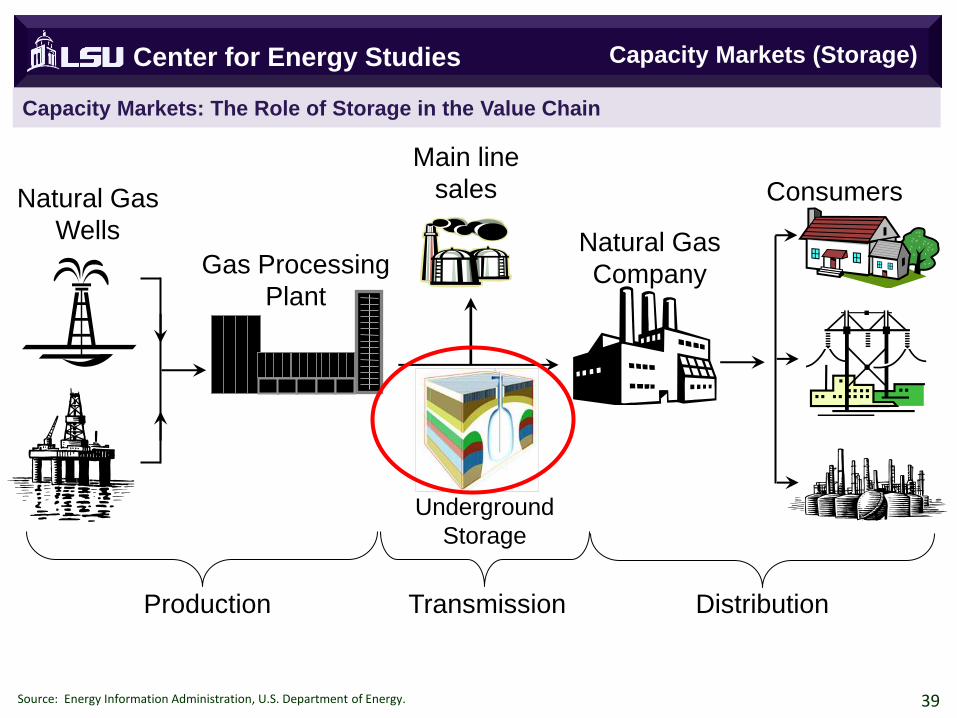
Natural Gas
Wells
Gas Processing
Plant
Natural Gas
Company
Main line
sales
Production Transmission Distribution
Consumers
Source: Energy Information Administration, U.S. Department of Energy. 39
Underground
Storage
Capacity Markets: The Role of Storage in the Value Chain
Center for Energy Studies Capacity Markets (Storage)
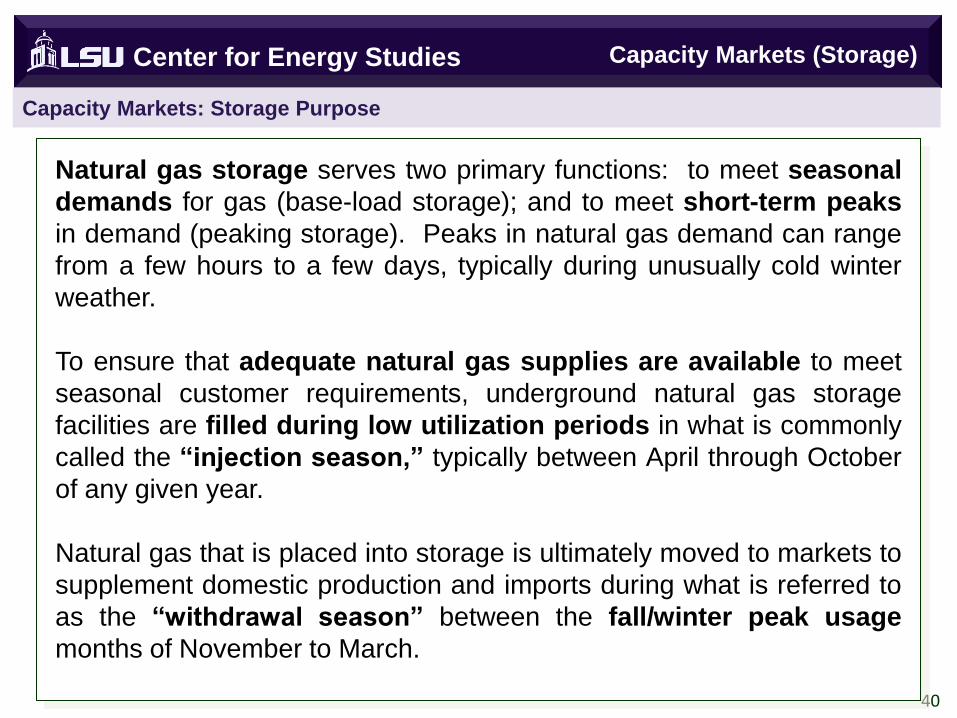
40
Natural gas storage serves two primary functions: to meet seasonal
demands for gas (base-load storage); and to meet short-term peaks
in demand (peaking storage). Peaks in natural gas demand can range
from a few hours to a few days, typically during unusually cold winter
weather.
To ensure that adequate natural gas supplies are available to meet
seasonal customer requirements, underground natural gas storage
facilities are filled during low utilization periods in what is commonly
called the “injection season,” typically between April through October
of any given year.
Natural gas that is placed into storage is ultimately moved to markets to
supplement domestic production and imports during what is referred to
as the “withdrawal season” between the fall/winter peak usage
months of November to March.
Capacity Markets: Storage Purpose
Center for Energy Studies Capacity Markets (Storage)

Storage Capacity
Usually thought of in terms of base, working and total. (Measured in billion cubic feet or “Bcf”)
Deliverability Where and how storage is integrated with the transportation system.
Cycles Number of times a facility can be completely filled and emptied (or “turned”).
All of these characteristics are important in defining different types and purposes for underground natural gas storage.
Characteristic Description
41
Capacity Markets: Storage Characteristics
Center for Energy Studies Capacity Markets (Storage)
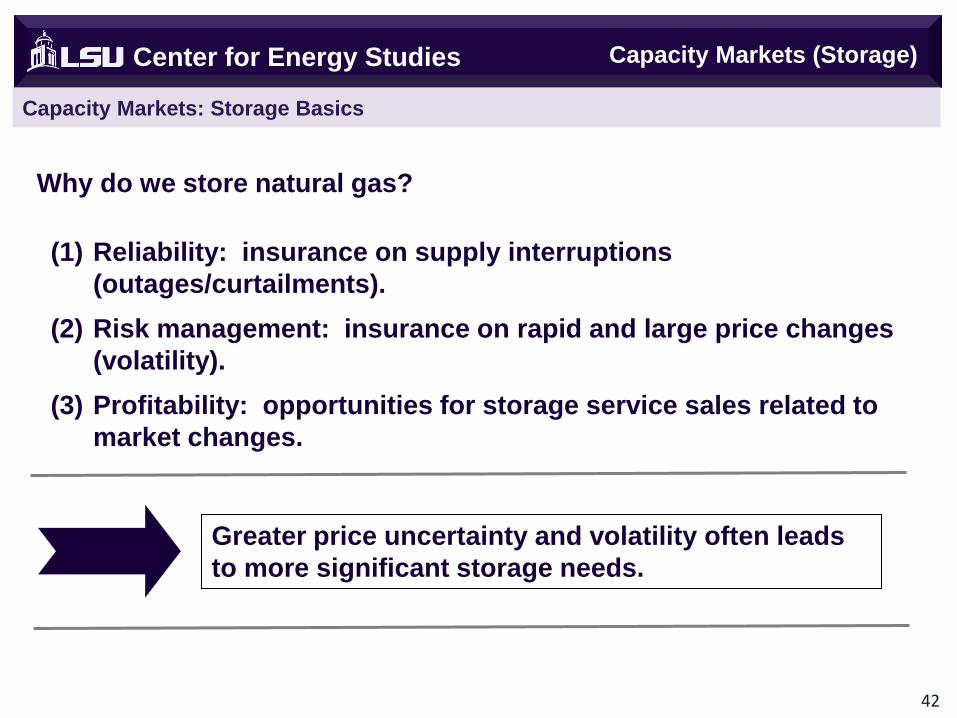
Why do we store natural gas?
Greater price uncertainty and volatility often leads
to more significant storage needs.
42
(1) Reliability: insurance on supply interruptions
(outages/curtailments).
(2) Risk management: insurance on rapid and large price changes
(volatility).
(3) Profitability: opportunities for storage service sales related to
market changes.
Capacity Markets: Storage Basics
Center for Energy Studies Capacity Markets (Storage)
0.0
0.5
1.0
1.5
2.0
2.5
3.0
3.5
Jan-01 Jan-03 Jan-05 Jan-07 Jan-09 Jan-11 Jan-13
Demand Supply
Source: Energy Information Administration, U.S. Department of Energy.
Bcf
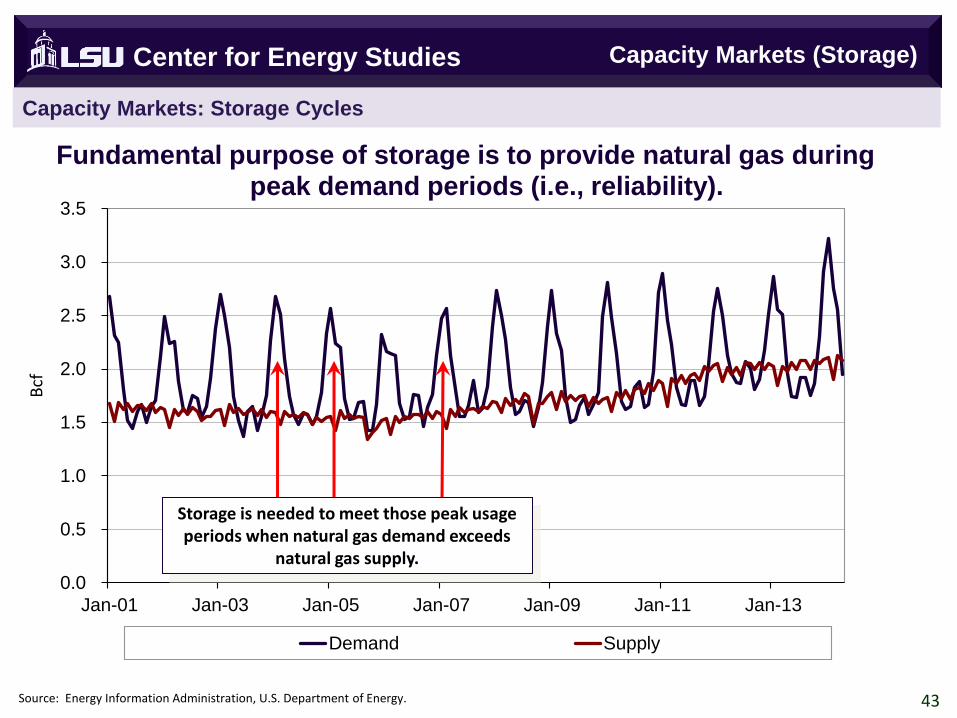
Fundamental purpose of storage is to provide natural gas during peak demand periods (i.e., reliability).
43
Capacity Markets: Storage Cycles
Center for Energy Studies
Storage is needed to meet those peak usage periods when natural gas demand exceeds
natural gas supply.
Capacity Markets (Storage)
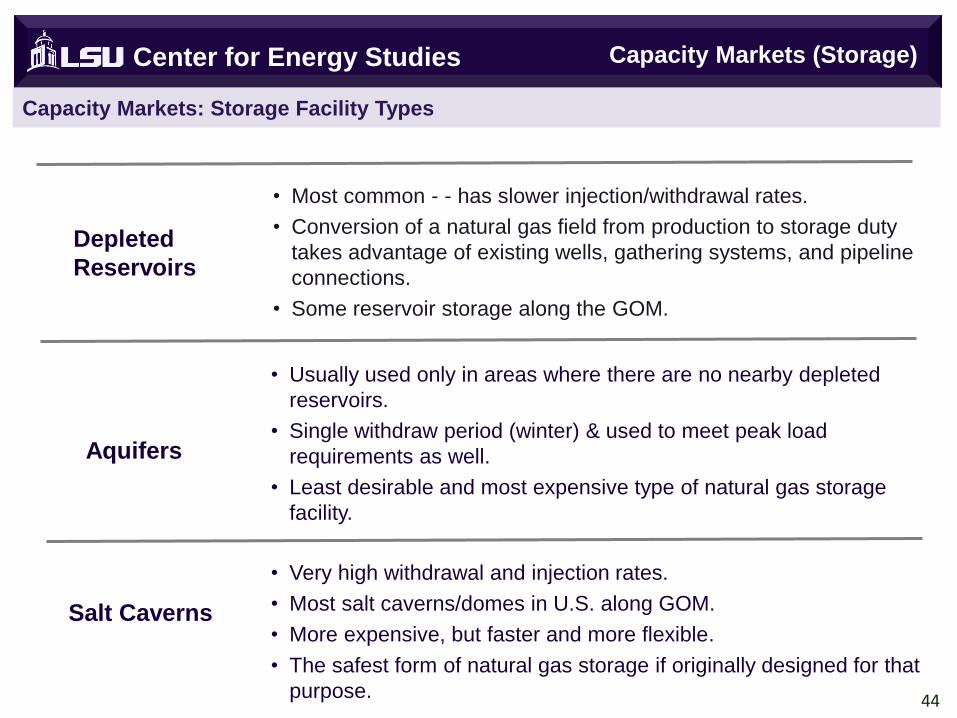
Salt Caverns
• Very high withdrawal and injection rates.
• Most salt caverns/domes in U.S. along GOM.
• More expensive, but faster and more flexible.
• The safest form of natural gas storage if originally designed for that
purpose.
Depleted
Reservoirs
Aquifers
• Most common - - has slower injection/withdrawal rates.
• Conversion of a natural gas field from production to storage duty
takes advantage of existing wells, gathering systems, and pipeline
connections.
• Some reservoir storage along the GOM.
• Usually used only in areas where there are no nearby depleted
reservoirs.
• Single withdraw period (winter) & used to meet peak load
requirements as well.
• Least desirable and most expensive type of natural gas storage
facility.
44
Capacity Markets: Storage Facility Types
Center for Energy Studies Capacity Markets (Storage)

Center for Energy Studies
Policy & Regulation
45 © LSU Center for Energy Studies
Important Market/Regulatory Distinctions (Gas & Power)
Policy & Regulation Center for Energy Studies
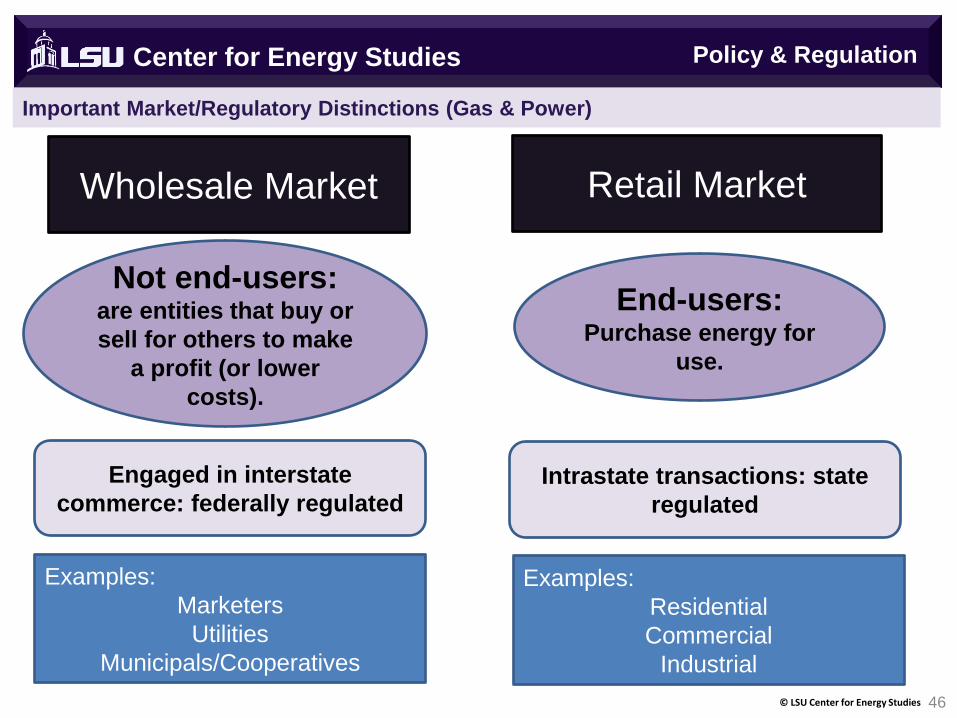
© LSU Center for Energy Studies 46
Wholesale Market Retail Market
Not end-users: are entities that buy or
sell for others to make
a profit (or lower
costs).
End-users: Purchase energy for
use.
Engaged in interstate
commerce: federally regulated Intrastate transactions: state
regulated
Examples:
Marketers
Utilities
Municipals/Cooperatives
Examples:
Residential
Commercial
Industrial

Power Markets: Wholesale v. Retail
Center for Energy Studies
© LSU Center for Energy Studies 47
Residential Commercial
Industrial
Wholesale – Competitive Market Retail – Regulated Market
Utility
Utility
Producer
Marketer
Market
The competitive wholesale market is “upstream” of the transmission and distribution
system and is where various market participants generate and trade electricity.
Producer
Utility
Marketer
Policy & Regulation
Regulation: Wholesale versus Retail
Center for Energy Studies
© LSU Center for Energy Studies 48
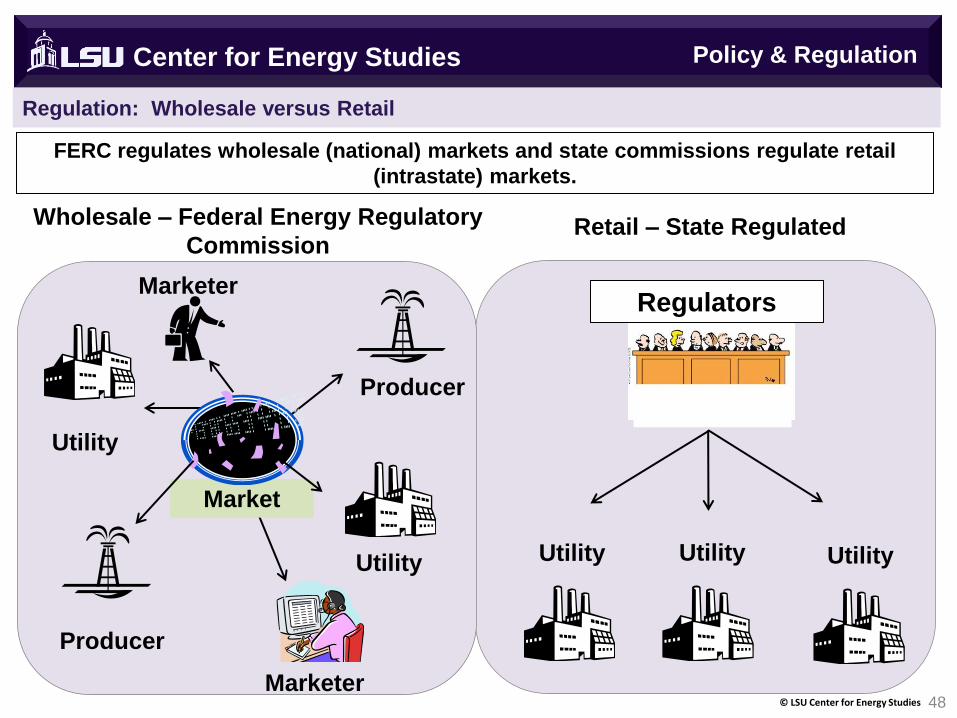
Wholesale – Federal Energy Regulatory
Commission Retail – State Regulated
Utility
Utility
Producer
Marketer
Market
FERC regulates wholesale (national) markets and state commissions regulate retail
(intrastate) markets.
Producer
Utility
Marketer
Utility Utility
Regulators
Policy & Regulation
Center for Energy Studies
Wholesale (Interstate) Regulation
49 © LSU Center for Energy Studies
Wholesale Regulation & Competition
50 © LSU Center for Energy Studies
Center for Energy Studies
Natural gas transmission systems can be either interstate or intrastate systems.
Interstate systems are regulated by the Federal Energy Regulatory
Commission (“FERC”) as a natural monopoly whereas intrastate systems are
typically regulated by state utility commissions. (Natural Gas Act of 1938, Federal
Power Act of 1935).
At one time, natural gas transportation systems were integrated where pipelines
owned (contracted for) the commodity and made those “bundled” sales to local
distribution companies. Sales were “bundled” meaning that transportation and
commodity were charged on one integrated rate.
The trend towards less regulation and more competition in the late 1970s and
early 1980s began the process of “unbundling” these systems: separating the
commodity from the transportation component. Began the process of turning
the interstate pipeline system into a common carrier-based system.
While the FERC has a number of “traditional” ratemaking (rate setting
functions) it has increasingly moved away from very stringent methods of
economic regulation and focus more on market oversight and stimulating
competition.
Wholesale Regulation
Wholesale Competition : Transportation & Order 636
51 © LSU Center for Energy Studies
Center for Energy Studies
Order 636 (1992) major regulatory change - creates a common-carrier
framework for transportation. Prohibits pipeline companies from
engaging directly in commodity sales and to provide transportation
and storage service on equal and non-discriminatory terms.
Requires pipeline to provide “no-notice” transportation service,
access to storage facilities, increased flexibility in receipt and delivery
points, and “capacity release” programs.
No-notice transportation services allow LDCs and utilities to receive
natural gas from pipelines on demand to meet peak service needs for its
customers, without incurring any penalties. These services were provided
based on LDC and utility concerns that the restructuring of the industry
may decrease the reliability needed to meet their own customers' needs.
Wholesale Regulation
Wholesale Competition: Order 636 & Capacity Release
52 © LSU Center for Energy Studies
Center for Energy Studies
Order 636 initiated a broad platform for trading a wide range of
transportation and storage services that are differentiated on price and
quality (firmness) – no longer “plain vanilla” transportation.
Electronic Bulletin Board (“EBB”): post critical information about
pipeline operations, services, terms and conditions, market opportunities,
and other information. Goal: increase market transparency and
reduce informational and transactions costs.
Capacity release: allow the resale of unwanted pipeline capacity
between pipeline customers. A customer requiring pipeline transportation
can refer to these bulletin boards, and find out if there is any available
capacity on the pipeline, or if there is any released capacity available for
purchase or lease from one who has already purchased capacity but
does not need it.
Wholesale Regulation

Center for Energy Studies
Retail (Intrastate) Regulation
53 © LSU Center for Energy Studies
Regulation conducted by state “Public Utilities
Commissions” or “Public Service Commissions” that have
quasi-legislative and quasi-judicial functions.
Commissioners are appointed or elected.
Rates typically set on a “fair” rate of return hence the
reference “rate of return regulation.”
“Rate of return” regulation is a bit of misnomer since
service rates are what are fixed (through a tariff) and
actual rates of return (profit/earnings) vary.
© LSU Center for Energy Studies 54
Regulatory Process Regulatory Process
State Utility Regulation (Retail)
Retail Regulation
Monopoly Center for Energy Studies
Rates Determination - Overview
© LSU Center for Energy Studies 55
Overall, the regulatory process is said to be governed by what is often
referred to as the “regulatory compact” between regulators and
regulated firms stating:
Utilities are given a monopoly service territory and are allowed to
utilized a set of regulated rates that provide them with an opportunity
to recover their prudently-incurred expenses and a return “on” and
“off” their prudently-incurred investments in return for providing safe,
economic, and reliable service.
This “regulatory compact” is the result of over 100 years of regulation.
It is not necessarily defined in a specific code or statute, but the result of
long-standing practices and precedents.
Rates are set in a fashion that is supposed to be consistent with this
regulatory compact.
Retail Regulation
Monopoly Center for Energy Studies
Other State Regulatory Functions
© LSU Center for Energy Studies 56
Utility regulation is not limited to just setting rates alone.
State PSCs are very active in the utility supply planning process. Will
review, evaluate and approve fuel procurement plans of utilities to ensure
that they are diversifying their supplies, storage and transportation
alternatives adequately.
PSCs will also be active in integrated resource planning. This usually
involves the analysis current mains extensions plans, other long run capital
management/budgeting plans, load forecasts and potential growth
requirements, energy efficiency requirements.
PSCs will also be active in the review and monitoring of a utility’s
distribution integrity management (“DIMP”) plans to ensure that the
utility is maintaining a safe and reliable systems. Evaluate and measure
existing system, identify and quantify known threats to the system,
develop plans to mitigate those risks (communication with contractors,
asset replacement), evaluate the success of prior plans and strategies,
feed those back into upcoming plans.
Retail Regulation

Center for Energy Studies
Conclusions
57 © LSU Center for Energy Studies
Monopoly Center for Energy Studies
Conclusions
© LSU Center for Energy Studies 58
Conclusions
Natural gas industry a very unique “American” energy
industry that is rich and diverse in its players and reflected by
three major sectors: production; transmission/storage; and
distribution.
Natural gas supplies are abundant and could supply up to a
century’s worth of domestic supplies to U.S. consumers at
affordable and relatively less volatile prices.
Natural gas end-uses are increasing given natural gas’: (a)
affordability; (b) availability; and (c) environmental attributes.
The industry is regulated by a number of agencies at the
federal and state level. State PSCs are very important players
associated with industry regulation and oversight.
Center for Energy Studies
Questions, Comments and Discussion
www.enrg.lsu.edu
© LSU Center for Energy Studies 59