Embed Size (px)
Citation preview
Int. J. Electrochem. Sci., 12 (2017) 747 – 761, doi: 10.20964/2017.01.56
International Journal of
ELECTROCHEMICAL SCIENCE
www.electrochemsci.org
Natural dye extracted from Pandannus amaryllifolius leaves as
sensitizer in fabrication of dye-sensitized solar cells
Mahmoud A. M. Al-Alwani 1, 4
, Abu Bakar Mohamad 1, 3
, Abd Amir H. Kadhum1, Norasikin A. Ludin
2,
N. E. Safie2, M. Z. Razali
2, M. Ismail
2, Kamaruzzaman Sopian
2
1
Department of Chemical and Process Engineering, Faculty of Engineering and Built Environment,
Universiti Kebangsaan Malaysia, 43600 Bangi, Selangor, Malaysia 2Solar Energy Research Institute (SERI), Universiti Kebangsaan Malaysia, Bangi, 43600 Selangor,
Malaysia 3Fuel Cell Institute, Universiti Kebangsaan Malaysia, Bangi, 43600 Selangor, Malaysia
4Department of Biology, College of Education for Pure Sciences/Ibn Al-Haitham, University of
Baghdad, Baghdad, Iraq *Email address: [email protected]
Received: 25 August 2016 / Accepted: 16 November 2016 / Published: 12 December 2016
A dye-sensitized solar cell (DSSC) was fabricated with natural chlorophyll dye extracted from pandan
(Pandannus amaryllifolius) leaves as natural sensitizer. Chlorophyll dye was extracted from pandan
leaves using different organic solvents, namely, ethanol, acetonitrile, chloroform, ethyl ether, and
methanol, to determine the effects of solvent type on the extraction. The optical and structural
properties of the natural extract were also analyzed. UV-Vis spectrophotometer and Fourier
transmission infrared studies (FTIR) indicated the presence of chlorophyll in pandan leaves. The
absorption spectrum of the dye extract was compared with that of the dye adsorbed onto the TiO2
surface. The dye structure was then confirmed through X-ray diffraction analysis (XRD). The
effectiveness of electron transfer was found to be related to the interaction between the chlorophyll dye
and the TiO2 film surface. The morphological properties and composition of dyes were analyzed
through scanning electron microscope (SEM) and EDX studies. The photovoltaic response of DSSC
was investigated by recording I–V characteristics under illumination. DSSC sensitized with the pandan
extract yielded the following parameters: Isc = 0.4 mA, Voc = 0.559 V, Pmax = 0.1 W, FF = 60.51%
and η = 0.1%.
Keywords: DSSC, Pandannus amaryllifolius, chlorophyll, sensitizers, solvents
1. INTRODUCTION
The use of solar energy technologies has increased worldwide to provide alternative sources of
energy and reduce dependence on existing energy sources [1]. Solar energy is converted into electric
energy through sensitization of wide-band-gap semiconductors by using dye-sensitized solar cells
Int. J. Electrochem. Sci., Vol. 12, 2017
748
(DSSC). The production and assembly of solar cells is cost efficient and easy [2, 3]. Studies on dye
sensitization focused on elucidating possible photo-sensitization reduction reactions [4]. Tsubomura
used porous ZnO as the working electrode of a DSSC in 1976 and obtained a photon-electricity
conversion efficiency of 2.5%; since then, DSSCs have been a subject of research on solar cells [5].
Nevertheless, the use of dye sensitization remains unsuccessful until Grätzel et al. developed a solar
cell using mesoporous TiO2 film in 1991 [6, 7]. DSSC has been increasingly used because it provides
high energy conversion efficiency; moreover, this type of cells exhibits potential for future
photovoltaic applications because of its simple fabrication process, low manufacturing cost, low
environmental impact, and flexibility [8–10]. Hence, DSSC has been extensively investigated
compared with conventional silicon cells [11]. Furthermore, cost optimization of solar cells has been
assessed in recent decades [12]. DSSC consists of nanocrystalline porous wide band-gap
semiconductor electrodes, which can absorb dyes, electrolytes (iodide and triiodide ions), and counter
electrodes [13, 14].
Photo anodes are prepared through dye adsorption on the surface of the TiO2 layer. The
performance of DSSC is mainly determined by the type of dye used as sensitizer. The efficiency of the
cell depends on the absorption spectra of the dye and its anchorage to the TiO2 surface [13, 15].
Synthetic inorganic compounds (ruthenium polypyridyl complexes) are one of the most effective
sensitizers because of their high conversion efficiency, excellent chemical stability, and intense
charge-transfer absorption in the entire visible light spectrum [16]. However, these complexes contain
metals, which are relatively expensive and hazardous to the environment [17, 18]. As such, many types
of natural organic dyes extracted from leaves, fruits, and flowers of various species of plants have been
actively studied and tested as low cost alternative materials to replace rare and expensive ruthenium
dyes [19, 20]. Natural plant dyes can be extracted through simple procedures [6]. These dyes have
been a subject of various studies because of their cost efficiency, environment friendliness, non-
toxicity, availability, and full biodegradation potential [21]. Commonly studied natural dyes include
chlorophyll [22, 23], anthocyanins [13, 24, 25], carotenoids [26–28], betalains [29, 30], flavonoids
[31], cyanine [32], and tannins [33].
Different kinds of dyes extracted from various plant species show varied solar energy-to-
electric conversion efficiencies depending on the source, chemical structure of the dyes, and degree of
adsorption onto the mesoporous TiO2 surface. Natural dyes as sensitizers in DSSCs perform poorly
because of weak binding capabilities to the surface of the semiconductor oxide film; this phenomenon
reduces excited electron transfer from the sensitizer to the conduction band of the porous film [34].
Many studies show that chlorophyll dyes are effective photosensitizer in photosynthesis and are
potential environment-friendly dye sources [22]. Calogero et al. (2009) reported that the conversion
efficiency of cells with chlorophyll derivatives as sensitizers is more than 2% [35], and that of cells
with chlorin-e6 reaches more than 4% [36]. Chlorophyll absorbs light from red, blue, and violet
wavelengths and obtains its color by reflecting green. Therefore, this pigment is a suitable
photosensitizer in the visible-light region. Chlorophyll is found in the leaves of most green plants,
cyanobacteria, and algae and primarily exists as chlorophyll A. Hence, from an economic point of
view, chlorophyll is the optimal dye sensitizer for fabrication of DSSCs because it can be extracted
through simple processes [37]. In this study, DSSCs were prepared with natural dyes extracted from

Int. J. Electrochem. Sci., Vol. 12, 2017
749
the leaves of pandan (Pandanus amaryllifolius L.) as photo-sensitizer. Pandan is abundant in tropical
countries and has high chlorophyll content [38]. The effect of different solvents on dye extraction was
investigated to determine the optimum solvent. The extracted dye was characterized using UV-Vis
absorption spectrum. The performance of DSSCs containing pandan leaf extracts was also assessed.
A photosensitizer is a molecule (dye) that produces a formal change in molecule of TiO2 in
a photochemical process. In order to test the natural dyes as sensitizer for DSSC application, the dye
sensitized solar cell was designed using P. amaryllifolius dye. The effective light exposure window of
the DSSCs was 1cm2. The parameters of solar cell are short circuit current (ISC), open circuit voltage
(VOC), fill factor (FF), and efficiency (η) and maximum power point (Pmax). The short circuit current
and open circuit voltage are obtained from the I-V curves. Also Incident Photon-to-Electron Efficiency
(IPCE) was studied. The surface morphology of deposited TiO2 thin film electrode was studied by
scanning electron microscope. The structure of the isolated extract was studied using Fourier
transmission infrared (FTIR) spectroscopy. In Addition, other confirmation that dyes supported surface
of TiO2, inhibition of crystallinity of TiO2 was investigated by the Energy Disperse X-ray (EDX)
analysis.
2. MATERIALS AND EXPERIMENTS
2.1 Materials
The scientific classification of pandan is
Kingdom: Plantae
Order: Pandanales
Family: Pandanaceae
Genus: Pandannus
Species: Amaryllifolius
Local name: Pandan
Used part: leaves
P. amaryllifolius is a tropical plant widely cultivated in several countries, including Malaysia,
Indonesia, Chinese, and Bangladesh; pandan leaves are widely used for cooking. This green plant has
fan-shaped, blade-like leaves and very rare flowers. Studies confirmed that pandan leaves can be used
as insect repellent, especially against American cockroaches (Periplaneta americana L.); the leaves
are also used in the food industry as natural colorant [38]. Pandan contains the following aromatic
compounds, namely, 2-acetyl-1-pyrroline, quercetin, tocopherols, tocotrienols, polyphenols,
chlorophyll, and carotenoids [39]. Pandan is a rich source of natural green extracts [40].
2.2 Experimental
2.2.1 Preparation of sensitizers using natural dyes
Several pieces of fresh P. amaryllifolius leaves were washed with distilled water and dried in
an oven at 40 °C before being crushed into fine powder by using a grinder (Mulry function
Int. J. Electrochem. Sci., Vol. 12, 2017
750
disintegrator SY-04). Briefly, 25 g of the powder was immersed in 250 mL of 96% ethanol and stored
for 1 week at room temperature in the dark. The extract was then filtrated using filter paper (NICE,
12.5cm, 102 Qualitative) to remove solid residues. The natural dye solution was concentrated with a
rotary evaporator (Yamato RE 600) at 50 °C for 4 h. The concentrated dye extracted from pandan
leaves was properly stored and protected from direct sunlight and atmospheric air. The resulting dye
solution was used as sensitizer in the DSSC and then characterized.
2.2.2 Fabrication of dye-sensitized TiO2 photo anode
TiO2 porous film (photo anode) was fabricated by mixing 3.0 g of TiO2 powder (anatase
titanium IV oxide, ALDRICH) with 6.0 ml of 0.1 M nitric acid in a mortar and pestle. The paste was
grounded completely after 30 min and added with 3.0 ml of polyethylene glycol (PEG, MW 20, 000)
under continuous stirring. PEG creates a porous structure in the TiO2 film, which led to high amounts
of dye adsorbed on the TiO2 surface. PEG also reduces crack formation, which occur during sintering
at high temperatures [41]. Finally, several drops of Triton X-100 (SIGMA, for electrophoresis) were
added to the mixture to facilitate the adhesion of TiO2 particles to the conductive glass substrate layer
[27]. Ethanol was applied on tissue to remove oil, impurities, and finger prints on the conductive glass
slide. A transparent tape was used to firmly hold and prevent the sliding down of the conductive glass
from the table. Furthermore, the tape controlled the thickness and the area of the TiO2 film. TiO2 paste
was immediately spread as evenly possible onto the 1.5 cm × 1.5 cm area of the conductive glass by
using a clean glass rod. After coating with TiO2 for few minutes, the glass slides were sintered at 450
°C for 30 min in a furnace (LENTON THERMAL DESIGHN, England) to solidify TiO2. When
cooling TiO2 at about 80 °C, the film was directly immersed in the dye solution extracted from pandan
leaves for 24 h at room temperature in the dark for proper adsorption of the dye on the TiO2 surface.
The TiO2/dye electrode was rinsed with ethanol to remove non-adsorbed dyes and excess water from
porous TiO2 and then dried.
2.2.3 Preparation of electrolyte
I−/
I3−
is a common electrolyte in organic solvents, such as acetonitrile, which was used in this
study. Lithium ion was added to facilitate electron transport. This electrolyte is suitable for ion
diffusion and infiltrates well into the TiO2 film, exhibiting the highest efficiency among all DSSCs.
However, the application of this electrolyte is hindered by its limited long-term stability caused by
liquid volatilization. The iodide/triiodide electrolyte solution containing 0.4 M lithium iodide, 0.04 M
iodine (I2), and 0.4 M tetrabutylammonium iodide was dissolved in 0.3 M N-methylbenzimidazole in a
solvent mixture of 3-methoxypropionitrile and acetonitrile with a volume ratio of 1:1.
2.2.4 DSSC assembly
The dry TiO2 porous film electrode was placed facing upward, and the conductive side of the
catalyst-coated counter electrode faced the TiO2 film. A DSSC was assembled by introducing liquid
Int. J. Electrochem. Sci., Vol. 12, 2017
751
electrolyte (0.5 M potassium iodide mixed with 0.05 M iodine dissolved in the solution of ethylene
glycol and acetonitrile at a volume ratio 4:1) into the space between the TiO2 electrode (photo anode)
and the counter electrode (cathode) by capillary action. The two electrodes were clipped together using
two binder clips to prevent the electrolyte from leaking.
2.2.5 Characterization and measurements
The absorption spectra of P. amaryllifolius dye solution and dye adsorbed on the TiO2 surface
were determined using UV-Vis spectrophotometer (Perkin Elmer, Lambda 35) in the wavelength range
of 400–800 nm. The conversion efficiency of the cell was measured under irradiation (AM 1.5:100
mW/cm2). The current–voltage (I-V) curve was used to determine short-circuit current (Isc) and open-
circuit voltage (Voc). The fill factor (FF) of the DSSC was calculated according to FF = (Imax ×
Vmax (Isc × Voc), whereas the conversion efficiency (η) of DSSC was calculated according to η = (Isc ×
Voc × Pin .
3. RESULTS AND DISCUSSION
3.1 Absorption wavelengths of dyes in different solvents
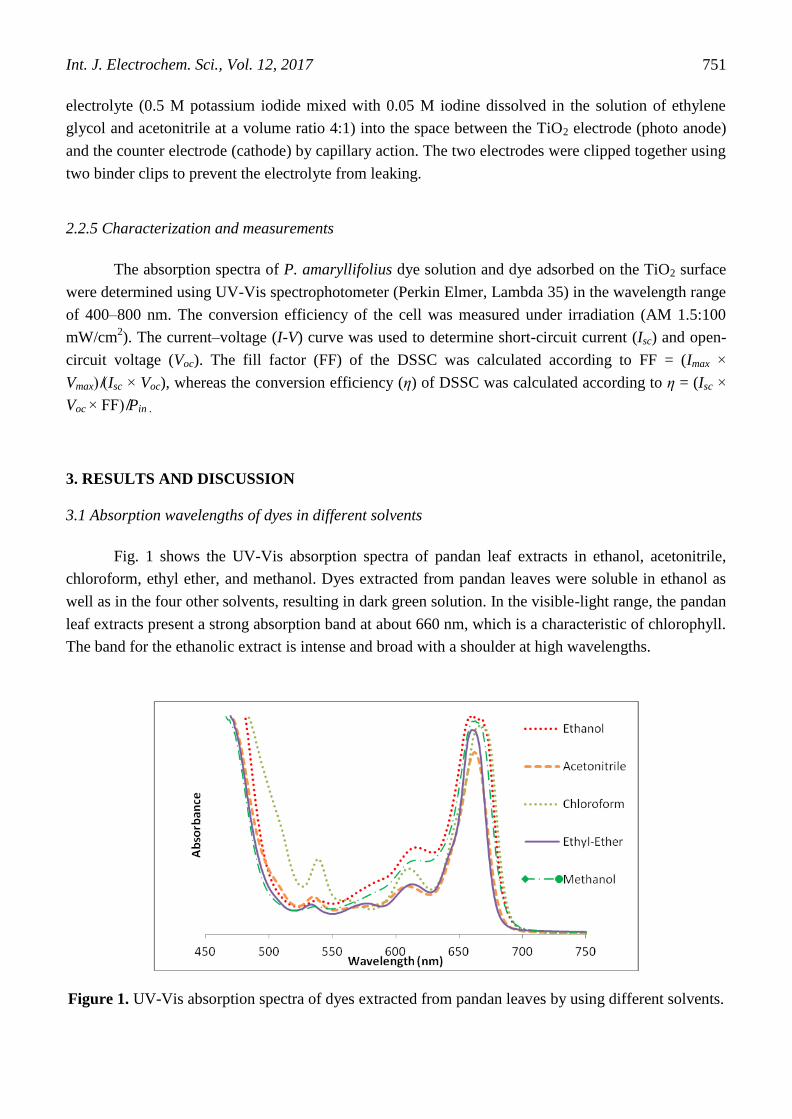
Fig. 1 shows the UV-Vis absorption spectra of pandan leaf extracts in ethanol, acetonitrile,
chloroform, ethyl ether, and methanol. Dyes extracted from pandan leaves were soluble in ethanol as
well as in the four other solvents, resulting in dark green solution. In the visible-light range, the pandan
leaf extracts present a strong absorption band at about 660 nm, which is a characteristic of chlorophyll.
The band for the ethanolic extract is intense and broad with a shoulder at high wavelengths.
Figure 1. UV-Vis absorption spectra of dyes extracted from pandan leaves by using different solvents.
Int. J. Electrochem. Sci., Vol. 12, 2017
752
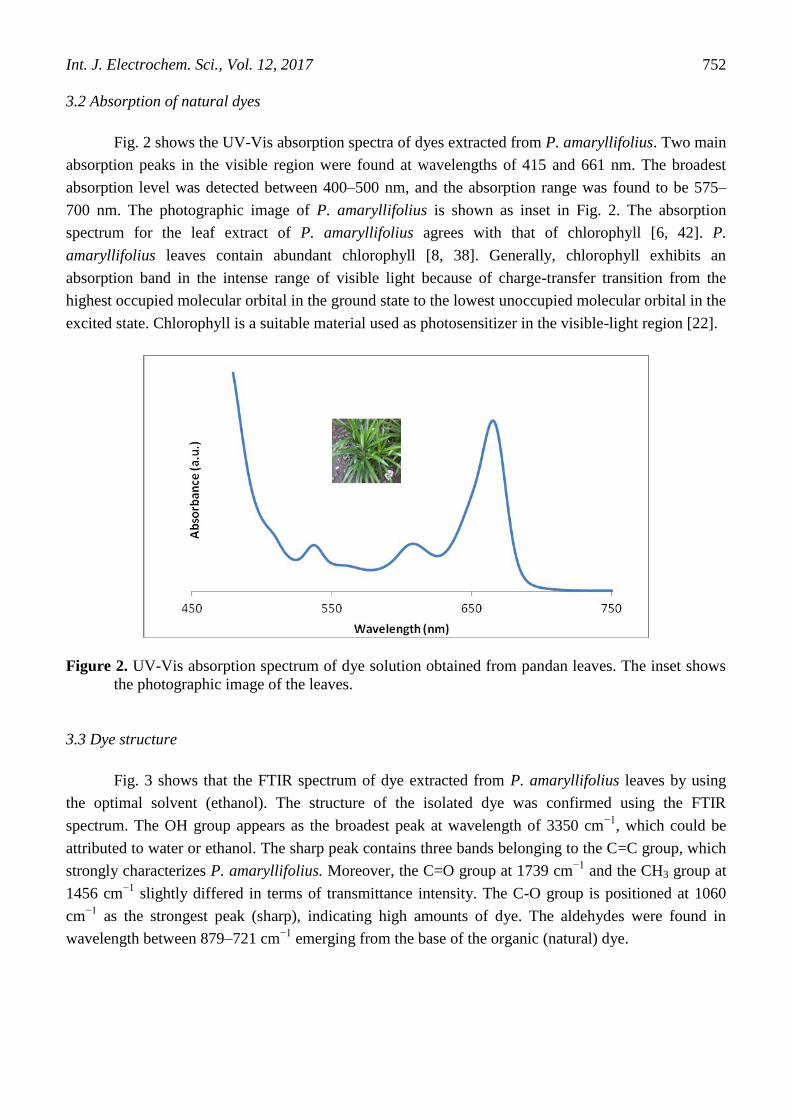
3.2 Absorption of natural dyes
Fig. 2 shows the UV-Vis absorption spectra of dyes extracted from P. amaryllifolius. Two main
absorption peaks in the visible region were found at wavelengths of 415 and 661 nm. The broadest
absorption level was detected between 400–500 nm, and the absorption range was found to be 575–
700 nm. The photographic image of P. amaryllifolius is shown as inset in Fig. 2. The absorption
spectrum for the leaf extract of P. amaryllifolius agrees with that of chlorophyll [6, 42]. P.
amaryllifolius leaves contain abundant chlorophyll [8, 38]. Generally, chlorophyll exhibits an
absorption band in the intense range of visible light because of charge-transfer transition from the
highest occupied molecular orbital in the ground state to the lowest unoccupied molecular orbital in the
excited state. Chlorophyll is a suitable material used as photosensitizer in the visible-light region [22].
Figure 2. UV-Vis absorption spectrum of dye solution obtained from pandan leaves. The inset shows
the photographic image of the leaves.
3.3 Dye structure
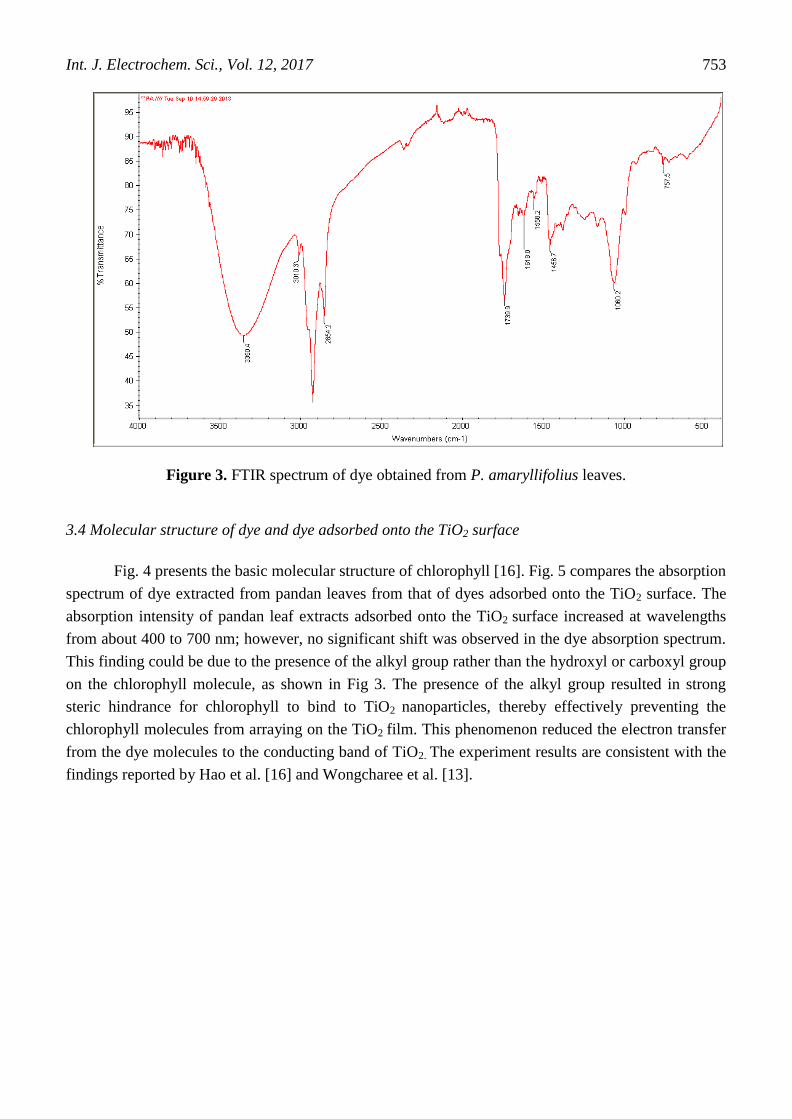
Fig. 3 shows that the FTIR spectrum of dye extracted from P. amaryllifolius leaves by using
the optimal solvent (ethanol). The structure of the isolated dye was confirmed using the FTIR
spectrum. The OH group appears as the broadest peak at wavelength of 3350 cm−1
, which could be
attributed to water or ethanol. The sharp peak contains three bands belonging to the C=C group, which
strongly characterizes P. amaryllifolius. Moreover, the C=O group at 1739 cm−1
and the CH3 group at
1456 cm−1
slightly differed in terms of transmittance intensity. The C-O group is positioned at 1060
cm−1
as the strongest peak (sharp), indicating high amounts of dye. The aldehydes were found in
wavelength between 879–721 cm−1
emerging from the base of the organic (natural) dye.
Int. J. Electrochem. Sci., Vol. 12, 2017
753
Figure 3. FTIR spectrum of dye obtained from P. amaryllifolius leaves.
3.4 Molecular structure of dye and dye adsorbed onto the TiO2 surface
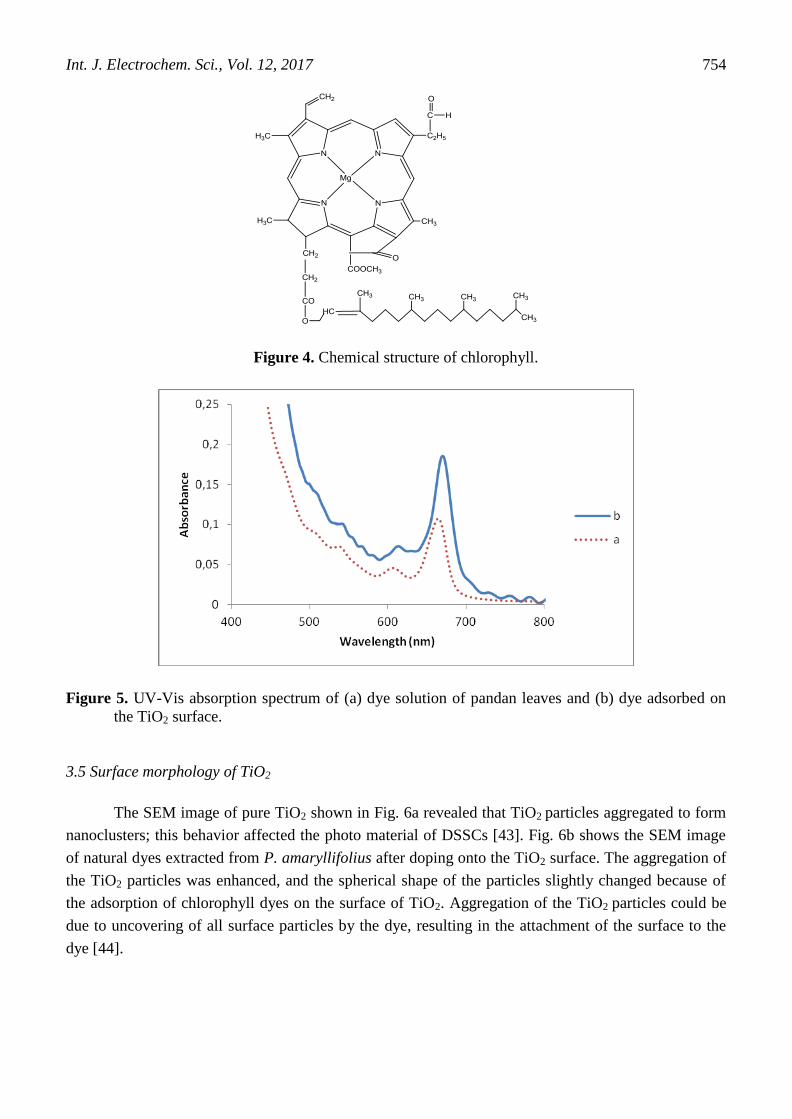
Fig. 4 presents the basic molecular structure of chlorophyll [16]. Fig. 5 compares the absorption
spectrum of dye extracted from pandan leaves from that of dyes adsorbed onto the TiO2 surface. The
absorption intensity of pandan leaf extracts adsorbed onto the TiO2 surface increased at wavelengths
from about 400 to 700 nm; however, no significant shift was observed in the dye absorption spectrum.
This finding could be due to the presence of the alkyl group rather than the hydroxyl or carboxyl group
on the chlorophyll molecule, as shown in Fig 3. The presence of the alkyl group resulted in strong
steric hindrance for chlorophyll to bind to TiO2 nanoparticles, thereby effectively preventing the
chlorophyll molecules from arraying on the TiO2 film. This phenomenon reduced the electron transfer
from the dye molecules to the conducting band of TiO2. The experiment results are consistent with the
findings reported by Hao et al. [16] and Wongcharee et al. [13].
Int. J. Electrochem. Sci., Vol. 12, 2017
754
Figure 4. Chemical structure of chlorophyll.
Figure 5. UV-Vis absorption spectrum of (a) dye solution of pandan leaves and (b) dye adsorbed on
the TiO2 surface.
3.5 Surface morphology of TiO2
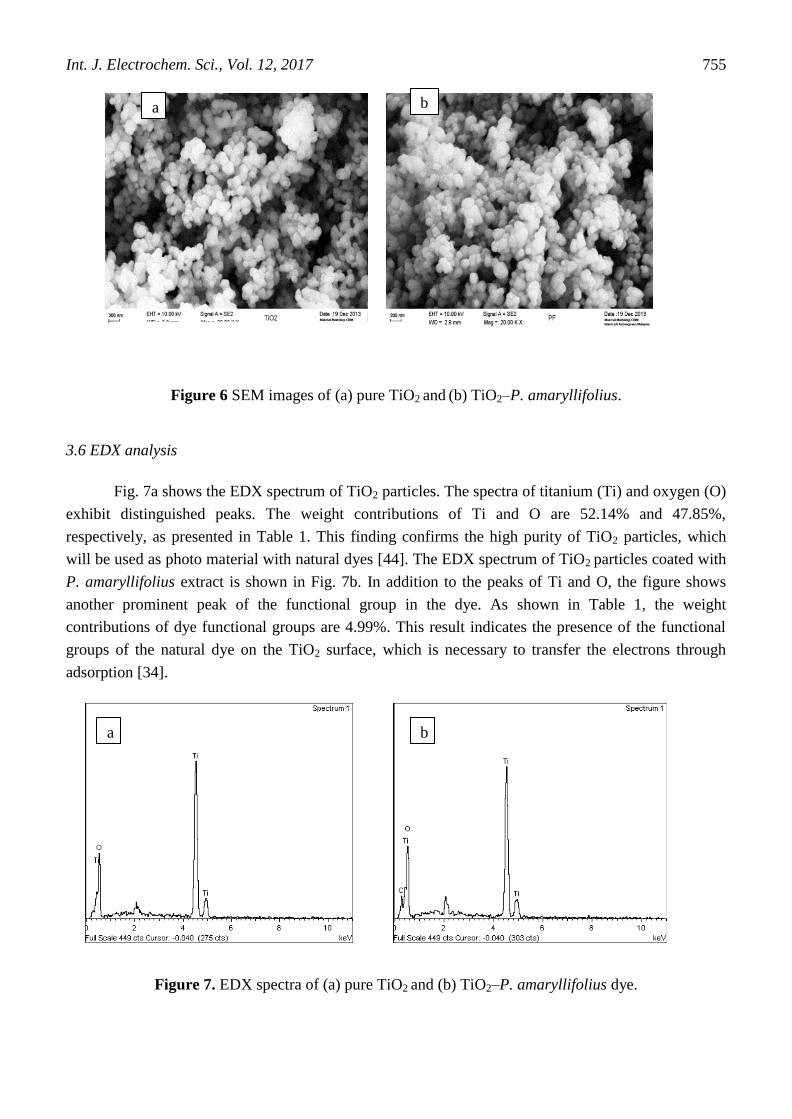
The SEM image of pure TiO2 shown in Fig. 6a revealed that TiO2 particles aggregated to form
nanoclusters; this behavior affected the photo material of DSSCs [43]. Fig. 6b shows the SEM image
of natural dyes extracted from P. amaryllifolius after doping onto the TiO2 surface. The aggregation of
the TiO2 particles was enhanced, and the spherical shape of the particles slightly changed because of
the adsorption of chlorophyll dyes on the surface of TiO2. Aggregation of the TiO2 particles could be
due to uncovering of all surface particles by the dye, resulting in the attachment of the surface to the
dye [44].
Int. J. Electrochem. Sci., Vol. 12, 2017
755
Figure 6 SEM images of (a) pure TiO2 and (b) TiO2–P. amaryllifolius.
3.6 EDX analysis
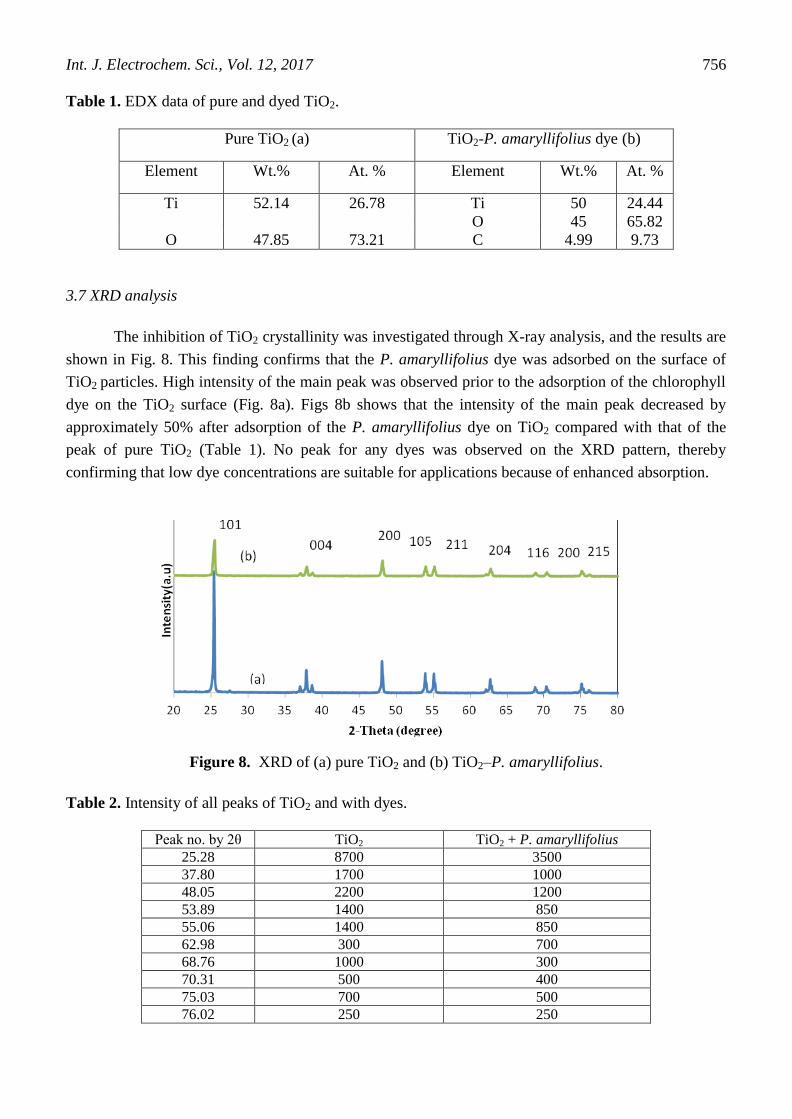
Fig. 7a shows the EDX spectrum of TiO2 particles. The spectra of titanium (Ti) and oxygen (O)
exhibit distinguished peaks. The weight contributions of Ti and O are 52.14% and 47.85%,
respectively, as presented in Table 1. This finding confirms the high purity of TiO2 particles, which
will be used as photo material with natural dyes [44]. The EDX spectrum of TiO2 particles coated with
P. amaryllifolius extract is shown in Fig. 7b. In addition to the peaks of Ti and O, the figure shows
another prominent peak of the functional group in the dye. As shown in Table 1, the weight
contributions of dye functional groups are 4.99%. This result indicates the presence of the functional
groups of the natural dye on the TiO2 surface, which is necessary to transfer the electrons through
adsorption [34].
Figure 7. EDX spectra of (a) pure TiO2 and (b) TiO2–P. amaryllifolius dye.
a b
a b
Int. J. Electrochem. Sci., Vol. 12, 2017
756
Table 1. EDX data of pure and dyed TiO2.
Pure TiO2 (a) TiO2-P. amaryllifolius dye (b)
Element Wt.% At. % Element Wt.% At. %
Ti 52.14 26.78 Ti 50 24.44
O 45 65.82
O 47.85 73.21 C 4.99 9.73
3.7 XRD analysis
The inhibition of TiO2 crystallinity was investigated through X-ray analysis, and the results are
shown in Fig. 8. This finding confirms that the P. amaryllifolius dye was adsorbed on the surface of
TiO2 particles. High intensity of the main peak was observed prior to the adsorption of the chlorophyll
dye on the TiO2 surface (Fig. 8a). Figs 8b shows that the intensity of the main peak decreased by
approximately 50% after adsorption of the P. amaryllifolius dye on TiO2 compared with that of the
peak of pure TiO2 (Table 1). No peak for any dyes was observed on the XRD pattern, thereby
confirming that low dye concentrations are suitable for applications because of enhanced absorption.
Figure 8. XRD of (a) pure TiO2 and (b) TiO2–P. amaryllifolius.
Table 2. Intensity of all peaks of TiO2 and with dyes.
Peak no. by 2θ TiO2 TiO2 + P. amaryllifolius
25.28 8700 3500
37.80 1700 1000
48.05 2200 1200
53.89 1400 850
55.06 1400 850
62.98 300 700
68.76 1000 300
70.31 500 400
75.03 700 500
76.02 250 250
Int. J. Electrochem. Sci., Vol. 12, 2017
757
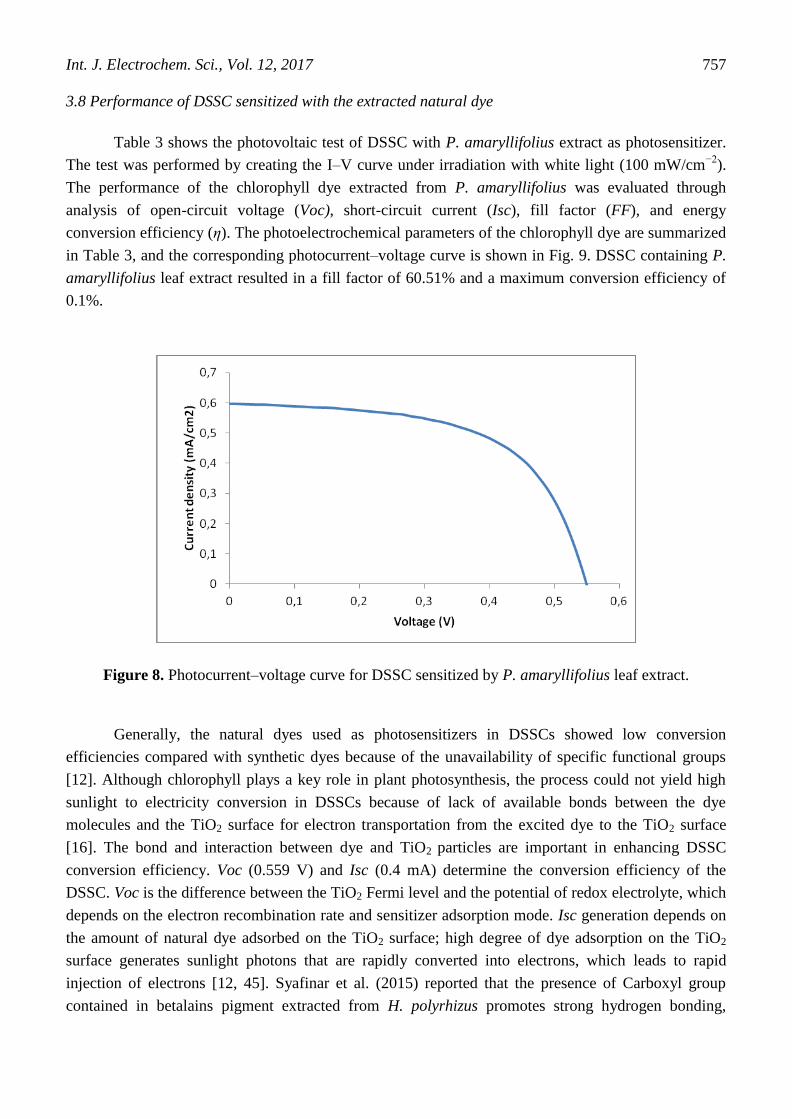
3.8 Performance of DSSC sensitized with the extracted natural dye
Table 3 shows the photovoltaic test of DSSC with P. amaryllifolius extract as photosensitizer.
The test was performed by creating the I–V curve under irradiation with white light (100 mW/cm−2
).
The performance of the chlorophyll dye extracted from P. amaryllifolius was evaluated through
analysis of open-circuit voltage (Voc), short-circuit current (Isc), fill factor (FF), and energy
conversion efficiency (η). The photoelectrochemical parameters of the chlorophyll dye are summarized
in Table 3, and the corresponding photocurrent–voltage curve is shown in Fig. 9. DSSC containing P.
amaryllifolius leaf extract resulted in a fill factor of 60.51% and a maximum conversion efficiency of
0.1%.
Figure 8. Photocurrent–voltage curve for DSSC sensitized by P. amaryllifolius leaf extract.
Generally, the natural dyes used as photosensitizers in DSSCs showed low conversion
efficiencies compared with synthetic dyes because of the unavailability of specific functional groups
[12]. Although chlorophyll plays a key role in plant photosynthesis, the process could not yield high
sunlight to electricity conversion in DSSCs because of lack of available bonds between the dye
molecules and the TiO2 surface for electron transportation from the excited dye to the TiO2 surface
[16]. The bond and interaction between dye and TiO2 particles are important in enhancing DSSC
conversion efficiency. Voc (0.559 V) and Isc (0.4 mA) determine the conversion efficiency of the
DSSC. Voc is the difference between the TiO2 Fermi level and the potential of redox electrolyte, which
depends on the electron recombination rate and sensitizer adsorption mode. Isc generation depends on
the amount of natural dye adsorbed on the TiO2 surface; high degree of dye adsorption on the TiO2
surface generates sunlight photons that are rapidly converted into electrons, which leads to rapid
injection of electrons [12, 45]. Syafinar et al. (2015) reported that the presence of Carboxyl group
contained in betalains pigment extracted from H. polyrhizus promotes strong hydrogen bonding,

Int. J. Electrochem. Sci., Vol. 12, 2017
758
towards high characteristic [46]. Ramamoorthy et al. (2016) have used natural dyes extracted from
common pear (Opuntia dillenii) and red tamarind (Tamarindus indica)to study the sensitizing
efficiency in DSSCs. They found that the best conversion efficiency of 0.47 % was achieved from
betalain dyes [47].
Table 3. Photoelectrochemical parameters of the DSSC using P. amaryllifolius leaf extract.
Dye Voc
(v)
Isc
(mA)
Jsc
(mA/cm2)
Vm
(v)
Im
(mA)
Pmax
(W)
η
%
FF
%
P.
amaryllifolius
0.55 0.4 0.4 0.428 0.3 0.1 0.1 60.51
3.9. Incident Photon-to-Electron Efficiency (IPCE)
In the DSSC, the large IPCE(ʎ) was related to high JSC [48]. Figure 16 shows the IPCE for
the DSSCs sensitized with extracts of P. amaryllifolius. The dye of P. amaryllifolius has high
absorption from the incident light energy when the incident light wavelength is at the range of 300-
400nm (Figure 9). The IPCE values observed at the characteristic wavelengths of the leaves dye of C.
fruticosa was 35%. The IPCE value of dye from P. amaryllifolius was attributed to its broader
absorption in the visible light region which is in agreement with absorption spectrum of chlorophyll
dye [49]. The difference in values of IPCE of various natural dyes maybe attribute to the varied
amount of dye loaded onto surface of TiO2 thin film, various energy levels of excited dye molecule
and the different degree of charge carrier’s recombination [50]. Calogero et al. (2012 mentioned
that the nature of natural dye and dye preparation was the key factors of IPCE values [29].
Figure 9. IPCE curves for the DSSCs sensitized with natural dyes from leave of P. amaryllifolius
Int. J. Electrochem. Sci., Vol. 12, 2017
759
4. CONCLUSION
In this paper, dyes extracted from pandan leaves (P. amaryllifolius) were found to be highly
soluble in ethanol and soluble in acetonitrile, chloroform, ethyl ether, and methanol. The extract
obtained using ethanol performed slightly better than extracts derived using the four other solvents.
Chlorophyll, a natural dye obtained from pandan leaves, was used as sensitizer in DSSCs. Various
photovoltaic parameters such as Isc, Voc, Pmax, FF, and η were evaluated, and the corresponding
values are 0.4 mA, 0.559 V, and 0.1 W, 60.51%, and 0.1%, respectively. UV-Vis spectrophotometer
and X-ray analyses were performed to confirm the adsorption of the dye on the TiO2 surface. The SEM
and EDX analyses were also conducted to determine the optical, structural, and morphological
properties of pure TiO2 and to confirm if the functional groups of the dye were attached to the TiO2
surface. No significant shift was observed in the absorption spectrum after the dye was absorbed onto
the surface of the TiO2 film. The results obtained in dyes extracted from pandan leaves are consistent
with previously reported findings.
ACKNOWLEDGMENTS
This study was supported by the National University of Malaysia (FRGS/1/2014/Sg06/UKM-D/P
2014) and the Solar Energy Research Institute (ICONIC-2013-006). Mahmoud A.M. Al-Alwani would
like to thank the College of Education of Pure Sciences and Ibn Al-Haitham of the University of
Baghdad.
References
1. M. Sokolsk and J. Cirák, Materials and Processes, Acta Electrotech. Inform., 10 (2010) 78.
2. C.J. Barbe, F. Arendse, P. Comte, M. Jirousek, F. Lenzmanne and V. Shklover, J. Am. Ceram.
Soc., 80(1997)3157.
3. Y. Li, S.H. Ku, S.M. Chen, M.A. Ali and F.M.A. Alhamed, Int. J. Electrochem. Sci., 8 (2013)1237.
4. C. Ruikui, Y. Xichuan, T. Haining and S. Licheng, J Photochem. Photobiol. A Chemistry, 189
(2007) 295.
5. H. Chang and Y. J. Lo, Sol. Energy, 84 (2010) 1833.
6. H. Zhou, W. Liqiong, G. Yurong and M. Tingli, J. Photochem. Photobiol. A Chemistry, 219 (2011)
188.
7. M. Grӓtzel, J. Photochem. Photobiol. C: Photochem. Rev., 4 (2003) 145.
8. M.M. Noor, M.H. Buraidah, S.N.F. Yusuf, M.A. Careem, S.R. Majid and A.K. Arof, Int. J.
Photoenergy, 2011 (2011) 5 pages.
9. D. Yu, Z. Guoliang, L. Shuang, G. Baosheng and H. Fang, Int. J. Hydrogen Energy, 2013 (2013)
102.
10. M.R. Narayan, Review, Renewable Sustainable Energy Rev. 16 (2012) 208.
11. M. Grӓtzel, Nature, 414 (2001) 338.
12. V. Shanmugan, M. Subbaiah, A. Sambandam and M. Ramaswamy, Spectrochem. Acta, Part A, 104
(2013) 35.
13. K. Wongcharee, V. Meeyoo and S. Chavadej, Sol. Energy Mater. Sol. Cells, 91 (2007) 566.
14. S. Kim, J.K. Lee, S.O. Kang, J. Ko, J.H. Yum, S. Fantacci, F.D. Angelis, D.D. Censo, M.A.K.
Nazeeruddin and M. Grätzel, J. Am. Chem. Soc. 128 (2006) 16701.
15. M. Shahid, S. Islam and F. Mohammad, J. Cleaner Prod., 53 (2013) 310.
16. S. Hao, J. Wu, Y. Huang and J. Lin, Sol. Energy, 80 (2006) 209.
Int. J. Electrochem. Sci., Vol. 12, 2017
760
17. H. Chang, H.M. Wu, T.L. Chen, K.D. Huang, C.S. Jwoand and Y.J. Lo, J. Alloys Compd., 495
(2010) 606.
18. K.H. Park, K.T. Young, P.J. Young , J.E. Mei , Y.S. Ho, C.D. Young and L.T. Wook, Dyes Pigm.,
96 (2013) 595.
19. L.L. Tobin, T. O’Reilly, D. Zerulla and J.T. Sheridan, Optik - International Journal for Light and
Electron Optics, 122 (2011) 1225.
20. M.A.M. Al-Alwani, A.B. Mohamad, A.A.H. Kadhum and N.A. Ludin, Asian J. Chem., 26(2014)
6285.
21. S. Furukawa, H. Iino, T. Iwamoto, K. Kukita and S. Yamauchi, Procedia chem., 518 (2009) 526.
22. C.G. Kuo, J. S. Bee and J. Chin. Chem. Soc., 58 (2011) 186.
23. G. Calogero, G.D. Marco, S. Cazzanti, S. Caramori, R. Argazzi, A.D. Carlo, and C.A. Bignozzi,
Int. J. Mol. Sci., 11 (2010) 254.
24. P. Luo, H. Niu, G. Zheng, X. Bai, M. Zhang and W. Wang, Spectrochim. Acta Part A, 74 (2009)
936.
25. E.M. Abdou, H.S. Hafez, E. Bakir and M.S.A. Abdel-Mottaleb, Spectrochem. Acta Part A, 115
(2013) 202.
26. K.V. Hemalatha, S.N. Karthick, C.J. Raj, N.Y. Hong, S.K. Kim and H.J. Kim, Spectrochim. Acta
Part A, 96 (2012) 305.
27. E. Yamazaki, M. Murayama, N. Nishikawa, N. Hashimoto, M. Shoyama and O. Kurita, Sol.
Energy, 81 (2007) 512.
28. K. Yasushi, K. Yoshinori and N. Hiroyoshi, Molecules, 17 (2012) 2188.
29. G. Calogero, J.H. Yum, A. Sinopoli, G.D. Marco, M. Grätzel and M.K. Nazeeruddin, Sol. Energy,
86 (2012) 1563.
30. O.P.S. Rebecca, A. N. Boyce and S. Chandran, Afr. J. Biotechnol., 9 (2010) 1450.
31. J.P.J. Marais, B. Deavours, R.A Dixon and D. Ferreira, Springer, Columbus, Ohio, USA, 2006, p.
1-46.
32. P.M. Sirimanne, M.K.I. Senevirathna, E.V.A. Premalal, P.K.D.D.P. Pitigala, V. Sivakumar and K.
Tennakone, J. Photochem. Photobiol. A, 77 (2006) 324.
33. R. Espinosa, I. Zumeta, J.L. Santana, F. Martinez-Luzardo, , B. Gonzalez, S. Docteur and E.Vigil,
Sol. Energ. Mat. Sol. Cells, 85 (2005) 359.
34. N.A. Ludin, M.A.M. Al-Alwani, A.B. Mohamad, A.A.H. Kadhum, K. Sopian and N.S. Abdul-
Karim, Renewable Sustainable Energy Rev. 31 (2014) 386.
35. G. Calogero, G.D. Marco, S. Caramori, S. Cazzanti, R. Argazzi and C.A. Bignozzi, Energy
Environ. Sci., 2 (2009) 1162.
36. M. Ikegami, M. Ozeki, Y. Kijitori and T. Miyasaka, Electrochem, 76 (2008) 140.
37. X.F. Wang, J. Xiang , P. Wang, Y. Koyama , S. Yanagida, Y. Wada , K. Kamada, S.I. Sasaki and
H. Tamiaki, Chem. Phys. Litter, 408 (2005) 409.
38. S. Porrarud and A. Pranee, Int. Food Research J., 17 (2010) 1031.
39. V. Laksanalamai and S. Ilangantileke, Cereal Chemistry, 70 (1993) 381.
40. U. Wissgott and K. Bortlik, Trends Food Sci. Technol., 7 (1996) 289.
41. T. Pradubsang, T. Amornsakchai and U. Asawapirom, J. Microsc. Soc. Thailand 4 (2011) 130.
42. G.R.A. Kumara, S. Kaneko, M. Okuya, B.O. Agyeman, A. Konno and K.T. ennakone, Sol. Energy
Mater. Sol. Cells, 90 (2006) 1220.
43. S. Ananth, T. Arumanayagam, P. Vivek and P. Murugakoothan, Optik - International Journal for
Light and Electron Optics, 125 (2014) 495.
44. M.A.M. Al-Alwani, A.B. Mohamad, A.A.H. Kadhum and N.A. Ludin, Spectrochim. Acta Part A,
138 (2015) 130.
45. R. Jose, V. Thavasi and S. Ramakrishna, Journal of the American Ceramic Society 92 (2009) 289.
46. R. Syafinar, N. Gomesh, M. Irwanto, M. Fareq, and Y.M. Irwan, ARPN J. Eng. Appl. Scien.,
10(2015) 1-8.

Int. J. Electrochem. Sci., Vol. 12, 2017
761
47. R. Ramamoorthy, N. Radha, G. Maheswari, S. Anandan, S. Manoharan and R.V. Williams, J Appl
Electrochem 46(2016) 929–941.
48. W. Maiaugree, S. Lowpa, M. Towannang, P. Rutphonsan, A. Tangtrakarn, S. Pimanpang, P.
Maiaugree, N. Ratchapolthavisin, W. Sang-Aroon, W. Jarernboon and V. Amornkitbamrung,
Scientific Reports 5(2015) 15230.
49. Z. Iqbal, W.-Q. Wu, D.-B. Kuang, L. Wang, H. Meier, and D. Cao, Dyes Pigments 96(2013) 722.
50. R. Kushwaha, P. Srivastava and L. Bahadur, J. Energy (2013) 1-8.
© 2017 The Authors. Published by ESG (www.electrochemsci.org). This article is an open access
article distributed under the terms and conditions of the Creative Commons Attribution license
(http://creativecommons.org/licenses/by/4.0/).