Embed Size (px)
Citation preview
Natural Disturbance Approaches
to Forest Land Management
Review of Day 1
Questions / Parking Lot
October 6-8, 2009
Hinton, Alberta
Natural Disturbance Approaches
to Forest Land Management
Day 2, Part 1: Exactly What is a Natural
Disturbance “Approach”?
October 6-8, 2009
Hinton, Alberta

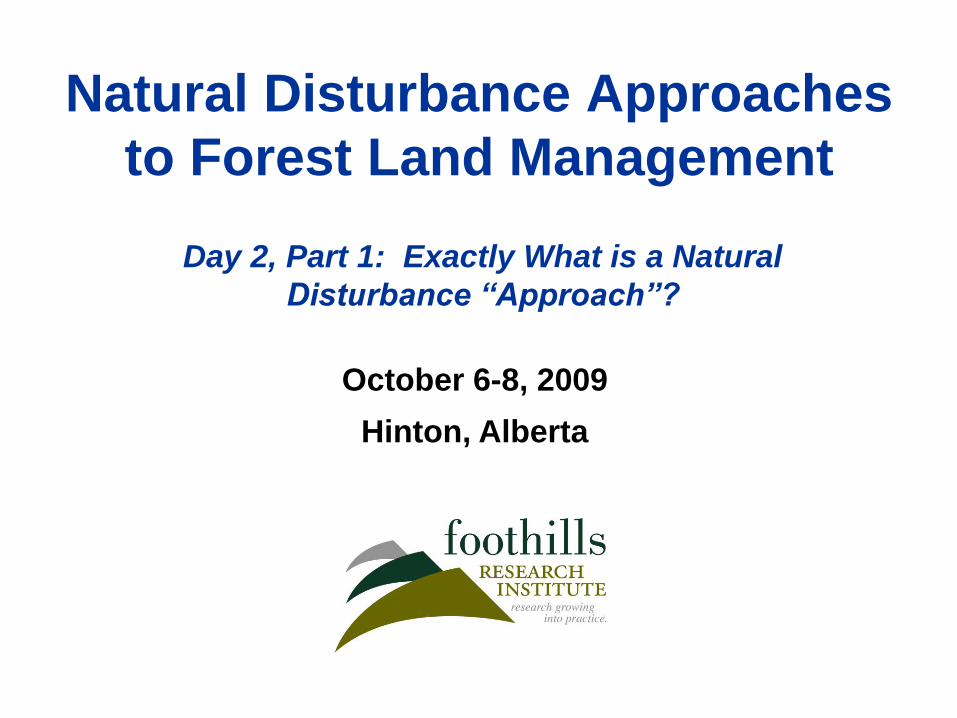
There is no Single Approach
Ha-haaa!!
Mintzberg (1994) The Rise and Fall of Strategic Planning.
Unrealized Strategy
FORMS OF STRATEGY*
Realized Strategy
Standard Operating
Procedures
Scenario Planning
Emergent Strategies
Values and Goals
Forest Management
Program
Public Policy
FMA Licenses
CCFM C & I
Regulations
Current Forest
Condition
Scientific Principles
Public Input
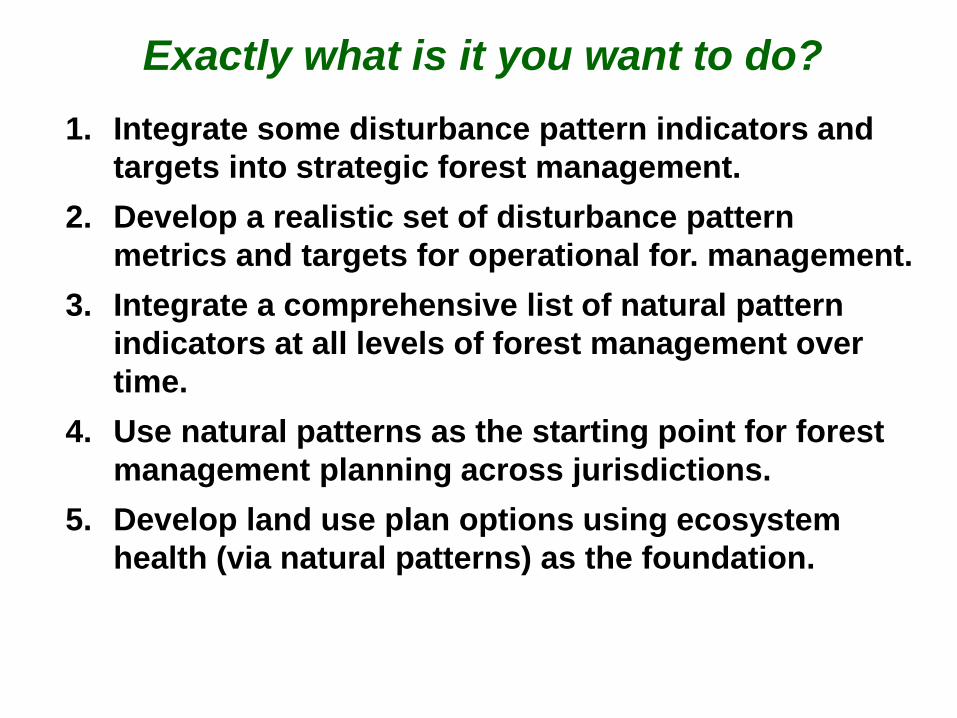
Exactly what is it you want to do?
1. Integrate some disturbance pattern indicators and
targets into strategic forest management.
2. Develop a realistic set of disturbance pattern
metrics and targets for operational for. management.
3. Integrate a comprehensive list of natural pattern
indicators at all levels of forest management over
time.
4. Use natural patterns as the starting point for forest
management planning across jurisdictions.
5. Develop land use plan options using ecosystem
health (via natural patterns) as the foundation.
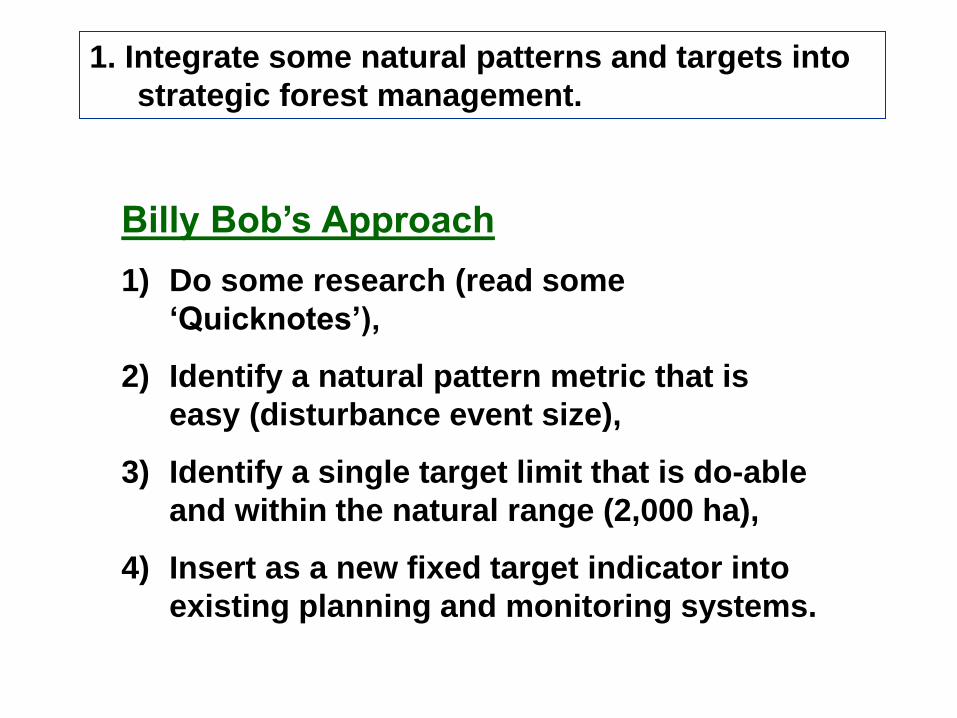
Billy Bob’s Approach
1) Do some research (read some
‘Quicknotes’),
2) Identify a natural pattern metric that is
easy (disturbance event size),
3) Identify a single target limit that is do-able
and within the natural range (2,000 ha),
4) Insert as a new fixed target indicator into
existing planning and monitoring systems.
1. Integrate some natural patterns and targets into
strategic forest management.
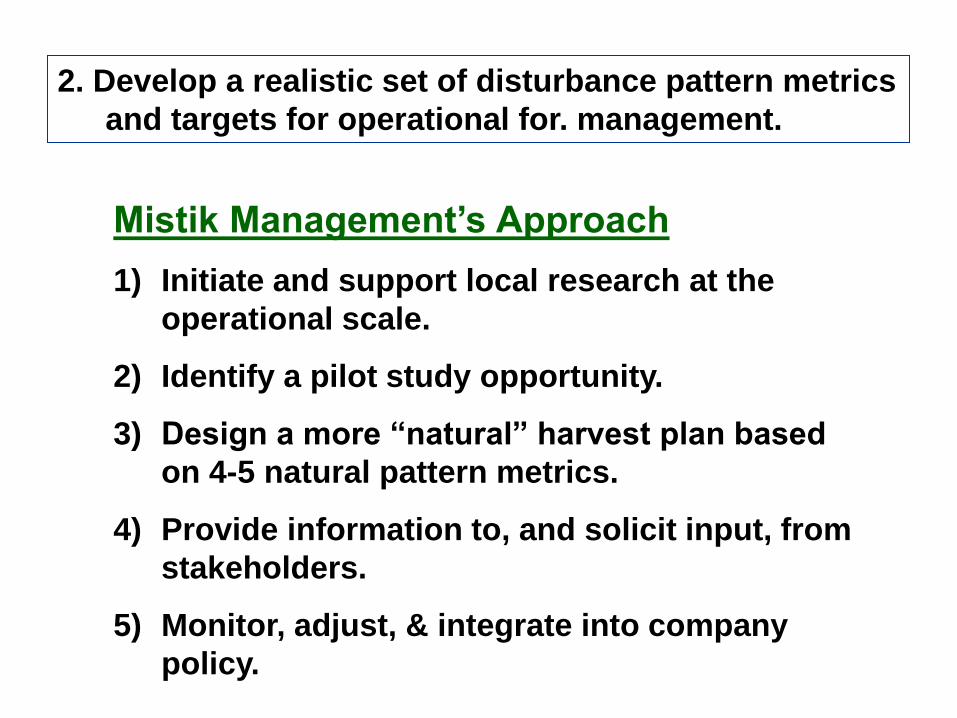
2. Develop a realistic set of disturbance pattern metrics
and targets for operational for. management.
Mistik Management’s Approach
1) Initiate and support local research at the
operational scale.
2) Identify a pilot study opportunity.
3) Design a more “natural” harvest plan based
on 4-5 natural pattern metrics.
4) Provide information to, and solicit input, from
stakeholders.
5) Monitor, adjust, & integrate into company
policy.
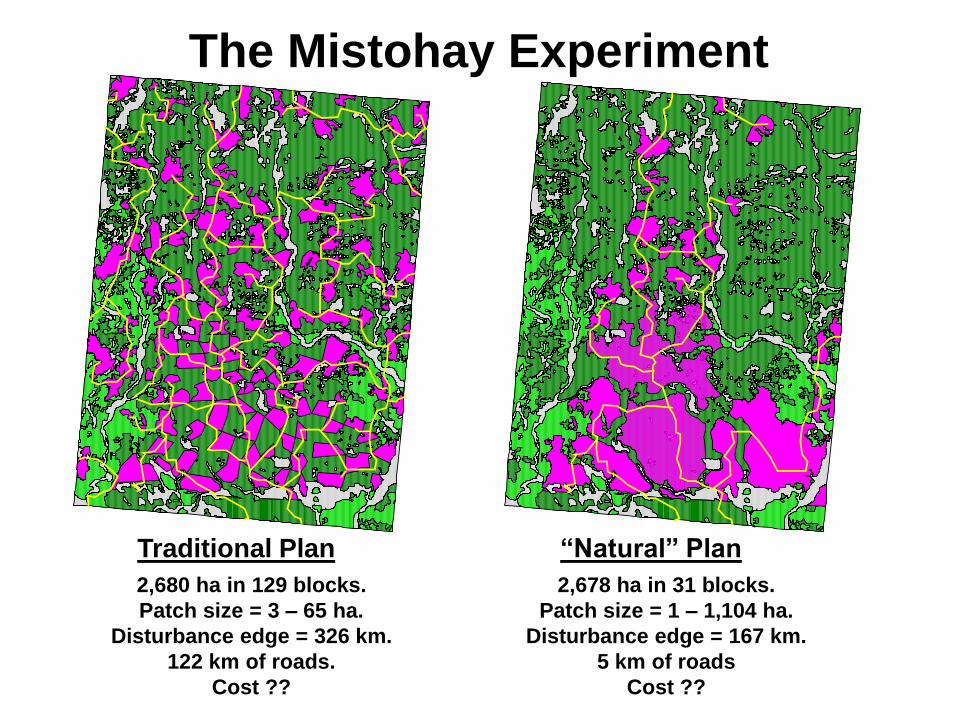
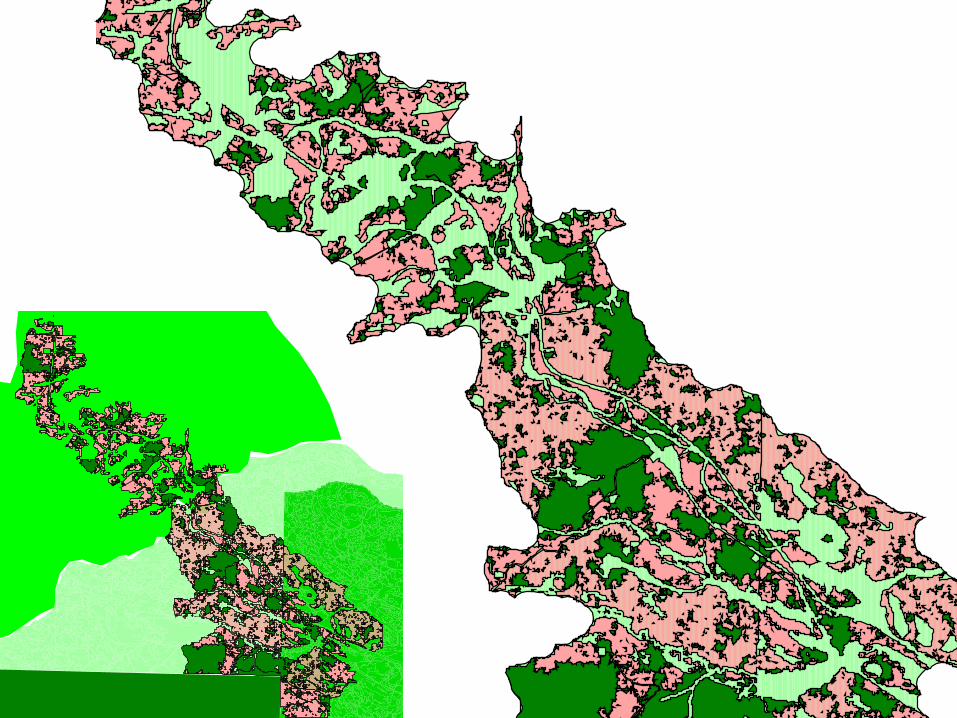
The Mistohay Experiment
Traditional Plan “Natural” Plan
2,678 ha in 31 blocks.
Patch size = 1 – 1,104 ha.
Disturbance edge = 167 km.
5 km of roads
Cost ??
2,680 ha in 129 blocks.
Patch size = 3 – 65 ha.
Disturbance edge = 326 km.
122 km of roads.
Cost ??
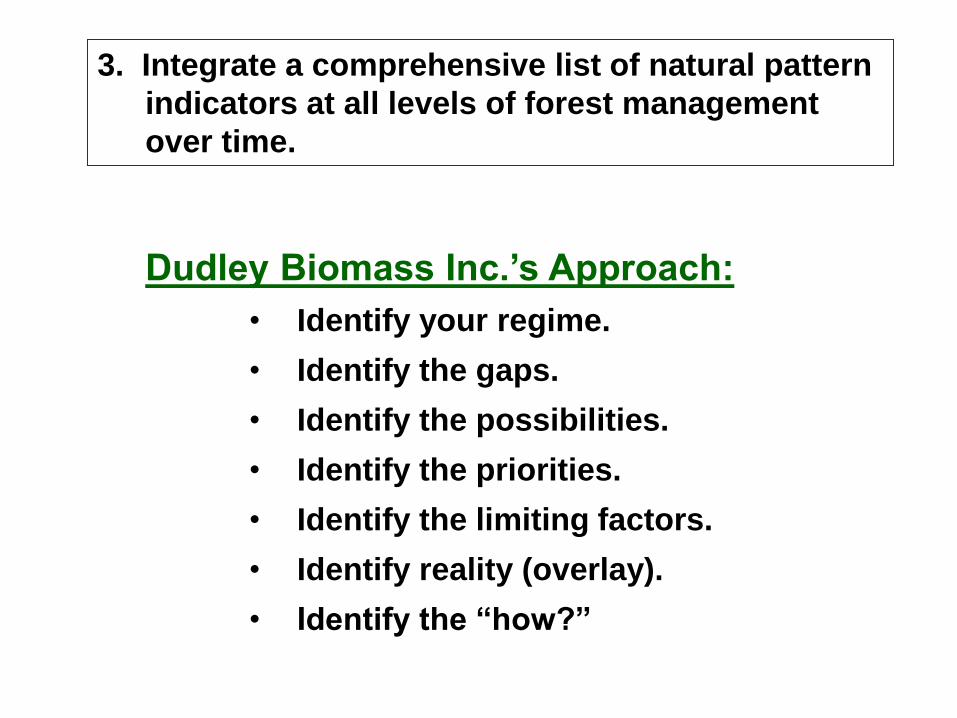
3. Integrate a comprehensive list of natural pattern
indicators at all levels of forest management
over time.
Dudley Biomass Inc.’s Approach:
• Identify your regime.
• Identify the gaps.
• Identify the possibilities.
• Identify the priorities.
• Identify the limiting factors.
• Identify reality (overlay).
• Identify the “how?”
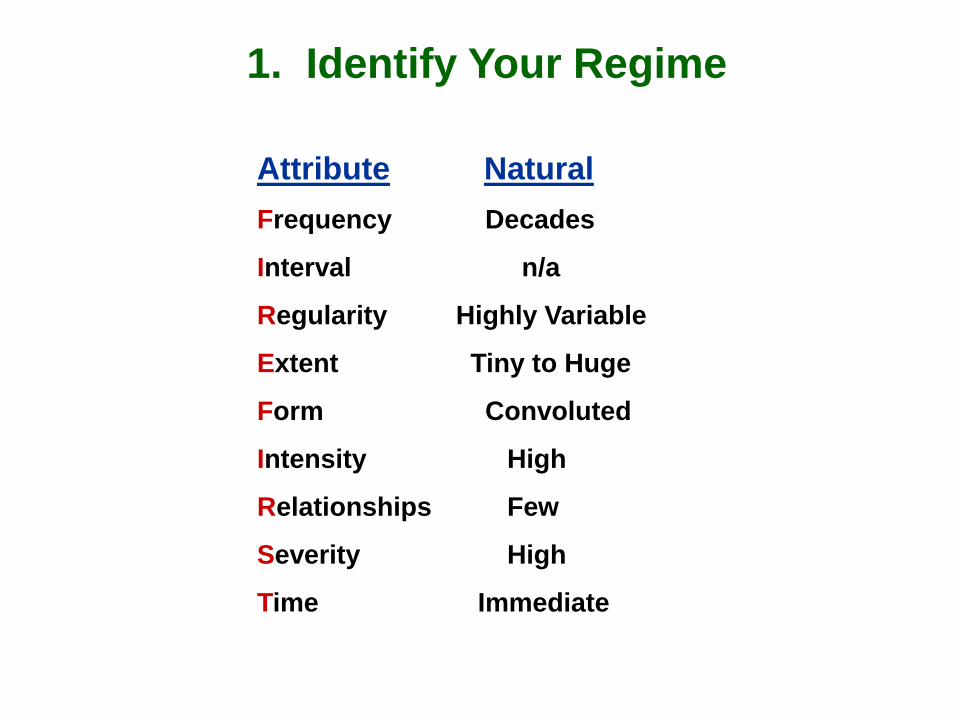
Attribute Natural
Frequency Decades
Interval n/a
Regularity Highly Variable
Extent Tiny to Huge
Form Convoluted
Intensity High
Relationships Few
Severity High
Time Immediate
1. Identify Your Regime
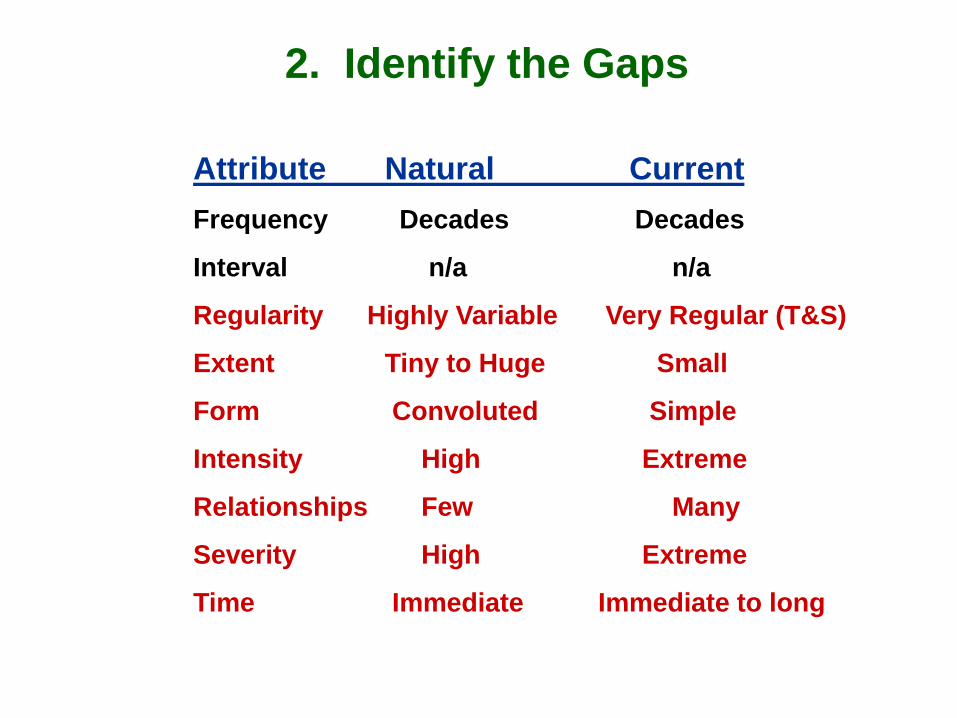
2. Identify the Gaps
Attribute Natural Current
Frequency Decades Decades
Interval n/a n/a
Regularity Highly Variable Very Regular (T&S)
Extent Tiny to Huge Small
Form Convoluted Simple
Intensity High Extreme
Relationships Few Many
Severity High Extreme
Time Immediate Immediate to long
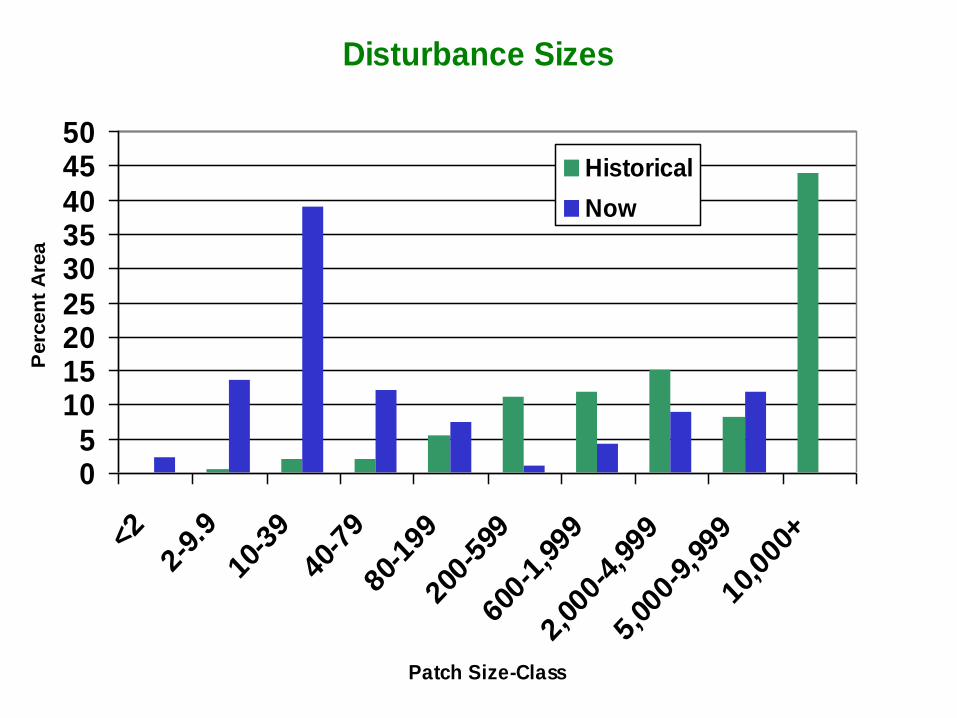
Disturbance Sizes
05
101520253035404550
<2
2-9.
9
10-3
9
40-7
9
80-1
99
200-
599
600-
1,99
9
2,00
0-4,
999
5,00
0-9,
999
10,0
00+
Patch Size-Class
Perc
en
t A
rea
Historical
Now
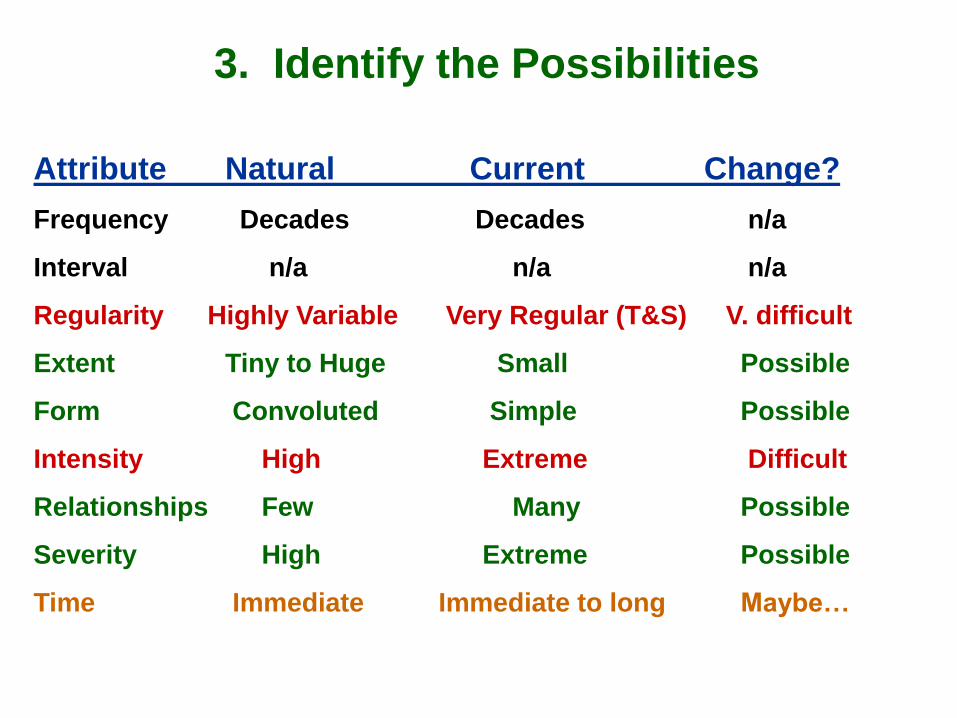
3. Identify the Possibilities
Attribute Natural Current Change?
Frequency Decades Decades n/a
Interval n/a n/a n/a
Regularity Highly Variable Very Regular (T&S) V. difficult
Extent Tiny to Huge Small Possible
Form Convoluted Simple Possible
Intensity High Extreme Difficult
Relationships Few Many Possible
Severity High Extreme Possible
Time Immediate Immediate to long Maybe…
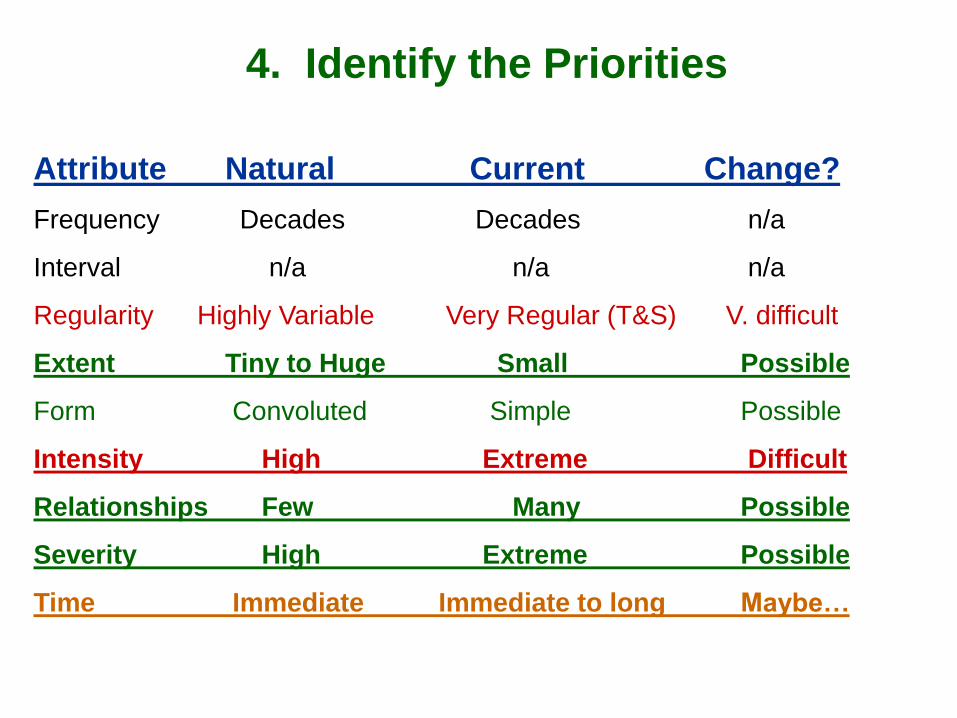
4. Identify the Priorities
Attribute Natural Current Change?
Frequency Decades Decades n/a
Interval n/a n/a n/a
Regularity Highly Variable Very Regular (T&S) V. difficult
Extent Tiny to Huge Small Possible
Form Convoluted Simple Possible
Intensity High Extreme Difficult
Relationships Few Many Possible
Severity High Extreme Possible
Time Immediate Immediate to long Maybe…
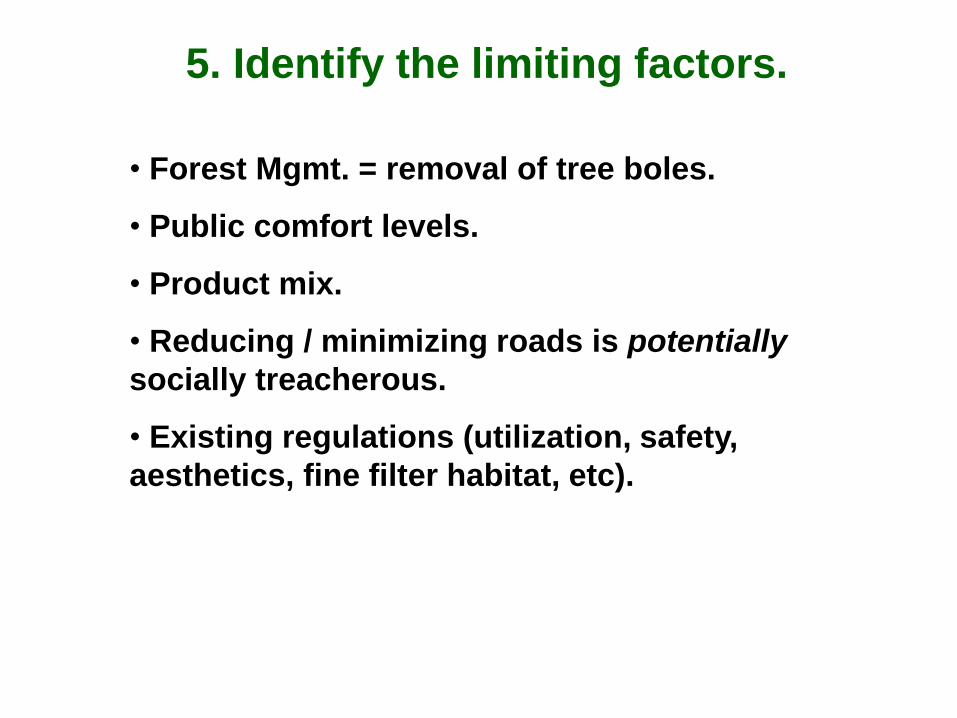
5. Identify the limiting factors.
• Forest Mgmt. = removal of tree boles.
• Public comfort levels.
• Product mix.
• Reducing / minimizing roads is potentially
socially treacherous.
• Existing regulations (utilization, safety,
aesthetics, fine filter habitat, etc).
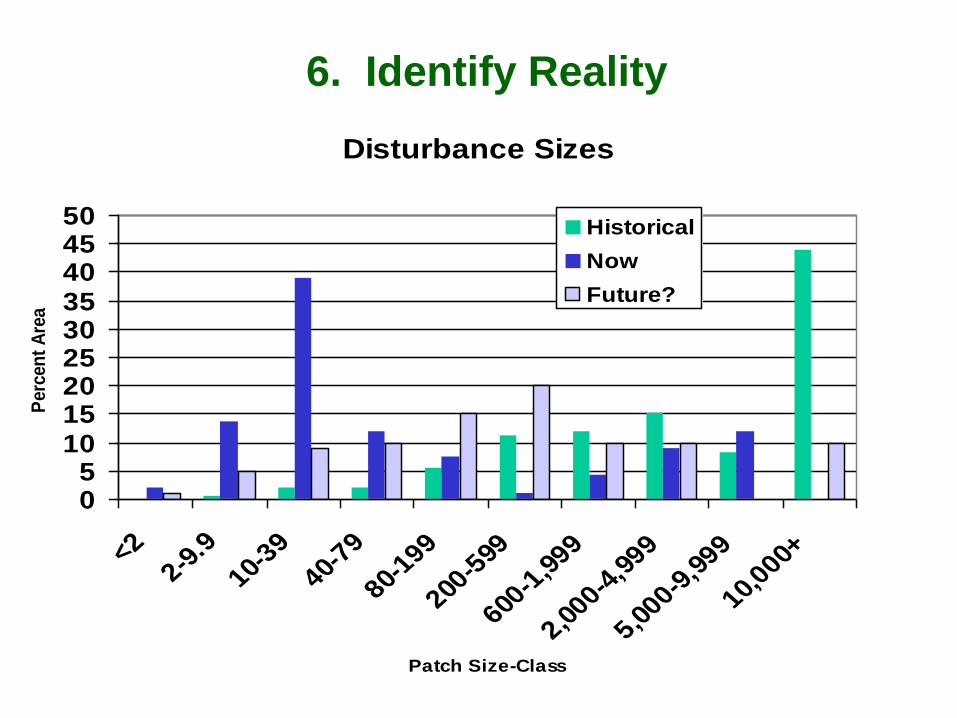
6. Identify Reality
Disturbance Sizes
05
101520253035404550
<22-9
.9
10-39
40-79
80-199
200-5
99
600-1
,999
2,000-4
,999
5,000-9
,999
10,000+
Patch Size-Class
Perc
en
t A
rea
Historical
Now
Future?
7. Identify the “how?”
• Replace the traditional block size upper
limits with a range of disturbance size targets
based on step 6.
• Add in an indicator for total residual levels
using quartiles of NRV from research.
• etc….
4. Use natural patterns as the starting point for
forest management planning across
jurisdictions.
Use available NRV knowledge as the foundation
for a cross-jurisdictional disturbance plan
implemented within the existing planning
systems, policies, and practices.
For Example: The Hwy40 North
Demonstration Project
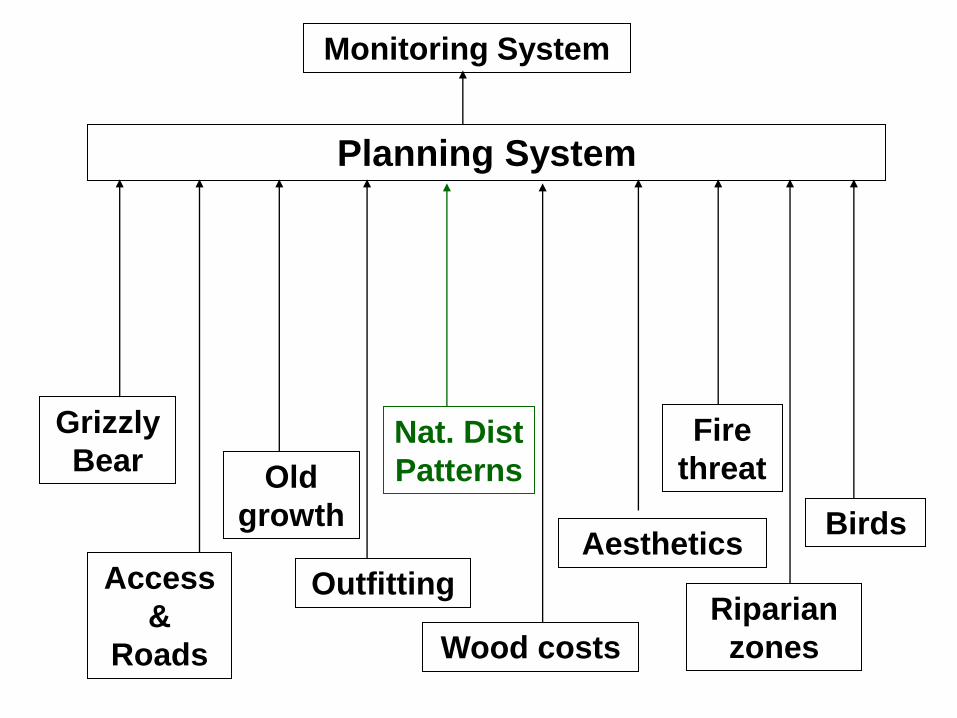
Access
&
Roads Wood costs
Monitoring System
Outfitting
Grizzly
Bear
Aesthetics
Old
growth
Fire
threat Nat. Dist
Patterns
Birds
Riparian
zones
Planning System
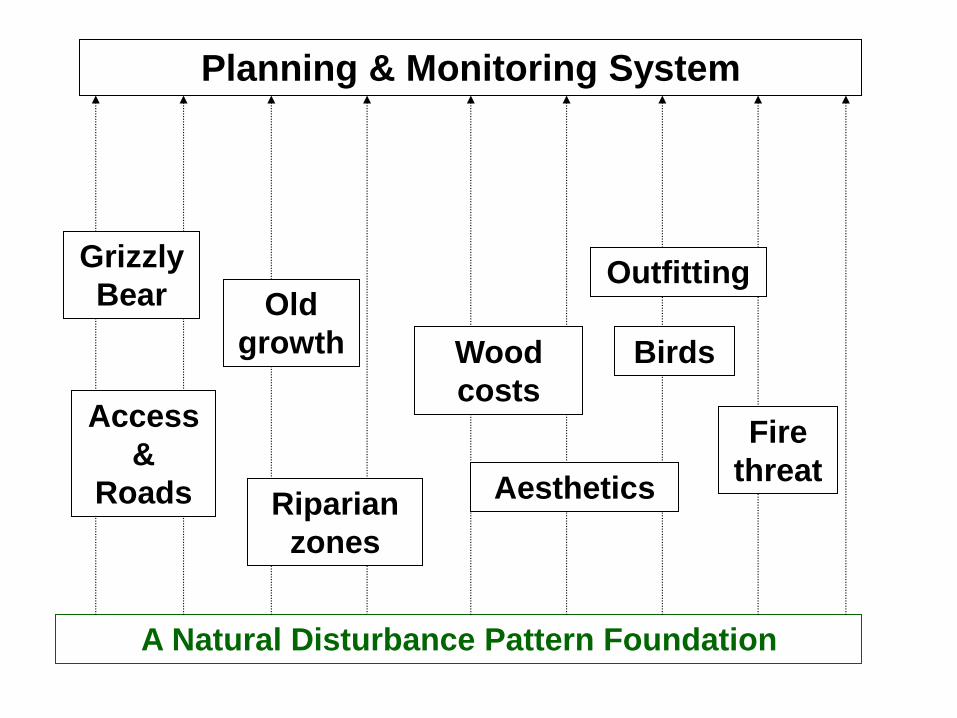
A Natural Disturbance Pattern Foundation
Planning & Monitoring System
Fire
threat
Access
&
Roads
Wood
costs
Outfitting Grizzly
Bear
Aesthetics
Old
growth Birds
Riparian
zones
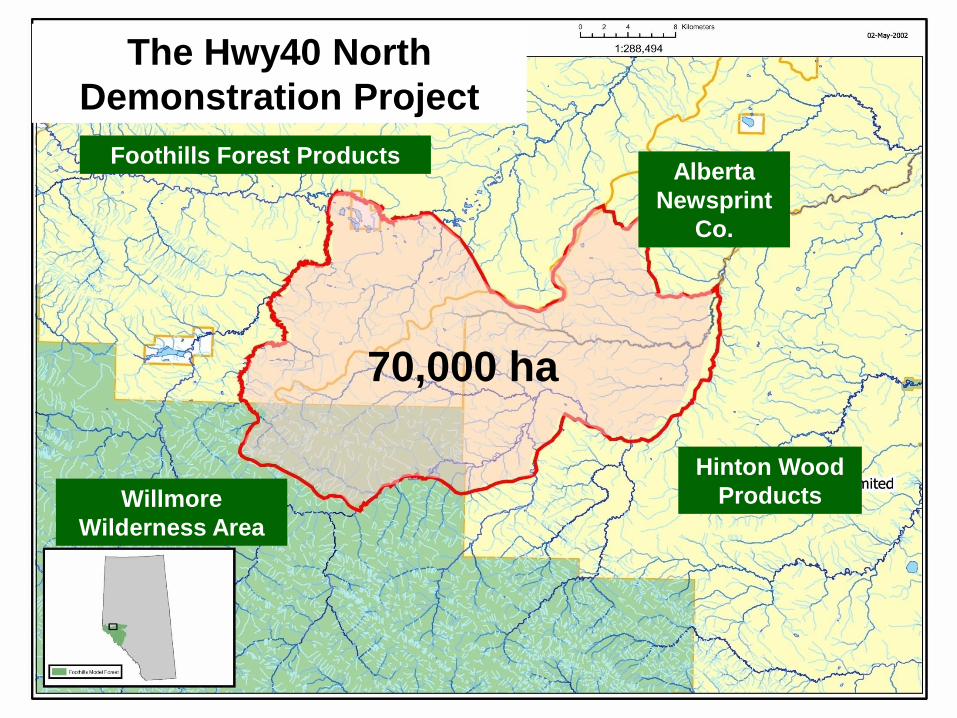
70,000 ha
Hinton Wood
Products
Alberta
Newsprint
Co.
Foothills Forest Products
Willmore
Wilderness Area
The Hwy40 North
Demonstration Project
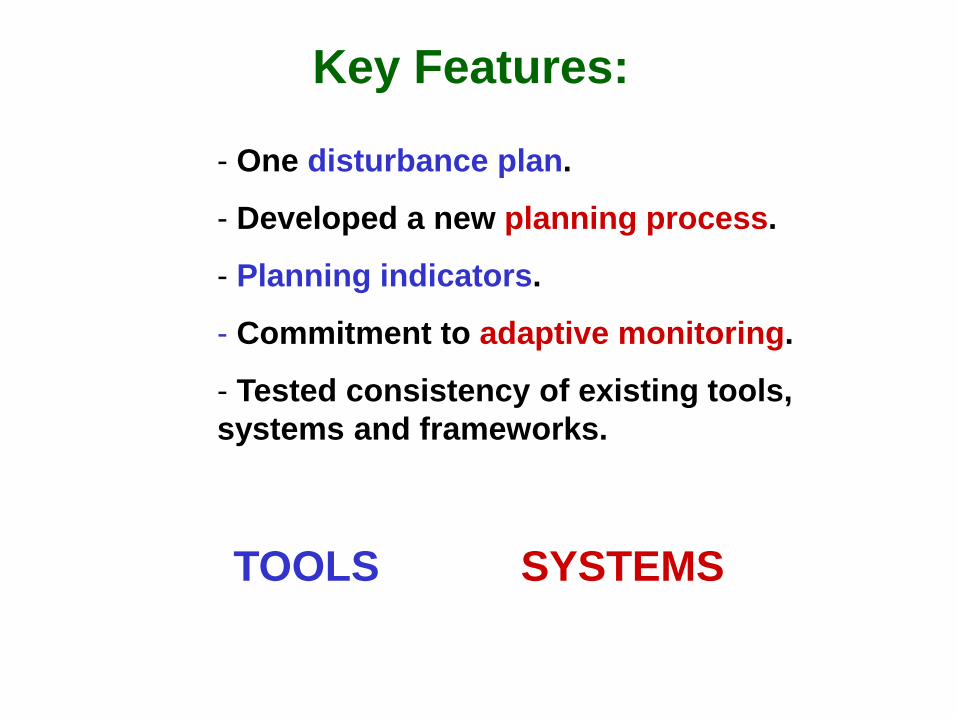
- One disturbance plan.
- Developed a new planning process.
- Planning indicators.
- Commitment to adaptive monitoring.
- Tested consistency of existing tools,
systems and frameworks.
Key Features:
TOOLS SYSTEMS
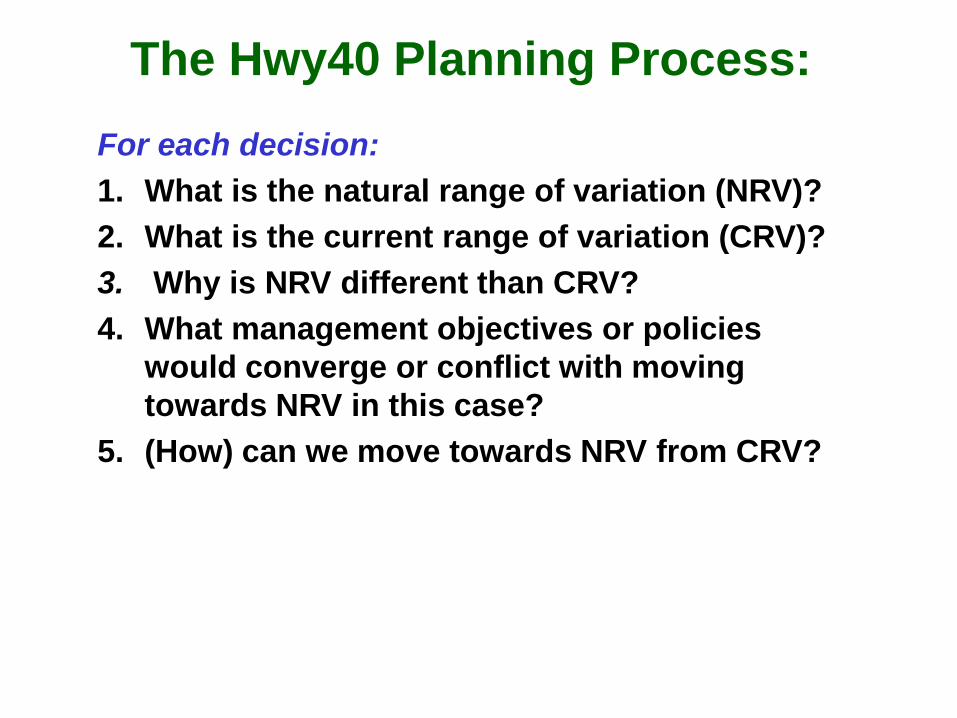
For each decision:
1. What is the natural range of variation (NRV)?
2. What is the current range of variation (CRV)?
3. Why is NRV different than CRV?
4. What management objectives or policies
would converge or conflict with moving
towards NRV in this case?
5. (How) can we move towards NRV from CRV?
The Hwy40 Planning Process:
Status:
• The plan has a large number of natural
features.
• Plans for harvesting and burning are nearly
done, but in limbo.
• Limited influence on activities of non-forest
management agencies.
• Has its own monitoring strategy & funding.
• Conceptual buy in was high, but some
partners balked at the output / team decision.
5. Develop land use plan options using ecosystem
health (via natural patterns) as the foundation.
The “Healthy Landscapes” FRI Project
• Conceptual backdrop for generating “healthy” land use
disturbance design options at sub-regional scales.
• Independent from, but linked to the LU folks.
• Land, water, forest, non-forest – everything.
• Pilot study 10 million ha, 20 partners, so far.
• Creating some supporting Tools and Systems.
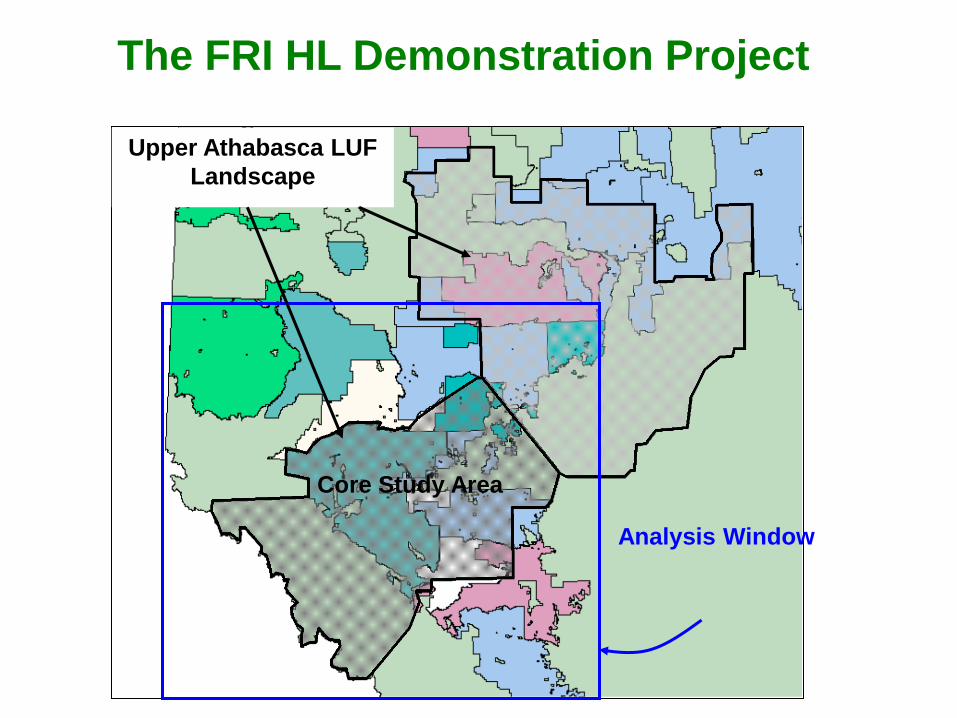
Core Study Area
Upper Athabasca LUF
Landscape
Analysis Window
The FRI HL Demonstration Project
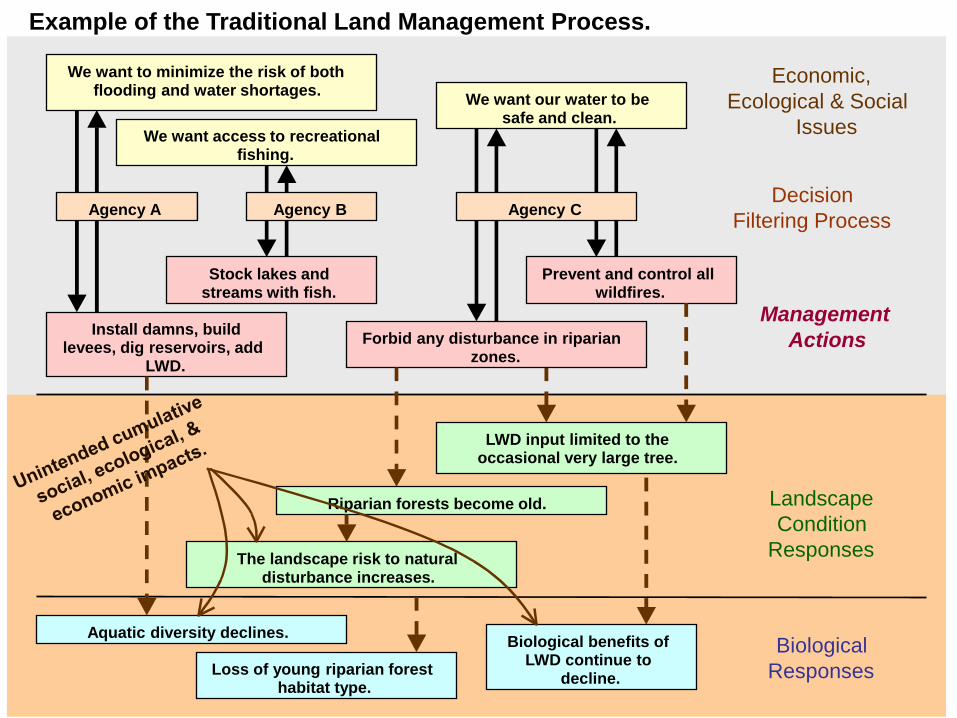
Install damns, build levees, dig reservoirs, add
LWD.
Stock lakes and streams with fish.
Aquatic diversity declines.
Management
Actions
We want to minimize the risk of both flooding and water shortages.
We want access to recreational fishing.
We want our water to be safe and clean.
Economic,
Ecological & Social
Issues
Forbid any disturbance in riparian zones.
Prevent and control all wildfires.
Loss of young riparian forest habitat type.
Biological
Responses
Riparian forests become old.
LWD input limited to the occasional very large tree.
Landscape
Condition
Responses The landscape risk to natural
disturbance increases.
Biological benefits of LWD continue to
decline.
Example of the Traditional Land Management Process.
Decision
Filtering Process Agency C Agency B Agency A
Install damns, build levees, dig reservoirs, add
LWD.
Stock lakes and streams with fish.
Aquatic diversity declines.
Management
Actions
We want to minimize the risk of both flooding and water shortages.
We want access to recreational fishing.
We want our water to be safe and clean.
Economic,
Ecological & Social
Issues
Forbid any disturbance in riparian zones.
Prevent and control all wildfires.
Loss of young riparian forest habitat type.
Biological
Responses
Riparian forests become old.
LWD input limited to the occasional very large tree.
Landscape
Condition
Responses The landscape risk to natural
disturbance increases.
Biological benefits of LWD continue to
decline.
Decision
Filtering Process Agency C Agency B Agency A
Management
Actions
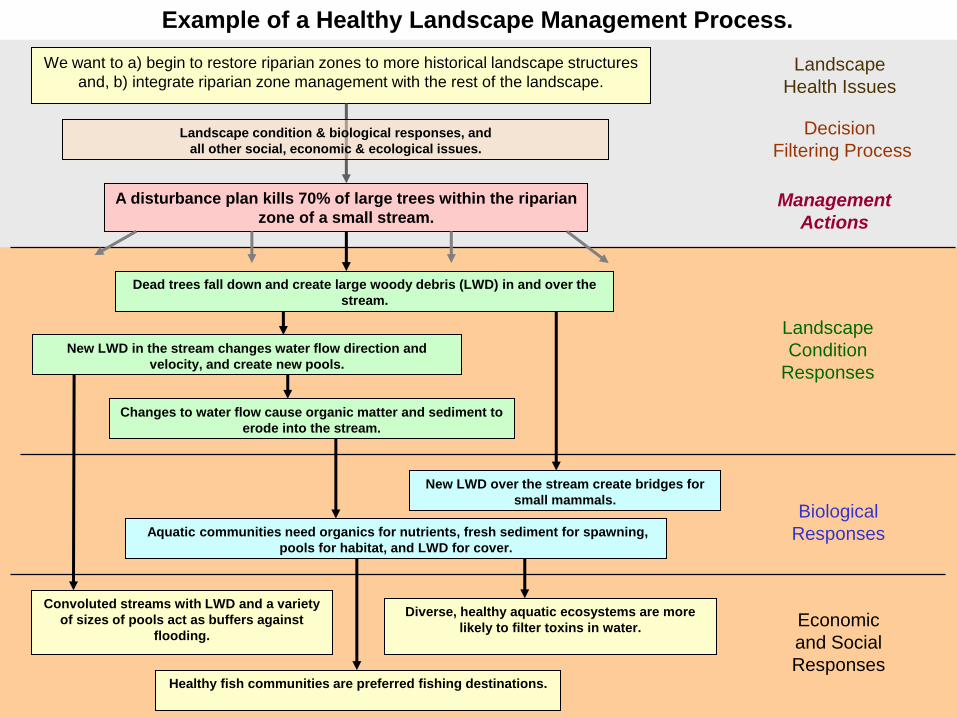
We want to a) begin to restore riparian zones to more historical landscape structures
and, b) integrate riparian zone management with the rest of the landscape. Landscape
Health Issues
Example of a Healthy Landscape Management Process.
Decision
Filtering Process
Landscape condition & biological responses, and
all other social, economic & ecological issues.
A disturbance plan kills 70% of large trees within the riparian
zone of a small stream.
Dead trees fall down and create large woody debris (LWD) in and over the
stream.
Aquatic communities need organics for nutrients, fresh sediment for spawning,
pools for habitat, and LWD for cover.
New LWD in the stream changes water flow direction and
velocity, and create new pools.
New LWD over the stream create bridges for
small mammals.
Convoluted streams with LWD and a variety
of sizes of pools act as buffers against
flooding.
Healthy fish communities are preferred fishing destinations.
Diverse, healthy aquatic ecosystems are more
likely to filter toxins in water.
Changes to water flow cause organic matter and sediment to
erode into the stream.
Landscape
Condition
Responses
Biological
Responses
Economic
and Social
Responses
(Adapted from: D.W. Andison, L. Van Damme, D. Hebert, T. Moore, R. Bonar, S. Boutin, and M.
Donnelly. 2009. The healthy landscape approach to land management. Foothills Research Institute
Natural Disturbance program, Hinton, Alberta. January, 2009.)
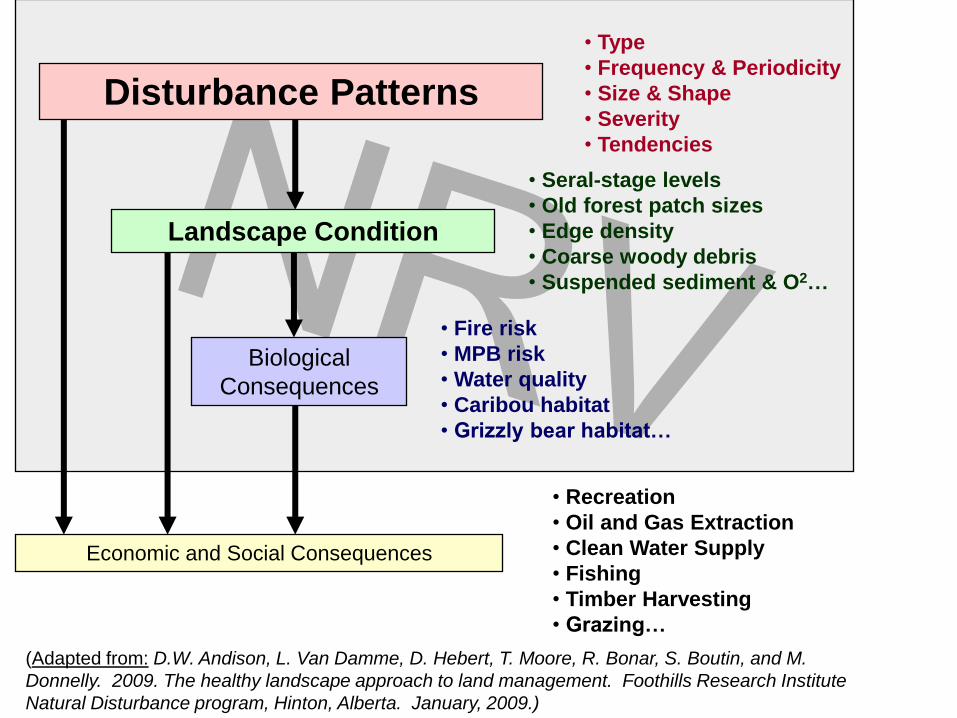
• Type
• Frequency & Periodicity
• Size & Shape
• Severity
• Tendencies
Economic and Social Consequences
• Recreation
• Oil and Gas Extraction
• Clean Water Supply
• Fishing
• Timber Harvesting
• Grazing…
• Seral-stage levels
• Old forest patch sizes
• Edge density
• Coarse woody debris
• Suspended sediment & O2…
• Fire risk
• MPB risk
• Water quality
• Caribou habitat
• Grizzly bear habitat…
Disturbance Patterns
Landscape Condition
Biological
Consequences
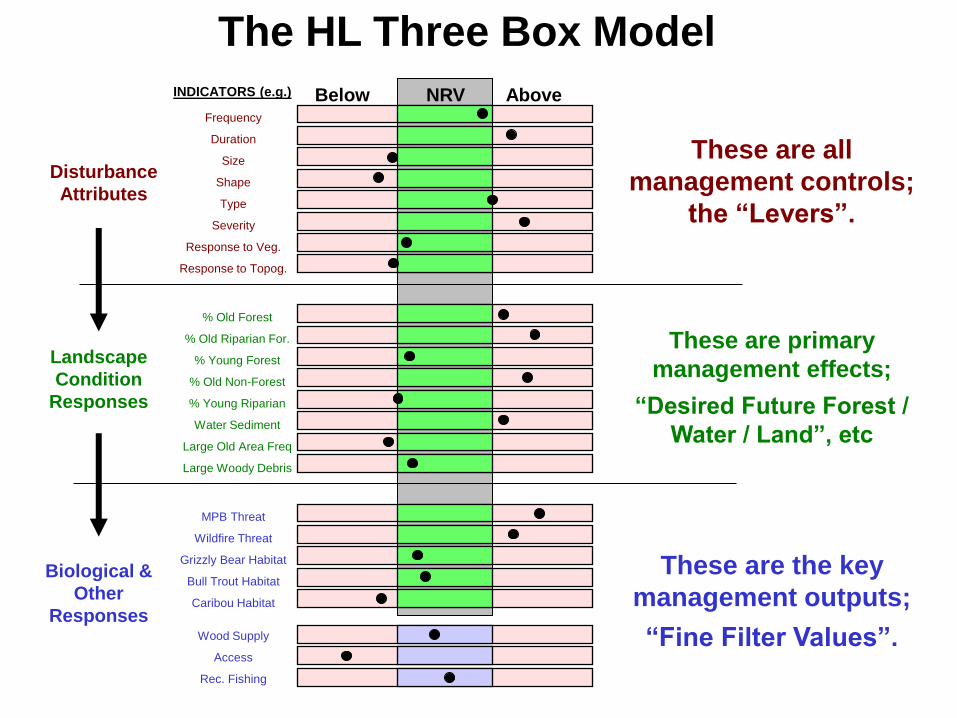
Frequency
Duration
Size
Shape
Type
Severity
Response to Veg.
Response to Topog.
MPB Threat
Wildfire Threat
Grizzly Bear Habitat
Bull Trout Habitat
Caribou Habitat
Wood Supply
Access
Rec. Fishing
% Old Forest
% Old Riparian For.
% Young Forest
% Old Non-Forest
% Young Riparian
Water Sediment
Large Old Area Freq
Large Woody Debris
Disturbance
Attributes
Landscape
Condition
Responses
Biological &
Other
Responses
These are all
management controls;
the “Levers”.
These are primary
management effects;
“Desired Future Forest /
Water / Land”, etc
These are the key
management outputs;
“Fine Filter Values”.
INDICATORS (e.g.) Below NRV Above
The HL Three Box Model
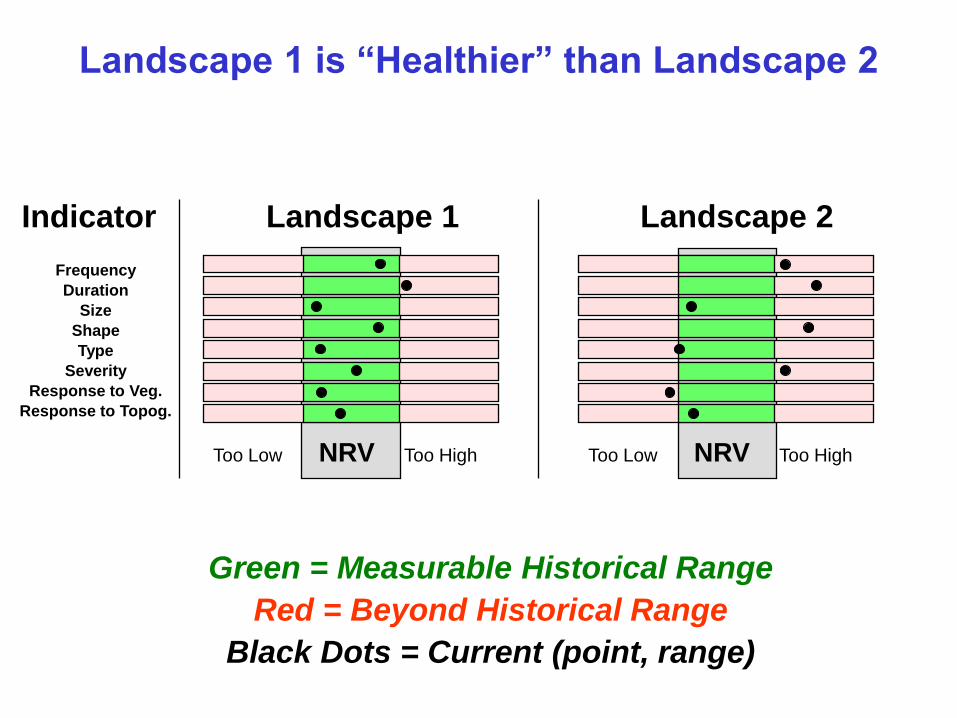
Indicator Landscape 1 Landscape 2
Too Low NRV Too High Too Low NRV Too High
Landscape 1 is “Healthier” than Landscape 2
Green = Measurable Historical Range
Red = Beyond Historical Range
Black Dots = Current (point, range)
Frequency
Duration
Size
Shape
Type
Severity
Response to Veg.
Response to Topog.
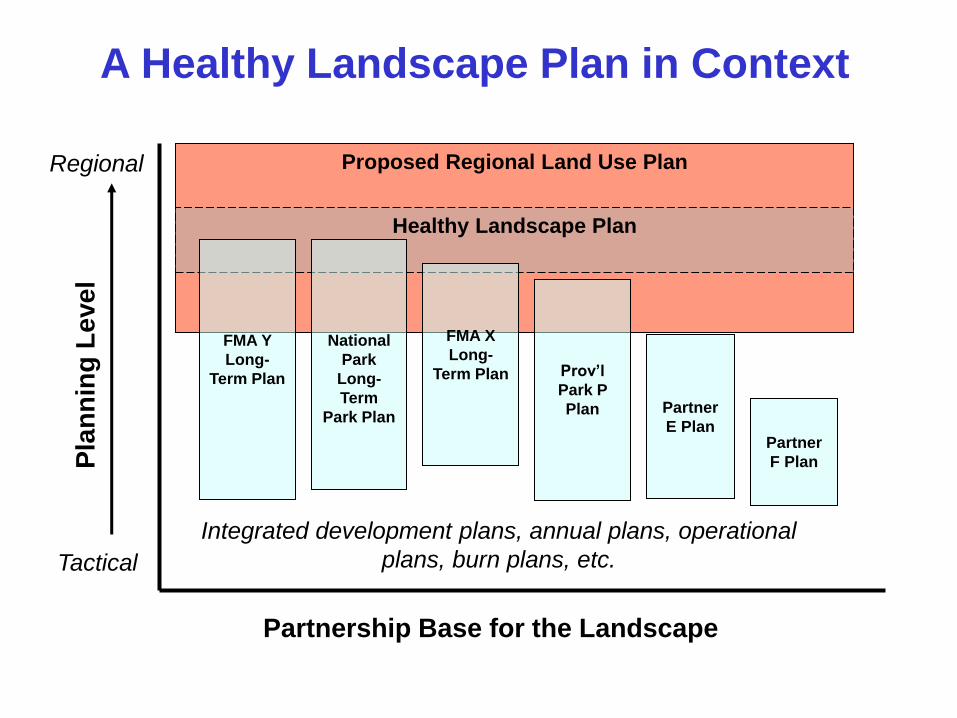
A Healthy Landscape Plan in Context
Proposed Regional Land Use Plan
Healthy Landscape Plan
FMA Y
Long-
Term Plan
FMA X
Long-
Term Plan
National
Park
Long-
Term
Park Plan
Prov’l
Park P
Plan
Partner
F Plan
Partner
E Plan
Integrated development plans, annual plans, operational
plans, burn plans, etc.
Partnership Base for the Landscape
Pla
nn
ing
Level
Tactical
Regional
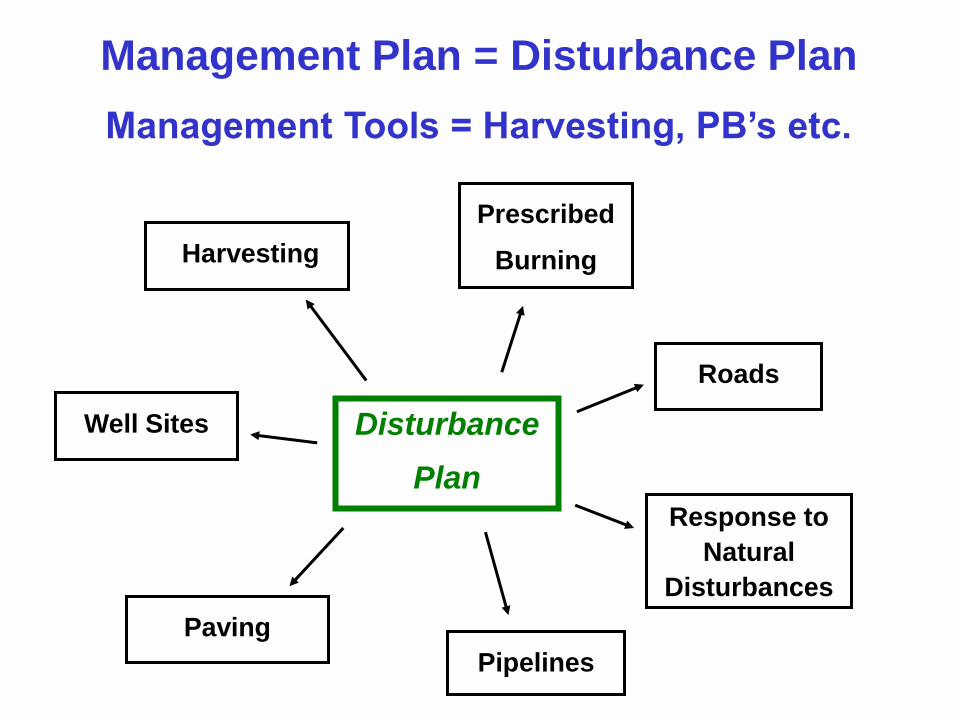
Disturbance
Plan
Harvesting
Prescribed
Burning
Roads
Well Sites
Paving
Response to
Natural
Disturbances
Pipelines
Management Plan = Disturbance Plan
Management Tools = Harvesting, PB’s etc.
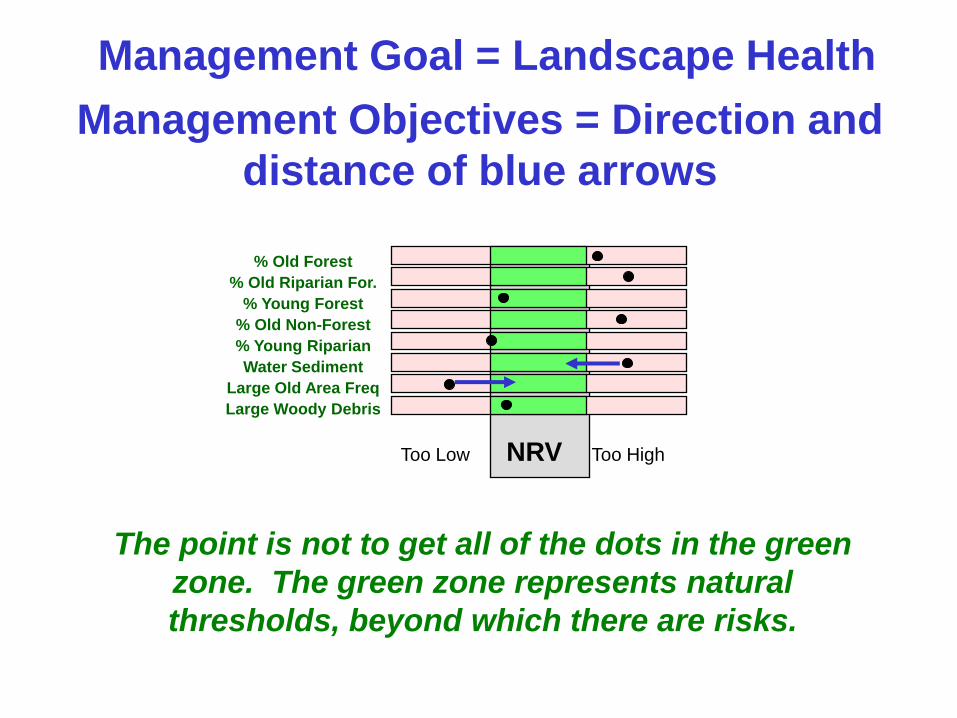
Too Low NRV Too High
The point is not to get all of the dots in the green
zone. The green zone represents natural
thresholds, beyond which there are risks.
Management Objectives = Direction and
distance of blue arrows
Management Goal = Landscape Health
% Old Forest
% Old Riparian For.
% Young Forest
% Old Non-Forest
% Young Riparian
Water Sediment
Large Old Area Freq
Large Woody Debris

Is any one of these “better”
than another?
![Long-Term Post-Disturbance Forest Recovery in the Greater ... · mapping forest disturbances across the United States [45–48], the ability of this approach to characterize post-disturbance](https://img.pdfslide.us/doc/110x75/5fbce943cad6ab277735ae83/long-term-post-disturbance-forest-recovery-in-the-greater-mapping-forest-disturbances.jpg)