Embed Size (px)
Citation preview
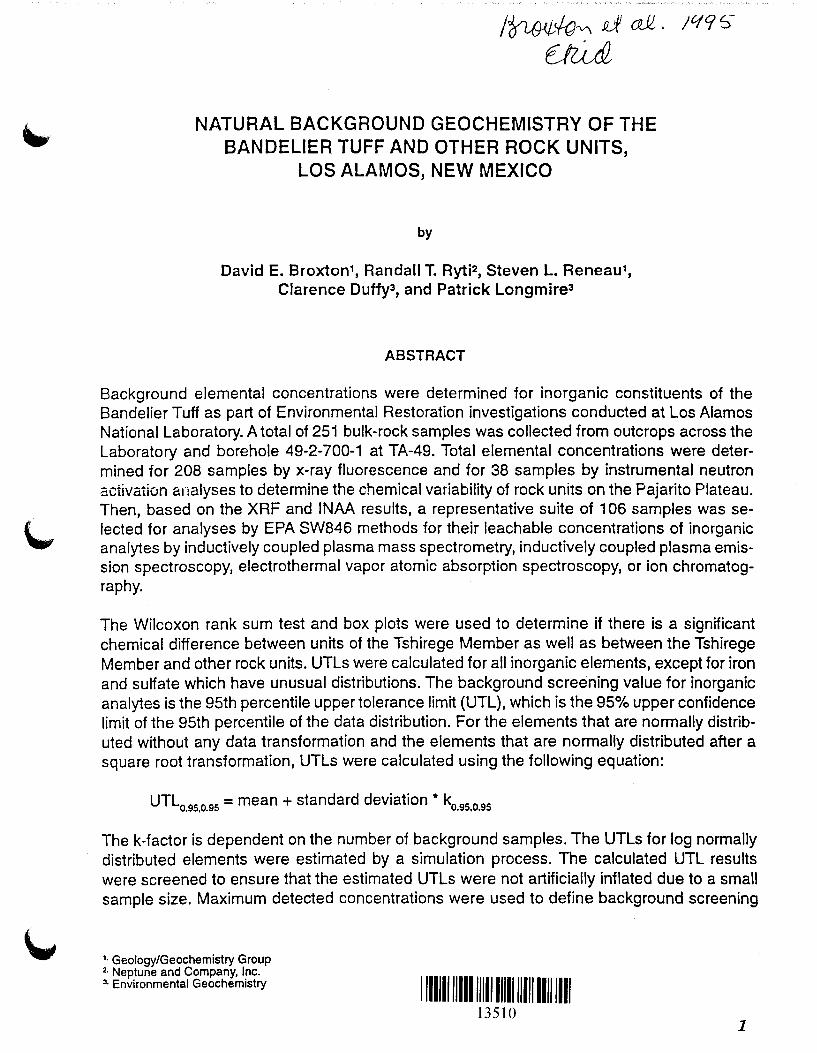
NATURAL BACKGROUND GEOCHEMISTRY OF THE BANDELIER TUFF AND OTHER ROCK UNITS,
LOS ALAMOS, NEW MEXICO
by
David E. Broxton1, Randall T. Ryti2, Steven L. Reneau1, Clarence Duffy3, and Patrick Longmire3
ABSTRACT
Background elemental concentrations were determined for inorganic constituents of the Bandelier Tuff as part of Environmental Restoration investigations conducted at Los Alamos National Laboratory. A total of 251 bulk-rock samples was collected from outcrops across the Laboratory and borehole 49-2-700-1 at TA-49. Total elemental concentrations were determined for 208 samples by x-ray fluorescence and for 38 samples by instrumental neutron activation analyses to determine the chemical variability of rock units on the Pajarito Plateau. Then, based on the XRF and INAA results, a representative suite of 106 samples was selected for analyses by EPA SW846 methods for their leachable concentrations of inorganic analytes by inductively coupled plasma mass spectrometry, inductively coupled plasma emission spectroscopy, electrothermal vapor atomic absorption spectroscopy, or ion chromatography.
The Wilcoxon rank sum test and box plots were used to determine if there is a significant chemical difference between units of the Tshirege Member as well as between the Tshirege Member and other rock units. UTLs were calculated for all inorganic elements, except for iron and sulfate which have unusual distributions. The background screening value for inorganic analytes is the 95th percentile upper tolerance limit (UTL), which is the 95% upper confidence limit of the 95th percentile of the data distribution. For the elements that are normally distributed without any data transformation and the elements that are normally distributed after a square root transformation, UTLs were calculated using the following equation:
UTLo.ss.o.ss = mean + standard deviation ... ko.ss.o.ss
The k-factor is dependent on the number of background samples. The UTLs for Jog normally distributed elements were estimated by a simulation process. The calculated UTL results were screened to ensure that the estimated UTLs were not artificially inflated due to a small sample size. Maximum detected concentrations were used to define background screening
1• Geology/Geochemistry Group 2· Neptune and Company, Inc. ~. Environmental Geochemistry
11111111111111111111111111111111111 13510
1
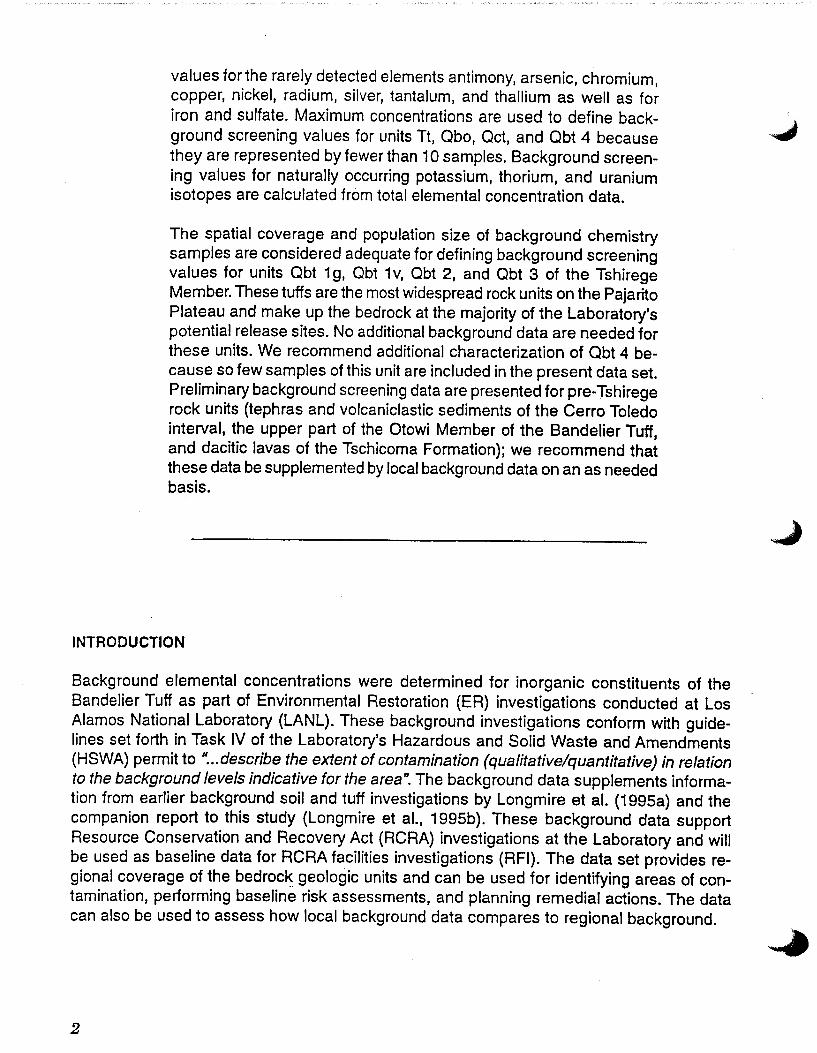
values for the rarely detected elements antimony, arsenic, chromium, copper, nickel, radium, silver, tantalum, and thallium as well as for iron and sulfate. Maximum concentrations are used to define background screening values for units Tt, Qbo, Qct, and Qbt 4 because they are represented by fewer than 10 samples. Background screening values for naturally occurring potassium, thorium, and uranium isotopes are calculated from total elemental concentration data.
The spatial coverage and population size of background chemistry samples are considered adequate for defining background screening values for units Qbt 1 g, Qbt 1 v, Obt 2, and Qbt 3 of the Tshirege Member. These tuffs are the most widespread rock units on the Pajarito Plateau and make up the bedrock at the majority of the Laboratory's potential release sites. No additional background data are needed for these units. We recommend additional characterization of Qbt 4 because so few samples of this unit are included in the present data set. Preliminary background screening data are presented for pre-Tshirege rock units (tephras and volcaniclastic sediments of the Cerro Toledo interval, the upper part of the Otowi Member of the Bandelier Tuff, and dacitic lavas of the Tschicoma Formation); we recommend that these data be supplemented by local background data on an as needed basis.
INTRODUCTION
Background elemental concentrations were determined for inorganic constituents of the Bandelier Tuff as part of Environmental Restoration (ER) investigations conducted at Los Alamos National Laboratory (LANL). These background investigations conform with guidelines set forth in Task IV of the Laboratory's Hazardous and Solid Waste and Amendments (HSWA) permit to " ... describe the extent of contamination (qualitative/quantitative) in relation to the background levels indicative for the area". The background data supplements information from earlier background soil and tuff investigations by Longmire et al. (1995a) and the companion report to this study (Longmire et al., 1995b). These background data support Resource Conservation and Recovery Act (RCRA) investigations at the Laboratory and will be used as baseline data for RCRA facilities investigations (RFI). The data set provides regional coverage of the bedroc~ geologic units and can be used for identifying areas of contamination, performing baseline risk assessments, and planning remedial actions. The data can also be used to assess how local background data compares to regional background.
2
This report presents background chemical data primarily for the Tshirege Member of the Bandelier Tuff. The Tshirege Member is the most widespread rock unit on the Pajarito Plateau, and it is the bedrock unit at the majority of the Laboratory's potential release sites. The Tshirege data are considered complete except for unit 4. The western part of the Laboratory, where unit 4 is the major surface bedrock unit, was little characterized at the time samples were collected for stratigraphic studies of the Bandelier Tuff, and only 4 samples of this unit were available for background characterization. The presence of a thick sequence of unit 4 tuffs in borehole 49-2-700-1 at TA-49 was not discovered until after background samples were submitted for analysis of leachable inorganic analytes.
Additional background data are presented for some of the pre-Tshirege rock units including, in descending stratigraphic order: tephras and volcaniclastic sediments of the Cerro Toledo interval, the upper part of the Otowi Member of the Bandelier Tuff, and dacitic lavas of the Tschicoma Formation. Background data for the pre-Tshirege rock units are preliminary because of the low number of samples representing the units; however, these data provide useful bounding information on the geochemistry of these deeper units.
Two types of analytical data for inorganic constituents are presented in this report. Leachable elemental concentrations are provided to determine the bioavailabilty of elements for risk assessment calculations. Leachable elemental concentrations were determined by first leaching the loosely bound inorganic constituents of the rocks in a water or acid solution, and then analyzing the leacha:~c. The leachable elemental concentrations are the primary focus of this report because RFI soils and rocks also are analyzed for their leachable elemental concentrations.
Total elemental concentrations also are discussed in this report and refer to the total concentration of an inorganic element in a rock, including the insoluble forms of the elements tightly bound in mineral structures as well as acid leachable (bioavailable) forms. Total elemental concentrations provide important information about: (1) the natural geochemical variability of the rock units, (2) the leachability behavior of inorganic constituents in different geologic settings, (3) discrimination of contaminated vs. uncontaminated media, and (4) geochemical processes controlling contaminant transport. In addition, background screening values for naturally occurring potassium, thorium, and uranium isotopes are calculated from total elemental concentration data. Data for total elemental concentrations are presented graphically, and comparisons between leachable elemental concentrations and total elemental concentrations are made on an analyte by analyte basis. The total elemental concentrations are not treated statistically and are used as supporting data for understanding the distribution of inorganic elements in the rock units.
This report summarizes the results of background chemistry investigations for rocks of the Pajarito Plateau. Field, analytical, and statistical methods used to describe background element concentrations are described, and geologic factors that control elemental distributions are discussed. Background elemental values are determined for each rock unit, and background screening values are calculated based on upper threshold limits or maximum reported concentrations. The data are summarized in tables and figures, and the underlying data will be available through the Facility for Information Management and Display (FIMAD).
3
METHODS
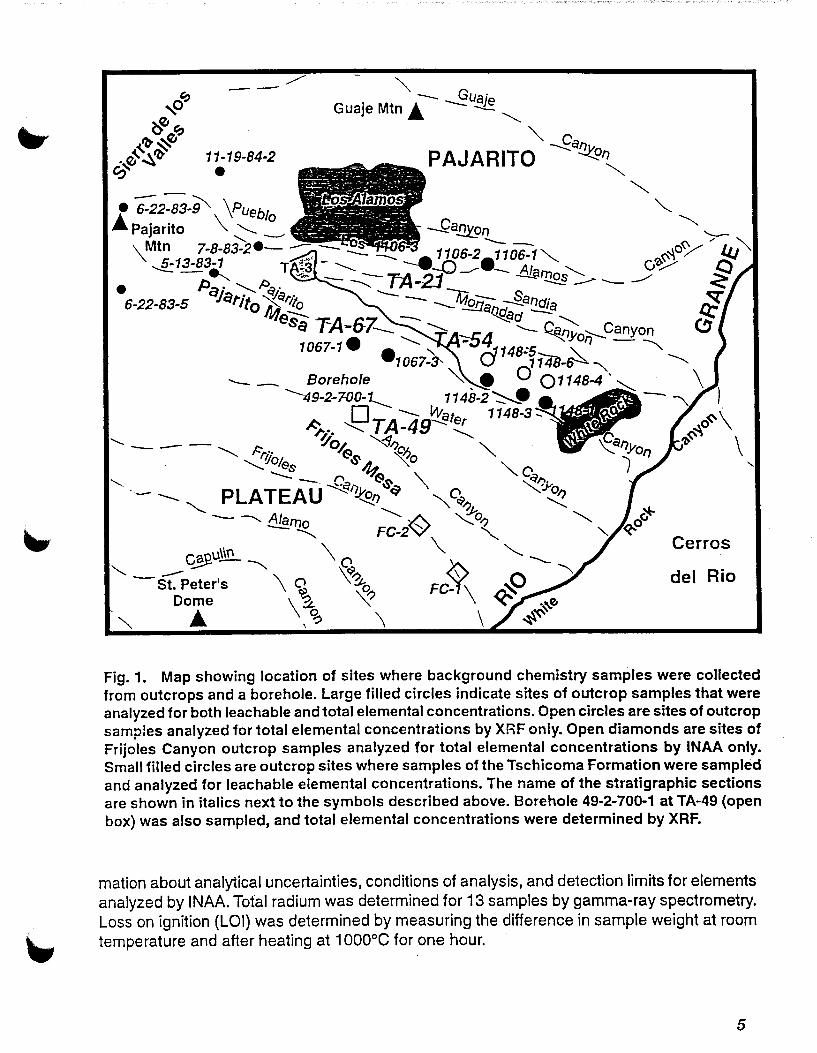
A total of 251 bulk-rock samples was collected from rock units across the Pajarito Plateau. One hundred and eighty-seven of the samples were collected from outcrops as part of stratigraphic studies of the Bandelier Tuff and older units, and details about sample collection as well as other relevant information about the geologic setting of the samples are given elsewhere (Broxton et al., 1995a, 1995b, 1995c; Longmire, 1995a). Sixty four samples were collected from background geology borehole 49-2-700-1 at TA-49 (Stimac et al., 1995). Areas where samples were collected are shown in Fig. 1.
In general, field work was performed using the procedure Characterization of Lithologic Variations within the Rock Outcrops of a Volcanic Field (LANL-ER-SOP-03.07). Typically, samples were collected in vertical stratigraphic sections at a nominal vertical spacing of 5 m or at major changes in lithology. Metal tags mark sample sites in the field. Vertical control was maintained by Jacob staff and Abney level in the field, and locations and elevations were estimated from maps or were surveyed by a professional surveying company. Site observations generally included descriptions of rock type, unit thickness, type and degree of alteration, welding and compaction, phenocryst assemblage and abundance, color of fresh and weathered surfaces, pumice size and abundance, and weathering characteristics. Bedding characteristics, fractures and their filling materials, and lithic assemblage, size, and abundance were also noted.
Table I summarizes the analytical methods, analytes, and numbers of samples collected in this study. First, total elemental concentrations were determined for 208 samples by x-ray fluorescence (XRF) and 38 samples by instrumental neutron activation analyses (INAA) to determine the chemical variability of rock units on the Pajarito Plateau. Then, based on the XRF and JNAA results, a representative suite of 1 06 samples was selected for analyses by EPA SW846 methods for their leachable concentrations of inorganic analytes. These included 5 outcrop samples from the Tschicoma Formation that were analyzed only for their inorganic analytes.
SW846 leachable elemental concentrations were determined by inductively coupled plasma mass spectrometry (ICPMS), inductively coupled plasma emission spectroscopy (ICPES), and electrothermal vapor atomic absorption spectroscopy (ETVAA). Aliquots of crushed rock powders were treated with a solution of concentrated HN03 (pH<1 ), and the IBachate was analyzed by ICPMS and ICPES. Separate aliquots of crushed rock powders were treated with de-ionized water and the leachate was analyzed for chlorine and sulfate by ion chromatography (IC). Thirteen untreated samples were analyzed for Radium-226 activities by gammaray spectroscopy (G).
Total elemental concentrations were made using an automated Rigaku wavelength-dispersive X-ray fluorescence (XRF) spectrometer located in the Geology/Geochemistry Group (EES-1) at LANL. Details about XRF analytical conditions are summarized in Broxton et al. (1995b, 1995c). Total elemental concentrations by INAA (Table I) were performed at the Omega West reactor facility at LANL. Minor et al. {1982) and Garcia et al. (1982) provide additional infer-
4
--
11-19-84-2
•
Cerros
del Rio
Fig. 1. Map showing location of sites where background chemistry samples were collected from outcrops and a borehole. Large filled circles indicate sites of outcrop samples that were analyzed for both leachable and total elemental concentrations. Open circles are sites of outcrop samples analyzed for total elemental concentrations by XRF only. Open diamonds are sites of Frijoles Canyon outcrop samples analyzed for total elemental concentrations by INAA only. Small filled circles are outcrop sites where samples of the Tschicoma Formation were sampled and analyzed for leachable elemental concentrations. The name of the stratigraphic sections are shown in italics next to the symbols described above. Borehole 49-2-700-1 at TA-49 (open box) was also sampled, and total elemental concentrations were determined by XRF.
mation about analytical uncertainties, conditions of analysis, and detection limits for elements
analyzed by INAA. Total radium was determined for 13 samples by gamma-ray spectrometry. Loss on ignition (LOI) was determined by measuring the difference in sample weight at room temperature and after heating at 1 ooooc for one hour.
5
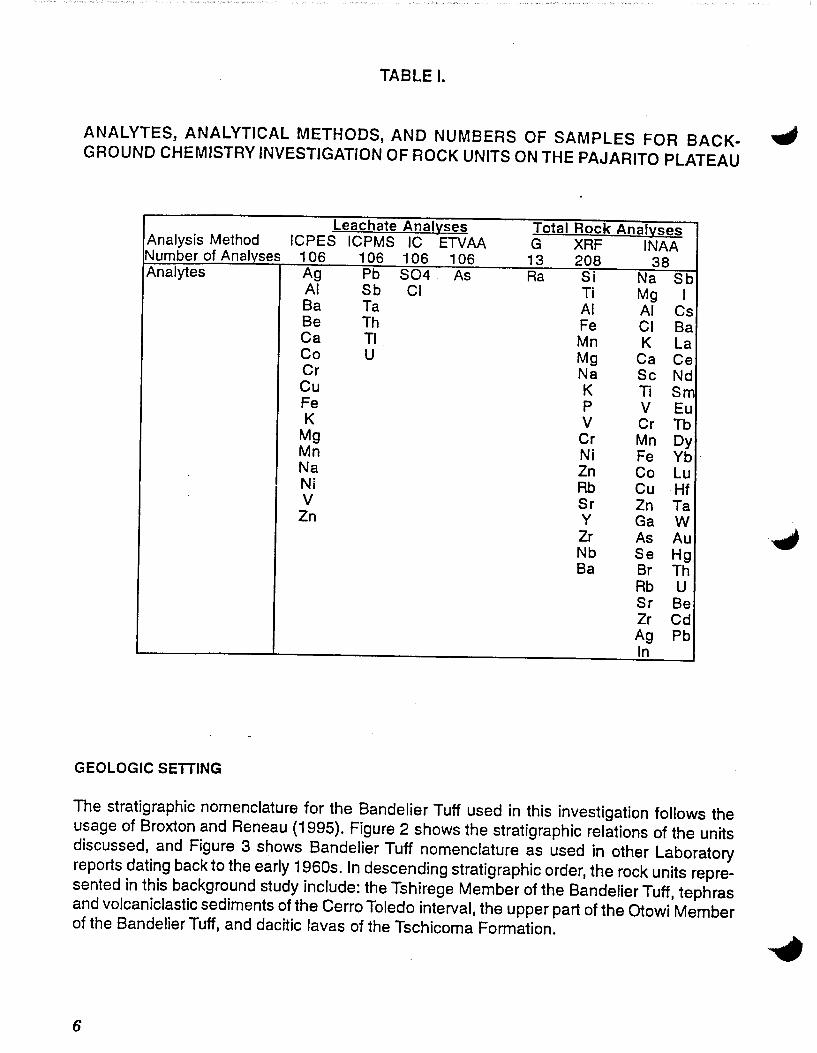
TABLE I.
ANALYTES, ANALYTICAL METHODS, AND NUMBERS OF SAMPLES FOR BACK- ~ GROUND CHEMISTRY INVESTIGATION OF ROCK UNITS ON THE PAJARITO PLATEAU
leachate Anal~ses Total Rock Analyses Analysis Method ICPES ICPMS IC ETVAA G XRF INAA Number of Analyses 106 106 106 106 13 208 38 Analytes Ag Pb 804. As Ra Si Na Sb
AI Sb Cl Ti Mg I Ba Ta AI AI Cs Be Th Fe Cl Ba Ca Tl Mn K La Co u Mg Ca Ce Cr Na Sc Nd Cu K Ti Sm Fe p v Eu K v Cr Tb
Mg Cr Mn Dy Mn Ni Fe Yb · Na Zn Co Lu Ni Rb Cu ·Hf v Sr Zn Ta Zn y Ga w
Zr As Au Nb Se Hg Ba Br Th
Rb u Sr Be Zr Cd Ag Pb In
GEOLOGIC SETTING
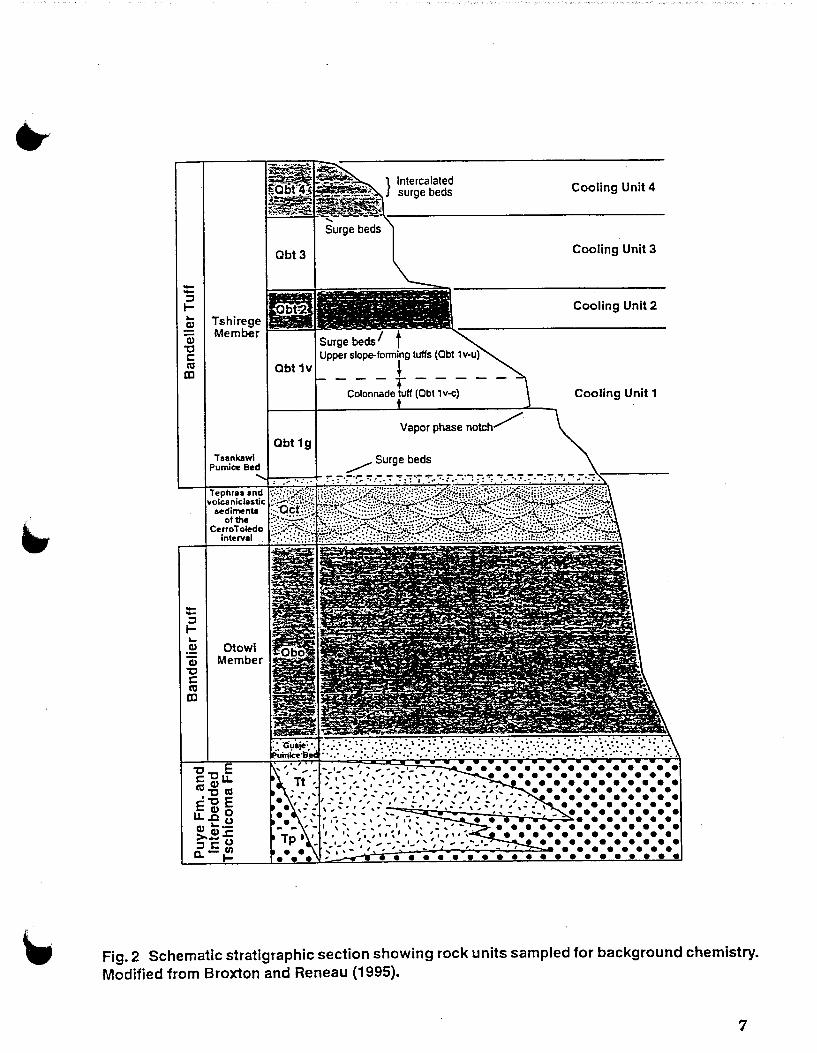
The stratigraphic nomenclature for the Bandelier Tuff used in this investigation follows the usage of Broxton and Reneau {1995). Figure 2 shows the stratigraphic relations of the units discussed, and Figure 3 shows Bandelier Tuff nomenclature as used in other Laboratory reports dating back to the early 1960s. In descending stratigraphic order, the rock units represented in this background study include: the Tshirege Member of the Bandelier Tuff, tephras and volcaniclastic sediments of the Cerro Toledo interval, the upper part of the Otowi Member of the Bandelier Tuff, and dacitic lavas of the Tschicoma Formation.
6
--:I ~ a.. .E a; 'C t: ra
CD
Tshirege Member
Obt3
Obt 1v
Obt1g
Surge beds
Intercalated surge beds
Surge beds/ t Upper slope-forming tuffs (Obt
---!----Colonnade tuff (Qbt1v-c)
Cooling Unit 4
Cooling Unit 3
Cooling Unit 2
Cooling Unit 1
Fig. 2 Schematic stratigraphic section showing rack units sampled for background chemistry.
Modified from Broxton and Reneau (1995).
7
Smith and Bailey 1966
Jemez Volcanic Field
Weir and Purtymun 1962
1b
TA-49
Baltz et al. 1963
1a
Monandad Cny.
Crowe etal. 1978
,
Anello Canyon
Vaniman and Wohletz 1990, 1991
and Goff, 1995
1;
CentrallANL
Reneau et al. Broxton and Reneau, 1995 1995 and and This Paper
Longmire et al 1993, 1995a
TA-33ancl Frijoles Canyon
1g
Central and Eastern LANL
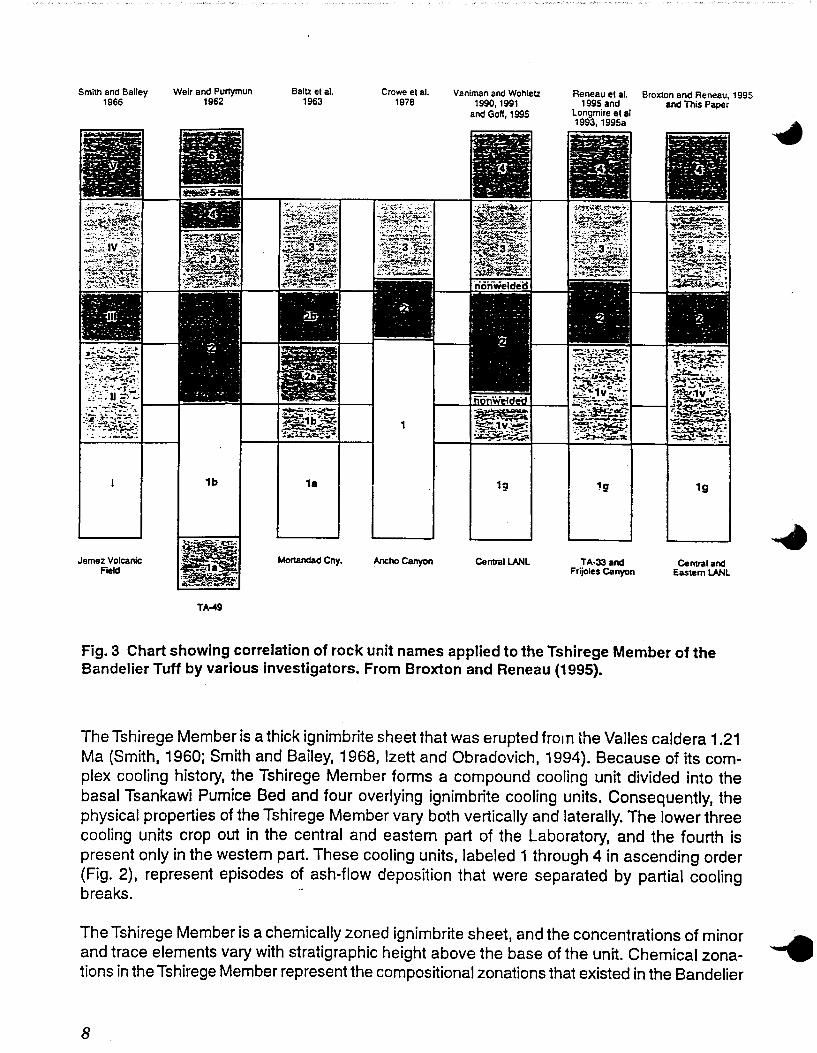
Fig. 3 Chart showing correlation of rock unit names applied to the Tshirege Member of the Bandelier Tuff by various investigators. From Broxton and Reneau (1995).
The Tshirege Member is a thick ignimbrite sheet that was erupted from the Valles caldera 1.21 Ma (Smith, 1960; Smith and Bailey, 1968, lzett and Obradovich, 1994). Because of its complex cooling history, the Tshirege Member forms a compound cooling unit divided into the basal Tsankawi Pumice Bed and four overlying ignimbrite cooling units. Consequently, the physical properties of the Tshirege Member vary both vertically and laterally. The lower three cooling units crop out in the central and eastern part of the Laboratory, and the fourth is present only in the western part. These cooling units, labeled 1 through 4 in ascending order (Fig. 2), represent episodes of ash-flow deposition that were separated by partial cooling brna~. -
The Tshirege Member is a chemically zoned ignimbrite sheet, and the concentrations of minor ._..A and trace elements vary with stratigraphic height above the base of the unit. Chemical zona- --. tions in the Tshirege Member represent the compositional zonations that existed in the Bandelier
8
magma chamber before eruption (Smith and Bailey, 1968; Smith, 1979). The earliest erupted
magmas mainly tapped the top of the magma body and were deposited as the stratigraphically
lowest ignimbrites. Further eruptions continued to draw down the magma body, tapping gen
erally deeper compositional zones of the magma body; these later eruptions resulted in the
deposition of stratigraphically higher parts of the Tshirege ignimbrite sheet. Thus the chemical
zonation in the Tshirege Member represents in inverted order the general compositional zo
nation of the Tshirege magma chamber before eruption, although some mixing of different
levels of magma occurred during in each eruptive event.
Tephras and volcaniclastic sediments of the Cerro Toledo interval is an informal name given
to a sequence of epiclastic sediments and tephras of mixed provenance that lies between the
two members of the Bandelier Tuff (Broxton and Reneau, 1995). The age of this unit is brack
eted by the ages of the Tshirege and Otowi Members (1.22-1.61 Ma; lzett and Obradovich,
1994). This unit contains some deposits normally assigned to the Cerro Toledo Rhyolite,
including tuffaceous sandstones and siltstones and primary ash-fall and pumice-fall deposits
(Smith et al., 1970; Heiken et al., 1986). The Cerro Toledo interval also includes poorly sorted
coarse-grained volcaniclastic sediments derived from lava flows of the Tschicoma Formation.
In most cases, both types of volcaniclastic deposits are intercalated, and it is not practical to
separate them. Samples for this investigation were collected only from primary fallout depos
its. This allowed us to characterize one end-member (high-silica rhyolite tuffar.eous material)
within this compiex etssemblage. The other end member composition is represented by analyses
from the dacitic lavas of the Tschicoma Formation, which are described below.
The Otowi Member of the Bandelier Tuff is a relatively homogenous unit made up of a succes
sion of ignimbrites. The ignimbrites are nonwelded to partially welded in the areas studied,
and the entire sequence of tuffs apparently forms a simple cooling unit. Only the upper part of
the Otowi Member was accessible at the sites studied, therefore the elemental data pre
sented los Valles. Tschicoma Formation rocks represent end member compositions for the
gravel component of stream-transported sediments in these larger drainage systems. These
Tschicoma-derived stream sediments and soils Bandelier Tuff as the streams cross the Pajarito
Plateau.
STATISTICAL APPROACH
Statistical Analysis of Bandelier Tuff and Other Geologic Units
The goal of the statistical analysis of the background tuff data is to develop a technically
defensible set of data for Environmental Restoration (ER) Project decision-making. The key
to technical defensibility is ensuring that the rock analyses represent the natural variation
found within each of the Laboratory's geological rock units. Thus the background rock samples
were collected from areas that were not affected by Laboratory operations.
The background data are used to support the RFI screening process ("Screening Assess
ment Methodology at Los Alamos National Laboratory", LANL ER Project, January 1995,
draft). As a part of the RFI process, data for most sites are compared to natural background
concentration of inorganic analytes. The screening action level (SAL) comparison step fol-
9
lows the background comparison in the screening assessment process. The SALs cited in this report are based on EPA Region 9 Preliminary Remediation Goals (PRGs). The background screening value for inorganic analytes is the 95th percentile upper tolerance limit (UTL), which is the 95% upper confidence limit of the 95th percentile of the data distribution. The type of data distribution for each inorganic analyte must be estimated to calculate these UTLs.
The statistical analysis of the background data is a step-wise process involving the following steps:
a) determine if there is a significant chemical difference between units of the Tshirege Member as well as between the Tshirege Member and other rock units.
b) estimate the type of data distribution for each inorganic analyte so that UTLs can be calculated.
c) calculate background screening values for each analyte by stratigraphic unit using either UTLs or the maximum reported values for infrequently detected analytes or sparsely sampled stratigraphic units.
Initial Data Analvsis Steps
Some of the inorganic results in the combined background rock data set are reported as less than the detection level (<DL). To facilitate statistical analysis of the data, all values reported ' as <DL were replaced by one-half of the detection limit. This replacement approach is recom- ·"' mended in the EPA risk assessment guidance (EPA 1992, 1166). Concentrations below de-tection limits commonly occurred for antimony, arsenic, chromium, copper, nickel, radium, silver, tantalum, and thallium. These analytes are excluded from further statistical analyses.
Three samples (field sample numbers 1106-3-12, 1106-3-13, and 11 06-3-14) from the Tshirege Qbt 1 g/Qbt 1 v contact from a stratigraphic section at TA-21 were excluded from the statistical analyses of these two units. This contact, which coincides with a feature called the vaporphase notch (Broxton et at., 1995), contains anomalous elemental concentrations that significantly skew some statistical parameters when included with the data sets for these units. Exclusion of the samples is justified because they represent a relatively thin· zone ( -2 m) of chemical alteration specific to the vapor phase notch at one locality, and they are not representative of the chemical characteristics of units 1 g and 1v as a whole.
Comparison of Units of the Tshirege Member as well as between the Tshirege Member and other rock units
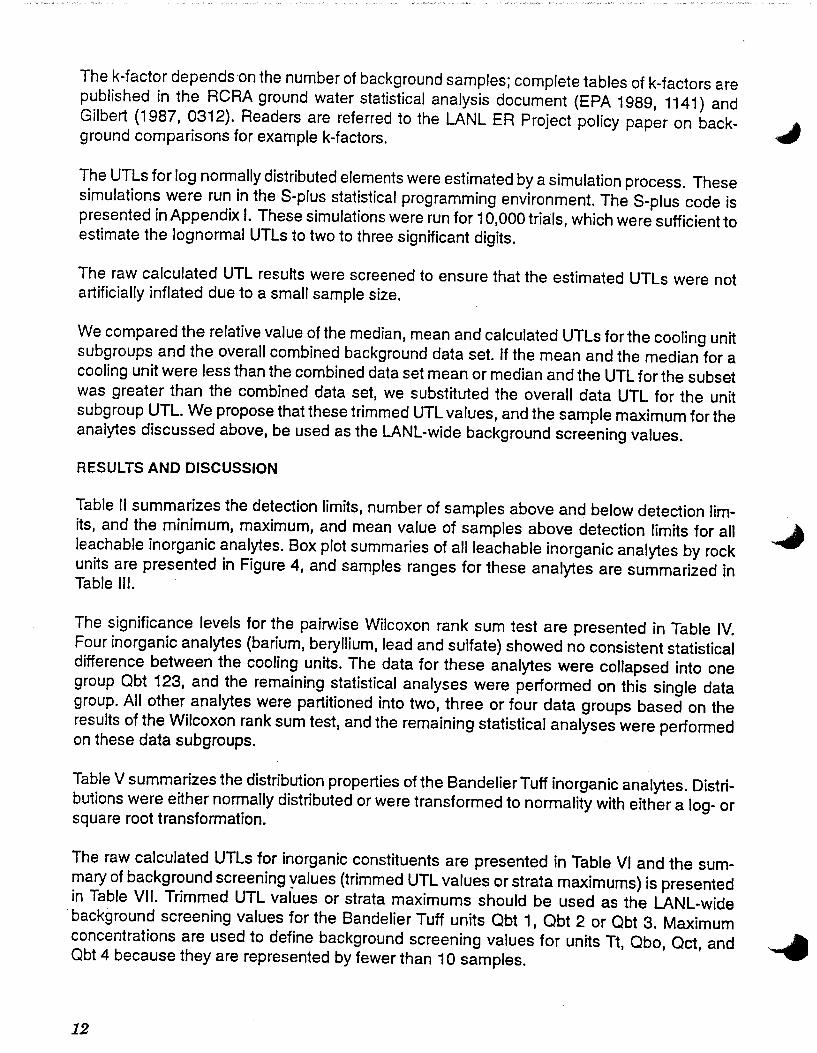
The statistical analyses first compared rock units represented by 10 or more samples. Because of the sampling bias which focused this study on the Tshirege Member, only units of the Tshirege Member are represented by 1 0 or more samples. These units included unit 1 g (Qbt 1 g), unit 1v (Qbt 1v), unit 2 (Qbt 2), and unit 3 (Qbt 3) (Fig. 4). The box plots show the actual values (as filled circles) for each stratigraphic unit. The ends of the box represent the "inter-
10
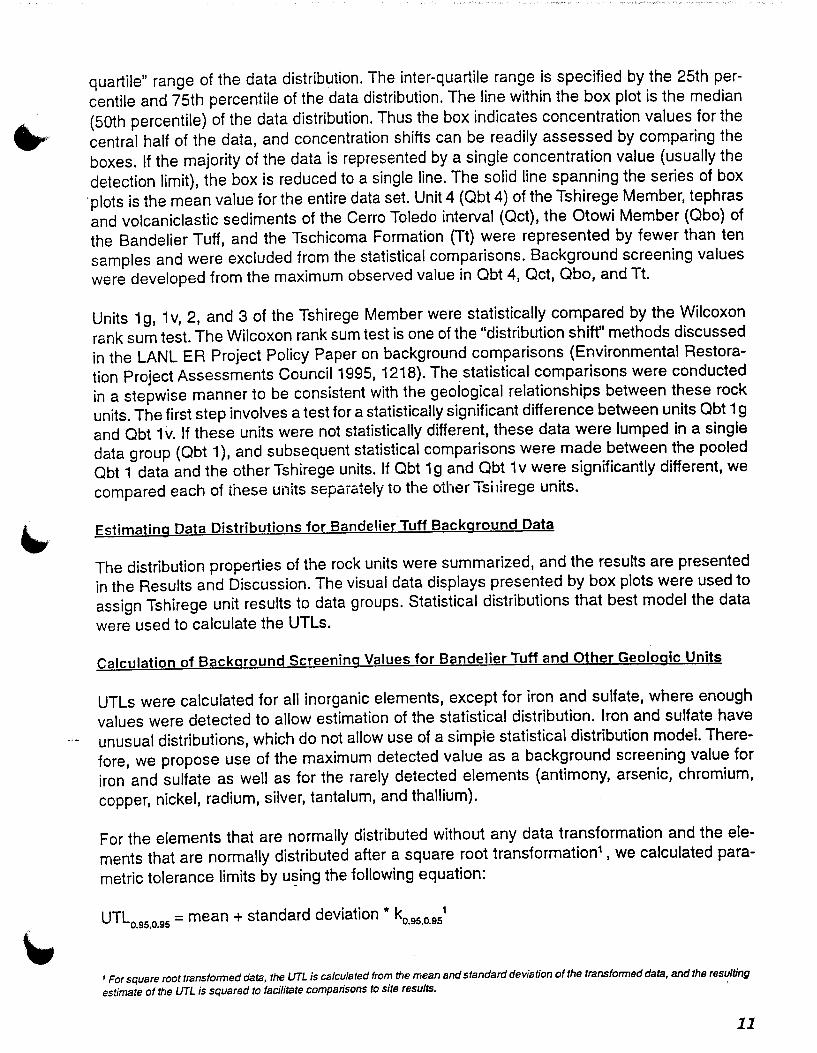
quartile" range of the data distribution. The inter-quartile range is specified by the 25th per
centile and 75th percentile of the data distribution. The line within the box plot is the median
(50th percentile) of the data distribution. Thus the box indicates concentration values for the
central half of the data, and concentration shifts can be readily assessed by comparing the
boxes. If the majority of the data is represented by a single concentration value (usually the
detection limit), the box is reduced to a single line. The solid line spanning the series of box
·plots is the mean value for the entire data set. Unit 4 (Obt 4) of the Tshirege Member, tephras
and volcaniclastic sediments of the Cerro Toledo interval (Oct), the Otowi Member (Qbo) of
the Bandelier Tuff, and the Tschicoma Formation {Tt) were represented by fewer than ten
samples and were excluded from the statistical comparisons. Background screening values
were developed from the maximum observed value in Qbt 4, Oct, Qbo, and Tt.
Units 1 g, 1 v, 2, and 3 of the Tshirege Member were statistically compared by the Wilcoxon
rank sum test. The Wilcoxon rank sum test is one of the "distribution shift" methods discussed
in the LANL ER Project Policy Paper on background comparisons (Environmental Restora
tion Project Assessments Council 1995, 1218). The statistical comparisons were conducted
in a stepwise manner to be consistent with the geological relationships between these rock
units. The first step involves a test for a statistically significant difference between units Qbt 1 g
and Qbt 1 v. If these units were not statistically different, these data were lumped in a single
data group (Qbt 1 ), and subsequent statistical comparisons were made between the pooled
Qbt 1 data and the other Tshirege units. If Obt 1 g and Qbt 1 v were significantly different, we
compared each of these units separately to the other Tshlrege units.
Estimating Data Distributions for Bandelier Tuff Background Data
The distribution properties of the rock units were summarized, and the results are presented
in the Results and Discussion. The visual data displays presented by box plots were used to
assign Tshirege unit results to data groups. Statistical distributions that best model the data
were used to calculate the UTLs.
Calculation of Background Screening Values for Bandelier Tuff and Other Geologic Units
UTLs were calculated for all inorganic elements, except for iron and sulfate, where enough
values were detected to allow estimation of the statistical distribution. Iron and sulfate have
unusual distributions, which do not allow use of a simpie statistical distribution model. There
fore, we propose use of the maximum detected value as a background screening value for
iron and sulfate as well as for the rarely detected elements (antimony, arsenic, chromium,
copper, nickel, radium, silver, tantalum, and thallium).
For the elements that are normally distributed without any data transformation and the ele
ments that are normally distributed after a square root transformation1 , we calculated para
metric tolerance limits by u~ing the following equation:
UTLo.ss,o.ss = mean + standard deviation * ko.ss.o.ss1
' For square root transformed data, the UTL is calculated from the mean and standard deviation of the transformed data, and the resulting
estimate of the UTL is squared to facilitate comparisons to site results. ·
11
The k-factor depends on the number of background samples; complete tables of k-factors are published in the RCRA ground water statistical analysis document (EPA 1989, 1141) and Gilbert (1987, 0312}. Readers are referred to the LANL ER Project policy paper on background comparisons for example k-factors.
The UTLs for log normally distributed elements were estimated by a simulation process. These simulations were run in the S-plus statistical programming environment. The S-plus code is presented in Appendix I. These simulations were run for 10,000 trials, which were sufficient to estimate the lognormal UTLs to two to three significant digits.
The raw calculated UTL results were screened to ensure that the estimated UTLs were not artificially inflated due to a small sample size.
We compared the relative value of the median, mean and calculated UTLs for the cooling unit subgroups and the overall combined background data set. If the mean and the median for a cooling unit were less than the combined data set mean or median and the UTL for the subset was greater than the combined data set, we substituted the overall data UTL for the unit subgroup UTL. We propose that these trimmed UTL values, and the sample maximum for the analytes discussed above, be used as the LANL-wide background screening values.
RESULTS AND DISCUSSION
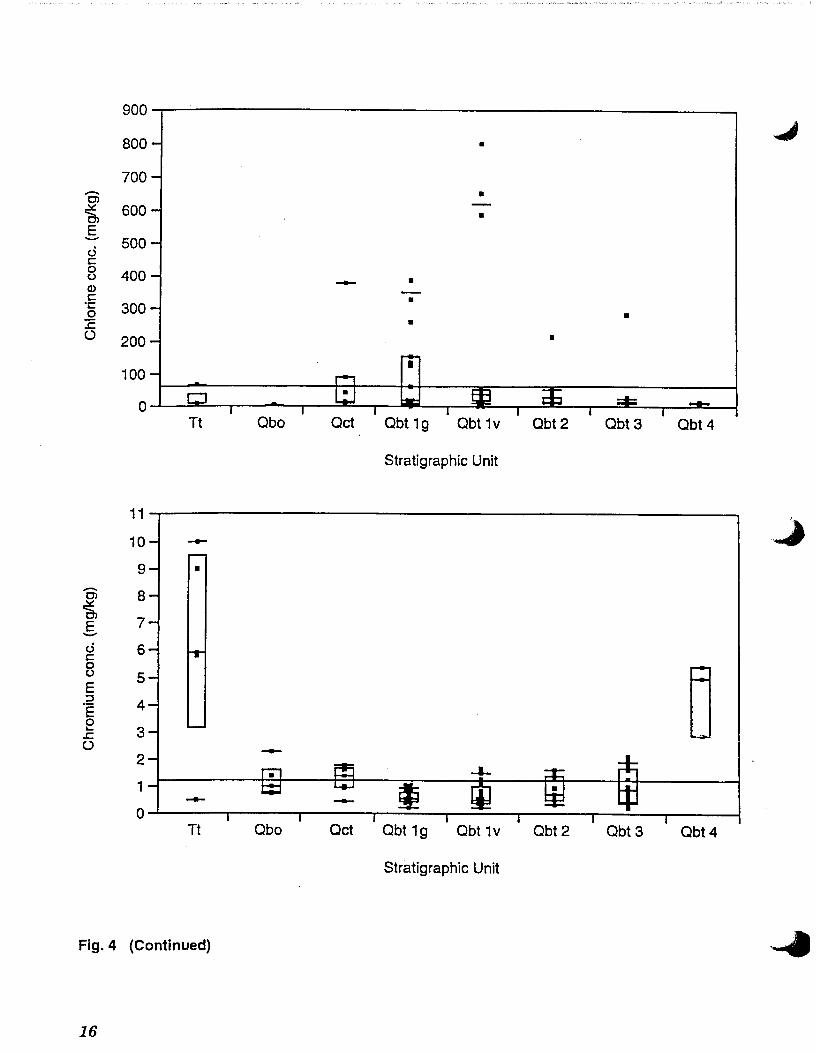
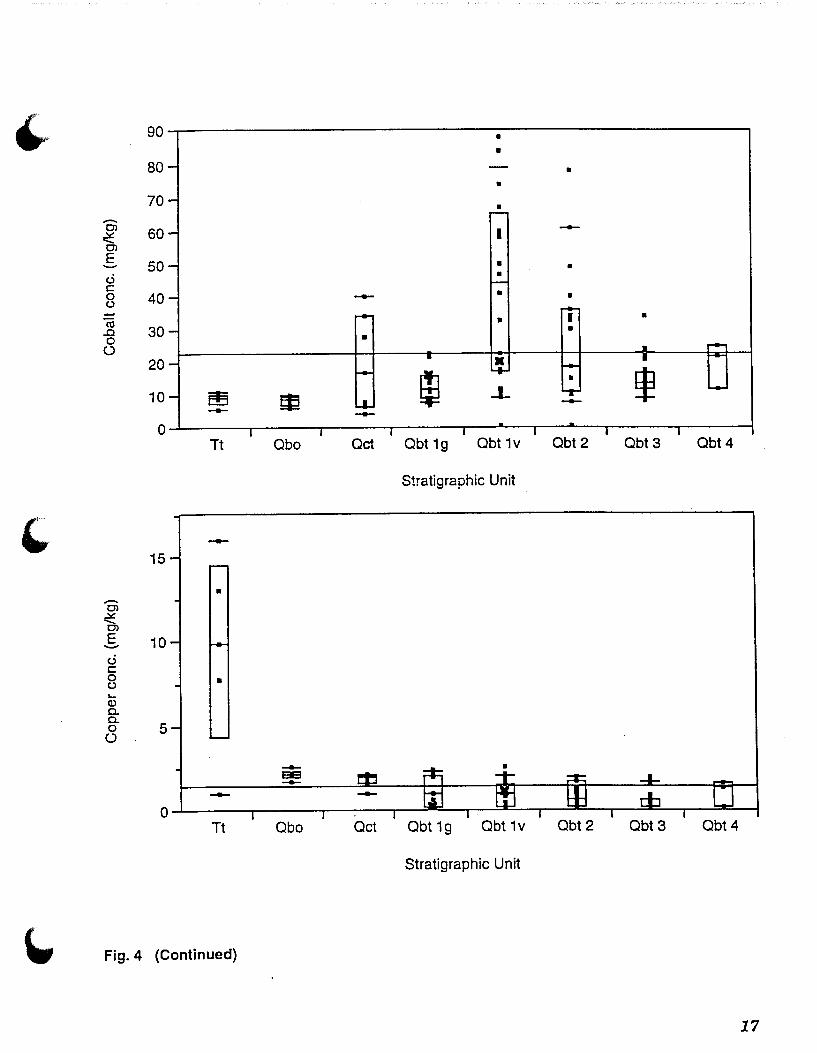
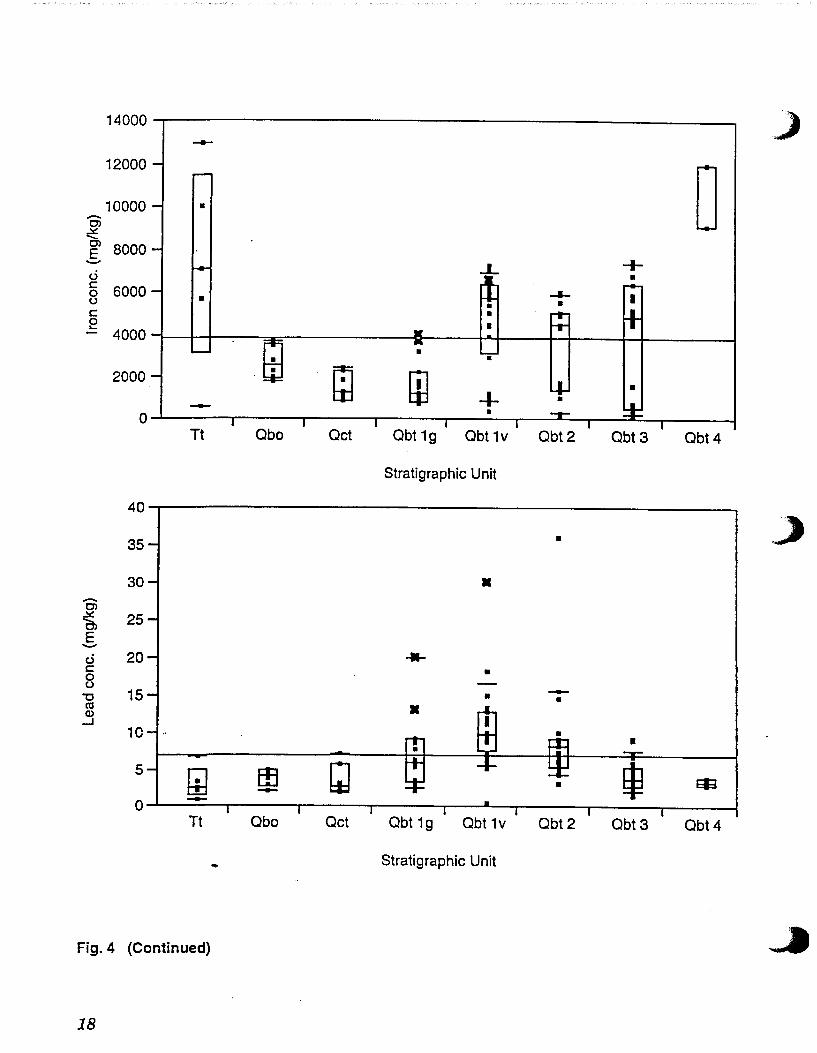
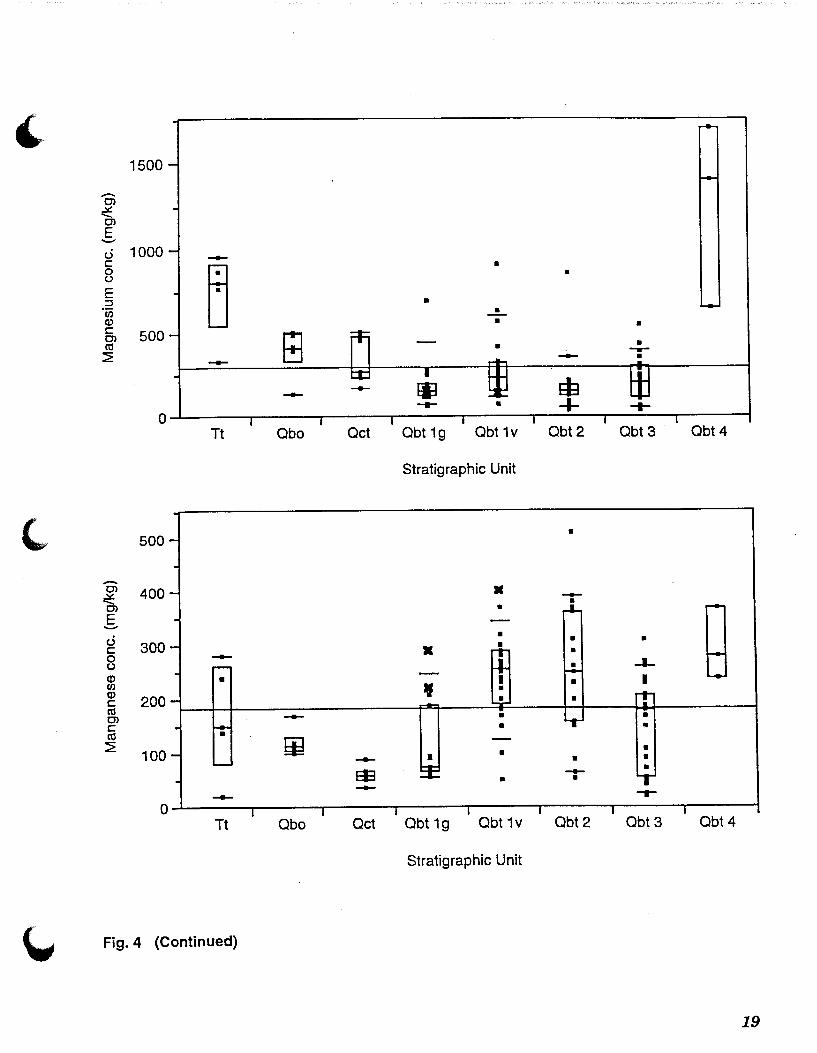
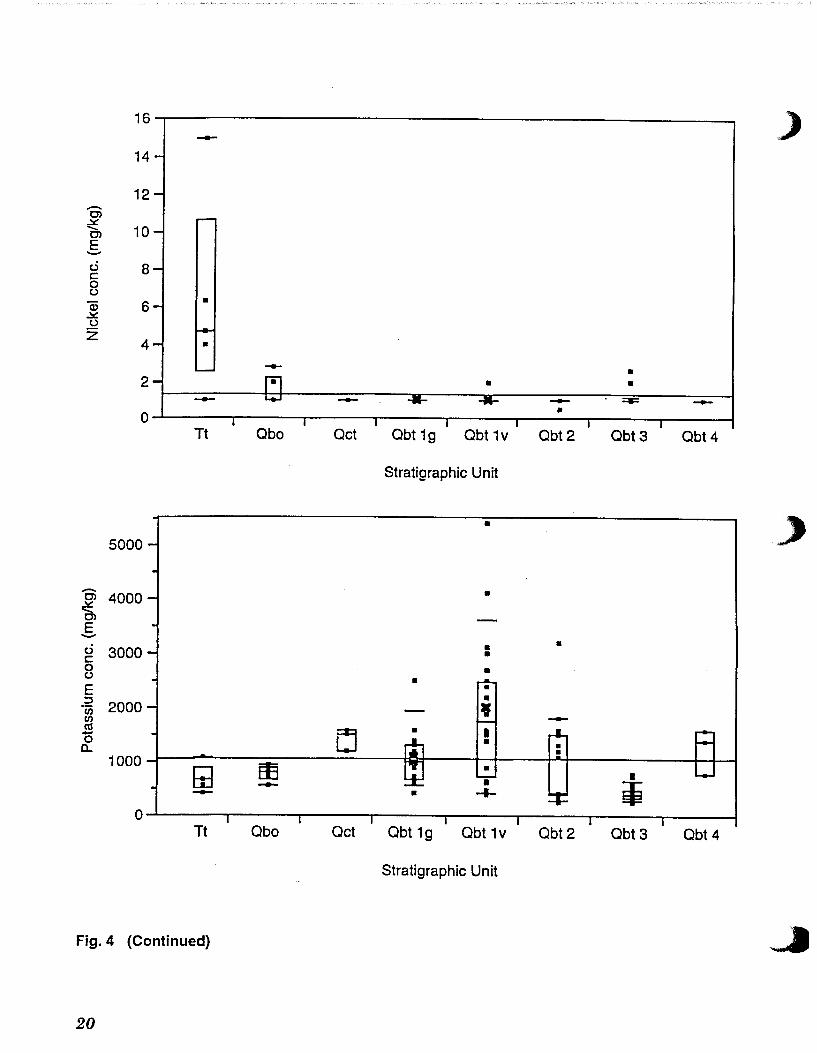
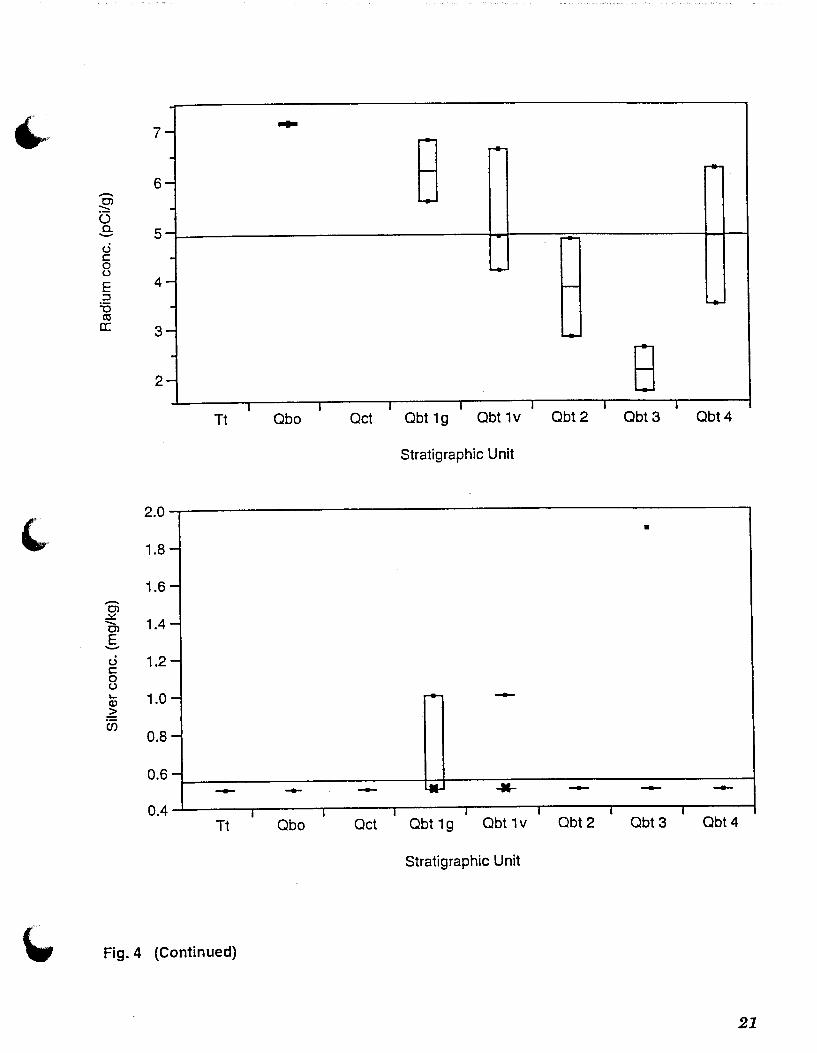
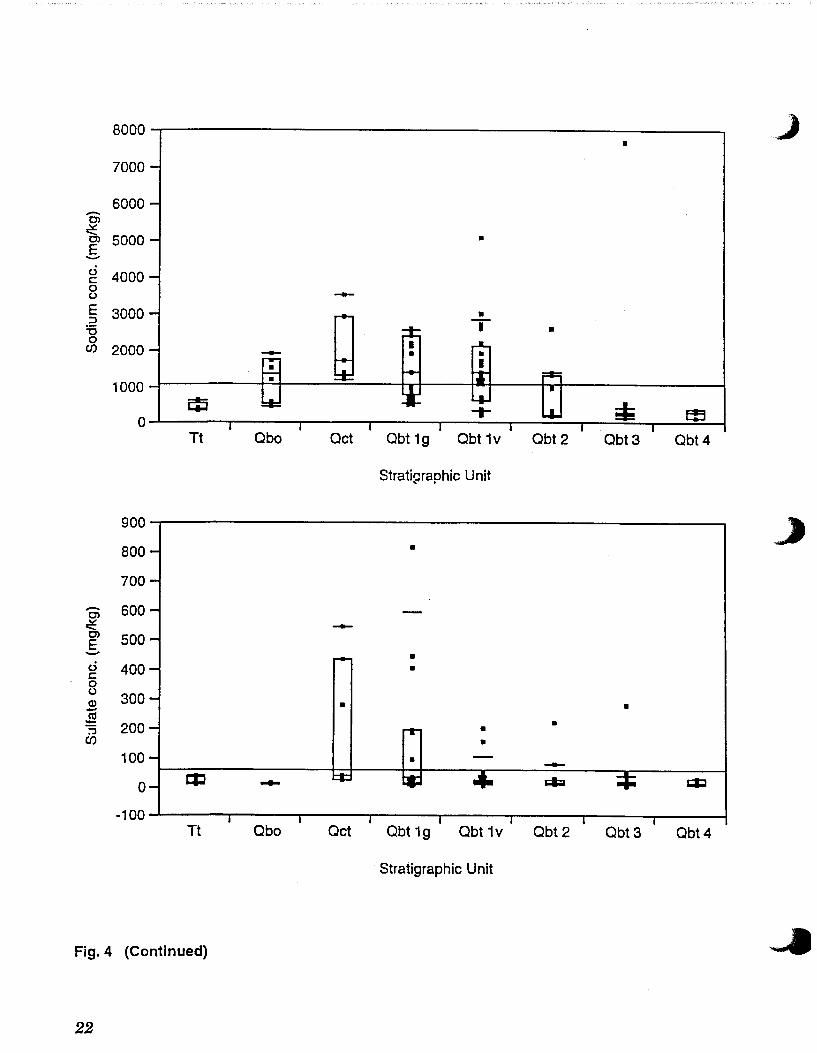
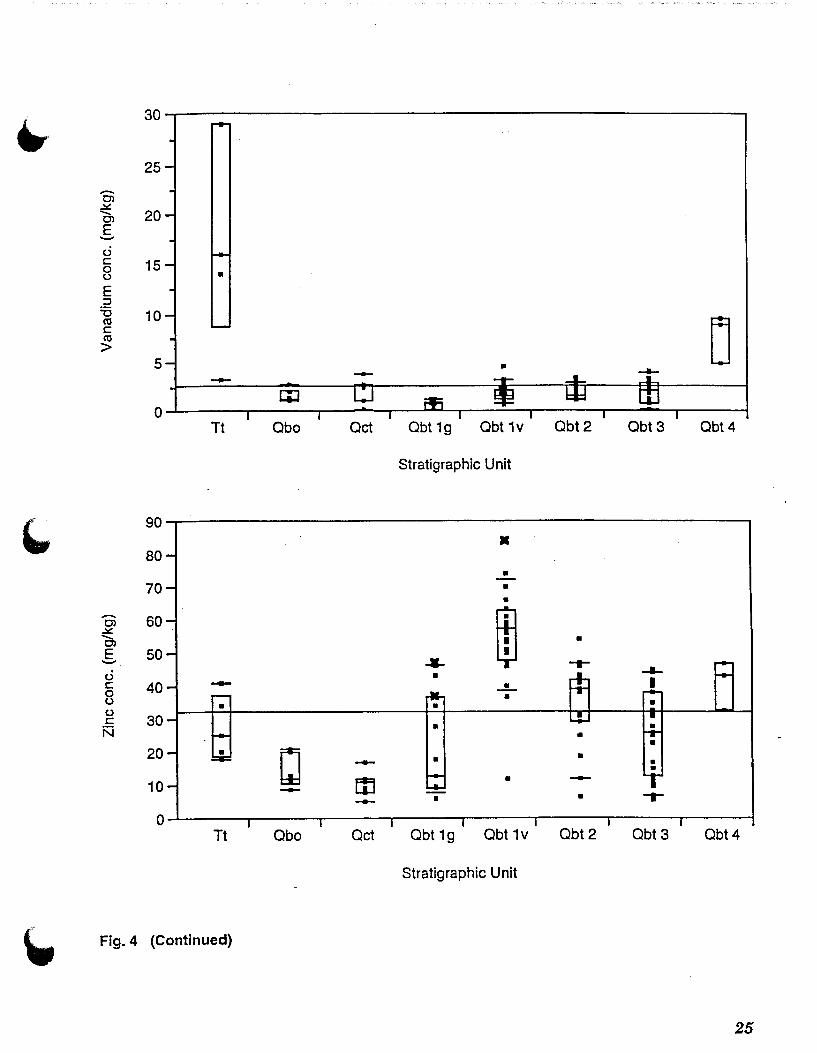
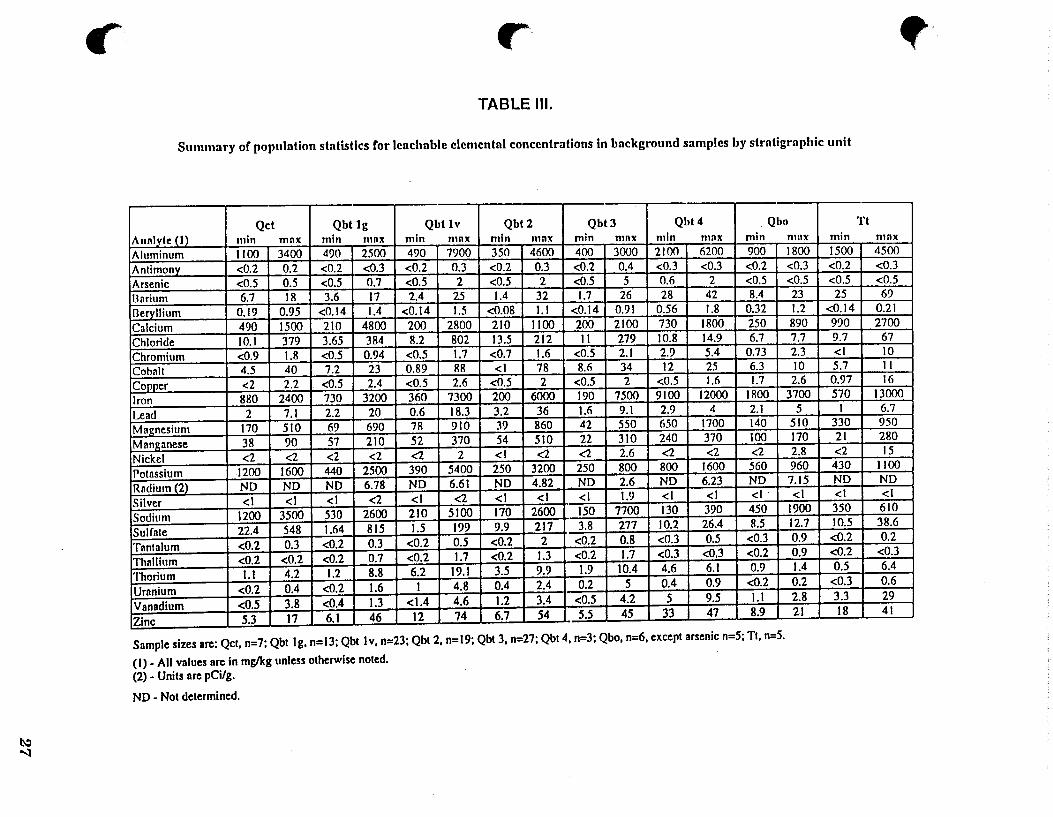
Table II summarizes the detection limits, number of samples above and below detection lim-its, and the minimum, maximum, and mean value of samples above detection limits for all ~ leachable inorganic analytes. Box plot summaries of all leachable inorganic analytes by rock units are presented in Figure 4, and samples ranges for these analytes are summarized in Table Ill.
The significance levels for the pairwise Wilcoxon rank sum test are presented in Table IV. Four inorganic analytes (barium, beryllium, lead and sulfate) showed no consistent statistical difference between the cooling units. The data for these analytes were collapsed into one group Qbt 123, and the remaining statistical analyses were performed on this single data group. All other analytes were partitioned into two, three or four data groups based on the results of the Wilcoxon rank sum test, and the remaining statistical analyses were performed on these data subgroups.
Table V summarizes the distribution properties of the Bandelier Tuff inorganic analytes. Distributions were either normally distributed or were transformed to normality with either a log- or square root transformation.
The raw calculated UTLs for inorganic constituents are presented in Table VI and the summary of background screening yalues (trimmed UTL values or strata maximums) is presented in Table VII. Trimmed UTL values or strata maximums should be used as the LANL-wide background screening values for the Bandelier Tuff units Qbt 1, Qbt 2 or Qbt 3. Maximum concentrations are used to define background screening values for units Tt, Qbo, Qct, and Qbt 4 because they are represented by fewer than 1 0 samples.
12
~ 16000
14000 • s12ooo ~ ........ 0'> E 10000 -c.S c 8000 • • 0 (.)
E • ~ 6000 c .E • ~
-1-
<: 4000
2000
0 Tt Qbo Oct Qbt 1g Qbt 1v Qbt2 Qbt3 Qbt4
Stratigraphic Unit
0.45
0.40 - •
- 0.35 -0'> ~ ........ 0'> 0.30 E - • • • -c.S c 0.25 0 -(.)
>- -c 0.20 0 - - r- - rll- r- r- ..... -E -c 0.15 <:
0.10
-0 - - - ...... ~ L-.- .....
0.05 I I I I I I I
Tt Qbo Oct Qbt 1g Obt 1v Qbt2 Qbt 3 Qbt4
Stratigraphic Unit
Fig. 4 Box plot summaries of leachable inorganic analytes by geologic unit. See Figure 2 for
explanation of geologic unit labels. Explanation of box plots symbols is given in the text. The
"x" values in these plots are vapor phase notch samples from stratigraphic section 3 at TA-21.
13
5 •
- 4 • C) .::,t:. e;, E - 3 0 c 0 ()
() ·c: 2 Q) rn .... <(
1
---0 Tt Qbo Oct Qbt 1g Obt 1v Qbt2 Qbt3 Qbt4
Stratigraphic Unit
200~------------------------------------------------------~
• 150 -C)
.::,t:. • ......... C)
E -0 100 c 0 ()
E :=! --·;:: ca
0 !Il 50
--0
Tt Qbo Oct Qbt 1g Obt 1v Qbt2 Qbt3 Qbt4
Stratigraphic Unit
Fig. 4 (Continued)
14
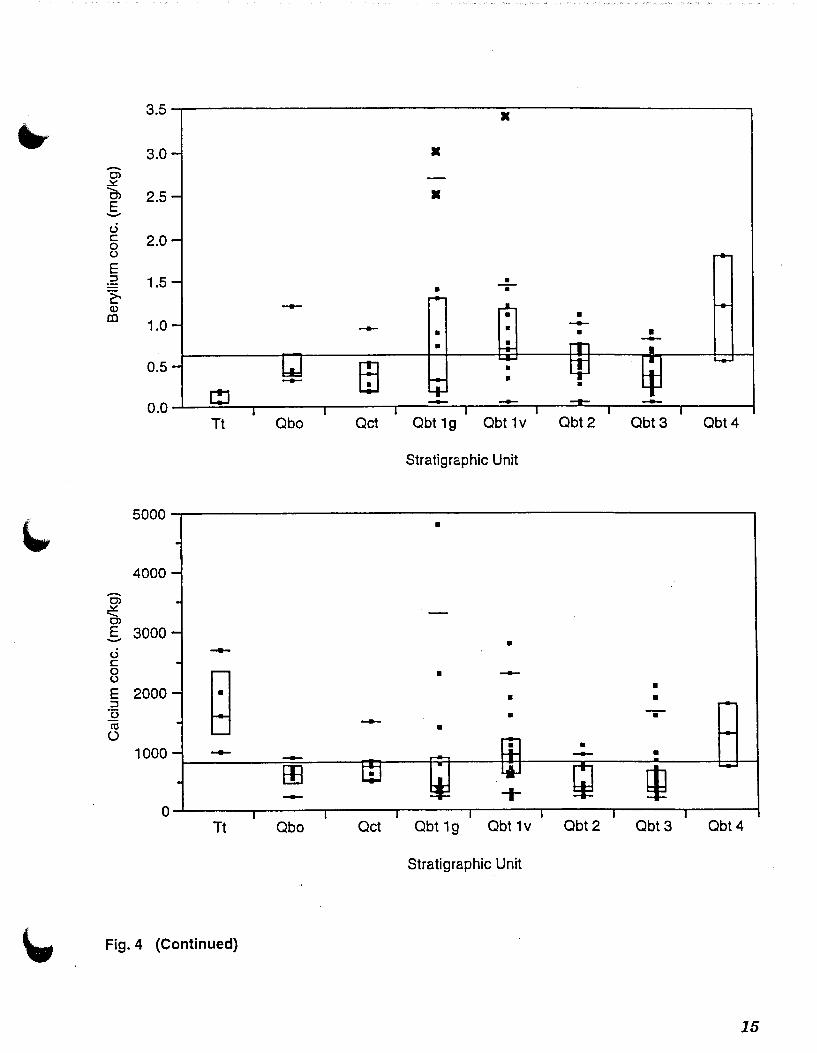
3.5 • -.,.. 3.0 • -0)
~ -- 2.5 • 0)
E -u r::: 2.0 0 0
E :J 1.5 ~ 11>
CD 1.0
0.5
0.0 t::J Tt Qbo Oct Qbt 1g Obt 1v Qbt2 Obt3 Qbt4
Stratigraphic Unit
'-5000
•
4000
-0) ~ --0)
E 3000 - • 0 -r::: 0
~ • --0
E 2000 • :J • •
·c:; • ..... ctl -- • ()
1000 -Tt Qbo Oct Qbt 1g Obt 1v Qbt2 Obt3 Qbt4
Stratigraphic Unit
\., Fig. 4 (Continued)
15
900
800
700 -C) ~ 600 -. C)
E - 500 0 c: 0 400 (.)
Q) c:
·;::::: 300 ..Q .c: (.)
200
100
0 Tt Obo Oct Obt 1g Obt 1v Obt2 Obt3 Obt4
Stratigraphic Unit
11
~ 10 -9 •
- 8 C)
~ C)
7 E -0 6 c: 0
~ (.)
5 E ::I
4 .E 0 ... 3 .c: (.) -2
1 - -0 Tt Obo Oct Obt 1g Obt 1v Obt2 Obt3 Obt4
Stratigraphic Unit
Fig. 4 (Continued)
16
' 90 • •
80 - - • •
70 - • ~ -Cl 60 ..:..::: .._ - I --
Cl E 50 - - • • u c
• -0 40 u - -- • • -ro
30 ..c 0
- • 7 • - • •
0 _._ -
20
10
- • ~
I --- ~ r-
~ • - ffi m ...L '--
± ----0 I I I I I I I
Tt Qbo Oct Qbt 1g Obt 1v Qbt2 Qbt3 Obt4
Stratigraphic Unit
--15
• -Cl ~ Cl E 10 -u c 0 • u ..... Q) a. a. 0 5 0
-Tt Qbo Obt 1g Obt 1v Qbt2 Qbt3 Qbt4
Stratigraphic Unit
Fig. 4 (Continued)
17
14000~----------------------------------------------------~ -12000
• 0 10000 -Cl .?!: E' aooo - -1-0 § 6000 (.)
c e
2000
-Tt Obo Oct Obt 1g Obt 1v Obt2 Obt3 Obt4
Stratigraphic Unit
40~-------------------------------------------------------,
35
30
-Cl
~ 25 E -0 c 0 (.)
"C ctl Q)
...J
20
15
Tt
Fig. 4 (Continued)
18
Obo Oct
•
• •
Obt 1g Obt 1v
Stratigraphic Unit
•
-•
Obt2 Obt3 Obt4
' 1500
-Ol .::&. -. Ol E -u 1000 --c:
B • 0 • u
E ::J • ·u; -·-Q) • • c: 500
~ Ol co • ~ ---- -- •
-- --- • 0
Tt Obo Oct Qbt 1g Obt 1v Qbt2 Qbt 3 Qbt4
Stratigraphic Unit
500 • -
--Ol 400 ~ Ol E -u 300 c: 0 u Q) en Q)
200 c: co Ol
- • --• •
Q - -
• • • - • ~ • --- ~ -1-- - I • I •
' • iT - - ....:... • -- • •
c: co ~
100
7" • !I
~ -- • • -- • • • - ~ • EJ3 --• • ---- ...-0 I I I I I I I
Tt Qbo Oct Obt 1g Obt 1v Qbt2 Qbt 3 Obt4
Stratigraphic Unit
Fig. 4 (Continued)
19
16 ) -14-
12--C) .!of:: ...._
10-C)
E -c3 8-c 0 (.)
a; 6- • .!of:: (.) r-z
4- •
-- - • 2- fl • • - ........ -- ...... ...... -- ~ --• 0 I I I I I I I
Tt Qbo Oct Qbt 1g Qbt 1v Qbt2 Obt3 Qbt4
Stratigraphic Unit
_) • 5000
- 4000 • C) .!of:: ...._ C)
E - • c3 3000 • • c 0 • (.)
E ::J 2000 ·u; 1/) co -0 a..
1000 @ ffi --
0 Tt Qbo Oct Qbt 1g Qbt 1v Qbt2 Qbt3 Qbt4
Stratigraphic Unit
Fig. 4 (Continued)
20
7 ... -
6 -0>
. 8 re-
r---
:'::::: () 0. 5 -c3
- - r+'
c 0 (.) L...-
E 4 - f--::J :.0 "'-co a: 3 - L...-
2
. 8 -I I I I I I I
Tt Qbo Oct Obt 1g Obt 1v Obt2 Qbt3 Obt4
Stratigraphic Unit
2.0
~" 1.8
• -
1.6 --0> ~
1.4 ..._ 0> -E -c3 c 1.2 -0 (.) .... 1.0 Q) - re- ->
i:i5 0.8 -0.6 - - - - LK- ..... - - -0.4 I I I I I I I
Tt Obo Oct Obt 1g Qbt 1v Obt2 Obt3 Qbt4
Stratigraphic Unit
Fig. 4 (Continued)
21
8000~----------------------------------------------------~
7000
6000 -C>
~ 5000 E -g 4000 0 0
5 3000 :0 0
C/) 2000
•
•
-•
E:J o~------~----~----~------~----~------~~~~--~es~~
Tt Obo Oct Obt 1g Obt 1v Obt2 Obt3 Obt4
Stratigraphic Unit
900-r------------------------------------------------------~
800
700
c; 600 ~ E 5oo -0 c: 0 0 Q)
.N :"J
C/)
400
300
200
100
0 -
-
•
•
• •
• •
---100~------~-----r------~----~------~----~r-----~----~
Tt Obo Oct Obt 1g Obt 1v Obt2 Obt3 Obt4
Stratigraphic Unit
Fig. 4 (Continued)
22
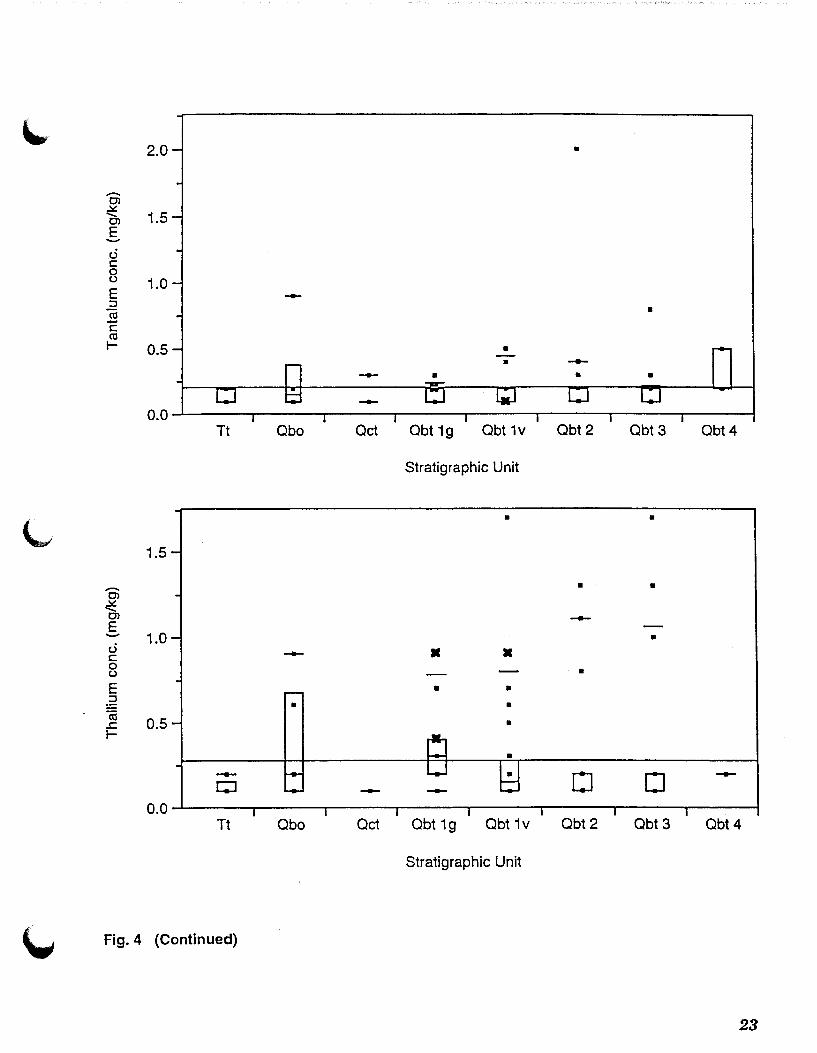
2.0 •
-Ol ~ ....... 1.5 Ol E -c.5 c: 0 (.) 1.0 E -::J co • -c: co 1- 0.5
0.0 Tt Qbo Oct Obt 1g Qbt 1v Qbt2 Qbt3 Obt4
Stratigraphic Unit
• •
1.5
- • • Ol ~ ....... Ol --E - 1.0 • c.5 -- • • c: 0 • (.)
E • • ::J • co 0.5 .r: • 1-
-- 0 0 --r::J --0.0
Tt Qbo Oct Obt 1g Qbt 1v Obt2 Qbt3 Qbt4
Stratigraphic Unit
Fig. 4 (Continued)
23
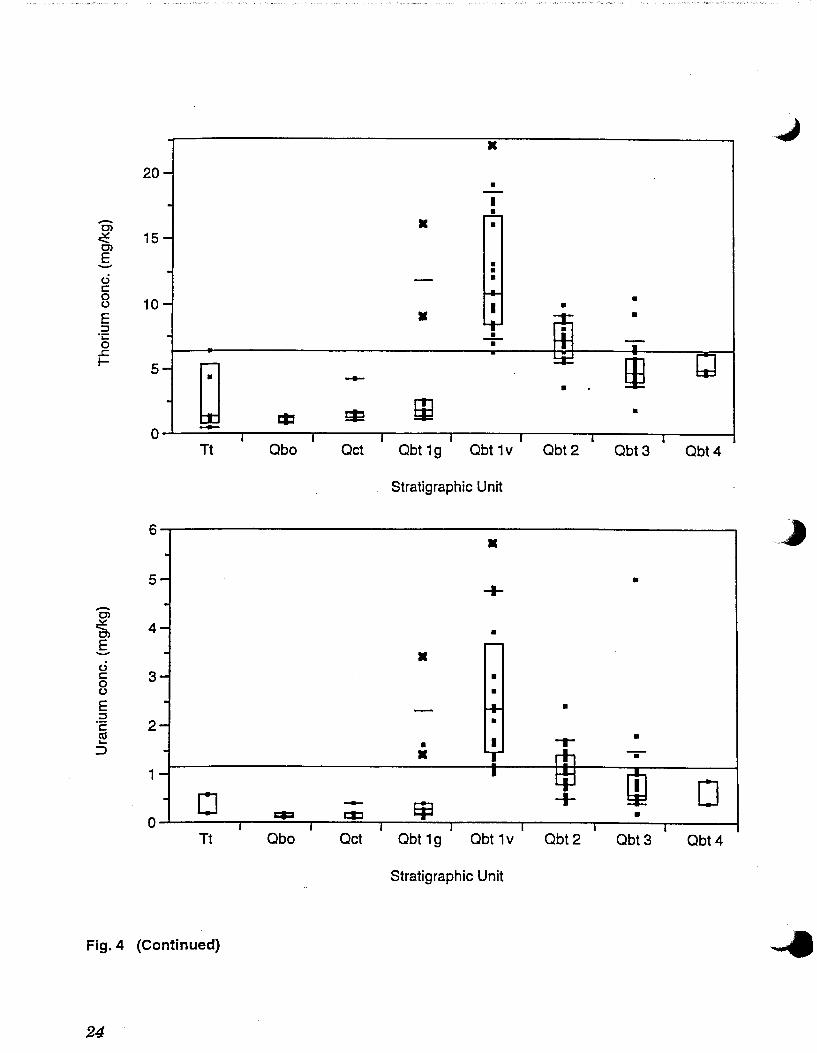
Fig. 4 (Continued)
24
30-r------------------------------------------------------~
25
-0) .lo:: - 20 0)
E -0 c: 15 0 0
E ::J :0 10 (13 c: (13
> 5 -0
Tt Qbo Oct Qbt 1g Obt 1v Qbt2 Qbt3 Qbt4
Stratigraphic Unit
90
• 80 •
70 • • - 60
ffi 0)
.lo:: - • 0)
E 50 ..... - -.-0 • c: 40 ...!.. 0 0 • 0
30 c: N
20 [j -10 EJj • - • • ....... -
0 Tt Qbo Oct Qbt 1g Obt 1v Qbt2 Obt3 Qbt4
Stratigraphic Unit
\., Fig. 4 {Continued)
25
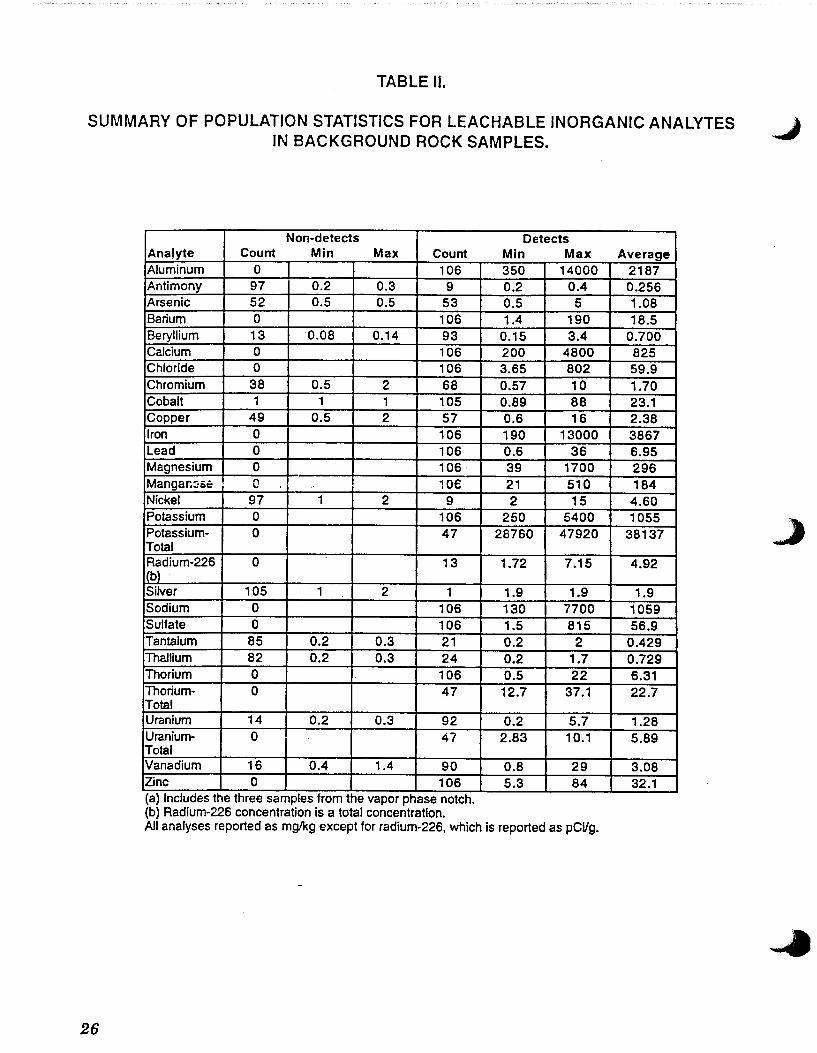
TABLE II.
SUMMARY OF POPULATION STATISTICS FOR LEACHABLE INORGANIC ANALYTES .J IN BACKGROUND ROCK SAMPLES. . .
26
Non-detects Ana(yte Count Min Max Count Aluminum 0 106 Antimony 97 0.2 0.3 9 Arsenic 52 0.5 0.5 53 Barium 0 106 Beryllium 13 0.08 0.14 93 Calcium 0 106 Chloride 0 106 Chromium 38 0.5 2 68 Cobalt 1 1 1 105 Copper 49 0.5 2 57 Iron 0 106 Lead 0 106 Magnesium 0 106 Mangar.~s= 0 .. 10€ Nickel 97 1 2 9 Potassium 0 106 Potassium- 0 47 Total Radium-226 0 13 ICb) Silver 105 1 2 1 Sodium 0 106 Sulfate 0 106 Tantalum 85 0.2 0.3 21 Thallium 82 0.2 0.3 24 Thorium 0 106 Thorium- 0 47 Total Uranium 14 0.2 0.3 92 Uranium- 0 47 Total Vanadium 16 0.4 1.4 90 Zinc 0 106 (a) Includes the three samples from the vapor phase notch. (b) Radium-226 concentration is a total concentration.
Detects Min Max 350 14000 0.2 0.4 0.5 5 1.4 190
0.15 3.4 200 4800 3.65 802 0.57 10 0.89 88 0.6 16 190 13000 0.6 36 39 1700 21 510 2 15
250 5400 28760 47920
1.72 7.15
1.9 1.9 130 7700 1.5 815 0.2 2 0.2 1.7 0.5 22 12.7 37.1
0.2 5.7 2.83 10.1
0.8 29 5.3 84
All analyses reported as mglkg except for radium-226, which is reported as pCVg.
Average 2187 0.256 1.08 18.5
0.700 825 59.9 1.70 23.1 2.38 3867 6.95 296 184 4.60 1055
38137
4.92
1.9 1059 56.9
0.429 0.729 6.31 22.7
1.28 5.89
3.08 32.1
1:1:1
"""'
~ r TABLE Ill.
Summary of population statistics for leachable elemental concentrations in background samples by stratigraphic unit
Qct Qbt lg Qbt tv Qbtl Qbt3 Qbt4 Qbo
Annlyle (1) min mnx min mnx min mnx min mnx min mnx min max min
Aluminum 1100 3400 490 2500 490 7900 350 4600 400 3000 2100 6200 900
AntimonY <0.2 0.2 <0.2 <0.3 <0.2 0.3 <0.2 0.3 <0.2 0.4 <0.3 <0.3 <0.2
Arsenic <0.5 0.5 <0.5 0.7 <0.5 2 <0.5 2 <0.5 5 0.6 2 <0.5
IJarium 6.7 18 3.6 17 2.4 25 1.4 32 1.7 26 28 42 8.4
IJeryllium 0.19 0.95 <0.14 1.4 <0.14 1.5 <0.08 1.1 <0.14 0.91 0.56 1.8 0.32
Calcium 490 1500 210 4800 200 2800 210 1100 200 2100 730 1800 250
Chloride 10.1 379 3.65 384 8.2 802 13.5 212 11 279 10.8 14.9 6.7
Chromium <0.9 1.8 <0.5 0.94 <0.5 1.7 <0.7 1.6 <0.5 2.1 2.9 5.4 0.73
Cobalt 4.5 40 7.2 23 0.89 88 <1 78 8.6 34 12 25 6.3
Cooner <2 2.2 <0.5 2.4 <0.5 2.6 <0.5 2 <0.5 2 <0.5 1.6 1.7
Iron 880 2400 730 3200 360 7300 200 6000 190 7500 9100 12000 1800
Lead 2 7.1 2.2 20 0.6 18.3 3.2 36 1.6 9.1 2.9 4 2.1
Magnesium 170 510 69 690 78 910 39 860 42 550 650 1700 140
Manganese 38 90 57 210 52 370 54 510 22 310 240 370 100
Nickel <2 <2 <2 <2 <2 2 <I <2 <2 2.6 <2 <2 <2
Potassium 1200 1600 440 2500 390 5400 250 3200 250 800 800 1600 560
Radium (2) ND ND ND 6.78 ND 6.61 ND 4.82 ND 2.6 ND 6.23 ND
Silver <I <I <I <2 <1 <2 <I <I <I 1.9 <I <I <I. -
Sodium 1200 3500 ~30 2600 210 5100 170 2600 150 7700 130 390 450
Sulfate 22.4 548 1.64 815 1.5 199 9.9 217 3.8 277 10.2 26.4 8.5
Tantalum <0.2 0.3 <0.2 0.3 <0.2 0.5 <0.2 2 <0.2 0.8 <0.3 0.5 <0.3
Thallium <0.2 <0.2 <0.2 0.7 <0.2 1.7 <0.2 1.3 <0.2 1.7 <0.3 <0.3 <0.2
Thorium 1.1 4.2 1.2 8.8 6.2 19.1 3.5 9.9 1.9 10.4 4.6 6.1 0.9
Uranium <0.2 0.4 <0.2 1.6 I 4.8 0.4 2.4 0.2 5 0.4 0.9 <0.2
Vanadium <0.5 3.8 <0.4 1.3 <1.4 4.6 1.2 3.4 <0.5 4.2 5 9.5 1.1
Zinc 5.3 17 6.1 46 12 74 6.7~ 54 5.5 45 33 47 8.9
Sample sizes are: Qct, n=7; Qbt lg, n=13; Qbt lv, n=23; Qbt 2, n=l9; Qbt 3, n=27; Qbt 4, n=3; Qbo, n=6, except arsenic n=5; Tt, n=5.
(I)- All values are in mg/kg unless otherwise noted. (2) - Units are pCi/g.
ND - Not determined.
max 1800 <0.3 <0.5 23 1.2 890 7.7 2.3 10 2.6
3700 5
510 170 2.8 960 7.15 <I
1900 12.7 0.9 0.9 1.4 0.2 2.8 21
min 1500 <0.2 <0.5
25 <0.14 990 9.7 <I 5.7 0.97 570
1 330 21 <2 430 ND <I 350 10.5 <0.2 <0.2 0.5
<0.3 3.3 18
~
Tt mil X
4500 <0.3 <0.5 69
0.21 2700
67 10 II 16
13000 6.7 950 280 15
1100 ND <I 610 38.6 0.2
<0.3 6.4 0.6 29 41
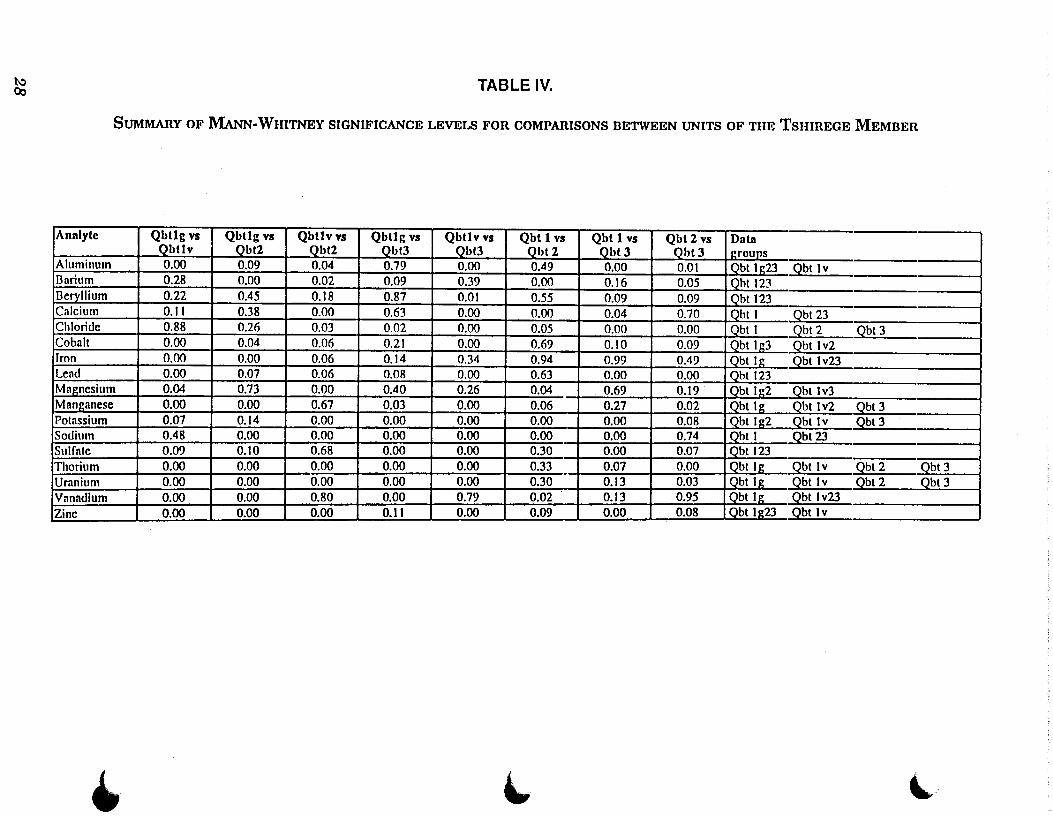
~ Oo TABLE IV.
SUMMARY OF MANN-WHITNEY SIGNIFICANCE LEVELS FOR COMPARISONS BETWEEN UNITS OF THE TSHIREGE MEMBER
Analyte Qbtlg vs Qbtlg vs Qbtlv vs Qbtlg VS Qbtlv vs Qbt 1 VS Qbt 1 vs Qbt 2 VS Data -Obtlv Qbt2 Qbt2 ~ObtJ ~ObtJ Oht2 -ObtJ -QbtJ l!roups
Aluminum 0.00 0.09 0.04 0.79 0.00 0.49 0.00 0.01 Qbt lg23 Qbt lv Barium 0.28 0.00 0.02 0.09 0.39 0.00 0.16 0.05 Qbt 123 IJeryllium 0.22 0.45 0.18 0.87 0.01 0.55 0.09 0.09 Qbt 123 Calcium 0.11 0.38 0.00 0.63 0.00 0.00 0.04 0.70 Qbt I Qbt 23 Chloride 0.88 0.26 0.03 0.02 0.00 0.05 0.00 0.00 Qbt I Qbt 2 Qbt 3 Cobalt 0.00 0.04 0.06 0.21 0.00 0.69 0.10 0.09 Qbt 1g3 Qbt 1v2 Iron 0.00 0.00 0.06 0.14 0.34 0.94 0.99 0.49 Qbt lg Qbt lv23 Lead 0.00 0.07 0.06 0.08 0.00 0.63 0.00 0.00 _Qbt 123 Magnesium 0.04 0.73 0.00 0.40 0.26 0.04 0.69 0.19 Qbt lg2 Qbt lv3 Manganese 0.00 0.00 0.67 0.03 0.00 0.06 0.27 0.02 Qbt 1g Qbt lv2 Qbt 3 Potassium 0.07 0.14 0.00 0.00 0.00 0.00 0.00 0.08 Qbt lg2 Qbt tv Qbt3 Sodium 0.48 0.00 0.00 0.00 0.00 0.00 0.00 0.74 Qbt I Qbt23 Sulfate 0.09 0.10 0.68 0.00 0.00 0.30 0.00 0.07 Qbt 123 Thorium 0.00 0.00 0.00 0.00 0.00 0.33 0.07 0.00 Qbt lg Qbt tv Qbt2 Qbt 3 . Uranium 0.00 0.00 0.00 0.00 0.00 0.30 0.13 0.03 Qbtlg Qbt lv Qbt2 Qbt 3 Vanadium 0.00 0.00 0.80 0.00 0.79 0.02 0.13 0.95 Qbt lg Qbt lv23 Zinc 0.00 0.00 0.00 0.11 0.00 - --~Q.09 0.00 0.08 Obt h~23 Qbttv
• ~ ~
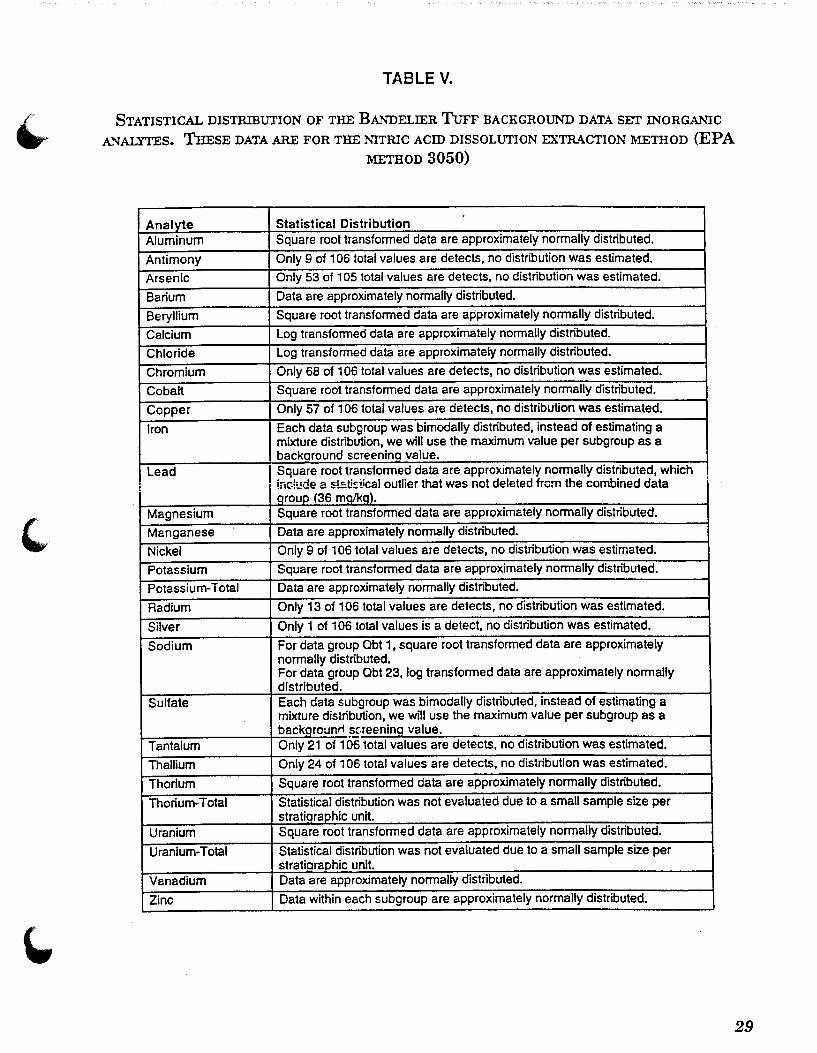
TABLE V.
STATISTICAL DISTRIBUTION OF THE BANDELIER TuFF BACKGROUND DATA SET INORGANIC
ANALYTES. THESE DATA ARE FOR THE NITRIC ACID DISSOLUTION EXTRACTION METHOD (EPA METHOD 3050)
Analyte Statistical Distribution Aluminum Square root transformed data are approximately normally distributed.
Antimony Only 9 of 106 total values are detects, no distribution was estimated.
Arsenic Only 53 of 105 total values are detects, no distribution was estimated.
Barium Data are approximately normally distributed.
Beryllium Square root transformed data are approximately normally distributed.
Calcium Log transformed data are approximately normally distributed.
Chloride Log transformed data are approximately normally distributed.
Chromium Only 68 of 106 total values are detects, no distribution was estimated.
Cobalt Square root transformed data are approximately normally distributed.
Copper Only 57 of 1 06 total values are detects, no distribution was estimated.
Iron Each data subgroup was bimodally distributed, instead of estimating a mixture distribution, we will use the maximum value per subgroup as a background screening value.
Lead Square root transformed data are approximately normally distributed, which
! inc!!.!de a stc.ti~tical outlier that was not deleted frcm the combined data group (36 mQ!kg).
Magnesium Square root transformed data are approximately normally distributed.
Manganese Data are approximately normally distributed.
Nickel Only 9 of 1 06 total values are detects, no distribution was estimated.
Potassium Square root transformed data are approximately normally distributed.
Potassium-Total Data are approximately normally distributed.
Radium Only 13 of 106 total values are detects, no distribution was estimated.
Silver Only 1 of 106 total values is a detect, no distribution was estimated.
Sodium For data group Qbt 1, square root transformed data are approximately normally distributed. For data group Qbt 23, log transformed data are approximately normally distributed.
Sulfate Each data subgroup was bimodally distributed, instead of estimating a mixture distribution, we will use the maximum value per subgroup as a backgrcunrt sc.reening value.
Tantalum Only 21 of 106 total values are detects, no distribution was estimated.
Thallium Only 24 of 106 total values are detects, no distribution was estimated.
Thorium Square root transformed data are approximately normally distributed.
Thorium-Total Statistical distribution was not evaluated due to a small sample size per stratigraphic unit.
Uranium Square root transformed data are approximately normally distributed.
Uranium-Total Statistical distribution was not evaluated due to a small sample size per stratigraphic unit.
Vanadium Data are approximately normally distributed.
Zinc Data within each subgroup are approximately normally distributed.
29
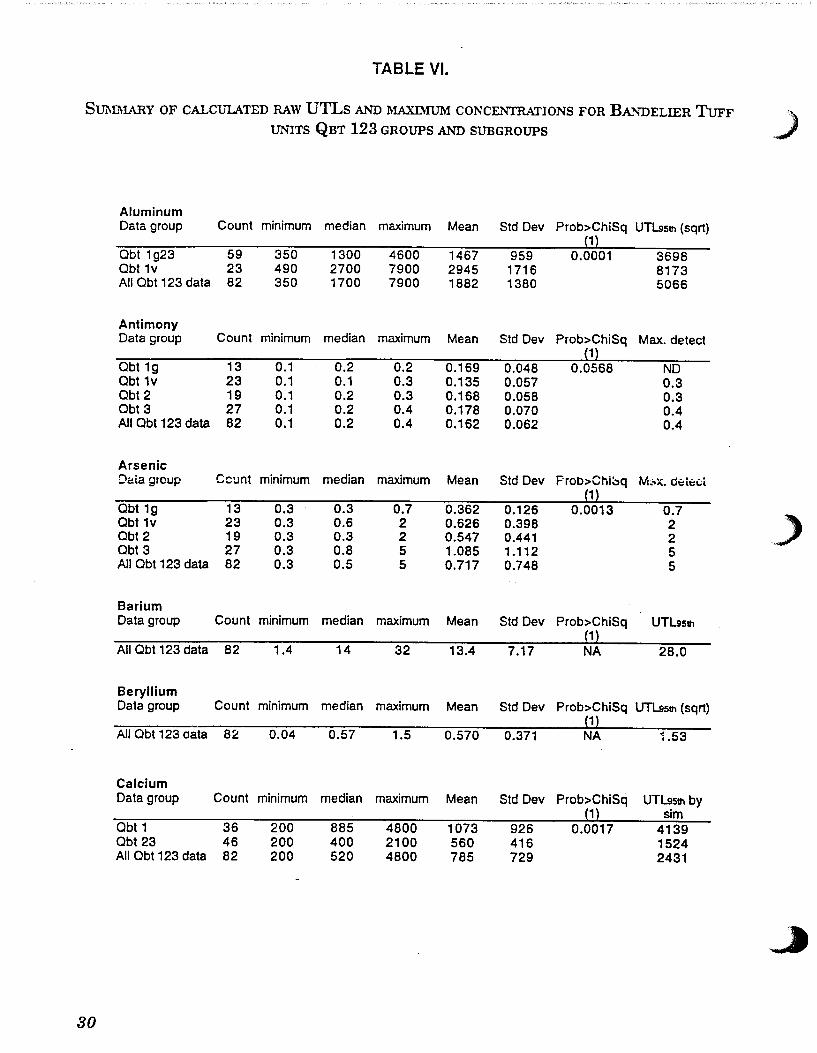
TABLE VI.
SUMMARY OF CALCULATED RAW UTLs AND MAXIMUM CONCE.!VTRATIONS FOR BANDELIER TuFF ) UNJTS QBT 123 GROUPS AND SUBGROUPS . .
Aluminum Data group Count minimum median maximum Mean Std Dev Prob>ChiSq UTL9sth (sqrt)
1 Qbt 1g23 59 350 1300 4600 1467 959 0.0001 3698 Qbt 1v 23 490 2700 7900 2945 1716 8173 All Obt 123 data 82 350 1700 7900 1882 1380 5066
Antimony Data group Count minimum median maximum Mean Std Dev Prob>ChiSq Max. detect
1 Qbt 1g 13 0.1 0.2 0.2 0.169 0.048 0.0568 NO Qbt 1v 23 0.1 0.1 0.3 0.135 0.057 0.3 Obt2 19 0.1 0.2 0.3 0.168 0.058 0.3 Qbt 3 27 0.1 0.2 0.4 0.178 0.070 0.4 All Obt 123 data 82 0.1 0.2 0.4 0.162 0.062 0.4
Arsenic Dc.ia group Ccunt minimum median maximum Mean Std Dev FiOb>Chi~q M~:.,x. dt:it:t:;i
1 Qbt 1g 13 0.3 0.3 0.7 0.362 0.126 0.0013 0.7
_) Qbt 1v 23 0.3 0.6 2 0.626 0.398 2 Qbt2 19 0.3 0.3 2 0.547 0.441 2 Qbt 3 27 0.3 0.8 5 1.085 1.112 5 All Obt 123 data 82 0.3 0.5 5 0.717 0.748 5
Barium Data group Count minimum median maximum Mean Std Dev Prob>ChiSq UTL9sth
1 All Obt 123 data 82 1.4 14 32 13.4 7.17 NA 28.0
Beryllium Data group Count minimum median maximum Mean Std Dev Prob>ChiSq UTL9sth (sqrt)
1 All Obt 123 oata 82 0.04 0.57 1.5 0.570 0.371 NA 1.53
Calcium Data group Count minimum median maximum Mean Std Dev Prob>ChiSq UTL9sth by
1 sim Qbt 1 36 200 885 4800 1073 926 0.0017 4139 Qbt 23 46 200 400 2100 560 416 1524 All Obt 123 data 82 200 520 4800 785 729 2431
30
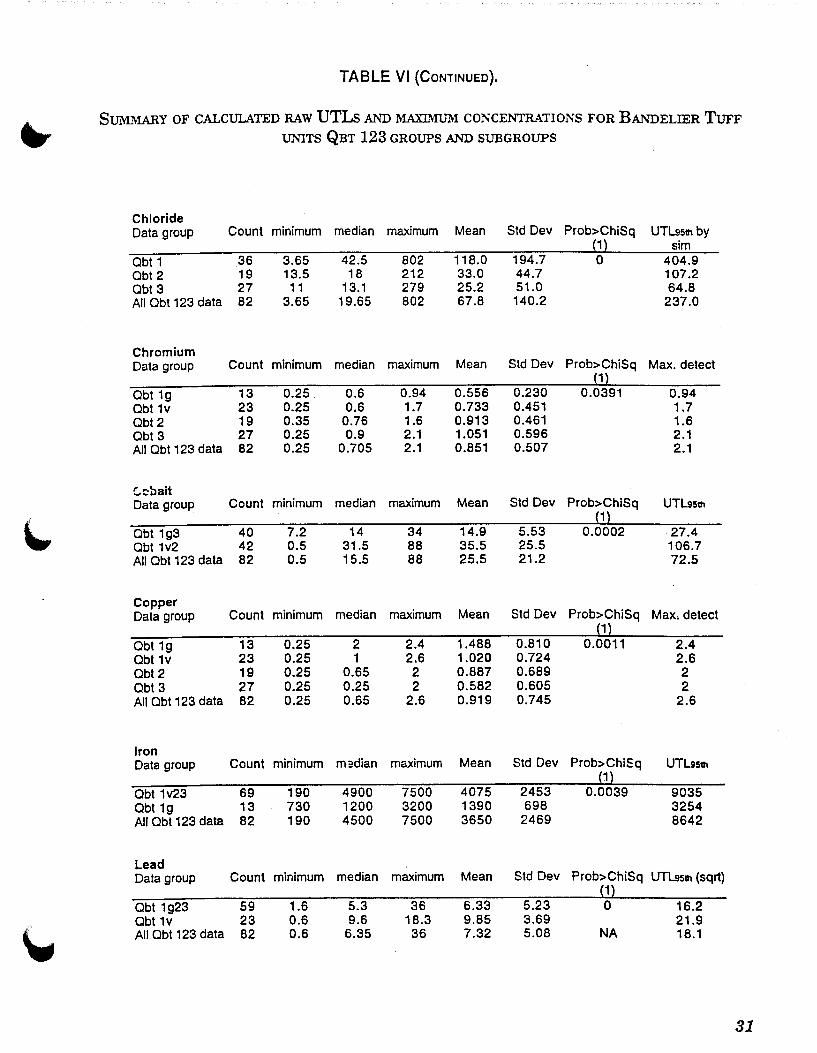
TABLE VI (CONTINUED).
SUMMARY OF CALCULATED RAW UTLs AND MAXIM:UM CONCENTRATIONS FOR BANDELIER TuFF
UNITS QBT 123 GROUPS AND SUBGROUPS
Chloride Data group Count minimum median maximum Mean Std Dev Prob>ChiSq UTL9slll by
1 sim Qbt 1 36 3.65 42.5 802 118.0 194.7 0 404.9 Qbt 2 19 13.5 18 212 33.0 44.7 107.2 Qbt 3 27 11 13.1 279 25.2 51.0 64.8 All Qbt 123 data 82 3.65 19.65 802 67.8 140.2 237.0
Chromium Data group Count minimum median maximum Mean Std Dev Prob>ChiSq Max. detect
1 Qbt 1g 13 0.25 0.6 0.94 0.556 0.230 0.0391 0.94 Qbt 1V 23 0.25 0.6 1.7 0.733 0.451 1.7 Qbt 2 19 0.35 0.76 1.6 0.913 0.461 1.6 Qbt 3 27 0.25 0.9 2.1 1.051 0.596 2.1 All Qbt 123 data 82 0.25 0.705 2.1 0.851 0.507 2.1
::..cbait Data group Count minimum median maximum Mean Std Dev Prob>ChiSq UTL9sth
1 Qbt 1g3 40 7.2 14 34 14.9 5.53 0.0002 27.4 Qbt 1v2 42 0.5 31.5 88 35.5 25.5 106.7 All Qbt 123 data 82 0.5 15.5 88 25.5 21.2 72.5
Copper Data group Count minimum median maximum Mean Std Dev Prob>ChiSq Max. detect
1 Qbt 1g 13 0.25 2 2.4 1.488 0.810 0.0011 2.4 Obt 1v 23 0.25 1 2.6 1.020 0.724 2.6 Qbt 2 19 0.25 0.65 2 0.887 0.689 2 Qbt 3 27 0.25 0.25 2 0.582 0.605 2 All Qbt 123 data 82 0.25 0.65 2.6 0.919 0.745 2.6
Iron Data group Count minimum m~dian maximum Mean Std Dev Prob>ChiSq UTLesth
1 Qbt 1v23 69 190 4900 7500 4075 2453 0.0039 9035 Qbt 1g 13 730 1200 3200 1390 698 3254 All Qbt 123 data 82 190 4500 7500 3650 2469 8642
Lead Data group Count minimum median maximum Mean Std Dev Prob>ChiSq UTL9sth (sqrt)
1 Qbt 1g23 59 1.6 5.3 36 6.33 5.23 0 16.2 Obt 1v 23 0.6 9.6 18.3 9.85 3.69 21.9 All Qbt 123 data 82 0.6 6.35 36 7.32 5.08 NA 18.1
31
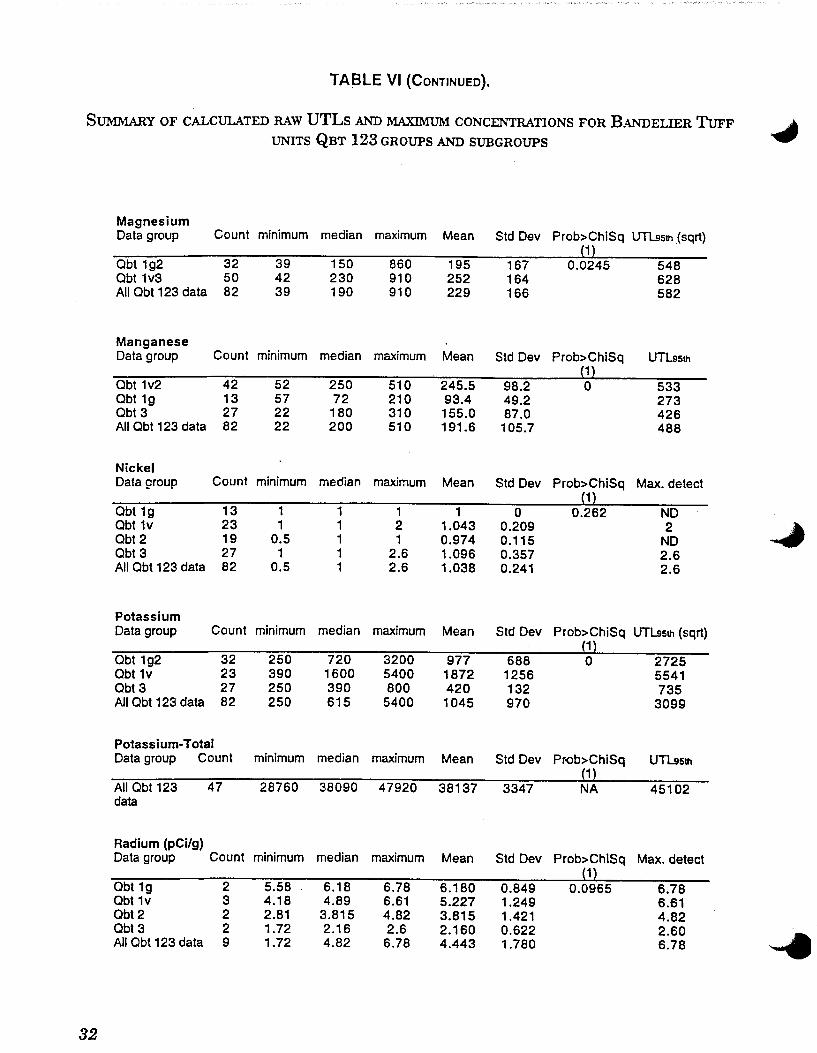
TABLE VI (CONTINUED).
SUMMARY OF CALCULATED RAW UTLs AND MAXIM1JM CONCENTRATIONS FOR BANDELIER TuFF UNITS QBT 123 GROUPS AND SUBGROUPS
Magnesium Data group Count minimum median maximum Mean Std Dev Prob>ChiSq UTLssth (sqrt)
1 Qbt 1g2 32 39 150 860 195 167 0.0245 548 Qbt 1v3 50 42 230 910 252 164 628 All Qbt 123 data 82 39 190 910 229 166 582
Manganese Data group Count minimum median maximum Mean Std Dev Prob>ChiSq UTL9slh
1 Obt 1v2 42 52 250 510 245.5 98.2 0 533 Qbt 1g 13 57 72 210 93.4 49.2 273 Qbt 3 27 22 180 310 155.0 87.0 426 All Obt 123 data 82 22 200 510 191.6 105.7 488
Nickel Data group Count minimum median maximum Mean Std Dev Prob>ChiSq Max. detect
1 Qbt 1g 13 1 1 1 1 0 0.262 NO Qbt 1v 23 1 1 2 1.043 0.209 2 Obt 2 19 0.5 1 1 0.974 0.115 NO Qbt 3 27 1 1 2.6 1.096 0.357 2.6 All Obt 123 data 82 0.5 1 2.6 1.038 0.241 2.6
Potassium Data group Count minimum median maximum Mean Std Dev Prob>ChiSq UTLsslh (sqrt)
1 Qbt 1g2 32 250 720 3200 977 688 0 2725 Qbt 1v 23 390 1600 5400 1872 1256 5541 Qbt 3 27 250 390 BOO 420 132 735 All Obt 123 data 82 250 615 5400 1045 970 3099
Potassium-Total Data group Count minimum median maximum Mean Std Dev Pr<>b>ChiSq UTL9slh
1 All Qbt 123 47 28760 38090 47920 38137 3347 NA 45102 data
Radium (pCi/g) Data group Count minimum median maximum Mean Std Oev Prob>ChiSq Max. detect
1 Qbt 1g 2 5.58 6.18 6.78 6.180 0.849 0.0965 6.78 Obt 1v 3 4.18 4.89 6.61 5.227 1.249 6.61 Qbt2 2 2.81 3.815 4.82 3.815 1.421 4.82 Qbt 3 2 1.72 2.16 2.6 2.160 0.622 2.60 All Qbt 123 data 9 1.72 4.82 6.78 4.443 1.780 6.78
32
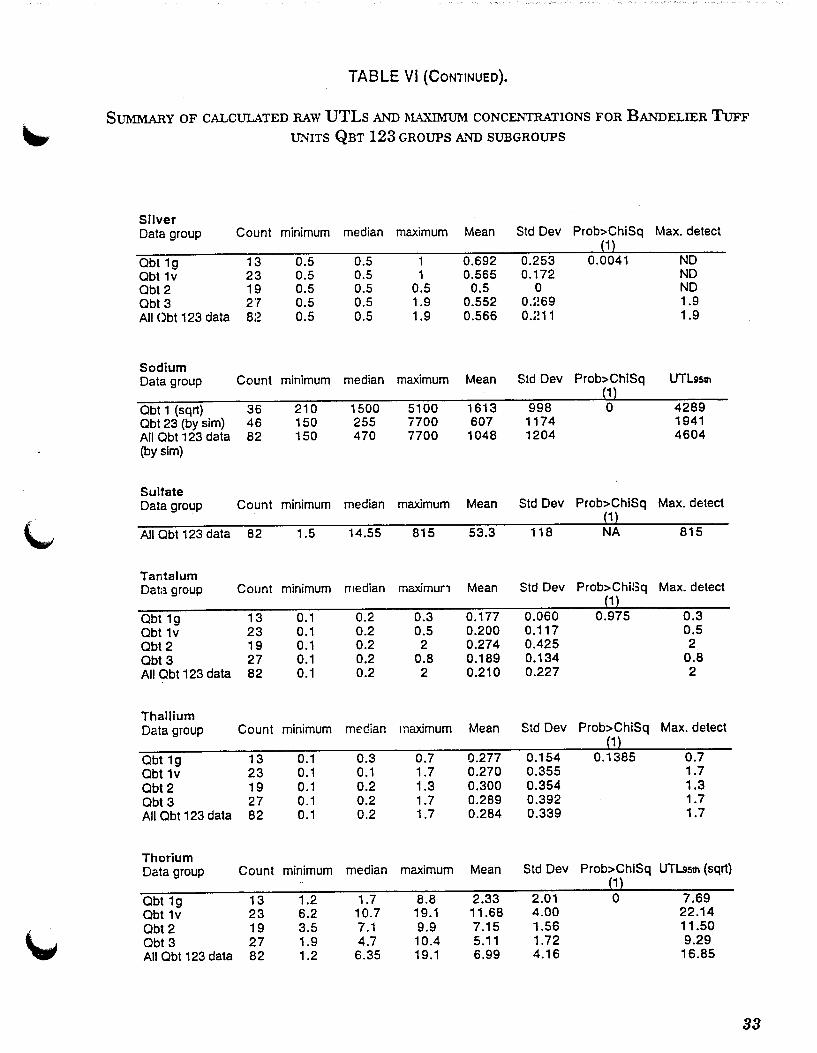
TABLE VI (CONTINUED).
SUMMARY OF CALCULATED RAW UTLs AND MAXIMlThl CONCEi"--"TR.ATIONS FOR BANDELIER TuFF
UNITS QBT 123 GROUPS AND SUBGROUPS
Silver Data group Count minimum median maximum Mean Std Dev Prob>ChiSq Max. detect
1 Obt 1g 13 0.5 0.5 1 0.692 0.253 0.0041 NO Obt 1v 23 0.5 0.5 1 0.565 0.172 NO Obt 2 19 0.5 0.5 0.5 0.5 0 NO Obt 3 27 0.5 0.5 1.9 0.552 0.~!69 1.9 All Obt 123 data 8:2 0.5 0.5 1.9 0.566 0.:!11 1.9
Sodium Data group Count minimum median maximum Mean Std Dev Prob>ChiSq UTL.ss111
1 Obt 1 (sqrt) 36 210 1500 5100 1613 998 0 4289 Obt 23 (by sim) 46 150 255 7700 607 1174 1941 All Obt 123 data 82 150 470 7700 1048 1204 4604 (by sim)
Sulfate Data group Count minimum median maximum Mean Std Dev Prob>ChiSq Max. detect
1 All Obt 123 data 82 1.5 14.55 815 53.3 118 NA 815
Tantalum Data group Count minimum median maximun Mean Std Dev Prob>ChiSq Max. detect
1
Qbt 1g 13 0.1 0.2 0.3 0.177 0.060 0.975 0.3 Obt 1v 23 0.1 0.2 0.5 0.200 0.117 0.5 Obt 2 19 0.1 0.2 2 0.274 0.425 2 Obt3 27 0.1 0.2 0.8 0.189 0.134 0.8 All Obt 123 data 82 0.1 0.2 2 0.210 0.227 2
Thallium Data group Count minimum median maximum Mean Std Dev Prob>ChiSq Max. detect
1
Obt 1g 13 0.1 0.3 0.7 0.277 0.154 0.1385 0.7 Obt 1v 23 0.1 0.1 1.7 0.270 0.355 1.7 Obt2 19 0.1 0.2 1.3 0.300 0.354 1.3 Obt 3 27 0.1 0.2 1.7 0.289 0.392 1.7 All Obt 123 data 82 0.1 0.2 1.7 0.284 0.339 1.7
Thorium Data group Count minimum median maximum Mean Std Dev Prob>ChiSq UTL9slh (sqrt)
1
Obt 1g 13 1.2 1.7 8.8 2.33 2.01 0 7.69 Qbt1v 23 6.2 10.7 19.1 11.68 4.00 22.14 Obt 2 19 3.5 7.1 9.9 7.15 1.56 11.50 Qbt 3 27 1.9 4.7 10.4 5.11 1.72 9.29 All Obt 123 data 82 1.2 6.35 19.1 6.99 4.16 16.85
33
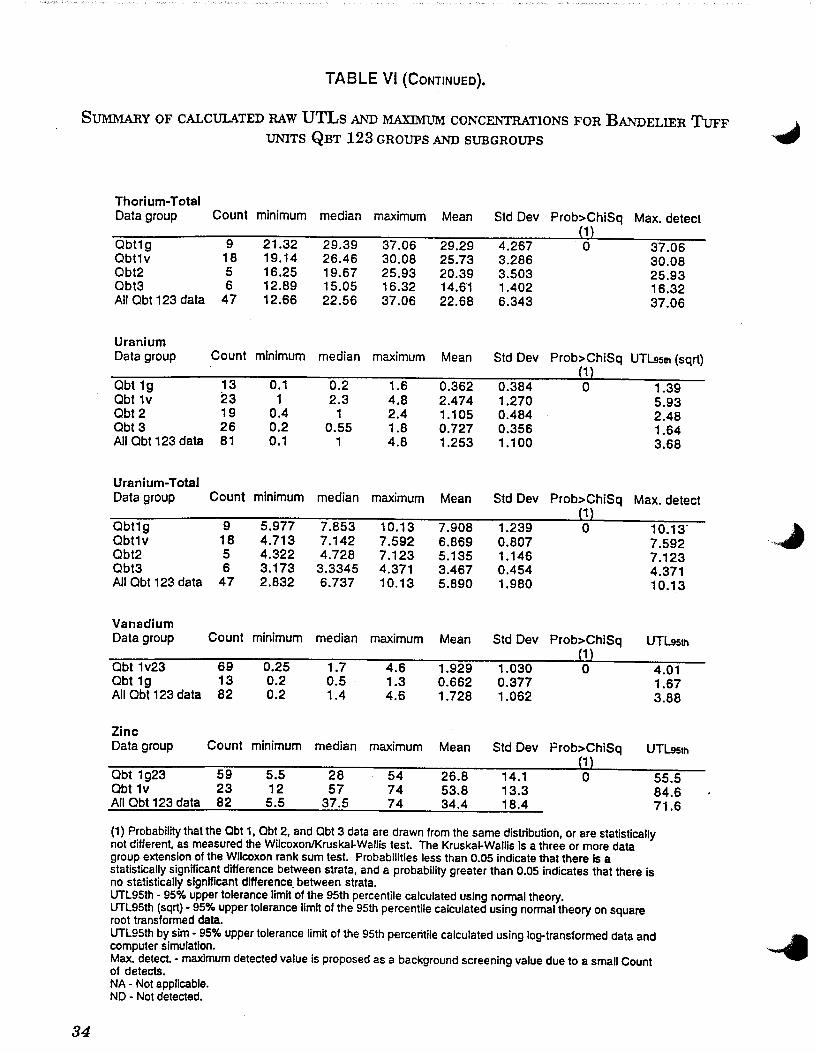
TABLE VI {CONTINUED).
SUMMARY OF CALCULATED RAW UTLs AND MAXIMUM CONCENTRATIONS FOR BANDELIER TuFF UNITS QBT 123 GROUPS AND SUBGROUPS
Thorium-Total Data group Count minimum median maximum Mean Std Dev Prob>ChiSq Max. detect
1 Qbt1g 9 21.32 29.39 37.06 29.29 4.267 0 37.06 Qbt1v 18 19.14 26.46 30.08 25.73 3.286 30.08 Qbt2 5 16.25 19.67 25.93 20.39 3.503 25.93 Qbt3 6 12.89 15.05 16.32 14.61 1.402 16.32 All Obt 123 data 47 12.66 22.56 37.06 22.68 6.343 37.06
Uranium Data group Count minimum median maximum Mean Std Dev Prob>ChiSq UTL9slh (sqrt)
1 Qbt 1g 13 0.1 0.2 1.6 0.362 0.384 0 1.39 Qbt 1v 23 1 2.3 4.8 2.474 1.270 5.93 Qbt2 19 0.4 1 2.4 1.105 0.484 2.48 Obt3 26 0.2 0.55 1.8 0.727 0.356 1.64 All Qbt 123 data 81 0.1 1 4.8 1.253 1.100 3.68
Uranium-Total Data group Count minimum median maximum Mean Std Dev Prob>ChiSq Max. detect
1 Qbt1g 9 5.977 7.853 10.13 7.908 1.239 0 10.13" Obt1v 18 4.713 7.142 7.592 6.869 0.807 7.592 Qbt2 5 4.322 4.728 7.123 5.135 1.146 7.123 Obt3 6 3.173 3.3345 4.371 3.467 0.454 4.371 All Obt 123 data 47 2.832 6.737 10.13 5.890 1.980 10.13
Vanadium Data group Count minimum median maximum Mean Std Dev Prob>ChiSq UTLsstn
1 Qbt 1v23 69 0.25 1.7 4.6 1.929 1.030 0 4.01 Qbt 1g 13 0.2 0.5 1.3 0.662 0.377 1.67 All Obt 123 data 82 0.2 1.4 4.6 1.728 1.062 3.88
Zinc Data group Count minimum median maximum Mean Std Dev Prob>ChiSq UTL9sth
1 Qbt 1g23 59 5.5 28 54 26.8 14.1 0 55.5 Obt1v 23 12 57 74 53.8 13.3 84.6 All Obt 123 data 82 5.5 37.5 74 34.4 18.4 71.6
(1) Probability that the Obt 1, Qbt 2, and Qbt 3 data are drawn from the same distribution, or are statistically not different, as measured the Wilcoxon/Kruskai·Walfis test. The Kruskai-Wallis is a three or more data group extension of the Wilcoxon rank sum test. Probabilities less than 0.05 indicate that there is a statistically significant difference between strata, and a probability greater than 0.05 indicates that there is no statistically significant difference. between strata. UTL95th - 95% upper tolerance limit of the 95th percentile calculated using normal theory. UTL95th (sqrt) • 95% upper tolerance limit of the 95th percentile calculated using normal theory on square root transformed data. UTL95th by sim • 95% upper tolerance limit of the 95th percentile calculated using log-transformed data and computer simulation. Max. detect. - maximum detected value is proposed as a background screening value due to a small Count of detects. NA - Not applicable. ND - Not detected.
34
·~
_..
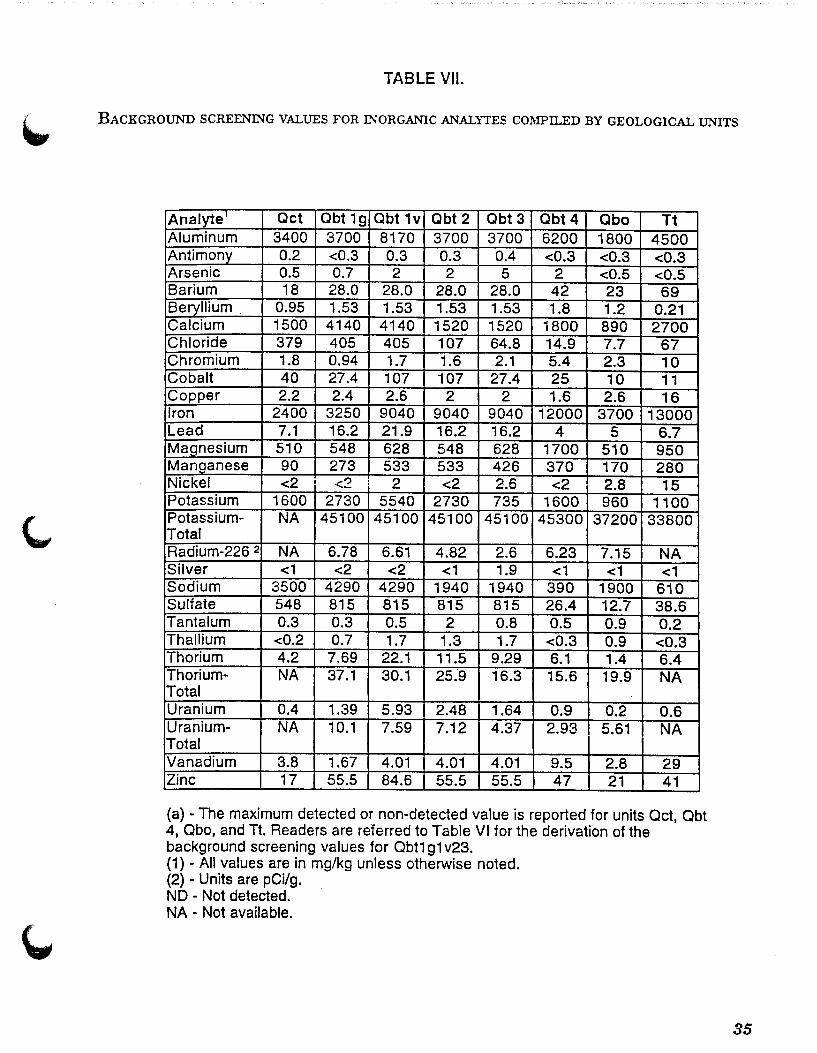
TABLE VII.
BACKGROUND SCREENING VALUES FOR INORGANIC ANALYTES COMPILED BY GEOLOGICAL UNITS
Analyte• Oct Qbt 1g Qbt 1V Qbt 2 Qbt 3 Qbt 4 Obo Tt Aluminum 3400 3700 8170 3700 3700 6200 1800 4500 Antimony 0.2 <0.3 0.3 0.3 0.4 <0.3 <0.3 <0.3 Arsenic 0.5 0.7 2 2 5 2 <0.5 <0.5 Barium 18 28.0 28.0 28.0 28.0 42 23 69 Beryllium 0.95 1.53 1.53 1.53 1.53 1.8 1.2 0.21 Calcium 1500 4140 4140 1520 1520 1800 890 2700 Chloride 379 405 405 107 64.8 14.9 7.7 67 Chromium 1.8 0.94 1.7 1.6 2.1 5.4 2.3 10 Cobalt 40 27.4 107 107 27.4 25 10 11 Copper 2.2 2.4 2.6 2 2 1.6 2.6 16 Iron 2400 3250 9040 9040 9040 12000 3700 13000 Lead 7.1 16.2 21.9 16.2 16.2 4 5 6.7 Magnesium 510 548 628 548 628 1700 510 950 Manganese 90 273 533 533 426 370 170 280 Nickel <2 I <2 : 2 <2 2.6 <2 2.8 15 Potassium 1600 2730 5540 2730 735 1600 960 1100 Potassium- NA 45100 45100 45100 45100 45300 37200 33800 Total Radium-226 2 NA 6.78 6.61 4.82 2.6 6.23 7.15 NA Silver <1 <2 <2 <1 1.9 <1 <1 <1 Sodium 3500 4290 4290 1940 1940 390 1900 610 Sulfate 548 815 815 815 815 26.4 12.7 38.6 Tantalum 0.3 0.3 0.5 2 0.8 0.5 0.9 0.2 Thallium <0.2 0.7 1.7 1.3 1.7 <0.3 0.9 <0.3 Thorium 4.2 7.69 22.1 11.5 9.29 6.1 1.4 6.4 Thorium- NA 37.1 30.1 25.9 16.3 15.6 19.9 NA Total Uranium 0.4 1.39 5.93 2.48 1.64 0.9 0.2 0.6 Uranium- NA 10.1 7.59 7.12 4.37 2.93 5.61 NA Total Vanadium 3.8 1.67 4.01 4.01 4.01 9.5 2.8 29 Zinc 17 55.5 84.6 55.5 55.5 47 21 41
(a) -The maximum detected or non-detected value is reported for units Oct, Qbt 4, Qbo, and Tt. Readers are referred to Table VI for the derivation of the background screening values for Qbt1 g1 v23. (1) - All values are in mg/kg unless otherwise noted. (2) - Units are pCi/g. ND - Not detected. NA - Not available.
35
Inorganic Analytes
Aluminum (AI)
All of the 1 06 leachable aluminum concentrations were above ICPES detection limits. Square root transformed aluminum data are approximately normally distributed. Aluminum concentrations for all geologic units range from 350 to 14000 mg/kg and average 2187 mglkg.
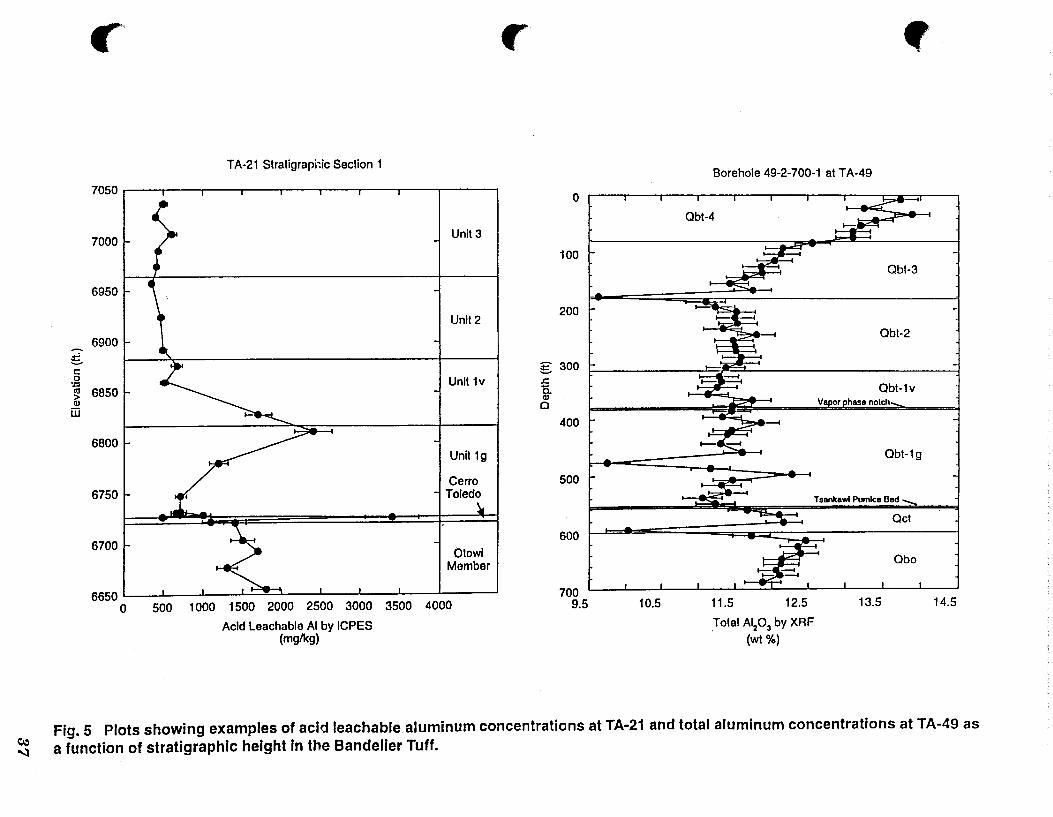
Population characteristics from the Wilcoxon rank sum test (Table IV) and box plots (Fig. 4) resulted in pooling the aluminum data for Obt 1 g, Obt 2, and Obt 3 (as Qbt 1 g23) and Qbt 1 v as a separate data group. Box plots comparing acid leachable aluminum by geologic unit show that medians, arithmetic means, and middle 50 percent ranges are distinctly greater for units Obt 1v and Obt 4 than for the other units (Fig. 4). Plots of leachable aluminum from individual stratigraphic sections show aluminum concentrations increase up section towards Obt 1 v before decreasing in the overlying tuffs (Fig. 5).
The background screening values for leachable aluminum are 4500 mg/kg for Tt, 1800 mglkg for Obo, 3400 mg/kg for Oct, 8170 mg/kg for Qbt 1 v, 3700 mg/kg for Qbt 1 g, Qbt 2, and Obt 3, and 6200 mg/kg for Obt 4. These background screening values are lower than the aluminum SAL of 77000 mg/kg.
Total aluminum concentrations by XRF and INAA tend to increase up section through the . -,. Tshirege Member (Fig. 5). Aluminum concentrations in the upper Otowi Member are slightly -' elevated with respect to the lower Tshirege Member. Comparison of acid leachable and total aluminum data for the Bandelier Tuff shows that approximately 10% to 25% of the total alumi-num in the rock is leachable by nitric acid at a pH of 1.
Antimony (Sb)
Nine of the 1 06 leachable antimony concentrations were above ICPMS detection limits of 0.2 to 0.3 mglkg. No statistical distribution of the antimony was estimated because of the limited number of detects. For samples above detection limits, leachable antimony concentrations range from 0.2 to 0.4 mg/kg and average 0.256 mg/kg.
The background screening values for leachable antimony are based on maximum detected concentrations in each rock unit. Background screening values are <0.3 mg/kg for Tt, <0.3 mg/kg for Obo, 0.2 mglkg for Oct, <0.3 mg/kg for Qbt 1 g, 0.3 mg/kg for Qbt 1 v, 0.3 mg/kg for Obt 2, 0.4 mglkg for Qbt 3, and <0.3 mglkg for Qbt 4. Background screening values for antimony in all rock units are well below the SAL of 31 mg/kg for soils and rock.
Only two of 38 samples analyzed by INAA had total antimony concentrations above detection limits which ranged between 0.2 and 0.7 mglkg. The maximum detected total antimony con- , •. centration was 0.7 mg/kg. ~
36
c.., '-l
~' "' ' TA-21 Stratigraphic Section 1
Borehole 49-2-700-1 at TA-49
7050. 0 I I I I I I I ~~---~
Qbt-4 I I
7000 Unit3
100
6950
Unit 2 200
6900. ~ ~ Obt-2
:S c: g 300
.Q Unit 1v .I:.
~ 6850 a. t ~· . Obt-1v Q)
Q)
iii 0
400
6800 Unit 1g ~ - ·>e I Obt-1g
Cerro 500 6750 1- .... i Toledo I . •.c=::·- Tsankawl Pumlca Bed
Oct I --
6700 1- ...-.;:;:_ 1 600
6650 I ~ I M~~:. I ~ l=:r:3" Qbo
I I I I I 700 0 500 1000 1500 2000 2500 3000 3500 4000 9.5 10.5 11.5 12.5 13.5 14.5
Acid Leachable AI by ICPES Total A1p3 by XRF (mglkg) (wt %)
Fig. 5 Plots showing examples of acid leachable aluminum concentrations at TA-21 and total aluminum concentrations at TA-49 as a function of stratigraphic height In the Bandelier Tuff.
Arsenic (As)
Fifty-three of the 105 leachable antimony concentrations were above ETVAA detection limit of 0.5 mg/kg. No statistical distribution of the antimony was estimated because of the large number of non detects. For samples above detection limits, leachable antimony concentrations range from 0.5 to 5 mg/kg and average 1.08 mg/kg.
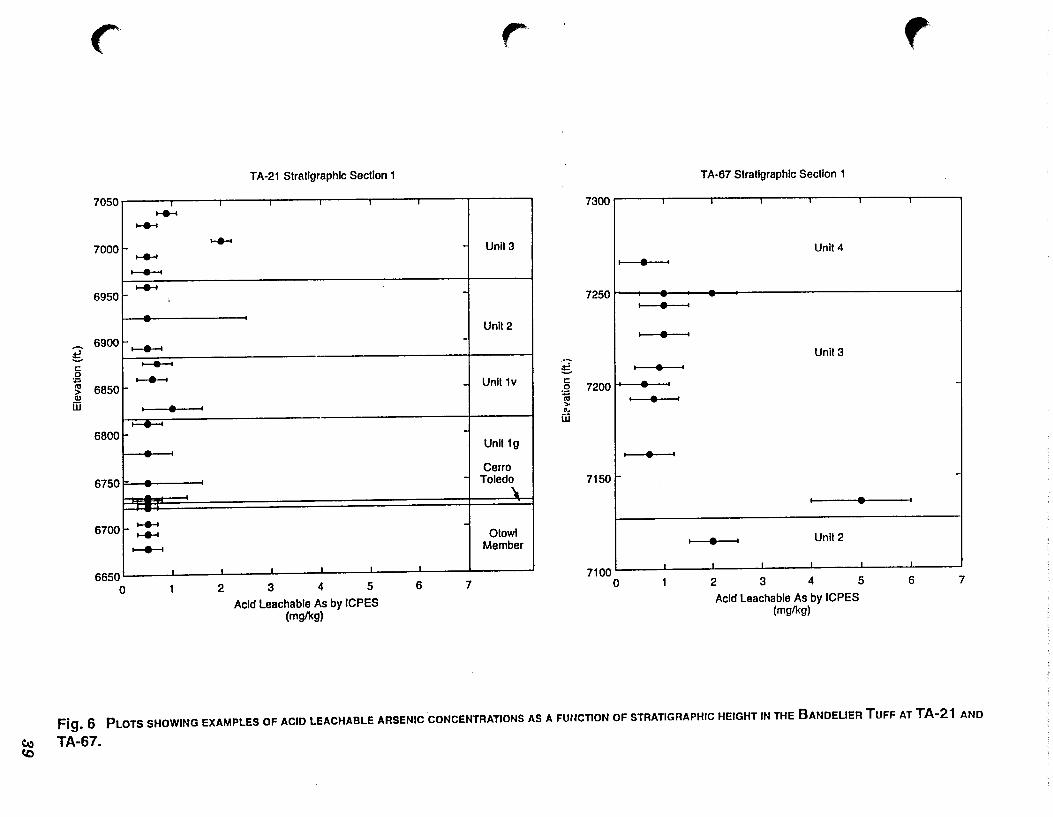
Box plots comparing acid leachable arsenic by geologic unit show that the middle 50 percent ranges are somewhat greater for units Obt 3 and Qbt 4 than for the other units (Fig. 4). However, plots of leachable arsenic from individual stratigraphic sections fail to show any clear pattern of arsenic concentration variation as a function of stratigraphic height (Fig. 6).
The background screening values for leachable arsenic are based on maximum detected concentrations in each rock unit. Background screening values are <0.5 mg/kg for Tt, <0.5 mg/kg for Qbo, 0.5 mg/kg fqr Oct, 0.7 mg/kg for Obt 1 g, 2 mg/kg for Qbt 1 v, 2 mg/kg for Qbt 2, 5 mg/kg for Qbt 3, and 2 mg/kg for Qbt 4. All of the background screening values exceed the SAL of 0.32 mg/kg.
Total arsenic concentrations by INAA were below detection limits for 61% of the samples. Concentrations ranged from 1.0 to 3.1 mg/kg for samples with total arsenic above the detection limit. Detection limits ranged from 1 to 4 mglkg.
Barium (Ba)
All of the 106 leachable barium concentrations were above ICPES detection limits. Leachable barium data are approximately normally distributed. Barium concentrations for all geologic units range from 1.4 to 190 mglkg and average 18.5 mg!kg.
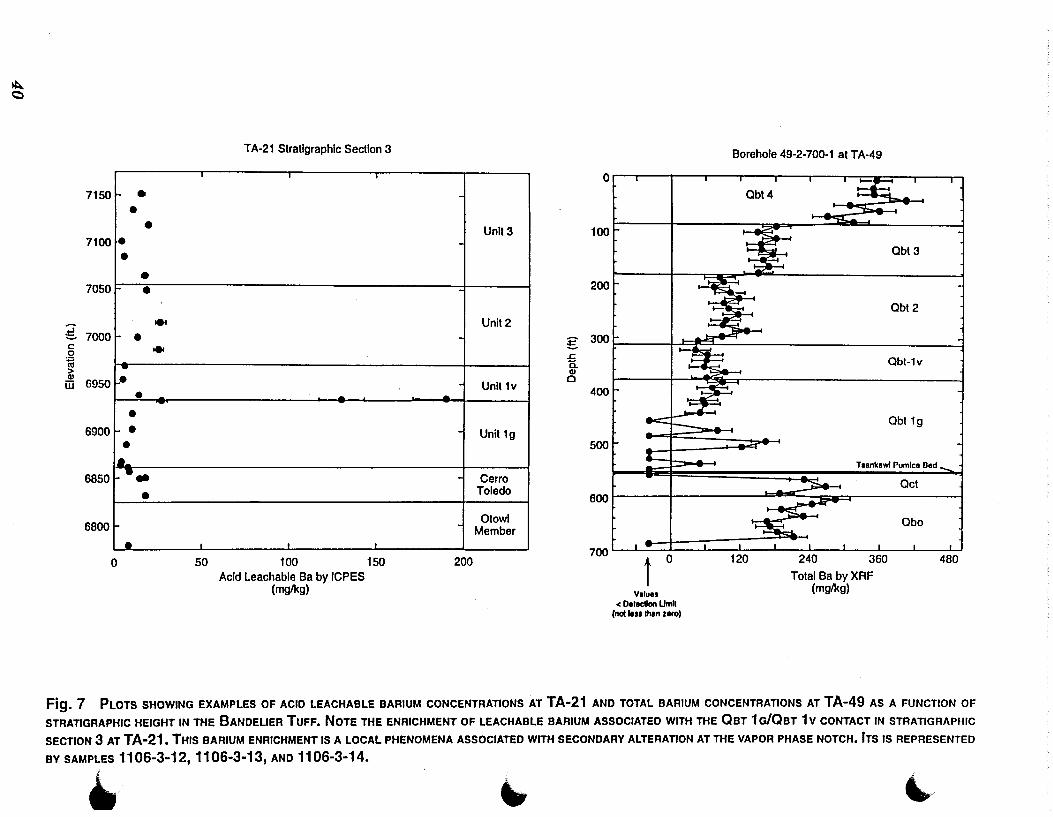
Population characteristics from the Wilcoxon rank sum test (Table IV) and box plots (Fig. 4) resulted in pooling the barium data for Qbt 1g, Obt 1v, Qbt 2, and Qbt 3 (as Qbt 123). Box plots comparing acid leachable barium by geologic unit show that medians, arithmetic means, and middle 50 percent ranges are greater for units Tt and Qbt 4 than for the other units (Fig. 4). Plots of leachable barium at individual stratigraphic sections supports the pooling of the leachable data set Qbt 123 (Fig. 7).
The background screening values for leachable barium are 69 mg/kg for Tt, 23 mglkg for Qbo, 18 mg/kg for Qct, 42 mg/kg for Obt 4, and 28 mg/kg for Qbt 1 g, Qbt 1 v, Qbt 2, and Qbt 3. Background screening values for barium in these rock units are well below the SAL of 5300 mg/kg.
Total barium concentrations by XRF tend to increase up section through the Tshirege Member (Fig. 7). The highest concentrations of total barium occur in Qbt 4 which contains about three times as much barium as the base of the Tshirege Member. Barium concentrations in the upper Otowi Member are about twice that found in the lower Tshirege Member. Comparison of acid leachable and total barium data for the Bandelier Tuff shows that approximately 5 to 30% of the total barium in the rock is leachable by nitric acid at a pH of 1.
38
r
7050
7000
6950
~ 6900 ~ c 0
~ > Q)
iii 6850
6800
6750
6700
6650 0
r ..........
..........
.......... ._._...
.......... ;
._._... ._._...
._._...
I • ._._...
..........
.......... ~
I
TA-21 Stratigraphic Section 1
..........
2 3 4 5
Acid Leachable As by ICPES (mglkg)
-
-
6 7
,.
Unit3
!
Unll2
~ c
~ Unll1v
... .. [ij
Unll1g
Cerro Toledo
-~
Otowi Member
TA-67 Stratigraphic Section 1
7300
Uni14
7200~. I
Uni13
I • I
7150
I • I Unll2
7100 1 2 0 3 4 5
Acid Leachable As by ICPES (mg/kg)
r
6 7
Fig. 6 PLOTS SHOWING EXAMPLES OF ACID LEACHABLE ARSENIC CONCENTRATIONS AS A FUNCTION OF STRATIGRAPHIC HEIGHT IN THE BANDELIER TUFF AT TA-21 AND
~ TA-67. (0
~ c
I 7150 • • • 7100 ..
• •
7050 ~='-•
~
~ 7000 • c: 0
~ > --.. CD
6950 [ij • t-• •
6900 • • 6850 1-'t-..
• 6800 1-
I e 0
• •
-._
I
50
TA-21 Stratigraphic Section 3
I
-
I I
100 150 Acid Leachable Ba by ICPES
(mglkg)
~ I
Unlt3
-
Unit2
I I
- Unit 1v
-
Unit1g
-Cerro
Toledo -
Otowi Member
J 200
Borehole 49-2-700-1 at TA-49
Qi I I I I I I I~ I II
Obt4
100
Obt3
200
Obt2
g 300~ £ I~ g 1 a. Obt-1v
400
Obi 1g
500
Tsankawl Pumice Bed
600r I 3 0 =:::;; I Oct 1 Obo
700 t 0 120 240 360 480 Total Ba by XRF
(mglkg) Voiuas
< Oaiacilon Umil (nol lassihan zero)
Fig. 7 PLOTS SHOWING EXAMPLES OF ACID LEACHABLE BARIUM CONCENTRATIONS AT TA-21 AND TOTAL BARIUM CONCENTRATIONS AT TA-49 AS A FUNCTION OF
STRATIGRAPHIC HEIGHT IN THE BANDELIER TUFF. NOTE THE ENRICHMENT OF LEACHABLE BARIUM ASSOCIATED WITH THE 0BT 1G/0BT 1v CONTACT IN STRATIGRAPHIC
SECTION 3 AT TA-21. THIS BARIUM ENRICHMENT IS A LOCAL PHENOMENA ASSOCIATED WITH SECONDARY ALTERATION AT THE VAPOR PHASE NOTCH. ITs IS REPRESENTED
BY SAMPLES 11 06-3-12, 11 06-3-13, AND 11 06-3-14 • .. " ~·
Beryllium (Be)
Ninety-three of the 106 leachable beryllium concentrations were above ICPES detection limits of 0.0 to 0.14 mg/kg. Square root transformed beryllium data are approximately normally distributed. For samples above detection limits, beryllium concentrations for all geologic units range from 0.15 to 3.4 mg/kg and average 0.70 mglkg.
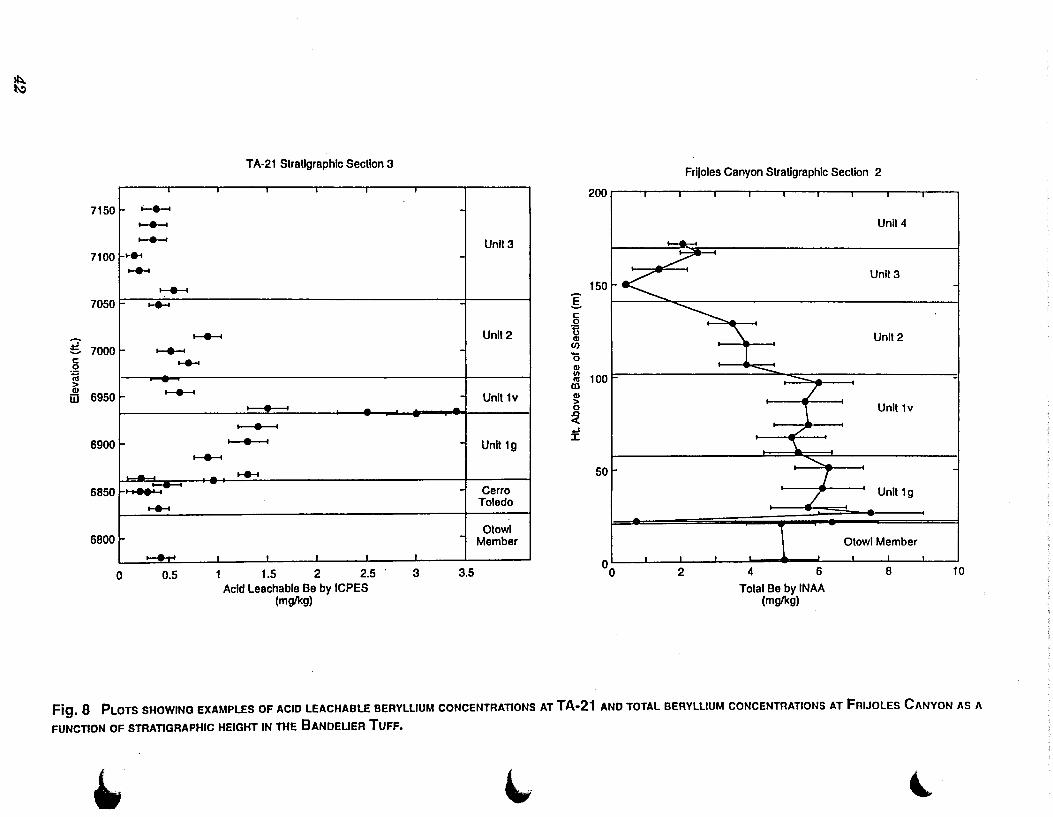
Population characteristics from the Wilcoxon rank sum test (Table IV) resulted in pooling the beryllium data for Qbt 1 g, Qbt 1 v, Qbt 2, and Qbt 3 (as Obt 123). Box plots comparing acid leachable beryllium by geologic unit show that medians, arithmetic means, and middle 50 percent ranges are generally less for units Tt, Obo, Oct, Obt 3 and Qbt 4 than for the other units (Fig. 4). Plots of leachable beryllium from individual stratigraphic sections show that in the Tshirege Member, beryllium concentrations increase up section from the base of the unit towards the Obt 1 g/Obt 1 v contact before decreasing in the overlying tuff units (Fig. 8). Enrichment of leachable beryllium at the Obt 1 g/Qbt 1 v contact coincides with the vapor phase notch that separates two units. The vapor phase notch frequently has an unusual geochemistry suggestive of secondary alteration concentrated along a boundary of contrasting rock
lithologies.
The background screening "..'~lues for !..:achable bery'llium are 0.21 mg/!<g forTt, 1.2 mglkg for Qbo, 0.95 mg/kg for Oct, 1.8 mg/kg for Obt 4, and 1.53 mg/kg for Obt 1 g, Obt 1 v, Qbt 2, and Obt 3. All of the background screening values exceed the SAL of 0.14 mg/kg.
Total beryllium concentrations by INM decrease up section through the Tshirege Member (Fig. 8). The highest concentrations of total beryllium occur in units Obt 1 g and Obt 1 v which contain approximately twice as much beryllium as units 3 and 4. Beryllium concentrations in the upper Otowi Member are slightly lower than those found in the lower part of the Tshirege Member. Comparison of acid leachable and total beryllium data for the Bandelier Tuff shows that approximately 15 to 50% of the total beryllium in the rock is leachable by nitric acid at a
pH of 1.
Cadmium (Cd}
Leachable cadmium concentrations were not determined for this investigation because total cadmium was not detected in the samples analyzed by INAA. All38 of the samples analyzed by INAA had total cadmium concentrations below the detection limit of 1 mg/kg. Thus naturally cadmium concentrations are well below the SAL of 38 mglkg.
Calcium (Ca)
All of the 106 leachable calcium concentrations were above ICPES detection limits. Log transformed calcium data are approximately normally distributed. Calcium concentrations for all geologic units range from 200 to 4800 mglkg and average 825 mg/kg.
41
~
7150 ~ ~
~
7100 t+4
~
~
7050 ....... ~
:E. 7000 ~ c: 0 ....... ·~ > m 6950
,_._.
6900 ~
6850 ..............
6800
0 0.5
TA-21 Stratigraphic Section 3
I • I
._._...._. ..._...._.
.......
1.5 2 2.5 Acid Leachable Be by ICPES
(mg/kg)
Unlt3
Unlt2
Unit 1g
Cerro Toledo
3 3.5
200
150
I c: 0
ts Cll en 0
Cll Ill 100 "' m Cll > 0
~ ~ :X:
50
00
Frijoles Canyon Stratigraphic Section 2
.......__.
~
< ~
\.
-I
2
I - -./ l
./ "'\..
............
I ./
4 6
Total Be by INAA (mg/kg)
Unit4
Unil3
Unlt2
Unit 1v
Unit 1g
Otowi Member I
8 10
Fig. 8 PLOTS SHOWING EXAMPLES OF ACID LEACHABLE BERYLLIUM CONCENTRATIONS AT TA-21 AND TOTAL BERYLLIUM CONCENTRATIONS AT FRIJOLES CANYON AS A
FUNCTION OF STRATIGRAPHIC HEIGHT IN THE BANDELIER TUFF.
.. '-' ~
'-·
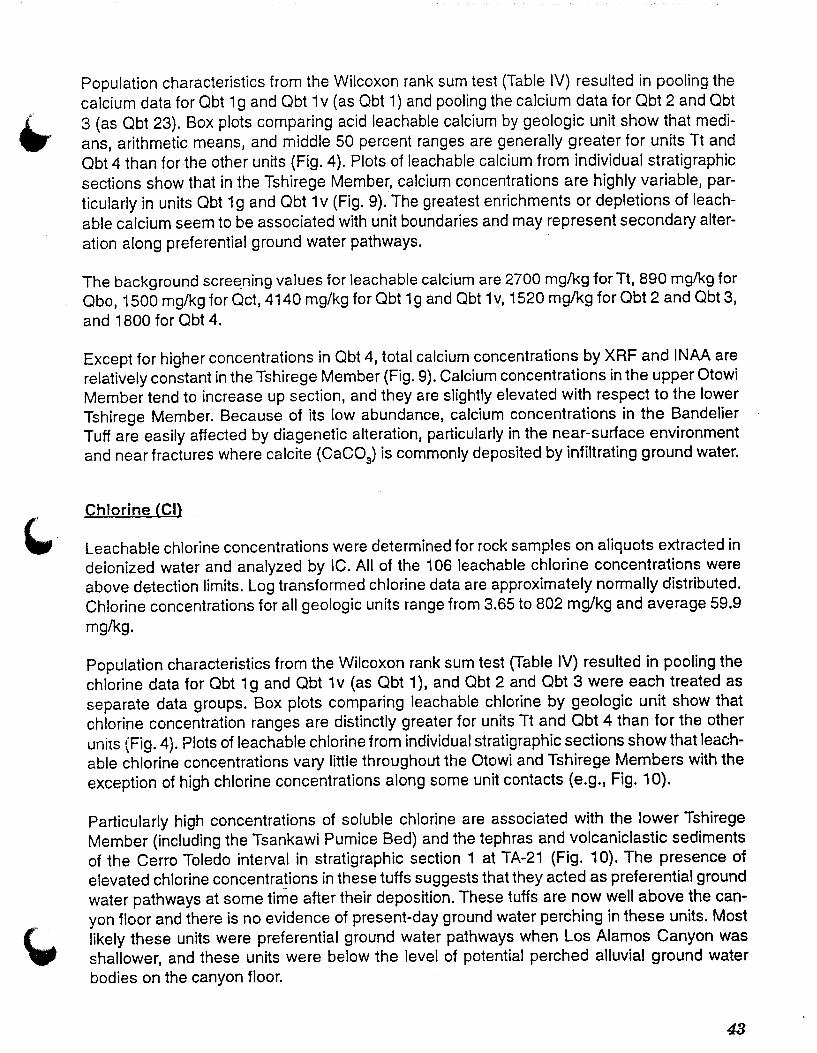
Population characteristics from the Wilcoxon rank sum test (Table IV) resulted in pooling the
calcium data for Obt 1 g and Obt 1 v (as Obt 1) and pooling the calcium data for Obt 2 and Obt
3 (as Qbt 23). Box plots comparing acid leachable calcium by geologic unit show that medi
ans, arithmetic means, and middle 50 percent ranges are generally greater for units Tt and
Obt 4 than for the other units (Fig. 4). Plots of leachable calcium from individual stratigraphic
sections show that in the Tshirege Member, calcium concentrations are highly variable, par
ticularly in units Obt 1 g and Qbt 1 v (Fig. 9). The greatest enrichments or depletions of leach
able calcium seem to be associated with unit boundaries and may represent secondary alter
ation along preferential ground water pathways.
The background scree_ning values for leachable calcium are 2700 mg!kg for Tt, 890 mg/kg for
Qbo, 1500 mg/kg for Oct, 4140 mg/kg for Obt 1 g and Qbt 1 v, 1520 mg/kg for Qbt 2 and Obt 3,
and 1800 for Qbt 4.
Except for higher concentrations in Qbt 4, total calcium concentrations by XRF and INAA are
relatively constant in the Tshirege Member (Fig. 9). Calcium concentrations in the upper Otowi
Member tend to increase up section, and they are slightly elevated with respect to the lower
Tshirege Member. Because of its low abundance, calcium concentrations in the Bandelier
Tuff are easily affected by diagenetic alteration, particularly in the near-surface environment
and near fractures where calcite (CaC03) is commonly deposited by infiltrating ground water.
Chlorine CCI)
Leachable chlorine concentrations were determined for rock samples on aliquots extracted in
deionized water and analyzed by I C. All of the 106 leachable chlorine concentrations were
above detection limits. Log transformed chlorine data are approximately normally distributed.
Chlorine concentrations for all geologic units range from 3.65 to 802 mg/kg and average 59.9
mg/kg.
Population characteristics from the Wilcoxon rank sum test (Table IV) resulted in pooling the
chlorine data for Obt 1 g and Obt 1 v (as Qbt 1 ), and Obt 2 and Qbt 3 were each treated as
separate data groups. Box plots comparing leachable chlorine by geologic unit show that
chlorine concentration ranges are distinctly greater for units Tt and Qbt 4 than for the other
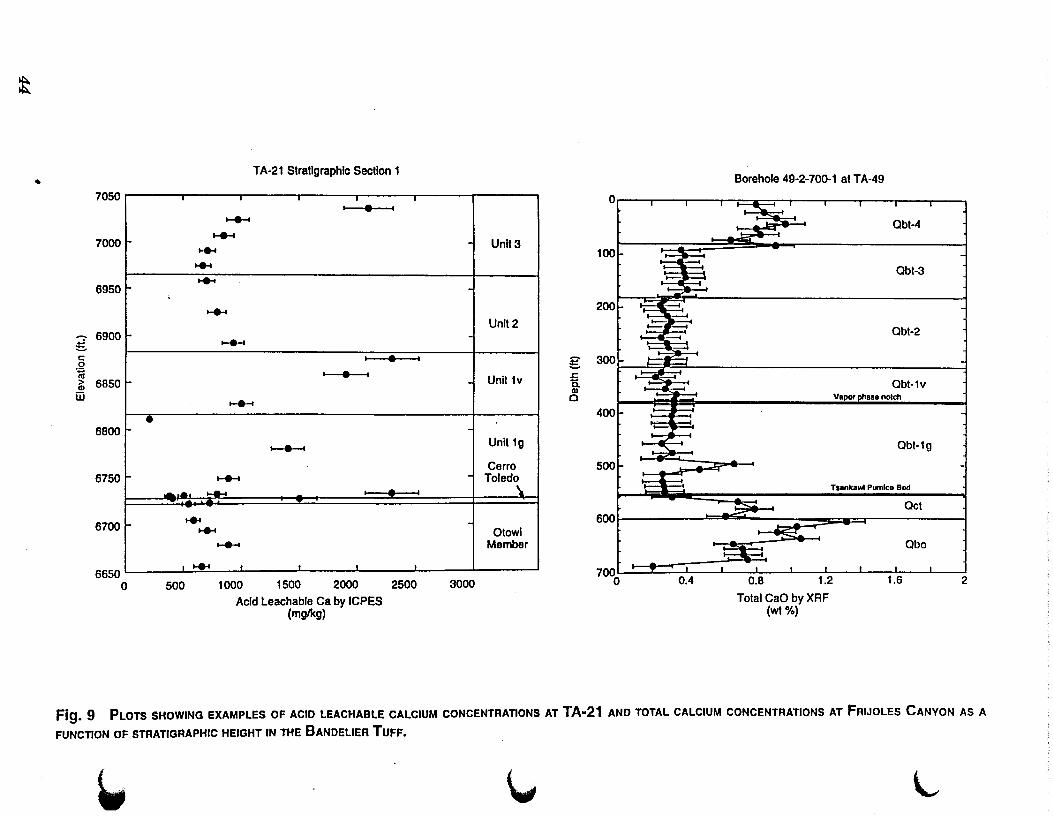
unils (Fig. 4). Plots of leachable chlorine from individual stratigraphic sections show that leach
able chlorine concentrations vary little throughout the Otowi and Tshirege Members with the
exception of high chlorine concentrations along some unit contacts (e.g., Fig. 1 0).
Particularly high concentrations of soluble chlorine are associated with the lower Tshirege
Member (including the Tsankawi Pumice Bed) and the tephras and volcaniclastic sediments
of the Cerro Toledo interval in stratigraphic section 1 at TA-21 (Fig. 1 0). The presence of
elevated chlorine concentra!ions in these tuffs suggests that they acted as preferential ground
water pathways at some time after their deposition. These tuffs are now well above the can
yon floor and there is no evidence of present-day ground water perching in these units. Most
likely these units were preferential ground water pathways when Los Alamos Canyon was
shallower, and these units were below the level of potential perched alluvial ground water
bodies on the canyon floor.
43
t
• 7050
7000 1-
6950
-:- 6900 ~ c 0 -~ ~ 6850 iii
6800
6750
6700
6650 0
•
TA-21 Stratigraphic Section 1
I • ........... ~
~
...... ~
;
~
~
I
I • I
...........
~
~ -.-. ....-.. ~
..... 500
~
I
1000 1500 2000
Acid Leachable Ca by ICPES (mglkg)
I
•
I
2500
I
3000
Unlt3
Unlt2
Unit 1v
Unit 1g
Cerro Toled\
Otowi Member
0
100
200
g 300 r. ii CD 0
400
500
600
700 0
t-:=41 --..:-c:--
.=-7-=r ~--
......... ~
~
""--
0.4 I
Borehole 49-2-700-1 at TA-49
~ I
-~ Qbt-4
Qbt-3
Qbt-2
Obt-1v Vapor ohasa notch
Qbt-1g
-Tsankawl Pumice Bod
~ Oct :.-
~
Qbo
I I
0.8 1.2 1.6
Total CaO by XAF (wt %)
2
Fig. 9 PLOTS SHOWING EXAMPLES OF ACID LEACHABLE CALCIUM CONCENTRATIONS AT TA-21 AND TOTAL CALCIUM CONCENTRATIONS AT FRIJOLES CANYON AS A
FUNCTION OF STRATIGRAPHIC HEIGHT IN THE BANDELIER TUFF.
~ "- L
~
r
7050
• • 7000 • •
• • 6950
• g 6900 • c: • .Q iii ai 6850 • ill •
• 6800
• 6750 •
6700 -: 6650
0
• •
...
50 100
TA-21 Stratigraphic Section 1
...........
I
150 200 250 300
Acid leachable Cl by ICPES (mglkg)
-
-
350 400
r
Unit3
:[ c: 0 Unit2 ·u Q)
en 0 Q) ., "'
Unit 1v .:0 Q)
> 0 .0 c(
Unit 1g ~
Cerro Toled\ I
I
Otowi Member
~
Frijoles Canyon Stratigraphic Section 2
200
.. !~
!::::-
150
~ .....
100
~ 50 ;;
\ 0 t 0 400
Values c Delectlon Umh
(nolless lhan zero)
Unit4
Unit3
Unit2
Unit 1v
Unit 1g
Otowi Member I
BOO 1200 1600 2000 2400 2800
Total Cl by INAA (mglkg)
-
-
Fig. 1 0 PLOTS SHOWING EXAMPLES OF ACID LEACHABLE CHLORINE CONCENTRATIONS AT TA-21 AND TOTAL CHLORINE CONCENTRATIONS AT FRIJOLES CANYON AS A
FUNCnON OF STRATIGRAPHIC HEIGHT IN THE BANDELIER TUFF.
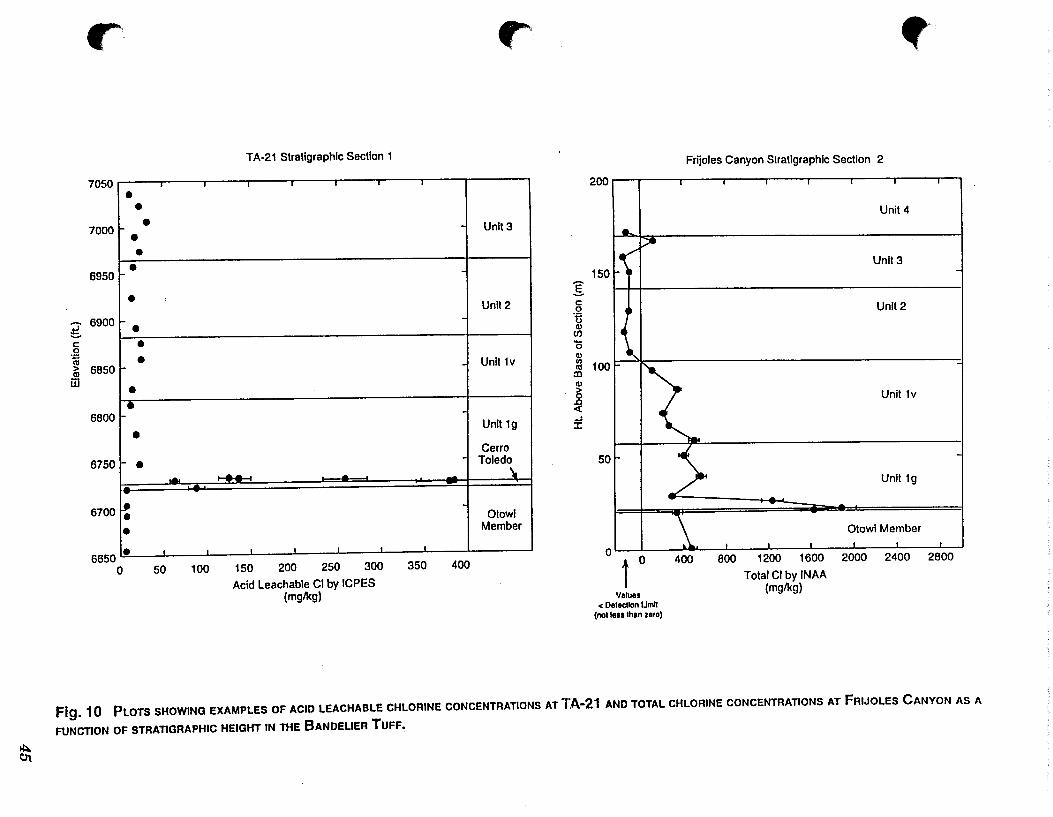
In addition to the vertical variations in leachable chlorine concentrations described above, there are also lateral variations in leachable chlorine across the Pajarito Plateau (Fig. 11 ). Median leachable chlorine concentrations for the Bandelier Tuff typically are 14 mg/kg in the . .J central part of the Laboratory (e.g., TA-21, TA-67) and 44 mg/kg in the eastern part of the Laboratory. These lateral differences in median soluble Cl concentrations probably reflect increased evapotranspiration and/or decreased moisture flux within bedrock eastwards across the Laboratory due to higher average temperatures and to lower rain fall and snow fall.
25
20
15 'E :l 0
(.)
10
5
8
7
6
5
'E 5 4 (.)
3
2
Central Part of Laboratory
40 60 Leachable Cl
(mglkg)
TA-67
Eastern Part of Laboratory
Leachable Cl (mglkg)
TA-54
80 100
80 100
Fig. 11 Histogram of acid leachable chlorine concentrations in Bandelier Tuff as a function of lateral position. Chlorine concentrations generally increase eastward across the Pajarito Plateau. The few anomalous Cl concentrations above 1 00 mg/kg are not shown.
46
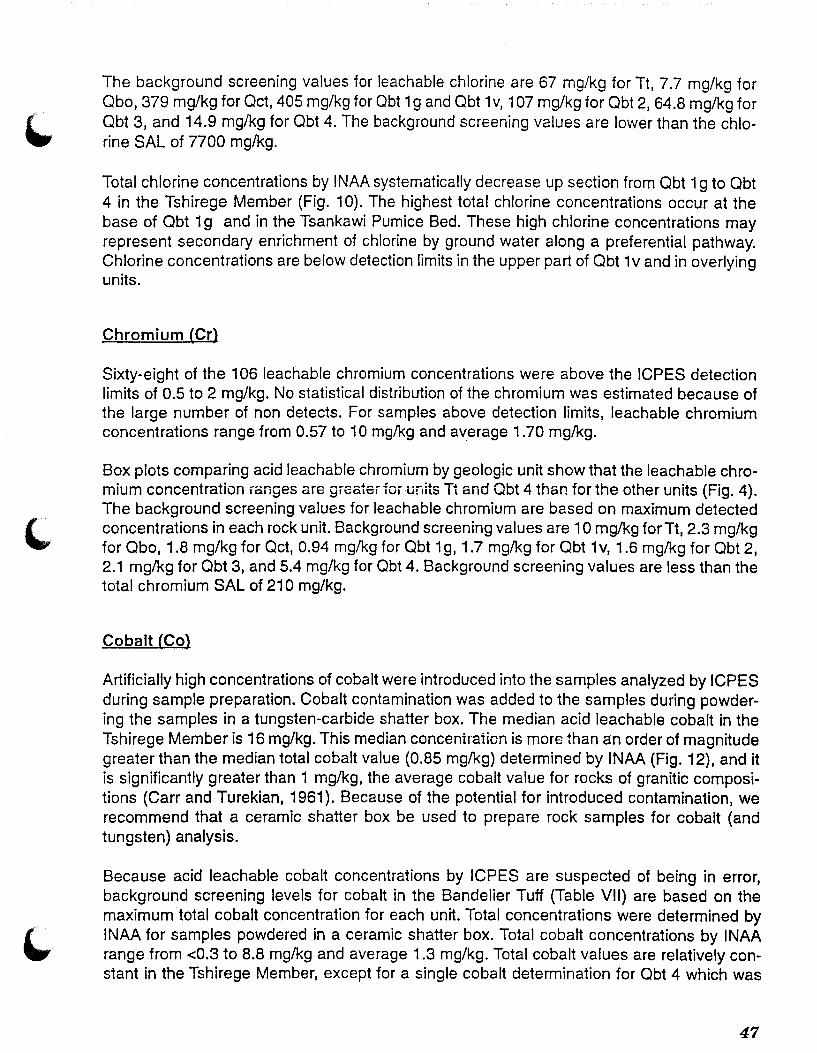
The background screening values for leachable chlorine are 67 mg/kg for Tt, 7.7 mg/kg for Qbo, 379 mg/kg for Oct, 405 mg/kg for Obt 1 g and Obt 1 v, 1 07 mglkg for Obt 2, 64.8 mg/kg for Qbt 3, and 14.9 mg/kg for Obt 4. The background screening values are lower than the chlorine SAL of 7700 mg/kg.
Total chlorine concentrations by INAA systematically decrease up section from Obt 1 g to Obt 4 in the Tshirege Member (Fig. 1 0). The highest total chlorine concentrations occur at the base of Obt 1 g and in the Tsankawi Pumice Bed. These high chlorine concentrations may represent secondary enrichment of chlorine by ground water along a preferential pathway. Chlorine concentrations are below detection limits in the upper part of Obt 1 v and in overlying units.
Chromium (Cr}
Sixty-eight of the 106 leachable chromium concentrations were above the ICPES detection limits of 0.5 to 2 mg/kg. No statistical distribution of the chromium was estimated because of the large number of non detects. For samples above detection limits, leachable chromium concentrations range from 0.57 to 10 mglkg and average 1.70 mglkg.
Box plots comparing acid leachable chromium by geologic unit show that the leachable chromium concentration ranges are greater ior units Tt and Qbt 4 than for the other units (Fig. 4). The background screening values for leachable chromium are based on maximum detected concentrations in each rock unit. Background screening values are 10 mg/kg forTt, 2.3 mg/kg for Qbo, 1.8 mg/kg for Oct, 0.94 mg/kg for Obt 1 g, 1.7 mg/kg for Qbt 1 v, 1.6 mg/kg for Obt 2, 2.1 mg/kg for Qbt 3, and 5.4 mglkg for Qbt 4. Background screening values are less than the total chromium SAL of 210 mg/kg.
Cobalt (Co}
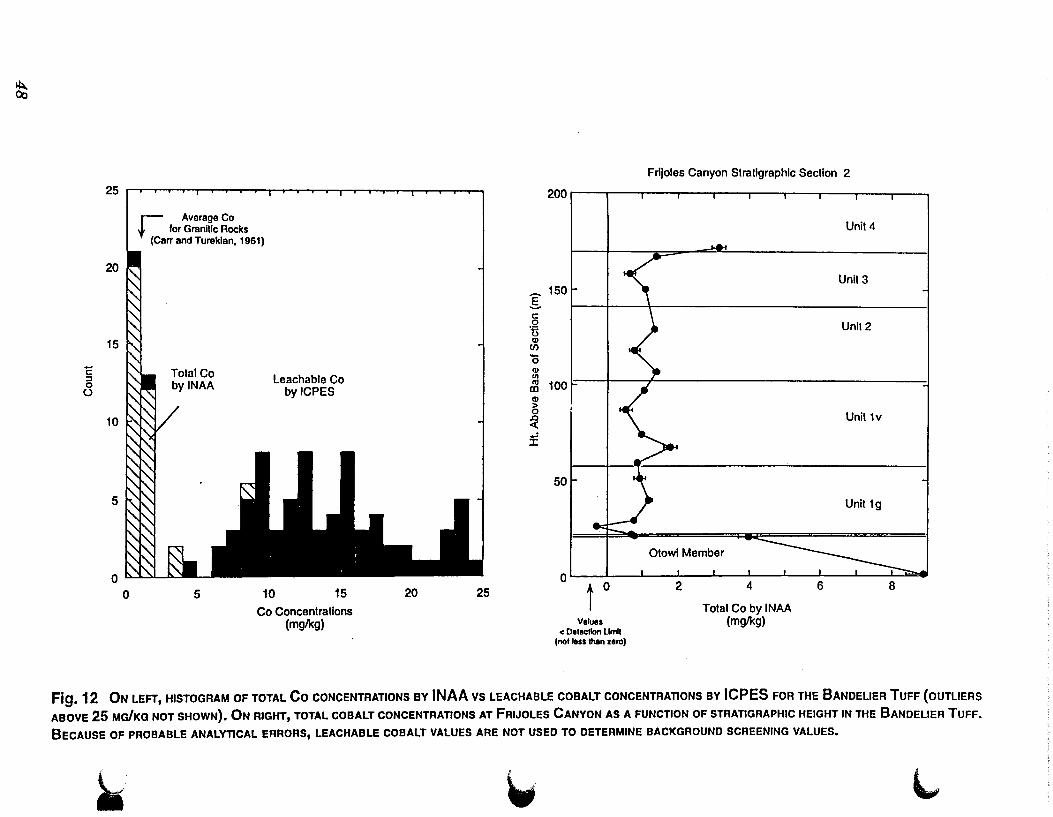
Artificially high concentrations of cobalt were introduced into the samples analyzed by ICPES during sample preparation. Cobalt contamination was added to the samples during powdering the samples in a tungsten-carbide shatter box. The median acid leachable cobalt in the Tshirege Member is 16 mg/kg. This median concentration is more than an order of magnitude greater than the median total cobalt value (0.85 mg/kg) determined by INAA (Fig. 12), and it is significantly greater than 1 mg/kg, the average cobalt value for rocks of granitic compositions (Carr and Turekian, 1961). Because of the potential for introduced contamination, we recommend that a ceramic shatter box be used to prepare rock samples for cobalt (and tungsten) analysis.
Because acid leachable cobalt concentrations by ICPES are suspected of being in error, background screening levels for cobalt in the Bandelier Tuff (Table VII) are based on the maximum total cobalt concentration for each unit. Total concentrations were determined by INAA for samples powdered in a ceramic shatter box. Total cobalt concentrations by INAA range from <0.3 to 8.8 mg/kg and average 1.3 mg/kg. Total cobalt values are relatively constant in the Tshirege Member, except for a single cobalt determination for Qbt 4 which was
47
11::1.. Oo
Frijoles Canyon Stratigraphic Section 2
25
1 ~ :M~;~~' 1
" "
0 " " 1
" " I
200
1 I Un;t4
(carr and Tureklan, 1961)
20-I I "- Unit3
~ 150 .§, c ~ I I ,a, Unit2
15 ~ '1 -1 ~ 0
§ ~ TotaiCo I 3: 0 by INAA Leachable Co .., 100 o by ICPES IIl
(I)
> 10 1::-'\1'\. '1 / -1 ~ I I .""\ Unit 1v
£
50
5 ~ ~ ... I - ~ I I Jl' Unit 1g
I 0::::::::::::: Otowi Member
0 01 I I
0 5 10 15 20 25 t 0 2 4
6 8
Co Concentrations Total Co by INAA (mglkg) Values (mglkg}
c Oa!IIC!ion Limit (no! less than zero)
Fig. 12 ON LEFT, HISTOGRAM OF TOTAL Co CONCENTRATIONS BY JNAA VS LEACHABLE COBALT CONCENTRATIONS BY JCPES FOR THE BANDELIER TUFF (OUTLIERS
ABOVE 25 MGfKG NOT SHOWN). ON RIGHT, TOTAL COBALT CONCENTRATIONS AT FRIJOLES CANYON AS A FUNCTION OF STRATIGRAPHIC HEIGHT IN THE BANDELIER TUFF.
BECAUSE OF PROBABLE ANALYTICAL ERRORS, LEACHABLE COBALT VALUES ARE NOT USED TO DETERMINE BACKGROUND SCREENING VALUES.
~- ~ ~
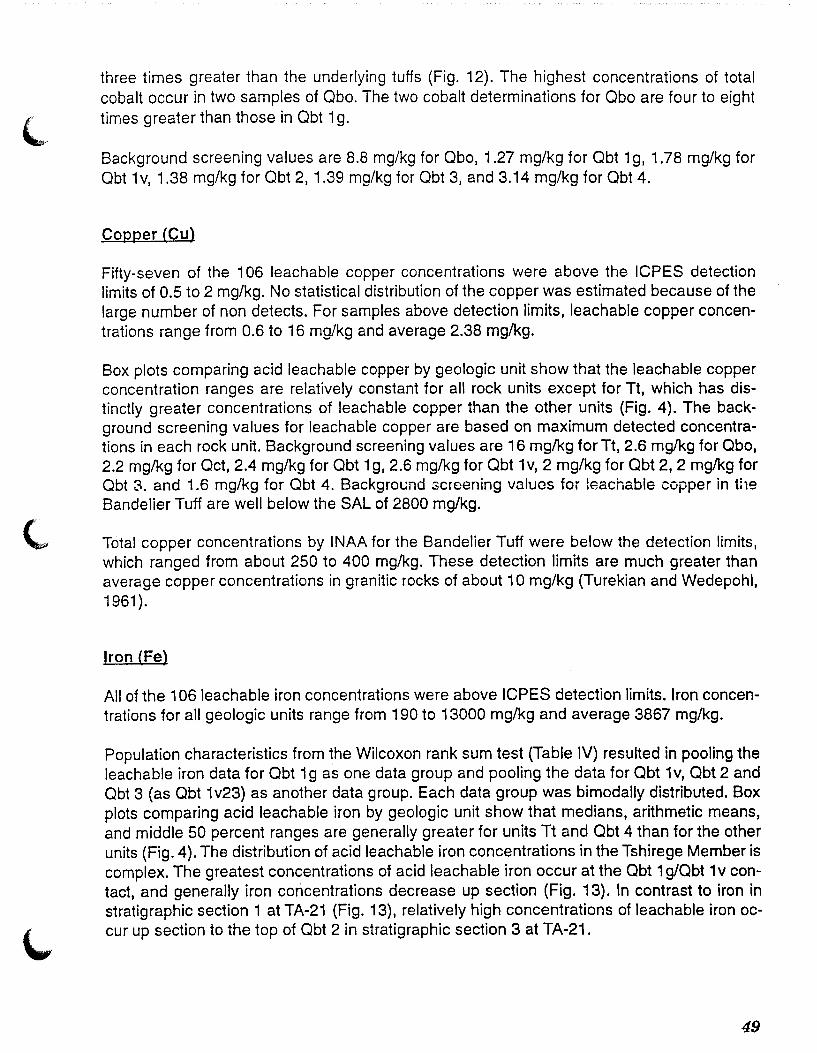
three times greater than the underlying tuffs (Fig. 12). The highest concentrations of total cobalt occur in two samples of Obo. The two cobalt determinations for Qbo are four to eight times greater than those in Qbt 1 g.
Background screening values are 8.8 mg/kg for Qbo, 1.27 mg/kg for Obt 1 g, 1.78 mg/kg for Qbt 1 v, 1.38 mg/kg for Obt 2, 1.39 mg/kg for Obt 3, and 3.14 mg/kg for Obt 4.
Copper (Cu)
Fifty-seven of the 1 06 leachable copper concentrations were above the ICPES detection limits of 0.5 to 2 mg/kg. No statistical distribution of the copper was estimated because of the large number of non detects. For samples above detection limits, leachable copper concentrations range from 0.6 to 16 mg/kg and average 2.38 mg/kg.
Box plots comparing acid leachable copper by geologic unit show that the leachable copper concentration ranges are relatively constant for all rock units except for Tt, which has distinctly greater concentrations of leachable copper than the other units (Fig. 4). The background screening values for leachable copper are based on maximum detected concentrations in each rock unit. Background screening values are 16 mglkg for Tt, 2.6 mglkg for Qbo, 2.2 mg/kg for Oct, 2.4 mg/kg for Obt 1 g, 2.6 mg/kg for Qbt 1 v, 2 mg/kg for Qbt 2, 2 mglkg for Qbt 3. and 1.6 mg/kg for Qbt 4. Background screening values for leachable copper in the Bandelier Tuff are well below the SAL of 2800 mg/kg.
Total copper concentrations by INAA for the Bandelier Tuff were below the detection limits, which ranged from about 250 to 400 mglkg. These detection limits are much greater than average copper concentrations in granitic rocks of about 10 mg/kg (Turekian and Wedepohl, 1961 ).
Iron (Fe)
All of the 1 06 leachable iron concentrations were above ICPES detection limits. Iron concentrations for all geologic units range from 190 to 13000 mg/kg and average 3867 mg!kg.
Population characteristics from the Wilcoxon rank sum test (Table IV) resulted in pooling the leachable iron data for Qbt 1 g as one data group and pooling the data for Qbt 1v, Qbt 2 and Qbt 3 (as Qbt 1v23) as another data group. Each data group was bimodally distributed. Box plots comparing acid leachable iron by geologic unit show that medians, arithmetic means, and middle 50 percent ranges are generally greater for units Tt and Obt 4 than for the other units (Fig. 4). The distribution of acid leachable iron concentrations in the Tshirege Member is complex. The greatest concentrations of acid leachable iron occur at the Qbt 1 g/Qbt 1v contact, and generally iron concentrations decrease up section (Fig. 13). In contrast to iron in stratigraphic section 1 at TA-21 (Fig. 13), relatively high concentrations of leachable iron occur up section to the top of Obt 2 in stratigraphic section 3 at TA-21.
49
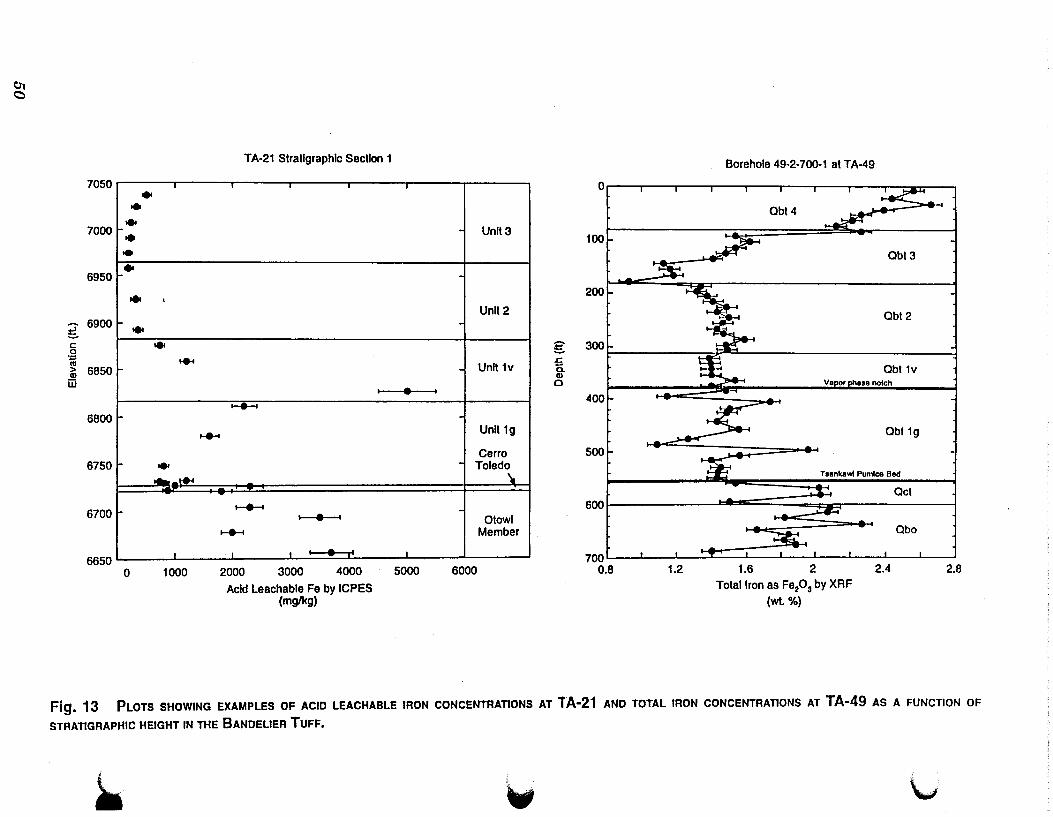
~ c
7050 r-
• • 7000
... • • ~.
6950 .. I
-:- 6900 ~ .. c 0
.. ~ .... ~ 6850 m
6800
6750 1- ... -.-..
6700
6650 -0 1000
.......
TA-21 Stratigraphic Section 1
I .
,_.._..
~ 1--e- -1
........... I I
......... _ 2000 3000 4000
Acid Leachable Fe by ICPES (mglkg)
1- ·-
5000
I . Unlt3
Unit 2
~ g Unit 1v
I
£ a. Cll 0
_J
Unit 1g
Cerro Toledo
~-
otowi Member
J 6000
Borehole 49·2-700-1 at TA-49
Or I I I I I I I I ;::::&L I
Obt4
I ~- I 100 I ec. •
Obt3
200
! ·~ Obt2
300
~ ~ Obi 1v Vapor l>hosa notch
400
Obt1g
500
Tsankawl Pumlca Bed
600 t . • I :: I Oct 1 Obo
700 I I I "'Y""': I I I I I 1 I
0.8 1.2 1.6 2 Total Iron as Fe20 3 by XRF
(wt. %)
2.4 2.8
Fig. 13 PLOTS SHOWING EXAMPLES OF ACID LEACHABLE IRON CONCENTRATIONS AT lA-21 AND TOTAL IRON CONCENTRATIONS AT TA-49 AS A FUNCTION OF
STRATIGRAPHIC HEIGHT IN THE BANDELIER TUFF.
~ w \..,
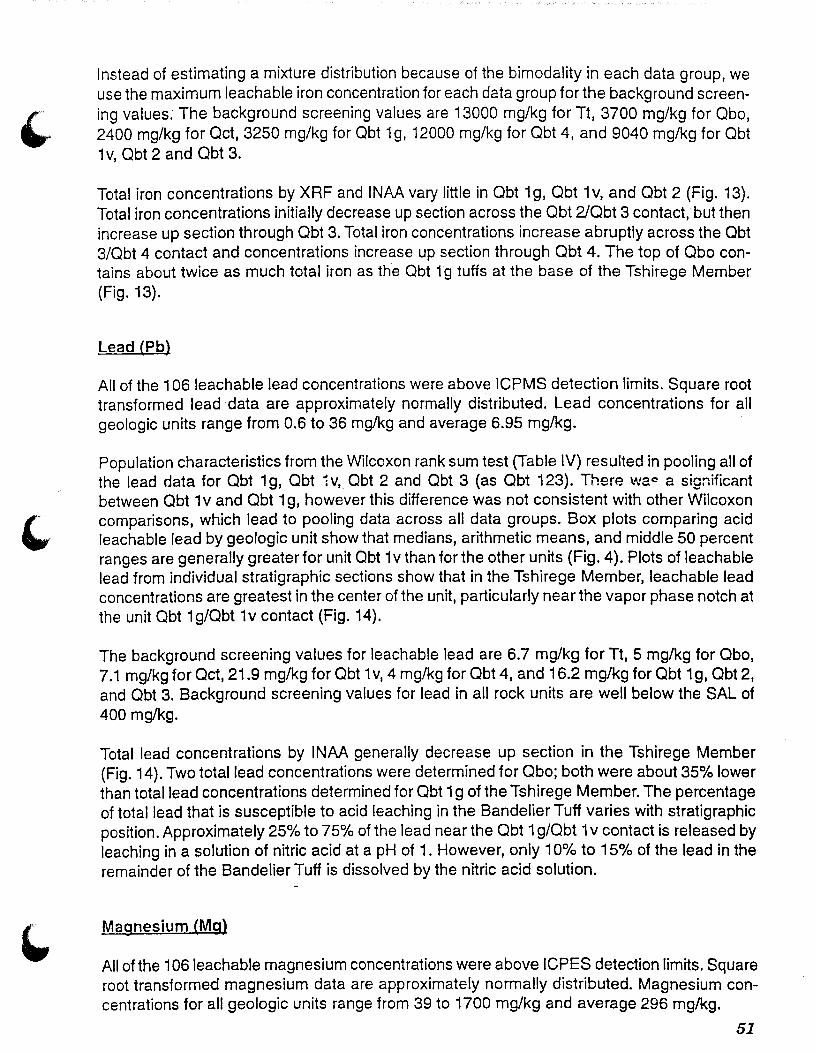
Instead of estimating a mixture distribution because of the bimodality in each data group, we use the maximum leachable iron concentration for each data group for the background screening values. The background screening values are 13000 mg/kg for Tt, 3700 mg/kg for Qbo, 2400 mg/kg for Oct, 3250 mg/kg for Qbt 1 g, 12000 mg/kg for Qbt 4, and 9040 mg/kg for Qbt 1 v, Qbt 2 and Qbt 3.
Total iron concentrations by XRF and INAA vary little in Qbt 1 g, Obt 1 v, and Obt 2 (Fig. 13). Total iron concentrations initially decrease up section across the Qbt 2/Qbt 3 contact, but then increase up section through Obt 3. Total iron concentrations increase abruptly across the Qbt 3/0bt 4 contact and concentrations increase up section through Qbt 4. The top of Qbo contains about twice as much total iron as the Qbt 1 g tuffs at the base of the Tshirege Member (Fig. 13).
Lead (Pb)
All of the 1 06 leachable lead concentrations were above ICPMS detection limits. Square root transformed lead data are approximately normally distributed. Lead concentrations for all geologic units range from 0.6 to 36 mg!kg and average 6.95 mg/kg.
Population characteristics from the Wilcoxon rank sum test (Table IV) resulted in pooling all of the lead data for Qbt 1 g, Qbt : v,_ Qbt 2 and Qbt 3 (as Qbt 123). There ware a significant between Qbt 1 v and Qbt 1 g, however this difference was not consistent with other Wilcoxon comparisons, which lead to pooling data across all data groups. Box plots comparing acid leachable lead by geologic unit show that medians, arithmetic means, and middle 50 percent ranges are generally greater for unit Obt 1 v than for the other units (Fig. 4). Plots of leachable lead from individual stratigraphic sections show that in the Tshirege Member, leachable lead concentrations are greatest in the center of the unit, particularly near the vapor phase notch at the unit Qbt 1g/Qbt 1v contact (Fig. 14).
The background screening values for leachable lead are 6.7 mg/kg for Tt, 5 mg/kg for Qbo, 7.1 mg/kg for Qct, 21.9 mg/kg for Obt 1 v, 4 mg!kg for Qbt 4, and 16.2 mg/kg for Qbt 1 g, Qbt 2, and Qbt 3. Background screening values for lead in all rock units are well below the SAL of 400 mg!kg.
Total lead concentrations by INAA generally decrease up section in the Tshirege Member (Fig. 14). Two total lead concentrations were determined for Qbo; both were about 35% lower than total lead concentrations determined for Qbt 1 g of the Tshirege Member. The percentage of total lead that is susceptible to acid leaching in the Bandelier Tuff varies with stratigraphic position. Approximately 25% to 75% of the lead near the Qbt 1 g/Qbt 1 v contact is released by leaching in a solution of nitric acid at a pH of 1. However, only 10% to 15% of the lead in the remainder of the Bandelier Tuff is dissolved by the nitric acid solution.
Magnesium (Mg)
All of the 106leachable magnesium concentrations were above ICPES detection limits. Square root transformed magnesium data are approximately normally distributed. Magnesium concentrations for all geologic units range from 39 to 1700 mg/kg and average 296 mg/kg.
51
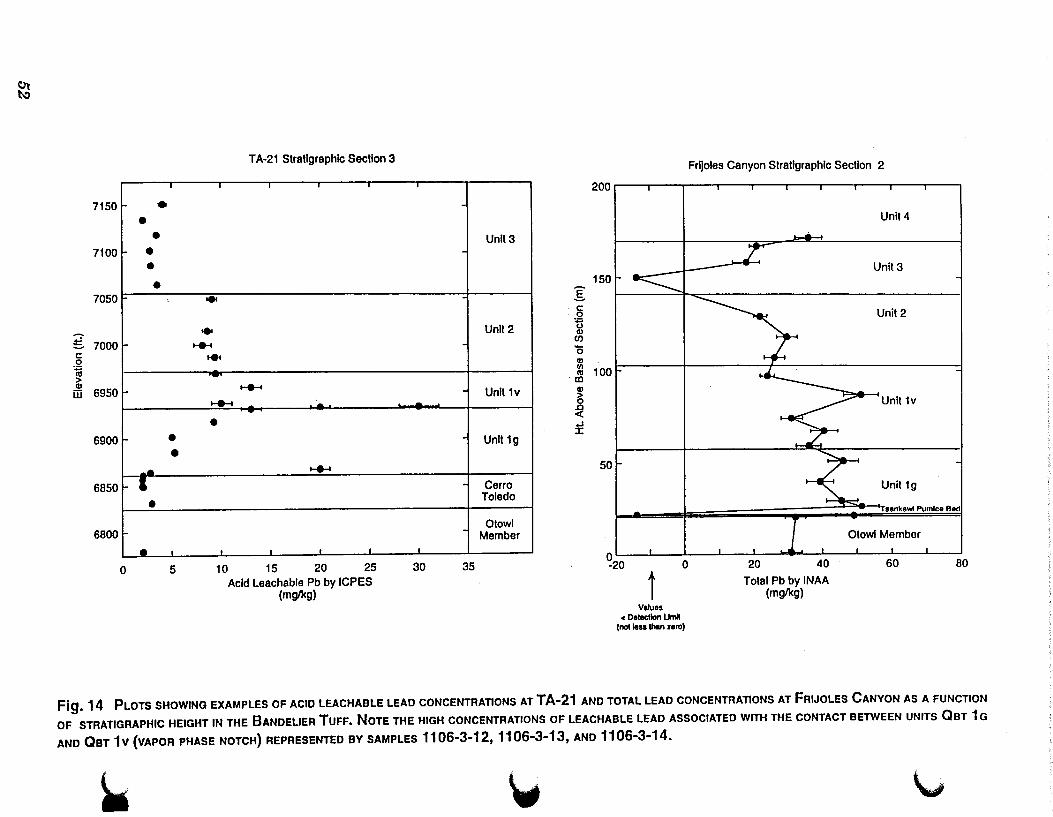
~
7150 1- • • •
7100 • • •
7050
~ 7000 c: 0 -~ > CIJ
6950 ill
6900
-· 6850 - I •
6800
• 0
I
;
• •
5
TA-21 Stratigraphic Section 3
... ... ~ ...
_. ...... ...... ·-•
......
I . 10 15 20 25
Acid Leachable Pb by ICPES (mglkg)
Unlt3
.§. c: 0 ;:
Unlt2 u CIJ en 0
CIJ (/) ns ·m
Unit 1v CIJ > - 0 .0 c( ..J :I:
Unit 1g
- Cerro Toledo
Otowi - Member I
30 35
Frijoles Canyon Stratigraphic Section 2
200r---r---~--.---,---.---.----r---.---.---.
150
100
50
0
t Values
< Dalectlon I.Jmll (nollasslhan zero)
20 40
Total Pb by INAA (mglkg)
Unlt4
Unit3
Unit2
Unit 1v
Unit 1g
'Tsankawl Pumice Bad
Otowi Member
60 80
Fig. 14 PLOTS SHOWING EXAMPLES OF ACID LEACHABLE LEAD CONCENTRATIONS AT TA-21 AND TOTAL LEAD CONCENTRATIONS AT FRIJOLES CANYON AS A FUNCTION
OF STRATIGRAPHIC HEIGHT IN THE BANDELIER TUFF. NoTE THE HIGH CONCENTRATIONS OF LEACHABLE LEAD ASSOCIATED WITH THE CONTACT BETWEEN UNITS Oar 1 G
AND 0BT 1V {VAPOR PHASE NOTCH) REPRESENTED BY SAMPLES 1106-3-12, 1106-3-13, AND 1106-3-14.
~ 'w \._,
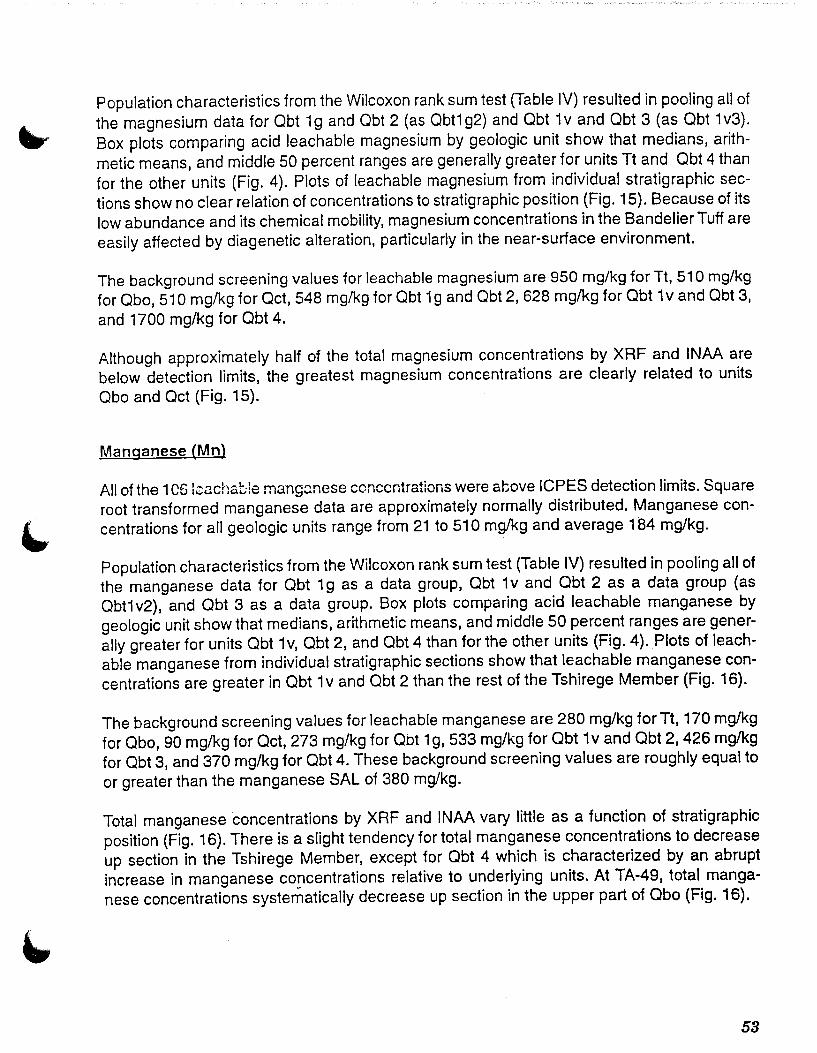
Population characteristics from the Wilcoxon rank sum test (Table IV) resulted in pooling all of
the magnesium data for Qbt 1g and Obt 2 (as Obt1g2) and Qbt 1v and Qbt 3 (as Qbt 1v3).
Box plots comparing acid leachable magnesium by geologic unit show that medians, arith
metic means, and middle 50 percent ranges are generally greater for units Tt and Obt 4 than
for the other units (Fig. 4). Plots of leachable magnesium from individual stratigraphic sec
tions show no clear relation of concentrations to stratigraphic position (Fig. 15). Because of its
low abundance and its chemical mobility, magnesium concentrations in the Bandelier Tuff are
easily affected by diagenetic alteration, particularly in the near-surface environment.
The background screening values for leachable magnesium are 950 mg/kg for Tt, 51 0 mg/kg
for Qbo, 51 0 mg/kg for Oct, 548 mg/kg for Obt 1 g and Obt 2, 628 mg/kg for Obt 1 v and Obt 3,
and 1700 mg/kg for Obt 4.
Although approximately half of the total magnesium concentrations by XRF and INAA are
below detection limits, the greatest magnesium concentrations are clearly related to units
Obo and Oct (Fig. 15).
Manganese (Mn)
All of the 1 C6 l.::achat:!e mang8.nese ccnccr.tratic-ns were above ICPES detection limits. Square
root transformed manganese data are approximately normally distributed. Manganese con-
4., centrations for all geologic units range from 21 to 510 mglkg and average 184 mglkg.
Population characteristics from the Wilcoxon rank sum test (Table IV) resulted in pooling all of
the manganese data for Obt 1 g as a data group, Obt 1 v and Qbt 2 as a data group (as
Obt1 v2), and Qbt 3 as a data group. Box plots comparing acid leachable manganese by
geologic unit show that medians, arithmetic means, and middle 50 percent ranges are gener
ally greater for units Obt 1v, Obt 2, and Qbt 4 than for the other units (Fig. 4). Plots of leach
able manganese from individual stratigraphic sections show that leachable manganese con
centrations are greater in Obt 1 v and Obt 2 than the rest of the Tshirege Member (Fig. 16).
The background screening values for leachable manganese are 280 mg/kg for Tt, 170 mglkg
for Obo, 90 mg/kg for Oct, 273 mg/kg for Obt 1 g, 533 mg/kg for Obt 1 v and Obt 2, 426 mglkg
for Obt 3, and 370 mg/kg for Obt 4. These background screening values are roughly equal to
or greater than the manganese SAL of 380 mglkg.
Total manganese concentrations by XRF and INAA vary little as a function of stratigraphic
position (Fig. 16). There is a slight tendency for total manganese concentrations to decrease
up section in the Tshirege Member, except for Obt 4 which is characterized by an abrupt
increase in manganese co!lcentrations relative to underlying units. At TA-49, total manga
nese concentrations systematically decrease up section in the upper part of Obo (Fig. 16).
53
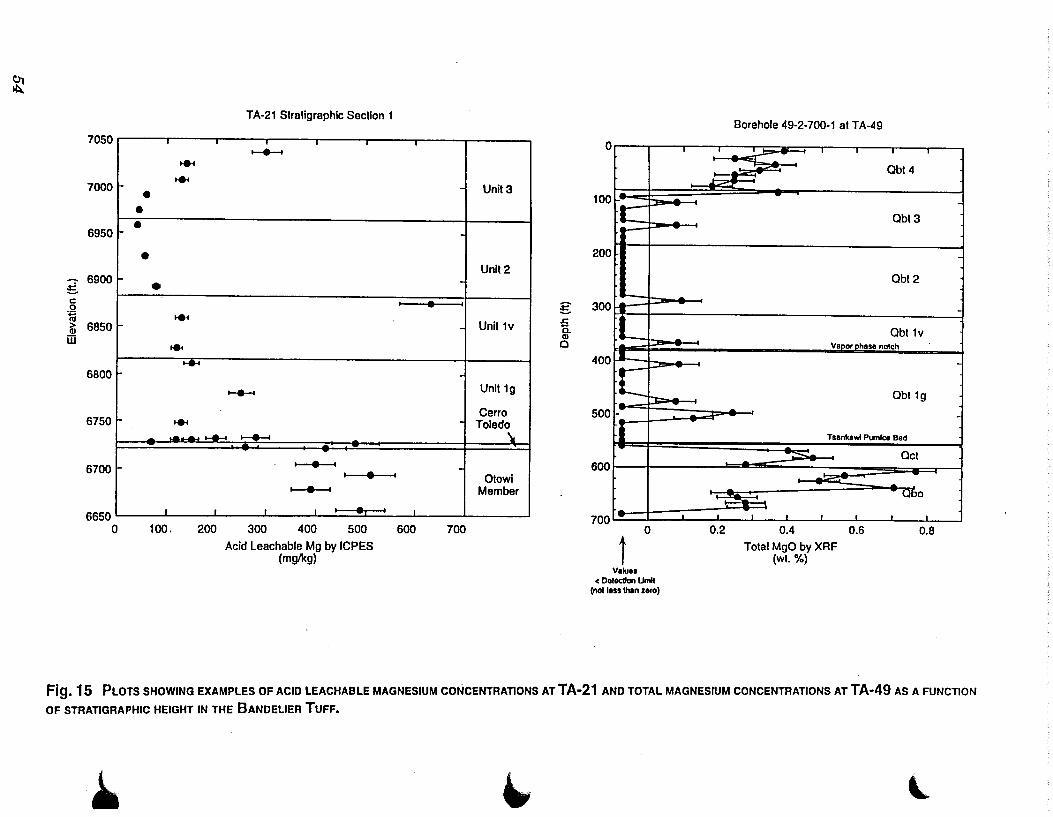
~
7050
7000
6950
-:- 6900 :E. c 0 ·~ a; 6850 m
6800
6750
6700
6650 0
• • • •
TA-21 Stratigraphic Section 1
T I
~ ~
~
• ... ...
..... ......._..
... .• _.._ ~ ~
100. 200
I • I
I • ~
I I
300 400 500 Acid Leachable Mg by ICPES
(mglkg)
I •
I
600
Unil3
Unil2
I
Unil1v
Unlt1g
Cerro Toledo
\
Otowi Member
700
0
100 ---·-=-~ , 200
tf-t-g 300 £ Cl. Cll 0 , .. 400
I-'
tc ) 500
ft ) 600
700 - 0
t Values
< Detection Umh (not lass lhan zero)
Borehole 49-2-700-1 at TA-49
I
Obt4
Obt3
Qbt2
Obt1v Vapor phase notch
Obt1g
Tsankawl Pumice Bed
Oct
- Ooo --.=-..
0.2 .
0.4 Total MgO by XRF
(wt %)
0.6 0.8
-
Fig. 15 PLOTS SHOWING EXAMPLES OF ACID LEACHABLE MAGNESIUM CONCENTRATIONS AT TA-21 AND TOTAL MAGNESIUM CONCENTRATIONS AT TA-49 AS A FUNCTION OF STRATIGRAPHIC HEIGHT IN THE BANDELIER TUFF.
~ " l.
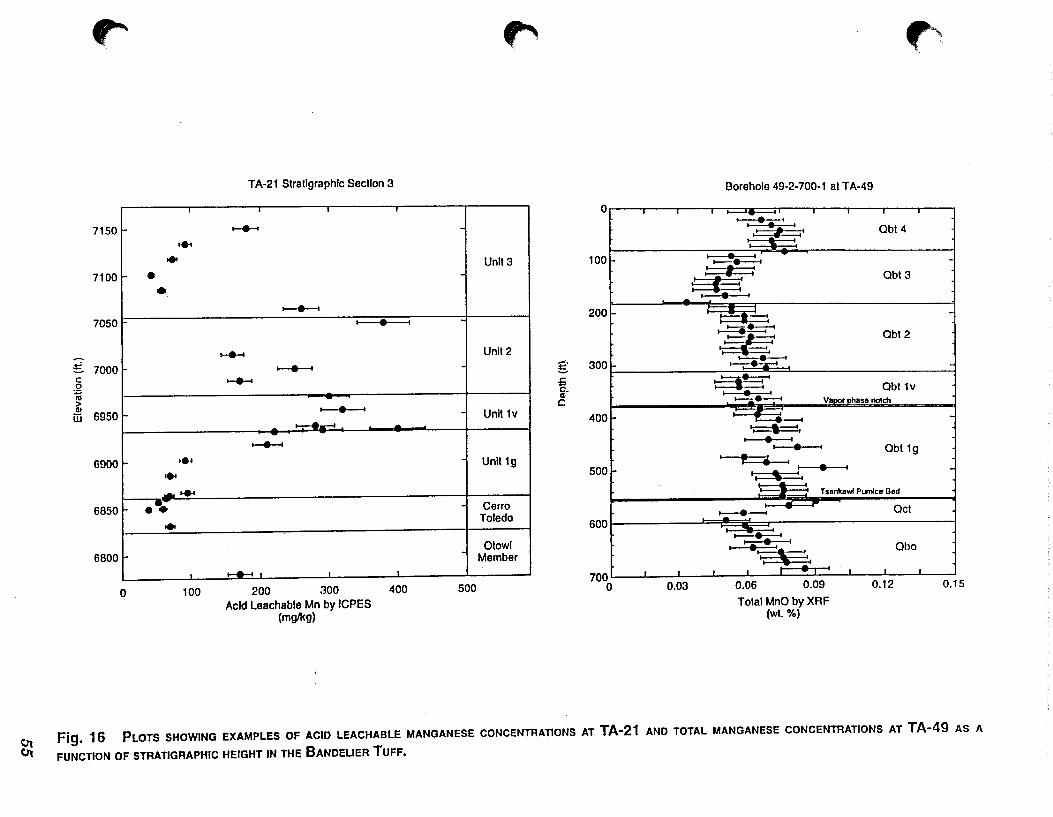
~
~
- --
7150 ... ... 7100 • • 7050
~ 7000 c 0
~ > Cll
6950 jjj
6900 ••• ... ... 6850 ... 6800
I
0 100
TA-21 Straligraphlc Section 3
...........
,__.._.. I •
.......... ,__._.... ,_.....,
,_._....
I • _ _1__1 -
200 300 400
Acid Leachable Mn by ICPES (mglkg)
~
Unlt3
I
Unlt2 g 5 0. a-c
Unit 1v
Unit 1g
500
0 '
1001-
200~
·oor 400
500
600
700 0
. •
I
0.03
f'
Borehole 49-2-700-1 at TA-49
~-____..
I • o I • I Obt4 ~__,I
I ' I •• I
I ._!t.._.,!..
Jii'"r Obt3
I • I
&--=-::!£ I --<
1112-/=.·: Obt2
~·, Obt 1v ;t~·.:: Vapor phase nolch
II ' II I • I
•I • I Obt 1g I , • I
I •' : • I I I _...
Tsenkewt Pumice Ded
I • I
I -. I I.. I I I I\ I I I I I
0.06 0.09
Total MnO by XRF (wt. %)
Oct
Obo
0.12
-
0.15
Fig. 16 PLOTS SHOWING EXAMPLES OF ACID LEACHABLE MANGANESE CONCENTRATIONS AT TA-21 AND TOTAL MANGANESE CONCENTRATIONS AT TA-49 AS A
FUNCTION OF STRATIGRAPHIC HEIGHT IN THE BANDELIER TUFF.
Mercury (Hg)
Leachable mercury concentrations were not determined for this investigation because mercury was not detected in the INAA analyses. All38 of the samples analyzed by INAA had total mercury concentrations below detection limits, which range from 0.3 to 0.7 mg/kg. Thus naturally mercury concentrations are well below the SAL of 23 mg/kg.
Nickel (Ni)
Only 9 of the 106 leachable nickel concentrations were above ICPES detection limits of 1 to 2 mg/kg. No statistical distribution of the nickel was estimated because of the large number of non detects. For samples above detection limits, leachable nickel concentrations range from 2 to 15 mg/kg and average 4.6 mg/kg.
Box plots comparing acid leachable nickel by geologic unit show that the highest leachable nickel concentrations are associate with unit Tt (Fig. 4). The background screening values for leachable nickel are based on maximum detected concentrations in each rock unit. Background screening values are 15 mglkg forTt, 2.8 mglkg for Obo, <2 mglkg for Oct and Obt 1 g, 2 mg/kg for Obt 1 v, <2 mglkg for Obt 2, 2.6 mglkg for Obt 3, and <2 mg/kg for Obt 4. Background screening values for all rock units are well below the SAL of 1500 mglkg.
Total nickel concentrations by XRF were generally below detection limits which ranged between 6 and 7 mg/kg.
Potassium (K)
All of the 1 06 leachable potassium concentrations were above ICPES detection limits. Square root transformed potassium data are approximately normally distributed. Potassium concentrations for all geologic units range from 250 to 5400 mg/kg and average 1 055 mg/kg.
Population characteristics from the Wilcoxon rank sum test (Table IV) resulted in pooling all of the potassium data for Obt 1 g and Obt 2 (as data group Obt 1 g2). Obt 1 v and Qbt 3 were pooled as tw~ separate data groups. Box plots comparing acid leachable potassium by geologic unit show generally high concentrations for units Obt 1 g and generally low concentrations for units Obo, Obt 3, and Tt (Fig. 4). Plots of leachable potassium from individual stratigraphic sections show that leachable potassium concentrations are greatest in the glassy tuffs (units Obo, Oct, and Obt 1 g), and concentrations decrease up section in the overlying devitrified tuffs (Fig. 17).
The background screening values for leachable potassium are 1100 mg/kg for Tt, 960 mg/kg for Obo, 1600 mg/kg for Oct, 2730 mg/kg for Obt 1 g and Obt 2, 5540 mg/kg for Obt 1 v, 735 mg/kg for Obt 3, and 1600 mg/kg for Obt 4.
56
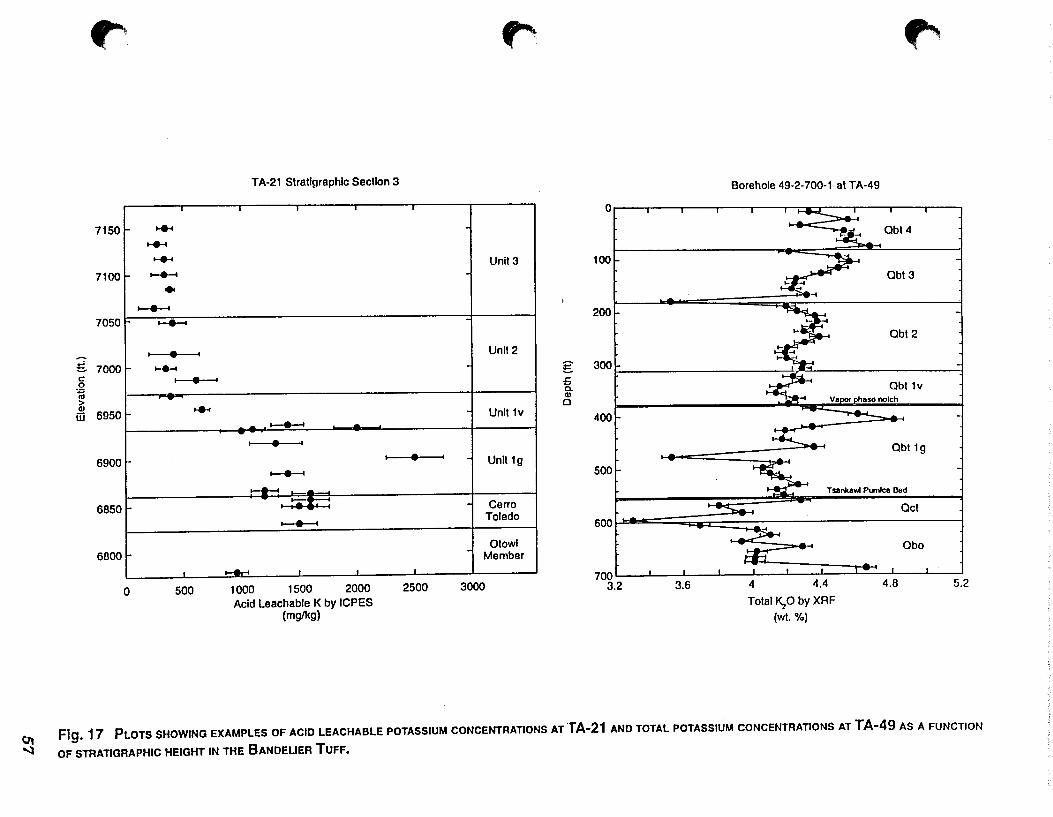
~·
I
7150 ..... .........
......... 7100 ~
• .._..._.... 7050 ..._.......
I • I
~ 7000 ........ c: 0
I • ·~ nl > ell
6950 jjj f.. .....
6900
6850
6800
I_
0 500
I
TA-21 Stratigraphic Section 3
.
... .._.__.... ---I • I
.._.__.... ~ ...
'a~ ...... _._..
.....- . 1000 1500 2000 Acid Leachable K by ICPES
(mglkg)
I
~
Unit3
Unit2
§: £ a. ell 0
Unit 1v
• I Unit 1g
Cerro Toledo
Otowi Member
2500 3000
" Borehole 49-2-700-1 at TA-49
0,---,--,,---,---.--,~~.---.---.---.---,
Obt4
100 Qbt3
200
! ; Qbt2
~
300
t _._,..'(-~ Obt1v
400
Qbt1g
500
Tsankawt Pumice Bed
600 r I ... :::::.. Oct • ~ 1 Qbo
5.2 1oo L_..J. _ _,L _ __L_ _ _t__!__-7:----L=--..:....· ~--1-~.
3.2 3.6 4 4.4 4.8
Total ~0 by XRF
(w1. %)
t1l Fig. 17 PLOTS SHOWING EXAMPLES OF ACID LEACHABLE POTASSIUM CONCENTRATIONS AT'TA-21 AND TOTAL POTASSIUM CONCENTRATIONS AT TA-49 AS A FUNCTION
.....:J OF STRATIGRAPHIC HEIGHT IN THE BANDELIER TUFF.
There is slight increase up section in total potassium concentrations by XRF and INAA in the Bandelier Tuff. Increasing total potassium up section is opposite of the general decrease in J soluble potassium up section in the Tshirege Member (Fig. 17). Total potassium concentra-tions at the top of Obo are somewhat lower than those found in the basal tuffs of the Tshirege Member (e.g., Qbt 1 g). Potassium in the Bandelier Tuff is relatively insoluble, and only 1% to 1 0% of the total potassium in the rock is released by leaching in a solution of nitric acid at a pH of 1.
Selenium (Se)
Leachable selenium concentrations were not determined for this investigation because total selenium was not detected by INAA, and these detection limits were consistently less than the SAL. All 38 of the samples analyzed by INAA had total selenium concentrations below detection limits, which range from 1.1 to 4.9 mglkg. Thus leachable selenium concentration should be well below the SAL of 380 mg/kg.
Silver (Ag)
Only 1 of the 106 leachable silver concer.t~'ltions was above ICPES detection limits of 1 to 2 mg/kg. The single detected silver concentration, which occurred in unit Qbt 3, was 1.9 ± 1.0 mg/kg. J Except for unit Qbt 1 v, background screening values for leachable silver are based on maxi-mum detection limits in each rock unit. Background screening values are <1 mg!kg for Tt, Qbo, Oct, Obt 2, and Obt 4, <2 mg/kg for Obt 1 g and Obt 1 v, and 1.9 mg/kg for Qbt 3. Background screening values for all rock units are well below the SAL of 380 mg/kg.
Total silver concentrations by INAA were below detection limits which ranged between 1 and 3 mg/kg.
Sodium (Na)
All of the 1 06 leachable sodium concentrations were above ICPES detection limits. Sodium concentrations for all geologic units range from 130 to 7700 mg/kg and average 1 059 mg/kg.
Population characteristics from the Wilcoxon rank sum test (Table IV) resulted in pooling all of the sodium data for Obt 1 g and Obt 1 v (as data group Obt 1). Qbt 2 and Qbt 3 were pooled as data group Qbt 23. Square root transformed sodium data are approximately normally distributed for data group Obt 1. Log ·transformed sodium data are approximately normally distributed for data group Obt 23. Box plots comparing acid leachable sodium by geologic unit show generally low concentrations for units Qbt 3, Qbt 4, and Tt relative to the other rock units (Fig. A
58
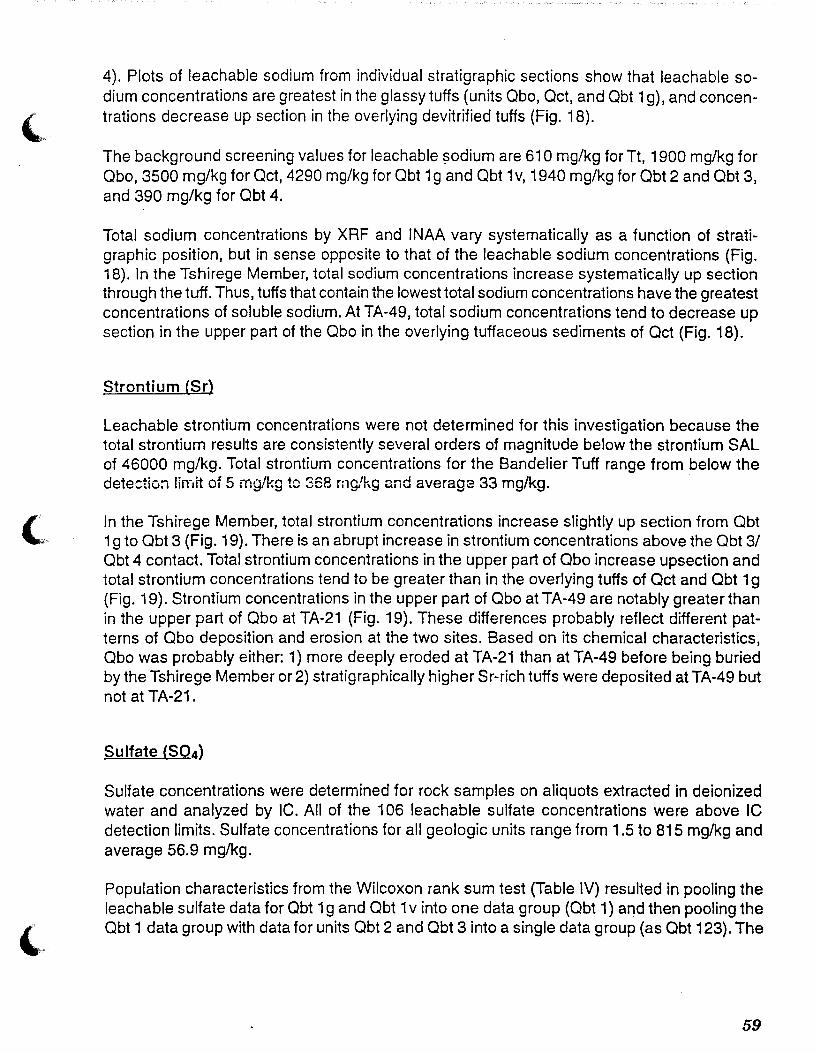
4). Plots of leachable sodium from individual stratigraphic sections show that leachable sodium concentrations are greatest in the glassy tuffs (units Obo, Oct, and Obt 1 g), and concentrations decrease up section in the overlying devitrified tuffs (Fig. 18).
The background screening values for leachable ~odium are 61 0 mg/kg for Tt, 1900 mg/kg for Obo, 3500 mg/kg for Oct, 4290 mg/kg for Obt 1 g and Obt 1 v, 1940 mg/kg for Obt 2 and Obt 3, and 390 mg/kg for Obt 4.
Total sodium concentrations by XRF and INAA vary systematically as a function of stratigraphic position, but in sense opposite to that of the leachable sodium concentrations (Fig. 18). In the Tshirege Member, total sodium concentrations increase systematically up section through the tuff. Thus, tuffs that contain the lowest total sodium concentrations have the greatest concentrations of soluble sodium. At TA-49, total sodium concentrations tend to decrease up section in the upper part of the Obo in the overlying tuffaceous sediments of Oct (Fig. 18).
Strontium (Sr)
Leachable strontium concentrations were not determined for this investigation because the total strontium results are consistently several orders of magnitude below the strontium SAL of 46000 mg/kg. Total strontium concentrations for the Bandelier Tuff range from below the detectio:a limit of 5 rng/kg to 368 rng/kg and average 33 mg/kg.
In the Tshirege Member, total strontium concentrations increase slightly up section from Obt 1 g to Qbt 3 (Fig. 19). There is an abrupt increase in strontium concentrations above the Qbt 3/ Qbt 4 contact. Total strontium concentrations in the upper part of Qbo increase upsection and total strontium concentrations tend to be greater than in the overlying tuffs of Oct and Qbt 1 g (Fig. 19). Strontium concentrations in the upper part of Qbo at TA-49 are notably greater than in the upper part of Obo at TA-21 (Fig. 19). These differences probably reflect different patterns of Qbo deposition and erosion at the two sites. Based on its chemical characteristics, Qbo was probably either: 1) more deeply eroded at TA-21 than at TA-49 before being buried by the Tshirege Member or 2) stratigraphically higher Sr-rich tuffs were deposited at TA-49 but not at TA-21.
Sulfate (S04)
Sulfate concentrations were determined for rock samples on aliquots extracted in deionized water and analyzed by I C. All of the 1 06 leachable sulfate concentrations were above IC detection limits. Sulfate concentrations for all geologic units range from 1.5 to 815 mglkg and average 56.9 mg/kg.
Population characteristics from the Wilcoxon rank sum test (Table IV) resulted in pooling the leachable sulfate data for Obt 1 g and Obt 1 v into one data group (Obt 1) and then pooling the Obt 1 data group with data for units Obt 2 and Qbt 3 into a single data group (as Obt 123). The
59
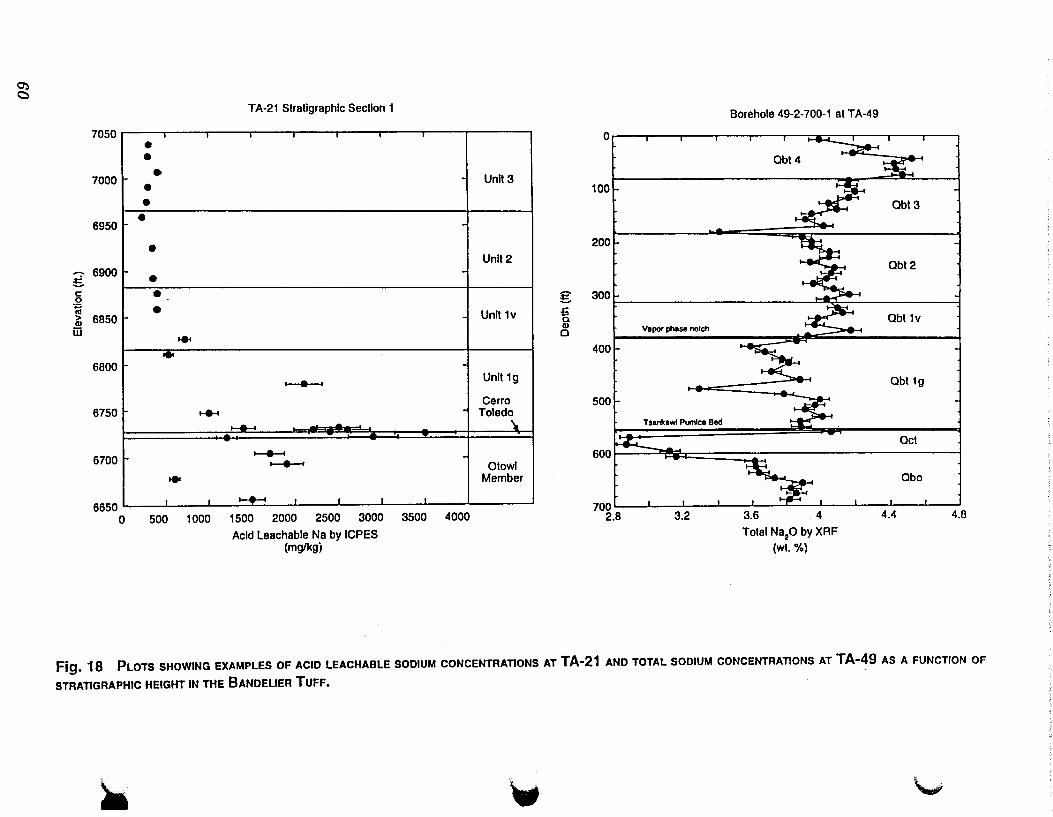
0') c
7050
7000
6950
-:- 6900 :E. c: 0
~ a"; 6850 iii
6800
6750
-6700
6650 0
TA-21 Stratigraphic Section 1
• • • • • • •
-• • • ... ...
._._.._.
t-e--4
~ ~ ... .._._. ,__.._ ..
I ~ I I I
500 1000 1500 2000 2500 3000 3500 4000
Acid Leachable Na by ICPES (mg/l<gj
I
Unit 3
Unit 2
g Unit 1v £
CL Ql
0
Unit 1g
Cerro Toledo
~
Otowi Member
Borehole 49-2-700-1 at TA-49
Or I I I I I t:::a::::lt I I I I
100
200
300
~ Vapor phase notch
400
500
Tsankawl Pumice Bed
Oct
Obo
4.8 700 I I I I I ..,.--= I I I I I
4 4.4 2.8 3.2 3.6
Tolal Nap by XRF
(wt. %)
Fig. 18 PLOTS SHOWING EXAMPLES OF ACIO LEACHABLE SODIUM CONCENTRATIONS AT TA-21 AND TOTAL SODIUM CONCENTRATIONS AT TA-49 AS A FUNCTION OF
STRATIGRAPHIC HEIGHT IN THE BANDELIER TUFF.
~ '-' '-"
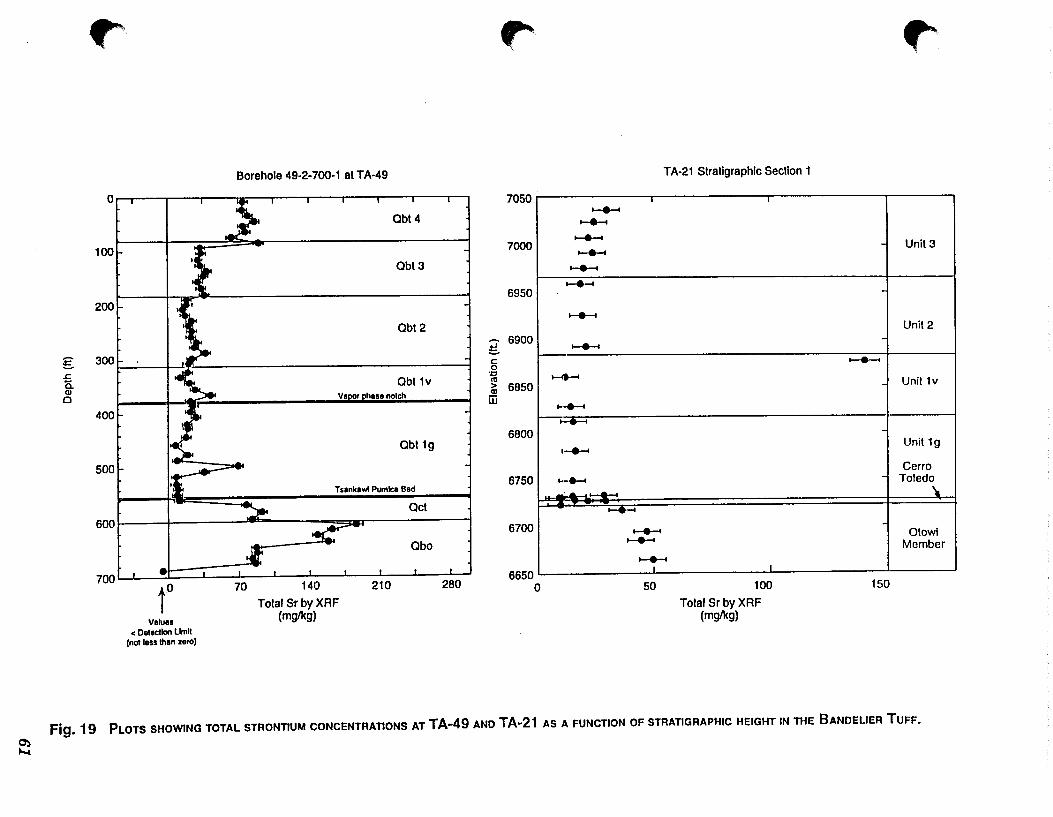
~
g .s::. 0.. C1)
0
~~
Borehole 49-2-700-1 at TA-49
o~r---r---~--~--~--~---T---T---,----~
Obt4
100 Qbt3
200
! \. Qbt2
300
~ I~ Qbt 1v
Vapar phua notch
400
Qbt 1g
500
Tsankawl Pumice Bod
Oct
600 I I ... - ::::::0 I I
Qbo
700 I I -r I I I I I I I I I
70 140 210 280 to Values
< Oeiectlon lirnil (not lass than zero)
Total Sr by XRF (mglkg)
~
7050
7000
6950
-:- 6900 ~ c: 0
":::>
"' ~ 6850 jjj
6800
6750
6700
6650 0
TA-21 Stratigraphic Section 1
t--e--t ~
~
t--e--t ~
t--e--t
~
t--e--t
......... .. ..._. ._.......
I_._. t--e--t -:.a. L.,_._. ~
._....... ,_._. ~ 50
f
100
Total Sr by XRF (mglkg)
~
Unit 3
Unit2
,........_. Unil1v
Uni11g
Cerro Toledo
'l.
Otowi Member
150
Fig. 19 PLOTS SHOWING TOTAL STRONTIUM CONCENTRATIONS AT TA-49 AND TA-21 AS A FUNCTION OF STRATIGRAPHIC HEIGHT IN THE BANDELIER TUFF.
J I
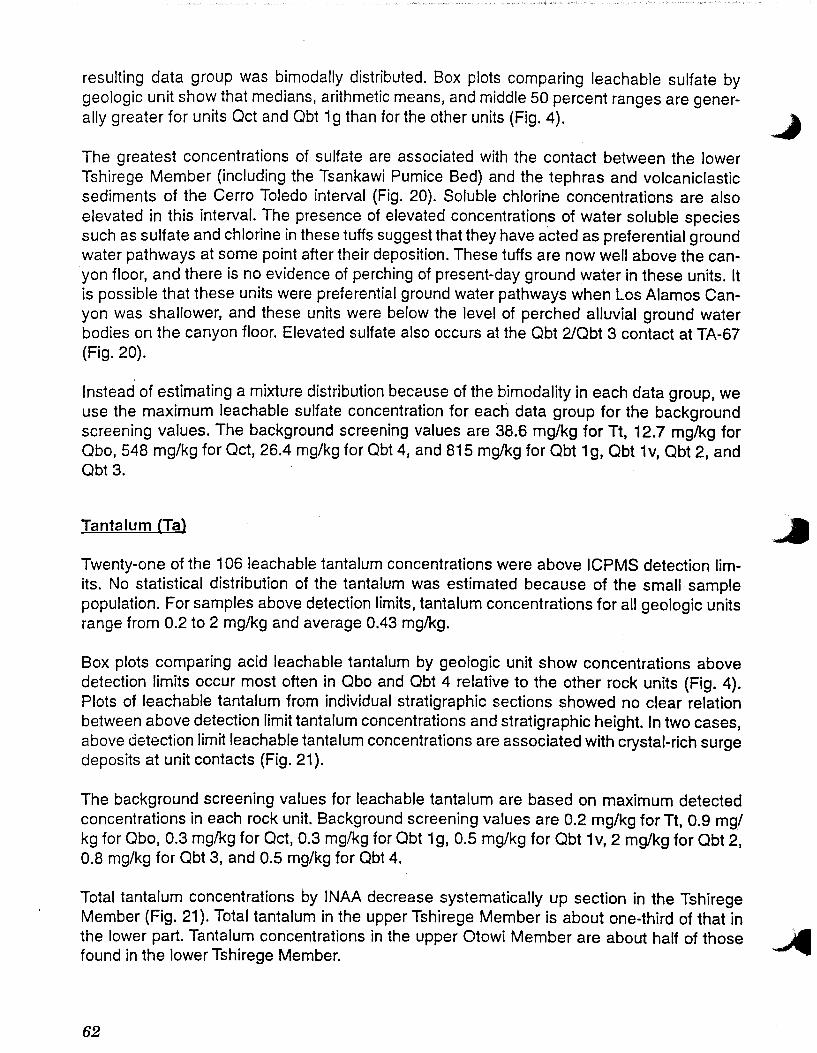
resulting data group was bimodally distributed. Box plots comparing leachable sulfate by geologic unit show that medians, arithmetic means, and middle 50 percent ranges are gener-ally greater for units Oct and Obt 1 g than for the other units (Fig. 4). ~
The greatest concentrations of sulfate are associated with the contact between the lower Tshirege Member (including the Tsankawi Pumice Bed) and the tephras and volcaniclastic sediments of the Cerro Toledo interval (Fig. 20). Soluble chlorine concentrations are also elevated in this interval. The presence of elevated concentrations of water soluble species such as sulfate and chlorine in these tuffs suggest that they have acted as preferential ground water pathways at some point after their deposition. These tuffs are now well above the can-yon floor, and there is no evidence of perching of present-day ground water in these units. It is possible that these units were preferential ground water pathways when Los Alamos Can-yon was shallower, and these units were below the level of perched alluvial ground water bodies on the canyon floor. Elevated sulfate also occurs at the Obt 2/0bt 3 contact at TA-67 (Fig. 20).
Instead of estimating a mixture distribution because of the bimodality in each data group, we use the maximum leachable sulfate concentration for each data group for the background screening values. The background screening values are 38.6 mg/kg for Tt, 12.7 mg!kg for Obo, 548 mg/kg for Oct, 26.4 mg/kg for Obt 4, and 815 mg!kg for Obt 1g, Obt 1v, Obt 2, and Obt3.
Tantalum (Ta)
Twenty-one of the 1 06 leachable tantalum concentrations were above ICPMS detection limits. No statistical distribution of the tantalum was estimated because of the small sample population. For samples above detection limits, tantalum concentrations for all geologic units range from 0.2 to 2 mg/kg and average 0.43 mg!kg.
Box plots comparing acid leachable tantalum by geologic unit show concentrations above detection limits occur most often in Obo and Obt 4 relative to the other rock units (Fig. 4}. Plots of leachable tantalum from individual stratigraphic sections showed no clear relation between above detection limit tantalum concentrations and stratigraphic height. In two cases, above detection limit leachable tantalum concentrations are associated with crystal-rich surge deposits at unit contacts (Fig. 21).
The background screening values for leachable tantalum are based on maximum detected concentrations in each rock unit. Background screening values are 0.2 mg/kg for Tt, 0.9 mg/ kg for Obo, 0.3 mg/kg for Oct, 0.3 mg/kg for Obt 1 g, 0.5 mg/kg for Obt 1 v, 2 mg/kg for Obt 2, 0.8 mg/kg for Obt 3, and 0.5 mg/kg for Obt 4.
Total tantalum concentrations by INAA decrease systematically up section in the Tshirege Member (Fig. 21 ). Total tantalum in the upper Tshirege Member is about one-third of that in the lower part. Tantalum concentrations in the upper Otowi Member are about half of those ....,..4 found in the lower Tshirege Member.
62
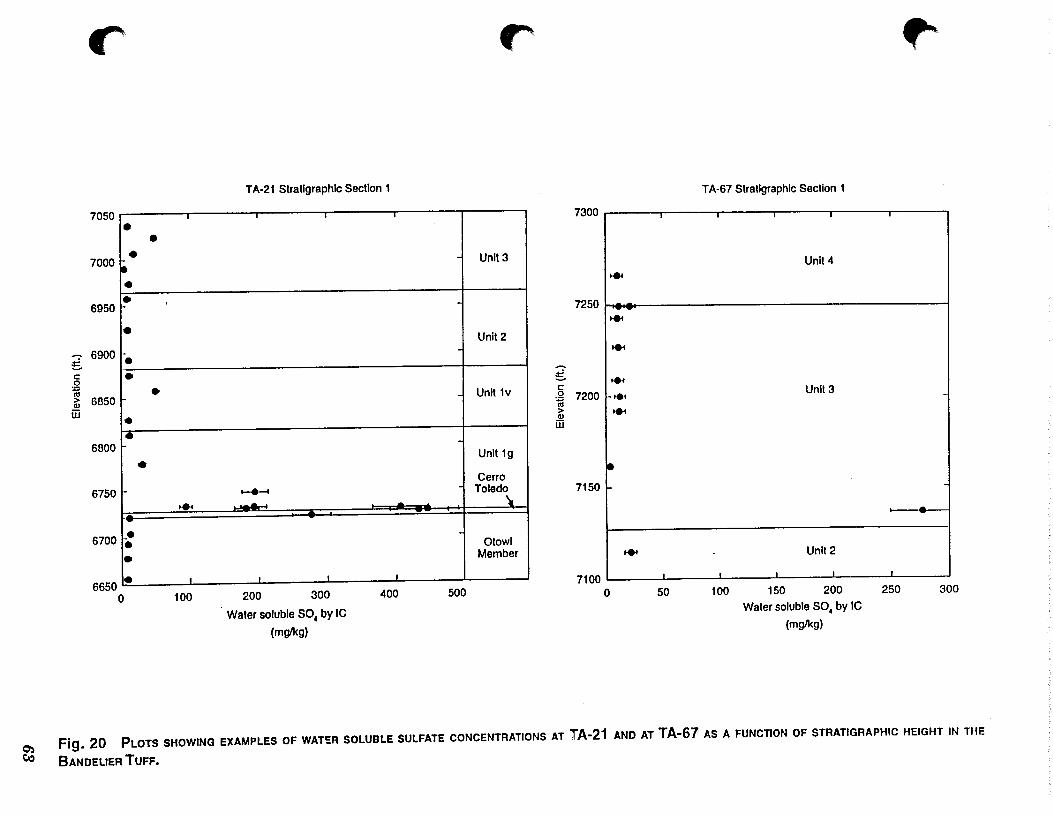
~
r
7050
7000
6950
• 6900 :S c: 0
~ > Q)
iii 6850
6800
6750
6700
6650 0
• • • • • • • •
• • •
• • • •
•
'
•
...
100
TA-21 Stratigraphic Section 1
...__._. ...........
I
200 300
Water soluble S04 by IC
(mglkg)
I
400 500
r
Unlt3
'
Unit 2
I
Unit 1v
Unit 1g
Cerro Toledo
\
Otowi Member
7300
7250
~ c: ,g 7200
"' > Q)
iii
7150
7100
.. ..,.,., .. ... ... ... ...
•
.. 0 50
T A-67 Stratigraphic Section 1
100
Unit4
Unlt3
Unil2
150 200
Water soluble S04 by IC
(mglkg)
~·
I -
250 300
Fig. 20 PLOTS SHOWING EXAMPLES OF WAT':R SOLUBLE SULFATE CONCENTRATIONS AT TA-21 AND AT TA-67 AS A FUNCTION OF STRATIGRAPHIC HEIGHT IN THE
BANDELIER TUFF.
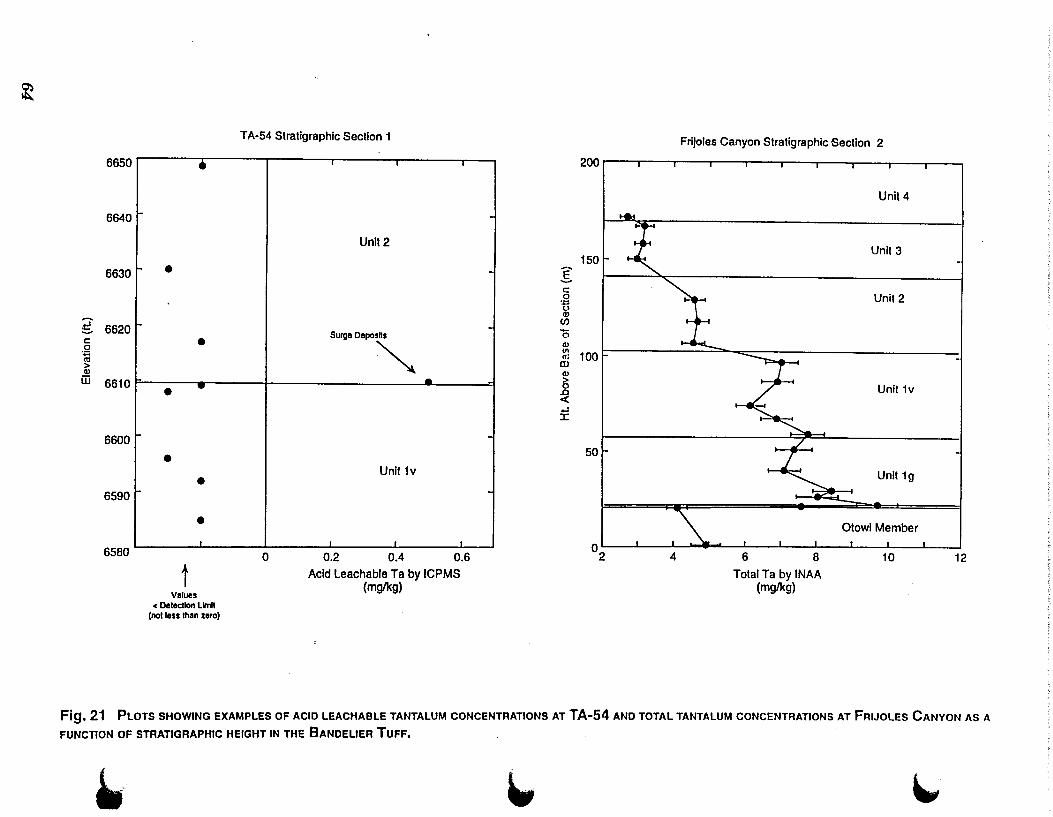
~
6650
6640
6630
g 6620 c:
.Q iii > Ql
m 6610
6600
6590
6580
f-
1-
•
•
•
• •
• • •
t Values
< Detection Limit (not less than zero)
TA-54 Stratigraphic Section 1
Unit 2
-· .. ~ •
Unit 1v
I I I
0 0.2 0.4 0.6 Acid Leachable Ta by ICPMS
(mglkg)
-
-
-
-
-
-
Frijoles Canyon Stratigraphic .Section 2
200~--r---r---~--~--~--~--~---r--~--~
Unit 4
Unil3 150
:[ c:
I ~ Unit2 0 •.;::> u Ql
en 0 Ql
::! 100 w Ql >
I "/ 0 Unil1v .0 < :E
50 I .1
Unit1g -1
?r-:-. I
Otowi Member
01 I I I~ I I I I I I
2 4 6 8 10 12 Total Ta by INAA
(mglkg)
Fig. 21 PLOTS SHOWING EXAMPLES OF ACID LEACHABLE TANTALUM CONCENTRATIONS AT TA-54 AND TOTAL TANTALUM CONCENTRATIONS AT FRIJOLES CANYON AS A FUNCTION OF STRATIGRAPHIC HEIGHT IN THE BANDELIER TUFF.
~· ~ '-'
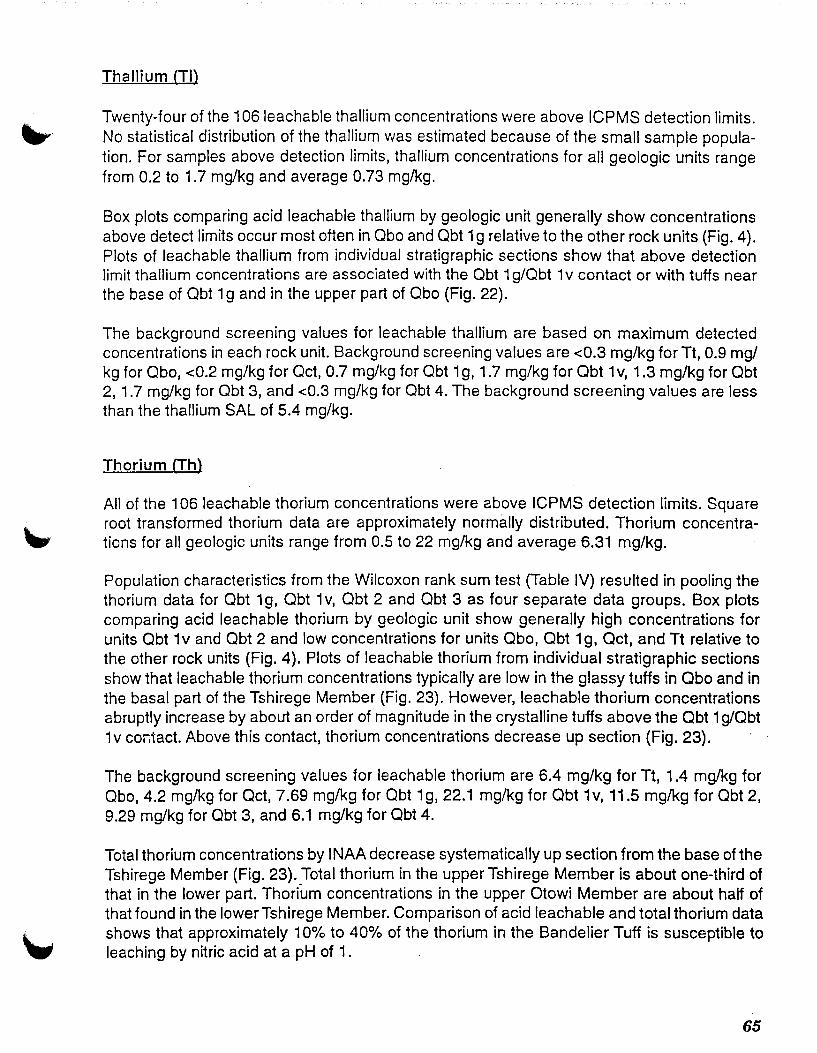
Thallium (TI)
Twenty-four of the 1 06 leachable thallium concentrations were above ICPMS detection limits. No statistical distribution of the thallium was estimated because of the small sample population. For samples above detection limits, thallium concentrations for all geologic units range from 0.2 to 1.7 mg/kg and average 0.73 mg/kg.
Box plots comparing acid leachable thallium by geologic unit generally show concentrations above detect limits occur most often in Qbo and Qbt 1 g relative to the other rock units (Fig. 4). Plots of leachable thallium from individual stratigraphic sections show that above detection limit thallium concentrations are associated with the Qbt 1 g/Qbt 1 v contact or with tuffs near the base of Qbt 1 g and in the upper part of Qbo (Fig. 22).
The background screening values for leachable thallium are based on maximum detected concentrations in each rock unit. Background screening values are <0.3 mg/kg for Tt, 0.9 mg/ kg for Qbo, <0.2 mg/kg for Oct, 0.7 mglkg for Qbt 1 g, 1.7 mg/kg for Obt 1 v, 1.3 mg/kg for Obt 2, 1.7 mglkg for Qbt 3, and <0.3 mg/kg for Qbt 4. The background screening values are less than the thallium SAL of 5.4 mg/kg.
Thorium (Th)
All of the 1 06 leachable thorium concentrations were above ICPMS detection limits. Square root transformed thorium data are approximately normally distributed. Thorium concentrations for all geologic units range from 0.5 to 22 mg/kg and average 6.31 mg/kg.
Population characteristics from the Wilcoxon rank sum test (Table IV) resulted in pooling the thorium data for Qbt 1 g, Obt 1 v, Obt 2 and Obt 3 as four separate data groups. Box plots comparing acid leachable thorium by geologic unit show generally high concentrations for units Obt 1 v and Obt 2 and low concentrations for units Obo, Obt 1 g, Oct, and Tt relative to the other rock units (Fig. 4). Plots of leachable thorium from individual stratigraphic sections show that leachable thorium concentrations typically are low in the glassy tuffs in Obo and in the basal part of the Tshirege Member (Fig. 23). However, leachable thorium concentrations abruptly increase by about an order of magnitude in the crystalline tuffs above the Obt 1 g/Obt 1 v contact. Above this contact, thorium concentrations decrease up section (Fig. 23}.
The background screening values for leachable thorium are 6.4 mg/kg for Tt, 1.4 mglkg for Qbo, 4.2 mg/kg for Oct, 7.69 mg/kg for Obt 1 g, 22.1 mg/kg for Obt 1 v, 11.5 mglkg for Obt 2, 9.29 mg/kg for Qbt 3, and 6.1 mg/kg for Obt 4.
Total thorium concentrations by INAA decrease systematically up section from the base of the Tshirege Member (Fig. 23}. Total thorium in the upper Tshirege Member is about one-third of that in the lower part. Thor(um concentrations in the upper Otowi Member are about half of that found in the lowerTshirege Member. Comparison of acid leachable and total thorium data shows that approximately 10% to 40% of the thorium in the Bandelier Tuff is susceptible to leaching by nitric acid at a pH of 1.
65
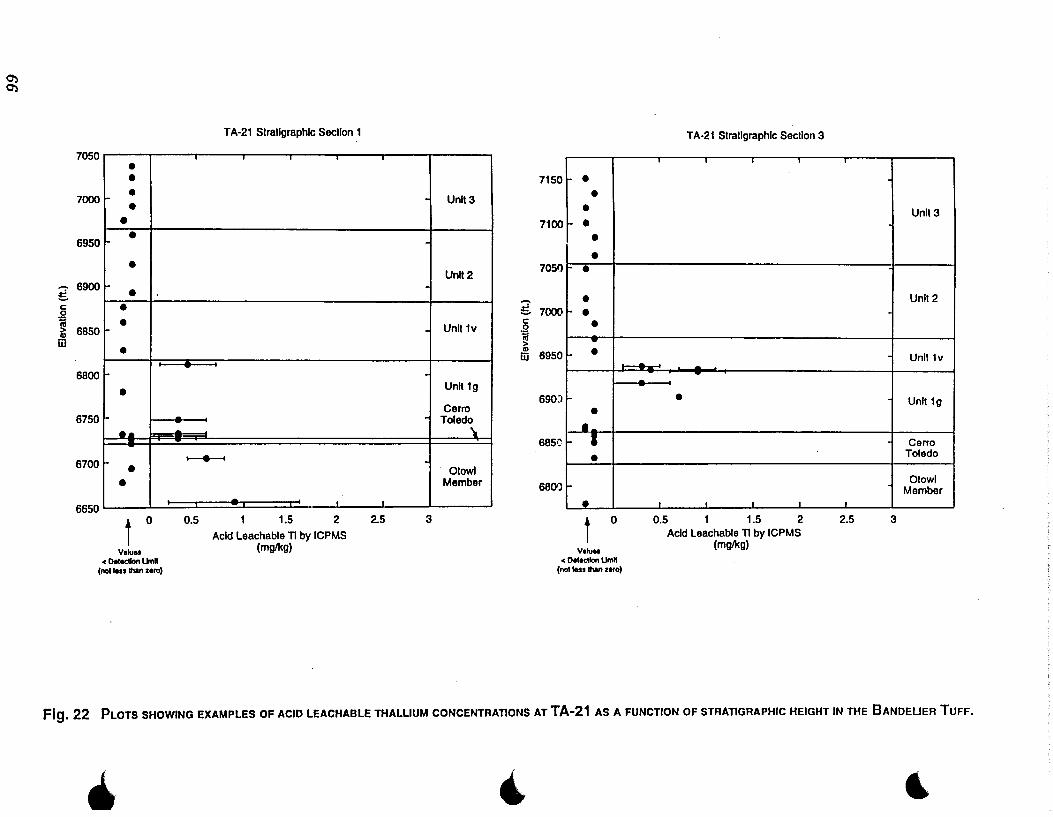
~ ~
7050 I • • 7000 • • • ~--. 6950
• --:- 6900 ~ c: 0
• t-. ~ • 6'i 6850 iii • - ,_
6800
• 6750 ....
t-
6700 • • 6650
t 0
Values < Deleetfon tinft
(no! less !han zero)
--
TA-21 Slrallgraphlc Section 1
•
... ,___.__...
0.5 ___. ·-- I
1.5 2
Acid Leachable 11 by ICPMS (mg.lkg)
2.5
Unll3
Unl12
-Unl11v
--
Unll1g
Cerro
Toted~\_
Olowl Member
-3
7150 • • • 7100 1- •
• • 7051) •
g 7000 • • c: 0 • "iii > -m 6950 •
690)
• •
6850 I •
68CY.l
•
t 0
Voluu < Oelecllon Umft
(nolless !han zlfo)
TA-21 Slrallgraphlc Seclion 3
-- -~
•
I I
0.5 1.5 2 Acid Leachable 11 by ICPMS
(mg.lkg)
Unl13
Unll2
Unll1v
Unll1g
Cerro Toledo
Olowl Member
I
2.5 3
Fig. 22 PLOTS SHOWING EXAMPLES OF ACID LEACHABLE THALLIUM CONCENTRATIONS AT TA-21 AS A FUNCTION OF STRATIGRAPHIC HEIGHT IN THE BANDELIER TUFF.
• ~ ~
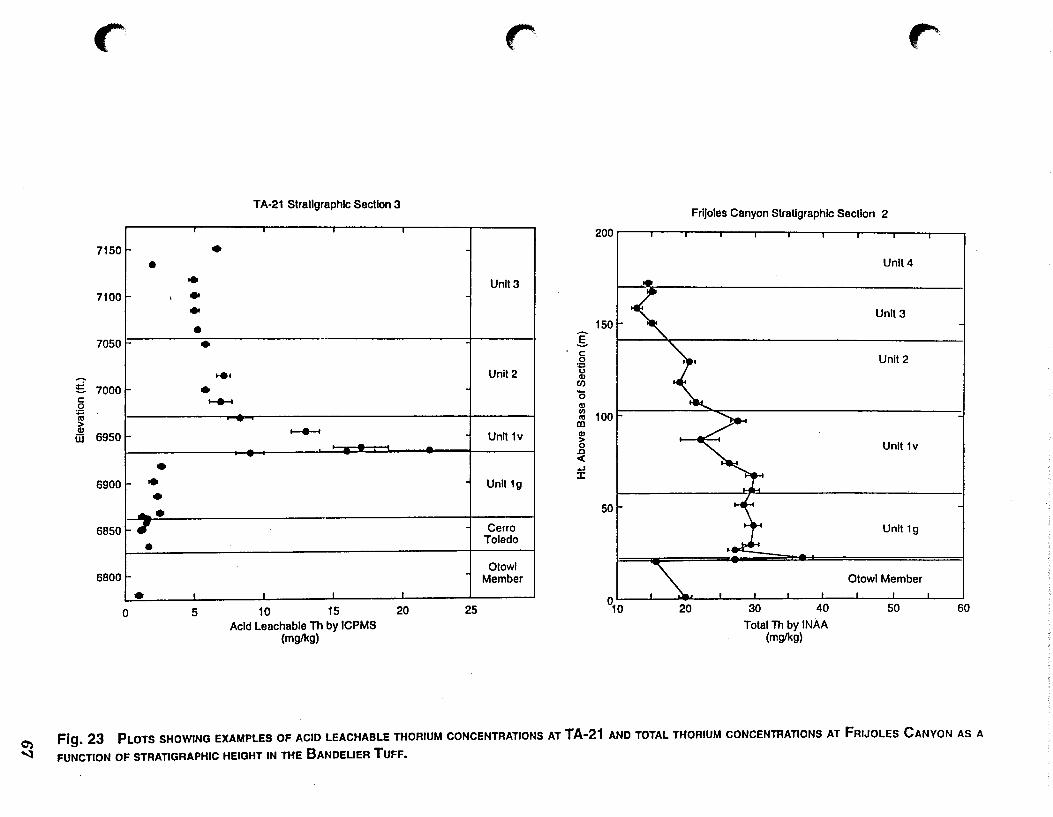
r
' 7150
• 7100 .
7050
~ 7000 c: 0
~ > Q)
6950 jjj
• 6900 • • 6850
,. •
6800 t-
• 0
TA-21 Stratigraphic Section 3
• • • • • -· • ... • ~
5
.. ._.._..
I I I
10 15 20 Acid Leachable Th by ICPMS
(mglkg)
r, r
Frijoles Canyon Stratigraphic Section 2
200r---r---.---.---,---,---.----.--~--~--~
Unit 4
Unlt3
Unlt2
Unit 1v
Unit 1g
Cerro Toledo
Otowi Member I
25
Q) Fig. 23 PLOTS SHOWING EXAMPLES OF ACID LEACHABLE THORIUM CONCENTRATIONS AT TA-21 AND TOTAL THORIUM CONCENTRATIONS AT FRIJOLES CANYON AS A
'-1 FUNCTION OF STRATIGRAPHIC HEIGHT IN THE BANDELIER TUFF.
Uranium (U)
Ninety-two of the 106 leachable uranium concentrations were above ICPMS detection limits. Square root transformed uranium data are approximately normally distributed. Uranium concentrations for all geologic units range from 0.2 to 5.7 mg/kg and average 1.28 mg/kg.
Population characteristics from the Wilcoxon rank sum test (Table IV) resulted in pooling the uranium data for Qbt 1 g, Qbt 1 v, Obt 2 and Obt 3 as four separate data groups. Box plots comparing acid leachable uranium by geologic unit show generally high concentrations for unit Obt 1 v and low concentrations for units Obo, Obt 1 g, Oct, and Tt relative to the other rock units (Fig. 4). Plots of leachable uranium from individual stratigraphic sections show that leachable uranium concentrations typically are low in the glassy tuffs in Qbo and in the basal part of the Tshirege Member, and they abruptly increase above the Qbt 1 g/Obt 1 v contact (Fig. 24}. Above this contact, uranium concentrations decrease up section.
The background screening values for leachable uranium are 0.6 mg!kg for Tt, 0.2 mg/kg for Obo, 0.4 mg/kg for Oct, 1.39 mg/kg for Obt 1 g, 5.93 mg/kg for Obt 1 v, 2.48 mg/kg for Qbt 2, 1.64 mg/kg for Qbt 3, and 0.9 mg/kg for Obt 4. Background screening values for uranium in all rock units are well below the SAL of 95 mglkg.
Total uranium concentrations by INAA decrease systematically up section from the base of the Tshlrege Member (Fig. 24). Total uranium in the upperTshirege Member is about one-haif of that in the lower part. Uranium concentrations in the upper Otowi Member are about 25% less than those found in the lower Tshirege Member. Comparison of acid leachable and total ~ uranium data shows that between 5% and 50% of the total uranium in the Bandelier Tuff is · susceptible to leaching by nitric acid at a pH of 1.
Vanadium (V)
Ninety of the 106 leachable vanadium concentrations were above ICPES detection limits of 0.4 to 1.4 mglkg. The vanadium data are approximately normally distributed. Vanadium concentrations for all geologic units range from 0.8 to 29 mg/kg and average 3.08 mg!kg.
Population characteristics from the Wilcoxon rank sum test (Table IV) resulted in pooling the vanadium data for Qbt 1 g as a separate data group and Qbt 1 v, Obt 2, and Qbt 3 as another data group (Qbt1v,2,3}. Box plots comparing acid leachable aluminum by geologic unit show that medians, arithmetic means, and middle 50 percent ranges are distinctly greater for units Tt and Qbt 4 than for the other units (Fig. 4). Plots of leachable vanadium from individual stratigraphic sections show that leachable vanadium concentrations are relatively constant in units Oct 1 g through Obt 3 of the Tshirege Member (Fig. 25). Soluble vanadium concentrations in Obt 4 are approximately four times greater than those in the underlying tuffs of the Tshirege Member. ··
The background screening values for leachable vanadium are 29 mg/kg for Tt, 2.8 mg/kg for Obo, 3.8 mg/kg for Oct, 1.67 mg/kg for Obt 1 g, 9.5 mg/kg for Obt 4, and 4.01 mg/kg for Qbt 1v, Obt 2, and Obt 3. Background screening values for vanadium in all rock units are well below the SAL of 540 mg/kg.
68
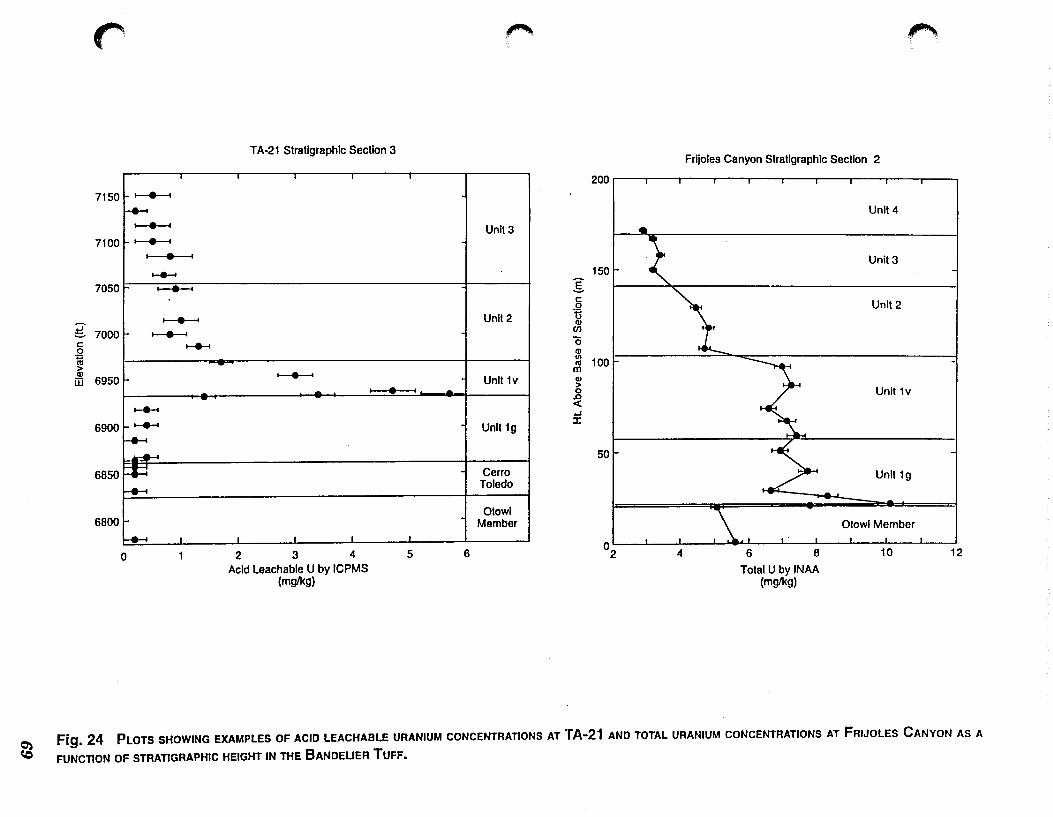
~
r
7150 ,__.__....
f-+-t ~
7100 ,__.__....
I • I
......... 7050 ,_._.
,__.__.... .:t:! 7000 ,_._. c: 0
,__._. ~ --> Q)
m 6950
-,__._. 6900
,__._. f--4H -~
6850 ~ f-+-4
6800 1-
1-+-t 0
TA-21 Stratigraphic Section 3
~ ..
_L
2 3 4 Acid Leachable U by ICPMS
(mglkg)
I • I
I
5
"""
Unlt3
Unlt2
Unll1v .. Unit 1g
Cerro Toledo
otowi Member
6
~
Frijoles Canyon Stratigraphic Section 2
200.---r---~--.----r---r---.---.----r---.---~
Unit4
Unit3 150
e c: I "':.. Unit2 0
t5 Q)
C/)
0 Q)
~ 100 m Q)
> I /" Unit 1v 0 .0 c{ ..J :I:
so I .......... ~
Unit 1g
~·I Otowi Member
01 I I I ~~I I" I I I
2 4 6 8 10 12
Total U by INAA (mglkg)
Fig. 24 PLOTS SHOWING EXAMPLES OF ACID LEACHABLE URANIUM CONCENTRATIONS AT TA-21 AND TOTAL URANIUM CONCENTRATIONS AT FRIJOLES CANYON AS A
FUNCTION OF STRATIGRAPHIC HEIGHT IN THE BANDELIER TUFF.
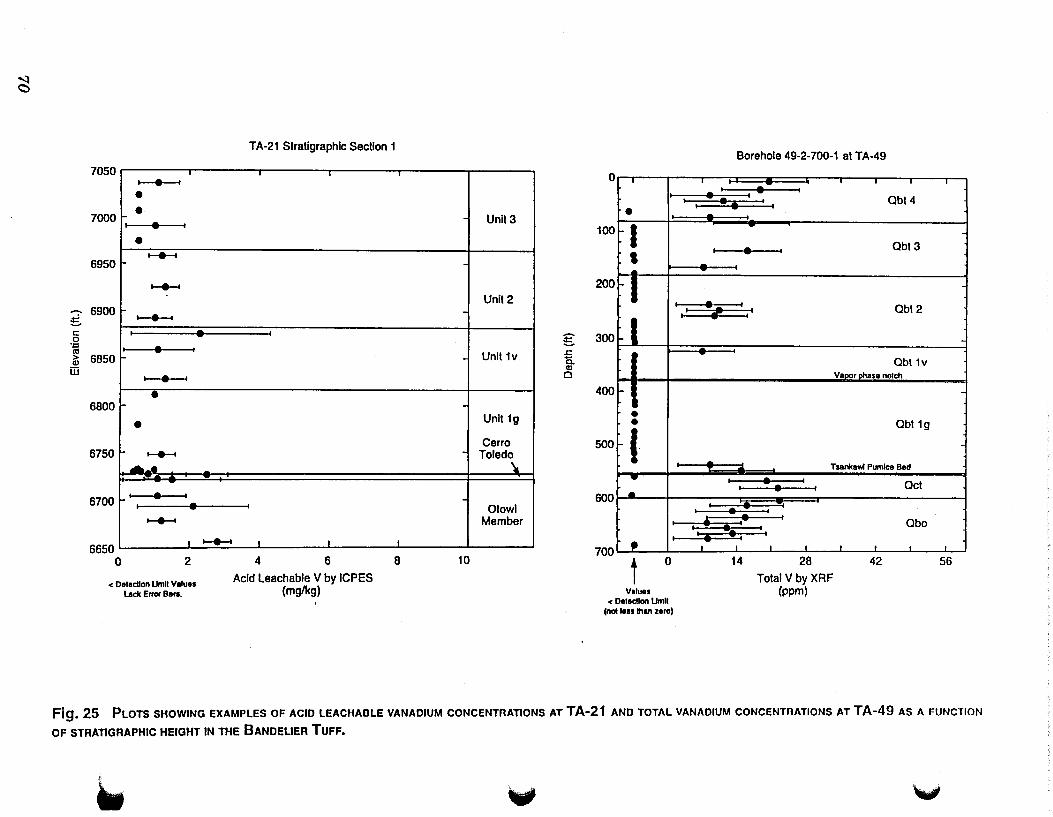
'l c
7050 I • I
• 7000 •
I • • .............. 6950
..............
. 6900 ~ ---r:: 0 ·.c Ill I • &; 6850 ill
I • •
6800
• 6750 .............. .._. 6700 t-1
6650 0
• ..............
I
I
I
I
2
< Detection Umll Values lack Error Bars.
..............
TA-21 Stratigraphic Section 1
I I
4 6
Acid Leachable V by ICPES (mglkg)
8 10
Unlt3
Unit2
Unit1v
Unit 1g
Cerro Toledo
\
Otowi Member
0 I
I
• 100 I
' .. 200 ~-r
g 300 I ..r::
~ 0
400
• • • 500 I
-.-600 •
I
I
700 • t 0
Values < Detection Umll
(nallen lhan zero)
I
I I
I
Borehole 49-2-700-1 at TA-49
I • I • • I Qbt4 I • I I
I • I Qbt3
., I Qbt2 I I
Obt 1v Vaoor !lhasa notch
Qbt1g
Tsankawl Pumlca Bed
I •• I Oct I I
I •• I
I • I
Qbo • I I I. .I I
I I
14 28 42
Total V by XRF (ppm)
-
-
-
-
, -1
' , J
,
I
56
Fig. 25 PLOTS SHOWING EXAMPLES OF ACID LEACHABLE VANADIUM CONCENTRATIONS AT TA-21 AND TOTAL VANADIUM CONCENTRATIONS AT TA-49 AS A FUNCTION
OF STRATIGRAPHIC HEIGHT IN THE BANDELIER TUFF.
~ .., \,#
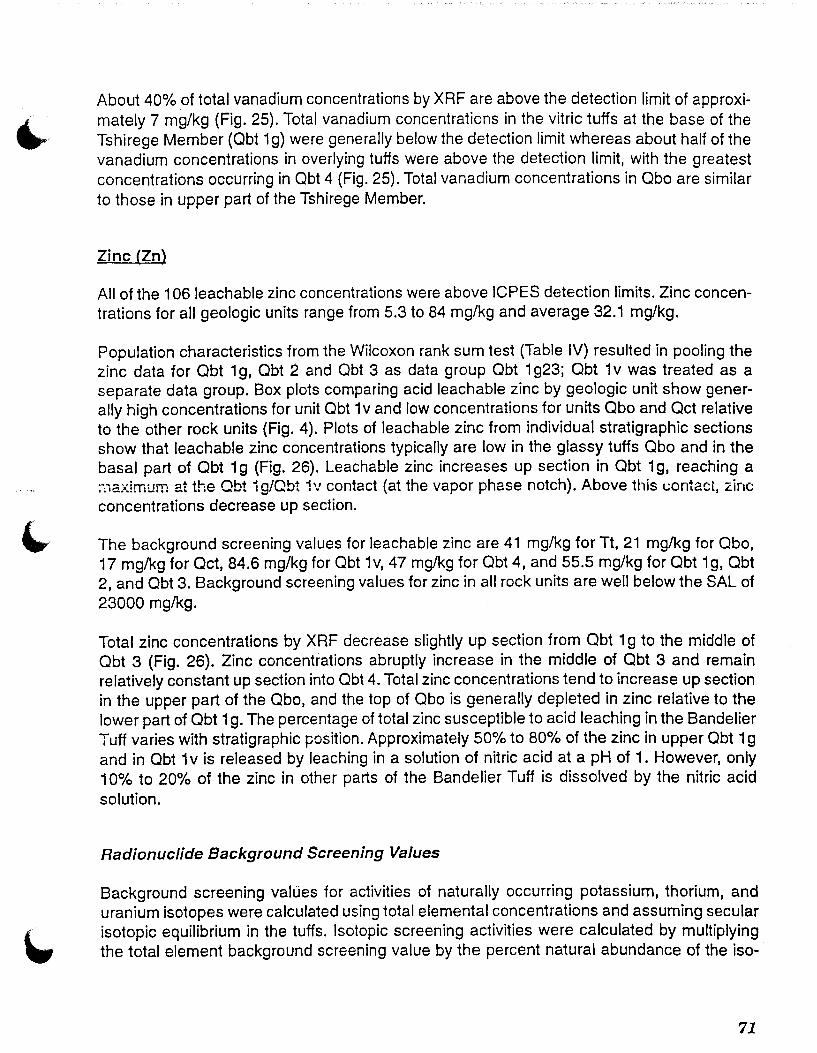
About 40% of total vanadium concentrations by XRF are above the detection limit of approxi
mately 7 mg/kg (Fig. 25). Total vanadium concentrations in the vitric tuffs at the base of the
Tshirege Member (Qbt 1 g) were generally below the detection limit whereas about half of the
vanadium concentrations in overlying tuffs were above the detection limit, with the greatest
concentrations occurring in Qbt 4 (Fig. 25). Total vanadium concentrations in Qbo are similar
to those in upper part of the Tshirege Member.
Zinc (Zn)
All of the 1 06 leachable zinc concentrations were above ICPES detection limits. Zinc concen
trations for all geologic units range from 5.3 to 84 mg/kg and average 32.1 mglkg.
Population characteristics from the Wilcoxon rank sum test (Table IV) resulted in pooling the
zinc data for Qbt 1 g, Qbt 2 and Qbt 3 as data group Qbt 1 g23; Qbt 1 v was treated as a separate data group. Box plots comparing acid leachable zinc by geologic unit show gener
ally high concentrations for unit Qbt 1 v and low concentrations for units Qbo and Oct relative
to the other rock units (Fig. 4). Plots of leachable zinc from individual stratigraphic sections show that leachable zinc concentrations typically are low in the glassy tuffs Qbo and in the
basal part of Qbt 1 g (Fig. 26). Leachable zinc increases up section in Qbt 1 g, reaching a ;;1aximum at the Qbt 1g/Qbt 1'.' contact (at the vapor phase notch). Above this t:ontact, zinc concentrations decrease up section.
The background screening values for leachable zinc are 41 mg/kg for Tt, 21 mg/kg for Qbo,
17 mg/kg for Oct, 84.6 mg/kg for Qbt 1v, 47 mglkg for Obt 4, and 55.5 mglkg for Qbt 1g, Qbt 2, and Qbt 3. Background screening values for zinc in all rock units are well below the SAL of
23000 mg/kg.
Total zinc concentrations by XRF decrease slightly up section from Qbt 1 g to the middle of
Qbt 3 (Fig. 26). Zinc concentrations abruptly increase in the middle of Qbt 3 and remain
relatively constant up section into Qbt 4. Total zinc concentrations tend to increase up section
in the upper part of the Qbo, and the top of Qbo is generally depleted in zinc relative to the
lower part of Qbt 1 g. The percentage of total zinc susceptible to acid leaching in the Bandelier
Tuff varies with stratigraphic position. Approximately 50% to 80% of the zinc in upper Obt 1 g
and in Qbt 1 v is released by leaching in a solution of nitric acid at a pH of 1. However, only
1 0% to 20% of the zinc in other parts of the Bandelier Tuff is dissolved by the nitric acid
solution.
Radionuclide Background Screening Values
Background screening values for activities of naturally occurring potassium, thorium, and
uranium isotopes were calculated using total elemental concentrations and assuming secular
isotopic equilibrium in the tuffs. Isotopic screening activities were calculated by multiplying
the total element background screening value by the percent natural abundance of the iso-
71
~
I 7150 ~
~
~
7100 ~
~
7050
.... ~ 7000 c: 0 -~ --
> Q)
6950 jjj
6900
• ... 6850 ..;;; ......
r -,__._ 6800 r ,__._
I_
0 20
TA-21 Stratigraphic Section 3
I
.......... .......-....
.......... I • ~
I • -I
,__._ ..........
,__._
40 60 Acid Leachable Zn by ICPES
(mglkg)
...
80
Unit3
Unit2
Unit 1v
Unit 1g
Cerro Toledo
Otowi Member
100
I
J I
J I
I
g £ c. Cl' 0
Borehole 49-2-700-1 at TA-49
Qbl4
Obt3
Qbt2
Qbt1v VaPOr Dhasa notch
400
Obt1g
500
Tsankawt Pumice Oed
Oct 6ool _... I Qbo
500
700 J I tw"' I I I I 1 1 1 1
300 400 0 100 200
Total Zn by XRF (mglkg)
Fig. 26 PLOTS SHOWING EXAMPLES OF ACID LEACHABLE ZINC CONCENTRATIONS AT TA-21 AND TOTAL ZINC CONCENTRATIONS AT TA-49 AS A FUNCTION OF STRATIGRAPHIC HEIGHT IN THE BANDELIER TUFF.
.. ~ ~·
tope of interest and the specific activity of that isotope. Radium-226 activities were measured for a limited suite of samples, and background screening values for this isotope are also discussed.
The radionuclide background screening activities were calculated using INAA data for 47 samples of Bandelier Tuff collected at two sections in Frijoles Canyon. A summary of background screening activities for radionuclides is presented in Table VIII.
Potassium-40
All of the total potassium concentrations were above INAA detection limits. Potassium concentrations for all geologic units range from 28760 to 47920 mg/kg and average 38137 mg/ kg. The potassium data are approximately normally distributed. Population characteristics from the Wilcoxon rank sum test resulted in pooling all of the potassium data for Qbt 1 g, Obt 1 v, Qbt 2, and Qbt 3 (as data group Qbt 123). Obt 4 was pooled as a separate data group.
The background screening activities for potassium-40 are 30.4 pCi/g for Qbo, 36.9 pCi/g for Qbt 1g, Obt 1v, Obt 2, and Qbt 3, and 37.0 pCi/g for Obt 4 (Table VIII).
Radium (Ra)
Thirteen Bandelier Tuff samples were analyzed for Radium-226 activities by gamma-ray spectroscopy. No statistical distribution of the radium-226 was estimated because of the small sample population. Radium activities range from 1.72 to 7.15 pCi/g and average 4.92 in the 13 samples analyzed.
Box plots comparing radium-226 activities by geologic unit show that radium-226 activities tend to decrease up section, with the highest activities occurring in unit Qbo and the lowest in Qbt 3 (Fig. 4). Radium-226 activities increase in Qbo 4 relative to the underlying tuffs. Radium-226 activities were not determined for units Oct and Tt.
The background screening values for radium-226 are based on maximum activities in each rock unit. Background scr~ening values are 7.15 pCi/g for Qbo, 6.78 pCi/g for Qbt 1g, 6.61 pCi/g for Qbt 1 v, 4.82 pCi/g for Obt 2, 2.6 pCi/g for Qbt 3, and 6.23 pCi/g for Obt 4. Six of the thirteen tuff samples analyzed in this study have 226Ra activities that exceed the SAL of 5 pCi/
g.
Thorium-232
All of the total thorium concentrations were above INAA detection limits. Thorium concentrations for all geologic units range from 12.7 to 37.1 mg/kg and average 22.7 mglkg. Statistical distributions for total thorium were not evaluated because of the small sample size for each stratigraphic unit. Maximum concentrations are used to calculate background screening activities for all units.
73
TABLE VIII.
COMPUTED BACKGROUND SCREENING VALUES FOR NATURALLY OCCURRING RADIONUCLIDES COMPILED BY
GEOLOGICAL UNITS
Analyte 1 Qbo Qbt 1g Qbt 1v Qbt 2 Qbt 3 Qbt 4 SAL Total Potassium 37200 45100 45100 45100 45100 45300 NA (mg!kg) Potassium-40 30.4 36.9 36.9 36.9 36.9 37.0 NA (pCi/g) Radium-226 7.15 6.78 6.61 4.82 2.6 6.23 5 (pCi/g measured) Total Thorium 19.9 37.1 30.1 25.9 16.3 15.6 NA (mg!kg) Thorium-232 2.17 4.05 3.29 2.83 1.78 1.70 5 (pCi/g) Total Uranium 5.61 10.1 7.59 7.12 4.37 2.93 95 (mg!kg) Uranium-234 1.99 3.59 2.70 2.53 1.55 1.04 86 (pCi/g) Uranium-235 0.086 0.155 0.116 0.109 0.067 0.045 18 i(pCi/g) Uranium-238 1.87 3.37 ., 2.53 2.37 1.46 0.98 59 (pCi/g) Total Uranium 3.95 7.12 5.34 5.01 3.08 2.06 66 (pCi/g)
NA - Not available.
The background screening activities for thorium-232 are 2.17 pCi/g for Qbo, 4.05 pCi/g for Qbt 1 g, 3.29 pCilg for Qbt 1 v, 2.83 pCi/g for Qbt 2,1.78 pCi/g for Qbt 3, and 1.70 pCi/g for Qbt 4 (Table VIII). The background screening activities for thorium-232 are below the SAL of 5 pCi/g.
Uranium Isotopes
All of the total uranium concentrations were above INAA detection limits. Uranium concentrations for all geologic units range from 2.8 to 1 0.1 mg/kg and average 5.89 mg/kg. Statistical distributions for total uranium were not evaluated because of the small sample size for each stratigraphic unit. Maximum concentrations are used to calculate background screening activities for all units. Uranium background screening activities are summarized by isotope in Table VIII. The background screening activities for uranium isotopes are below SALs.
74
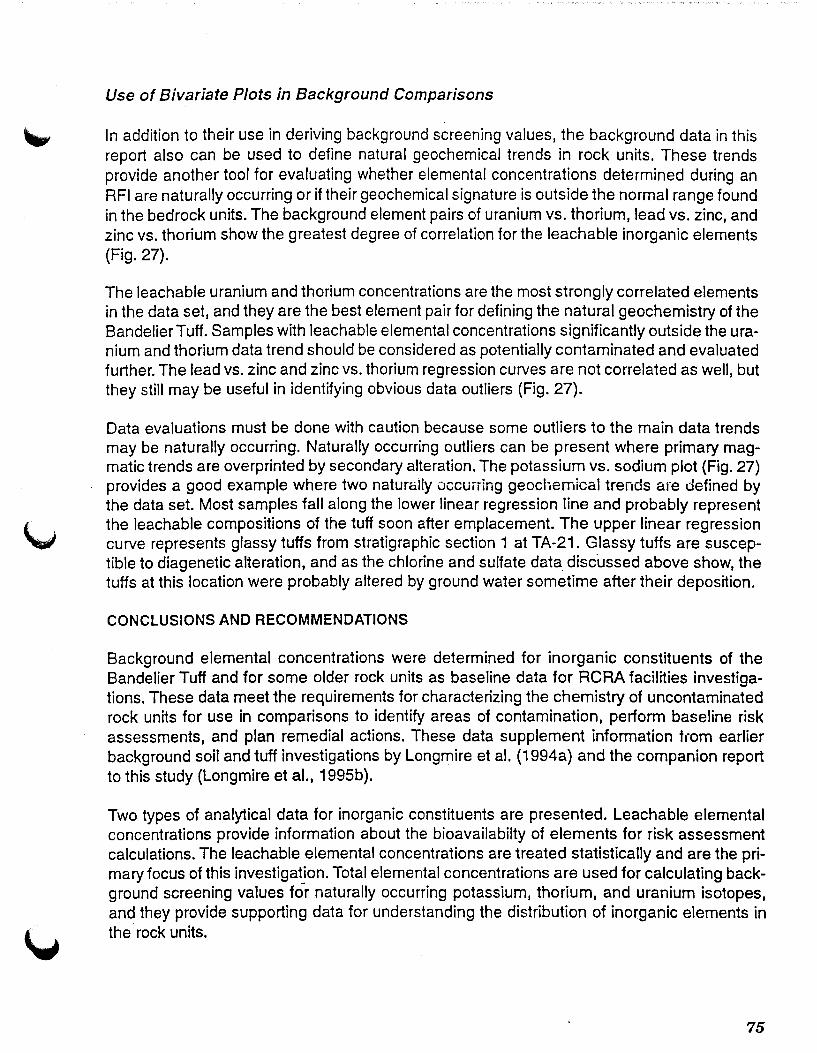
Use of Bivariate Plots in Background Comparisons
In addition to their use in deriving background screening values, the background data in this report also can be used to define natural geochemical trends in rock units. These trends provide another tool for evaluating whether elemental concentrations determined during an RFI are naturally occurring or if their geochemical signature is outside the normal range found in the bedrock units. The background element pairs of uranium vs. thorium, lead vs. zinc, and zinc vs. thorium show the greatest degree of correlation for the leachable inorganic elements (Fig. 27).
The leachable uranium and thorium concentrations are the most strongly correlated elements in the data set, and they are the best element pair for defining the natural geochemistry of the Bandelier Tuff. Samples with leachable elemental concentrations significantly outside the uranium and thorium data trend should be considered as potentially contaminated and evaluated further. The lead vs. zinc and zinc vs. thorium regression curves are not correlated as well, but they still may be useful in identifying obvious data outliers (Fig. 27).
Data evaluations must be done with caution because some outliers to the main data trends may be naturally occurring. Naturally occurring outliers can be present where primary magmatic trends are overprinted by secondary alteration. The potassium vs. sodium plot {Fig. 27) provides a good example where two naturally occunlng geochemical trends are defined by the data set. Most samples fall along the lower linear regression line and probably represent the leachable compositions of the tuff soon after emplacement. The upper linear regression curve represents glassy tuffs from stratigraphic section 1 at TA-21. Glassy tuffs are susceptible to diagenetic alteration, and as the chlorine and sulfate data discussed above show, the tuffs at this location were probably altered by ground water sometime after their deposition.
CONCLUSIONS AND RECOMMENDATIONS
Background elemental concentrations were determined for inorganic constituents of the Bandelier Tuff and for some older rock units as baseline data for RCRA facilities investigations. These data meet the requirements for characterizing the chemistry of uncontaminated rock units for use in comparisons to identify areas of contamination, perform baseline risk assessments, and plan remedial actions. These data supplement information fiOm earlier background soil and tuff investigations by Longmire et al. (1 994a) and the companion report to this study (Longmire et al., 1 995b).
Two types of analytical data for inorganic constituents are presented. Leachable elemental concentrations provide information about the bioavailabilty of elements for risk assessment calculations. The leachable elemental concentrations are treated statistically and are the primary focus of this investigation. Total elemental concentrations are used for calculating background screening values for naturally occurring potassium, thorium, and uranium isotopes, and they provide supporting data for understanding the distribution of inorganic elements in the rock units.
75
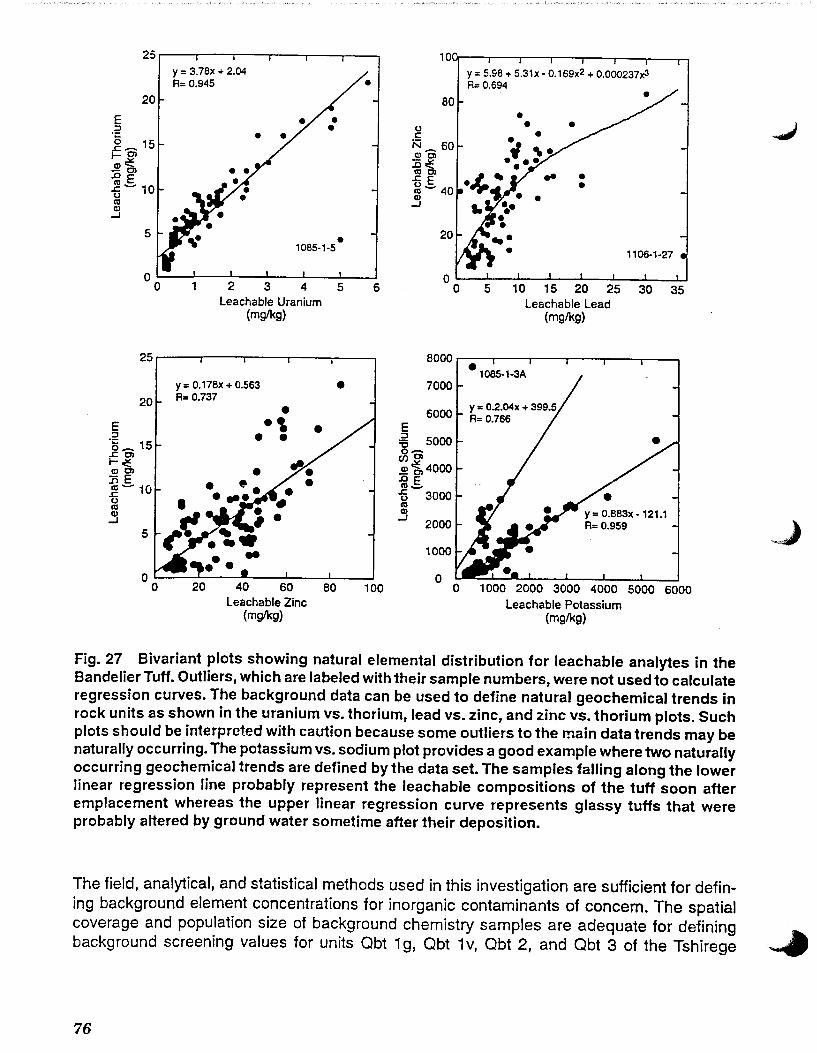
25 10 y = 3.7Bx + 2.04 y = 5.98 + 5.31x • 0.169x2 + 0.000237x3 R= 0.945 R= 0.694
20 80
E • .2 0 • c _g- 15 N_ 60 1-0l (1)01 .:.: :Col!: (I)-- Ol COOl • .oE .cE • ~-1o l6 .._ 40 0 (I) • co _J (I)
_J
5 • 20 1085-1·5
1106-1·27
0 0 0 1 2 3 4 5 6 0 5 10 15 20 25 30 35
Leachable Uranium Leachable Lead (mglkg) (mglkg)
25 8000 e1085·1·3A
y = 0.17Bx + 0.563 • 7000 20 R= 0.737
• 6000 E ., E :::1 • • :::1
5000 ·g_ 15 '6 o-.COl enOl 1-.l!: .S! .g, 4000 (1)01 :nE .OE co-~- iO -£ 3000 0 co co (I) Cll _J _J 2000
5
1000
0 20 40 60 80 100 0 1000 2000 3000 4000 5000 6000
Leachable Zinc Leachable Potassium (mglkg) (mglkg)
Fig. 27 Bivariant plots showing natural elemental distribution for leachable analytes in the Bandelier Tuff. Outliers, which are labeled with their sample numbers, were not used to calculate regression curves. The background data can be used to define natural geochemical trends in rock units as shown in the uranium vs. thorium, lead vs. zinc, and zinc vs. thorium plots. Such plots should be interpreted with caution because some outliers to the main data trends may be naturally occurring. The potassium vs. sodium plot provides a good example where two naturally occurring geochemical trends are defined by the data set. The samples falling along the lower linear regression line probably represent the leachable compositions of the tuff soon after emplacement whereas the upper linear regression curve represents glassy tuffs that were probably altered by ground water sometime after their deposition.
The field, analytical, and statistical methods used in this investigation are sufficient for defining background element concentrations for inorganic contaminants of concern. The spatial coverage and population size of background chemistry samples are adequate for defining background screening values for units Obt 1 g, Qbt 1 v, Qbt 2, and Qbt 3 of the Tshirege
76
~ .. J
Member. These tuffs are the most widespread rock units on the Pajarito Plateau and make up the bedrock at the majority of the Laboratory's potential release sites. No additional background data are needed for these units.
We recommend additional background characterization of Obt 4 because so few samples of this unit are included in the present data set. Obt 4 is an important geologic unit because it has unique geochemical characteristics compared to other parts of the Tshirege Member and because it is the surface bedrock unit underlying potential release sites in the western part of the Laboratory. The need for additional Obt 4 background data will be mitigated in part by ongoing local background investigations being done in support of clean closure of MDA P at TA-16. We recommend that characterization of Qbt 4 be completed by analyzing samples from the background geology borehole 49-2-700-1 at TA-49 which penetrated 25m of Obt 4 at the top of the section.
Additional background data are presented for some of the pre-Tshirege rock units including, in descending stratigraphic order: tephras and volcaniclastic sediments of the Cerro Toledo interval, the upper part of the Otowi Member of the Bandelier Tuff, and dacitic lavas of the Tschicoma Formation. These background data provide useful bounding information on the geochemistry of these deeper units, but they are considered preliminary because so few samples of these units are included in the present data set. Because these rock units directly underlie so few potential release sites, we recommend that local background data be collected for these units Oi 1 an as needed basis.
REFERENCES
Baltz, E.H., Abrahams, J.H., Sr., and Purtymun, W.O., 1963, Preliminary report on geology and hydrology of Mortandad Canyon near Los Alamos, New Mexico, with reference to disposal of liquid low-level radioactive wastes, U.S. Geol. Survey open-file report (Albuquerque, NM), 105 p.
Broxton, D.E., Heiken, G., Chipera, S.J., and Byers, F.M., 1995a, Stratigraphy, Petrography, and Mineralogy of Bandelier Tuff and Cerro Toledo deposits, in D.E.Broxton and P.G. Eller, eds., Earth Science Investigations for Environmental Restoration-Los Alamos National Laboratory Technical Area 21, Los Alamos National Laboratory Report LA-12934-MS pp. 33-64.
Broxton, D.E., Vaniman, D., Byers, F.M., Jr., Chipera, S.J., Kluk, E.C., and Warren, R.G., 1995b, Stratigraphy, mineralogy, and chemistry of bedrock tuffs at Pajarito Mesa, Los Alamos National Laboratory, New Mexico, Los Alamos National Laboratory report, in press, 29p
Broxton, D.E., LaDelfe, C., Chipera, S.J., and Kluk, E.C., in review, Stratigraphy, mineralogy, and chemistry of bedrock tuffs at Mesita del Suey, Los Alamos National Laboratory, New Mexico, Los Alamos Nation_al Laboratory LAMS report, 32p., in review.
Broxton, D.E. and Reneau, S.L., 1995, Stratigraphic nomenclature of the Bandelier Tuff for the Environmental Restoration Project at Los Alamos National Laboratory, Los Alamos National Laboratory Report LA-1301 O-MS, 21 p.
77
Carr, M.H. and Turekian, K.K., 1961, The geochemistry of cobalt, Geochem. et Cosmochim. Acta, 26, pp. 411-416.
Crowe, B., Linn, G., Heiken, G., and Bevier, M., 1978, Stratigraphy of the Bandelier Tuff in the Pajarito Plateau, applications to waste management, Los Alamos National Laboratory report LA-7225-MS, 57 p.
Doell, R.R., Dalrymple, G.B., Smith, R.L., and Bailey, R.A., 1968, Paleomagnetism, potassium-argon ages, and geology of rhyolites and associated rocks of the Valles caldera, New Mexico, Geol. Soc. America Memoir 116, pp. 211-248.
EPA (US Environmental Protection Agency), April1989, "Statistical Analysis of Ground-Water Monitoring Data at RCRA Facilities. Interim Final Guidance," Office of Solid Waste, Waste Management Division, US Environmental Protection Agency, Washington DC. (EPA 1989, 1141)
EPA (US Environmental Protection Agency), April1992, "Guidance for Data Useability in Risk Assessment (Part A)," Office of Emergency Remedial Response, US Environmental Protection Agency, Washington DC. (EPA 1992, 1166)
Environmental Restoration Project Assessments Council, March 28,1995. Statistical Comparisons to Backgrounu, Part 1,•: Los Alamo~ Natior1ai Laboratory Report LA-UR-95-1217, Los Alamos, New Mexico. (Environmental Restoration Project Assessments Council1995, 1218)
Garcia, S.R., Hensley, W.K., Minor, M.M., Denton, M., and Fuka, M. A., 1982, An automated multidetector system for instrumental neutron activation analysis, of geologic and environmental materials, in R.H. Filby, B.S. Carpenter, and R,C. Ragaini, eds., Atomic and Nuclear Methods in Fossil Energy Research, Plenum, New York, pp. 133-140.
Gilbert, R.O., 1987, Statistical Methods for Environmental Pollution Monitoring., Von Nostrand Reinhold Company Inc., New York, 320 pp.
Goff, Fraser, 1995, Geologic Map of Technical Area 21, in D.E.Broxton and P.G. Eller, eds., Earth Science Investigations for Environmental Restoration-Los Alamos National Laboratory Technical Area 21, Los Alamos National Laboratory Report LA-12934-MS pp. 33-64.
Heiken, G., Goff, F., Stix, J., Tamanyu, S., Shafiqullah, S., Garcia, S., and Hagan, R, 1986, lntracaldera volcanic activity, Toledo caldera and embayment, Jemez Mountains, New Mexico, J. Geophy. Res., 91, (B2), pp. 1799-1815.
lzett, G.A. and Obradovich, J.D., 1994, 40Arf39Ar age constraints for the Jaramillo Normal Subchron and the Matuyama-Brunhes geomagnetic boundary, J. Geophys. Res. 99 (B2), pp. 2925-2934.
Longmire, 0., Duffy, C., and Reneau, S., 1993, Preliminary Background Elemental Concentrations in Bandelier Tuff and Selected Soils Series, 1993, Los Alamos National Laboratory, Letter Report.
78
Longmire, P., Reneau, S., Watt, P., McFadden, L., Gardner, J., Duffy, C., and Ryti, R., 1995a, Natural Background Geochemistry, Geomorphology, and Pedogenesis of Selected Soil Profiles and Bandelier Tuff, Los Alamos, New Mexico, Los Alamos National Laboratory Report LA-12913-MS, 158p.
Longmire, P., McDonald, E., Reneau, S., Ryti, R., and Watt, P., 1995b, Natural Background Geochemistry, Geomorphology, and Pedogenesis of Fourteen Soil Profiles, Los Alamos, New Mexico, this report.
Minor, M.M., Hensley, W.K., Denton, M., and Garcia, S.R., 1982, An automated activation analysis system, J. Radioanal. Chern., 70, pp. 459-471.
Reneau, S.L., Dethier, D.P., and Carney, J.S, 1995, Landslides and other mass movements at Technical Area 33, Los Alamos National Laboratory Report LA-12955-MS, 48 p.
Smith, R.L., 1960, Zones and zonal variations in welded ash flows, U.S. Geol. Survey Prof. Paper 354-F, pp. 149-159.
Smith, R.L. and Bailey, R.A., 1966, The Bandelier Tuff: a study of ash-flow eruption cycles from zoned magma chambers, Bull. Volcanologique, v. 29, pp. 83-104.
Smith, R.L., Bailey, R.A., and Ross, C.S., 1970, Geologic map of the Jemez Mountains, New Mexico, U.S. Geol. Survey Map 1-571, scale 1:125,000.
Smith, R. L., 1979, Ash flow magmatism, Geol. Soc. America Spec. Paper 180, p. 5-27.
Stimac, J.A., Broxton, D.E. Klug, E., and Chipera, S., 1995, Preliminary stratigraphy of tuffs from borehole 49-2-700-1 at Technical Area 49, Los Alamos National Laboratory, New Mexico, Los Alamos National Laboratory Report, in review.
Turekian K.K. and Wedepohl, K.H., 1961, Distribution of the elements in some major rock units of the Earth's crust, Geol. Soc. America Bull., v. 72, pp. 175-192.
Vaniman, D. and Wuhletz, K., 1990, Results of geological mapping/fracture studies, TA-55 area, Los Alamos National Laboratory Seismic Hazards Memo EES1-SH90-17, 25 pp, 3 Plates, 23 figures.
Vaniman, D., and Wohletz, K., 1991, Revisions to report EES1-SH90-17, Los Alamos National Laboratory Seismic Hazards Memo EES1-SH91-12, 2 pp.
Weir, J.E. and Purtymun, W.O., 1962, Geology and hydrology of Technical Area 49, Frijoles Mesa, Los Alamos County, New Mexico, U.S. Geol. Survey Admin. Release Report, Albuquerque, NM, 225 p.
79
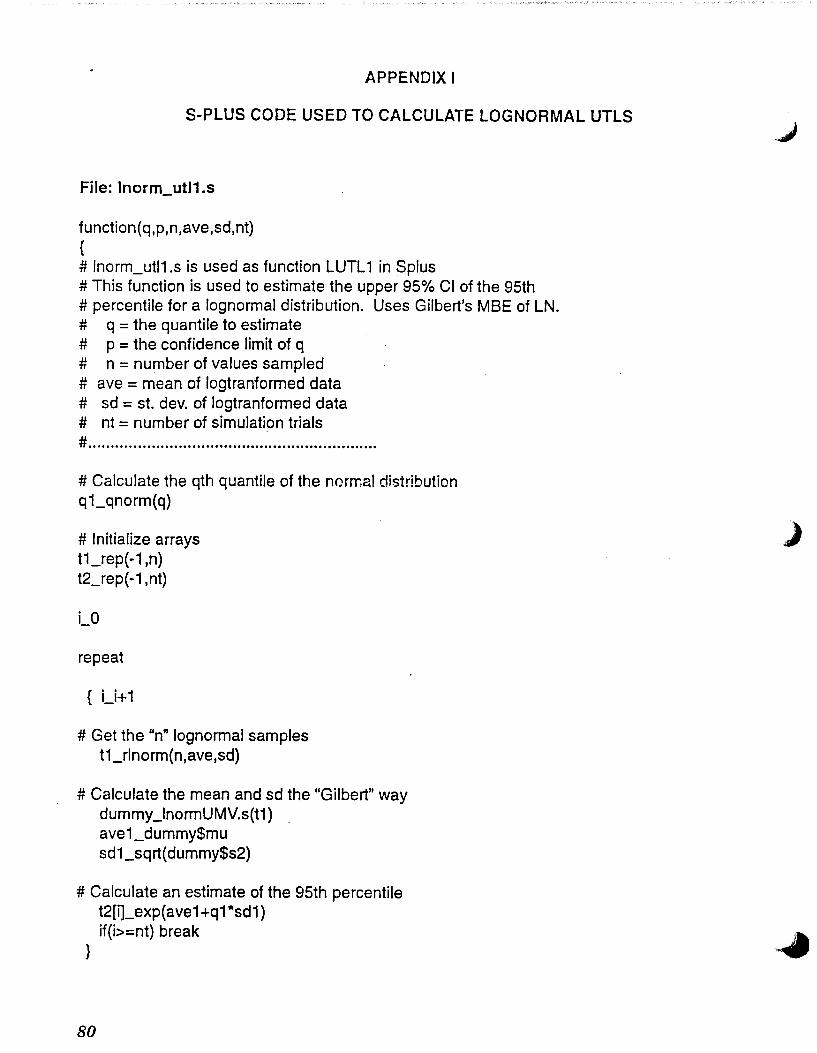
APPENDIX I
S-PLUS CODE USED TO CALCULATE LOGNORMAL UTLS
File: lnorm_ut11.s
function(q,p,n,ave,sd,nt) { # lnorm_utl1.s is used as function LUTL 1 in Splus # This function is used to estimate the upper 95% Cl of the 95th # percentile for a lognormal distribution. Uses Gilbert's MBE of LN. # q =the quantile to estimate # p = the confidence limit of q # n = number of values sampled # ave = mean of logtranformed data # sd = st. dev. of logtranformed data # nt = number of simulation trials # .............................•...•.•......•.....................
# Calculate the qth quantile of the norrr:al distribution q1_qnorm(q)
# Initialize arrays t1_rep{-1,n) t2_rep(-1,nt)
i_O
repeat
{ i_i+1
# Get the "n" lognormal samples t1_rlnorm(n,ave,sd)
# Calculate the mean and sd the "Gilbert" way dummy _lnormUMV.s(t1) ave1_dummy$mu sd 1_sqrt( dummy$s2)
# Calculate an estimate of the 95th percentile t2[i]_exp(ave1 +q1 *sd1) if(i>=nt) break
}
80
)
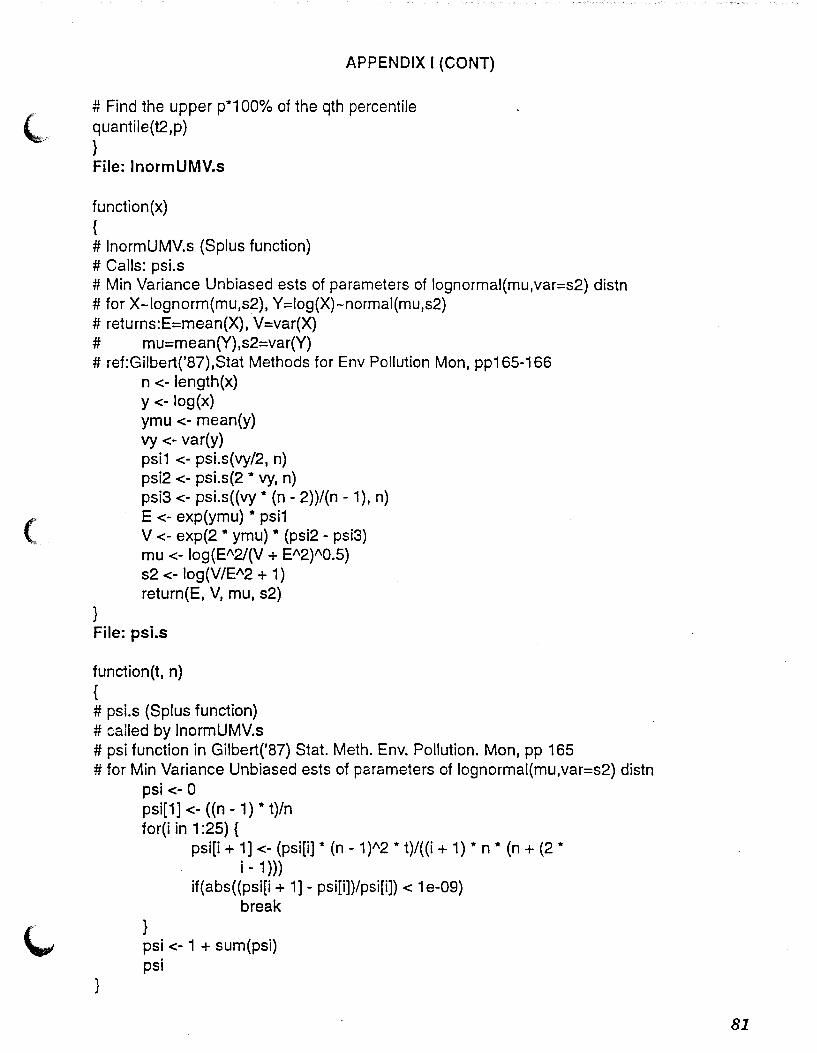
(
APPENDIX I (CONT)
# Find the upper p*1 00% of the qth percentile q uantile(t2,p) } File: lnormUMV.s
function(x) { # lnormUMV.s (Splus function) # Calls: psi.s # Min Variance Unbiased ests of parameters of lognormal(mu,var=s2) distn #for X-lognorm(mu,s2), Y=log(X)-normal(mu,s2) # returns:E=mean(X), V=var(X) # mu=mean(Y),s2=var(Y) # ref:Gilbert('87),Stat Methods for Env Pollution Mon, pp165-166
n <- length(x)
}
y <- log(x) ymu <- mean(y) vy <- var(y) psi1 <- psi.s(vy/2, n) psi2 <- psi.s(2 * vy, n) psi3 <- psi.s((vy * (n- 2))/(n- 1), n) E <- exp(ymu) * psi1 V <- exp(2 * ymu) * (psi2 - psi3) mu <- log(E"2/(V + E"2)"0.5) s2 <- log(V /E"2 + 1) return(E, V, mu, s2)
File: psi.s
function(t, n) { # psi.s (Splus function) # called by lnormUMV.s # psi function in Gilbert('87) Stat. Meth. Env. Pollution. Mon, pp 165 #for Min Variance Unbiased ests of parameters of lognormal(mu,var=s2) distn
psi<- 0
}
psi[1] <- ((n- 1) * t)/n for(i in 1 :25) {
}
psi[i + 1] <- (psi[i] * (n -1)"2 * t)/((i + 1) * n * (n + (2 * i- 1)))
if(abs((psi[i + 1]- psi[i])/psi[i]) < 1e-09) break
psi<- 1 + sum(psi) psi
81
This report has been reproduced directly from the
best available copy.
It is available to DOE and DOE contractors from the Office of Scientific and Technical Information, P.O. Box62, Oak Ridge, TN 37831. Prices are available from (615) 576-8401.
It is available to the public from the National Technical Information Service, US Department of Commerce, 5285 Port Royal Rd. Springfield, VA 22161.