Embed Size (px)
Citation preview
Available online at scholarcommons.usf.edu/ijs/ & www.ijs.speleo.it
International Journal of SpeleologyOfficial Journal of Union Internationale de Spéléologie
International Journal of Speleology 42 (1) 49-56 Tampa, FL (USA) January 2013
Natural and anthropogenic factors which influence aerosol distribution in Ingleborough Show Cave, UK Andrew C. Smith1*, Peter M. Wynn1, and Philip A. Barker1
1 Lancaster Environment Centre, University of Lancaster, LA14YQ, UK
Monitoring in Ingleborough Show Cave (N. Yorkshire, UK) reveals the influence of tourism and cave management techniques on different parameters of the cave atmosphere. Exploratory aerosol monitoring identified a 0.015 ± 0.03 mg/m³ (≈70%) reduction in airborne particulates within the f irst 75 meters of cave passage and two major aerosol sources within this artificially ventilated show cave. Autogenic aerosol production was identified close to active stream ways (increases of <0.012 mg/m³), suggesting the expulsion of water-borne aerosols during turbulent water flow. The presence of tourist groups also increased aerosol concentrations within the cave (increases of <0.021 mg/m³), either by transporting them from an allogenic source or through the disturbance of particles which had previously been deposited within the cave environment. Exploratory aerosol data is presented alongside more routine analytical monitoring, helping to contextualise the impact of cave management strategies on natural cave atmospherics.
aerosol; cave; tourism; temperature; carbon dioxide; ventilation
Received 31 August 2012; Revised 19 November 2012; Accepted 19 November 2012
Smith A.C., Wynn P.M. and Barker P.A. 2013. Natural and anthropogenic factors which influence aerosol distribution in Ingleborough Show Cave, UK. International Journal of Speleology, 42 (1), 49-56. Tampa, FL (USA) ISSN 0392-6672 http://dx.doi.org/10.5038/1827-806X.42.1.6
INTRODUCTION
Understanding cave atmospherics is becoming increasingly important for the interpretation of isotopic and trace element signatures encapsulated in karstic speleothem deposits. The cave atmosphere offers an important control over speleothem chemistry, acting to modify the composite signal derived from the external atmosphere, vegetation and epikarst (McDermott 2004; Fairchild et al., 2006). Cave ventilation, carbon dioxide degassing and temperature fluctuations actively control speleothem growth dynamics and therefore dictate how and when speleothems incorporate chemical components from the hydrological system (Spötl et al., 2005; Faimon et al., 2006, 2012a; Baldini 2010).
Cave atmospherics are controlled by soil productivity, cave geometry and pressure differences between the external and cave atmospheres (Cigna 1967; Spötl et al., 2005; Baldini et al., 2006). However, caves that are open to the public may be subject to additional controls, which influence their atmospheric composition and ventilation regimes (Lario & Soler 2010). Human visitors are known to change the carbon dioxide
composition and temperature of cave air over short temporal scales (Baker & Genty, 1998; Faimon et al., 2006, 2012b; Liñan et al., 2008; Dominguez-Villar et al., 2010; Benavente et al., 2011). A less well defined impact of cave tourism is the possible introduction of foreign atmospheric particulates into the cave environment (Kertész et al., 1999). For example some studies have attributed speleothem discolouration to an increase in fossil fuel derived particulates, transported into cave systems by visitors (Jeong et al., 2003; Chang et al., 2008). Other studies have investigated natural and anthropogenic transport mechanisms which lead to the dispersal of biological aerosols, especially important for cave managers when combating unwanted plant growth (Mulec et al., 2012). Despite these studies, comparatively little attention has been focused upon either natural or anthropogenic introduction of atmospheric particulates in the size fraction 0.1 -10 µm (referred to in this study as aerosols). As scientific interest in speleothem chemistry increases, understanding the role of the cave atmosphere in transporting and depositing aerosols is becoming more important (Fairchild et al., 2010; Dredge et al., 2012 in review).
Abstract:
Keywords:
Citation:
50 Smith, Wynn and Barker
International Journal of Speleology, 42 (1), 49-56. Tampa, FL (USA) January 2013
Here, we undertake an exploratory assessment of aerosol presence within a cave environment by measuring aerosol concentrations, and logging their distribution throughout Ingleborough Show Cave. This study aims to categorise sources of aerosols within the cave environment and identify zones of maximum and minimum aerosol concentration. Aerosol monitoring is incorporated into a larger scale characterisation of show cave atmospherics during the peak tourist season (June to October 2009).
SITE DESCRIPTION
Ingleborough Cave (54°8’N, 2°22’W and 270 m.a.s.l.) (Fig. 1) is situated 2 km outside the village of Clapham, Yorkshire and functions as a resurgence for the Gaping Gill system (Gascoyne et al., 1983). The cave is developed in 100-200 m thick, well jointed Carboniferous Limestones with a North-West dip of 1-4° (Sweeting, 1950; Waltham, 1970). Whilst little is known about the chemical records encapsulated within the speleothems from this system, the first 500 m of passages (total length 17 km) is open to public access as a show cave, providing an excellent opportunity to assess the impact of cave tourism on natural underground atmospheric conditions. Cave modifications include a concrete path from 0 – 500 m depth into the cave for ease of access, whilst timer operated lighting is used to minimise unwanted vegetation growth within the cave.
To reduce the concentrations of potentially harmful radon gas within the cave system a fan has been installed at the cave entrance, pumping external air into the cave throughout the tourist day (09:00-17:00). Inward air movement of up to 1.8 m/s was recorded next to the fan using a Kestrel 4500 airflow monitor, (range 0.6 - 40 m/s, error 0.1 m/s and an accuracy of ±3 ‰), in contrast to the natural “summer season” exhalation of cave air recorded at speeds of 1.4 m/s at ground level when the fan is switched off. Fan operation occurs whenever people are in the cave system, predominately the height of the summer tourist season but also during weekend winter tourist visits and staff activities. This fan is designed to effectively ventilate the entirety of the
show cave, reducing radon build up and ensuring a safe working environment for cave guides, who may enter the cave hundreds of times every year (Hayland, 1995). Studies have indicated that Ingleborough Cave has relatively low radon levels (annual average 610 Bq/m³; summer average 1140 Bq/m³) in comparison with adjacent caving locations (Hayland, 1995). The introduction of this fan however, alters natural cave atmospherics. Here we assume that three discrete atmospheric scenarios occur within the cave. The term background is used to distinguish relatively stable atmospheric conditions (either naturally occurring or as a result of fan operation) from more dynamic atmospheric conditions driven by tourism.
1) Natural atmospherics, occurring whilst the cave is not open for tourism and the fan is not operating.
2) Fan induced background atmospherics, occurring whilst the fan is on but visitors and staff are not present within the system.
3) A combination of fan activity and tourists within the cave system.
This study measures changes in cave air temperature, pCO2 and aerosol concentration at different spatial and temporal scales to assess these three atmospheric regimes.
METHODS
Monitoring was undertaken from June - October 2009 with repeat surveys of aerosol concentration in February 2011. Cave monitoring characterised atmospheric properties before, during and after tourist visits, with the aim of identifying the magnitude and duration of atmospheric changes within the show cave. Tourist group numbers fluctuated between 4 and 40 individuals.
Large spatial scale atmospheric monitoring was undertaken either by continuous in-situ logging or by the formation of cave transects. In-situ logging was undertaken if several logging devices were available for monitoring (limited to temperature data). Transects are comprised of data obtained at a number of pre-identified locations from the entrance to end of the show cave (identified in Table 1 and Fig. 1) when only one logging device was available.
TemperatureCave air temperature was continuously logged at
different cave locations throughout June, July and August, using 4 inter-calibrated Tiny-Tag Plus2 loggers. These loggers have an operational range between -40 and +85 °C, limit of detection of 0.01 °C, measurement uncertainty of ±0.02 °C and are waterproof to 15 m making them ideal for operating in high humidity cave environments. Sampling intervals were set between 1 second and 3 minutes.
Carbon DioxideCave atmospheric CO2 concentration was measured
in parts per million (ppm) using a Vaisala GM70 monitor and GMP221 probe with measurement uncertainty of ±2 % and operational range of 0 – 10,000 ppm. The wide operational range and high
100m
Bedrock depth Forest Plantation
(5) Stal Gallery (10) 1st bells(8) Waterfall (12) End cave(3) Old Cave
Horizontal Scale
0m 100m
(2) Cave entrance door and fan
0m(1) External
(11) Long Gallery
(7) Abyss
(4) Eldon Hall (6) Hall
Pillar(9) Oxbow
Fig. 1. Location of Ingleborough Cave and cave survey. Survey adapted from the original created by Taylor & Hodgson, Land Surveyors of Lancaster (1838).
51Aerosol distribution and cave atmospherics within a British show cave
International Journal of Speleology, 42 (1), 49-56. Tampa, FL (USA) January 2013
stability (±5 % over 2 years) of this handheld device makes it an ideal piece of equipment to operate both during transects and in situ logging scenarios.
AerosolsAerosol quantities were measured using a Sidepak-
AM510 aerosol pump and extension tube. The AM510 has an operating range of 0.001 - 20 mg/m³ and a limit of detection of 0.001 mg/m³, ideal for logging very low aerosol concentrations found within cave environments. The AM510 was used with an impactor head of 10 microns sampling aerosol fractions between 0.1 and 10 µm, pump rate of 1.2 l/min and measurement uncertainty of 0.001 mg/m3. Monitoring was restricted to short intervals due to the high relative humidity nature of cave environments and the unknown impact this may have on the previously untested AM510 pump.
Aerosol monitoring focused upon establishing 1) the decay of aerosol quantities with increasing distance from the cave entrance, 2) the transport of aerosols by tourists and 3) sites of aerosol production within the cave.
RESULTS
Natural background atmosphericsNatural cave atmospherics were continuously
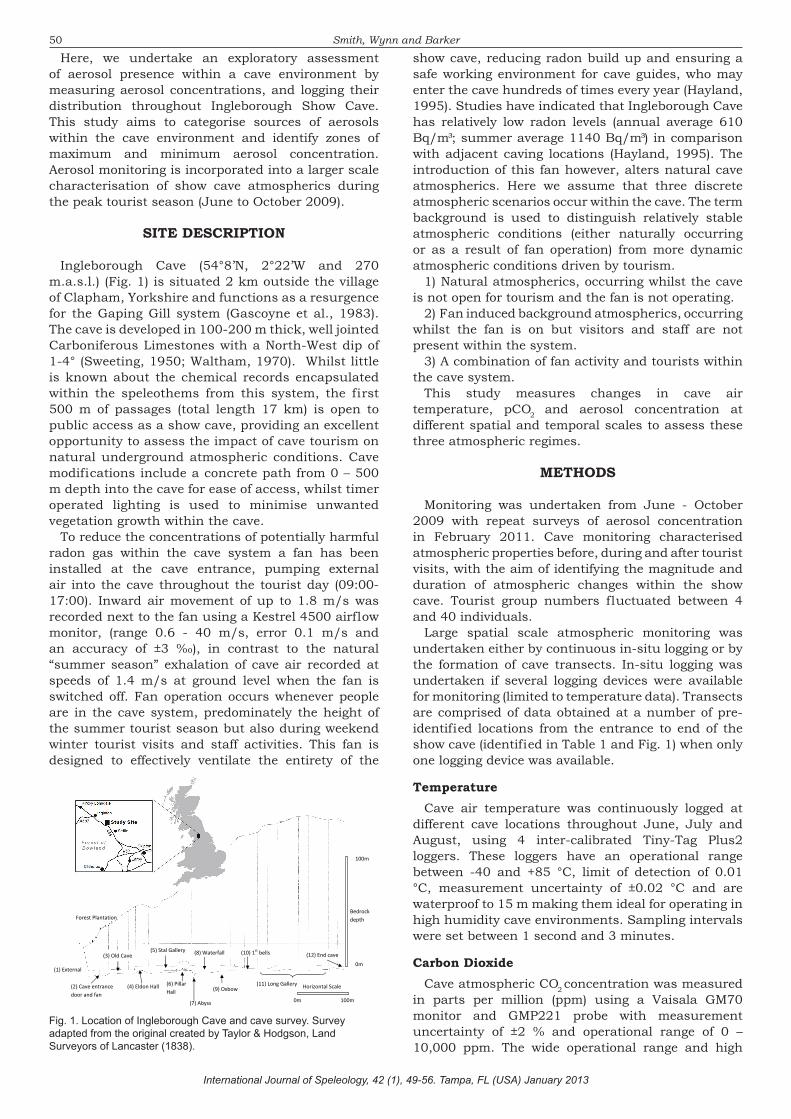
logged during overnight periods when monitoring was unaffected by human activity or fan operation. Temperatures reduce with distance into the system from 10.06 °C inside the entrance to 9.18 °C at the end of the show cave (Table 1, data recorded between June and August 2009). The amplitude of recorded temperatures also decreases with distance into the cave, from 0.35 °C in the cave entrance to 0.07 °C at the end of the show cave. The observed reduction in temperature range with distance demonstrates the diminishing influence of the external environment on the cave microclimate.
Carbon dioxide concentrations are highest during periods when the show cave is closed and the fan is
not in operation. Two continuous logging overnight studies, taken exactly 1 month apart (17-18th June and 17-18th July) in Eldon Hall (100 m into the cave system) exhibit CO2 increases occurring immediately after the fan is switched off (Fig. 2). The July study represents the most extreme CO2 concentrations measured in Ingleborough with overnight values in excess of 3500 ppm (2200 ppm higher than transect maximums) (Fig. 2). Overnight CO2 values during both studies show a distinctive CO2 ‘pulse’, which gradually returns to what may be described as a ‘natural background minimum’.
The high natural background level in July is immediately disrupted once the fan is switched on, with an extremely rapid reduction in CO2 concentration. This rapid readjustment due to fan operation would not have been expected in June as natural background levels already approximate those induced by the fan.
Fan induced background atmosphericsThe largest control that the fan exerted over
the monitored cave atmospherics is its control of carbon dioxide concentration, demonstrated in a
Location Depth into cave
system (m)
Average Temperature (°C) CO2 (ppm) Average Aerosol concentration (mg/m-3)
Fan on (range) 09:00-17:00
Fan off (range) 17:00-09:00
Fan On Fan Off July 09 (range) Feb 11 (range)
(1) External 0 13.13(1.50) 12.33 (1.68) Atmospheric ≈ 380 0.018 (0.010) 0.022 (0.043)
2) Cave Entrance -5 10.20 (0.40) 10.06 (0.35) 380 380 0.009 (0.004) 0.012 (0.073)
(3) Old Cave -25 - - 400 380 0.004 (0.007) 0.013 (0.042)
(4) Eldon Hall -60 10.23 9.55 410 980 0.002 (0.004) 0.007 (0.019)
5) Stal Gallery -100 - - 410 1280 0.001 (0.002) 0.005 (0.028)
(6) Pillar Hall -180 0.003 (0.004) 0.006 (0.015)
7) Abyss -200 9.31 (0.08) 9.30 (0.049) 420 1300 0.015 (0.026) 0.013 (0.015)
(8) Waterfall -250 0.010 (0.065)
(9) Oxbow -320 0 0.004 (0.036)
10) 1st bells -350 0.001 (0.059)
(11) Long Gallery -400 9.27 9.20 490 1240 0 0.003 (0.037)
(12) End Cave -500 9.20 (0.16) 9.18 (0.065) 520 1190 0 0.003 (0.019)
Table 1: Site number and names correspond to Fig. 1. Cave air temperature data was collected by continuous logging, whilst CO2 and aerosol data was obtained during discrete cave transects, all data was collected between June and August 2009, unless stated. Where appropriate, measurement ranges are presented and data is related to fan operation. The range refers to the amplitude of data fluctuation around the presented average value.
0
100
200
300
400
500
600
700
800
0
500
1000
1500
2000
2500
3000
3500
4000
13:00 18:00 23:00 04:00 09:00
CO2Co
ncen
tration Ju
ne (p
pm)
CO2Co
ncen
tration July (p
pm)
Time
Overnight CO2 maximums June July
Natural background minimum
Radon fan offat ≈17:00
Radon fan induced background level
Fig. 2. Continuous logging of carbon dioxide concentrations (5 min log) from Eldon Hall, between the 17th and 18th of June (Blue Diamonds) and 17th and 18th of July (Gray Diamonds). CO2 increases are observed as the tourist day finishes (≈17:00), values reach a natural peak, eventually recovering to natural background minimum values. The influence of the fan can be observed at 09:00 in July, forcing a rapid reduction in CO2 concentrations.
52
International Journal of Speleology, 42 (1), 1-8. Tampa, FL (USA) January 2013
Smith, Wynn and Barker
transect undertaken on the 4th of June (10:00) with a three minuet logging period (Table 1). Fan induced background carbon dioxide levels remain stable and low during cave opening times, especially close to the cave entrance (380-410 ppm). When the fan is operating, maximum carbon dioxide levels rise to 520 ppm at 500 m depth into the cave, exhibiting a gradual, but relatively minor increase of approximately 120 ppm from the entrance to the end of the show cave (Table 1).
Data presented in Table 1 shows average cave air temperatures recorded at hourly intervals during two monitoring periods. The first between 4th-17th of June (loggers sited in Eldon Hall and Long Gallery), the second from 15th July-18th August (loggers sited at the cave entrance, Abyss, cave end and external to the entrance). A rapid stabilisation of temperatures is observed between 60 m (Eldon Hall) and 200 m (Abyss) into the cave.
Aerosol concentration transects were taken exclusively during cave opening hours on the 14th of July 2009 and 28th of February 2011, with the fan in operation. Aerosol measurements therefore incorporate not only naturally produced cave aerosols but also any aerosols derived from artificial ventilation, reflecting a maximum value that may be expected within the cave system.
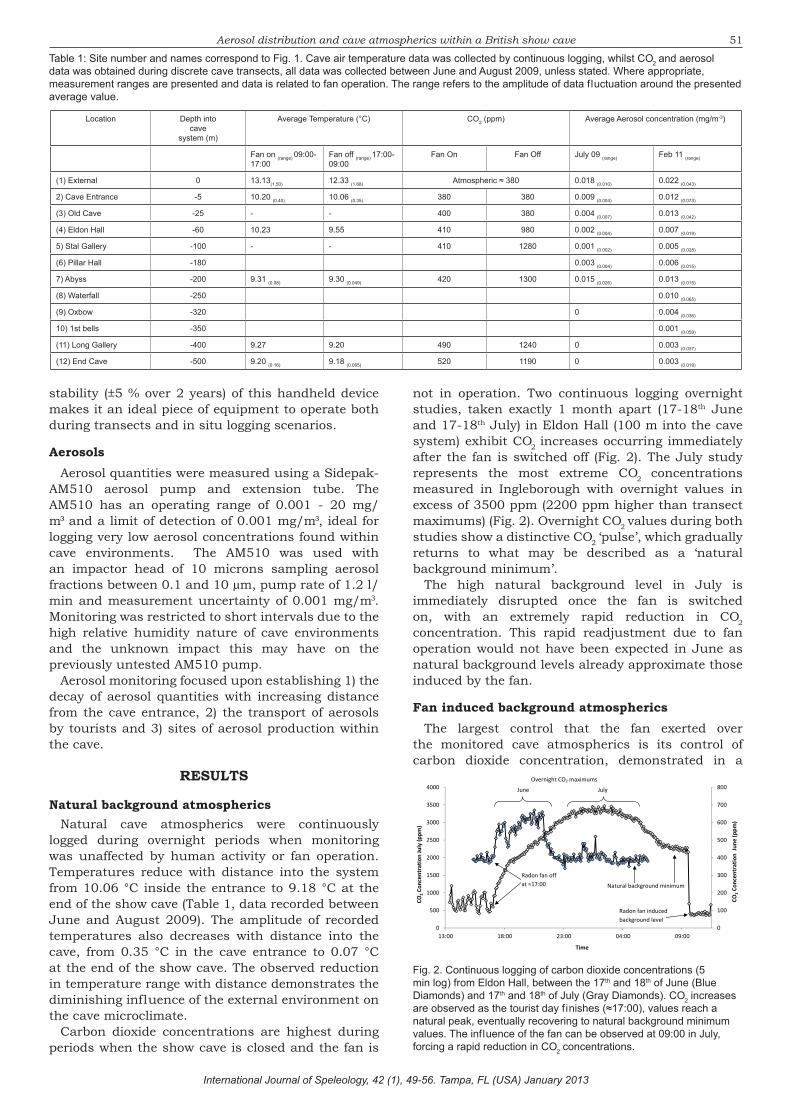
External atmospheric aerosol concentrations had an average value of 0.018 – 0.022 mg/m3. With increasing distance into the cave, aerosol concentrations decreased to average readings of ≈0.003 - 0 mg/m3 at 500 m (Fig. 3). Aerosol concentrations decrease with distance from the entrance, such that by 75 m into the cave, aerosol levels reach values similar to those measured at 500 m depth (Table 1 and Fig. 3). The reduction in aerosol concentration was observed during 2 separate transects, both incorporating the same 12 monitoring sites but occurring 1.5 years apart and under different seasonal conditions.
The measured reduction of total aerosol concentration reverses at the Abyss; this region of the cave has the only active waterfalls close to the tourist path. The active stream continues close to the path between the Abyss and the second waterfall, both marked in Fig. 3 and 4. Aerosol concentrations in this section increased
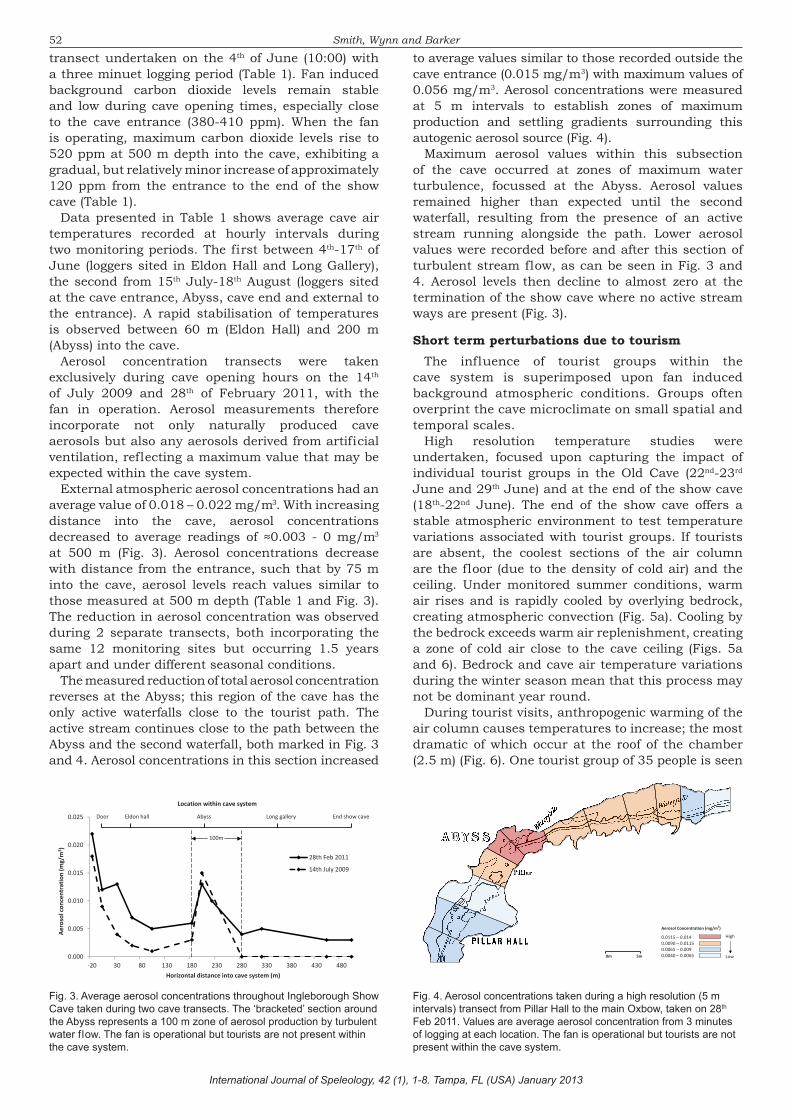
to average values similar to those recorded outside the cave entrance (0.015 mg/m3) with maximum values of 0.056 mg/m3. Aerosol concentrations were measured at 5 m intervals to establish zones of maximum production and settling gradients surrounding this autogenic aerosol source (Fig. 4).
Maximum aerosol values within this subsection of the cave occurred at zones of maximum water turbulence, focussed at the Abyss. Aerosol values remained higher than expected until the second waterfall, resulting from the presence of an active stream running alongside the path. Lower aerosol values were recorded before and after this section of turbulent stream flow, as can be seen in Fig. 3 and 4. Aerosol levels then decline to almost zero at the termination of the show cave where no active stream ways are present (Fig. 3).
Short term perturbations due to tourismThe influence of tourist groups within the
cave system is superimposed upon fan induced background atmospheric conditions. Groups often overprint the cave microclimate on small spatial and temporal scales.
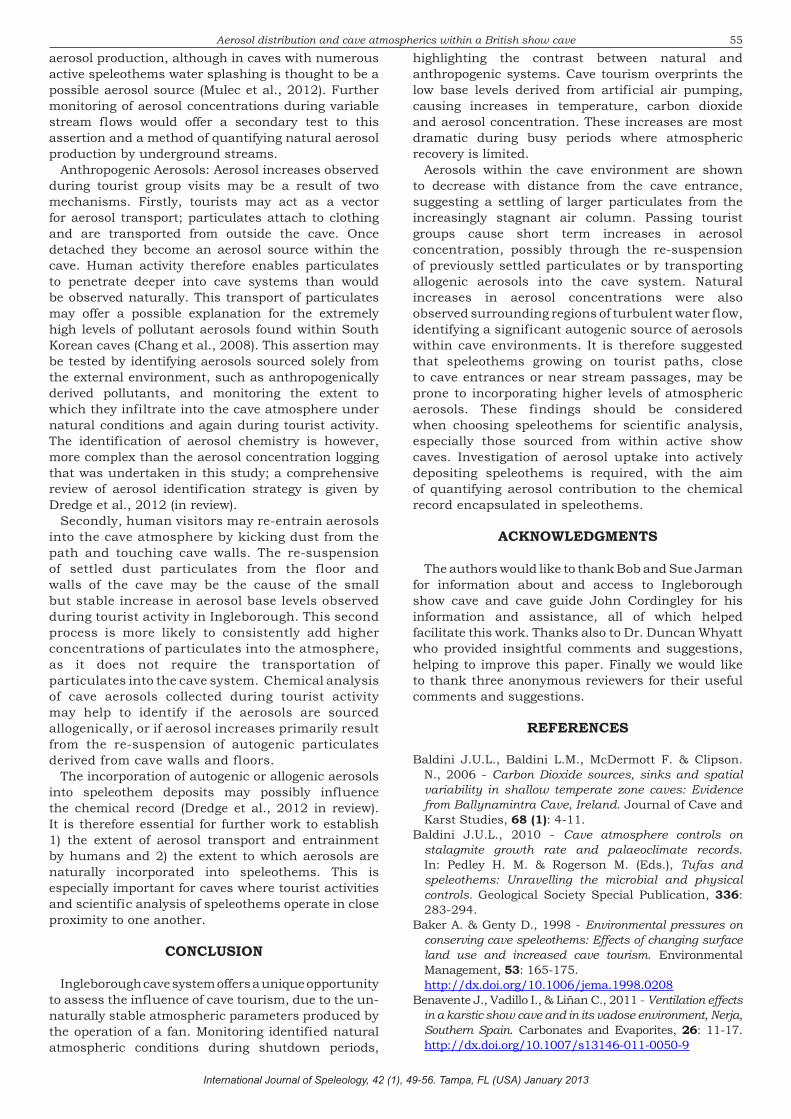
High resolution temperature studies were undertaken, focused upon capturing the impact of individual tourist groups in the Old Cave (22nd-23rd June and 29th June) and at the end of the show cave (18th-22nd June). The end of the show cave offers a stable atmospheric environment to test temperature variations associated with tourist groups. If tourists are absent, the coolest sections of the air column are the floor (due to the density of cold air) and the ceiling. Under monitored summer conditions, warm air rises and is rapidly cooled by overlying bedrock, creating atmospheric convection (Fig. 5a). Cooling by the bedrock exceeds warm air replenishment, creating a zone of cold air close to the cave ceiling (Figs. 5a and 6). Bedrock and cave air temperature variations during the winter season mean that this process may not be dominant year round.
During tourist visits, anthropogenic warming of the air column causes temperatures to increase; the most dramatic of which occur at the roof of the chamber (2.5 m) (Fig. 6). One tourist group of 35 people is seen
Location within cave system
0.000
0.005
0.010
0.015
0.020
0.025
‐20 30 80 130 180 230 280 330 380 430 480
(m
g/m
)
Horizontal distance into cave system (m)
Door Eldon hall Abyss Long gallery End show cave
100m
3
28th Feb 2011
14th July 2009 concen
tration
Aerosol
Fig. 3. Average aerosol concentrations throughout Ingleborough Show Cave taken during two cave transects. The ‘bracketed’ section around the Abyss represents a 100 m zone of aerosol production by turbulent water flow. The fan is operational but tourists are not present within the cave system.
Fig. 4. Aerosol concentrations taken during a high resolution (5 m intervals) transect from Pillar Hall to the main Oxbow, taken on 28th Feb 2011. Values are average aerosol concentration from 3 minutes of logging at each location. The fan is operational but tourists are not present within the cave system.
Low
High
Aerosol Concentration (mg/m‐3)
0.0115 – 0.014 0.0090 – 0.0115 0.0065 – 0.009 0.0040 – 0.0065
Aerosol Concentration (mg/m3)
0m 5m
53Aerosol distribution and cave atmospherics within a British show cave
International Journal of Speleology, 42 (1), 49-56. Tampa, FL (USA) January 2013
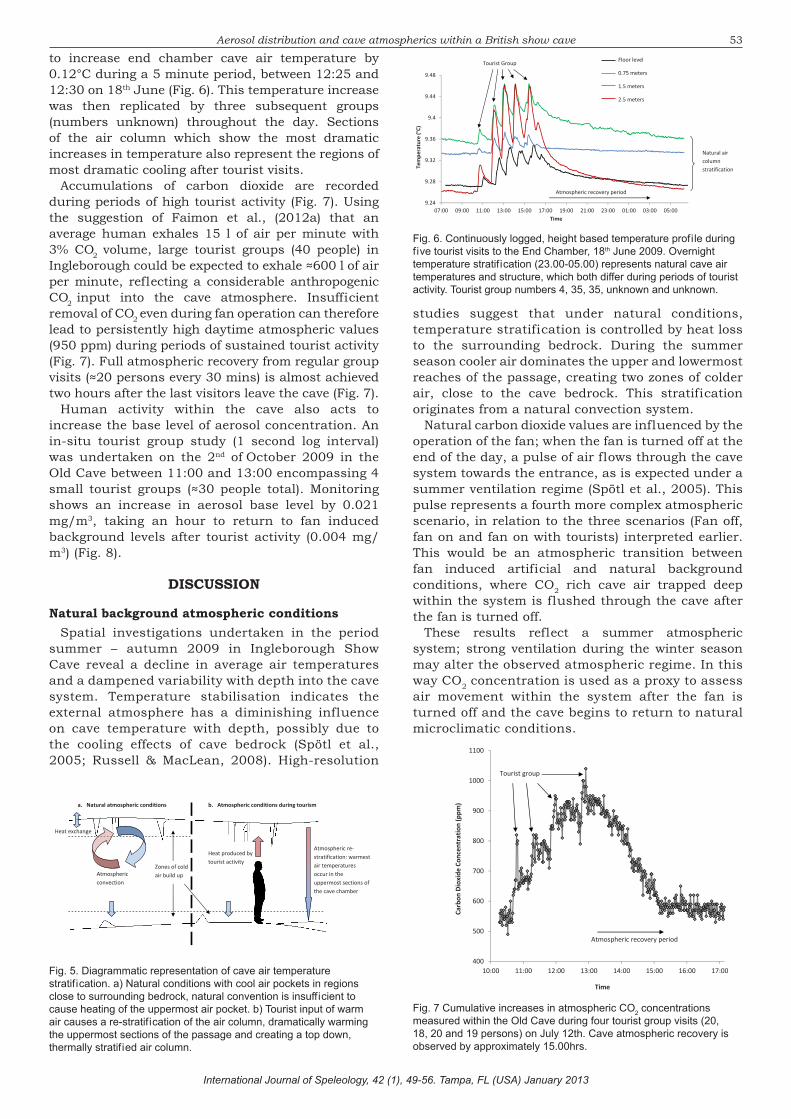
to increase end chamber cave air temperature by 0.12°C during a 5 minute period, between 12:25 and 12:30 on 18th June (Fig. 6). This temperature increase was then replicated by three subsequent groups (numbers unknown) throughout the day. Sections of the air column which show the most dramatic increases in temperature also represent the regions of most dramatic cooling after tourist visits.
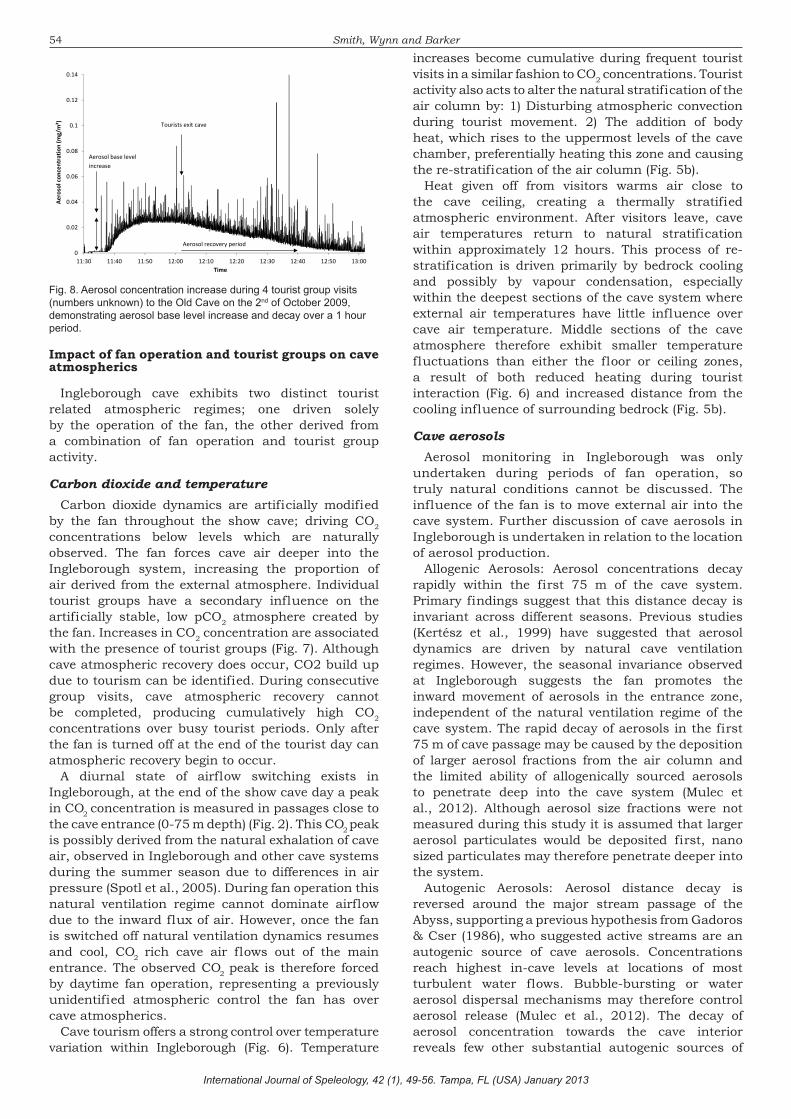
Accumulations of carbon dioxide are recorded during periods of high tourist activity (Fig. 7). Using the suggestion of Faimon et al., (2012a) that an average human exhales 15 l of air per minute with 3% CO2 volume, large tourist groups (40 people) in Ingleborough could be expected to exhale ≈600 l of air per minute, reflecting a considerable anthropogenic CO2 input into the cave atmosphere. Insufficient removal of CO2 even during fan operation can therefore lead to persistently high daytime atmospheric values (950 ppm) during periods of sustained tourist activity (Fig. 7). Full atmospheric recovery from regular group visits (≈20 persons every 30 mins) is almost achieved two hours after the last visitors leave the cave (Fig. 7).
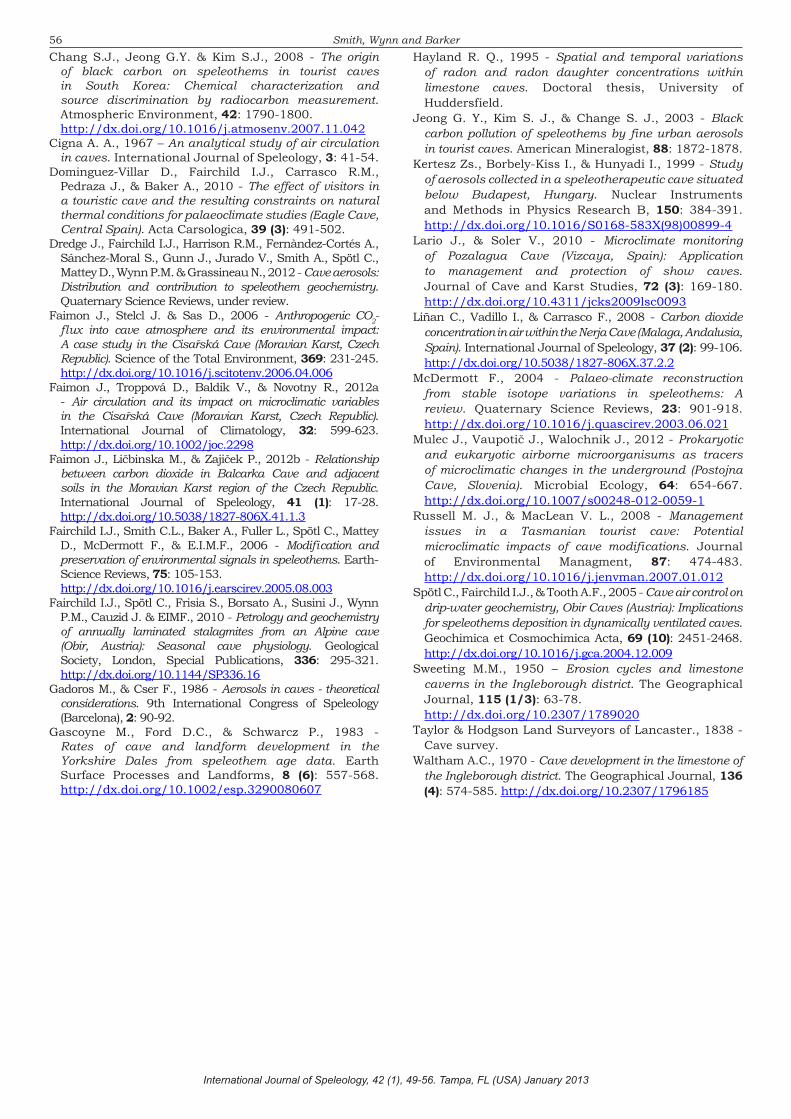
Human activity within the cave also acts to increase the base level of aerosol concentration. An in-situ tourist group study (1 second log interval) was undertaken on the 2nd of October 2009 in the Old Cave between 11:00 and 13:00 encompassing 4 small tourist groups (≈30 people total). Monitoring shows an increase in aerosol base level by 0.021 mg/m3, taking an hour to return to fan induced background levels after tourist activity (0.004 mg/m3) (Fig. 8).
DISCUSSION
Natural background atmospheric conditionsSpatial investigations undertaken in the period
summer – autumn 2009 in Ingleborough Show Cave reveal a decline in average air temperatures and a dampened variability with depth into the cave system. Temperature stabilisation indicates the external atmosphere has a diminishing influence on cave temperature with depth, possibly due to the cooling effects of cave bedrock (Spötl et al., 2005; Russell & MacLean, 2008). High-resolution
studies suggest that under natural conditions, temperature stratification is controlled by heat loss to the surrounding bedrock. During the summer season cooler air dominates the upper and lowermost reaches of the passage, creating two zones of colder air, close to the cave bedrock. This stratification originates from a natural convection system.
Natural carbon dioxide values are influenced by the operation of the fan; when the fan is turned off at the end of the day, a pulse of air flows through the cave system towards the entrance, as is expected under a summer ventilation regime (Spötl et al., 2005). This pulse represents a fourth more complex atmospheric scenario, in relation to the three scenarios (Fan off, fan on and fan on with tourists) interpreted earlier. This would be an atmospheric transition between fan induced artificial and natural background conditions, where CO2 rich cave air trapped deep within the system is flushed through the cave after the fan is turned off.
These results reflect a summer atmospheric system; strong ventilation during the winter season may alter the observed atmospheric regime. In this way CO2 concentration is used as a proxy to assess air movement within the system after the fan is turned off and the cave begins to return to natural microclimatic conditions.
Atmospheric re‐stratification: warmest air temperatures occur in the uppermost sections of the cave chamber
Heat produced by tourist activity
Atmospheric convection
Heat exchange
Zones of cold air build up
b. Atmospheric conditions during tourisma. Natural atmospheric conditions
Fig. 5. Diagrammatic representation of cave air temperature stratification. a) Natural conditions with cool air pockets in regions close to surrounding bedrock, natural convention is insufficient to cause heating of the uppermost air pocket. b) Tourist input of warm air causes a re-stratification of the air column, dramatically warming the uppermost sections of the passage and creating a top down, thermally stratified air column.
Fig. 6. Continuously logged, height based temperature profile during five tourist visits to the End Chamber, 18th June 2009. Overnight temperature stratification (23.00-05.00) represents natural cave air temperatures and structure, which both differ during periods of tourist activity. Tourist group numbers 4, 35, 35, unknown and unknown.
9.2
9.28
9.32
9.3
9.4
9.4
9.48
07:00 09:00 11:00 13:00 15:00 17:00 19:00 21:00 23:00 01:00 03:00 05:00
Tempe
rature (°C)
Time
Atmospheric recovery period
Tourist Group Floor level
0.75 meters
1.5 meters
2.5 meters
4
6
Natural air column stratification
4
Fig. 7 Cumulative increases in atmospheric CO2 concentrations measured within the Old Cave during four tourist group visits (20, 18, 20 and 19 persons) on July 12th. Cave atmospheric recovery is observed by approximately 15.00hrs.
400
500
600
700
800
900
1000
1100
10:00 11:00 12:00 13:00 14:00 15:00 16:00 17:00
Carbon
Dioxide
Con
centration
(ppm
)
Time
Tourist group
Atmospheric recovery period
54 Smith, Wynn and Barker
International Journal of Speleology, 42 (1), 49-56. Tampa, FL (USA) January 2013
Impact of fan operation and tourist groups on cave atmospherics
Ingleborough cave exhibits two distinct tourist related atmospheric regimes; one driven solely by the operation of the fan, the other derived from a combination of fan operation and tourist group activity.
Carbon dioxide and temperatureCarbon dioxide dynamics are artificially modified
by the fan throughout the show cave; driving CO2 concentrations below levels which are naturally observed. The fan forces cave air deeper into the Ingleborough system, increasing the proportion of air derived from the external atmosphere. Individual tourist groups have a secondary influence on the artificially stable, low pCO2 atmosphere created by the fan. Increases in CO2 concentration are associated with the presence of tourist groups (Fig. 7). Although cave atmospheric recovery does occur, CO2 build up due to tourism can be identified. During consecutive group visits, cave atmospheric recovery cannot be completed, producing cumulatively high CO2 concentrations over busy tourist periods. Only after the fan is turned off at the end of the tourist day can atmospheric recovery begin to occur.
A diurnal state of airflow switching exists in Ingleborough, at the end of the show cave day a peak in CO2 concentration is measured in passages close to the cave entrance (0-75 m depth) (Fig. 2). This CO2 peak is possibly derived from the natural exhalation of cave air, observed in Ingleborough and other cave systems during the summer season due to differences in air pressure (Spotl et al., 2005). During fan operation this natural ventilation regime cannot dominate airflow due to the inward flux of air. However, once the fan is switched off natural ventilation dynamics resumes and cool, CO2 rich cave air flows out of the main entrance. The observed CO2 peak is therefore forced by daytime fan operation, representing a previously unidentified atmospheric control the fan has over cave atmospherics.
Cave tourism offers a strong control over temperature variation within Ingleborough (Fig. 6). Temperature
increases become cumulative during frequent tourist visits in a similar fashion to CO2 concentrations. Tourist activity also acts to alter the natural stratification of the air column by: 1) Disturbing atmospheric convection during tourist movement. 2) The addition of body heat, which rises to the uppermost levels of the cave chamber, preferentially heating this zone and causing the re-stratification of the air column (Fig. 5b).
Heat given off from visitors warms air close to the cave ceiling, creating a thermally stratified atmospheric environment. After visitors leave, cave air temperatures return to natural stratification within approximately 12 hours. This process of re-stratification is driven primarily by bedrock cooling and possibly by vapour condensation, especially within the deepest sections of the cave system where external air temperatures have little influence over cave air temperature. Middle sections of the cave atmosphere therefore exhibit smaller temperature fluctuations than either the floor or ceiling zones, a result of both reduced heating during tourist interaction (Fig. 6) and increased distance from the cooling influence of surrounding bedrock (Fig. 5b).
Cave aerosols Aerosol monitoring in Ingleborough was only
undertaken during periods of fan operation, so truly natural conditions cannot be discussed. The influence of the fan is to move external air into the cave system. Further discussion of cave aerosols in Ingleborough is undertaken in relation to the location of aerosol production.
Allogenic Aerosols: Aerosol concentrations decay rapidly within the first 75 m of the cave system. Primary findings suggest that this distance decay is invariant across different seasons. Previous studies (Kertész et al., 1999) have suggested that aerosol dynamics are driven by natural cave ventilation regimes. However, the seasonal invariance observed at Ingleborough suggests the fan promotes the inward movement of aerosols in the entrance zone, independent of the natural ventilation regime of the cave system. The rapid decay of aerosols in the first 75 m of cave passage may be caused by the deposition of larger aerosol fractions from the air column and the limited ability of allogenically sourced aerosols to penetrate deep into the cave system (Mulec et al., 2012). Although aerosol size fractions were not measured during this study it is assumed that larger aerosol particulates would be deposited first, nano sized particulates may therefore penetrate deeper into the system.
Autogenic Aerosols: Aerosol distance decay is reversed around the major stream passage of the Abyss, supporting a previous hypothesis from Gadoros & Cser (1986), who suggested active streams are an autogenic source of cave aerosols. Concentrations reach highest in-cave levels at locations of most turbulent water flows. Bubble-bursting or water aerosol dispersal mechanisms may therefore control aerosol release (Mulec et al., 2012). The decay of aerosol concentration towards the cave interior reveals few other substantial autogenic sources of
0
0.02
0.04
0.06
0.08
0.1
0.12
0.14
11:30 11:40 11:50 12:00 12:10 12:20 12:30 12:40 12:50 13:00
Aerosol con
centration
(mg/m³)
Time
Aerosol base level increase
Tourists exit cave
Aerosol recovery period
Fig. 8. Aerosol concentration increase during 4 tourist group visits (numbers unknown) to the Old Cave on the 2nd of October 2009, demonstrating aerosol base level increase and decay over a 1 hour period.
55Aerosol distribution and cave atmospherics within a British show cave
International Journal of Speleology, 42 (1), 49-56. Tampa, FL (USA) January 2013
aerosol production, although in caves with numerous active speleothems water splashing is thought to be a possible aerosol source (Mulec et al., 2012). Further monitoring of aerosol concentrations during variable stream flows would offer a secondary test to this assertion and a method of quantifying natural aerosol production by underground streams.
Anthropogenic Aerosols: Aerosol increases observed during tourist group visits may be a result of two mechanisms. Firstly, tourists may act as a vector for aerosol transport; particulates attach to clothing and are transported from outside the cave. Once detached they become an aerosol source within the cave. Human activity therefore enables particulates to penetrate deeper into cave systems than would be observed naturally. This transport of particulates may offer a possible explanation for the extremely high levels of pollutant aerosols found within South Korean caves (Chang et al., 2008). This assertion may be tested by identifying aerosols sourced solely from the external environment, such as anthropogenically derived pollutants, and monitoring the extent to which they infiltrate into the cave atmosphere under natural conditions and again during tourist activity. The identification of aerosol chemistry is however, more complex than the aerosol concentration logging that was undertaken in this study; a comprehensive review of aerosol identification strategy is given by Dredge et al., 2012 (in review).
Secondly, human visitors may re-entrain aerosols into the cave atmosphere by kicking dust from the path and touching cave walls. The re-suspension of settled dust particulates from the floor and walls of the cave may be the cause of the small but stable increase in aerosol base levels observed during tourist activity in Ingleborough. This second process is more likely to consistently add higher concentrations of particulates into the atmosphere, as it does not require the transportation of particulates into the cave system. Chemical analysis of cave aerosols collected during tourist activity may help to identify if the aerosols are sourced allogenically, or if aerosol increases primarily result from the re-suspension of autogenic particulates derived from cave walls and floors.
The incorporation of autogenic or allogenic aerosols into speleothem deposits may possibly influence the chemical record (Dredge et al., 2012 in review). It is therefore essential for further work to establish 1) the extent of aerosol transport and entrainment by humans and 2) the extent to which aerosols are naturally incorporated into speleothems. This is especially important for caves where tourist activities and scientific analysis of speleothems operate in close proximity to one another.
CONCLUSION
Ingleborough cave system offers a unique opportunity to assess the influence of cave tourism, due to the un-naturally stable atmospheric parameters produced by the operation of a fan. Monitoring identified natural atmospheric conditions during shutdown periods,
highlighting the contrast between natural and anthropogenic systems. Cave tourism overprints the low base levels derived from artificial air pumping, causing increases in temperature, carbon dioxide and aerosol concentration. These increases are most dramatic during busy periods where atmospheric recovery is limited.
Aerosols within the cave environment are shown to decrease with distance from the cave entrance, suggesting a settling of larger particulates from the increasingly stagnant air column. Passing tourist groups cause short term increases in aerosol concentration, possibly through the re-suspension of previously settled particulates or by transporting allogenic aerosols into the cave system. Natural increases in aerosol concentrations were also observed surrounding regions of turbulent water flow, identifying a significant autogenic source of aerosols within cave environments. It is therefore suggested that speleothems growing on tourist paths, close to cave entrances or near stream passages, may be prone to incorporating higher levels of atmospheric aerosols. These findings should be considered when choosing speleothems for scientific analysis, especially those sourced from within active show caves. Investigation of aerosol uptake into actively depositing speleothems is required, with the aim of quantifying aerosol contribution to the chemical record encapsulated in speleothems.
ACKNOWLEDGMENTS
The authors would like to thank Bob and Sue Jarman for information about and access to Ingleborough show cave and cave guide John Cordingley for his information and assistance, all of which helped facilitate this work. Thanks also to Dr. Duncan Whyatt who provided insightful comments and suggestions, helping to improve this paper. Finally we would like to thank three anonymous reviewers for their useful comments and suggestions.
REFERENCES
Baldini J.U.L., Baldini L.M., McDermott F. & Clipson. N., 2006 - Carbon Dioxide sources, sinks and spatial variability in shallow temperate zone caves: Evidence from Ballynamintra Cave, Ireland. Journal of Cave and Karst Studies, 68 (1): 4-11.
Baldini J.U.L., 2010 - Cave atmosphere controls on stalagmite growth rate and palaeoclimate records. In: Pedley H. M. & Rogerson M. (Eds.), Tufas and speleothems: Unravelling the microbial and physical controls. Geological Society Special Publication, 336: 283-294.
Baker A. & Genty D., 1998 - Environmental pressures on conserving cave speleothems: Effects of changing surface land use and increased cave tourism. Environmental Management, 53: 165-175. http://dx.doi.org/10.1006/jema.1998.0208
Benavente J., Vadillo I., & Liñan C., 2011 - Ventilation effects in a karstic show cave and in its vadose environment, Nerja, Southern Spain. Carbonates and Evaporites, 26: 11-17. http://dx.doi.org/10.1007/s13146-011-0050-9
56 Smith, Wynn and Barker
International Journal of Speleology, 42 (1), 49-56. Tampa, FL (USA) January 2013
Chang S.J., Jeong G.Y. & Kim S.J., 2008 - The origin of black carbon on speleothems in tourist caves in South Korea: Chemical characterization and source discrimination by radiocarbon measurement. Atmospheric Environment, 42: 1790-1800. http://dx.doi.org/10.1016/j.atmosenv.2007.11.042
Cigna A. A., 1967 – An analytical study of air circulation in caves. International Journal of Speleology, 3: 41-54.
Dominguez-Villar D., Fairchild I.J., Carrasco R.M., Pedraza J., & Baker A., 2010 - The effect of visitors in a touristic cave and the resulting constraints on natural thermal conditions for palaeoclimate studies (Eagle Cave, Central Spain). Acta Carsologica, 39 (3): 491-502.
Dredge J., Fairchild I.J., Harrison R.M., Fernàndez-Cortés A., Sánchez-Moral S., Gunn J., Jurado V., Smith A., Spötl C., Mattey D., Wynn P.M. & Grassineau N., 2012 - Cave aerosols: Distribution and contribution to speleothem geochemistry. Quaternary Science Reviews, under review.
Faimon J., Stelcl J. & Sas D., 2006 - Anthropogenic CO2-flux into cave atmosphere and its environmental impact: A case study in the Cisařská Cave (Moravian Karst, Czech Republic). Science of the Total Environment, 369: 231-245. http://dx.doi.org/10.1016/j.scitotenv.2006.04.006
Faimon J., Troppová D., Baldik V., & Novotny R., 2012a - Air circulation and its impact on microclimatic variables in the Cisařská Cave (Moravian Karst, Czech Republic). International Journal of Climatology, 32: 599-623. http://dx.doi.org/10.1002/joc.2298
Faimon J., Ličbinska M., & Zajiček P., 2012b - Relationship between carbon dioxide in Balcarka Cave and adjacent soils in the Moravian Karst region of the Czech Republic. International Journal of Speleology, 41 (1): 17-28. http://dx.doi.org/10.5038/1827-806X.41.1.3
Fairchild I.J., Smith C.L., Baker A., Fuller L., Spötl C., Mattey D., McDermott F., & E.I.M.F., 2006 - Modification and preservation of environmental signals in speleothems. Earth-Science Reviews, 75: 105-153. http://dx.doi.org/10.1016/j.earscirev.2005.08.003
Fairchild I.J., Spötl C., Frisia S., Borsato A., Susini J., Wynn P.M., Cauzid J. & EIMF., 2010 - Petrology and geochemistry of annually laminated stalagmites from an Alpine cave (Obir, Austria): Seasonal cave physiology. Geological Society, London, Special Publications, 336: 295-321. http://dx.doi.org/10.1144/SP336.16
Gadoros M., & Cser F., 1986 - Aerosols in caves - theoretical considerations. 9th International Congress of Speleology (Barcelona), 2: 90-92.
Gascoyne M., Ford D.C., & Schwarcz P., 1983 - Rates of cave and landform development in the Yorkshire Dales from speleothem age data. Earth Surface Processes and Landforms, 8 (6): 557-568. http://dx.doi.org/10.1002/esp.3290080607
Hayland R. Q., 1995 - Spatial and temporal variations of radon and radon daughter concentrations within limestone caves. Doctoral thesis, University of Huddersf ield.
Jeong G. Y., Kim S. J., & Change S. J., 2003 - Black carbon pollution of speleothems by fine urban aerosols in tourist caves. American Mineralogist, 88: 1872-1878.
Kertesz Zs., Borbely-Kiss I., & Hunyadi I., 1999 - Study of aerosols collected in a speleotherapeutic cave situated below Budapest, Hungary. Nuclear Instruments and Methods in Physics Research B, 150: 384-391. http://dx.doi.org/10.1016/S0168-583X(98)00899-4
Lario J., & Soler V., 2010 - Microclimate monitoring of Pozalagua Cave (Vizcaya, Spain): Application to management and protection of show caves. Journal of Cave and Karst Studies, 72 (3): 169-180. http://dx.doi.org/10.4311/jcks2009lsc0093
Liñan C., Vadillo I., & Carrasco F., 2008 - Carbon dioxide concentration in air within the Nerja Cave (Malaga, Andalusia, Spain). International Journal of Speleology, 37 (2): 99-106. http://dx.doi.org/10.5038/1827-806X.37.2.2
McDermott F., 2004 - Palaeo-climate reconstruction from stable isotope variations in speleothems: A review. Quaternary Science Reviews, 23: 901-918. http://dx.doi.org/10.1016/j.quascirev.2003.06.021
Mulec J., Vaupotič J., Walochnik J., 2012 - Prokaryotic and eukaryotic airborne microorganisums as tracers of microclimatic changes in the underground (Postojna Cave, Slovenia). Microbial Ecology, 64: 654-667. http://dx.doi.org/10.1007/s00248-012-0059-1
Russell M. J., & MacLean V. L., 2008 - Management issues in a Tasmanian tourist cave: Potential microclimatic impacts of cave modifications. Journal of Environmental Managment, 87: 474-483. http://dx.doi.org/10.1016/j.jenvman.2007.01.012
Spötl C., Fairchild I.J., & Tooth A.F., 2005 - Cave air control on drip-water geochemistry, Obir Caves (Austria): Implications for speleothems deposition in dynamically ventilated caves. Geochimica et Cosmochimica Acta, 69 (10): 2451-2468. http://dx.doi.org/10.1016/j.gca.2004.12.009
Sweeting M.M., 1950 – Erosion cycles and limestone caverns in the Ingleborough district. The Geographical Journal, 115 (1/3): 63-78. http://dx.doi.org/10.2307/1789020
Taylor & Hodgson Land Surveyors of Lancaster., 1838 - Cave survey.
Waltham A.C., 1970 - Cave development in the limestone of the Ingleborough district. The Geographical Journal, 136 (4): 574-585. http://dx.doi.org/10.2307/1796185