Embed Size (px)
Citation preview

BioOne sees sustainable scholarly publishing as an inherently collaborative enterprise connecting authors, nonprofit publishers, academic institutions, researchlibraries, and research funders in the common goal of maximizing access to critical research.
Natural abundances of stable isotopes trace anthropogenic N and C in an urbanstreamAuthor(s): Amber J. Ulseth and Anne E. HersheySource: Journal of the North American Benthological Society, 24(2):270-289. 2005.Published By: The Society for Freshwater ScienceDOI: http://dx.doi.org/10.1899/03-080.1URL: http://www.bioone.org/doi/full/10.1899/03-080.1
BioOne (www.bioone.org) is a nonprofit, online aggregation of core research in the biological, ecological, andenvironmental sciences. BioOne provides a sustainable online platform for over 170 journals and books publishedby nonprofit societies, associations, museums, institutions, and presses.
Your use of this PDF, the BioOne Web site, and all posted and associated content indicates your acceptance ofBioOne’s Terms of Use, available at www.bioone.org/page/terms_of_use.
Usage of BioOne content is strictly limited to personal, educational, and non-commercial use. Commercial inquiriesor rights and permissions requests should be directed to the individual publisher as copyright holder.

270
J. N. Am. Benthol. Soc., 2005, 24(2):270–289q 2005 by The North American Benthological Society
Natural abundances of stable isotopes trace anthropogenic N and C inan urban stream
AMBER J. ULSETH1 AND ANNE E. HERSHEY2
Biology Department, University of North Carolina Greensboro, Greensboro, North Carolina 27402 USA
Abstract. Important ecological services of low-order streams are greatly affected by urbaniza-tion. North Buffalo Creek, in the headwaters of the Cape Fear River basin in Greensboro, NorthCarolina, receives point- and nonpoint-source pollutants. Natural abundances of the stable isotopesof C (13C) and N (15N) were used to determine the influence of anthropogenic nutrients on sestond15N, nutrient concentrations, C/N ratios, and patterns of d13C and d15N in foodweb componentsin North Buffalo Creek during different hydrological conditions. Baseflow seston d15N varied sig-nificantly among sampling sites. Baseflow seston d15N ranged from 3.7‰ to 4.6‰ at forested sitesand was slightly enriched at open sites, and probably reflected nonpoint sources of N in NorthBuffalo Creek. Seston d15N also reflected point sources of N in North Buffalo Creek. The mostenriched seston d15N values (8.4‰) were found directly downstream of the Waste Water TreatmentPlant (WWTP). Seston d15N values at the Rankin Mill Road (Rankin) site, several km downstreamof the WWTP, also were strongly influenced by effluent from the WWTP. The Summit Avenue site(Summit) received textile effluent until June 2001. Before June 2001, seston 15N at Summit wasdepleted compared to seston 15N at sites upstream of the plant, probably because the textile effluentwas depleted in 15N. During storms, seston d15N was negatively correlated with nutrient concen-trations upstream of the WWTP. However, at Rankin Mill Road, seston d15N was positively corre-lated with NO3
2 flux, which explained 54% of the variation in seston d15N. d15N was not correlatedwith NH4
1 and PO423 fluxes at Rankin Mill Road. During storms, seston d15N was influenced
partially by nonpoint sources of N, a pattern consistent with observed C/N ratios. d13C values formost foodweb components and d15N values for all foodweb components varied significantly be-tween sites, suggesting that sources of C and N differed among sites. Foodweb components atRankin were enriched in 15N from incorporation of sewage-derived N from the WWTP effluent,whereas, prior to June 2001, foodweb components at Summit appeared to be depleted in 15N fromincorporation of textile effluent. Thus, specific influences of point sources of N could be distin-guished in foodweb components. Nonpoint sources and stormwater influenced seston d15N duringstorm events, but these sources could not be distinguished in consumers by using natural abun-dances of stable isotopes.
Key words: urban streams, d15N, d13C, wastewater, storm events, food webs, anthropogenic nutri-ents, C/N ratio.
Low-order streams are at risk of disturbancefrom urban landuse practices (Resh et al. 1988,Meyer and Wallace 2001, Peterson et al. 2001).This risk is a significant concern because low-order streams are spatially and functionally im-portant in watersheds, they constitute moststream miles (Hynes 1975), and they serve assites of N processing and retention (Meyer et al.1988, Meyer 1997, Peterson et al. 2001). Disrup-tion of the nutrient dynamics of low-orderstreams may have downstream repercussions in
1 Present address: Department of Ecology and Evo-lutionary Biology, Corson Hall, Cornell University, Ith-aca, New York 14853-2701 USA.E-mail: [email protected]
2 To whom correspondence should be addressed.E-mail: [email protected]
rivers, lakes, and estuaries, where water-qualityproblems are often very serious (Vitousek et al.1997).
Streams are often nutrient-limited, and addi-tion of nutrients may alter stream communitystructure (Dodds and Welch 2000). Urbanizationof watersheds increases delivery of all forms ofN from impervious surfaces (Characklis et al.1979, Soranno et al. 1996, Corbett et al. 1997,Albanese and Matlack 1998), lawn-fertilizer run-off (Wahl et al. 1997, Carpenter et al. 1998), petwaste (NCDENR 2004), construction sites (Car-penter et al. 1998), nutrients in precipitation (Sil-va et al. 2002), stormwater runoff (Silva et al.2002), leakage or overflow of wastewater sewers(Seager and Abrahams 1990, City of GreensboroStorm Water Services 2000), and sewage effluent

2005] 271STABLE ISOTOPES TRACE URBAN STREAM POLLUTANTS
(e.g., Hershey et al. 2004). For example, Wahl etal. (1997) found 113 more NOX-N loading intoa stream from an urbanized watershed thaninto a stream from a forested watershed. In-creased delivery of P from sewage effluent andrunoff of construction-derived sediment also isa problem in urban watersheds (Carpenter et al.1998, Paul and Meyer 2001).
Stable isotopes of N have been used success-fully to detect anthropogenic N in aquatic sys-tems. Different pools of N can be identified andtraced because they have distinct 15N/14N ratios(Peterson and Fry 1987, McClelland et al. 1997,Robinson 2001). Natural abundances of 15N havebeen used to trace wastewater influence in aqui-fers (Kreitler and Browning 1983, Aravena et al.1993) and in marine (Rau et al. 1981, Valiela etal. 1992, Van Dover et al. 1992, McClelland andValiela 1998a, b), lotic (Wayland and Hobson2001, deBruyn and Rasmussen 2002), and lentic(Hansson et al. 1997) systems. Natural abun-dances of 15N also have been used to trace Nfertilizer in streams (Kohl et al. 1971) and ani-mal wastes in groundwater (Karr et al. 2001,2002). Differing isotopic signatures in aquaticsystems can be caused by a number of differentdisturbances and, therefore, may be useful forevaluating how these disturbances have alteredecosystem processes and pathways of materialthrough the system (Peterson 1999).
Stable isotopes also are useful tools for food-web analysis. d15N can be used to determine tro-phic positions of foodweb components (Peter-son and Fry 1987, Fry 1991, Robinson 2001) be-cause d15N of each trophic level is typically ;3to 5‰ higher than its source of N (Minigawaand Wada 1984, Peterson and Fry 1987, Fry1991, Robinson 2001). 15N-tracer experiments(Mulholland et al. 2000) and the natural abun-dance of 15N (e.g., Richey et al. 1975, Mathisenet al. 1988, Kline et al. 1990) have been usedsuccessfully in studies of trophic interactions.d13C also can be used to trace C pathways infood webs because the d13C of each componentof a food web is 0‰ to 1‰ higher than itssource of C (DeNiro and Epstein 1978, Rounickand Winterbourn 1986, Peterson and Fry 1987,Michener and Schell 1994, McCutchan et al.2003).
Seston is an important component of streamsystems. Seston is a food source for filter-feed-ing organisms (Cummins 1974), plays a role innutrient processing (Wallace et al. 1991), and is
a major pathway of organic matter transportand export throughout the watershed (Wallaceand Grubaugh 1996). Seston is derived from avariety of sources, including terrestrial organicmatter, autochthonous production, and fecal andanimal detritus (Cummins 1974). Thus, sestond15N should integrate the 15N signature of sev-eral sources of N, including anthropogenicsources.
The 1st objective of our study was to deter-mine if the natural abundance of seston 15Ncould be used to detect anthropogenic sourcesof N in an urban stream. Two questions wereof particular interest: 1) How does seston d15Nchange as seston moves through a city, i.e., up-stream to downstream and through areas of dif-ferent land use? 2) How does seston d15N fluc-tuate with discharge (i.e., during storms)? Wehypothesized that d15N of seston would reflectd15N of anthropogenic point sources of N andcould be used as a tool to identify those sources.We also expected seston d15N signatures to re-flect d15N signatures of anthropogenic, nonpointsources of N, but that it might be difficult todetermine the sources given the complexity andnumber of anthropogenic nonpoint inputs in ur-ban streams (Duda et al. 1982). Nutrient con-centrations tend to reflect point sources at base-flow conditions and nonpoint sources duringstorms (Carpenter et al. 1998). Therefore, we hy-pothesized that the d15N signature of the sestonwould fluctuate with discharge. To test these hy-potheses, we examined nutrient concentrationsand the d15N signature of the seston along atransect of changing land use during base flow,and during ascending and descending limbs ofthe stream hydrograph.
The 2nd objective of our study was to deter-mine which foodweb components of an urbanstream assimilated anthropogenic sources of Nand to determine how foodweb dynamics dif-fered among sites. We hypothesized that an-thropogenic inputs would alter the flow of en-ergy and nutrients through the food web andcause foodweb components from different sitesto reflect the C and N signatures of the anthro-pogenic sources. To test this hypothesis, we ex-amined changes in, and distribution of, stableisotopes of N and C in the food web of an urbanstream at sites that differed in point and non-point sources of pollution.
272 [Volume 24A. J. ULSETH AND A. E. HERSHEY
FIG. 1. Sampling sites on North Buffalo Creek, Greensboro, North Carolina. WWTP 5 Waste Water Treat-ment Plant, USGS 5 US Geological Survey.
TABLE 1. Daily mean and maximum discharge at 3US Geological Survey gages along the North BuffaloCreek transect during sampling events.
Gage locationMean discharge
(m3/s)Maximum dis-charge (m3/s)
WestoverChurchRankin
0.670.891.97
3.594.739.40
Methods
Site description
Our research was conducted in a 4th-ordersection of North Buffalo Creek in Greensboro,North Carolina. Greensboro is a growing citywith a population of 224,000. The city spans 296km2 and is located in the originating headwatersof the Cape Fear River Basin. North BuffaloCreek is a typical urban stream. It was recog-nized as impaired in the Cape Fear BasinwideWater Quality Management Plan (NCDENR2000) based on instream habitat degradation,impaired biological communities, and the pres-ence of fecal coliform bacteria.
Nine sampling sites, distributed along thelength of the stream (Fig. 1), were chosen basedon land use adjacent to the stream. Average dis-charge during sampling ranged from 0.67 m3/sto 1.97 m3/s at the 3 US Geological Survey
(USGS) staging gages along the stream (Table1). Site 1, the most upstream site on the streamtransect was Hamilton Lakes Park (Hamilton),a headwater tributary of North Buffalo Creek.This site was in a residential area and had amixed conifer–hardwood riparian zone. Hamil-ton was considered the most pristine site, rela-tive to other sites, because the channel mean-dered, large woody debris was present, and theriparian vegetation consisted of intact forest.However, the watershed above Hamilton wasentirely within an upper-middle-class residen-tial area in the City of Greensboro. Thus, thesite received stormwater runoff, which couldhave been contaminated with lawn fertilizer, petwaste, and other materials. Contamination fromleaky sanitary sewer pipes also may have beenpresent. Hamilton was not sampled during dryperiods of the year because of no or low flow.Site 2, Golf Course, was downstream from a golfcourse. The site had little shading from riparianvegetation. Sites 3 and 4, Battleground and La-tham, were along Greensboro’s greenway parksystem, which follows a power-line corridor.These sites were maintained by regular mow-ing, had few trees, and were often subject to fullsun. Site 5, Fairview, was in an industrial sectionof Greensboro, 3.39 stream km downstream ofLatham. This site was downstream of a sectionof stream that ran under a building, and it wasupstream of Cone Mills textile plant. This site

2005] 273STABLE ISOTOPES TRACE URBAN STREAM POLLUTANTS
FIG. 2. Sample hydrographic data from the US Geological Survey staging gage located at Rankin Mill Roadoutside Greensboro, North Carolina. Arrows indicate possible sampling times during baseflow, and ascendingand descending portions of the hydrograph.
had some shade, but part of the site was adja-cent to a baseball field, so sections of the streamwere subject to full sun. Site 6, Summit Avenue(Summit), was just downstream of Fairview andCone Mills textile plant. This site was forested.The Waste Water Treatment Plant (WWTP) was;1.48 stream km downstream of Summit. Sites7 and 8 were immediately upstream and down-stream, respectively, of the WWTP. Samples atthese sites were taken directly upstream anddownstream of the WWTP from the facilitybridges, which were 0.58 stream km apart.WWTP effluent also was sampled. Site 9, Ran-kin Mill Road (Rankin), was ;5.94 stream kmdownstream from the WWTP, and a distinctodor of WWTP effluent was present. Except fora landfill immediately downstream of theWWTP, the stream was forested between theWWTP and Rankin.
Influence of Cone Mills textile effluent on Summit
Until June 2001, Summit received industrialeffluent from Cone Mills textile plant. The pres-ence of industrial discharge was apparent as fardownstream as the WWTP (WWTP personnel,North Buffalo Creek WWTP, personal commu-nication) because the effluent often containeddye that colored the streamwater. Cone Millswas cited repeatedly for violating effluent tox-icity limits (NCDENR 2000) until it was con-nected to a WWTP facility in June 2001. Datacollected from Summit before June 2001 are pre-sented separately in our study. Data collected
from Summit after June 2001, are presented aspart of the stream transect through the city.
Seston stable isotope and nutrient sampling
Seston was sampled during baseflow (definedas no rain for 72 h prior to sampling) (8 dates),and the ascending (5 dates) and descending (5dates) limbs of the stream hydrograph (Fig. 2)during rainfall from October 2000 to June 2002.Baseflow samples were collected from all 9 sitesso that variation among seasons and sites couldbe analyzed. Sites 7 and 8 (upstream and down-stream of the WWTP) were not sampled on as-cending or descending limbs of the hydrographbecause it was difficult to sample at the WWTPon short notice.
Water for seston samples was collected in 4-Lcubitainers, returned to the lab, and filteredonto precombusted glass-fiber filters (GelmanSciences, Ann Arbor, Michigan). The filters weredried at 508C for $48 h, and the seston wasscraped from the filter with a stainless steelblade for stable isotope analysis.
Nutrient samples were collected concurrentlywith seston sampling. NO3
2 (Cd-reductionmethod), NH4
1 (sodium salicylate and dichloroisocyanuric method), and PO4
23 (ascorbic acidmethod) concentrations (APHA 1989) weremeasured using a Bran1Luebee TRAACS 2000autoanalyzer. Nutrient flux (mg/s) was calcu-lated from discharge (L/s) and nutrient concen-tration (mg/L). Discharge was calculated usingdata from the 3 USGS gages located on Westov-

274 [Volume 24A. J. ULSETH AND A. E. HERSHEY
er Terrace, Church Street, and Rankin Mill Road(Rankin sampling site) along North BuffaloCreek. Distances of USGS gages and samplingsites from the headwater (Hamilton) were de-termined by digitizing images of North BuffaloCreek from 7.5-min series USGS topographicmaps (1:24,000; Greensboro and McCleansvillequadrangles, Guilford County, North Carolina).Daily average discharge from each gage andstream distance from the headwater were fit toa regression model to estimate discharge foreach sampling site and date for those sites lo-cated between USGS gages (Ulseth 2003). Nu-trient flux was calculated for each sampling dateby multiplying discharge by concentration foreach nutrient species at each site.
Foodweb sampling
Sampling was done approximately every 2mo from June 2001 to June 2002 during base-flow. Hamilton, Latham, Fairview, Summit, andRankin (Fig. 1) were selected for foodweb sam-pling on the basis of land use adjacent to thesite or because the site was known to receiveurban point-source discharges. Key componentsof the food web sampled for d13C and d15N anal-yses included seston, algae, moss, conditionedleaves, hydropsychid caddisflies, 2 crayfish spe-cies (Cambarus hobbsorum and Procambarus acu-tus), and Asian clams (Corbicula fluminea). Sestonwas expected to be formed from a combinationof sources, especially leaf detritus and algae(e.g., Allan 1995) (see below). Therefore, algae,moss, and conditioned leaves were collectedfrom several patches within a site to providecomposite samples that would be as represen-tative as possible of source materials of sestonfor the stream food web. These samples werechecked for macroinvertebrates, which were re-moved before the samples were rinsed with de-ionized (DI) water and immediately dried. Hy-dropsychid caddisflies and Asian clams werekept in filtered stream water for 24 h to allowgut contents to clear before the animals wereprepared for isotope analysis. Asian clams wereremoved from their shells prior to preparation.Crayfish were frozen (2158C) as soon as theywere brought in from the field; the tail musclewas dissected later and prepared for isotopeanalysis.
Stable isotope analyses
All samples for d13C and d15N analyses weredried at 508C for $48 h. Samples were homog-enized, weighed, and placed in 4- 3 6-mm tincapsules. Several samples were checked for thepresence of carbonates by looking for bubblesfollowing the addition of a drop of 10% HCl.No bubbles were seen, so samples were notacidified. Macroinvertebrate samples consistedof ;1 to 7 individuals to ensure enough drymass for isotope analysis.
Stable isotopes of C and N were analyzed us-ing a Thermo-Finnigan DELTA-plus AdvantageMass Spectrometer coupled to a Carlo–ErbaNC2100 Elemental Analyzer (EA) at the Colo-rado Plateau Stable Isotope Lab (Northern Ari-zona University, Flagstaff, Arizona). Ratios of13C/12C and 15N/14N were expressed relative toknown standards (VPDB and atmospheric N, re-spectively) in per mil (‰) notation (e.g.,d13Csample 5 [(13C/12Csample)/(13C/12Cstandard)2 1] 31000). Sample data were normalized using 4 In-ternational Atomic Energy Association (IAEA)reference standards (CH6, CH7, N1, and N2).An internal laboratory standard (National Insti-tute of Standards and Technology, NIST 1547—peach leaves) was run every 10 samples. Mea-surement errors (1 SD) on the laboratory stan-dard were ;0.05‰ (d13C) and ;0.11‰ (d15N).The laboratory reported measurement error onduplicate samples as ;0.15‰ (d13C) and;0.19‰ (d15N). Duplicates of field samples werenot analyzed because of this high level of pre-cision and because internal laboratory standardswere used.
C/N ratios
C/N ratios were determined from the %Cand %N data obtained as part of the stable iso-tope analyses for all foodweb components.Many of the samples were scraped from filters,so absolute %C and %N values may not havebeen accurate, but the C/N ratios should nothave been affected. C/N ratios were used to as-sist in interpretation of foodweb sources.
Statistical analyses
All statistical analyses were run using JMP IN4.0 (SAS Institute, Cary, North Carolina), and alldata sets were examined for normality and

2005] 275STABLE ISOTOPES TRACE URBAN STREAM POLLUTANTS
transformed as needed using either log10(x),loge(x), or x2 prior to analyses. Statistical signif-icance of all tests was judged at p , 0.05. Anal-ysis of variance (ANOVA) was used to evaluatethe effect of sampling date on baseflow sestond15N. Baseflow seston d15N did not differ sea-sonally (see Results). Therefore, sampling dateswere used as replicates in two 1-way ANOVAsto evaluate the effects of site and flow conditionon seston d15N. Sites 7 and 8 were excluded fromthe analysis of the effect of flow condition onseston d15N values because no samples were tak-en at these 2 sites during storms. After exclusionof these sites, remaining samples were catego-rized as base, ascending, and descendingstream-flow conditions, and 1-way ANOVA wasused to evaluate the effect of flow condition onseston d15N (G. Kissling, Department of Mathe-matical Sciences, University of North CarolinaGreensboro, personal communication).
One-way ANOVAs were used to evaluate theeffects of flow condition on nutrient concentra-tions in the stream water. Sites 7 and 8 wereexcluded from the analysis (see above), and nu-trient data from Rankin were analyzed sepa-rately because of elevated nutrient concentra-tions from the influence of WWTP effluent. Re-gressions were used to determine the relation-ships between seston d15N and flux of NO3
2,NH4
1, and PO423.
Multivariate ANOVA (MANOVA) was used toevaluate the effects of season on d15N and d13Cin foodweb components. No seasonal patternswere detected (see Results), so sampling dateswere used as replicates (Ulseth 2003) in a MAN-OVA to evaluate the effects of site and isotopespecies on changes in baseflow enrichment val-ues of the foodweb components. No clams andonly one caddisfly were found at Hamilton;therefore, Hamilton was excluded from compar-isons among sites for these 2 foodweb compo-nents. MANOVA was done to reduce the chanceof making a type I error while determiningwhether enrichment values for d13C and d15N infoodweb components differed among sites. IfMANOVA results for a foodweb component in-dicated that enrichment values differed depend-ing on isotope species, then separate 1-way AN-OVAs (1 for each isotope) were used to identifydifferences in d15N or d13C values among sites.
Separate 2-way ANOVAs were used to eval-uate the effects of site and date on the C/N ra-tios of each foodweb component. Replication
was not sufficient to permit analysis of interac-tions between components. Separate 1-way AN-OVAs were used to evaluate the effect of flowcondition on C/N ratios of foodweb compo-nents at combined sites upstream of the WWTPand at Rankin.
Results
Seston d15N and nutrient concentrations
Baseflow seston d15N did not differ with re-spect to sampling date (ANOVA, p 5 0.62, d15N5 5.6 6 0.4 in autumn, 4.5 6 0.8 in spring, 5.26 0.3 in summer, 4.9 6 0.7 in winter). Baseflowseston d15N values differed significantly amongsampling sites (Fig. 3). Seston d15N values werelowest at Hamilton and highest at site 8, directlydownstream of the WWTP. Seston d15N valuesat site 8 were significantly more enriched thanall of the sites upstream of the WWTP (Tukey–Kramer Honestly Significant Difference [TKHSD]). Seston d15N at Rankin was significantlymore enriched than seston d15N at Hamilton,Golf Course, Fairview, Summit, and upstream ofthe WWTP (TK HSD). Seston d15N values dif-fered significantly among flow conditions (Table2). Seston d15N values did not differ between as-cending and descending conditions, but valueswere significantly more depleted under ascend-ing and descending conditions than duringbaseflow (TK HSD).
Nutrient concentrations differed significantlyamong flow conditions. NO3
2, NH41, and PO4
23
concentrations at sites upstream of the WWTPwere significantly lower during baseflow thanduring ascending and descending conditions(Fig. 4), but concentrations did not differ be-tween ascending and descending conditions(TK HSD). Nutrient concentrations at Rankindid not differ significantly among flow condi-tions (Fig. 5), although NO3
2 and PO423 concen-
trations appeared higher during baseflow thanduring ascending and descending conditions,and NH4
1 concentrations appeared lower dur-ing baseflow than during ascending and de-scending conditions (Fig. 5). Overall, responsesof nutrients to flow conditions at Rankin werenot similar to responses of nutrients at sites up-stream of the WWTP.
Seston d15N at sites above the WWTP was di-luted as nutrient flux increased (Table 3). Sestond15N upstream of the WWTP was significantly

276 [Volume 24A. J. ULSETH AND A. E. HERSHEY
FIG. 3. Box plots of seston d15N for samples taken during baseflow at sites on North Buffalo Creek fromOctober 2000 to April 2002. Plots show medians (horizontal bars), interquartile ranges (rectangles), and ranges(vertical bars extending from rectangles). Means with the same letters are not significantly different. Arrowindicates upstream–downstream direction. Upstream 5 upstream of Waste Water Treatment Plant (WWTP),Downstream 5 downstream of WWTP.
TABLE 2. Mean (11 SE) seston d15N across all sitesduring baseflow, and ascending and descending por-tions of the hydrograph. * indicates values signifi-cantly different from baseflow (p ,0.05).
Condition n d15N SE
BaseflowAscendingDescending
432925
4.993.50*4.07*
0.240.400.21
and negatively correlated with ln(NH41), NO3
2,and ln(PO4
23) (Table 3), and changes in thesenutrient fluxes explained 22%, 27%, and 16%,respectively, of the variation in d15N at sitesabove the plant (Table 3). At Rankin, 6 km belowthe plant, d15N was not significantly correlatedwith ln(NH4
1) or ln(PO423), but d15N increased
with increasing ln(NO32) (R2 5 0.54; Table 3).
Site and seasonal variation in d13C and d15N offoodweb components
d13C and d15N did not differ among seasonsfor any component (Table 4), but did differamong sites for all foodweb components except
Procambarus (see below). A significant interac-tion between isotope and site for algae, leaves,moss, and seston indicated that the relationshipbetween d13C and d15N was not consistentamong sites for these foodweb components. Thenonsignificant interaction between isotope andsite for hydropsychid caddisflies, Procambarus,and clams indicated that the relationship be-tween d13C and d15N was consistent among sitesfor these foodweb components. Significant dif-ferences among sites for d13C and d15N valuesjustified analyses of the foodweb componentsby 1-way ANOVAs to determine where the var-iance occurred.
d13C varied among sites for most foodwebcomponents. d13C of algae at Rankin and Sum-mit was significantly depleted relative to d13C ofalgae at Hamilton and Latham (Fig. 6A). d13C ofalgae at Fairview did not differ significantlyfrom other sites (Fig. 6A). d13C of hydropsychidcaddisflies at Fairview and Summit was signif-icantly depleted relative to d13C of hydropsychidcaddisflies at Latham and Rankin (Fig. 6B). d13Cof Cambarus at Summit was significantly deplet-ed relative to d13C of Cambarus at Latham,Fairview, and Rankin (Fig. 6C). Cambarus at

2005] 277STABLE ISOTOPES TRACE URBAN STREAM POLLUTANTS
FIG. 4. Box plots of NO32 (A), NH4
1 (B), and PO423
(C) concentrations for samples collected during differ-ent flow conditions at sites upstream of the Waste Wa-ter Treatment Plant. Box plots as described in Fig. 3.NH4
1 data were log transformed for analyses, but un-transformed data are shown. Means with the sameletters are not significantly different.
FIG. 5. Box plots of NO32 (A), NH4
1 (B), and PO423
(C) concentrations for samples collected during differ-ent hydrograph conditions at Rankin downstream ofthe Waste Water Treatment Plant. Box plots as de-scribed in Fig. 3. NH4
1 data were log transformed foranalyses, but untransformed data are shown.
TABLE 3. Regression parameters for linear regression analyses of d15N vs nutrient flux at pooled sites upstreamand at the Rankin site downstream of the Waste Water Treatment Plant. * 5 p , 0.01, ** 5 p , 0.001, *** 5 p, 0.001.
Nutrient flux(mg/s) n Intercept d15N Slope R2
Pooled upstream sites ln(NH41)
NO32
ln(PO423)
515154
4.60***5.73***4.23**
20.24***20.37***20.25*
0.220.270.16
Rankin ln(NH41)
ln(NO32)
ln(PO423)
161717
6.31***2.92*7.42***
20.251.83**0.65
0.060.540.06
Fairview was significantly depleted in d13C com-pared to Cambarus at Latham and Rankin (Fig.6C). d13C of Procambarus did not vary signifi-cantly among sites (Fig. 6D). d13C of clams at
Rankin was significantly enriched relative tod13C of clams at Latham, Fairview, and Summit(Fig. 6E). d13C of clams at Latham was signifi-cantly enriched relative to d13C of clams at Sum-

278 [Volume 24A. J. ULSETH AND A. E. HERSHEY
TA
BL
E4.
Seas
onal
mea
n(6
SE)
d15N
and
d13C
for
each
food
web
com
pone
ntby
seas
on,a
ndre
sult
sof
mu
ltip
lean
alys
isof
vari
ance
(MA
NO
VA)
use
dto
anal
yze
isot
ope
valu
esby
seas
on.
Com
pon
ent
d15N
Aut
um
nW
inte
rSp
ring
Sum
mer
d13C
Aut
um
nW
inte
rSp
ring
Sum
mer
MA
NO
VAre
sult
s
nd
fp
Alg
ae9.
46
0.7
3.5
6.8
61.
56.
86
1.1
230
.56
1.6
233
.52
29.8
63.
12
31.7
61.
621
3,17
0.4
Hyd
rop
sych
idae
10.5
61.
510
.06
1.6
9.2
61.
18.
96
1.3
228
.56
0.9
231
.16
1.3
228
.66
1.1
228
.46
0.7
213,
170.
8C
amba
rus
9.3
60.
99.
66
0.7
9.0
60.
98.
36
0.2
226
.46
0.9
225
.36
0.3
225
.66
0.3
225
.66
0.3
443,
400.
5P
roca
mba
rus
6.6
8.4
60.
68.
46
0.4
7.8
60.
32
23.7
226
.16
0.9
225
.26
0.9
223
.96
0.3
153,
110.
3C
lam
s7.
46
0.7
8.3
60.
97.
96
0.9
6.3
61.
02
25.6
60.
92
25.4
60.
92
26.4
60.
92
26.8
60.
628
3,24
0.5
Lea
ves
2.7
61.
52.
16
0.5
2.3
60.
72.
66
0.4
228
.56
0.6
228
.66
0.6
229
.06
0.3
228
.46
0.3
273,
220.
5M
oss
10.0
62.
04.
16
1.2
7.3
62.
48.
46
1.4
233
.76
2.6
236
.76
1.6
233
.66
2.2
234
.26
2.1
223,
180.
9Se
ston
5.3
60.
44.
26
0.7
5.1
60.
95.
06
0.4
227
.46
0.8
229
.36
1.3
227
.06
0.5
226
.86
0.2
333,
290.
4
TA
BL
E5.
Mea
n(6
1SE
)C
/N
rati
osof
food
web
com
pon
ents
from
Nor
thB
uff
alo
Cre
ekby
seas
onan
dsi
te.D
ata
wer
ean
alyz
edu
sing
2-w
ayan
alys
isof
vari
ance
(AN
OVA
).W
ithi
n-co
lum
nm
eans
wit
hth
esa
me
lett
ers
are
not
sign
ifica
ntly
dif
fere
nt(T
uke
y’s
Hon
estl
ySi
gnifi
cant
Dif
fere
nces
).W
WT
P5
Was
teW
ater
Tre
atm
ent
Pla
nt,–
5fo
odw
ebco
mp
onen
tno
tan
alyz
ed.
Sest
onA
lgae
Lea
ves
Mos
sC
lam
sH
ydro
psy
chid
aeC
amba
rus
Pro
cam
baru
s
Sea
son
Spri
ngSu
mm
erA
utu
mn
Win
ter
7.8
60.
412
.86
2.0
8.6
61.
08.
76
1.0
8.8
60.
7b
7.9
60.
8ab
6.7
60.
3a
6.8ab
34.5
62.
1b
20.6
62.
2a
28.5
60.
8ab
34.5
64.
4b
9.1
61.
19.
06
0.3
7.5
60.
39.
96
0.6
4.7
60.
3a
4.7
60.
2a
4.0
60.
1b
3.8
60.
1b
5.2
60.
2a
4.4
60.
1b
4.3
60.
2b
5.1
60.
1a
3.2
60.
02ab
3.1
60.
03ab
3.1
60.
02a
3.2
60.
01b
3.1
60.
053.
26
0.08
3.1
3.1
60.
02
Sit
e Ham
ilton
Gol
fC
ours
eB
attl
egro
und
Lat
ham
Fair
view
Sum
mit
10.2
62.
47.
36
1.0
8.1
60.
98.
26
0.8
13.3
64.
615
.26
5.4
8.1
61.
8– –
7.7
60.
57.
16
0.5
7.7
60.
4
39.0
61.
6– –
29.4
65.
022
.16
3.5
27.9
62.
6
11.3
60.
5– –
8.0
60.
58.
76
0.4
8.6
60.
8
– – –4.
56
0.3
4.3
60.
24.
56
0.4
– – –4.
66
0.3
4.8
60.
35.
06
0.2
3.2
60.
04– –
3.2
60.
023.
26
0.02
3.2
60.
03
– – –3.
26
0.04
3.1
60.
053.
16
0.04
Up
stre
amW
WT
PD
owns
trea
mW
WT
PR
anki
n
14.9
63.
98.
56
1.2
10.5
62.
5
– –8.
36
0.8
– –23
.16
2.5
– –9.
36
0.5
– –4.
06
0.1
– –4.
66
0.2
– –3.
26
0.03
– – –

2005] 279STABLE ISOTOPES TRACE URBAN STREAM POLLUTANTS
FIG. 6. Box plots of d13C values for algae (A), caddisflies (B), Cambarus (C), Procambarus (D), clams (E), leaves(F), moss (G), and seston (H) from sampling sites along North Buffalo Creek. Box plots as described in Fig. 3.Sites with the same letters are not significantly different.
mit (Fig. 6E). d13C of leaves did not vary signif-icantly among sites (Fig. 6F). d13C of moss atLatham was significantly enriched relative tod13C of moss at Fairview, Summit, and Rankin.d13C of moss at Fairview was significantly de-pleted relative to d13C of moss at Hamilton (Fig.6G). d13C of seston at Rankin was significantlyenriched relative to d13C of seston at Hamilton(Fig. 6H).
d15N also varied among sites for most food-web components. d15N of algae at Rankin wassignificantly enriched relative to d15N of algae atHamilton, Fairview, and Summit (Fig. 7A). d15Nof hydropsychid caddisflies and Cambarus atRankin was significantly enriched relative tod15N of hydropsychid caddisflies and Cambarusat all other sites (Fig. 7B, C). d15N of Cambarusat Summit and Fairview was significantly en-riched relative to d15N of Cambarus at Hamilton(Fig. 7C). d15N of Procambarus did not vary sig-
nificantly among sites, but Procambarus were notcollected at Rankin or Hamilton (Fig. 7D). d15Nof clams at Rankin was significantly enrichedrelative to d15N of clams at all other sites (Fig.7E). d15N of leaves at Hamilton was significantlydepleted relative to d15N of leaves at Latham,Fairview, Summit, and Rankin (Fig. 7F). d15N ofmoss at Summit and Latham was significantlyenriched relative to d15N of moss at Hamilton(Fig. 7G). d15N of moss at Rankin was signifi-cantly enriched relative to d15N of moss at La-tham, Fairview, and Hamilton (Fig. 7G). d15N ofseston at Rankin was significantly enriched rel-ative to d15N of seston at Fairview, Summit, andHamilton, but not Latham (Fig. 7H).
d13C and d15N of foodweb components
Seston d15N signatures generally were inter-mediate between d15N signatures of leaves and

280 [Volume 24A. J. ULSETH AND A. E. HERSHEY
FIG. 7. Box plots of d15N values for algae (A), caddisflies (B), Cambarus (C), Procambarus (D), clams (E), leaves(F), moss (G), and seston (H) from sampling sites along North Buffalo Creek. Box plots as described in Fig. 3.Sites with the same letters are not significantly different.
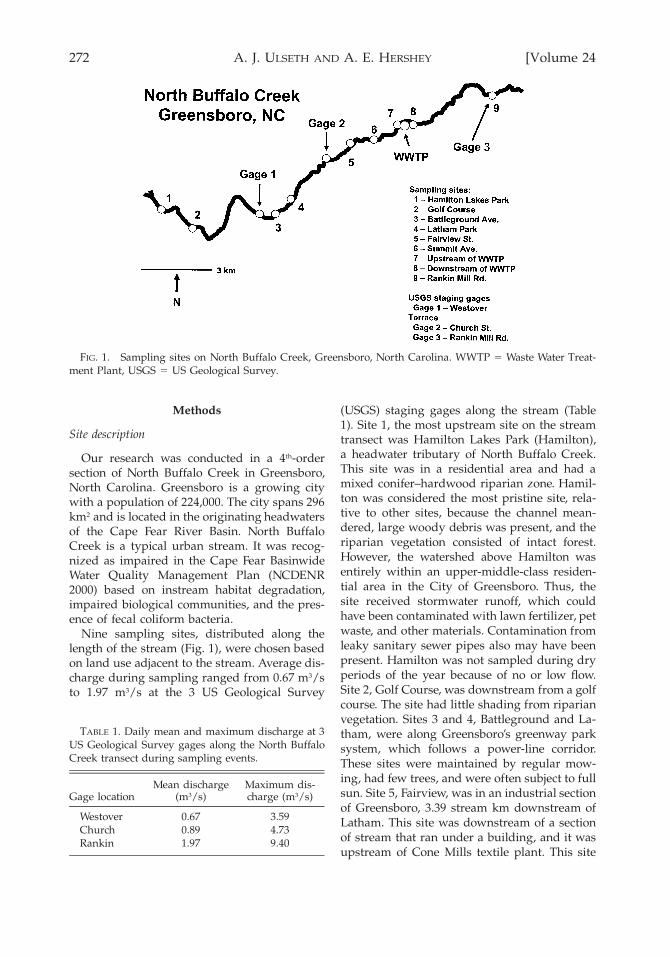
algae, a pattern that is consistent with the pre-sumption that seston was derived largely fromleaves and algae (Fig. 8A–E). However, atFairview, Summit, and Rankin, d13C of sestonwas more enriched than d13C of both leaves andalgae, indicating the presence of other importantsources of seston at these sites (Fig. 8C–E). AtHamilton, seston d13C was more depleted thand13C of both algae and leaves, also indicating thepresence of other sources of seston at this site(Fig. 8A). At Rankin, d13C of seston was .8‰enriched relative to d13C of algae and was inter-mediate between d13C of WWTP effluent andd13C of leaves (Fig. 8E), indicating that seston atthis site was derived largely from WWTP efflu-ent and leaves.
Hydropsychid caddisflies appeared to be as-similating seston, algae, and moss but the rela-tive importance of these sources was not con-sistent among sites. At most sites, d15N of hy-
dropsychids was enriched ;3 to 5‰ relative tod15N of seston, a pattern consistent with the tro-phic shift expected if the diet consisted of ses-ton. However, d13C values of hydropsychids didnot track d13C values of seston at all of the sites.At Hamilton, incorporation of moss C is themost likely explanation for the observed hy-dropsychid d13C value (Fig. 8A), although wehad only one hydropsychid d13C observation atthat site. At Latham, hydropsychids appeared tobe assimilating 15N and 13C from either sestonor moss or both (Fig. 8B). At Fairview, hydrop-sychids appeared to be assimilating 15N fromseston, but the 13C signature was consistent withassimilation of a considerable amount of moss(Fig. 8C). At Summit, hydropsychids appearedto be assimilating C from either moss or algaeor both (Fig. 8D). At Rankin, hydropsychid d13Cwas slightly depleted compared to seston d13C,and the depletion could be accounted for by in-
2005] 281STABLE ISOTOPES TRACE URBAN STREAM POLLUTANTS
FIG. 8. d13C and d15N biplots (mean 6 SE) of foodweb components for Hamilton (A), Latham (B), Fairview(C), Summit (D), and Rankin (E). WWTP 5 Waste Water Treatment Plant, caddis 5 caddisflies, Ch 5 Cambarus,Pa 5 Procambarus.
clusion of 13C from algae and moss (Fig. 8E).However, hydropsychids appeared to be assim-ilating 15N from seston (Fig. 8E). Therefore, hy-dropsychid caddisflies appeared to be assimi-lating C and N from different combinations ofsource components at the various sites.
Clams appeared to be deriving their C and Nfrom different sources at different sites. At La-tham, clams appeared to be assimilating 13Clargely from seston (Fig. 8B). However, atFairview and Summit, clam d13C was slightlydepleted relative to seston d13C, and this patternindicated that clams may have been assimilatingsome 13C from leaves or algae (Fig. 8C, D). AtFairview and Summit, clam d15N was enriched;1.5‰ compared to seston d15N, a pattern thatdoes not reflect a diet composed entirely of ses-ton. At Rankin, clam d13C appeared to bestrongly influenced by effluent from the WWTP(Fig. 8E), but clam d15N was enriched only 1‰
compared to WWTP effluent d15N. However, atRankin, clam d15N was enriched ;3.7‰ com-pared to seston d15N (Fig. 8E). These resultssuggest that WWTP effluent was important inclam diets, and this effluent was a major com-ponent of the seston at the Rankin site.
C/N ratios of foodweb components
Baseflow seston C/N ratios did not differamong seasons or sites (Table 5). At sites up-stream of WWTP, seston C/N ratios were sig-nificantly higher during the ascending limb ofthe hydrograph than during baseflow or the de-scending limb (Table 6). At Rankin, seston C/Nratios did not differ significantly among flowconditions (Table 6). Algal C/N ratios were sim-ilar among sites but were significantly higherduring spring than during autumn (Table 5).Moss C/N ratios did not differ among seasons

282 [Volume 24A. J. ULSETH AND A. E. HERSHEY
TABLE 6. Mean (61 SE) C/N ratios of seston underdifferent hydrological conditions at pooled sites up-stream and at the Rankin site downstream of theWaste Water Treatment Plant. Means with the sameletter are not significantly different. Number in pa-rentheses indicate the sample size used to calculatemeans.
ConditionPooled upstream
sites Rankin
BaseflowAscendingDescending
10.5 6 1.4b (35)13.7 6 0.8a (24)
9.1 6 0.5b (18)
10.2 6 2.5 (8)9.8 6 1.3 (5)7.8 6 1.1 (4)
FIG. 9. d15N values (mean 6 SE) of foodweb com-ponents sampled at Summit. Effluent samples weretaken from autumn 2000 to June 2001 while ConeMills textile plant was discharging industrial effluentinto North Buffalo Creek. No-effluent samples weretaken from June 2001 to June 2002 after the dischargefrom Cone Mills textile plant was diverted.or sites. Clam C/N ratios were similar among
sites, but were significantly higher duringspring and summer than during autumn andwinter (Table 5). Leaf C/N ratios were signifi-cantly lower during summer than during winterand spring (Table 5). Hydropsychid C/N ratiosdid not differ among sites but were significantlyhigher during winter and spring than duringsummer and autumn (Table 5). Cambarus andProcambarus C/N ratios did not differ amongsites (Table 5). Procambarus C/N ratios did notdiffer among seasons, but Cambarus C/N ratioswere higher during winter than during autumn.However, the variance for Cambarus C/N ratioswas extremely low, and the observed seasonaldifference reflected low variance rather than alarge difference among means (Table 5).
Influence of Cone Mills textile effluent at Summiton foodweb components
d15N of foodweb components sampled atSummit while the site was receiving textile ef-fluent from Cone Mills were depleted comparedto d15N of foodweb components sampled afterthe plant stopped discharging into the stream(Fig. 9). The organisms probably were assimi-lating N from Cone Mills effluent because ConeMills d15N signatures were consistently deplet-ed. No statistical analyses were done becausethe number of samples collected before June2001 was too low, but the data in Fig. 9 givesome insight into the site-specific effects of in-dustrial effluent on the natural abundance ofd15N of some of the foodweb components inNorth Buffalo Creek.
Discussion
Baseflow seston d15N
Baseflow seston d15N values varied signifi-cantly between sites in North Buffalo Creek,and 3 sites showed evidence of point-source in-puts (Figs 3, 9). Site 8, directly below the WWTP,was most enriched in 15N. This result was notsurprising because the WWTP discharges45,000 to 60,000 m3/d of 15N-enriched treatedeffluent into North Buffalo Creek during dryconditions (WWTP personnel, North BuffaloCreek WWTP, personal communication). AtRankin, seston d15N appeared to be influencedprimarily by WWTP effluent, but it also mayhave been influenced partially by dischargefrom the city. In the past, nonpoint sources up-stream of the WWTP have caused water-qualityproblems at Rankin (NCDENR 2000). At Sum-mit, seston d15N was depleted while Cone Millswas discharging 15N-depleted textile effluentinto the stream. Thus, for each of the 3 samplingsites that clearly were receiving point-sourcepollutants, the d15N data suggested that sestond15N was sensitive to those point-source inputs.Moreover, during baseflow, the seston responsewas site-specific rather than cumulative alongthe transect.
At baseflow, seston d15N values at every site,including Hamilton (d15N 5 3.7‰), were moreenriched than d15N values reported for pristinesites elsewhere (d15N ù 0‰; Fry 1991, Salas andDudgeon 2001). However, this result was ex-pected given the urban setting of North Buffalo

2005] 283STABLE ISOTOPES TRACE URBAN STREAM POLLUTANTS
Creek. Salas and Dudgeon (2001) compared for-ested, shaded, and open streams in Hong Kong,and found that seston d15N was 6.4‰ in opensites and ;0‰ in forested sites. They attributedthis difference to the higher proportion of au-tochthonous material contributing to seston fluxat open sites than at forested sites. Seston d15Nvalues from nonurban streams in the piedmontof North Carolina ranged from 3.6‰ to 8.1‰(Ulseth 2003). Thus, the ;3 to 4‰ 15N enrich-ment of seston at urban sites that were not re-ceiving point-source inputs was generally con-sistent with values of seston d15N in nonurbanstreams in the region.
Seston d15N values in North Buffalo Creekwere consistent with values that have been re-ported for soil d15N-NO3
2 in the region. Hubner(1986) reported soil d15N-NO3
2 values from13‰ to 18‰, and Kendall (1998) reportedd15N-NO3
2 values from 22‰ to 114‰ in nat-ural soils and from 22‰ to 112‰ in agricul-tural soils. At 17 Long Term Ecological Research(LTER) sites, most of which are more pristinethan many other locations, Fry (1991) reportedmineral soil-d15N values that ranged from 0‰to 18‰ and organic soil-d15N values thatranged from 23‰ to 12‰.
Historical land use also influences piedmontstreams. Humans have been altering the land-scape for centuries, but understanding thesehistorical impacts in relation to the life historiesof aquatic organisms and systems we study hasnot always been emphasized (Meyer and Wal-lace 2001). For instance, Harding et al. (1998)found that macroinvertebrate and fish commu-nity structure was better explained by 1950s wa-tershed land use than by current riparian andwatershed land use. Very little of the North Car-olina piedmont has not been disturbed (Mul-holland and Lenat 1992). The southeastern pied-mont was heavily affected by European settlers.Historical landuse practices included forest re-moval and agriculture (Mulholland and Lenat1992). Soil organic matter is oxidized duringcultivation, and this oxidation causes increasesin d15N-NO3
2 (Heaton 1986). In addition, severalstudies have attributed high d15N values ofstream food webs to agricultural land use with-in the watershed (Bunn et al. 1997, Harringtonet al. 1998). Therefore, seston d15N signaturesmay reflect historical as well as current landusepractices.
Seston d15N during storms
During ascending and descending limbs ofthe stream hydrograph at sites upstream of theWWTP, nutrient concentrations were elevatedand seston d15N was depleted relative to valuesduring baseflow. These results were consistentwith the observed decline in seston d15N withincreasing nutrient flux. Stormwater inputs in-fluence nutrient concentrations in streams (Car-penter et al. 1998). Seston sampled from stormsand a leaky sewer pipe along North BuffaloCreek during storms was depleted in d15N (d15N5 1.4‰ 6 0.3, n 5 10, and d15N 5 21.6‰, n 51, respectively). WWTP influent, which shouldbe representative of sewage leaks, also was de-pleted in d15N (d15N 5 20.3‰ 6 0.7, n 5 7;Ulseth 2003). These depleted sources of 15Ncould partially explain the depletion of sestond15N observed during storms. However, if theproportion of allochthonous contribution(leaves) to seston increased during storms, thenthe 15N signal in seston would have been dilutedbecause leaf d15N was depleted compared to al-gal d15N. This hypothesis was only partiallysupported by C/N ratios. The C/N ratios ofseston were higher during the ascending por-tion of the hydrograph than during baseflow,and leaves had higher C/N ratios than otherfoodweb components (Table 5). However, the C/N ratio increased from 10.5 6 1.4 at baseflow to13.7 6 0.8 during the ascending limb, and thissmall increase was consistent with only a slight-ly higher-than-baseflow contribution of allo-chthonous detritus to the seston. However, thedepleted d15N values of seston during the as-cending portion of the hydrograph may havebeen caused by changing proportions of a com-bination of terrestrial detritus (high C/N ratioand low d15N), autochthonous material (low C/N ratio and high d15N), and anthropogenic in-puts (low d15N and intermediate C/N ratio; C/N ratio of storm pipe seston 5 17 6 1.3, n 510, C/N ratio of leaky sewer seston 5 12.3, n 51; and C/N ratio of WWTP influent 5 10 6 0.1,n 5 6; Ulseth 2003). All of these sources wouldbe expected to increase during high discharge,and a combination of them could have causedthe observed C/N ratios and d15N signaturesduring ascending conditions. Nevertheless, ses-ton d15N and C/N ratios during storm eventswere most similar to those of anthropogenic

284 [Volume 24A. J. ULSETH AND A. E. HERSHEY
sources, and could not be accounted for strictlyby allochthonous detritus.
At Rankin, the relationship between sestond15N and NO3
2 flux was positive and explained54% of the variability in seston d15N. Storms in-creased input from nonpoint sources, which in-creased nutrient concentrations and flux, at sitesupstream of the WWTP, but storms diluted nu-trient concentrations and flux at sites down-stream of the WWTP. During baseflow at Ran-kin, WWTP effluent dominated flow and, attimes, made up ;50% of the stream discharge.However, WWTP effluent was diluted duringstorms, and this dilution reduced seston d15N,illustrating the contrast between the effects ofstorm runoff and sanitary sewer sources of ses-ton d15N.
Foodweb d13C and d15N
d13C values of algae and moss at Latham andalgae at Fairview were enriched compared tod13C values of algae and moss at Summit andRankin and moss at Fairview. Overall, primaryproducers are variable with respect to their iso-topic signatures (Boon and Bunn 1994), and wesee several potential explanations for the differ-ences among sites in our study. 1) Biomass offilamentous algae was much higher at Lathamthan at other sites. If the higher algal biomassat Latham was accompanied by higher produc-tivity, then C could have been limiting at La-tham, thereby increasing d13C values at that site(Hicks 1997). 2) Moss and algae at Summit andRankin and moss at Fairview were collectedfrom riffles, whereas moss and algae were col-lected from runs at Latham, because the Lathamsite had no riffles. The riffle at Fairview was ful-ly covered with moss, so algae from Fairviewwas collected from a run. Differences in currentvelocity can affect moss and algae fractionationof 13C (Finlay et al. 1999). 3) Species compositionof moss and algae may have differed amongsites. 4) d13C of dissolved inorganic C (DIC) mayhave differed among sites, thereby affectingmoss and algal d13C at the sites (Rosenfield andRoff 1992).
Isotopic signatures of hydropsychid caddis-flies, which are generally considered filter-feed-ers (Merritt and Cummins 1996), were not fullyconsistent with a diet primarily of seston acrosssites. For example, hydropsychid caddisfly d13Cwas ;4‰ depleted relative to seston at Fairview
and Summit. Moreover, d13C and d15N signa-tures of hydropsychid caddisflies were inconsis-tent with those of their presumed food sourcesand, at some sites, the 2 isotope signatures sug-gested different food sources. These d13C andd15N results could have been the consequencesof: 1) a seasonal shift in isotopic signatures offood sources (Hart and Lovvorn 2002, Mc-Cutchan and Lewis 2002), 2) failure to measureall possible food sources, or 3) use of .1 foodsource by caddisflies (Mihuc and Toetz 1994,Hicks 1997).
McCutchan and Lewis (2002) and Hart andLovvorn (2002) suggested that seasonal shifts inisotopic signatures of food sources may causetime lags between assimilation of C and assim-ilation of N in consumers, resulting in disparateconsumer d13C and d15N values relative to theirfood sources. However, isotopic signatures forfoodweb components in North Buffalo Creekdid not vary seasonally (Table 4), nor did sestonC/N ratios (Table 5), so this explanation is un-likely. Hydropsychid caddisflies are omnivoresthat feed on a variety of suspended organic ma-terials, which may include detritus, inverte-brates, and algae (Fuller and Mackay 1980). Lar-vae collect particles from the water column byusing a silken net (Schefter and Wiggins 1986).Thus, hydropsychid caddisflies may have se-lected particles with d13C values that were de-pleted relative to the d13C of the seston particlesin our water column samples. However, wethink it is most likely that the apparent mis-match between the d13C and d15N signatures ofhydropsychid caddisflies and those of their foodsources reflected differential assimilation of 13Cand 15N from the various components of amixed diet. Unfortunately, the relative contri-butions of various potential food sources aredifficult to infer from mixing models when .2food sources are available (e.g., Kline et al.1990). Moreover, the approach developed byPhillips and Koch (2002) for a 3-source mixingmodel is restricted to n isotopes with #(n 1 1)sources, and .3 food sources probably contrib-uted to both seston and animal diets (e.g., algae,leaf detritus, moss, animal feces, animal detri-tus, and sewage).
d13C of clams was similar to d13C of seston,and clams appeared to be assimilating some 13Cfrom seston at most sites. However, at Rankin,d13C of clams was more similar to d13C ofWWTP effluent than of seston. d15N of clams

2005] 285STABLE ISOTOPES TRACE URBAN STREAM POLLUTANTS
was consistently enriched ;1.5‰ above thefood sources suggested by the d13C values. Av-erage trophic shifts for d15N are ;3.4‰ (VanderZanden and Rasmussen 2001), but trophic shiftscan range from 1‰ to 5‰ (Minigawa andWada 1984, Mihuc and Toetz 1994, McCutchanet al. 2003). In a broad comparative study,McCutchan et al. (2003) noted that trophic shiftsfor d13C depended on the type of tissue ana-lyzed and whether the sample was acidified,whereas trophic shifts for d15N depended onwhether a consumer fed on invertebrates, otherhigh-protein foods, or plant tissue. When the C/N ratio of the food source is high, less fraction-ation of 15N occurs between trophic levels (Ad-ams and Sterner 2000, Huryn et al. 2001, Hartand Lovvorn 2002). In our study, seston C/Nratios were only slightly higher than those ofalgae and much lower than those of leaves.Thus, clams probably were assimilating C andN from a variety of sources. For instance, clamsat Fairview and Summit sites appeared to beassimilating some C and N from leaf detritus.Some clams, especially at Latham, were collect-ed from the stream bank or from below the sur-face of the stream substrate. Therefore, clamsmay have been pedal-feeding on food sourcesthat were not collected for stable isotope anal-ysis.
d15N of nearly all foodweb components atRankin was enriched relative to d15N of foodwebcomponents at sites upstream of the WWTP.This result suggested that organisms at Rankinwere assimilating WWTP effluent-derived N,despite the fact that Rankin was 6 km down-stream of the point of WWTP discharge. Theenrichment may have been the result of assim-ilation of sewage-derived 15N-NO3
2 (which wedid not measure) by algae or the incorporationof sewage-derived particulate organic matter(SDPOM) in the diets of consumers. Valiela etal. (1992) found that sewage-derived N was as-similated by primary producers as 15N-NO3
2,and deBruyn and Rasmussen (2002) and VanDover et al. (1992) found that consumers assim-ilated SDPOM. At Rankin, a combination ofthese 2 pathways seems likely because the de-gree of 15N enrichment was as high for algaeand moss as it was for primary and secondaryconsumers. deBruyn and Rasmussen (2002)found that algal d15N was higher downstream ofa WWTP because adhered particles of SDPOMcould not be washed from algae prior to anal-
ysis. However, moss and algae samples in ourstudy were rinsed with DI water before analy-sis, and little or no adhered SDPOM was ob-served. Wayland and Hobson (2001) found thatd15N values of algae and suspended sediment(seston) were enriched, a pattern they attributedto assimilation of N from sewage, which ac-counted for 42% of the algal N. Therefore, theenriched d15N of moss and algae at Rankin prob-ably was caused by assimilation of 15N-NO3
2
from the WWTP effluent rather than by contam-ination of samples with adhered SDPOM.
At Rankin, hydropsychid caddisflies ap-peared to be assimilating 15N from WWTP ef-fluent via seston and some algae or other en-riched source. Clams, on the other hand, ap-peared to be assimilating 15N from WWTP ef-fluent as SDPOM. SDPOM is a mix of organicdetritus and microorganisms. It is a high-qual-ity food source and, therefore, it is often the pre-ferred food source for macroinvertebrate con-sumers (deBruyn and Rasmussen 2002). Assuch, it may act as a vector for transfer of sew-age-associated contaminants to aquatic consum-ers (deBruyn and Rasmussen 2002).
Overall, baseflow seston d15N in North Buf-falo Creek reflected the d15N signatures of point-source inputs and the soil of the Piedmont re-gion. Foodweb components at 3 sites alongNorth Buffalo Creek were assimilating N and Cfrom anthropogenic point-source effluents. Nat-ural abundance of d15N was a useful tool forexamining the contribution of these point sourc-es to foodweb components and to seston. Dur-ing storms, the importance of anthropogenicsources, including storm water and sewageleaks, to seston increased, but these various an-thropogenic inputs could not be discriminatedin consumer components of the food web.
Acknowledgements
We thank S. Beaty, B. Bishop, K. Goodman, K.Fortino, and E. Lynam for assistance in the fieldand lab, G. Kissling for statistical assistance, andR. Doucett and B. Hungate of the Colorado Sta-ble Isotope Laboratory for running the stableisotope analyses. We also thank the people atthe North Buffalo Creek WWTP for their assis-tance throughout this project. This project wasfunded by a grant from the North Carolina Wa-ter Resources Research Institute to AEH and theJulia Taylor Morton endowment.

286 [Volume 24A. J. ULSETH AND A. E. HERSHEY
Literature Cited
ADAMS, T. S., AND R. W. STERNER. 2000. The effect ofdietary nitrogen content on trophic level 15N en-richment. Limnology and Oceanography 45:601–607.
ALBANESE, B., AND G. MATLACK. 1998. Utilization ofparking lots in Hattiesburg, Mississippi, USA,and impacts on local streams. EnvironmentalManagement 24:265–271.
ALLAN, J. D. 1995. Stream ecology: structure and func-tion of running waters. Kluwer Academic Pub-lishers, Dordrecht, The Netherlands.
APHA (AMERICAN PUBLIC HEALTH ASSOCIATION).1989. Standard methods for the examination ofwater and wastewater. 17th edition. AmericanPublic Health Association, American Water WorksAssociation, and Water Environment Federation,Washington, DC.
ARAVENA, R., M. L. EVANS, AND J. A. CHERRY. 1993.Stable isotopes of oxygen and nitrogen in sourceidentification of nitrate from septic systems.Groundwater 31:180–186.
BOON, P. I., AND S. E. BUNN. 1994. Variations in thestable isotope composition of aquatic plants andtheir implications for food web analysis. AquaticBotany 48:99–108.
BUNN, S. E., P. M. DAVIES, AND D. M. KELLAWAY. 1997.Contributions of sugar cane and invasive pasturegrass to the aquatic food web of a tropical low-land stream. Marine and Freshwater Research 48:173–179.
CARPENTER, S. R., N. F. CARACO, D. L. CORREL, R. W.HOWARTH, A. N. SHARPLEY, AND V. H. SMITH.1998. Nonpoint pollution of surface waters withphosphorus and nitrogen. Ecological Applica-tions 8:559–568.
CHARACKLIS, W. G., C. H. WARD, J. M. KING, AND F. L.ROE. 1979. Rainfall quality, land use, and runoffquality. American Society of Civil Engineers 105:416–419.
CITY OF GREENSBORO STORM WATER SERVICES. 2000.Stormwater management manual. City of Greens-boro, Greensboro, North Carolina. (Available from:http://www.ci.greensboro.nc.us/stormwater/Planning/TechnicalDocuments/SWMpupdate.pdf)
CORBETT, C. W., M. WAHL, D. E. PORTER, D. EDWARDS,AND C. MOISE. 1997. Nonpoint source runoff mod-eling: a comparison of a forested watershed andan urban watershed on the South Carolina coast.Journal of Experimental Marine Biology and Ecol-ogy 213:133–149.
CUMMINS, K. W. 1974. Structure and function of streamecosystems. BioScience 24:631–641.
DEBRUYN, A. M., AND J. B. RASMUSSEN. 2002. Quanti-fying assimilation of sewage-derived organic mat-ter by riverine benthos. Ecological Applications 12:511–520.
DENIRO, M. J., AND S. EPSTEIN. 1978. Influence of dieton the distribution of carbon isotopes in animals.Geochimica et Cosmochimica Acta 42:495–506.
DODDS, W. K., AND E. B. WELCH. 2000. Establishing nu-trient criteria in streams. Journal of the NorthAmerican Benthological Society 19:186–196.
DUDA, A. M., D. R. LENAT, AND D. L. PENROSE. 1982.Water quality in urban streams—what can we ex-pect. Journal Water Pollution Control Federation 54:1139–1147.
FINLAY, J. C., M. E. POWER, AND G. CABANA. 1999. Ef-fects of water velocity on algal carbon isotope ra-tios: implications for river food web studies. Lim-nology and Oceanography 44:1198–1203.
FRY, B. 1991. Stable isotope diagrams of freshwaterfood webs. Ecology 72:2293–2297.
FULLER, R. L., AND R. J. MACKAY. 1980. Feeding ecologyof three species of Hydropsyche (Trichoptera: Hy-dropsychidae) in southern Ontario. Canadian Jour-nal of Zoology 58:2239–2251.
HANSSON, S., J. E. HOBBIE, R. ELMGREN, U. LARSSON, B.FRY, AND S. JOHANSSON. 1997. The stable nitrogenisotope ratio as a marker of food-web interactionsand fish migration. Ecology 78:2249–2257.
HARDING, J. S., E. F. BENFIELD, P. V. BOLSTAD, G. S. HELF-MAN, AND E. B. D. JONES. 1998. Stream biodiver-sity: the ghost of land use past. Proceedings of theNational Academy of Sciences of the United Statesof America 95:14,843–14,847.
HARRINGTON, R. R., B. P. KENNEDY, C. P. CHAMBERLAIN,J. B. BLUM, AND C. L. FOLT. 1998. 15N enrichmentto agricultural catchments: field patterns and ap-plications to tracking Atlantic salmon (Salmo salar).Chemical Geology 147:281–294.
HART, E. A., AND J. R. LOVVORN. 2002. Interpreting sta-ble isotopes from macroinvertebrate foodwebs insaline wetlands. Limnology and Oceanography 47:580–584.
HEATON, T. H. E. 1986. Isotopic studies of nitrogen pol-lution of the hydrosphere and atmosphere: a re-view. Chemical Geology 59:87–102.
HERSHEY, A. E., A. J. ULSETH, AND K. FORTINO. 2004.Use of stable isotopes to trace sewage effluentthrough a forested mid-order stream in the vicinityof Greensboro, N. C. Proceedings of the 77th An-nual Water Environment Federation Technical Ex-hibition and Conference, New Orleans, Louisiana.(Available on CD ROM from: Water EnvironmentFederation, 601 Wythe Street, Alexandria, Virginia22314-1994 USA.)
HICKS, B. J. 1997. Food webs in forest and pasturestreams in the Waikato region, New Zealand: astudy based on analyses of stable isotopes of car-bon and nitrogen, and fish gut contents. New Zea-land Journal of Marine and Freshwater Research31:651–664.
HUBNER, H. 1986. Isotope effects of nitrogen in the soiland biosphere. Pages 361–425 in P. Fritz and J. P.
2005] 287STABLE ISOTOPES TRACE URBAN STREAM POLLUTANTS
Fontes (editors). Handbook of environmental iso-tope geochemistry, volume 2b. The terrestrial en-vironment. Elsevier Science Publishers, New York.
HURYN, A. D., R. H. RILEY, R. G. YOUNG, C. J. ARBUCK-LE, K. PEACOCK, AND G. LYONS. 2001. Temporalshift in contribution of terrestrial organic matter toconsumer production in a grassland river. Fresh-water Biology 46:213–226.
HYNES, H. B. N. 1975. The ecology of running waters.University of Toronto Press, Toronto, Ontario.
KARR, J. D., W. J. SHOWERS, J. W. GILLIAM, AND A. S.ANDRES. 2001. Tracing nitrate using Delta Nitro-gen-15. Journal of Environmental Quality 30:1163–1175.
KARR, J. D., W. J. SHOWERS, AND T. H. HINSON. 2002.Nitrate source identification using d15N in agroundwater plume near an intensive swine op-eration. Ground Water Monitoring and Remedia-tion 22:68–75.
KENDALL, C. 1998. Tracing nitrogen sources and cyclingin catchments. Pages 520–576 in C. Kendall and J.J. McDonnell (editors). Isotope tracers in catchmenthydrology. Elsevier Science Publishers, New York.
KLINE, T. C., J. J. GOERING, O. A. MATHISEN, AND P. H.POE. 1990. Recycling of elements transported up-stream by runs of Pacific salmon: 1. 15N and 13Cevidence in Sashin Creek, southeastern Alaska. Ca-nadian Journal of Fisheries and Aquatic Sciences47:136–144.
KOHL, D. H., G. B. SHEARER, AND B. COMMONER. 1971.Fertilizer nitrogen: contribution to nitrate in sur-face water in a corn belt watershed. Science 174:1331–1334.
KREITLER, C. W., AND L. A. BROWNING. 1983. Nitrogen-isotope analysis of groundwater nitrate in carbon-ate aquifers: natural sources versus human pollu-tion. Journal of Hydrology 61:285–301.
MATHISEN, O. A., P. L. PARKER, J. J. GOERING, T. C.KLINE, P. H. POE, AND R. S. SCALAN. 1988. Recy-cling of marine elements transported into fresh-water by anadromous salmon. Verhandlungen derInternationalen Vereinigung fur theoretische undangewandte Limnologie 23:2249–2258.
MCCLELLAND, J. W., AND I. VALIELA. 1998a. Linking ni-trogen in estuarine producers to land-derivedsources. Limnology and Oceanography 43:577–585.
MCCLELLAND, J. W., AND I. VALIELA. 1998b. Changes infood web structure under the influence of in-creased anthropogenic nitrogen inputs to estuar-ies. Marine Ecology Progress Series 168:259–271.
MCCLELLAND, J. W., I. VALIELA, AND R. H. MICHENER.1997. Nitrogen stable isotope signatures in estua-rine food webs: a record of increasing urbanizationin coastal watersheds. Limnology and Oceanog-raphy 42:930–937.
MCCUTCHAN, J. H., AND W. M. LEWIS,JR. 2002. Relativeimportance of carbon sources for macroinverte-
brates in a Rocky Mountain stream. Limnologyand Oceanography 47:742–752.
MCCUTCHAN, J. H., W. M. LEWIS,JR., C. KENDALL, AND
C. C. MCGRATH. 2003. Variation in trophic shift forstable isotope ratios of carbon, nitrogen, and sulfur.Oikos 102:378–390.
MERRITT, R. W., AND K. W. CUMMINS. 1996. Trophic re-lations of macroinvertebrates. Pages 453–474 in F.R. Hauer and G. A. Lamberti (editors). Methods instream ecology. Academic Press, San Diego, Cali-fornia.
MEYER, J. L. 1997. Stream health: incorporating the hu-man dimension to advance stream ecology. Journalof the North American Benthological Society 16:439–447.
MEYER, J. L., W. H. MCDOWELL, T. L. BOTT, J. W. EL-WOOD, C. ISHIZAKI, J. M. MELACK, B. L. PECKARSKY,B. J. PETERSON, AND P. A. RUBLEE. 1988. Elementaldynamics in streams. Journal of the North Amer-ican Benthological Society 7:410–432.
MEYER, J. L., AND J. B. WALLACE. 2001. Lost linkagesand lotic ecology: rediscovering small streams.Pages 295–317 in M. C. Press, N. J. Huntly, and S.Levin (editors). Ecology: achievement and chal-lenge. Cambridge University Press, Cambridge,UK.
MICHENER, R. H., AND D. M. SCHELL. 1994. Stable iso-tope ratios as tracers in marine aquatic food webs.Pages 138–157 in K. Lajtha and R. H. Michener(editors). Stable isotopes in ecology and environ-mental science. Blackwell Scientific Publications,Oxford, UK.
MIHUC, T., AND D. TOETZ. 1994. Determination of dietsof alpine aquatic insects using stable isotopes andgut analysis. American Midland Naturalist 131:146–155.
MINIGAWA, M., AND E. WADA. 1984. Stepwise enrich-ment of 15N along food chains: further evidenceand the relationship between d15N and animal age.Geochimica et Cosmochimica Acta 48:1135–1140.
MULHOLLAND, P. J., AND D. R. LENAT. 1992. Streams ofthe southeastern piedmont, Atlantic Drainage. Pag-es 193–231 in C. T. Hackney, M. Adams, and W.Martin (editors). Biodiversity of the southeasternUnited States: aquatic communities. John Wileyand Sons, New York.
MULHOLLAND, P. J., J. L. TANK, D. M. SANZONE, W. M.WOLLHEIM, B. J. PETERSON, J. R. WEBSTER, AND J.L. MEYER. 2000. Food resources of stream macro-invertebrates determined by natural-abundancestable C and N isotopes and a 15N tracer addition.Journal of the North American Benthological So-ciety 19:145–157.
NCDENR (NORTH CAROLINA DEPARTMENT OF ENVI-RONMENT AND NATURAL RESOURCES). 2000. CapeFear River basinwide water quality plan. Divisionof Water Quality, North Carolina Department ofEnvironment and Natural Resources, Raleigh,

288 [Volume 24A. J. ULSETH AND A. E. HERSHEY
North Carolina. (Available from: http://h2o.enr.state.nc.us/basinwide/Capefear/capefearindex.htm)
NCDENR (NORTH CAROLINA DEPARTMENT OF ENVI-RONMENT AND NATURAL RESOURCES). 2004. Fecalcoliform total maximum daily load for the UpperNorth Buffalo Creek Watershed, City of Greens-boro, Guilford County, Cape Fear River Basin. Di-vision of Water Quality, North Carolina Depart-ment of Environment and Natural Resources, Ra-leigh, North Carolina. (Available from: http://h2o.enr. state.nc.us/tmdl/documents/northpbuffalop
tmdlpfinalpreport.pdf)PAUL, M. J., AND J. L. MEYER. 2001. Streams in the ur-
ban landscape. Annual Review of Ecology andSystematics 32:333–365.
PETERSON, B. J. 1999. Stable isotopes as tracers of or-ganic matter input and transfer in benthic foodwebs: a review. Acta Oecologica 20:479–487.
PETERSON, B. J., AND B. FRY. 1987. Stable isotopes inecosystem studies. Annual Review of Ecology andSystematics 18:293–320.
PETERSON, B. J., W. M. WOLLHEIM, P. J. MULHOLLAND,J. R. WEBSTER, J. L. MEYER, J. L. TANK, E. MARTI,W. B. BOWDEN, H. M. VALETT, A. E. HERSHEY, W.H. MCDOWELL, W. K. DODDS, S. K. HAMILTON, S.GREGORY, AND D. D. MORRALL. 2001. Control ofnitrogen export from watersheds by headwaterstreams. Science 292:86–90.
PHILLIPS, D. L., AND P. L. KOCH. 2002. Incorporatingconcentration dependence in stable isotope mixingmodels. Oecologia (Berlin) 130:114–125.
RAU, G. H., R. E. SWEENEY, I. R. KAPLAN, A. J.MAEARNS, AND D. R. YOUNG. 1981. Differencesin animal 13C, 15N, and D abundance between apolluted and an unpolluted coastal site: likelyindicators of sewage uptake by a marine foodweb. Estuarine, Coastal, and Shelf Science 13:701–707.
RESH, V. H., A. V. BROWN, A. P. COVICH, M. E. GURTZ,H. W. LI, G. W. MINSHALL, S. R. REICE, A. L. SHEL-DON, J. B. WALLACE, AND R. WISSMAR. 1988. Therole of disturbance in stream ecology. Journal ofthe North American Benthological Society 7:433–455.
RICHEY, J. E., M. A. PERKINS, AND C. R. GOLDMAN.1975. Effects of Kokanee salmon (Oncorhynchusnerka) decomposition on the ecology of a subal-pine stream. Journal of the Fisheries ResearchBoard of Canada 32:817–820.
ROBINSON, D. 2001. d15N as an integrator of the ni-trogen cycle. Trends in Ecology and Evolution16:153–162.
ROSENFIELD, J. S., AND J. C. ROFF. 1992. Examinationof the carbon base in southern Ontario streamsusing stable isotopes. Journal of the North Amer-ican Benthological Society 11:1–10.
ROUNICK, J. S., AND M. J. WINTERBOURN. 1986. Stable
carbon isotopes and carbon flow in ecosystems.BioScience 36:171–177.
SALAS, M., AND D. DUDGEON. 2001. Stable-isotope de-termination of mayfly (Insecta: Ephemeroptera)food sources in three tropical Asian streams. Ar-chiv fur Hydrobiologie 151:17–32.
SCHEFTER, P. W., AND G. B. WIGGINS. 1986. A system-atic study of nearctic larvae of the Hydropsyche mo-rose group (Trichoptera: Hydropsychidae). RoyalOntario Museum, Toronto, Ontario, Canada.
SEAGER, J., AND R. G. ABRAHAMS. 1990. The impact ofstorm sewage discharges on the ecology of asmall urban river. Water Science and Technology22:163–171.
SILVA, S. R., P. B. GING, R. W. LEE, J. C. EBBERT, A. J.TESORIERO, AND E. L. INKPEN. 2002. Forensic ap-plications of nitrogen and oxygen isotopes intracing nitrate sources in urban environments.Environmental Forensics 3:125–130.
SORANNO, P. A., S. L. HUBLER, AND S. R. CARPENTER.1996. Phosphorus loads to surface waters: a sim-ple model to account for spatial pattern of landuse. Ecological Applications 6:865–878.
ULSETH, A. J. 2003. Use of the natural abundance of15N to evaluate the effects of anthropogenic N onthe components of a headwater urban stream. MSThesis, University of North Carolina Greensboro,Greensboro, North Carolina.
VALIELA, I., K. FOREMAN, M. LAMONTAGNE, D. HERSH,J. COSTA, P. PECKOL, B. DEMEO-ANDERSON, C.D’AVANZO, M. BABIONE, C. SHAM, J. BRAWLEY,AND K. LAJTHA. 1992. Couplings of watershedsand coastal waters: sources and consequences ofnutrient enrichment in Waquoit Bay, Massachu-setts. Estuaries 15:443–457.
VANDER ZANDEN, M. J., AND J. B. RASMUSSEN. 2001.Variation in d15N and trophic fractionation: impli-cations for aquatic food webs. Limnology andOceanography 46:2061–2066.
VAN DOVER, C. L., J. F. GRASSLE, B. FRY, R. H. GARRIT,AND V. R. STARCZAK. 1992. Stable isotope evi-dence for entry of sewage-derived organic mate-rial into a deep-sea food web. Nature 360:153–156.
VITOUSEK, P. M., J. D. ABER, R. W. HOWARTH, G. E.LIKENS, P. A. MATSON, D. W. SCHINDLER, W. H.SCHLESINGER, AND D. G. TILMAN. 1997. Alterationof the global N cycle: sources and consequences.Ecological Applications 7:738–750.
WAHL, M. H., H. N. MCKELLAR, AND T. M. WILLIAMS.1997. Patterns of nutrient loading in forested andurbanized coastal streams. Journal of Experimen-tal Marine Biology and Ecology 213:111–131.
WALLACE, J. B., T. F. CUFFNEY, J. R. WEBSTER, G. J. LUG-THART, K. CHUNG, AND B. S. GOLDOWITZ. 1991.Export of fine organic particles from headwaterstreams: effects of season, extreme discharges,

2005] 289STABLE ISOTOPES TRACE URBAN STREAM POLLUTANTS
and invertebrate manipulation. Limnology andOceanography 36:670–682.
WALLACE, J. B., AND J. W. GRUBAUGH. 1996. Transportand storage of FPOM. Pages 191–216 in F. R.Hauer and G. A. Lamberti (editors). Methods instream ecology. Academic Press, San Diego, Cal-ifornia.
WAYLAND, M., AND K. A. HOBSON. 2001. Stable car-bon, nitrogen, and sulfur isotope ratios in ripar-ian food webs on rivers receiving sewage andpulp-mill effluents. Canadian Journal of Zoology79:5–15.
Received: 6 August 2003Accepted: 20 February 2005