Embed Size (px)
Citation preview
A KIDS COUNT SPECIAL REPORT
2005
Native American Children in New Mexico
Snapshots from the US Census
Native American Children in New Mexico
Snapshots from the US Census
Revised March 2008

2
With special thanks to the New Mexico Human Services Department for their support in publishing this report and to the Annie E. Casey Foundation for supporting the New Mexico KIDS COUNT Project. Any data errors are the sole responsibility of New Mexico Voices for Children (www.nmvoices.org).
*The Census Bureau defines “linguistic isolation” as no family member older than 14 years old who speaks English well. Percentages are of linguistically isolated children where at least some members speak a non-English language.
3
In late 2007, New Mexico Voices for Children (NMVC) became aware that there were errors in this publication. Although not numerous, there were enough to prompt NMVC to produce an amended version. The original publication used data from the 2000 Census and corrections were made using that same data. The tables and charts in this version are in the same format as in the original. Most of the substance of the narrative portion remains, although some edits were necessary. NMVC apologizes for any inconvenience that may have resulted from the errors.
KIDS COUNT Program Director’s Note
Lisa Adams-ShaferKIDS COUNT Program Director
4

*The Census Bureau defines “linguistic isolation” as no family member older than 14 years old who speaks English well. Percentages are of linguistically isolated children where at least some members speak a non-English language.
5
Table of Contents
Introduction..............................................Map........................................................Summary of Tribal Communities.................Urban Native Americans Albuquerque................................ New Mexico.................................Acoma Pueblo.........................................Cochiti Pueblo..........................................Isleta Pueblo............................................Jemez Pueblo..........................................Jicarilla Apache Nation..............................Laguna Pueblo.........................................Mescalero Apache Nation..........................Nambe Pueblo.........................................Navajo Nation in New Mexico.................... Alamo......................................... Ramah........................................ To’hajiilee....................................Picuris Pueblo.........................................Pojoaque.................................................San Felipe...............................................San Ildefonso...........................................San Juan.................................................Sandia.....................................................Santa Ana................................................Santa Clara..............................................Santo Domingo........................................Taos Pueblo.............................................Tesuque Pueblo.......................................Zia Pueblo...............................................Zuni Pueblo.............................................Native American Income............................Appendix.................................................
789
101112-1314-1516-1718-1920-2122-2324-2526-2728-2930-3132-3334-3536-3738-3940-4142-4344-4546-4748-4950-5152-5354-5556-5758-5960-616365

6

*The Census Bureau defines “linguistic isolation” as no family member older than 14 years old who speaks English well. Percentages are of linguistically isolated children where at least some members speak a non-English language.
7
Introduction
In 2003, New Mexico Voices for Children (NMVC) produced a report entitled Minority/Majority: A Profile of New Mexico’s Children, which highlighted the diversity of the child population in New Mexico. In fact, the Native-American population in New Mexico comprises 10.5 percent of the total population.1 This constitutes the third highest proportion of Native Americans in the United States.2
There are 22 tribal communities in New Mexico. The 19 pueblos are spread across eight counties, with a combined land mass of 2.11 million acres.3 The Mescalero and Jicarilla Apache tribes are in three counties – Rio Arriba, Sandoval, and Otero.4 The Navajo Nation encompasses parts of Arizona, New Mexico and Utah and approximately 39 percent of Navajo people reside in New Mexico.5 For the purposes of this report, only data for Navajo communities in New Mexico is used.
Using the 2000 Census
The Census is the most comprehensive source of data available for all populations within the United States. It uses consistent definitions and measures, and its data can be compared across communities. Census data can be accessed at www.census.gov.
To review how NMVC obtained the figures presented within this publication, see the appendix entitled A Note on Sources.
Populations in these communities range from less than 2000 individuals at Picuris Pueblo to more than 70,000 people living on the Navajo Nation in New Mexico. Each community has different access to services and is variously affected by rural and geographic issues.
1 Census 2000. 2 Ibid. Alaska’s Native American population is 19 percent of its total population and Oklahoma’s is 11.5 percent. 3 See page 9.4 See page 9. 5 Census 2000.
Highlights of this report include:
• Children under the age of 18 represent 39.3 percent of the Native-American population.
• Nearly 40 percent of all Native-American children live under the federal poverty level. Among white, non-Hispanic children, this rate is 12 percent.
• The median income of Native-American families is half that of white, non-Hispanics in New Mexico.
8
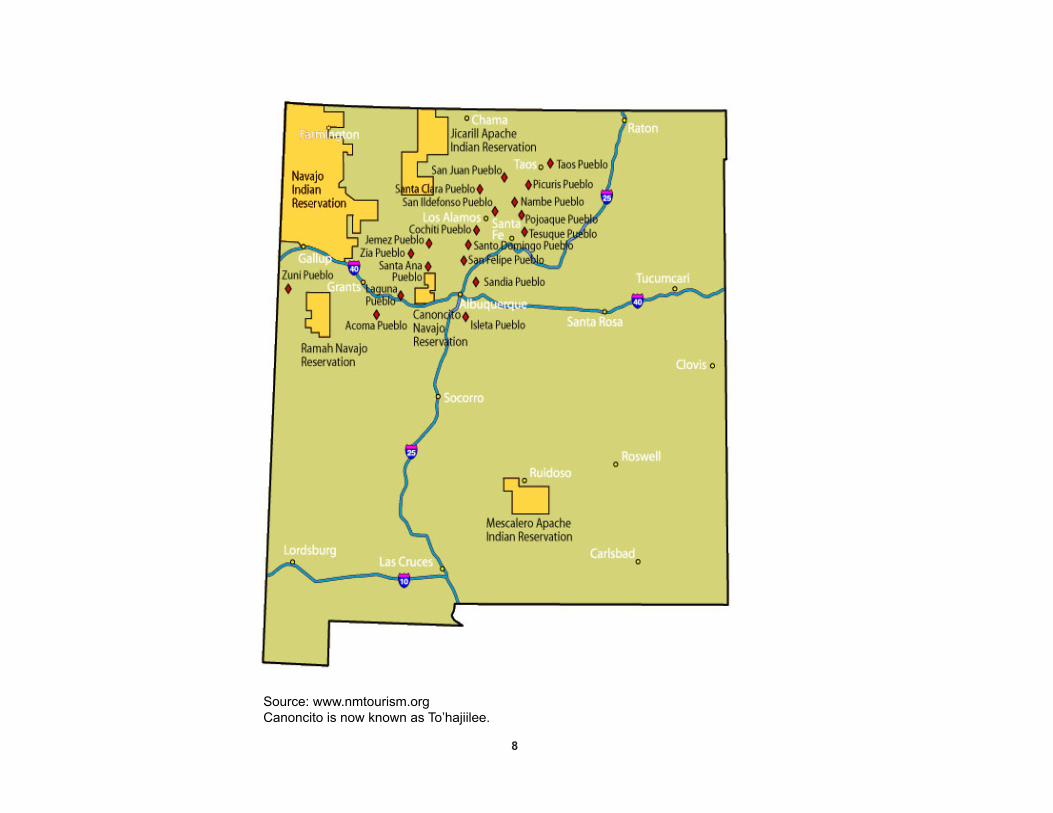
Source: www.nmtourism.org Canoncito is now known as To’hajiilee.

*The Census Bureau defines “linguistic isolation” as no family member older than 14 years old who speaks English well. Percentages are of linguistically isolated children where at least some members speak a non-English language.
9
SUMMARY OF TRIBAL COMMUNITIES
Tribe Language County Nearest Urban Center Square Miles
Population on Tribal Land
Acoma Keresan Cibola 60 miles from Albuquerque 411 2,756Cochiti Keresan Sandoval 35 miles from Santa Fe 82.09 742Isleta Tiwa Bernalillo & Valencia 13 miles from Albuquerque 331.14 2,813Jemez Towa Sandoval 73 miles from Santa Fe 139.71 1,933
Jicarilla Apache Apache Rio Arriba & Sandoval 75 miles from Farmington 1,367.32 2,466Laguna Keresan Cibola 45 miles from Albuquerque 775.08 3,733
Mesalero Apache Apache Otero 30 miles from Alamogordo 719.29 2,932Nambe Tewa Santa Fe 20 miles from Santa Fe 32.07 521
Navajo Nation (NM) Navajo Multiple, including San Juan, McKinley, Cibola
The capital of the Navajo Nation is Window Rock, 104 miles from Shiprock
4,392.77 43,524
Picuris Tiwa Taos 25 miles from Taos 27.36 195Pojoaque Tewa Santa Fe 18 miles from Santa Fe 21.16 311San Felipe Keresan Sandoval 35 miles from Albuquerque 80.03 2,489
San Ildefonso Tewa Santa Fe 23 miles from Santa Fe 43.98 554San Juan Tewa Rio Arriba 25 miles from Santa Fe 26.70 1,395Sandia Tiwa Sandoval 16 miles from Albuquerque 39.43 536
Santa Ana Keresan Sandoval 15 miles from Albuquerque 101.05 514Santa Clara Tewa Rio Arriba 1.5 miles from Española 77.11 1,448
Santo Domingo Keresan Sandoval 25 miles from Santa Fe 106.60 3,134Taos Tiwa Taos 2.5 miles from Taos 155.03 1,393
Tesuque Tewa Santa Fe 10 miles from Santa Fe 26.52 428Zia Keresan Sandoval 37 miles from Albuquerque 187.76 578
Zuni Zuñi McKinley 37 miles from Gallup 638.73 7,440
*Square Miles and Population are from the U.S. Census 2000. Population counts are for “American Indian alone or in any combination.”

10
URBAN NATIVE AMERICANS
ALBUQUERQUE
*The Census Bureau defines “linguistic isolation” as no family member older than 14 years old who speaks English well. Percentages are of linguistically isolated children where at least some members speak a non-English language.
Percent of all Pueblo children in
Albuquerque
Percent of all Apache children in
Albuquerque
Percent of all Navajo children in
Albuquerque
Percent of all Native American
children in Albuquerque
Percent of all Hispanic children (of any race) in Albuquerque
Percent of all white (non-His-panic) children in Albuquerque
Percent of all children in
Albuquerque
Economic SecurityPercent of children in poverty 30.1% 35.7% 39.4% 31.3% 23.4% 8.6% 18.5%
Percent of children with no parent working 32.8% 11.3% 24.0% 24.2% 14.3% 4.9% 11.5%
EducationPercent of 3-4 year olds in preschool 64.1% 80.0% 48.0% 57.4% 36.1% 49.3% 42.5%
Percent of 18-24 year olds with a HS diploma or more 65.2% 69.9% 70.0% 67.7% 65.6% 83.5% 73.3%
Percent of 18-24 year olds enrolled in school 29.8% 39.2% 38.9% 37.1% 35.9% 50.2% 42.1%
TeensPercent of 16-19 year olds not in school, military, or working 24.3% 7.9% 20.8% 19.2% 13.9% 7.0% 11.6%
Percent of 16-19 year olds not in school or HS graduate 20.6% 23.8% 17.3% 17.1% 16.7% 6.4% 12.3%
DisabilityPercent of 5-17 year olds with a disability 7.5% 1.5% 2.8% 6.4% 7.5% 6.3% 6.9%
Percent of disabled 5-17 year olds living in poverty 31.9% 100.0% 52.7% 26.2% 30.6% 15.0% 25.1%
LanguagePercent of children speaking a language other than English 62.2% 9.6% 43.8% 45.7% 35.5% 4.2% 24.2%
Percent of those children speaking English "very well" 61.6% 82.9% 56.4% 59.9% 67.6% 80.5% 67.6%
Percent of linguistically isolated children* 11.5% 6.8% 12.7% 11.5% 13.3% 3.2% 12.1%
HousingPercent of children living in owner occupied homes 71.3% 55.0% 48.2% 56.4% 65.1% 76.5% 69.1%
Percent of households with telephone access 85.7% 90.9% 72.8% 85.5% 95.6% 98.7% 96.9%

*The Census Bureau defines “linguistic isolation” as no family member older than 14 years old who speaks English well. Percentages are of linguistically isolated children where at least some members speak a non-English language.
11
ALL NEW MEXICO
NEW MEXICOPercent of all
Pueblo children in
New Mexico
Percent of all Apache
children in New Mexico
Percent of all Navajo children in
New Mexico
Percent of all Native American
children in New Mexico
Percent of all Hispanic children (of any race) in
New Mexico
Percent of all white (non-His-panic) children in New Mexico
Percent of all children in
New Mexico
Economic SecurityPercent of children in poverty 36.3% 34.5% 47.3% 39.2% 29.6% 12.4% 25.0%
Percent of children with no parent working 27.7% 22.1% 28.0% 23.6% 16.1% 6.1% 13.6%
EducationPercent of 3-4 year olds in preschool 60.4% 61.9% 49.7% 50.2% 34.2% 46.7% 40.4%
Percent of 18-24 year olds with a HS diploma or more 66.5% 56.1% 58.0% 65.0% 63.2% 81.1% 70.5%
Percent of 18-24 year olds enrolled in school 31.8% 30.5% 36.8% 38.1% 36.3% 49.1% 41.8%
TeensPercent of 16-19 year olds not in school, military, or working 17.2% 16.2% 18.2% 16.0% 14.0% 7.9% 11.9%
Percent of 16-19 year olds not in school or HS graduate 15.0% 16.7% 13.6% 13.6% 15.8% 7.2% 12.1%
DisabilityPercent of 5-17 year olds with a disability 5.8% 3.0% 5.6% 6.1% 7.0% 6.5% 6.7%
Percent of disabled 5-17 year olds living in poverty 39.1% 38.9% 43.8% 37.8% 35.1% 19.5% 30.4%
LanguagePercent of children speaking a language other than English 54.3% 18.4% 51.4% 43.4% 46.8% 4.4% 31.2%
Percent of those children speaking English "very well" 64.8% 68.7% 61.1% 65.3% 67.2% 78.3% 67.5%
Percent of linguistically isolated children* 7.9% 4.4% 10.8% 8.7% 13.9% 3.4% 12.0%
HousingPercent of children living in owner occupied homes 71.1% 62.6% 80.8% 65.2% 67.3% 73.0% 68.8%
Percent of households with telephone access 83.2% 76.7% 43.5% 71.2% 93.8% 97.7% 94.3%

12
ACOMA PUEBLO
Number of
Children
Number of Children
Below Poverty
Percent Below
PovertyAll children living with their own families 952 308 32.4%
Living in a two-parent home 493 146 29.6%Living with a single father 101 42 41.6%Living with a single mother 358 120 33.5%
Income Level for All Children in Acoma Pueblo by Federal Poverty Level
All Native American Percent Native AmericanTotal population 2,814 2,756 97.9%Adult population 1,824 1,775 97.3%Population under 18 years 990 981 99.1%Percent under 18 years 35.2% 35.6% N/A0 to 2 years 154 152 98.7%3 to 4 years 101 99 98.0%5 to 9 years 248 243 98.0%10 to 14 years 315 315 100.0%15 to 17 years 172 172 100.0%
100% - 129% 130% - 184%
185% - 199% Over 200%
Under 50% 50% - 99%
17.6%
12.7%
14.9%30.0%
7.4%
17.4%

*The Census Bureau defines “linguistic isolation” as no family member older than 14 years old who speaks English well. Percentages are of linguistically isolated children where at least some members speak a non-English language.
13
ACOMA PUEBLO
Acoma Pueblo New MexicoPercent of Native American children
living on the pueblo
Percent of all children (native and non-native)
living on the pueblo
Percent of all Native American children in New
Mexico
Percent of all children in
New Mexico
Economic SecurityPercent of children in poverty 32.7% 32.5% 39.2% 25.0%Percent of children with no parent working 28.6% 28.4% 23.6% 13.6%
EducationPercent of 3-4 year olds in preschool 59.6% 58.4% 50.2% 40.4%Percent of 18-24 year olds with a HS diploma or more 66.3% 66.3% 65.0% 70.5%Percent of 18-24 year olds enrolled in school 31.7% 31.7% 38.1% 41.8%
TeensPercent of 16-19 year olds not in school, military, or working 15.9% 15.9% 16.0% 11.9%Percent of 16-19 year olds not in school or HS graduate 10.1% 10.1% 13.6% 12.1%
DisabilityPercent of 5-17 year olds with a disability 2.9% 2.8% 6.1% 6.7%Percent of disabled 5-17 year olds living in poverty 30.0% 30.0% 37.8% 30.4%
LanguagePercent of children speaking a language other than English 27.0% 27.5% 43.4% 31.2%
Percent of those children speaking English "very well" 55.8% 54.5% 65.3% 67.5%Percent of linguistically isolated children* 2.5% 3.3% 8.7% 12.0%
HousingPercent of children living in owner occupied homes 90.9% 91.0% 65.2% 68.8%Percent of households with telephone access 80.9% 81.6% 71.2% 94.3%

14
COCHITI PUEBLO
Number of
Children
Number of Children
Below Poverty
Percent Below
PovertyAll children living with their own families 379 81 21.4%
Living in a two-parent home 249 25 10.0%Living with a single father 61 9 14.8%Living with a single mother 69 47 68.1%
Income Level for All Children in Cochiti Pueblo by Federal Poverty Level
All Native American Percent Native AmericanTotal population 1,482 742 50.1%Adult population 1,098 487 44.4%Population under 18 years 384 255 66.4%Percent under 18 years 25.9% 34.4% N/A0 to 2 years 57 32 56.1%3 to 4 years 43 28 65.1%5 to 9 years 114 88 77.2%10 to 14 years 115 73 63.5%15 to 17 years 55 34 61.8%
15.4%
10.2%
7.0%
53.4%
3.6%
10.4%
100% - 129% 130% - 184%
185% - 199% Over 200%
Under 50% 50% - 99%

*The Census Bureau defines “linguistic isolation” as no family member older than 14 years old who speaks English well. Percentages are of linguistically isolated children where at least some members speak a non-English language.
15
COCHITI PUEBLO
Cochiti Pueblo New MexicoPercent of Native American children
living on the pueblo
Percent of all children (native and non-native)
living on the pueblo
Percent of all Native American children in New
Mexico
Percent of all children in
New Mexico
Economic SecurityPercent of children in poverty 20.4% 22.4% 39.2% 25.0%Percent of children with no parent working 12.3% 13.6% 23.6% 13.6%
EducationPercent of 3-4 year olds in preschool 32.1% 34.9% 50.2% 40.4%Percent of 18-24 year olds with a HS diploma or more 76.5% 73.2% 65.0% 70.5%Percent of 18-24 year olds enrolled in school 38.3% 28.8% 38.1% 41.8%
TeensPercent of 16-19 year olds not in school, military, or working 18.2% 24.1% 16.0% 11.9%Percent of 16-19 year olds not in school or HS graduate 0.0% 12.6% 13.6% 12.1%
DisabilityPercent of 5-17 year olds with a disability 7.7% 8.1% 6.1% 6.7%Percent of disabled 5-17 year olds living in poverty 0.0% 34.8% 37.8% 30.4%
LanguagePercent of children speaking a language other than English 67.7% 59.5% 43.4% 31.2%
Percent of those children speaking English "very well" 72.0% 78.1% 65.3% 67.5%Percent of linguistically isolated children* 12.9% 9.7% 8.7% 12.0%
HousingPercent of children living in owner occupied homes 60.3% 69.0% 65.2% 68.8%Percent of households with telephone access 84.7% 92.0% 71.2% 94.3%
16
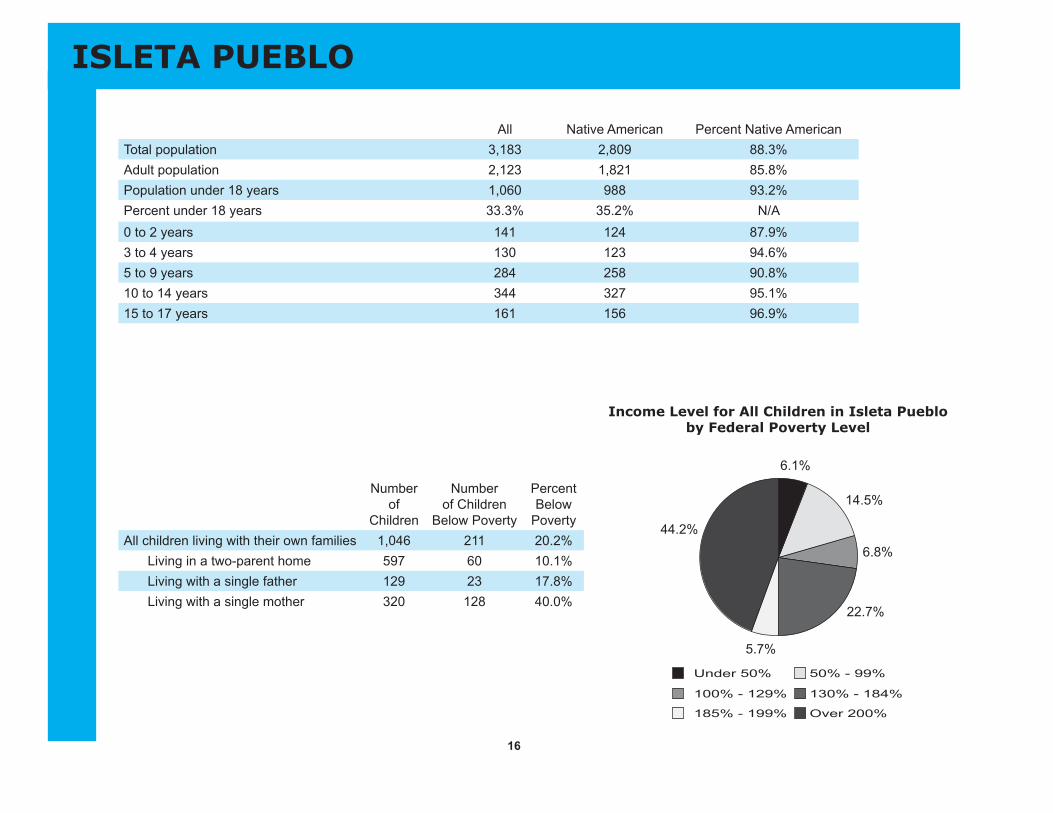
ISLETA PUEBLO
14.5%
6.8%
6.1%
44.2%
5.7%
22.7%
100% - 129% 130% - 184%
185% - 199% Over 200%
Under 50% 50% - 99%
Number of
Children
Number of Children
Below Poverty
Percent Below
PovertyAll children living with their own families 1,046 211 20.2%
Living in a two-parent home 597 60 10.1%Living with a single father 129 23 17.8%Living with a single mother 320 128 40.0%
Income Level for All Children in Isleta Pueblo by Federal Poverty Level
All Native American Percent Native AmericanTotal population 3,183 2,809 88.3%Adult population 2,123 1,821 85.8%Population under 18 years 1,060 988 93.2%Percent under 18 years 33.3% 35.2% N/A0 to 2 years 141 124 87.9%3 to 4 years 130 123 94.6%5 to 9 years 284 258 90.8%10 to 14 years 344 327 95.1%15 to 17 years 161 156 96.9%

*The Census Bureau defines “linguistic isolation” as no family member older than 14 years old who speaks English well. Percentages are of linguistically isolated children where at least some members speak a non-English language.
17
ISLETA PUEBLO
Isleta Pueblo New MexicoPercent of Native American children
living on the pueblo
Percent of all children (native and non-native)
living on the pueblo
Percent of all Native American children in New
Mexico
Percent of all children in
New Mexico
Economic SecurityPercent of children in poverty 20.2% 20.6% 39.2% 25.0%Percent of children with no parent working 25.1% 23.7% 23.6% 13.6%
EducationPercent of 3-4 year olds in preschool 54.5% 51.5% 50.2% 40.4%Percent of 18-24 year olds with a HS diploma or more 77.3% 73.4% 65.0% 70.5%Percent of 18-24 year olds enrolled in school 23.1% 20.8% 38.1% 41.8%
TeensPercent of 16-19 year olds not in school, military, or working 10.9% 9.7% 16.0% 11.9%Percent of 16-19 year olds not in school or HS graduate 12.2% 14.8% 13.6% 12.1%
DisabilityPercent of 5-17 year olds with a disability 8.1% 7.7% 6.1% 6.7%Percent of disabled 5-17 year olds living in poverty 0.0% 0.0% 37.8% 30.4%
LanguagePercent of children speaking a language other than English 49.0% 48.3% 43.4% 31.2%
Percent of those children speaking English "very well" 83.5% 80.8% 65.3% 67.5%Percent of linguistically isolated children* 2.6% 5.0% 8.7% 12.0%
HousingPercent of children living in owner occupied homes 83.7% 83.3% 65.2% 68.8%Percent of households with telephone access 91.5% 92.0% 71.2% 94.3%

18
JEMEZ PUEBLO
Number of
Children
Number of Children
Below Poverty
Percent Below
PovertyAll children living with their own families 691 187 27.1%
Living in a two-parent home 338 27 8.0%Living with a single father 139 37 26.6%Living with a single mother 214 123 57.5%
Income Level for All Children in Jemez Pueblo by Federal Poverty Level
All Native American Percent Native AmericanTotal population 1,958 1,930 98.6%Adult population 1,267 1,250 98.7%Population under 18 years 691 680 98.4%Percent under 18 years 35.3% 35.2% N/A0 to 2 years 84 84 100.0%3 to 4 years 73 71 97.3%5 to 9 years 215 212 98.6%10 to 14 years 193 193 100.0%15 to 17 years 126 120 95.2%
13.9%
15.2%
13.2%28.9%
5.1%
23.7%
100% - 129% 130% - 184%
185% - 199% Over 200%
Under 50% 50% - 99%

*The Census Bureau defines “linguistic isolation” as no family member older than 14 years old who speaks English well. Percentages are of linguistically isolated children where at least some members speak a non-English language.
19
JEMEZ PUEBLO
Jemez Pueblo New MexicoPercent of Native American children
living on the pueblo
Percent of all children (native and non-native)
living on the pueblo
Percent of all Native American children in New
Mexico
Percent of all children in
New Mexico
Economic SecurityPercent of children in poverty 27.5% 27.1% 39.2% 25.0%Percent of children with no parent working 37.5% 36.8% 23.6% 13.6%
EducationPercent of 3-4 year olds in preschool 83.1% 83.6% 50.2% 40.4%Percent of 18-24 year olds with a HS diploma or more 71.0% 70.7% 65.0% 70.5%Percent of 18-24 year olds enrolled in school 38.5% 38.7% 38.1% 41.8%
TeensPercent of 16-19 year olds not in school, military, or working 5.4% 5.3% 16.0% 11.9%Percent of 16-19 year olds not in school or HS graduate 5.4% 5.3% 13.6% 12.1%
DisabilityPercent of 5-17 year olds with a disability 2.7% 3.0% 6.1% 6.7%Percent of disabled 5-17 year olds living in poverty 85.7% 75.0% 37.8% 30.4%
LanguagePercent of children speaking a language other than English 89.7% 88.2% 43.4% 31.2%
Percent of those children speaking English "very well" 45.9% 45.9% 65.3% 67.5%Percent of linguistically isolated children* 21.3% 21.3% 8.7% 12.0%
HousingPercent of children living in owner occupied homes 91.7% 91.8% 65.2% 68.8%Percent of households with telephone access 67.6% 68.0% 71.2% 94.3%
20
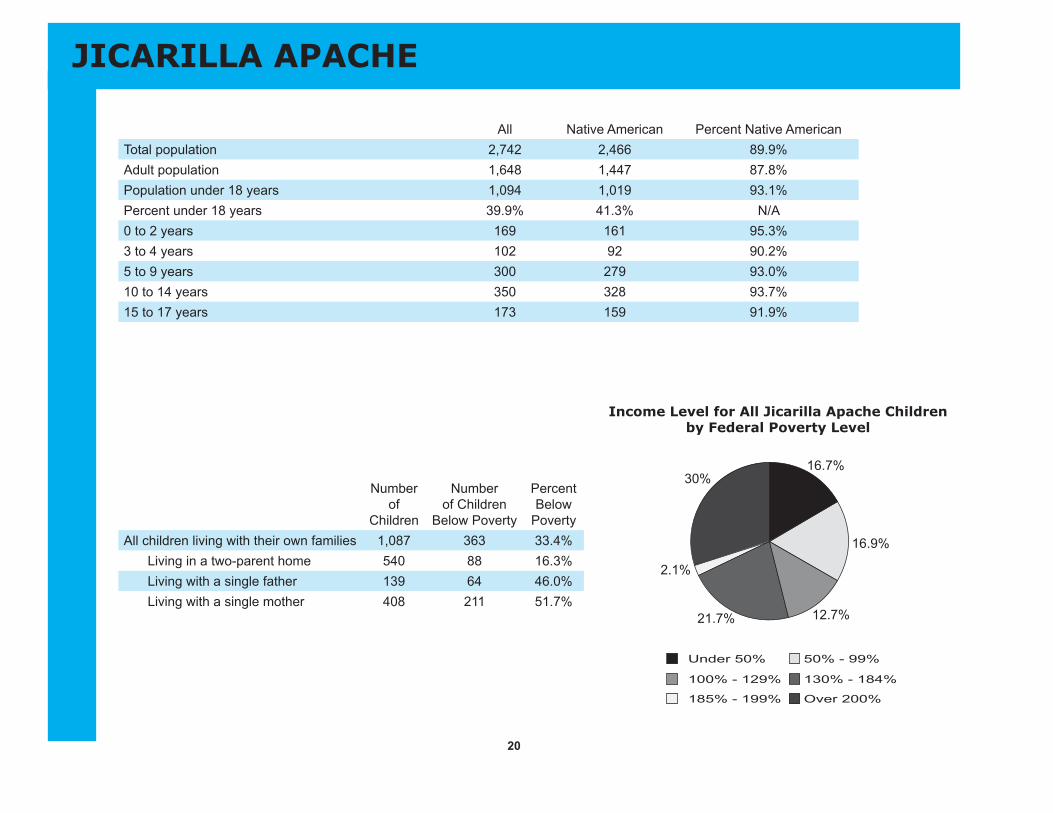
JICARILLA APACHE
16.9%
12.7%
16.7%30%
2.1%
21.7%
100% - 129% 130% - 184%
185% - 199% Over 200%
Under 50% 50% - 99%
Number of
Children
Number of Children
Below Poverty
Percent Below
PovertyAll children living with their own families 1,087 363 33.4%
Living in a two-parent home 540 88 16.3%Living with a single father 139 64 46.0%Living with a single mother 408 211 51.7%
Income Level for All Jicarilla Apache Childrenby Federal Poverty Level
All Native American Percent Native AmericanTotal population 2,742 2,466 89.9%Adult population 1,648 1,447 87.8%Population under 18 years 1,094 1,019 93.1%Percent under 18 years 39.9% 41.3% N/A0 to 2 years 169 161 95.3%3 to 4 years 102 92 90.2%5 to 9 years 300 279 93.0%10 to 14 years 350 328 93.7%15 to 17 years 173 159 91.9%

*The Census Bureau defines “linguistic isolation” as no family member older than 14 years old who speaks English well. Percentages are of linguistically isolated children where at least some members speak a non-English language.
21
JICARILLA APACHE
Jicarilla Pueblo New MexicoPercent of Native American children
living on the pueblo
Percent of all children (native and non-native)
living on the pueblo
Percent of all Native American children in New
Mexico
Percent of all children in
New Mexico
Economic SecurityPercent of children in poverty 32.9% 33.6% 39.2% 25.0%Percent of children with no parent working 25.2% 24.2% 23.6% 13.6%
EducationPercent of 3-4 year olds in preschool 79.3% 79.4% 50.2% 40.4%Percent of 18-24 year olds with a HS diploma or more 52.2% 54.3% 65.0% 70.5%Percent of 18-24 year olds enrolled in school 24.3% 23.8% 38.1% 41.8%
TeensPercent of 16-19 year olds not in school, military, or working 21.3% 20.8% 16.0% 11.9%Percent of 16-19 year olds not in school or HS graduate 17.5% 17.3% 13.6% 12.1%
DisabilityPercent of 5-17 year olds with a disability 1.2% 1.5% 6.1% 6.7%Percent of disabled 5-17 year olds living in poverty 44.4% 58.3% 37.8% 30.4%
LanguagePercent of children speaking a language other than English 8.5% 9.0% 43.4% 31.2%
Percent of those children speaking English "very well" 80.0% 82.4% 65.3% 67.5%Percent of linguistically isolated children* 0.4% 0.4% 8.7% 12.0%
HousingPercent of children living in owner occupied homes 63.1% 61.0% 65.2% 68.8%Percent of households with telephone access 69.7% 72.3% 71.2% 94.3%

22
LAGUNA PUEBLO
21.2%
14.0%
10.1%29.3%
4.0%
21.4%
100% - 129% 130% - 184%
185% - 199% Over 200%
Under 50% 50% - 99%
Number of
Children
Number of Children
Below Poverty
Percent Below
PovertyAll children living with their own families 1,259 394 31.3%
Living in a two-parent home 737 142 19.3%Living with a single father 133 78 58.6%Living with a single mother 389 174 44.7%
Income Level for All Children in Laguna Pueblo by Federal Poverty Level
All Native American Percent Native AmericanTotal population 3,814 3,733 97.9%Adult population 2,541 2,472 97.3%Population under 18 years 1,273 1,261 99.1%Percent under 18 years 33.4% 33.8% N/A0 to 2 years 180 172 95.6%3 to 4 years 136 136 100.0%5 to 9 years 435 435 100.0%10 to 14 years 312 308 98.7%15 to 17 years 210 210 100.0%
*The Census Bureau defines “linguistic isolation” as no family member older than 14 years old who speaks English well. Percentages are of linguistically isolated children where at least some members speak a non-English language.
23
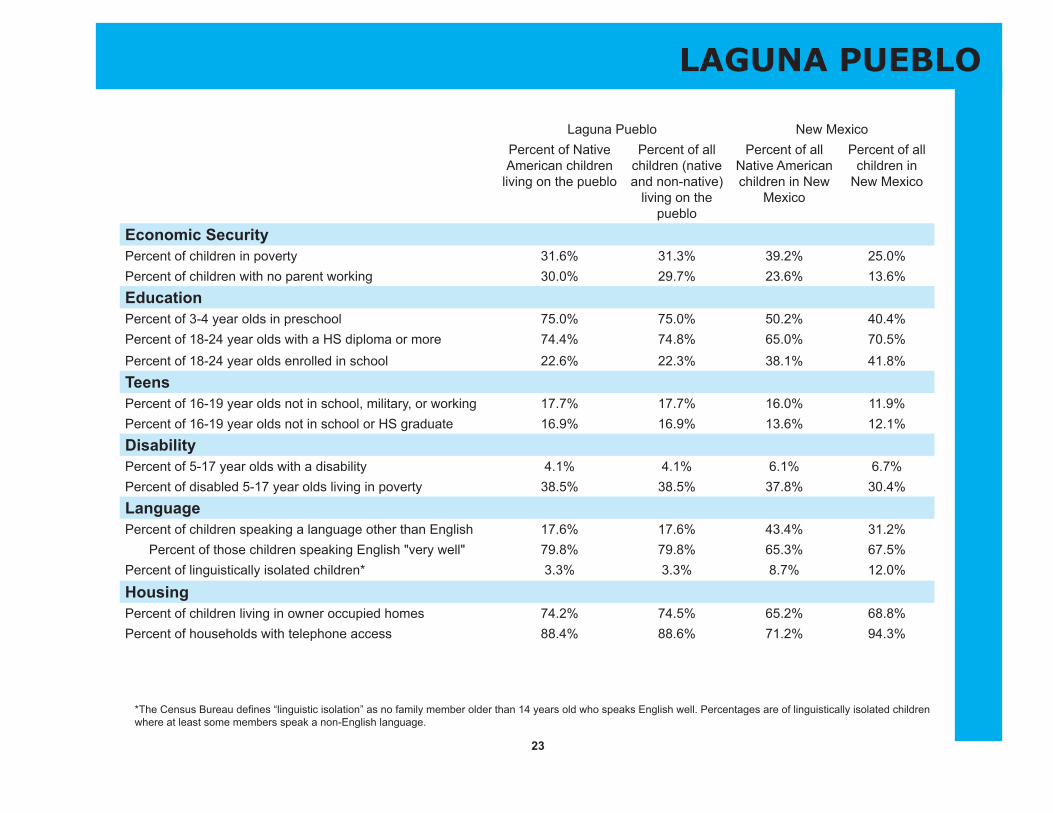
LAGUNA PUEBLO
Laguna Pueblo New MexicoPercent of Native American children
living on the pueblo
Percent of all children (native and non-native)
living on the pueblo
Percent of all Native American children in New
Mexico
Percent of all children in
New Mexico
Economic SecurityPercent of children in poverty 31.6% 31.3% 39.2% 25.0%Percent of children with no parent working 30.0% 29.7% 23.6% 13.6%
EducationPercent of 3-4 year olds in preschool 75.0% 75.0% 50.2% 40.4%Percent of 18-24 year olds with a HS diploma or more 74.4% 74.8% 65.0% 70.5%Percent of 18-24 year olds enrolled in school 22.6% 22.3% 38.1% 41.8%
TeensPercent of 16-19 year olds not in school, military, or working 17.7% 17.7% 16.0% 11.9%Percent of 16-19 year olds not in school or HS graduate 16.9% 16.9% 13.6% 12.1%
DisabilityPercent of 5-17 year olds with a disability 4.1% 4.1% 6.1% 6.7%Percent of disabled 5-17 year olds living in poverty 38.5% 38.5% 37.8% 30.4%
LanguagePercent of children speaking a language other than English 17.6% 17.6% 43.4% 31.2%
Percent of those children speaking English "very well" 79.8% 79.8% 65.3% 67.5%Percent of linguistically isolated children* 3.3% 3.3% 8.7% 12.0%
HousingPercent of children living in owner occupied homes 74.2% 74.5% 65.2% 68.8%Percent of households with telephone access 88.4% 88.6% 71.2% 94.3%

24
MESCALERO APACHE
Number of
Children
Number of Children
Below Poverty
Percent Below
PovertyAll children living with their own families 1,265 470 37.2%
Living in a two-parent home 594 152 25.6%Living with a single father 100 47 47.0%Living with a single mother 571 271 47.5%
Income Level for All Mescalero Apache Childrenby Federal Poverty Level
All Native American Percent Native AmericanTotal population 3,136 2,927 93.3%Adult population 1,817 1,653 91.0%Population under 18 years 1,319 1,274 96.6%Percent under 18 years 42.1% 43.5% N/A0 to 2 years 171 171 100.0%3 to 4 years 117 117 100.0%5 to 9 years 363 361 99.4%10 to 14 years 416 392 94.2%15 to 17 years 252 233 92.5%
19.6%
14.9%
18.8%26.5%
3.7%
16.4%
100% - 129% 130% - 184%
185% - 199% Over 200%
Under 50% 50% - 99%

*The Census Bureau defines “linguistic isolation” as no family member older than 14 years old who speaks English well. Percentages are of linguistically isolated children where at least some members speak a non-English language.
25
MESCALERO APACHE
Mescalero Pueblo New MexicoPercent of Native American children
living on the pueblo
Percent of all children (native and non-native)
living on the pueblo
Percent of all Native American children in New
Mexico
Percent of all children in
New Mexico
Economic SecurityPercent of children in poverty 39.1% 38.4% 39.2% 25.0%Percent of children with no parent working 29.6% 29.1% 23.6% 13.6%
EducationPercent of 3-4 year olds in preschool 69.2% 69.2% 50.2% 40.4%Percent of 18-24 year olds with a HS diploma or more 51.1% 50.7% 65.0% 70.5%Percent of 18-24 year olds enrolled in school 23.4% 22.8% 38.1% 41.8%
TeensPercent of 16-19 year olds not in school, military, or working 16.4% 15.7% 16.0% 11.9%Percent of 16-19 year olds not in school or HS graduate 17.5% 16.7% 13.6% 12.1%
DisabilityPercent of 5-17 year olds with a disability 3.7% 3.6% 6.1% 6.7%Percent of disabled 5-17 year olds living in poverty 36.1% 36.1% 37.8% 30.4%
LanguagePercent of children speaking a language other than English 21.6% 21.2% 43.4% 31.2%
Percent of those children speaking English "very well" 77.9% 75.8% 65.3% 67.5%Percent of linguistically isolated children* 4.5% 4.3% 8.7% 12.0%
HousingPercent of children living in owner occupied homes 51.5% 52.7% 65.2% 68.8%Percent of households with telephone access 71.1% 72.6% 71.2% 94.3%

26
NAMBE PUEBLO
6.3% 4.8%
17.6%48.6%
4.8%
18.0%
100% - 129% 130% - 184%
185% - 199% Over 200%
Under 50% 50% - 99%
Number of
Children
Number of Children
Below Poverty
Percent Below
PovertyAll children living with their own families 461 51 11.1%
Living in a two-parent home 277 16 5.8%Living with a single father 54 10 18.5%Living with a single mother 130 25 19.2%
Income Level for All Children in Nambe Pueblo by Federal Poverty Level
All Native American Percent Native AmericanTotal population 1,757 521 29.7%Adult population 1,293 339 26.2%Population under 18 years 464 182 39.2%Percent under 18 years 26.4% 34.9% N/A0 to 2 years 42 30 71.4%3 to 4 years 80 24 30.0%5 to 9 years 124 42 33.9%10 to 14 years 151 58 38.4%15 to 17 years 67 28 41.8%
*The Census Bureau defines “linguistic isolation” as no family member older than 14 years old who speaks English well. Percentages are of linguistically isolated children where at least some members speak a non-English language.
27
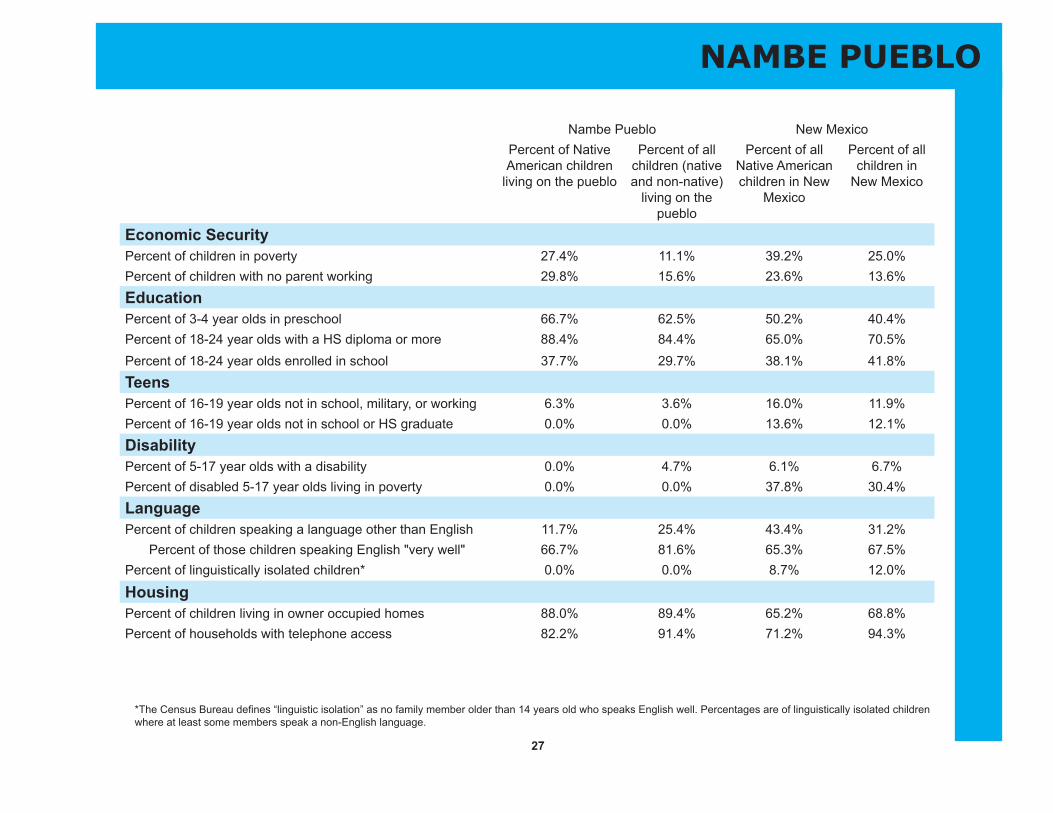
NAMBE PUEBLO
Nambe Pueblo New MexicoPercent of Native American children
living on the pueblo
Percent of all children (native and non-native)
living on the pueblo
Percent of all Native American children in New
Mexico
Percent of all children in
New Mexico
Economic SecurityPercent of children in poverty 27.4% 11.1% 39.2% 25.0%Percent of children with no parent working 29.8% 15.6% 23.6% 13.6%
EducationPercent of 3-4 year olds in preschool 66.7% 62.5% 50.2% 40.4%Percent of 18-24 year olds with a HS diploma or more 88.4% 84.4% 65.0% 70.5%Percent of 18-24 year olds enrolled in school 37.7% 29.7% 38.1% 41.8%
TeensPercent of 16-19 year olds not in school, military, or working 6.3% 3.6% 16.0% 11.9%Percent of 16-19 year olds not in school or HS graduate 0.0% 0.0% 13.6% 12.1%
DisabilityPercent of 5-17 year olds with a disability 0.0% 4.7% 6.1% 6.7%Percent of disabled 5-17 year olds living in poverty 0.0% 0.0% 37.8% 30.4%
LanguagePercent of children speaking a language other than English 11.7% 25.4% 43.4% 31.2%
Percent of those children speaking English "very well" 66.7% 81.6% 65.3% 67.5%Percent of linguistically isolated children* 0.0% 0.0% 8.7% 12.0%
HousingPercent of children living in owner occupied homes 88.0% 89.4% 65.2% 68.8%Percent of households with telephone access 82.2% 91.4% 71.2% 94.3%

28
NAVAJO NATION - NEW MEXICO
Number of
Children
Number of Children
Below Poverty
Percent Below
PovertyAll children living with their own families 28,078 13,175 46.9%
Living in a two-parent home 17,592 6,846 38.9%Living with a single father 2,193 1,181 53.9%Living with a single mother 8,293 5,148 62.1%
Income Level for All Children in Navajo Nation -New Mexico by Federal Poverty Level
All Native American Percent Native AmericanTotal population 70,076 68,291 97.5%Adult population 41,853 40,521 96.8%Population under 18 years 28,223 27,770 98.4%Percent under 18 years 40.3% 40.7% N/A0 to 2 years 4,028 3,955 98.2%3 to 4 years 2,595 2,530 97.5%5 to 9 years 8,492 8,335 98.2%10 to 14 years 8,413 8,324 98.9%15 to 17 years 4,695 4,626 98.5%
3.4%
18.2%
22.6%20.4%
11.0%
24.4%
100% - 129% 130% - 184%
185% - 199% Over 200%
Under 50% 50% - 99%

*The Census Bureau defines “linguistic isolation” as no family member older than 14 years old who speaks English well. Percentages are of linguistically isolated children where at least some members speak a non-English language.
29
NAVAJO NATION - NEW MEXICO
Navajo Nation New MexicoPercent of Native American children
living on the Navajo Nation in NM
Percent of all Navajo children
in NM (living on and off tribal
land)
Percent of all Native American children in New
Mexico
Percent of all children in
New Mexico
Economic SecurityPercent of children in poverty 47.3% 47.0% 39.2% 25.0%Percent of children with no parent working 28.0% 27.9% 23.6% 13.6%
EducationPercent of 3-4 year olds in preschool 49.7% 48.9% 50.2% 40.4%Percent of 18-24 year olds with a HS diploma or more 58.0% 58.5% 65.0% 70.5%Percent of 18-24 year olds enrolled in school 36.8% 36.5% 38.1% 41.8%
TeensPercent of 16-19 year olds not in school, military, or working 18.2% 18.0% 16.0% 11.9%Percent of 16-19 year olds not in school or HS graduate 13.6% 13.4% 13.6% 12.1%
DisabilityPercent of 5-17 year olds with a disability 5.6% 5.6% 6.1% 6.7%Percent of disabled 5-17 year olds living in poverty 43.8% 43.4% 37.8% 30.4%
LanguagePercent of children speaking a language other than English 51.4% 50.9% 43.4% 31.2%
Percent of those children speaking English "very well" 61.1% 61.0% 65.3% 67.5%Percent of linguistically isolated children* 10.8% 10.8% 8.7% 12.0%
HousingPercent of children living in owner occupied homes 80.8% 74.1% 65.2% 68.8%Percent of households with telephone access 43.5% 45.2% 71.2% 94.3%

30
NAVAJO NATION - ALAMO
Number of
Children
Number of Children
Below Poverty
Percent Below
PovertyAll children living with their own families 900 509 56.6%
Living in a two-parent home 589 274 46.5%Living with a single father 48 35 72.9%Living with a single mother 263 200 76.0%
Income Level for All Children in Navajo Nation -Alamo by Federal Poverty Level
All Native American Percent Native AmericanTotal population 2,163 2,108 97.5%Adult population 1,263 1,237 97.9%Population under 18 years 900 871 96.8%Percent under 18 years 41.6% 41.3% N/A0 to 2 years 124 124 100.0%3 to 4 years 75 75 100.0%5 to 9 years 246 237 96.3%10 to 14 years 275 273 99.3%15 to 17 years 180 162 90.0%
30.2%0.4%
17.8%
16.7%
8.6%26.3%
100% - 129% 130% - 184%
185% - 199% Over 200%
Under 50% 50% - 99%
*The Census Bureau defines “linguistic isolation” as no family member older than 14 years old who speaks English well. Percentages are of linguistically isolated children where at least some members speak a non-English language.
31
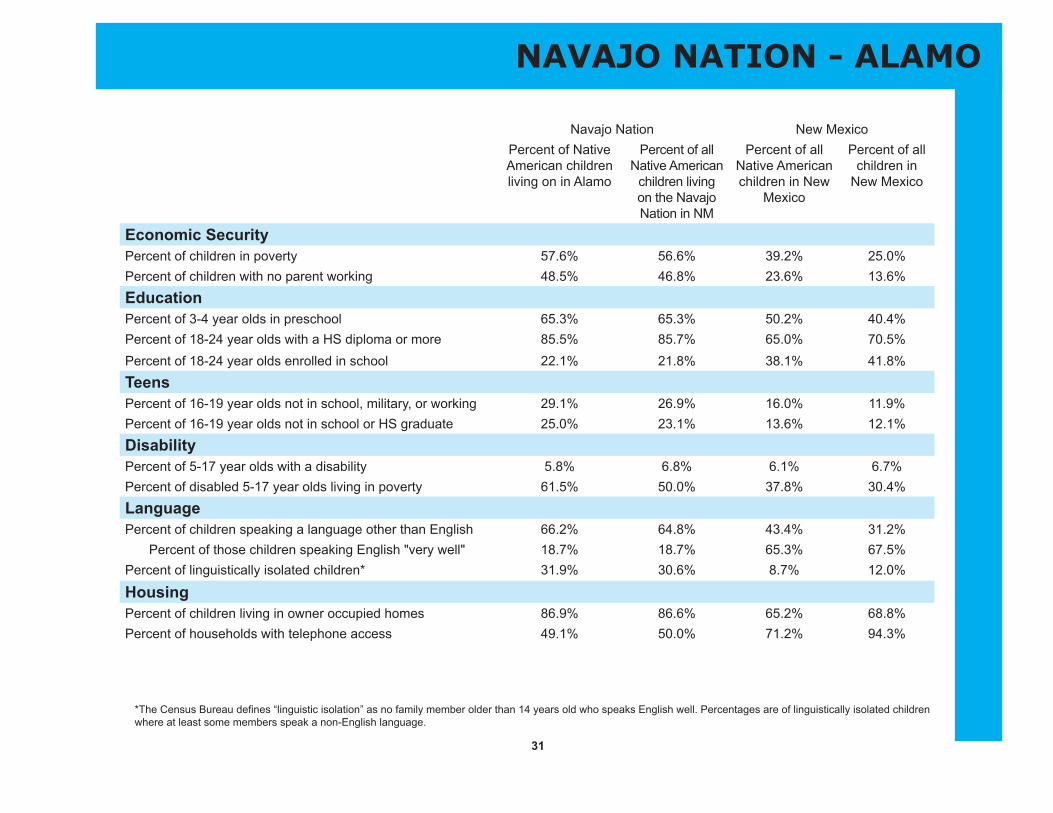
NAVAJO NATION - ALAMO
Navajo Nation New MexicoPercent of Native American children living on in Alamo
Percent of all Native American
children living on the Navajo Nation in NM
Percent of all Native American children in New
Mexico
Percent of all children in
New Mexico
Economic SecurityPercent of children in poverty 57.6% 56.6% 39.2% 25.0%Percent of children with no parent working 48.5% 46.8% 23.6% 13.6%
EducationPercent of 3-4 year olds in preschool 65.3% 65.3% 50.2% 40.4%Percent of 18-24 year olds with a HS diploma or more 85.5% 85.7% 65.0% 70.5%Percent of 18-24 year olds enrolled in school 22.1% 21.8% 38.1% 41.8%
TeensPercent of 16-19 year olds not in school, military, or working 29.1% 26.9% 16.0% 11.9%Percent of 16-19 year olds not in school or HS graduate 25.0% 23.1% 13.6% 12.1%
DisabilityPercent of 5-17 year olds with a disability 5.8% 6.8% 6.1% 6.7%Percent of disabled 5-17 year olds living in poverty 61.5% 50.0% 37.8% 30.4%
LanguagePercent of children speaking a language other than English 66.2% 64.8% 43.4% 31.2%
Percent of those children speaking English "very well" 18.7% 18.7% 65.3% 67.5%Percent of linguistically isolated children* 31.9% 30.6% 8.7% 12.0%
HousingPercent of children living in owner occupied homes 86.9% 86.6% 65.2% 68.8%Percent of households with telephone access 49.1% 50.0% 71.2% 94.3%
32
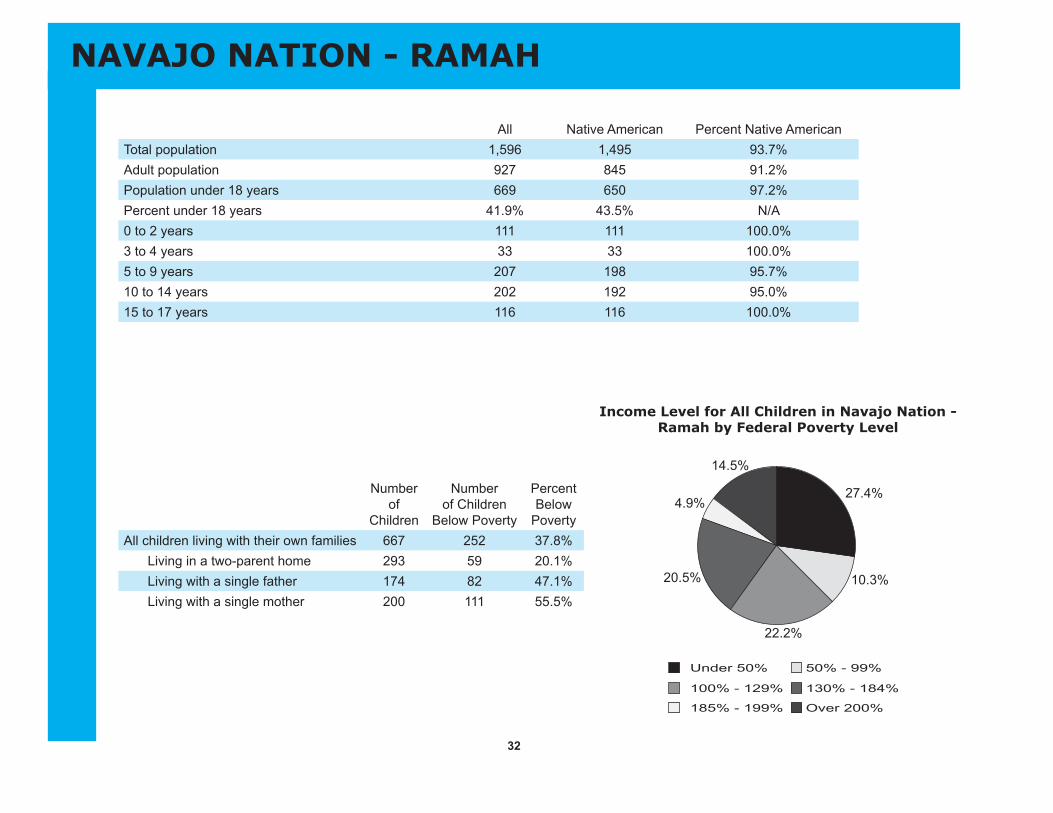
NAVAJO NATION - RAMAH
Number of
Children
Number of Children
Below Poverty
Percent Below
PovertyAll children living with their own families 667 252 37.8%
Living in a two-parent home 293 59 20.1%Living with a single father 174 82 47.1%Living with a single mother 200 111 55.5%
Income Level for All Children in Navajo Nation - Ramah by Federal Poverty Level
All Native American Percent Native AmericanTotal population 1,596 1,495 93.7%Adult population 927 845 91.2%Population under 18 years 669 650 97.2%Percent under 18 years 41.9% 43.5% N/A0 to 2 years 111 111 100.0%3 to 4 years 33 33 100.0%5 to 9 years 207 198 95.7%10 to 14 years 202 192 95.0%15 to 17 years 116 116 100.0%
27.4%4.9%
14.5%
20.5%
22.2%
10.3%
100% - 129% 130% - 184%
185% - 199% Over 200%
Under 50% 50% - 99%
*The Census Bureau defines “linguistic isolation” as no family member older than 14 years old who speaks English well. Percentages are of linguistically isolated children where at least some members speak a non-English language.
33
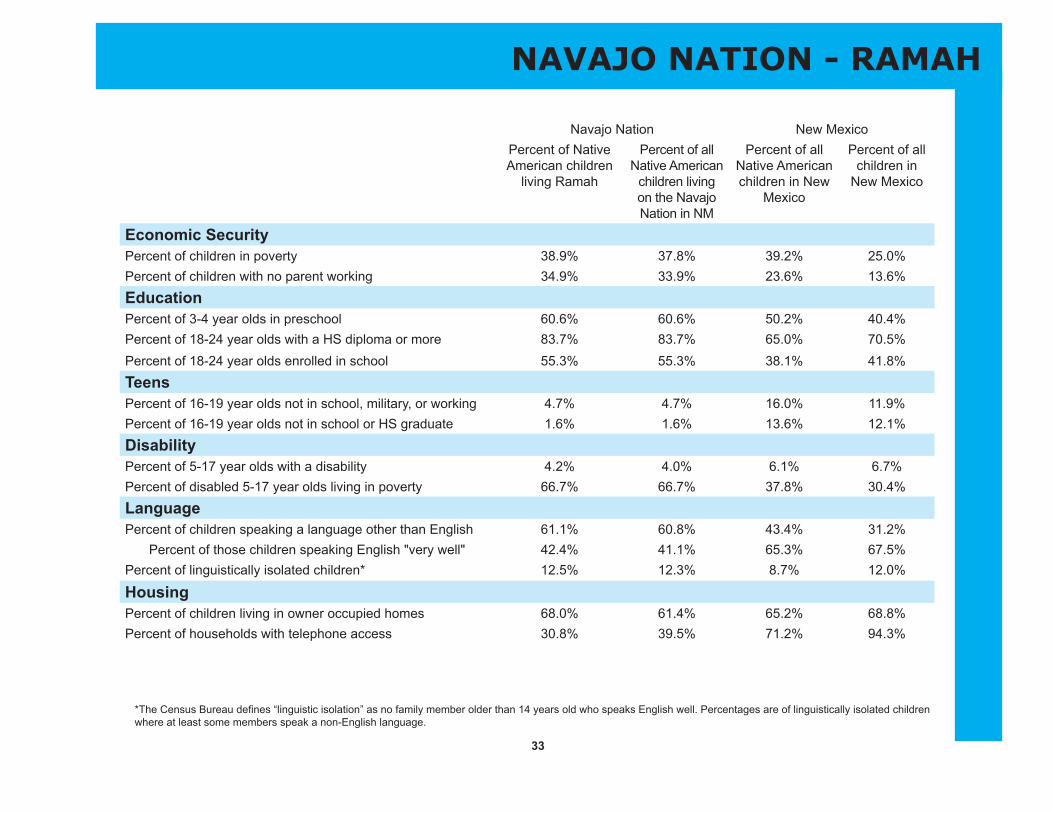
NAVAJO NATION - RAMAH
Navajo Nation New MexicoPercent of Native American children
living Ramah
Percent of all Native American
children living on the Navajo Nation in NM
Percent of all Native American children in New
Mexico
Percent of all children in
New Mexico
Economic SecurityPercent of children in poverty 38.9% 37.8% 39.2% 25.0%Percent of children with no parent working 34.9% 33.9% 23.6% 13.6%
EducationPercent of 3-4 year olds in preschool 60.6% 60.6% 50.2% 40.4%Percent of 18-24 year olds with a HS diploma or more 83.7% 83.7% 65.0% 70.5%Percent of 18-24 year olds enrolled in school 55.3% 55.3% 38.1% 41.8%
TeensPercent of 16-19 year olds not in school, military, or working 4.7% 4.7% 16.0% 11.9%Percent of 16-19 year olds not in school or HS graduate 1.6% 1.6% 13.6% 12.1%
DisabilityPercent of 5-17 year olds with a disability 4.2% 4.0% 6.1% 6.7%Percent of disabled 5-17 year olds living in poverty 66.7% 66.7% 37.8% 30.4%
LanguagePercent of children speaking a language other than English 61.1% 60.8% 43.4% 31.2%
Percent of those children speaking English "very well" 42.4% 41.1% 65.3% 67.5%Percent of linguistically isolated children* 12.5% 12.3% 8.7% 12.0%
HousingPercent of children living in owner occupied homes 68.0% 61.4% 65.2% 68.8%Percent of households with telephone access 30.8% 39.5% 71.2% 94.3%
34
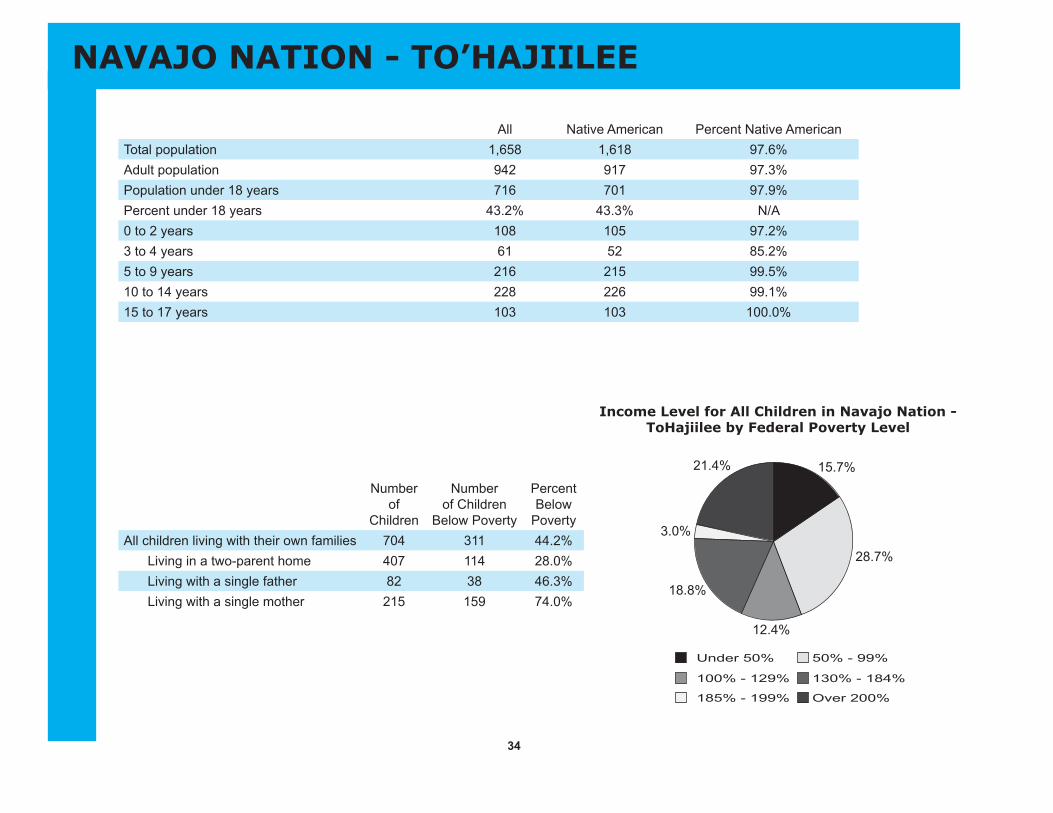
NAVAJO NATION - TO’HAJIILEE
Number of
Children
Number of Children
Below Poverty
Percent Below
PovertyAll children living with their own families 704 311 44.2%
Living in a two-parent home 407 114 28.0%Living with a single father 82 38 46.3%Living with a single mother 215 159 74.0%
Income Level for All Children in Navajo Nation - ToHajiilee by Federal Poverty Level
All Native American Percent Native AmericanTotal population 1,658 1,618 97.6%Adult population 942 917 97.3%Population under 18 years 716 701 97.9%Percent under 18 years 43.2% 43.3% N/A0 to 2 years 108 105 97.2%3 to 4 years 61 52 85.2%5 to 9 years 216 215 99.5%10 to 14 years 228 226 99.1%15 to 17 years 103 103 100.0%
15.7%
3.0%
21.4%
18.8%
12.4%
28.7%
100% - 129% 130% - 184%
185% - 199% Over 200%
Under 50% 50% - 99%
*The Census Bureau defines “linguistic isolation” as no family member older than 14 years old who speaks English well. Percentages are of linguistically isolated children where at least some members speak a non-English language.
35
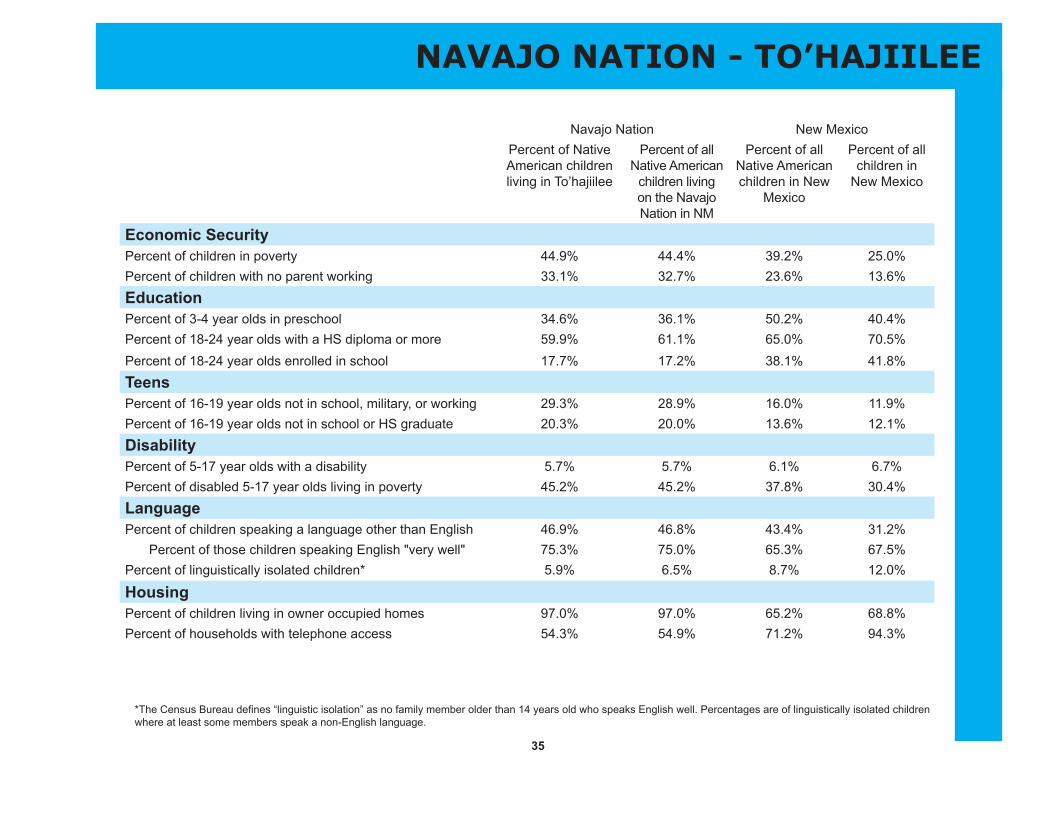
NAVAJO NATION - TO’HAJIILEE
Navajo Nation New MexicoPercent of Native American children living in To’hajiilee
Percent of all Native American
children living on the Navajo Nation in NM
Percent of all Native American children in New
Mexico
Percent of all children in
New Mexico
Economic SecurityPercent of children in poverty 44.9% 44.4% 39.2% 25.0%Percent of children with no parent working 33.1% 32.7% 23.6% 13.6%
EducationPercent of 3-4 year olds in preschool 34.6% 36.1% 50.2% 40.4%Percent of 18-24 year olds with a HS diploma or more 59.9% 61.1% 65.0% 70.5%Percent of 18-24 year olds enrolled in school 17.7% 17.2% 38.1% 41.8%
TeensPercent of 16-19 year olds not in school, military, or working 29.3% 28.9% 16.0% 11.9%Percent of 16-19 year olds not in school or HS graduate 20.3% 20.0% 13.6% 12.1%
DisabilityPercent of 5-17 year olds with a disability 5.7% 5.7% 6.1% 6.7%Percent of disabled 5-17 year olds living in poverty 45.2% 45.2% 37.8% 30.4%
LanguagePercent of children speaking a language other than English 46.9% 46.8% 43.4% 31.2%
Percent of those children speaking English "very well" 75.3% 75.0% 65.3% 67.5%Percent of linguistically isolated children* 5.9% 6.5% 8.7% 12.0%
HousingPercent of children living in owner occupied homes 97.0% 97.0% 65.2% 68.8%Percent of households with telephone access 54.3% 54.9% 71.2% 94.3%
36
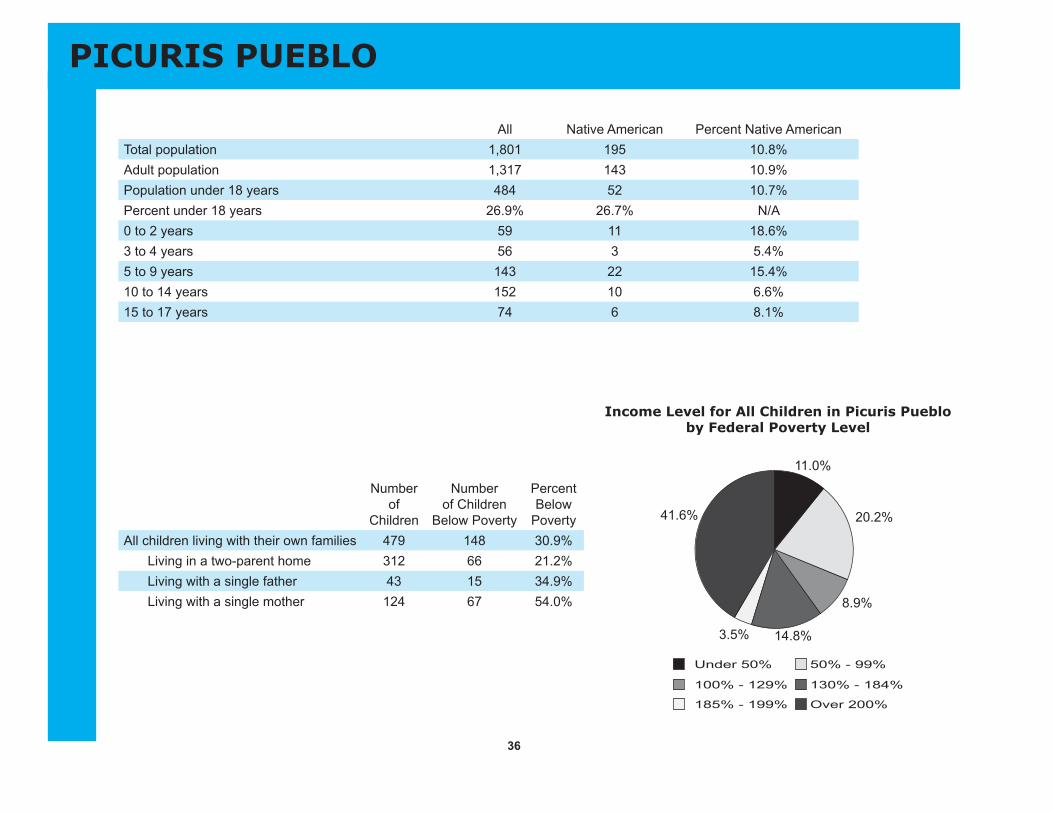
PICURIS PUEBLO
Number of
Children
Number of Children
Below Poverty
Percent Below
PovertyAll children living with their own families 479 148 30.9%
Living in a two-parent home 312 66 21.2%Living with a single father 43 15 34.9%Living with a single mother 124 67 54.0%
Income Level for All Children in Picuris Pueblo by Federal Poverty Level
All Native American Percent Native AmericanTotal population 1,801 195 10.8%Adult population 1,317 143 10.9%Population under 18 years 484 52 10.7%Percent under 18 years 26.9% 26.7% N/A0 to 2 years 59 11 18.6%3 to 4 years 56 3 5.4%5 to 9 years 143 22 15.4%10 to 14 years 152 10 6.6%15 to 17 years 74 6 8.1%
11.0%
3.5%
41.6%
14.8%
8.9%
20.2%
100% - 129% 130% - 184%
185% - 199% Over 200%
Under 50% 50% - 99%

*The Census Bureau defines “linguistic isolation” as no family member older than 14 years old who speaks English well. Percentages are of linguistically isolated children where at least some members speak a non-English language.
37
PICURIS PUEBLO
Picuris Pueblo New MexicoPercent of Native American children
living on the Picuris pueblo
Percent of all children (native and non-native)
living on the pueblo
Percent of all Native American children in New
Mexico
Percent of all children in
New Mexico
Economic SecurityPercent of children in poverty 34.7% 31.2% 39.2% 25.0%Percent of children with no parent working 4.5% 18.0% 23.6% 13.6%
EducationPercent of 3-4 year olds in preschool 100.0% 19.6% 50.2% 40.4%Percent of 18-24 year olds with a HS diploma or more 100.0% 73.2% 65.0% 70.5%Percent of 18-24 year olds enrolled in school 16.7% 44.9% 38.1% 41.8%
TeensPercent of 16-19 year olds not in school, military, or working 0.0% 7.4% 16.0% 11.9%Percent of 16-19 year olds not in school or HS graduate 0.0% 12.6% 13.6% 12.1%
DisabilityPercent of 5-17 year olds with a disability 0.0% 4.1% 6.1% 6.7%Percent of disabled 5-17 year olds living in poverty 0.0% 20.0% 37.8% 30.4%
LanguagePercent of children speaking a language other than English 28.9% 51.2% 43.4% 31.2%
Percent of those children speaking English "very well" 100.0% 83.6% 65.3% 67.5%Percent of linguistically isolated children* 0.0% 2.8% 8.7% 12.0%
HousingPercent of children living in owner occupied homes 63.6% 77.7% 65.2% 68.8%Percent of households with telephone access 78.9% 88.2% 71.2% 94.3%
38
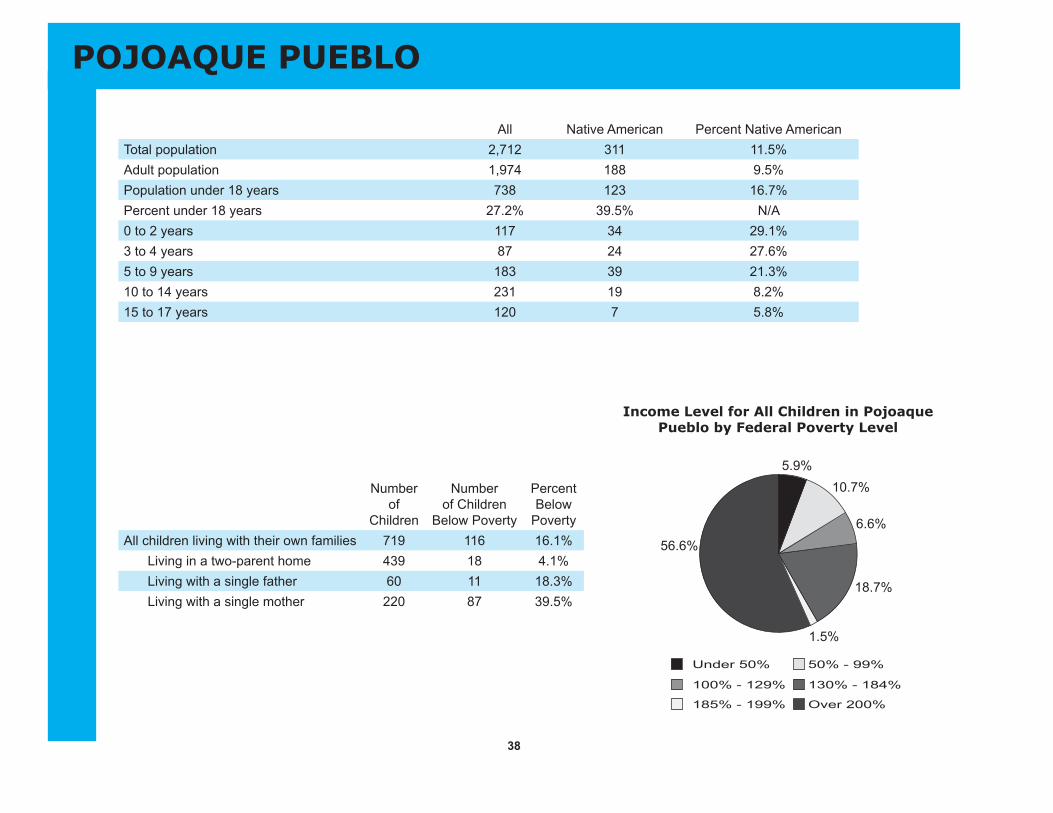
POJOAQUE PUEBLO
5.9%
1.5%
56.6%
18.7%
6.6%
10.7%
100% - 129% 130% - 184%
185% - 199% Over 200%
Under 50% 50% - 99%
Number of
Children
Number of Children
Below Poverty
Percent Below
PovertyAll children living with their own families 719 116 16.1%
Living in a two-parent home 439 18 4.1%Living with a single father 60 11 18.3%Living with a single mother 220 87 39.5%
Income Level for All Children in Pojoaque Pueblo by Federal Poverty Level
All Native American Percent Native AmericanTotal population 2,712 311 11.5%Adult population 1,974 188 9.5%Population under 18 years 738 123 16.7%Percent under 18 years 27.2% 39.5% N/A0 to 2 years 117 34 29.1%3 to 4 years 87 24 27.6%5 to 9 years 183 39 21.3%10 to 14 years 231 19 8.2%15 to 17 years 120 7 5.8%

*The Census Bureau defines “linguistic isolation” as no family member older than 14 years old who speaks English well. Percentages are of linguistically isolated children where at least some members speak a non-English language.
39
POJOAQUE PUEBLO
Pojoaque Pueblo New MexicoPercent of Native American children
living on the pueblo
Percent of all children (native and non-native)
living on the pueblo
Percent of all Native American children in New
Mexico
Percent of all children in
New Mexico
Economic SecurityPercent of children in poverty 47.9% 16.6% 39.2% 25.0%Percent of children with no parent working 41.7% 11.5% 23.6% 13.6%
EducationPercent of 3-4 year olds in preschool 16.7% 32.2% 50.2% 40.4%Percent of 18-24 year olds with a HS diploma or more 21.6% 53.6% 65.0% 70.5%Percent of 18-24 year olds enrolled in school 35.3% 45.9% 38.1% 41.8%
TeensPercent of 16-19 year olds not in school, military, or working 0.0% 9.7% 16.0% 11.9%Percent of 16-19 year olds not in school or HS graduate 0.0% 12.0% 13.6% 12.1%
DisabilityPercent of 5-17 year olds with a disability 0.0% 5.3% 6.1% 6.7%Percent of disabled 5-17 year olds living in poverty 0.0% 14.3% 37.8% 30.4%
LanguagePercent of children speaking a language other than English 52.3% 42.7% 43.4% 31.2%
Percent of those children speaking English "very well" 85.3% 82.5% 65.3% 67.5%Percent of linguistically isolated children* 0.0% 5.9% 8.7% 12.0%
HousingPercent of children living in owner occupied homes 64.2% 74.0% 65.2% 68.8%Percent of households with telephone access 91.9% 96.6% 71.2% 94.3%
40
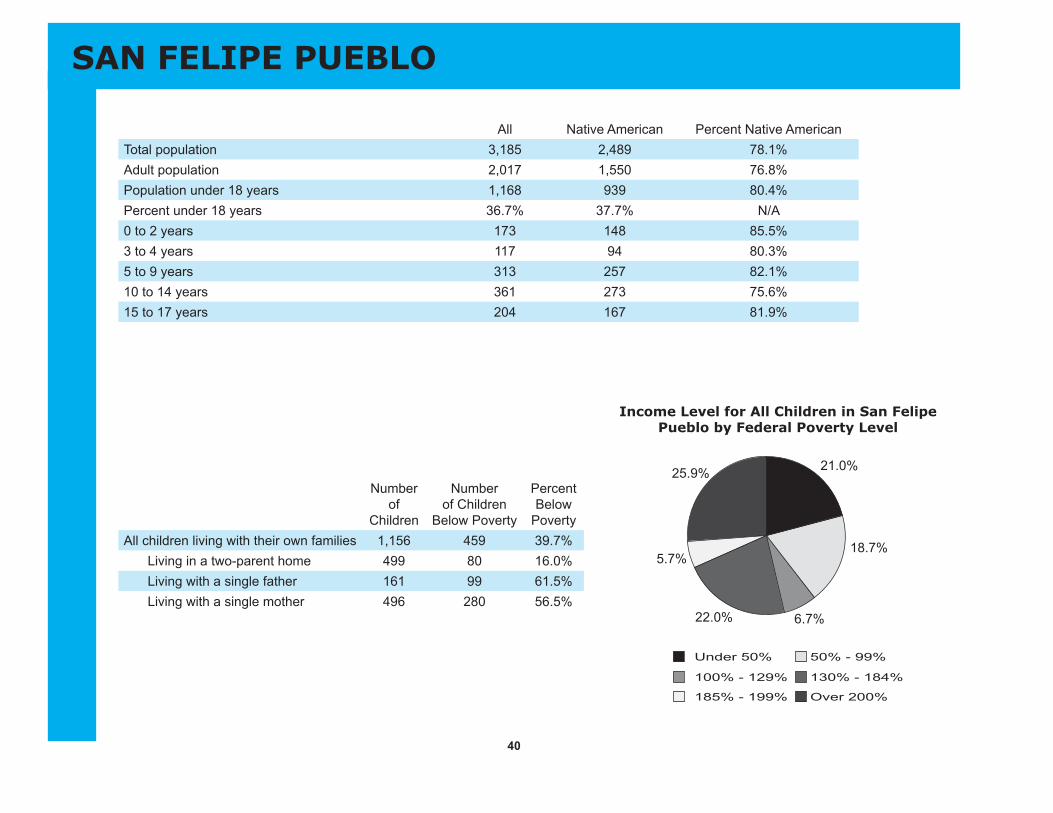
SAN FELIPE PUEBLO
Number of
Children
Number of Children
Below Poverty
Percent Below
PovertyAll children living with their own families 1,156 459 39.7%
Living in a two-parent home 499 80 16.0%Living with a single father 161 99 61.5%Living with a single mother 496 280 56.5%
Income Level for All Children in San Felipe Pueblo by Federal Poverty Level
All Native American Percent Native AmericanTotal population 3,185 2,489 78.1%Adult population 2,017 1,550 76.8%Population under 18 years 1,168 939 80.4%Percent under 18 years 36.7% 37.7% N/A0 to 2 years 173 148 85.5%3 to 4 years 117 94 80.3%5 to 9 years 313 257 82.1%10 to 14 years 361 273 75.6%15 to 17 years 204 167 81.9%
21.0%
5.7%
25.9%
22.0% 6.7%
18.7%
100% - 129% 130% - 184%
185% - 199% Over 200%
Under 50% 50% - 99%

*The Census Bureau defines “linguistic isolation” as no family member older than 14 years old who speaks English well. Percentages are of linguistically isolated children where at least some members speak a non-English language.
41
SAN FELIPE PUEBLO
San Felipe Pueblo New MexicoPercent of Native American children
living on the pueblo
Percent of all children (native and non-native)
living on the pueblo
Percent of all Native American children in New
Mexico
Percent of all children in
New Mexico
Economic SecurityPercent of children in poverty 47.1% 39.7% 39.2% 25.0%Percent of children with no parent working 71.9% 59.5% 23.6% 13.6%
EducationPercent of 3-4 year olds in preschool 76.6% 73.5% 50.2% 40.4%Percent of 18-24 year olds with a HS diploma or more 53.3% 54.1% 65.0% 70.5%Percent of 18-24 year olds enrolled in school 7.8% 11.7% 38.1% 41.8%
TeensPercent of 16-19 year olds not in school, military, or working 40.5% 38.0% 16.0% 11.9%Percent of 16-19 year olds not in school or HS graduate 33.5% 33.8% 13.6% 12.1%
DisabilityPercent of 5-17 year olds with a disability 4.5% 5.7% 6.1% 6.7%Percent of disabled 5-17 year olds living in poverty 45.2% 38.0% 37.8% 30.4%
LanguagePercent of children speaking a language other than English 94.8% 82.3% 43.4% 31.2%
Percent of those children speaking English "very well" 52.2% 56.3% 65.3% 67.5%Percent of linguistically isolated children* 23.2% 19.9% 8.7% 12.0%
HousingPercent of children living in owner occupied homes 97.2% 96.1% 65.2% 68.8%Percent of households with telephone access 66.6% 77.0% 71.2% 94.3%
42
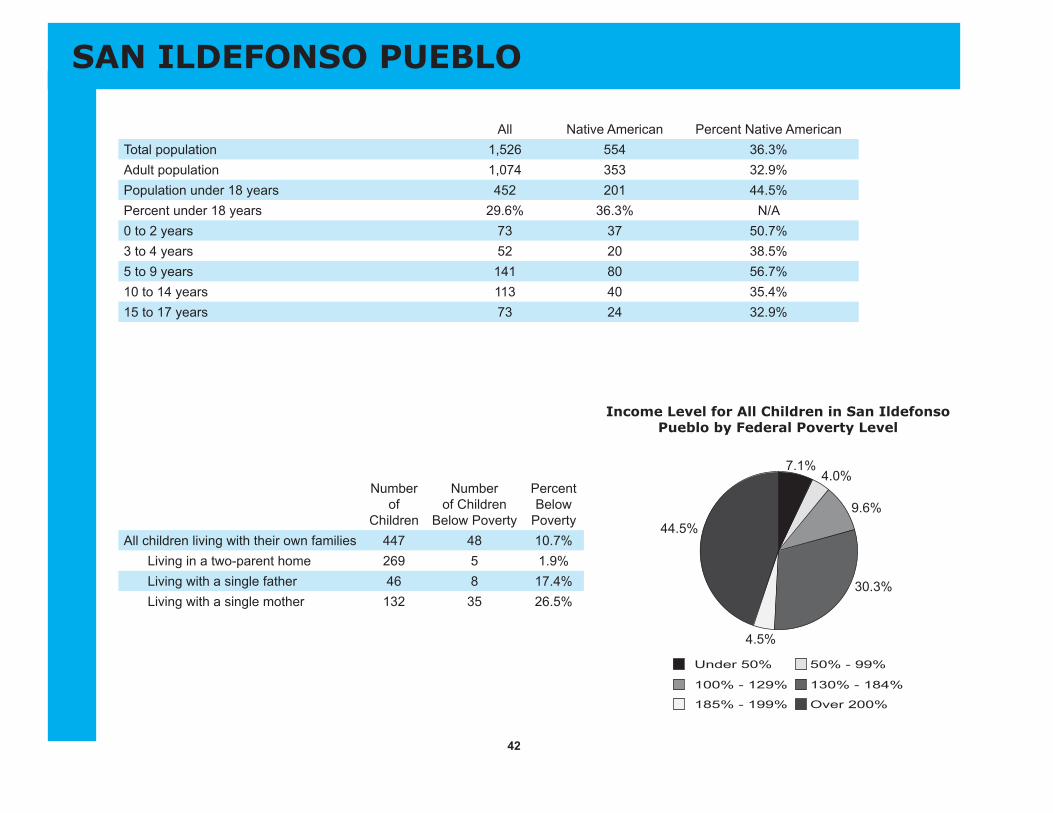
SAN ILDEFONSO PUEBLO
Number of
Children
Number of Children
Below Poverty
Percent Below
PovertyAll children living with their own families 447 48 10.7%
Living in a two-parent home 269 5 1.9%Living with a single father 46 8 17.4%Living with a single mother 132 35 26.5%
Income Level for All Children in San Ildefonso Pueblo by Federal Poverty Level
All Native American Percent Native AmericanTotal population 1,526 554 36.3%Adult population 1,074 353 32.9%Population under 18 years 452 201 44.5%Percent under 18 years 29.6% 36.3% N/A0 to 2 years 73 37 50.7%3 to 4 years 52 20 38.5%5 to 9 years 141 80 56.7%10 to 14 years 113 40 35.4%15 to 17 years 73 24 32.9%
7.1%
4.5%
44.5%
30.3%
9.6%
4.0%
100% - 129% 130% - 184%
185% - 199% Over 200%
Under 50% 50% - 99%

*The Census Bureau defines “linguistic isolation” as no family member older than 14 years old who speaks English well. Percentages are of linguistically isolated children where at least some members speak a non-English language.
43
SAN ILDEFONSO PUEBLO
San Ildefonso Pueblo New MexicoPercent of Native American children
living on the pueblo
Percent of all children (native and non-native)
living on the pueblo
Percent of all Native American children in New
Mexico
Percent of all children in
New Mexico
Economic SecurityPercent of children in poverty 15.2% 11.1% 39.2% 25.0%Percent of children with no parent working 4.7% 12.7% 23.6% 13.6%
EducationPercent of 3-4 year olds in preschool 35.0% 44.2% 50.2% 40.4%Percent of 18-24 year olds with a HS diploma or more 77.4% 82.8% 65.0% 70.5%Percent of 18-24 year olds enrolled in school 39.6% 42.2% 38.1% 41.8%
TeensPercent of 16-19 year olds not in school, military, or working 0.0% 0.0% 16.0% 11.9%Percent of 16-19 year olds not in school or HS graduate 0.0% 0.0% 13.6% 12.1%
DisabilityPercent of 5-17 year olds with a disability 7.8% 3.4% 6.1% 6.7%Percent of disabled 5-17 year olds living in poverty 18.2% 18.2% 37.8% 30.4%
LanguagePercent of children speaking a language other than English 38.9% 40.1% 43.4% 31.2%
Percent of those children speaking English "very well" 85.7% 82.4% 65.3% 67.5%Percent of linguistically isolated children* 0.0% 3.2% 8.7% 12.0%
HousingPercent of children living in owner occupied homes 56.0% 71.3% 65.2% 68.8%Percent of households with telephone access 82.8% 91.4% 71.2% 94.3%
44
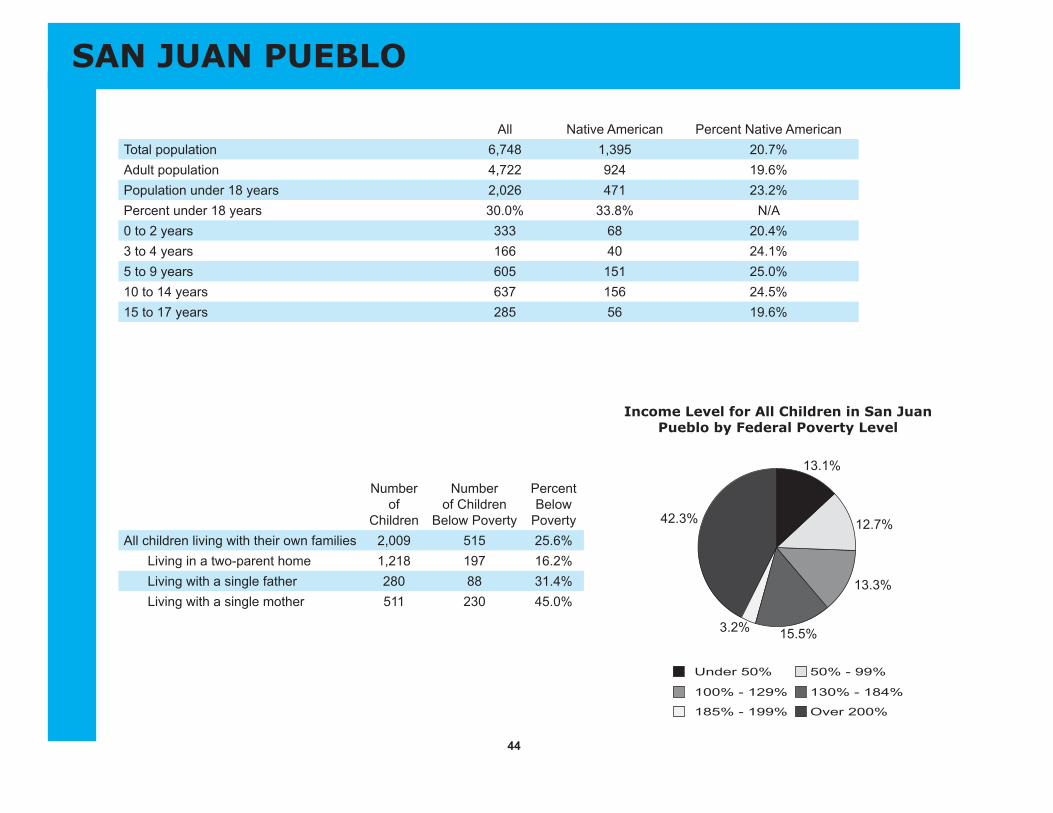
SAN JUAN PUEBLO
Number of
Children
Number of Children
Below Poverty
Percent Below
PovertyAll children living with their own families 2,009 515 25.6%
Living in a two-parent home 1,218 197 16.2%Living with a single father 280 88 31.4%Living with a single mother 511 230 45.0%
Income Level for All Children in San Juan Pueblo by Federal Poverty Level
All Native American Percent Native AmericanTotal population 6,748 1,395 20.7%Adult population 4,722 924 19.6%Population under 18 years 2,026 471 23.2%Percent under 18 years 30.0% 33.8% N/A0 to 2 years 333 68 20.4%3 to 4 years 166 40 24.1%5 to 9 years 605 151 25.0%10 to 14 years 637 156 24.5%15 to 17 years 285 56 19.6%
13.1%
3.2%
42.3%
15.5%
13.3%
12.7%
100% - 129% 130% - 184%
185% - 199% Over 200%
Under 50% 50% - 99%

*The Census Bureau defines “linguistic isolation” as no family member older than 14 years old who speaks English well. Percentages are of linguistically isolated children where at least some members speak a non-English language.
45
SAN JUAN PUEBLO
San Juan Pueblo New MexicoPercent of Native American children
living on the pueblo
Percent of all children (native and non-native)
living on the pueblo
Percent of all Native American children in New
Mexico
Percent of all children in
New Mexico
Economic SecurityPercent of children in poverty 26.6% 25.7% 39.2% 25.0%Percent of children with no parent working 10.9% 18.5% 23.6% 13.6%
EducationPercent of 3-4 year olds in preschool 82.5% 44.6% 50.2% 40.4%Percent of 18-24 year olds with a HS diploma or more 49.2% 63.3% 65.0% 70.5%Percent of 18-24 year olds enrolled in school 29.5% 30.3% 38.1% 41.8%
TeensPercent of 16-19 year olds not in school, military, or working 13.3% 20.3% 16.0% 11.9%Percent of 16-19 year olds not in school or HS graduate 32.5% 24.5% 13.6% 12.1%
DisabilityPercent of 5-17 year olds with a disability 3.0% 4.3% 6.1% 6.7%Percent of disabled 5-17 year olds living in poverty 0.0% 23.1% 37.8% 30.4%
LanguagePercent of children speaking a language other than English 30.3% 52.2% 43.4% 31.2%
Percent of those children speaking English "very well" 94.5% 80.3% 65.3% 67.5%Percent of linguistically isolated children* 1.1% 5.6% 8.7% 12.0%
HousingPercent of children living in owner occupied homes 64.0% 76.7% 65.2% 68.8%Percent of households with telephone access 78.3% 86.6% 71.2% 94.3%

46
SANDIA PUEBLO
Number of
Children
Number of Children
Below Poverty
Percent Below
PovertyAll children living with their own families 1,400 295 21.1%
Living in a two-parent home 837 91 10.9%Living with a single father 123 36 29.3%Living with a single mother 440 168 38.2%
Income Level for All Children in Sandia Pueblo by Federal Poverty Level
All Native American Percent Native AmericanTotal population 4,436 536 12.1%Adult population 3,024 351 11.6%Population under 18 years 1,412 185 13.1%Percent under 18 years 31.8% 34.5% N/A0 to 2 years 217 26 12.0%3 to 4 years 162 13 8.0%5 to 9 years 401 54 13.5%10 to 14 years 425 69 16.2%15 to 17 years 207 23 11.1%
9.0%
5.8%
39.0%
23.6%
10.4%
12.2%
100% - 129% 130% - 184%
185% - 199% Over 200%
Under 50% 50% - 99%

*The Census Bureau defines “linguistic isolation” as no family member older than 14 years old who speaks English well. Percentages are of linguistically isolated children where at least some members speak a non-English language.
47
SANDIA PUEBLO
Sandia Pueblo New MexicoPercent of Native American children
living on the pueblo
Percent of all children (native and non-native)
living on the pueblo
Percent of all Native American children in New
Mexico
Percent of all children in
New Mexico
Economic SecurityPercent of children in poverty 24.3% 21.3% 39.2% 25.0%Percent of children with no parent working 18.0% 12.5% 23.6% 13.6%
EducationPercent of 3-4 year olds in preschool 61.5% 45.7% 50.2% 40.4%Percent of 18-24 year olds with a HS diploma or more 39.7% 55.4% 65.0% 70.5%Percent of 18-24 year olds enrolled in school 32.8% 23.7% 38.1% 41.8%
TeensPercent of 16-19 year olds not in school, military, or working 26.8% 16.1% 16.0% 11.9%Percent of 16-19 year olds not in school or HS graduate 31.7% 20.4% 13.6% 12.1%
DisabilityPercent of 5-17 year olds with a disability 7.5% 9.4% 6.1% 6.7%Percent of disabled 5-17 year olds living in poverty 27.3% 13.4% 37.8% 30.4%
LanguagePercent of children speaking a language other than English 26.0% 41.6% 43.4% 31.2%
Percent of those children speaking English "very well" 78.9% 85.6% 65.3% 67.5%Percent of linguistically isolated children* 0.0% 5.0% 8.7% 12.0%
HousingPercent of children living in owner occupied homes 77.5% 80.8% 65.2% 68.8%Percent of households with telephone access 93.6% 95.1% 71.2% 94.3%

48
SANTA ANA PUEBLO
Number of
Children
Number of Children
Below Poverty
Percent Below
PovertyAll children living with their own families 196 8 4.1%
Living in a two-parent home 92 0 0.0%Living with a single father 17 0 0.0%Living with a single mother 87 8 9.2%
Income Level for All Children in Santa Ana Pueblo by Federal Poverty Level
All Native American Percent Native AmericanTotal population 514 514 100.0%Adult population 316 316 100.0%Population under 18 years 198 198 100.0%Percent under 18 years 38.5% 38.5% N/A0 to 2 years 15 15 100.0%3 to 4 years 16 16 100.0%5 to 9 years 57 57 100.0%10 to 14 years 77 77 100.0%15 to 17 years 33 33 100.0%
4.1%
4.6%
53.1%
18.9%
19.4%
0.0%
100% - 129% 130% - 184%
185% - 199% Over 200%
Under 50% 50% - 99%

*The Census Bureau defines “linguistic isolation” as no family member older than 14 years old who speaks English well. Percentages are of linguistically isolated children where at least some members speak a non-English language.
49
SANTA ANA PUEBLO
Santa Ana Pueblo New MexicoPercent of Native American children
living on the pueblo
Percent of all children (native and non-native)
living on the pueblo
Percent of all Native American children in New
Mexico
Percent of all children in
New Mexico
Economic SecurityPercent of children in poverty 4.1% 4.1% 39.2% 25.0%Percent of children with no parent working 17.6% 17.6% 23.6% 13.6%
EducationPercent of 3-4 year olds in preschool 56.3% 56.3% 50.2% 40.4%Percent of 18-24 year olds with a HS diploma or more 49.1% 49.1% 65.0% 70.5%Percent of 18-24 year olds enrolled in school 70.9% 70.9% 38.1% 41.8%
TeensPercent of 16-19 year olds not in school, military, or working 10.6% 10.6% 16.0% 11.9%Percent of 16-19 year olds not in school or HS graduate 8.5% 8.5% 13.6% 12.1%
DisabilityPercent of 5-17 year olds with a disability 3.6% 3.6% 6.1% 6.7%Percent of disabled 5-17 year olds living in poverty 0.0% 0.0% 37.8% 30.4%
LanguagePercent of children speaking a language other than English 21.0% 21.0% 43.4% 31.2%
Percent of those children speaking English "very well" 45.7% 45.7% 65.3% 67.5%Percent of linguistically isolated children* 0.0% 0.0% 8.7% 12.0%
HousingPercent of children living in owner occupied homes 100.0% 100.0% 65.2% 68.8%Percent of households with telephone access 87.3% 87.3% 71.2% 94.3%
50
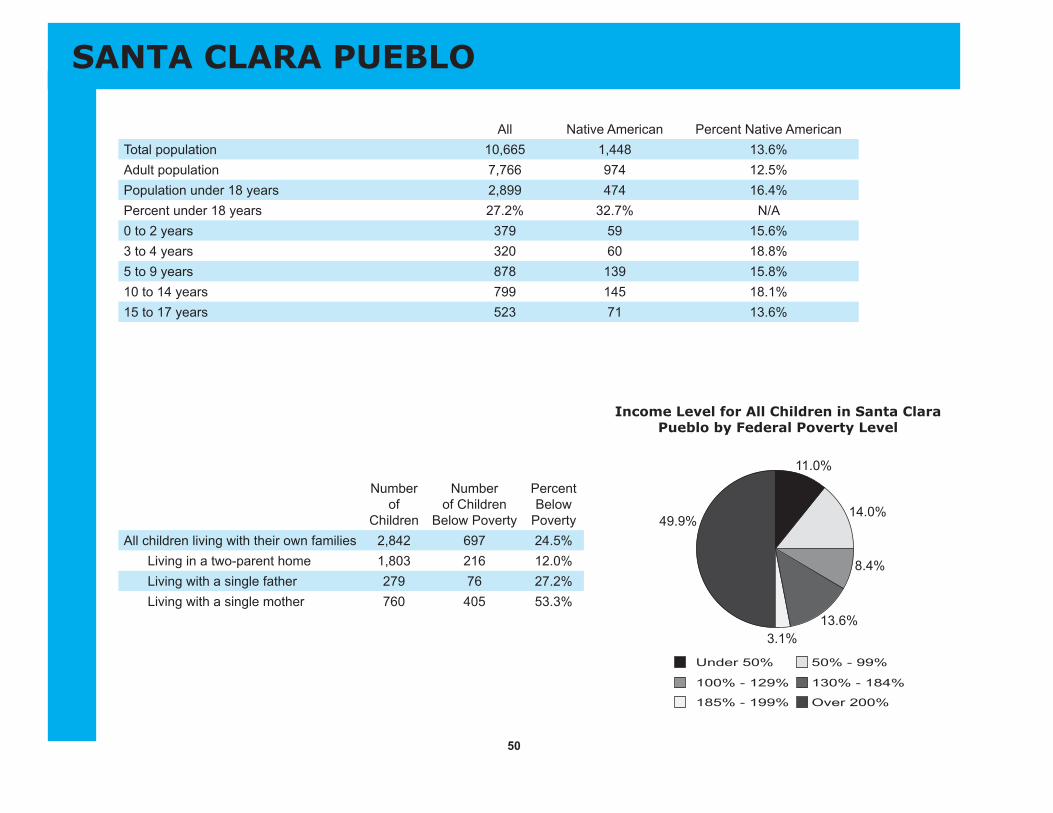
SANTA CLARA PUEBLO
Number of
Children
Number of Children
Below Poverty
Percent Below
PovertyAll children living with their own families 2,842 697 24.5%
Living in a two-parent home 1,803 216 12.0%Living with a single father 279 76 27.2%Living with a single mother 760 405 53.3%
Income Level for All Children in Santa Clara Pueblo by Federal Poverty Level
All Native American Percent Native AmericanTotal population 10,665 1,448 13.6%Adult population 7,766 974 12.5%Population under 18 years 2,899 474 16.4%Percent under 18 years 27.2% 32.7% N/A0 to 2 years 379 59 15.6%3 to 4 years 320 60 18.8%5 to 9 years 878 139 15.8%10 to 14 years 799 145 18.1%15 to 17 years 523 71 13.6%
11.0%
3.1%
49.9%
13.6%
8.4%
14.0%
100% - 129% 130% - 184%
185% - 199% Over 200%
Under 50% 50% - 99%

*The Census Bureau defines “linguistic isolation” as no family member older than 14 years old who speaks English well. Percentages are of linguistically isolated children where at least some members speak a non-English language.
51
SANTA CLARA PUEBLO
Santa Clara Pueblo New MexicoPercent of Native American children
living on the pueblo
Percent of all children (native and non-native)
living on the pueblo
Percent of all Native American children in New
Mexico
Percent of all children in
New Mexico
Economic SecurityPercent of children in poverty 34.3% 24.9% 39.2% 25.0%Percent of children with no parent working 12.3% 11.1% 23.6% 13.6%
EducationPercent of 3-4 year olds in preschool 58.3% 31.9% 50.2% 40.4%Percent of 18-24 year olds with a HS diploma or more 71.6% 62.6% 65.0% 70.5%Percent of 18-24 year olds enrolled in school 32.3% 32.7% 38.1% 41.8%
TeensPercent of 16-19 year olds not in school, military, or working 15.0% 17.2% 16.0% 11.9%Percent of 16-19 year olds not in school or HS graduate 9.0% 25.5% 13.6% 12.1%
DisabilityPercent of 5-17 year olds with a disability 10.6% 5.9% 6.1% 6.7%Percent of disabled 5-17 year olds living in poverty 38.9% 26.6% 37.8% 30.4%
LanguagePercent of children speaking a language other than English 43.9% 49.5% 43.4% 31.2%
Percent of those children speaking English "very well" 78.2% 77.4% 65.3% 67.5%Percent of linguistically isolated children* 4.8% 9.3% 8.7% 12.0%
HousingPercent of children living in owner occupied homes 80.6% 74.1% 65.2% 68.8%Percent of households with telephone access 78.5% 89.6% 71.2% 94.3%
52
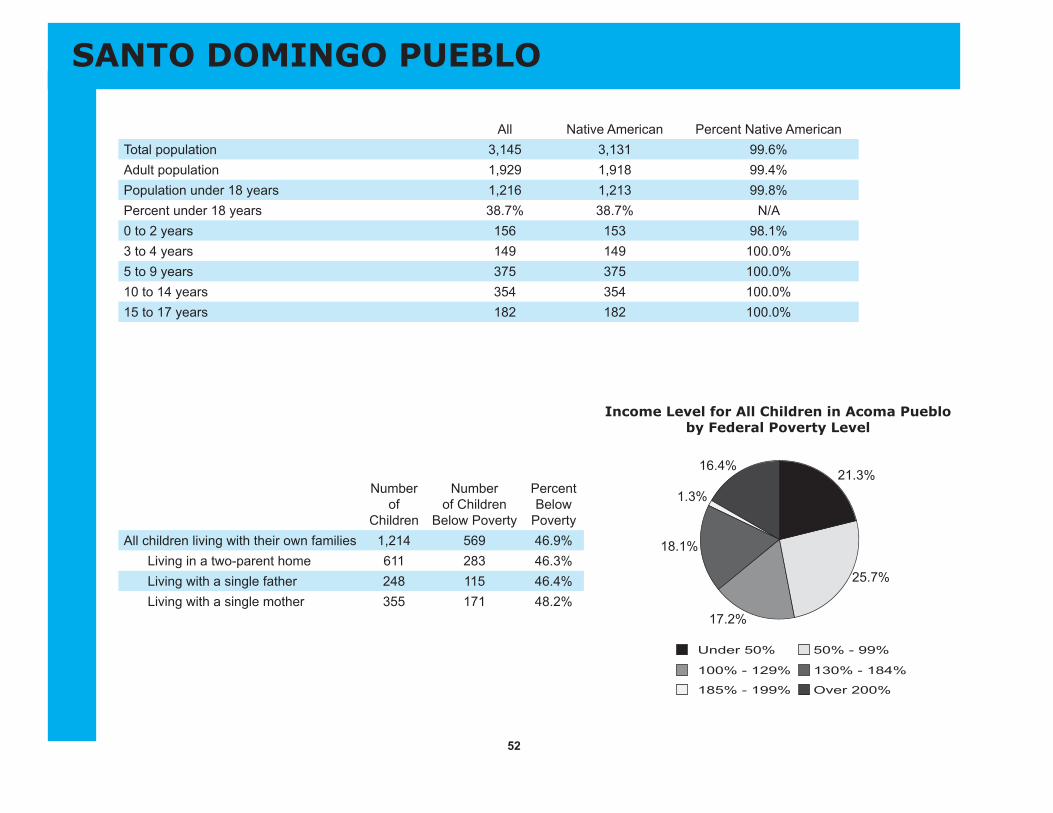
SANTO DOMINGO PUEBLO
Number of
Children
Number of Children
Below Poverty
Percent Below
PovertyAll children living with their own families 1,214 569 46.9%
Living in a two-parent home 611 283 46.3%Living with a single father 248 115 46.4%Living with a single mother 355 171 48.2%
Income Level for All Children in Acoma Pueblo by Federal Poverty Level
All Native American Percent Native AmericanTotal population 3,145 3,131 99.6%Adult population 1,929 1,918 99.4%Population under 18 years 1,216 1,213 99.8%Percent under 18 years 38.7% 38.7% N/A0 to 2 years 156 153 98.1%3 to 4 years 149 149 100.0%5 to 9 years 375 375 100.0%10 to 14 years 354 354 100.0%15 to 17 years 182 182 100.0%
21.3%1.3%
16.4%
18.1%
17.2%
25.7%
100% - 129% 130% - 184%
185% - 199% Over 200%
Under 50% 50% - 99%

*The Census Bureau defines “linguistic isolation” as no family member older than 14 years old who speaks English well. Percentages are of linguistically isolated children where at least some members speak a non-English language.
53
SANTO DOMINGO PUEBLO
Santo Domingo Pueblo New MexicoPercent of Native American children
living on the pueblo
Percent of all children (native and non-native)
living on the pueblo
Percent of all Native American children in New
Mexico
Percent of all children in
New Mexico
Economic SecurityPercent of children in poverty 46.8% 47.0% 39.2% 25.0%Percent of children with no parent working 48.6% 48.7% 23.6% 13.6%
EducationPercent of 3-4 year olds in preschool 73.8% 73.8% 50.2% 40.4%Percent of 18-24 year olds with a HS diploma or more 47.9% 47.9% 65.0% 70.5%Percent of 18-24 year olds enrolled in school 19.8% 19.8% 38.1% 41.8%
TeensPercent of 16-19 year olds not in school, military, or working 32.2% 32.2% 16.0% 11.9%Percent of 16-19 year olds not in school or HS graduate 22.4% 22.4% 13.6% 12.1%
DisabilityPercent of 5-17 year olds with a disability 3.8% 3.8% 6.1% 6.7%Percent of disabled 5-17 year olds living in poverty 48.6% 48.6% 37.8% 30.4%
LanguagePercent of children speaking a language other than English 95.4% 95.4% 43.4% 31.2%
Percent of those children speaking English "very well" 66.1% 66.1% 65.3% 67.5%Percent of linguistically isolated children* 11.2% 11.2% 8.7% 12.0%
HousingPercent of children living in owner occupied homes 78.9% 78.9% 65.2% 68.8%Percent of households with telephone access 85.3% 85.4% 71.2% 94.3%

54
TAOS PUEBLO
Number of
Children
Number of Children
Below Poverty
Percent Below
PovertyAll children living with their own families 1,001 301 30.1%
Living in a two-parent home 526 100 19.0%Living with a single father 163 68 41.7%Living with a single mother 312 133 42.6%
Income Level for All Children in Acoma Pueblo by Federal Poverty Level
All Native American Percent Native AmericanTotal population 4,489 1,391 31.0%Adult population 3,451 988 28.6%Population under 18 years 1,038 403 38.8%Percent under 18 years 23.1% 29.0% N/A0 to 2 years 130 45 34.6%3 to 4 years 115 48 41.7%5 to 9 years 254 86 33.9%10 to 14 years 343 145 42.3%15 to 17 years 196 79 40.3%
15.5%
2.0%
39.0%
15.0%
13.5%
15.0%
100% - 129% 130% - 184%
185% - 199% Over 200%
Under 50% 50% - 99%

*The Census Bureau defines “linguistic isolation” as no family member older than 14 years old who speaks English well. Percentages are of linguistically isolated children where at least some members speak a non-English language.
55
TAOS PUEBLO
Taos Pueblo New MexicoPercent of Native American children
living on the pueblo
Percent of all children (native and non-native)
living on the pueblo
Percent of all Native American children in New
Mexico
Percent of all children in
New Mexico
Economic SecurityPercent of children in poverty 38.6% 30.6% 39.2% 25.0%Percent of children with no parent working 20.4% 12.9% 23.6% 13.6%
EducationPercent of 3-4 year olds in preschool 79.2% 54.8% 50.2% 40.4%Percent of 18-24 year olds with a HS diploma or more 76.7% 64.8% 65.0% 70.5%Percent of 18-24 year olds enrolled in school 36.7% 37.8% 38.1% 41.8%
TeensPercent of 16-19 year olds not in school, military, or working 13.5% 17.9% 16.0% 11.9%Percent of 16-19 year olds not in school or HS graduate 8.3% 13.9% 13.6% 12.1%
DisabilityPercent of 5-17 year olds with a disability 2.6% 2.9% 6.1% 6.7%Percent of disabled 5-17 year olds living in poverty 62.5% 27.3% 37.8% 30.4%
LanguagePercent of children speaking a language other than English 65.5% 52.8% 43.4% 31.2%
Percent of those children speaking English "very well" 78.3% 85.2% 65.3% 67.5%Percent of linguistically isolated children* 0.0% 1.7% 8.7% 12.0%
HousingPercent of children living in owner occupied homes 69.0% 59.1% 65.2% 68.8%Percent of households with telephone access 76.8% 89.6% 71.2% 94.3%
56
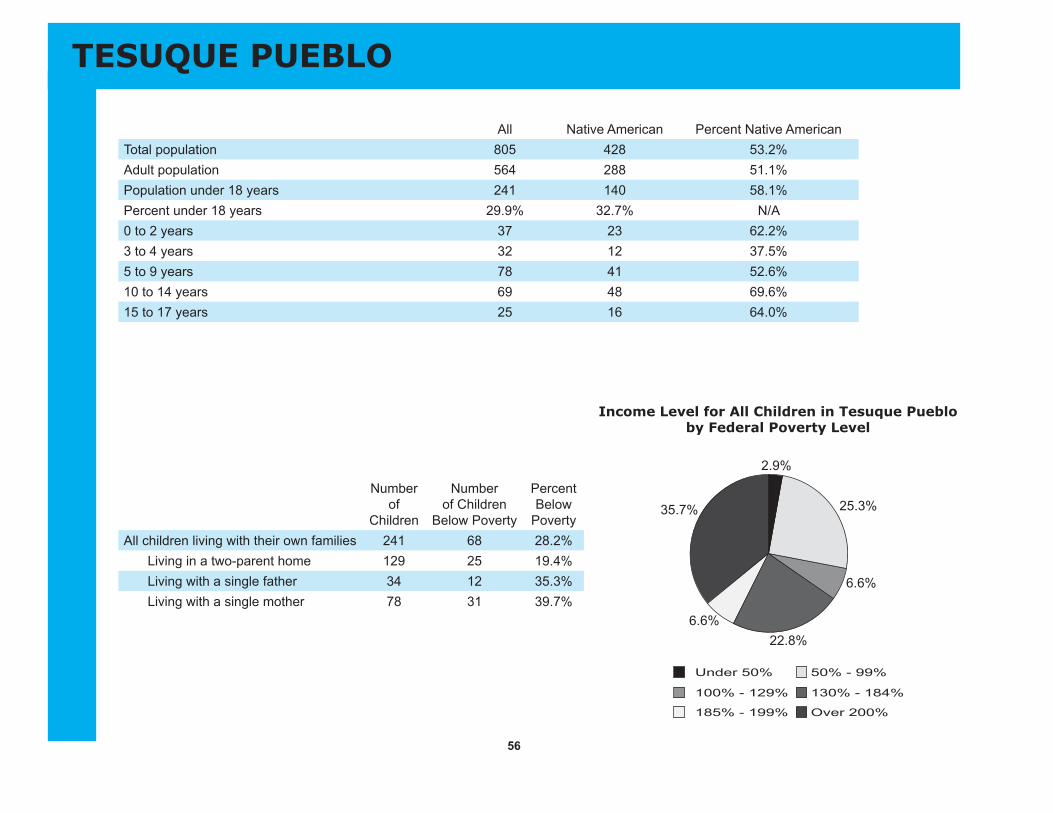
TESUQUE PUEBLO
Number of
Children
Number of Children
Below Poverty
Percent Below
PovertyAll children living with their own families 241 68 28.2%
Living in a two-parent home 129 25 19.4%Living with a single father 34 12 35.3%Living with a single mother 78 31 39.7%
Income Level for All Children in Tesuque Pueblo by Federal Poverty Level
All Native American Percent Native AmericanTotal population 805 428 53.2%Adult population 564 288 51.1%Population under 18 years 241 140 58.1%Percent under 18 years 29.9% 32.7% N/A0 to 2 years 37 23 62.2%3 to 4 years 32 12 37.5%5 to 9 years 78 41 52.6%10 to 14 years 69 48 69.6%15 to 17 years 25 16 64.0%
2.9%
6.6%
35.7%
22.8%
6.6%
25.3%
100% - 129% 130% - 184%
185% - 199% Over 200%
Under 50% 50% - 99%

*The Census Bureau defines “linguistic isolation” as no family member older than 14 years old who speaks English well. Percentages are of linguistically isolated children where at least some members speak a non-English language.
57
TESUQUE PUEBLO
Tesuque Pueblo New MexicoPercent of Native American children
living on the pueblo
Percent of all children (native and non-native)
living on the pueblo
Percent of all Native American children in New
Mexico
Percent of all children in
New Mexico
Economic SecurityPercent of children in poverty 18.6% 28.2% 39.2% 25.0%Percent of children with no parent working 11.2% 7.8% 23.6% 13.6%
EducationPercent of 3-4 year olds in preschool 66.7% 40.6% 50.2% 40.4%Percent of 18-24 year olds with a HS diploma or more 46.5% 56.3% 65.0% 70.5%Percent of 18-24 year olds enrolled in school 37.2% 28.8% 38.1% 41.8%
TeensPercent of 16-19 year olds not in school, military, or working 38.5% 39.5% 16.0% 11.9%Percent of 16-19 year olds not in school or HS graduate 42.3% 28.9% 13.6% 12.1%
DisabilityPercent of 5-17 year olds with a disability 1.9% 2.9% 6.1% 6.7%Percent of disabled 5-17 year olds living in poverty 50.0% 20.0% 37.8% 30.4%
LanguagePercent of children speaking a language other than English 55.2% 42.4% 43.4% 31.2%
Percent of those children speaking English "very well" 86.2% 80.8% 65.3% 67.5%Percent of linguistically isolated children* 0.0% 0.0% 8.7% 12.0%
HousingPercent of children living in owner occupied homes 76.6% 81.4% 65.2% 68.8%Percent of households with telephone access 87.2% 92.5% 71.2% 94.3%

58
ZIA PUEBLO
Number of
Children
Number of Children
Below Poverty
Percent Below
PovertyAll children living with their own families 188 35 18.6%
Living in a two-parent home 109 8 7.3%Living with a single father 12 7 58.3%Living with a single mother 67 20 29.9%
Income Level for All Children in Zia Pueblo by Federal Poverty Level
All Native American Percent Native AmericanTotal population 578 578 100.0%Adult population 382 382 100.0%Population under 18 years 196 196 100.0%Percent under 18 years 33.9% 33.9% N/A0 to 2 years 19 19 100.0%3 to 4 years 14 14 100.0%5 to 9 years 65 65 100.0%10 to 14 years 67 67 100.0%15 to 17 years 31 31 100.0%
9.6%
9.0%
42.0%
21.3%
9.0%
9.0%
100% - 129% 130% - 184%
185% - 199% Over 200%
Under 50% 50% - 99%

*The Census Bureau defines “linguistic isolation” as no family member older than 14 years old who speaks English well. Percentages are of linguistically isolated children where at least some members speak a non-English language.
59
ZIA PUEBLO
Zia Pueblo New MexicoPercent of Native American children
living on the pueblo
Percent of all children (native and non-native)
living on the pueblo
Percent of all Native American children in New
Mexico
Percent of all children in
New Mexico
Economic SecurityPercent of children in poverty 18.6% 18.6% 39.2% 25.0%Percent of children with no parent working 7.3% 7.3% 23.6% 13.6%
EducationPercent of 3-4 year olds in preschool 57.1% 57.1% 50.2% 40.4%Percent of 18-24 year olds with a HS diploma or more 81.0% 81.0% 65.0% 70.5%Percent of 18-24 year olds enrolled in school 16.5% 16.5% 38.1% 41.8%
TeensPercent of 16-19 year olds not in school, military, or working 12.5% 12.5% 16.0% 11.9%Percent of 16-19 year olds not in school or HS graduate 21.9% 21.9% 13.6% 12.1%
DisabilityPercent of 5-17 year olds with a disability 9.4% 9.4% 6.1% 6.7%Percent of disabled 5-17 year olds living in poverty 26.7% 26.7% 37.8% 30.4%
LanguagePercent of children speaking a language other than English 69.3% 69.3% 43.4% 31.2%
Percent of those children speaking English "very well" 36.3% 36.3% 65.3% 67.5%Percent of linguistically isolated children* 13.5% 13.5% 8.7% 12.0%
HousingPercent of children living in owner occupied homes 100.0% 100.0% 65.2% 68.8%Percent of households with telephone access 79.5% 79.5% 71.2% 94.3%

60
ZUNI PUEBLO
Number of
Children
Number of Children
Below Poverty
Percent Below
PovertyAll children living with their own families 2,785 1,513 54.3%
Living in a two-parent home 1,501 751 50.0%Living with a single father 187 127 67.9%Living with a single mother 1,097 635 57.9%
Income Level for All Children in Zuni Pueblo by Federal Poverty Level
All Native American Percent Native AmericanTotal population 7,749 7,436 96.0%Adult population 4,959 4,688 94.5%Population under 18 years 2,790 2,748 98.5%Percent under 18 years 36.0% 37.0% N/A0 to 2 years 365 361 98.9%3 to 4 years 270 265 98.1%5 to 9 years 919 900 97.9%10 to 14 years 776 762 98.2%15 to 17 years 460 460 100.0%
25.7%
3.4%
18.1%
14.3%
28.6%9.9%
100% - 129% 130% - 184%
185% - 199% Over 200%
Under 50% 50% - 99%

*The Census Bureau defines “linguistic isolation” as no family member older than 14 years old who speaks English well. Percentages are of linguistically isolated children where at least some members speak a non-English language.
61
ZUNI PUEBLO
Zuni Pueblo New MexicoPercent of Native American children
living on the pueblo
Percent of all children (native and non-native)
living on the pueblo
Percent of all Native American children in New
Mexico
Percent of all children in
New Mexico
Economic SecurityPercent of children in poverty 55.2% 54.3% 39.2% 25.0%Percent of children with no parent working 31.0% 31.3% 23.6% 13.6%
EducationPercent of 3-4 year olds in preschool 35.5% 36.7% 50.2% 40.4%Percent of 18-24 year olds with a HS diploma or more 62.0% 62.9% 65.0% 70.5%Percent of 18-24 year olds enrolled in school 38.8% 39.1% 38.1% 41.8%
TeensPercent of 16-19 year olds not in school, military, or working 11.0% 11.0% 16.0% 11.9%Percent of 16-19 year olds not in school or HS graduate 7.6% 7.6% 13.6% 12.1%
DisabilityPercent of 5-17 year olds with a disability 4.2% 4.1% 6.1% 6.7%Percent of disabled 5-17 year olds living in poverty 53.9% 53.9% 37.8% 30.4%
LanguagePercent of children speaking a language other than English 80.8% 79.5% 43.4% 31.2%
Percent of those children speaking English "very well" 63.8% 63.8% 65.3% 67.5%Percent of linguistically isolated children* 10.7% 10.7% 8.7% 12.0%
HousingPercent of children living in owner occupied homes 73.7% 71.9% 65.2% 68.8%Percent of households with telephone access 77.8% 79.0% 71.2% 94.3%


*The Census Bureau defines “linguistic isolation” as no family member older than 14 years old who speaks English well. Percentages are of linguistically isolated children where at least some members speak a non-English language.
63
NATIVE AMERICAN INCOME
Median Income for Native American Families with Children Under Eighteen
Pueblo FamiliesAcoma $27,065Cochiti $34,107Isleta $29,931Jemez $31,964Laguna $30,223Nambe $26,042Picuris $32,500
Pojoaque $13,750San Felipe $24,375
San Ildefonso $25,750San Juan $27,250Sandia $33,750
Santa Ana $34,107Santa Clara $22,258
Santo Domingo $19,728Taos $22,841
Tesuque $34,583Zia $39,063
Zuni $19,234All Pueblo Families in Albuquerque $28,913All Pueblo Families in New Mexico $25,470
Apache FamiliesJicarilla $25,556
Mescalero $20,556All Apache Families in Albuquerque $25,893All Apache Families in New Mexico $23,528
Navajo FamiliesNavajo Nation in New Mexico $21,990
Alamo $18,684Ramah $24,464
To’hajiilee $22,813All Navajo Families in Albuquerque $24,121All Navajo Families in New Mexico $21,990
New MexicoAll Native American Families in New Mexico $24,573
All White, Non-Hispanic Families in New Mexico $48,372All Hispanic (of any race) Families in New Mexico $28,570
All New Mexico $35,579


*The Census Bureau defines “linguistic isolation” as no family member older than 14 years old who speaks English well. Percentages are of linguistically isolated children where at least some members speak a non-English language.
65
A Note on Sources
This report relies on data from the U.S. Census Bureau, which is available at www.census.gov. Specifically, data are derived from Census 2000’s Summary File 4 of the American Fact Finder data sets. The geography used for all pueblos, Apache tribes, and Navajo chapters is “American Indian Area/Alaska Native Area/Hawaiian Home Land.” The population groups used were either “Total population” or “American Indian and Alaska Native alone or in combination with one or more other races.”
The geography used for the Navajo Nation in New Mexico is “American Indian Area/Alaska Native Area/Hawaiian Home Land (or part).” This option is obtained through the link titled “Show major geography types only,” from which the user can then select the desired state. The population groups used are the same as for the groups above.
The precise tables used are as follows:
APPENDIX
Total population PCT 3Children in families PCT 150Poverty status pie chart PCT 144Child poverty rate PCT 142Children with no working parents PCT 813-4 year olds in preschool PCT 6218-24 year olds with a high school diploma PCT 6518-24 year olds in school PCT 6216-19 year olds not in school, military or working PCT 6616-19 year olds not in school or high school graduates PCT665-17 year olds with a disability PCT 148
-Disabled 5-17 year olds in poverty PCT 148Bilingual children PCT 38
-Those speaking English "very well" PCT 38Linguistically isolated children PCT 41Home ownership HCT 8Telephone access HCT 92Median income for families with children PCT 122

66
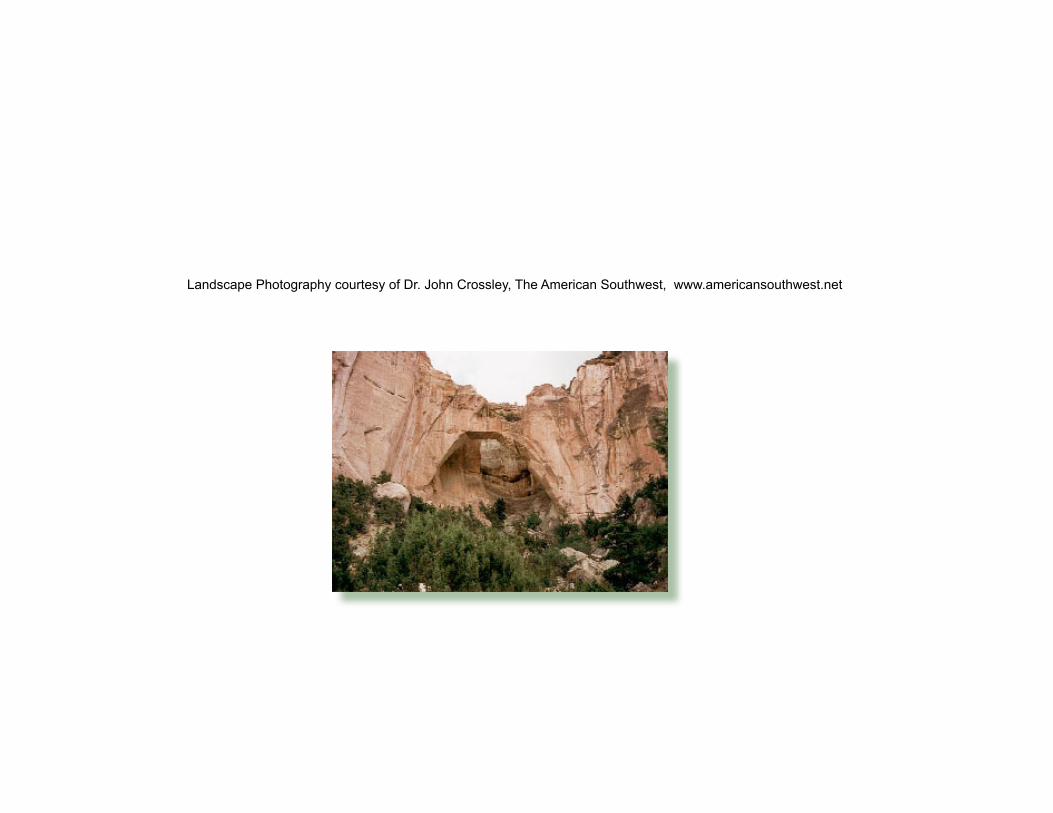
Landscape Photography courtesy of Dr. John Crossley, The American Southwest, www.americansouthwest.net
68
New Mexico Voices for Children 2340 Alamo S.E., Suite 120
Albuquerque, New Mexico 87106 Phone 505.244.9505
Fax 505.244.9509 www.nmvoices.org