Embed Size (px)
Citation preview
CRCPD Publication E-03-6-a Available Online at No Charge
$15.00 for a Computer-Generated Copy
NATIONWIDE EVALUATION OF X-RAY TRENDS (NEXT)
TABULATION AND GRAPHICAL SUMMARY
OF THE 1999 DENTAL RADIOGRAPHY SURVEY
November 2003
Republished August 2007
Published by Conference of Radiation Control Program Directors, Inc.

[Inside Front Cover-Intentionally Blank]
CRCPD Publication E-03-6-a
NATIONWIDE EVALUATION OF X-RAY TRENDS (NEXT)
TABULATION AND GRAPHICAL SUMMARY OF THE 1999 DENTAL RADIOGRAPHY SURVEY
Prepared by Albert E. Moyal
Division of Mammography Quality and Radiation Programs
Center for Devices and Radiological Health (CDRH) Office of Health and Industry Programs
U.S. Food and Drug Administration 1350 Piccard Drive Mail Code: HFZ-240 Rockville, MD 20850
E-mail: [email protected]
In Association with
Conference of Radiation Control Program Directors' Committee on Nationwide Evaluation of X-ray Trends (NEXT) (H-4)
and American College of Radiology
Members Professional Liaisons Federal Liaisons John Ferruolo, RI (Chair) Jeanne Crosby, CA Grant Klokeid, ID Linda Plusquellic, ME Mary Ann Spohrer, IL
Jan Martensen ACCR Keith Strauss, AAPM
Ronald Bernacki, FDA Richard Kaczmarek, CDRH John McCrohan, CDRH Albert Moyal CDRH David Spelic, CDRH Orhan H. Suleiman, CDRH
November 2003
Republished August 2007
Published by Office of Executive Director
Conference of Radiation Control Program Directors, Inc. 205 Capital Avenue
Frankfort, Kentucky 40601 www.crcpd.org
ii
{On August 24, 3007, pages 15 and 16 of this document [Tables 18 and 19 and Figures 13 and 14] were modified
to reflect revised data provided by FDA.)
This publication was supported in part by grant number FD-U-000005 from the Food and Drug Administration. The information contained in this document is for guidance. The implementation and use of the information and recommendations contained in this document are at the discretion of the user. The implications from the use of this document are solely the responsibility of the user. This document has been developed by a working group of the Conference of Radiation Control Program Directors, Inc. (CRCPD) and accepted by the Board of Directors for publication. The contents contained herein, however, may not necessarily represent the views of the entire membership of the CRCPD or any federal agency supporting the work contained in this document. The mention of commercial products, their sources, or their use in connection with material reported herein is not to be construed as either an actual or implied endorsement of such products by the CRCPD or any federal agency.
iii
FOREWORD The Conference of Radiation Control Program Directors, Inc. (CRCPD) is an organization made up of the radiation control programs in each of the 50 states, the District of Columbia, and Puerto Rico, and of individuals, regardless of employer affiliation, with an interest in radiation protection. The primary purpose and goal of CRCPD is to assist its members in their efforts to protect the public, radiation worker, and patient from unnecessary radiation exposure. CRCPD also provides a forum for centralized communication on radiation protection matters between the states and the federal government, and between the individual states.
One method of providing assistance to the states, as well as to other interested parties, is through technical and administrative publications. Most technical publications of CRCPD are written by various committees, task forces or special working groups. Most administrative publications are written by staff of the Office of Executive Director (OED).
CRCPD's mission is "to promote consistency in addressing and resolving radiation protection issues, to encourage high standards of quality in radiation protection programs, and to provide leadership in radiation safety and education."
This particular publication, Nationwide Evaluation of X-ray Trends (NEXT) Tabulation and Graphical Summary of the 1999 Dental Radiography, is the release of this data for informational use. No conclusions are included; these are left for in-depth analysis and publications in technical journals.
Richard Ratliff, Chairperson Conference of Radiation Control
Program Directors, Inc.

iv
[This page is intentionally blank.]
v
PREFACE
The Nationwide Evaluation of X-ray Trends (NEXT) is a national program conducted annually to measure the x-ray exposure that a standard patient receives for selected x-ray examinations. The NEXT program is a cooperative effort of the Conference of Radiation Control Program Directors, Inc. (CRCPD), an association of state and local radiation control agencies, and the Food and Drug Administration's (FDA) Center for Devices and Radiological Health (CDRH). This tabulation has been prepared in cooperation with CRCPD's H-4 Committee on Nationwide Evaluation of X-ray Trends (NEXT). The tables and graphs are a summary of the survey data collected by the NEXT program in 1999. The procedures used for the collection of data are those contained within the protocol for the NEXT Dental Survey 1999. A sample of approximately 340 dental facilities was randomly selected for survey in 40 participating states. The sample size for each state was proportional to the state population. The following states participated in the 1999 survey: Alabama Alaska Arizona Arkansas California Colorado Connecticut Florida Hawaii Idaho
Illinois Iowa Kansas Kentucky Louisiana Maine Maryland Massachusetts Michigan Minnesota
Mississippi Missouri Nebraska New Hampshire New Jersey New Mexico North Carolina North Dakota Ohio Oregon
Pennsylvania Rhode Island South Carolina Tennessee Texas Utah Vermont Virginia Washington West Virginia Wisconsin
We wish to thank the personnel of the State radiation control programs who performed these surveys. Without their cooperation, the collection of this data would not have been possible.
Mary Ann Spohrer, Current Chairperson Committee on Nationwide Evaluation
of X-ray Trends
vi
ABSTRACT
Moyal, Albert E., CRCPD Committee on Nationwide Evaluation of X-ray Trends, Nationwide Evaluation of X-ray Trends (NEXT) Tabulation and Graphical Summary of 1999 Dental Radiography Survey, CRCPD Publication #E-03-6 (November 2003) (70 pp).
This document presents 1999 dental survey data. The tables and graphs are a summary of the data collected as part of the Nationwide Evaluation of X-ray Trends program. No conclusions are included.
vii
CONTENTS Foreword........................................................................................................ iii
Preface.............................................................................................................v
Abstract ..........................................................................................................vi
Introduction.................................................................................................... 1
Intraoral Procedures ..................................................................................... 2 Type of Dental Practices (Table 1) ................................................................. 2 Film Brands Used for Intraoral Imaging (Table 2) .......................................... 2 Types of Film Used for Intraoral Imaging (Table 3) ........................................ 2 Availability of Line Voltage Compensator for Intraoral Imaging (Table 4)........ 2 Generator Phase of X-ray Units (Table 5) ...................................................... 3 Number of Intraoral X-ray Units in Use (Table 6 & Figure 1) ............................ 3 Number of Intraoral Patients Examined Weekly (Table 7 & Figure 2) ................ 4 Number of Intraoral Patients Examined Weekly With Surveyed X-ray Tube (Table 8 & Figure 3) .................................................................. 5 Number of Intraoral Films Taken per Patient (Table 9 & Figure 4) .................... 6 Intraoral Entrance Skin Exposure (mR) (Table 10 & Figure 5) .......................... 7 Intraoral Entrance Skin Air Kerma Free-in-Air (Table 11 & Figure 6) ................ 8 Intraoral Entrance Skin Exposure Using D-Speed Film (Table 12 & Figure 7) ... 9 Intraoral Entrance Skin Air Kerma Using D-Speed Film (Table 13 & Figure 8)................................................................................ 10 Intraoral Entrance Skin Exposure Using E-Speed Film (Table 14 & Figure 9)................................................................................. 11 Intraoral Entrance Skin Air Kerma Using E-Speed Film (Table 15 & Figure 10) ................................................................................................12 Intraoral Entrance Skin Exposure Using Unknown Speed Class of Film (Table 16 & Figure 11) ............................................................................... 13 Intraoral Entrance Skin Air Kerma Using Unknown Speed Class of Film (Table 17 & Figure 12)................................................................................ 14 Intraoral Tube Potential Selected (Table 18 & Figure 13)............................... 15 Intraoral Tube Potential Measured (Table 19 & Figure 14) .............................. 16 Absolute Value of Difference in Intraoral Tube Potential: Measured vs. Selected (Table 20 & Figure 15) ............................................ 17 Intraoral Tube Potential (Using Copper Method) (Table 21 & Figure 16) .......... 18 Absolute Value of Difference in Intraoral Tube Potential: Selected vs. Measured (Using Copper Method) (Table 22 & Figure 17) ........ 19 Intraoral Half-Value Layer (mm Al) (Table 23 & Figure 18) .............................. 20 Intraoral Exposure Time Selected (Table 24 & Figure 19)................................ 21 Intraoral Exposure Time Measured (Table 25 & Figure 20) ............................. 22
viii
Absolute Value of Difference of Intraoral Exposure Time: Selected time vs. Measured time (Table 26 & Figure 21)............................. 23 Intraoral Tube Current Selected (Table 27 & Figure 22) .................................. 24 Intraoral mAs Values Selected (Table 28 & Figure 23)..................................... 25 Darkroom Fog Optical Density (Table 29 & Figure 24) .................................... 26 Fog Optical Density w/Daylight Processing System (Table 30 & Figure 25) ..... 27 Intraoral Phantom Film Optical Density (Table 31 & Figure 26) ...................... 28 High Contrast (3.0 cm Hole) Phantom Film Optical Density (Table 32 & Figure 27) ............................................................................... 29 Medium Contrast (2.0 cm Hole) Phantom Optical Density (Table 33 & Figure 28) ............................................................................... 30 Low Contrast (1.0 cm Hole) Phantom Optical Density (Table 34 & Figure 29) ............................................................................... 31 Number of Visible High Contrast Test Tool Objects (Meshes) (Table 35 & Figure 30) See Appendix A for Illustration of Holes and Meshes of Phantom ....................................................................................................32
Intraoral Automatic Film Processing Speed (Table 36 & Figure 31) ................. 33 Intraoral Film Processor Temperature Measured (Table 37 & Figure 32) ......... 34 Intraoral Film Processor Temperature Displayed (Table 38 & Figure 33) ......... 35 Absolute Value of Difference of Processor Temperature: Displayed vs. Measured (Table 39 & Figure 34).......................................... 36 Manual Film Processing Developer Immersion Time (Table 40 & Figure 35) ... 37 Cephalometric Procedures Number of Patients Examined per Week (at each Facility) Table 41 & Figure 36)................................................................................ 38 Entrance Skin Exposure (mR) (Table 42 & Figure 37) ..................................... 39 Entrance Skin Air Kerma Free-in-Air (Table 43 & Figure 38)........................... 40 Tube Potential Selected (Table 44 & Figure 39) ............................................... 41 Tube Potential Measured (Table 45 & Figure 40)............................................. 42 Absolute Value Difference in Tube Potential: Measured vs. Selected (Table 46 & Figure 41) ......................................................43 Half-Value Layer (mm Al) at Clinical Tube Potential (Table 47 & Figure 42)..... 44 Tube Current Selected (Table 48 & Figure 43) ................................................ 45 Exposure Time Selected (Table 49 & Figure 44) .............................................. 46 mAs Values Selected (Table 50 & Figure 45) ................................................... 47 Darkroom Fog Optical Density (Table 51 & Figure 46) .................................... 48 Film Brands Used for Cephalometric Imaging (Table 52).............................. 49 Film Types Used for Cephalometric Imaging (Table 53) ................................ 49 Screen Brands Used for Cephalometric Imaging (Table 54) .......................... 49 Screen Types Used for Cephalometric Imaging (Table 55) ............................ 50 Use of Grid during Procedures (Table 56) ................................................... 50 Selection of Cone Type (Table 57) ................................................................ 50
ix
Panoramic Procedures Number of Patients Examined Weekly per Facility (Table 58 & Figure 47) ....... 51 Tube Potential Selected (Table 59 & Figure 48) ............................................... 52 Tube Current Selected (Table 60 & Figure 49) ........................................................... 53 Exposure Times Selected (Table 61 & Figure 50)............................................. 54
mAs Values Selected (Table 62 & Figure 51) ................................................... 55 Panoramic Generator Phase Selection (Table 63) ......................................... 56 Film Brands Used for Panoramic Imaging (Table 64) ................................... 56 Film Types Used for Panoramic Imaging (Table 65)...................................... 56
Screen Brands Used for Panoramic Imaging (Table 66) ................................ 57 Screens Types Used for Panoramic Imaging (Table 67)................................. 57
APPENDICES Appendix A: Dental Phantom Diagram...................................................... 59 Appendix B: Abridged Protocol.................................................................. 61

x
[This page is intentionally blank.]

1
INTRODUCTION The Nationwide Evaluation of X-ray Trends (NEXT) entails a survey of various diagnostic radiology modalities performed annually in a voluntary program at the State level. Previous surveys performed include those for computed tomography (1990, 2000), fluoroscopy (1984, 1991, and 1996), mammography (1985, 1988, and 1992), dental radiography (1993), adult chest (1994), abdomen and lumbosacral spine radiography (1995), and pediatric chest radiography (1998).
In 1999 the NEXT program surveyed facilities that perform intraoral, cephalometric, and panoramic dental radiology. Patient exposure and air kerma was measured for typical clinical conditions, and a radiographic phantom was used to evaluate image quality. Information regarding technique factors (including exposure time and tube potential), patient workload, equipment information, film processing, and x-ray system half-value layer was also collected. Data were obtained from a representative sampling of the population of United States dental facilities including general dental offices, dental surgical facilities, and orthodontal facilities.
2
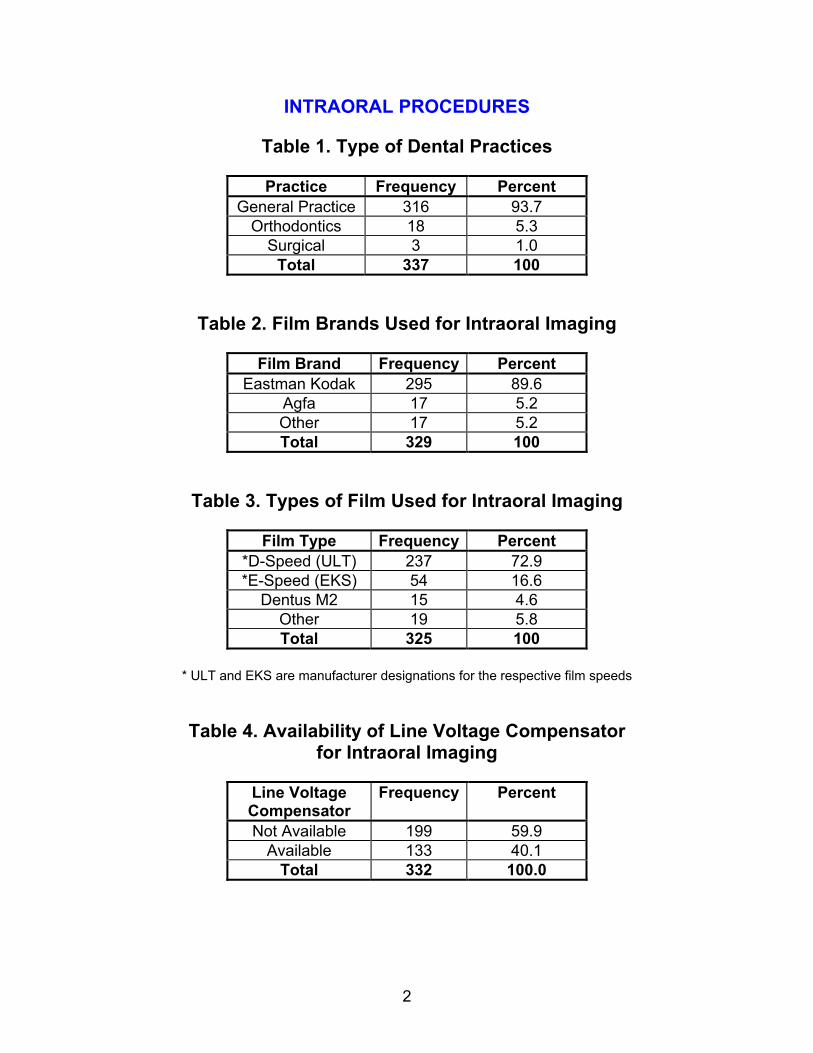
INTRAORAL PROCEDURES
Table 1. Type of Dental Practices
Practice Frequency Percent General Practice 316 93.7
Orthodontics 18 5.3 Surgical 3 1.0
Total 337 100
Table 2. Film Brands Used for Intraoral Imaging
Film Brand Frequency Percent
Eastman Kodak 295 89.6 Agfa 17 5.2 Other 17 5.2 Total 329 100
Table 3. Types of Film Used for Intraoral Imaging
Film Type Frequency Percent *D-Speed (ULT) 237 72.9 *E-Speed (EKS) 54 16.6
Dentus M2 15 4.6 Other 19 5.8 Total 325 100
* ULT and EKS are manufacturer designations for the respective film speeds
Table 4. Availability of Line Voltage Compensator for Intraoral Imaging
Line Voltage Compensator
Frequency Percent
Not Available 199 59.9 Available 133 40.1
Total 332 100.0
3
1 2 3 4 > 50
5
10
15
20
25
30
35
Number of Intraoral X-rayUnits In Use at Each Facility
Perc
ent o
f Sam
ple
Units
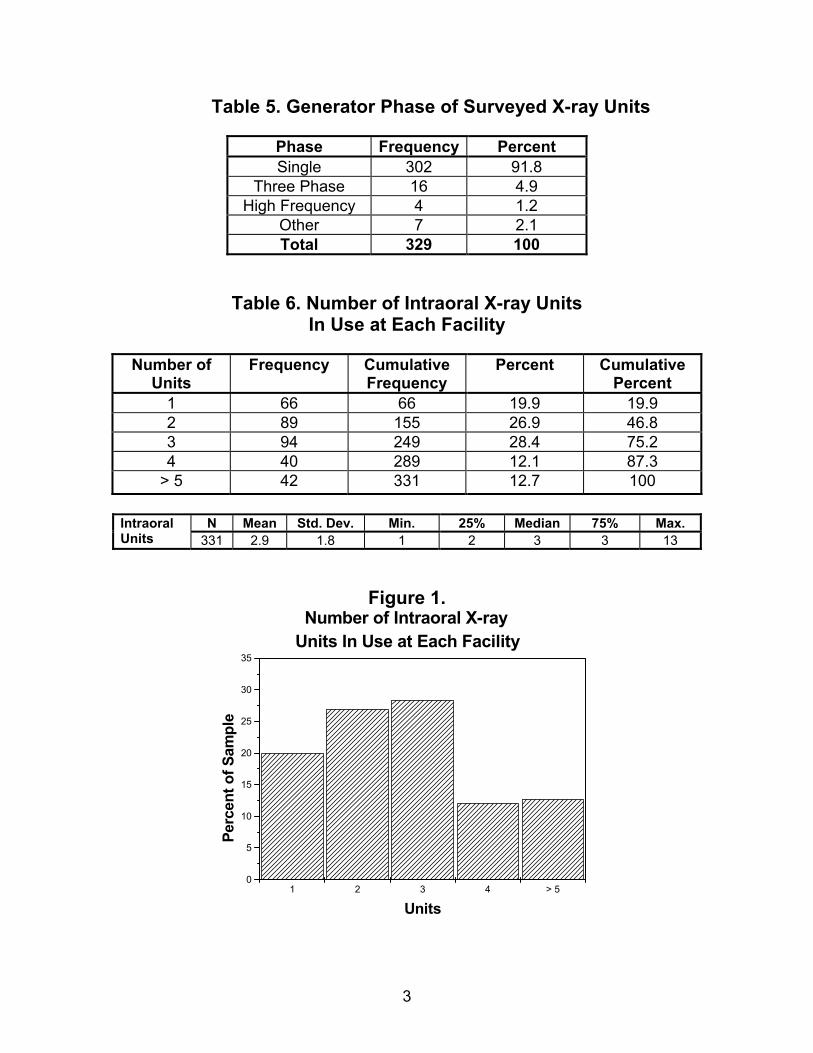
Table 5. Generator Phase of Surveyed X-ray Units
Phase Frequency Percent Single 302 91.8
Three Phase 16 4.9 High Frequency 4 1.2
Other 7 2.1 Total 329 100
Table 6. Number of Intraoral X-ray Units In Use at Each Facility
Number of
Units Frequency Cumulative
Frequency Percent Cumulative
Percent 1 66 66 19.9 19.9 2 89 155 26.9 46.8 3 94 249 28.4 75.2 4 40 289 12.1 87.3
> 5 42 331 12.7 100
N Mean Std. Dev. Min. 25% Median 75% Max. Intraoral Units 331 2.9 1.8 1 2 3 3 13
Figure 1.
4
0 - 24 25 - 49 50 - 74 75 - 99 100 - 125 > 1250
5
10
15
20
25
30 N=329Mean=53.4
Number of Intraoral PatientsExamined Per Week at Each Facility
Perc
ent o
f Sam
ple
Patients
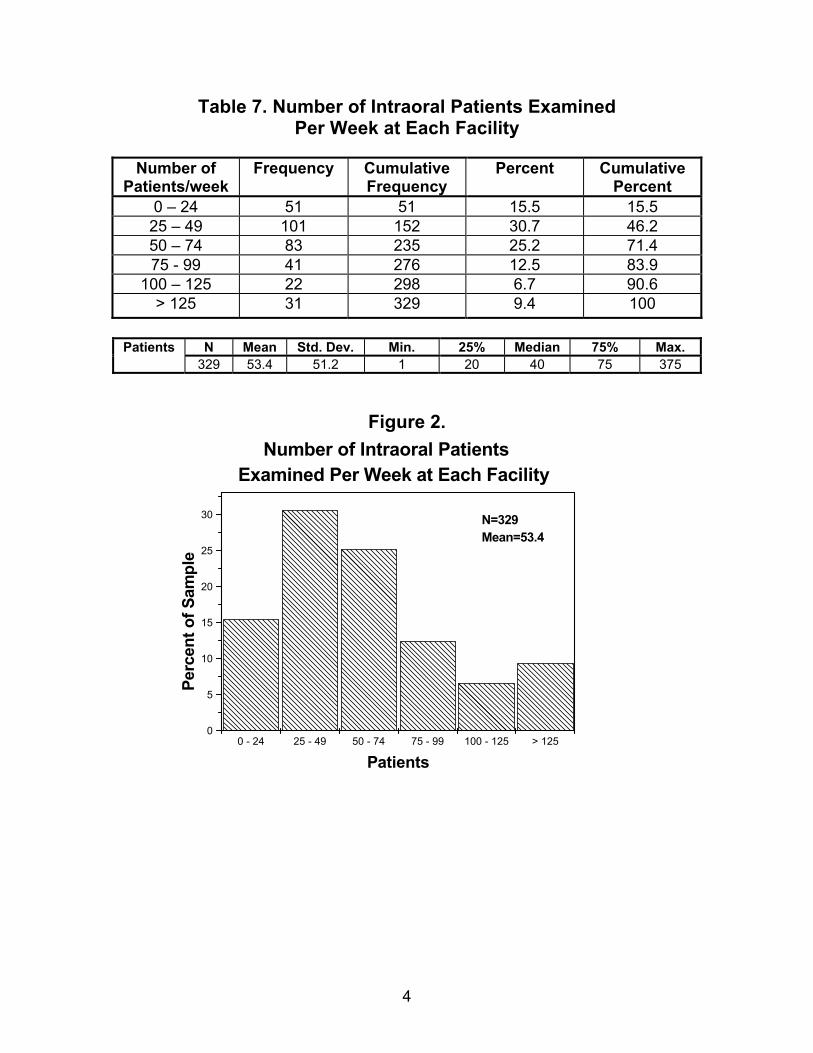
Table 7. Number of Intraoral Patients Examined Per Week at Each Facility
Number of
Patients/week Frequency Cumulative
Frequency Percent Cumulative
Percent 0 – 24 51 51 15.5 15.5
25 – 49 101 152 30.7 46.2 50 – 74 83 235 25.2 71.4 75 - 99 41 276 12.5 83.9
100 – 125 22 298 6.7 90.6 > 125 31 329 9.4 100
N Mean Std. Dev. Min. 25% Median 75% Max. Patients
329 53.4 51.2 1 20 40 75 375
Figure 2.

5
0-12 13-24 25-37 37-49 > 490
5
10
15
20
25
30
35
40
N=329Mean=26.5
Number of Intraoral Patients Examined Weekly with Surveyed X-ray Tube
Perc
ent o
f Sam
ple
Patients
Table 8. Number of Intraoral Patients Examined Weekly with Surveyed X-ray Tube
Patients Frequency Cumulative
Frequency Percent Cumulative
Percent 0-12 37 37 11.3 11.3
13-24 100 137 30.4 41.6 25-37 101 238 30.7 72.3 37-49 44 282 13.4 85.7 > 49 47 329 14.3 100
N Mean Std. Dev. Min. 25% Median 75% Max. Patients 329 26.5 24.8 0 12 20 33 200
Figure 3.

6
1 2 3 4 5 60
10
20
30
N=330Mean=3.5
Number of Intraoral Films Taken per Patient
Perc
ent o
f Sam
ple
Films
Table 9. Number of Intraoral Films Taken per Patient
Intraoral
Films/Patient Frequency Cumulative
Frequency Percent Cumulative
Percent 1 27 27 8.2 8.2 2 107 134 32.4 40.6 3 20 154 6.1 46.7 4 117 271 35.5 82.1 5 16 287 4.9 87.0 6 25 312 7.6 94.6
> 7 18 330 5.4 100
N Mean Std. Dev. Min. 25% Median 75% Max. Films per Patient 330 3.5 2.0 1 2 4 4 20
Figure 4.
7
< 50 50 - 124 125 - 199 200 - 274 > 2750
5
10
15
20
25
30
35
N=327Mean=184.9
Intraoral Entrance Skin Exposure
Perc
ent o
f Sam
ple
Exposure (mR)
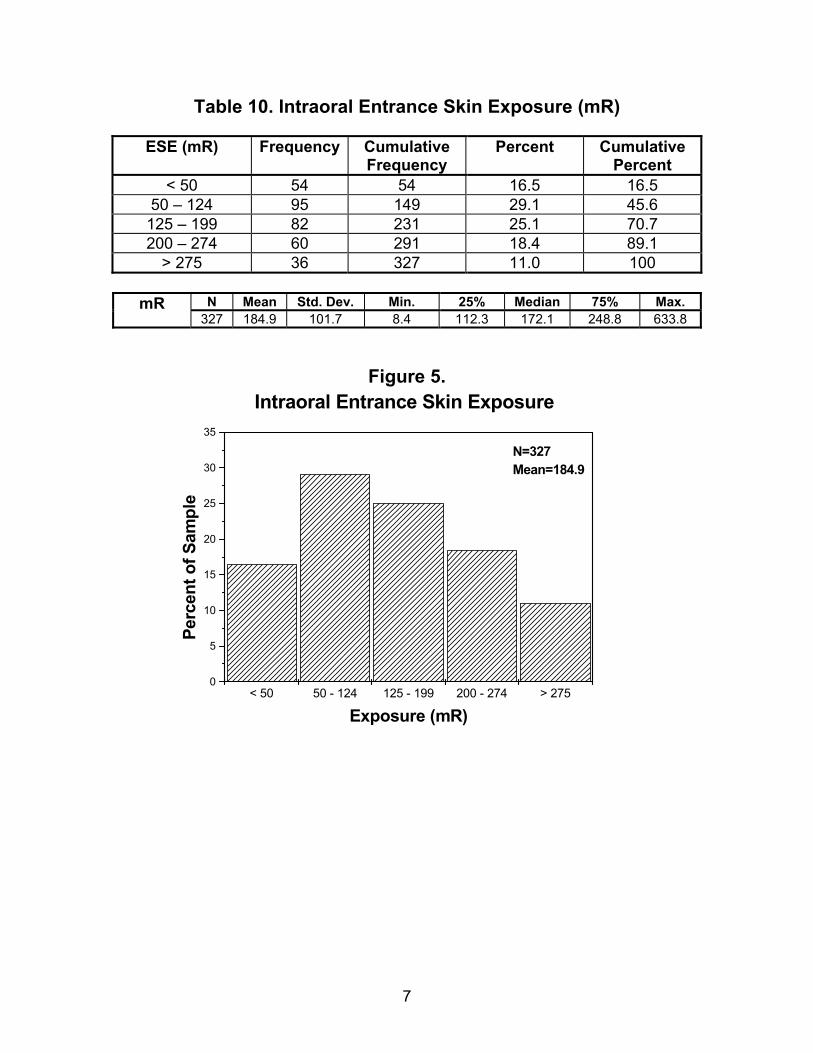
Table 10. Intraoral Entrance Skin Exposure (mR)
ESE (mR) Frequency Cumulative Frequency
Percent Cumulative Percent
< 50 54 54 16.5 16.5 50 – 124 95 149 29.1 45.6
125 – 199 82 231 25.1 70.7 200 – 274 60 291 18.4 89.1
> 275 36 327 11.0 100
N Mean Std. Dev. Min. 25% Median 75% Max. mR 327 184.9 101.7 8.4 112.3 172.1 248.8 633.8
Figure 5.
8
< 0.75 0.75-1.24 1.25-1.74 1.75-2.24 2.25-2.75 > 2.750
5
10
15
20
25
30
N=327Mean=1.6
Intraoral Entrance Skin Air Kerma
Perc
ent o
f Sam
ple
Kerma (mGy)
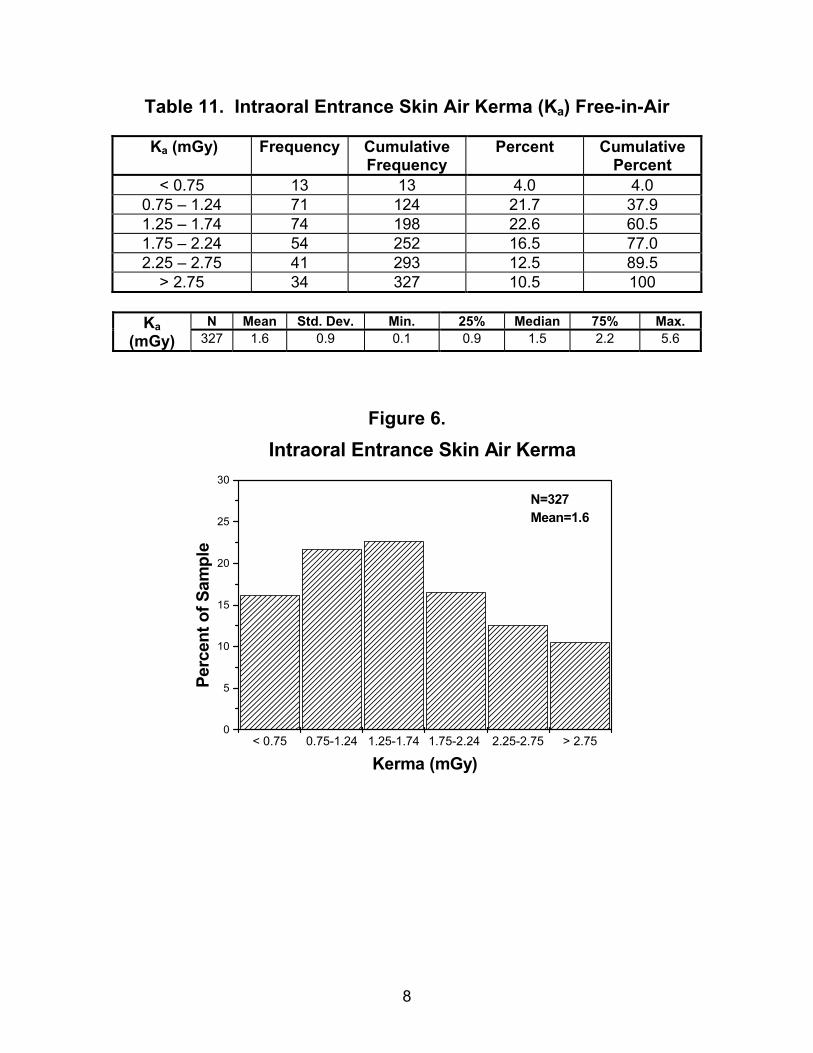
Table 11. Intraoral Entrance Skin Air Kerma (Ka) Free-in-Air
Ka (mGy) Frequency Cumulative Frequency
Percent Cumulative Percent
< 0.75 13 13 4.0 4.0 0.75 – 1.24 71 124 21.7 37.9 1.25 – 1.74 74 198 22.6 60.5 1.75 – 2.24 54 252 16.5 77.0 2.25 – 2.75 41 293 12.5 89.5
> 2.75 34 327 10.5 100
N Mean Std. Dev. Min. 25% Median 75% Max. Ka (mGy) 327 1.6 0.9 0.1 0.9 1.5 2.2 5.6
Figure 6.
9
< 50 50 - 124 125 - 199 200 - 275 > 2750
5
10
15
20
25 N=233Mean=194.6
Intraoral Entrance SkinExposure D-Speed Film
Perc
ent o
f Sam
ple
Exposure (mR)
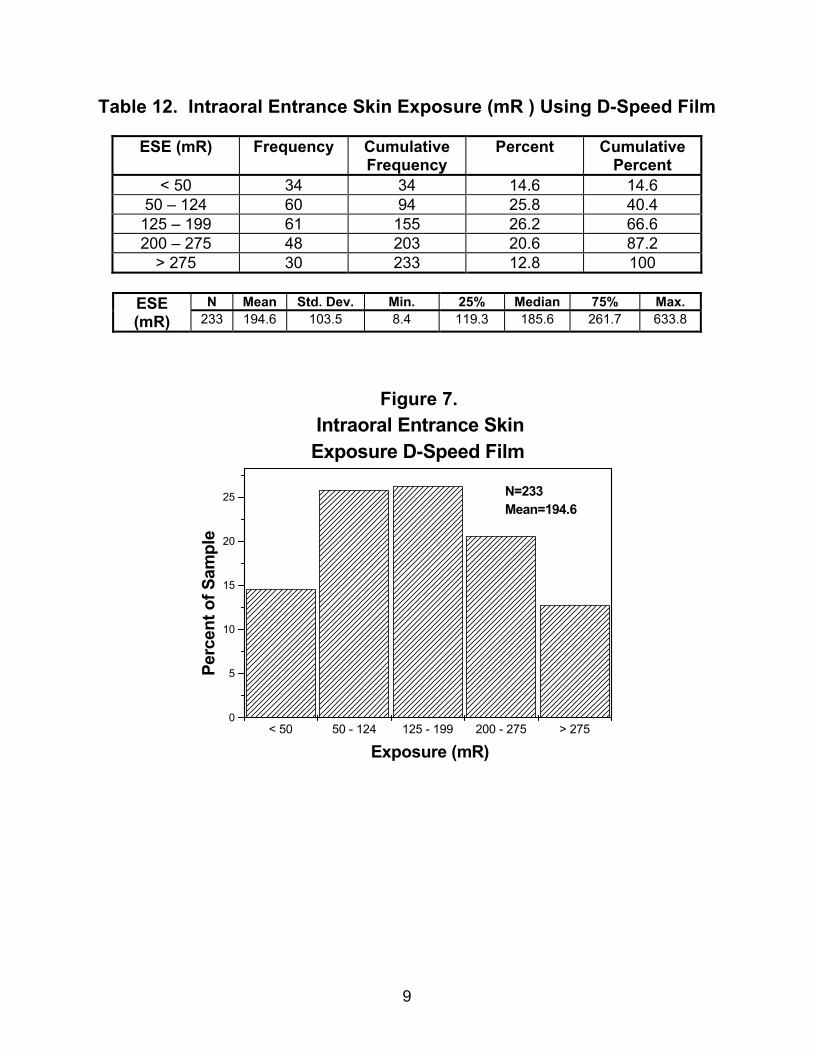
Table 12. Intraoral Entrance Skin Exposure (mR ) Using D-Speed Film
ESE (mR) Frequency Cumulative Frequency
Percent Cumulative Percent
< 50 34 34 14.6 14.6 50 – 124 60 94 25.8 40.4
125 – 199 61 155 26.2 66.6 200 – 275 48 203 20.6 87.2
> 275 30 233 12.8 100
N Mean Std. Dev. Min. 25% Median 75% Max. ESE (mR) 233 194.6 103.5 8.4 119.3 185.6 261.7 633.8
Figure 7.

10
< 0.40 0.40 - 1.19 1.20 - 1.99 2.00 - 2.79 2.80 - 3.60 > 3.600
5
10
15
20
25
30
35
N=233Mean=1.7
Intraoral Entrance SkinAir Kerma D-Speed Film
Perc
ent o
f Sam
ple
Kerma (mGy)
Table 13. Intraoral Entrance Skin Air Kerma (Ka ) Free-in-Air Using D-Speed Film
Ka (mGy) Frequency Cumulative
Frequency Percent Cumulative
Percent < 0.40 15 15 6.4 6.4
0.40 – 1.19 57 72 24.5 30.9 1.20 – 1.99 77 149 33.1 64.0 2.00 – 2.79 59 208 25.3 89.3 2.80 – 3.60 20 228 8.6 97.9
> 3.60 5 233 2.1 100
N Mean Std. Dev. Min. 25% Median 75% Max. Ka (mGy) 233 1.7 0.9 0.1 1.0 1.6 2.3 5.5
Figure 8.
11
< 50 50 - 99 100 - 149 150 - 200 > 2000
5
10
15
20
25
30
35N=53Mean=148.4
Intraoral Entrance SkinExposure using E-Speed Film
Perc
ent o
f Sam
ple
Exposure (mR)
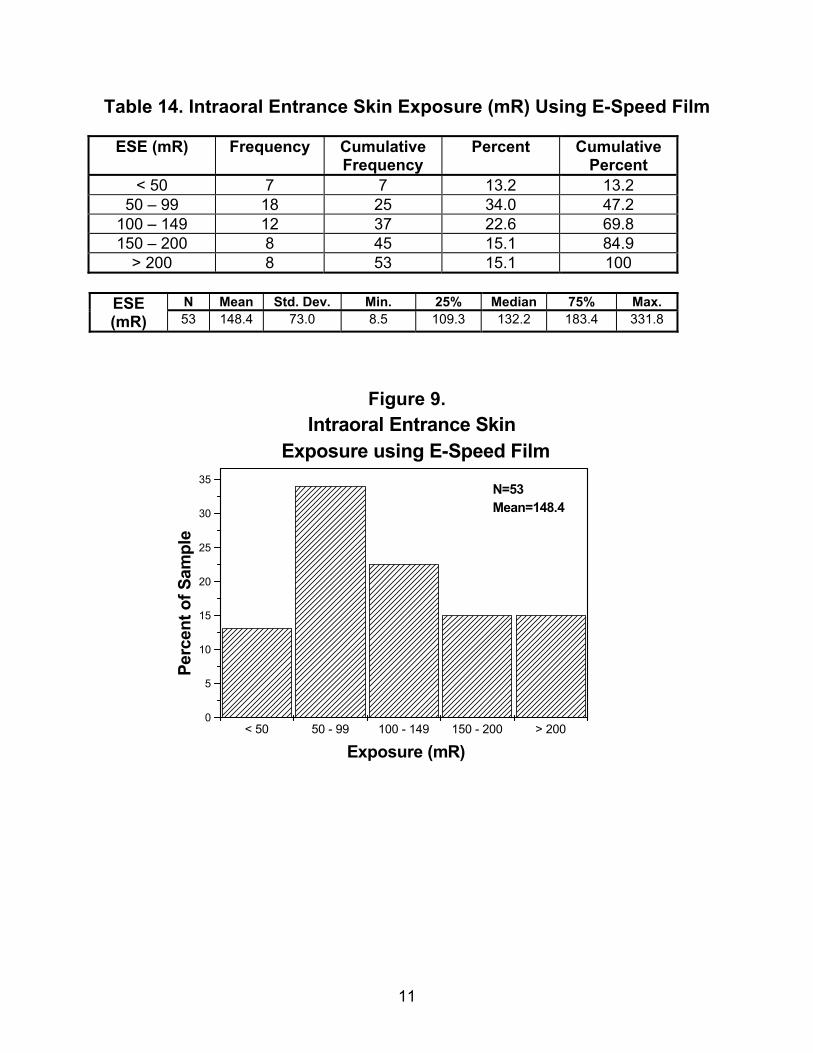
Table 14. Intraoral Entrance Skin Exposure (mR) Using E-Speed Film
ESE (mR) Frequency Cumulative Frequency
Percent Cumulative Percent
< 50 7 7 13.2 13.2 50 – 99 18 25 34.0 47.2
100 – 149 12 37 22.6 69.8 150 – 200 8 45 15.1 84.9
> 200 8 53 15.1 100
N Mean Std. Dev. Min. 25% Median 75% Max. ESE (mR) 53 148.4 73.0 8.5 109.3 132.2 183.4 331.8
Figure 9.
12
< 0.75 0.75 - 1.24 1.25 - 1.74 1.75 - 2.24 2.25 - 2.75 > 2.750
5
10
15
20
25
30
35N=53Mean=1.3
Intraoral Entrance SkinAir Kerma using E-Speed Film
Perc
ent o
f Sam
ple
Kerma (mGy)
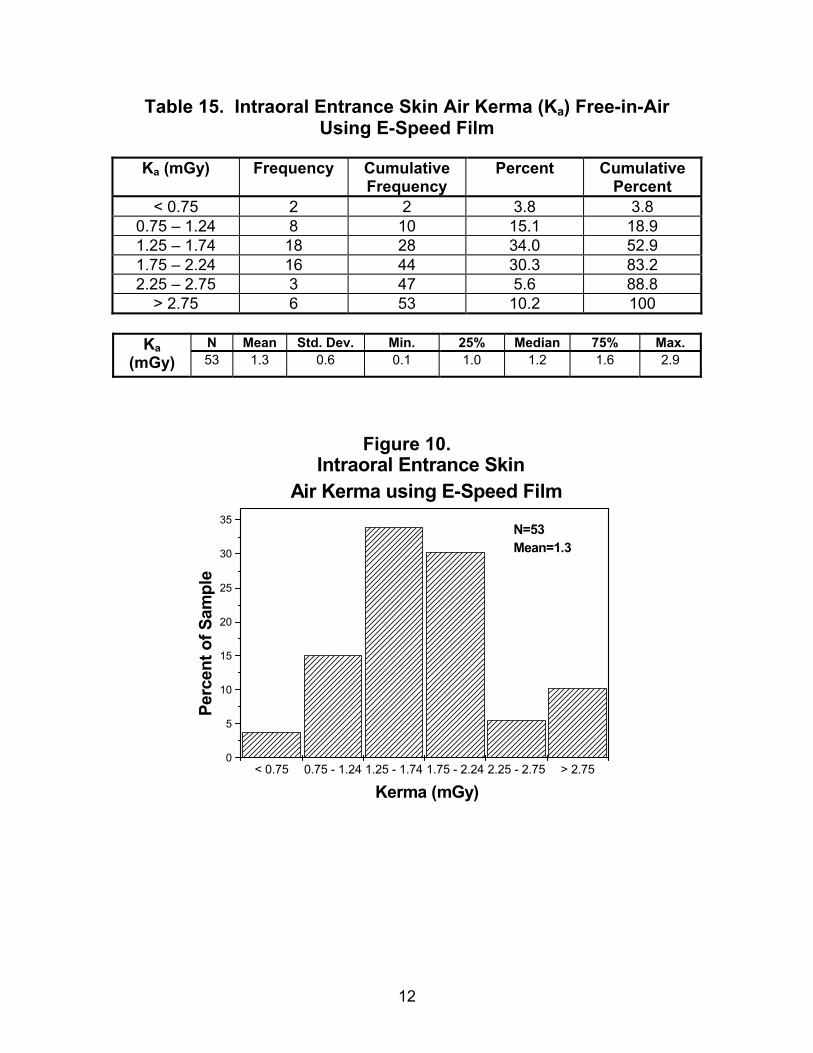
Table 15. Intraoral Entrance Skin Air Kerma (Ka) Free-in-Air Using E-Speed Film
Ka (mGy) Frequency Cumulative
Frequency Percent Cumulative
Percent < 0.75 2 2 3.8 3.8
0.75 – 1.24 8 10 15.1 18.9 1.25 – 1.74 18 28 34.0 52.9 1.75 – 2.24 16 44 30.3 83.2 2.25 – 2.75 3 47 5.6 88.8
> 2.75 6 53 10.2 100
N Mean Std. Dev. Min. 25% Median 75% Max. Ka (mGy) 53 1.3 0.6 0.1 1.0 1.2 1.6 2.9
Figure 10.
13
< 25 25 - 99 100 - 174 175 - 250 > 2500
5
10
15
20
25
30
N=41Mean=177.2
Intraoral Entrance Skin Exposureusing Unknown Speed Class of Film
Perc
ent o
f Sam
ple
Exposure (mR)
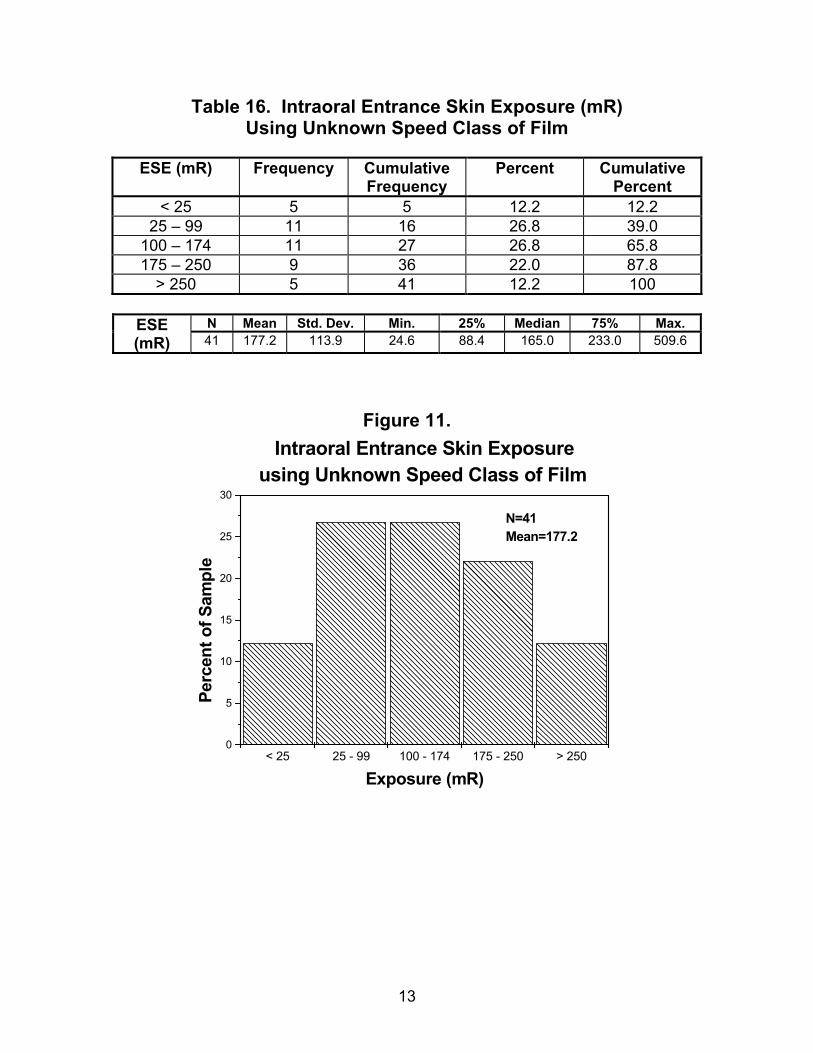
Table 16. Intraoral Entrance Skin Exposure (mR) Using Unknown Speed Class of Film
ESE (mR) Frequency Cumulative
Frequency Percent Cumulative
Percent < 25 5 5 12.2 12.2
25 – 99 11 16 26.8 39.0 100 – 174 11 27 26.8 65.8 175 – 250 9 36 22.0 87.8
> 250 5 41 12.2 100
N Mean Std. Dev. Min. 25% Median 75% Max. ESE (mR) 41 177.2 113.9 24.6 88.4 165.0 233.0 509.6
Figure 11.

14
< 0.30 0.30 - 0.89 0.90 - 1.49 1.50 - 2.09 2.10 - 2.70 > 2.700
5
10
15
20
25N=41Mean=1.6
Intraoral Entrance Skin Air Kermausing Unknown Speed Class of Film
Perc
ent o
f Sam
ple
Kerma (mGy)
Table 17. Intraoral Entrance Skin Air Kerma (Ka) Free-in-Air Using Unknown Speed Class of Film
Ka (mGy) Frequency Cumulative
Frequency Percent Cumulative
Percent < 0.30 2 2 4.9 4.9
0.30 – 0.89 11 13 26.8 31.7 0.90 – 1.49 9 22 22.0 53.7 1.50 – 2.09 9 31 22.0 75.7 2.10 – 2.70 6 37 14.6 90.3
> 2.70 4 41 9.7 100
N Mean Std. Dev. Min. 25% Median 75% Max. Ka (mGy) 41 1.6 1.0 0.2 0.8 1.4 2.0 4.5
Figure 12.
15
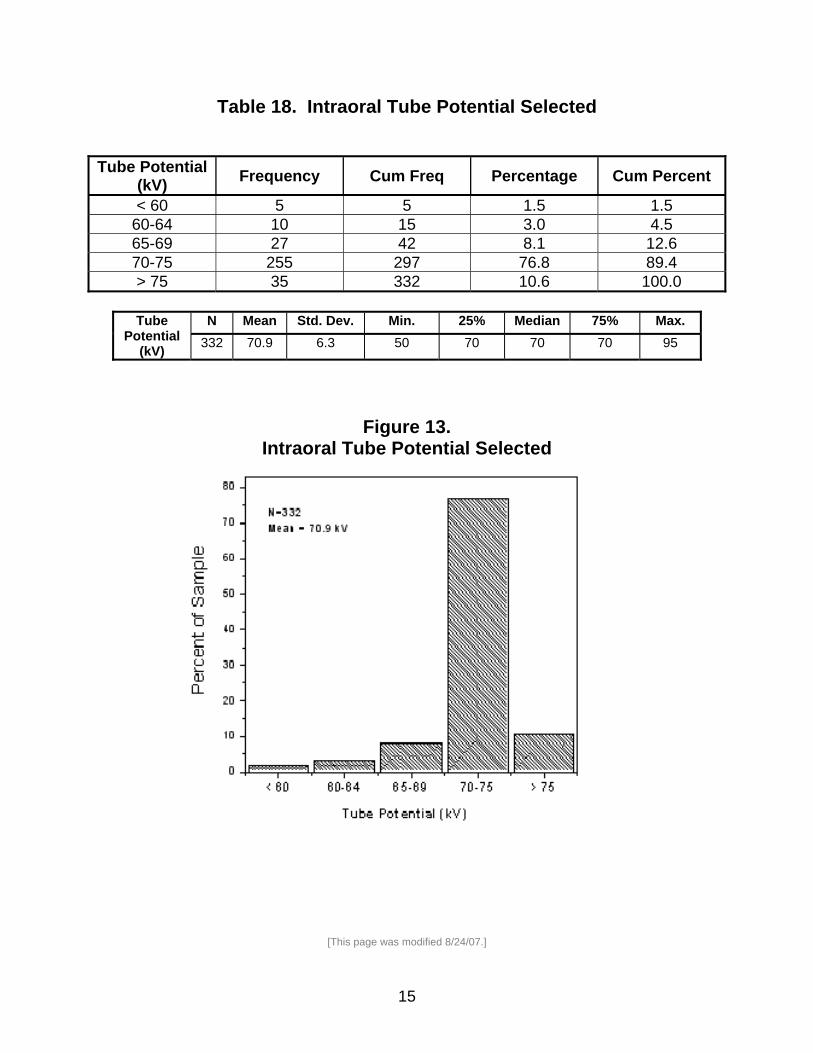
Table 18. Intraoral Tube Potential Selected
N Mean Std. Dev. Min. 25% Median 75% Max. Tube
Potential (kV) 332 70.9 6.3 50 70 70 70 95
Figure 13. Intraoral Tube Potential Selected
[This page was modified 8/24/07.]
Tube Potential (kV) Frequency Cum Freq Percentage Cum Percent
< 60 5 5 1.5 1.5 60-64 10 15 3.0 4.5 65-69 27 42 8.1 12.6 70-75 255 297 76.8 89.4 > 75 35 332 10.6 100.0
16
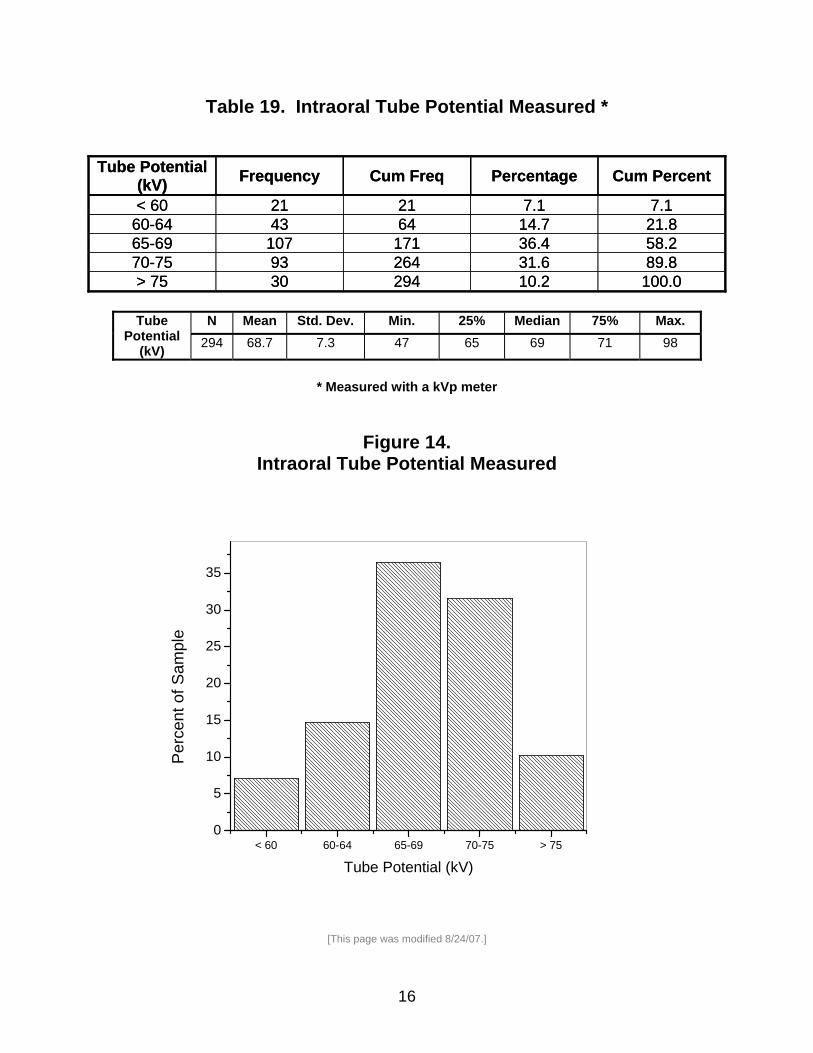
Table 19. Intraoral Tube Potential Measured *
N Mean Std. Dev. Min. 25% Median 75% Max. Tube
Potential (kV) 294 68.7 7.3 47 65 69 71 98
* Measured with a kVp meter
Figure 14. Intraoral Tube Potential Measured
[This page was modified 8/24/07.]
Tube Potential (kV) Frequency Cum Freq Percentage Cum Percent
< 60 21 21 7.1 7.1 60-64 43 64 14.7 21.8 65-69 107 171 36.4 58.2 70-75 93 264 31.6 89.8 > 75 30 294 10.2 100.0
Tube Potential (kV) Frequency Cum Freq Percentage Cum Percent
< 60 21 21 7.1 7.1 60-64 43 64 14.7 21.8 65-69 107 171 36.4 58.2 70-75 93 264 31.6 89.8 > 75 30 294 10.2 100.0
< 60 60-64 65-69 70-75 > 750
5
10
15
20
25
30
35
Perc
ent o
f Sam
ple
Tube Potential (kV)
Figure 14.Intraoral Tube Potential Measured
17
0 0 - 2 3 - 5 6 - 8 > 8 0
5
10
15
20
25
30
35N = 290Mean=3.8
Absolute Value of Difference in Tube Potential: Measured vs. Selected
Perc
ent o
f Sam
ple
Voltage Difference (kV)
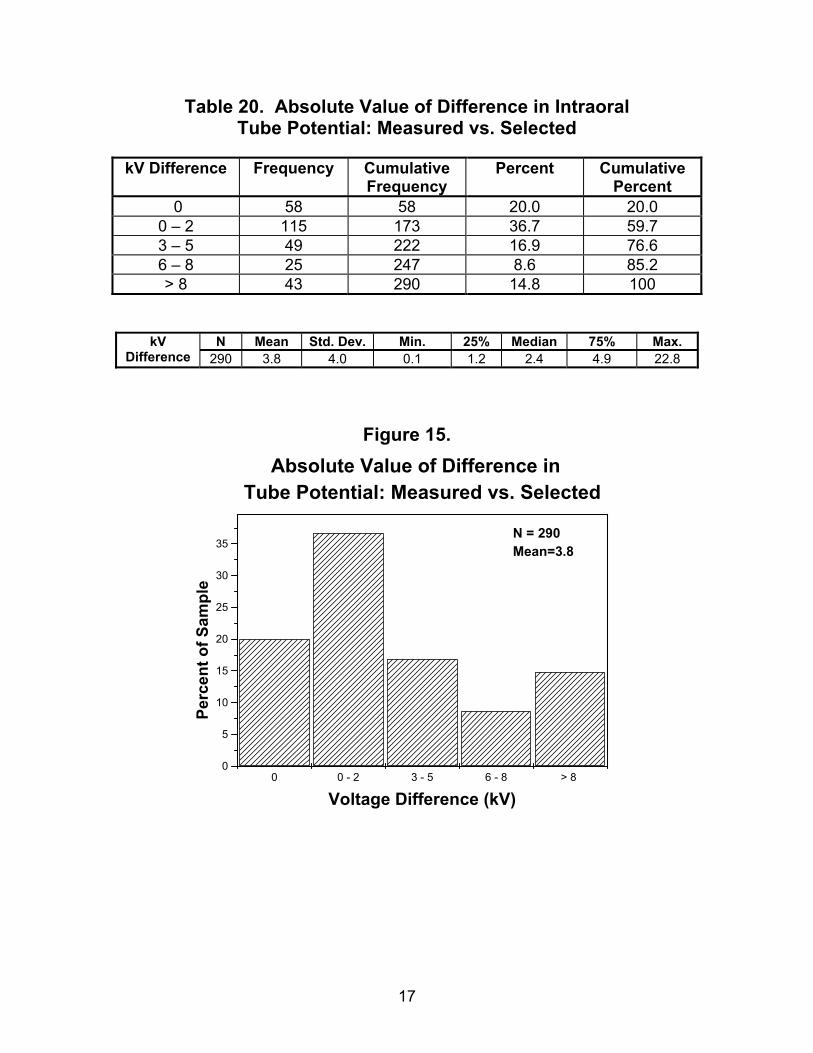
Table 20. Absolute Value of Difference in Intraoral Tube Potential: Measured vs. Selected
kV Difference Frequency Cumulative
Frequency Percent Cumulative
Percent 0 58 58 20.0 20.0
0 – 2 115 173 36.7 59.7 3 – 5 49 222 16.9 76.6 6 – 8 25 247 8.6 85.2 > 8 43 290 14.8 100
N Mean Std. Dev. Min. 25% Median 75% Max. kV Difference 290 3.8 4.0 0.1 1.2 2.4 4.9 22.8
Figure 15.
18
< 60 60-64 65-69 70-75 75-80 > 800
5
10
15
20
25
30
35
N=107Mean=72.2
Intraoral Tube Potential:Copper Filtration Method
Perc
ent o
f Sam
ple
Tube Potential (kV)
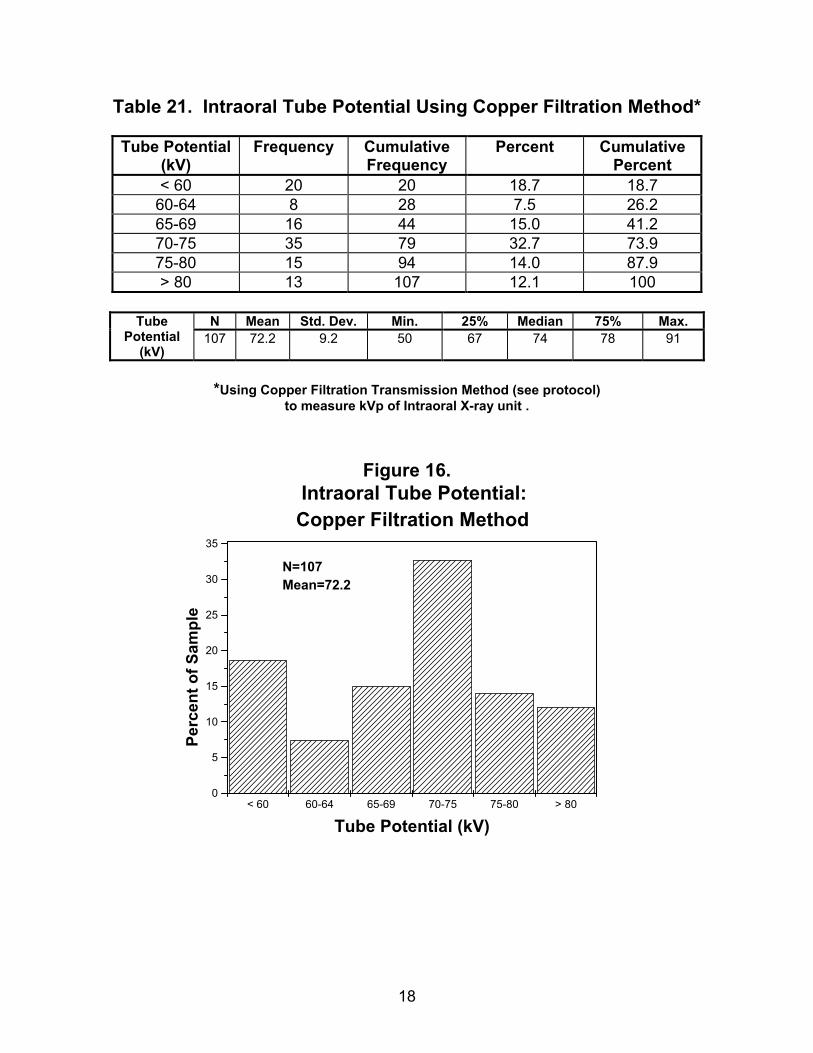
Table 21. Intraoral Tube Potential Using Copper Filtration Method*
Tube Potential (kV)
Frequency Cumulative Frequency
Percent Cumulative Percent
< 60 20 20 18.7 18.7 60-64 8 28 7.5 26.2 65-69 16 44 15.0 41.2 70-75 35 79 32.7 73.9 75-80 15 94 14.0 87.9 > 80 13 107 12.1 100
N Mean Std. Dev. Min. 25% Median 75% Max. Tube
Potential (kV)
107 72.2 9.2 50 67 74 78 91
*Using Copper Filtration Transmission Method (see protocol)
to measure kVp of Intraoral X-ray unit .
Figure 16.
19
< 1 1.0 - 3.9 4.0 - 6.9 7.0 - 10 > 100
5
10
15
20
25
30 N=105Mean=6.6
Absolute Value of Difference in Tube Potential: Selected vs. Measured (using Copper Method)
Perc
ent o
f Sam
ple
Voltage Difference (kV)
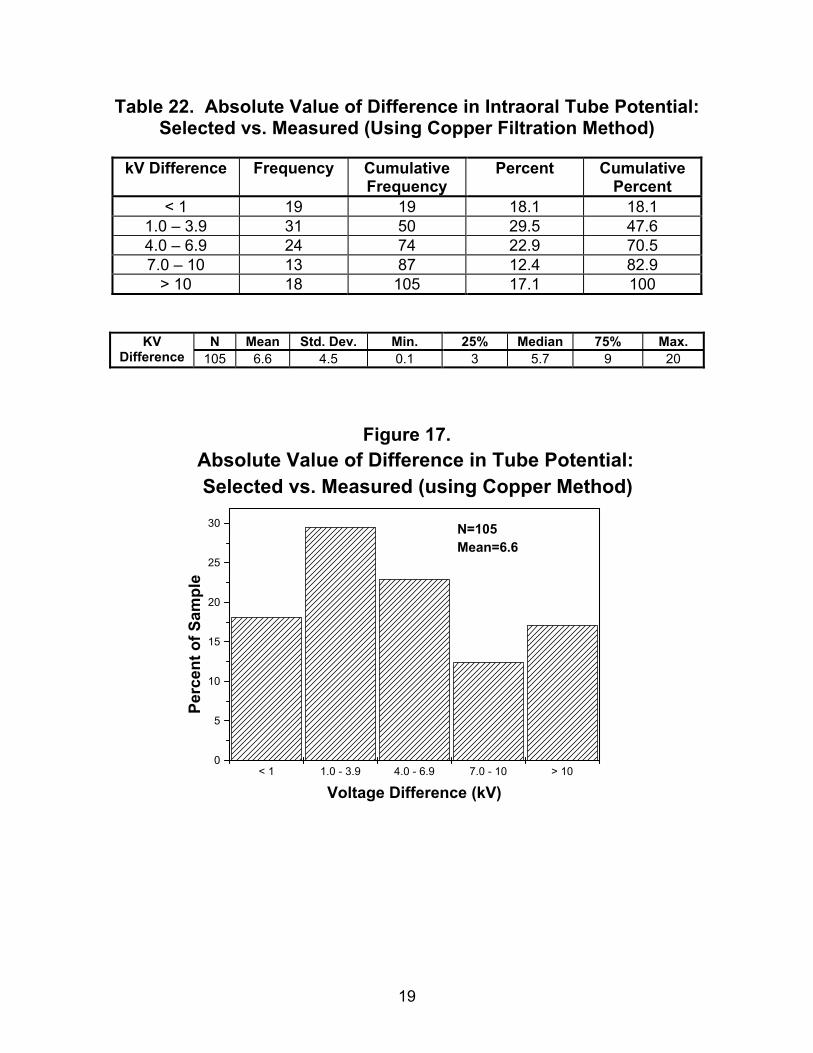
Table 22. Absolute Value of Difference in Intraoral Tube Potential: Selected vs. Measured (Using Copper Filtration Method)
kV Difference Frequency Cumulative
Frequency Percent Cumulative
Percent < 1 19 19 18.1 18.1
1.0 – 3.9 31 50 29.5 47.6 4.0 – 6.9 24 74 22.9 70.5 7.0 – 10 13 87 12.4 82.9
> 10 18 105 17.1 100
N Mean Std. Dev. Min. 25% Median 75% Max. KV Difference 105 6.6 4.5 0.1 3 5.7 9 20
Figure 17.
20
< 1.8 1.8 - 2.1 2.2 - 2.4 2.5 - 2.7 > 2.70
5
10
15
20
25
30 N=328Mean=2.3
Intraoral Half-Value Layer (mm Al) at Clinical Tube Potential
Perc
ent o
f Sam
ple
Aluminum (mm)
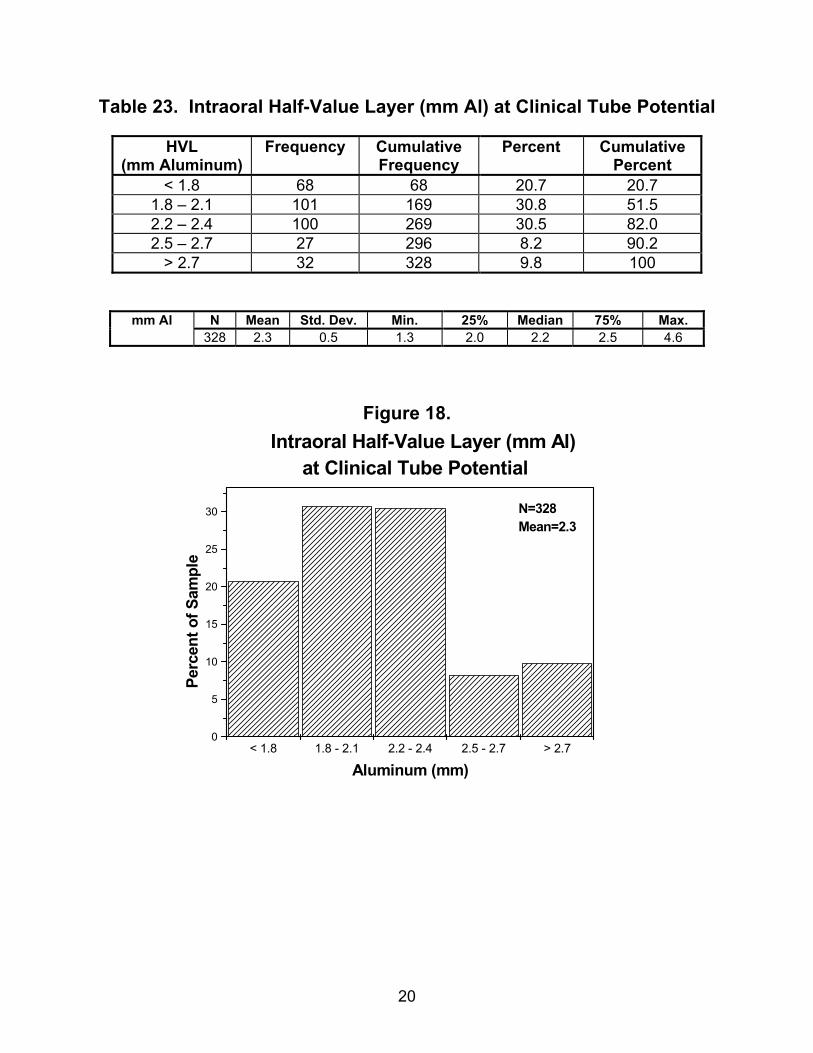
Table 23. Intraoral Half-Value Layer (mm Al) at Clinical Tube Potential
HVL (mm Aluminum)
Frequency Cumulative Frequency
Percent Cumulative Percent
< 1.8 68 68 20.7 20.7 1.8 – 2.1 101 169 30.8 51.5 2.2 – 2.4 100 269 30.5 82.0 2.5 – 2.7 27 296 8.2 90.2
> 2.7 32 328 9.8 100
N Mean Std. Dev. Min. 25% Median 75% Max. mm Al 328 2.3 0.5 1.3 2.0 2.2 2.5 4.6
Figure 18.
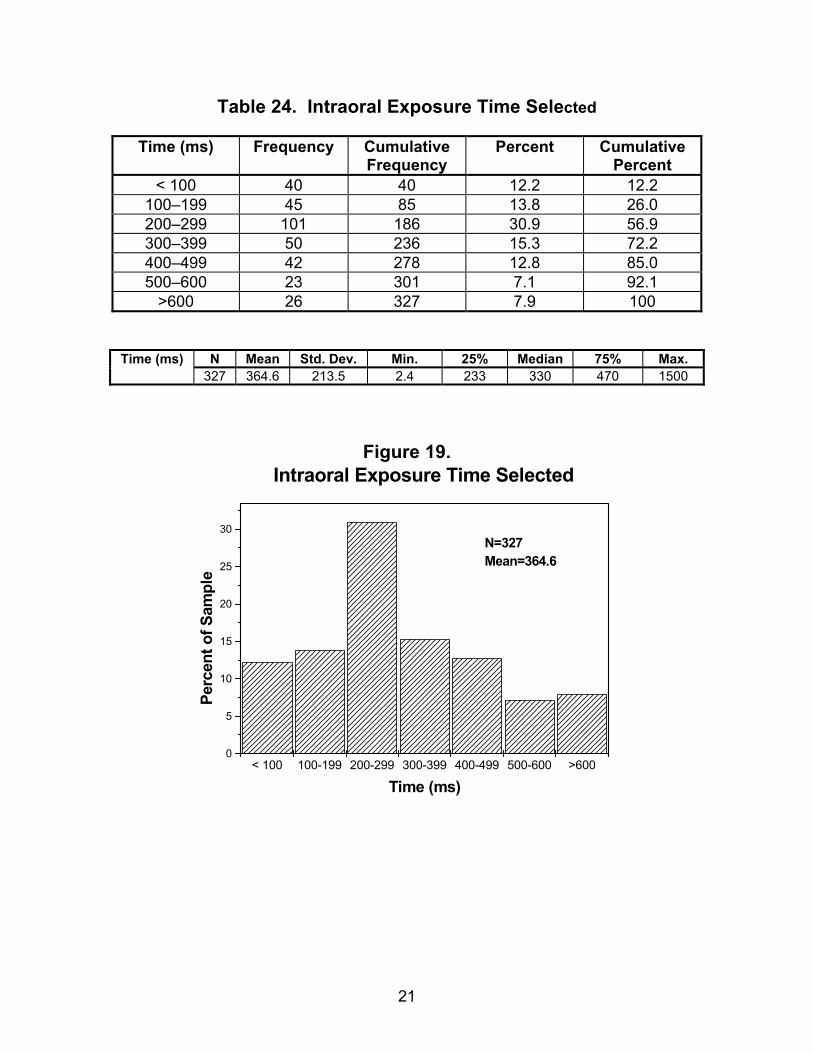
21
< 100 100-199 200-299 300-399 400-499 500-600 >6000
5
10
15
20
25
30N=327Mean=364.6
Intraoral Exposure Time Selected
Perc
ent o
f Sam
ple
Time (ms)
Table 24. Intraoral Exposure Time Selected
Time (ms) Frequency Cumulative Frequency
Percent Cumulative Percent
< 100 40 40 12.2 12.2 100–199 45 85 13.8 26.0 200–299 101 186 30.9 56.9 300–399 50 236 15.3 72.2 400–499 42 278 12.8 85.0 500–600 23 301 7.1 92.1
>600 26 327 7.9 100
N Mean Std. Dev. Min. 25% Median 75% Max. Time (ms) 327 364.6 213.5 2.4 233 330 470 1500
Figure 19.
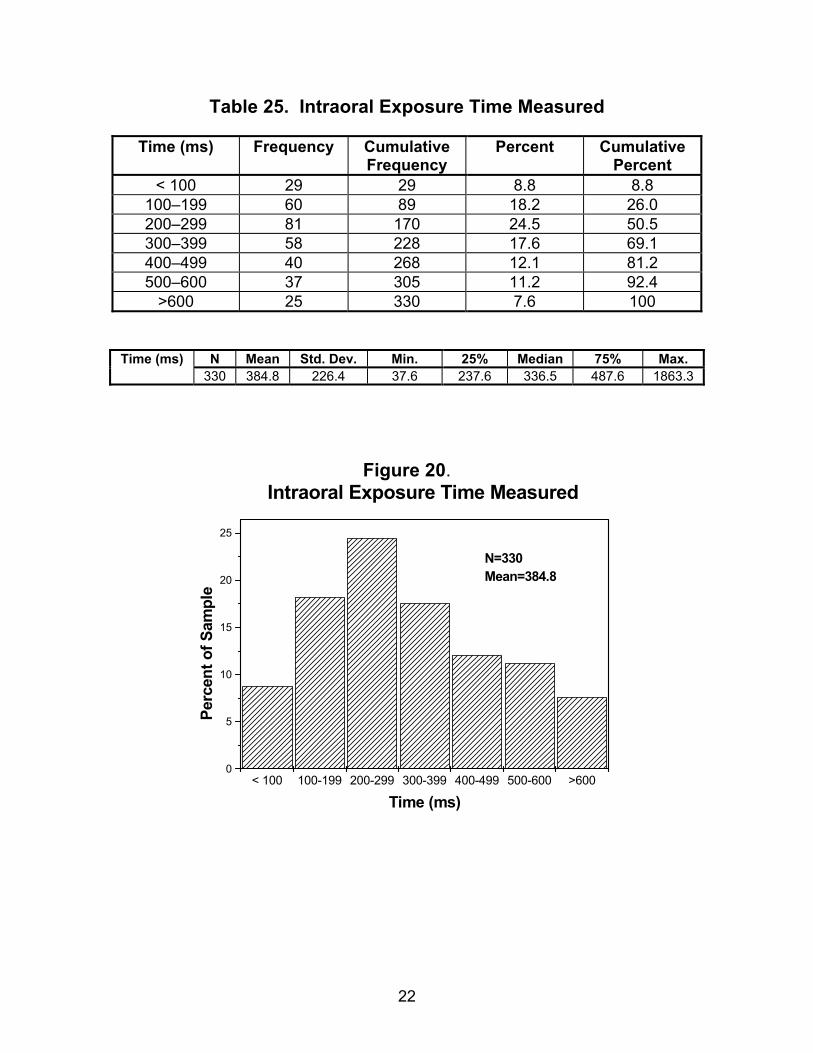
22
< 100 100-199 200-299 300-399 400-499 500-600 >6000
5
10
15
20
25
N=330Mean=384.8
Intraoral Exposure Time Measured
Perc
ent o
f Sam
ple
Time (ms)
Table 25. Intraoral Exposure Time Measured
Time (ms) Frequency Cumulative Frequency
Percent Cumulative Percent
< 100 29 29 8.8 8.8 100–199 60 89 18.2 26.0 200–299 81 170 24.5 50.5 300–399 58 228 17.6 69.1 400–499 40 268 12.1 81.2 500–600 37 305 11.2 92.4
>600 25 330 7.6 100
N Mean Std. Dev. Min. 25% Median 75% Max. Time (ms) 330 384.8 226.4 37.6 237.6 336.5 487.6 1863.3
Figure 20.
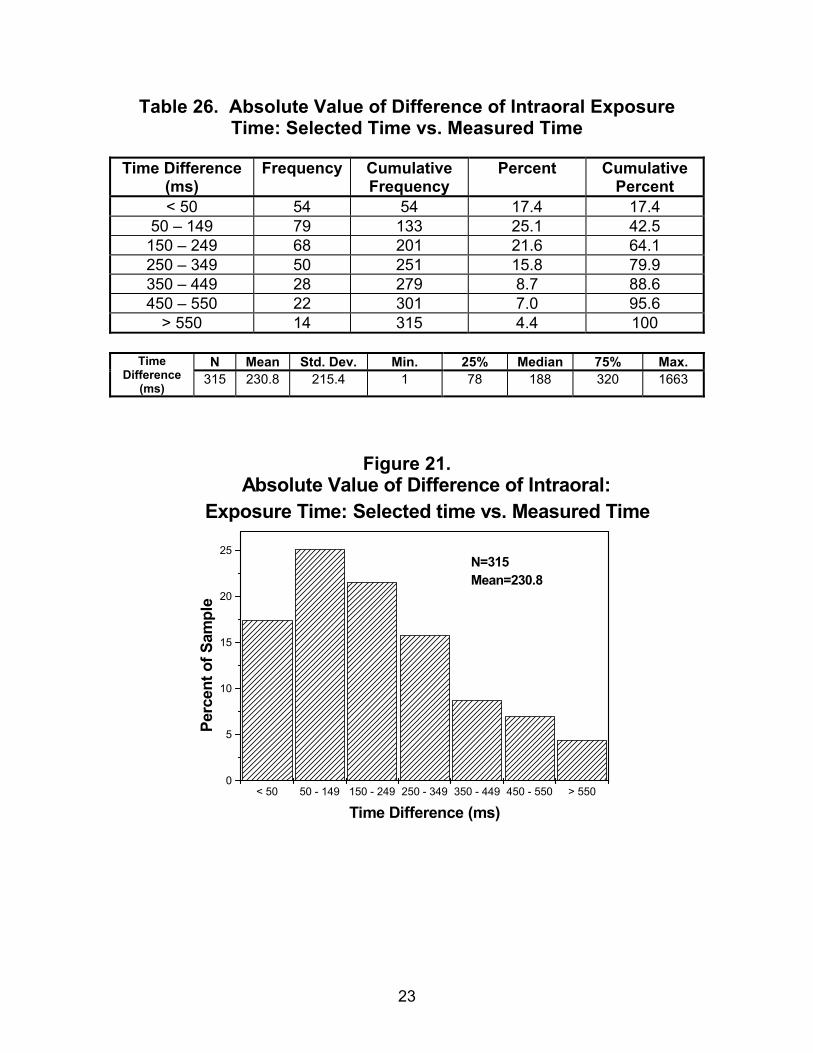
23
< 50 50 - 149 150 - 249 250 - 349 350 - 449 450 - 550 > 5500
5
10
15
20
25N=315Mean=230.8
Absolute Value of Difference of Intraoral:Exposure Time: Selected time vs. Measured Time
Perc
ent o
f Sam
ple
Time Difference (ms)
Table 26. Absolute Value of Difference of Intraoral Exposure Time: Selected Time vs. Measured Time
Time Difference
(ms) Frequency Cumulative
Frequency Percent Cumulative
Percent < 50 54 54 17.4 17.4
50 – 149 79 133 25.1 42.5 150 – 249 68 201 21.6 64.1 250 – 349 50 251 15.8 79.9 350 – 449 28 279 8.7 88.6 450 – 550 22 301 7.0 95.6
> 550 14 315 4.4 100
N Mean Std. Dev. Min. 25% Median 75% Max. Time Difference
(ms) 315 230.8 215.4 1 78 188 320 1663
Figure 21.
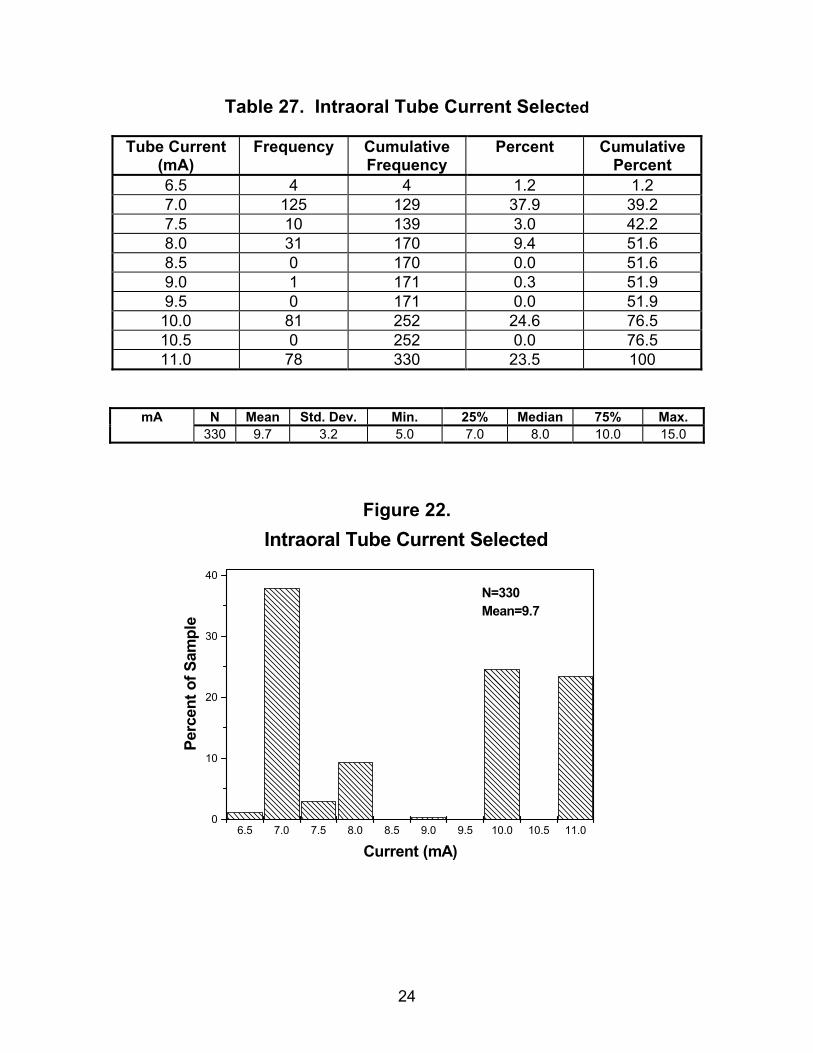
24
6.5 7.0 7.5 8.0 8.5 9.0 9.5 10.0 10.5 11.00
10
20
30
40
N=330Mean=9.7
Intraoral Tube Current Selected
Perc
ent o
f Sam
ple
Current (mA)
Table 27. Intraoral Tube Current Selected
Tube Current (mA)
Frequency Cumulative Frequency
Percent Cumulative Percent
6.5 4 4 1.2 1.2 7.0 125 129 37.9 39.2 7.5 10 139 3.0 42.2 8.0 31 170 9.4 51.6 8.5 0 170 0.0 51.6 9.0 1 171 0.3 51.9 9.5 0 171 0.0 51.9
10.0 81 252 24.6 76.5 10.5 0 252 0.0 76.5 11.0 78 330 23.5 100
N Mean Std. Dev. Min. 25% Median 75% Max. mA 330 9.7 3.2 5.0 7.0 8.0 10.0 15.0
Figure 22.
25
< 1.0 1.0 - 1.9 2.0 - 2.9 3.0 - 3.9 4.0 - 4.9 5.0 - 6.0 > 6.00
5
10
15
20
25
30N=325Mean=3.6
Intraoral mAs Values Selected
Perc
ent o
f Sam
ple
mAs
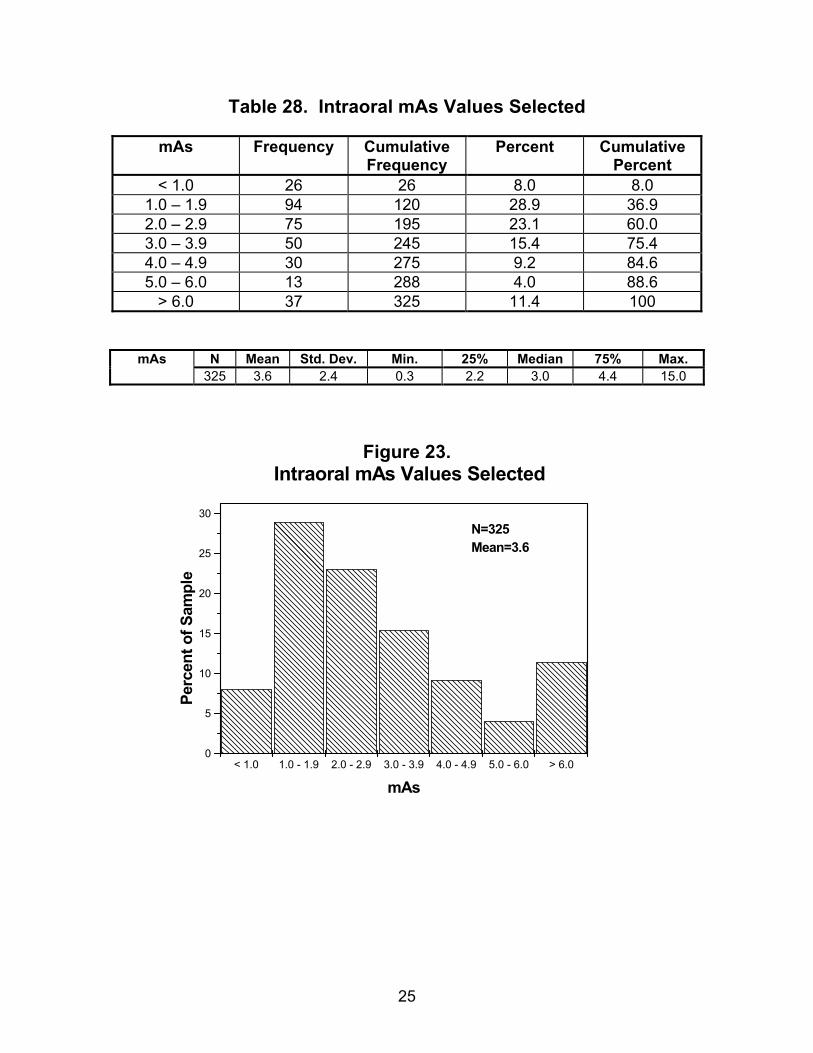
Table 28. Intraoral mAs Values Selected
mAs Frequency Cumulative Frequency
Percent Cumulative Percent
< 1.0 26 26 8.0 8.0 1.0 – 1.9 94 120 28.9 36.9 2.0 – 2.9 75 195 23.1 60.0 3.0 – 3.9 50 245 15.4 75.4 4.0 – 4.9 30 275 9.2 84.6 5.0 – 6.0 13 288 4.0 88.6
> 6.0 37 325 11.4 100
N Mean Std. Dev. Min. 25% Median 75% Max. mAs 325 3.6 2.4 0.3 2.2 3.0 4.4 15.0
Figure 23.
26
0.00 .01 - .029 .03 - .049 .05 - .069 .07 - .090 > .090
10
20
30
40
50 N=227Mean=0.07
Darkroom Fog Optical Density for Intraoral Facilities
Perc
ent o
f Sam
ple
Optical Density
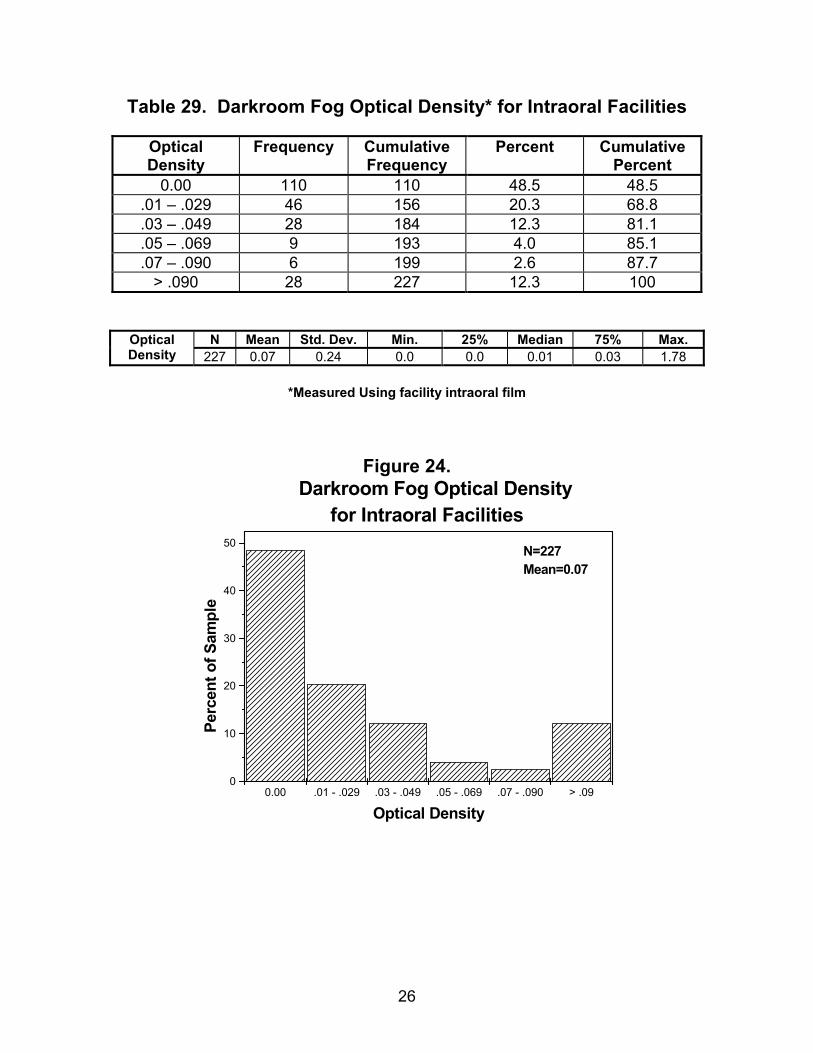
Table 29. Darkroom Fog Optical Density* for Intraoral Facilities
Optical Density
Frequency Cumulative Frequency
Percent Cumulative Percent
0.00 110 110 48.5 48.5 .01 – .029 46 156 20.3 68.8 .03 – .049 28 184 12.3 81.1 .05 – .069 9 193 4.0 85.1 .07 – .090 6 199 2.6 87.7
> .090 28 227 12.3 100
N Mean Std. Dev. Min. 25% Median 75% Max. Optical Density 227 0.07 0.24 0.0 0.0 0.01 0.03 1.78
*Measured Using facility intraoral film
Figure 24.
27
0.00 .01 - .10 .11 - .20 .21 - .30 .31 - 40 .41 -.51 > 0.510
10
20
30
40 N=76Mean=0.16
Fog Optical Density usingDaylight Processing System
Perc
ent o
f Sam
ple
Optical Density
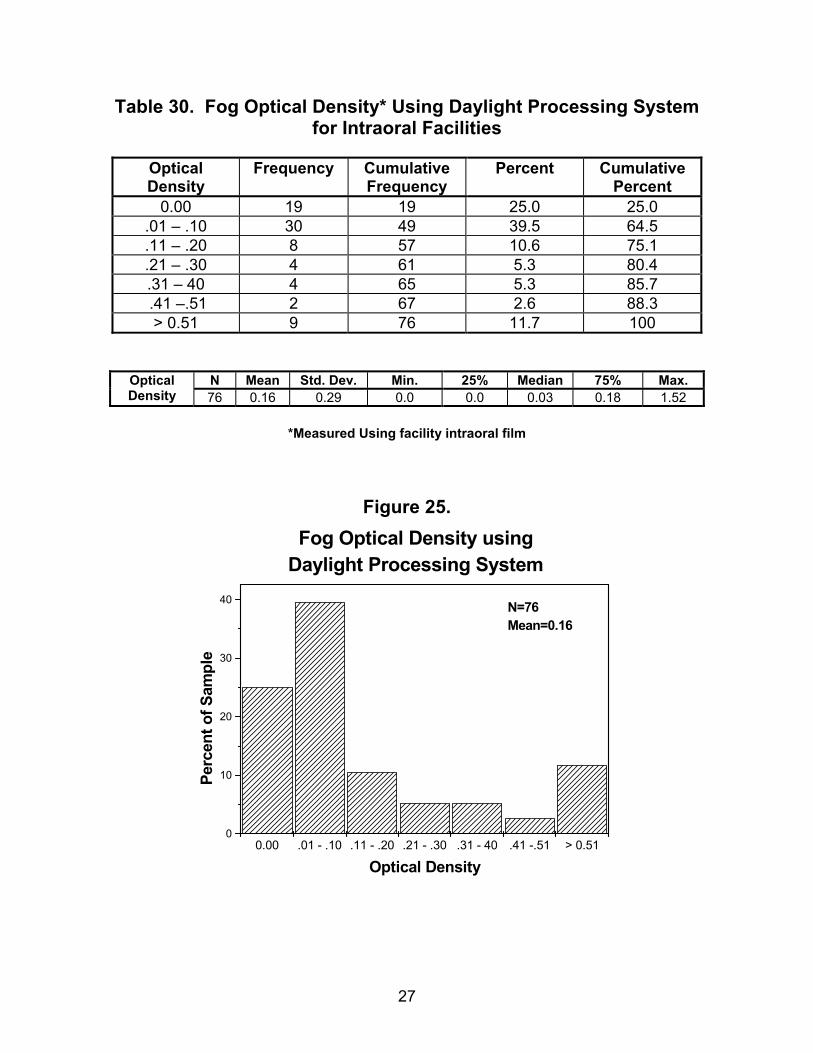
Table 30. Fog Optical Density* Using Daylight Processing System for Intraoral Facilities
Optical Density
Frequency Cumulative Frequency
Percent Cumulative Percent
0.00 19 19 25.0 25.0 .01 – .10 30 49 39.5 64.5 .11 – .20 8 57 10.6 75.1 .21 – .30 4 61 5.3 80.4 .31 – 40 4 65 5.3 85.7 .41 –.51 2 67 2.6 88.3 > 0.51 9 76 11.7 100
N Mean Std. Dev. Min. 25% Median 75% Max. Optical Density 76 0.16 0.29 0.0 0.0 0.03 0.18 1.52
*Measured Using facility intraoral film
Figure 25.
28
< 0.50 0.50 - 1.49 1.50 - 1.99 2.00 - 2.50 > 2.500
5
10
15
20
25
30
35
40
45
N=324Mean=1.49
Intraoral Phantom Film Optical Density
Perc
ent o
f Sam
ple
Optical Density
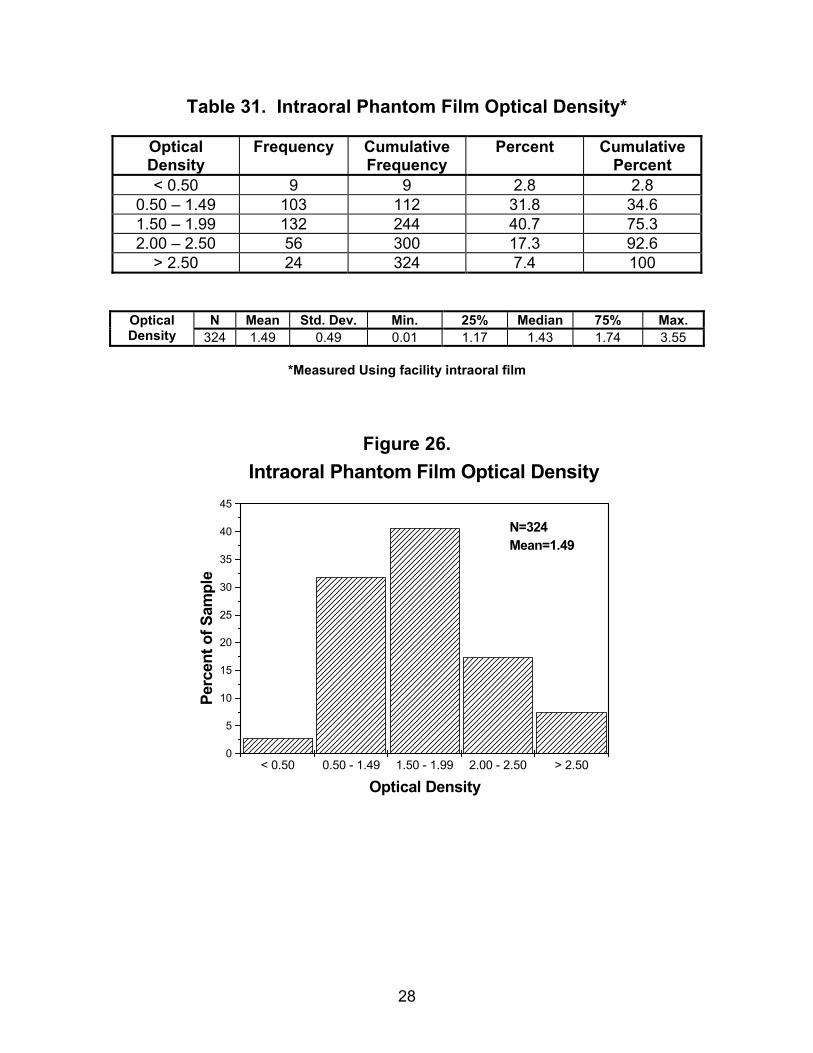
Table 31. Intraoral Phantom Film Optical Density*
Optical Density
Frequency Cumulative Frequency
Percent Cumulative Percent
< 0.50 9 9 2.8 2.8 0.50 – 1.49 103 112 31.8 34.6 1.50 – 1.99 132 244 40.7 75.3 2.00 – 2.50 56 300 17.3 92.6
> 2.50 24 324 7.4 100
N Mean Std. Dev. Min. 25% Median 75% Max. Optical Density 324 1.49 0.49 0.01 1.17 1.43 1.74 3.55
*Measured Using facility intraoral film
Figure 26.
29
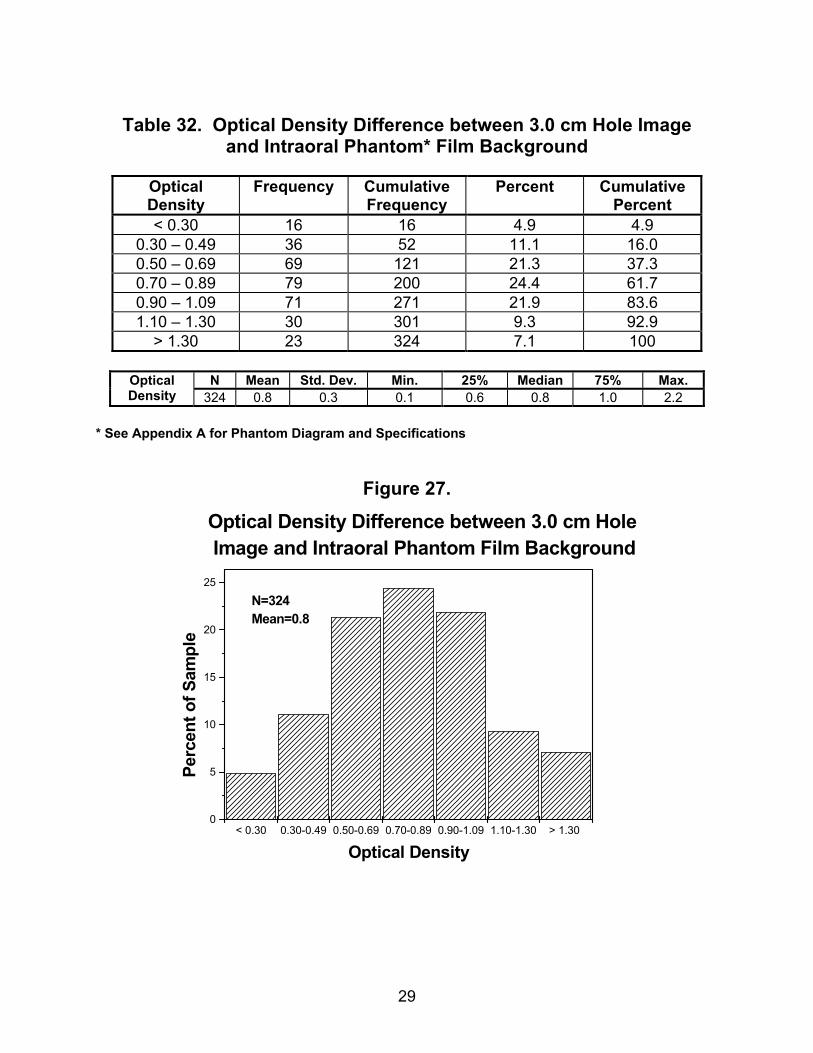
Table 32. Optical Density Difference between 3.0 cm Hole Image
and Intraoral Phantom* Film Background
Optical Density
Frequency Cumulative Frequency
Percent Cumulative Percent
< 0.30 16 16 4.9 4.9 0.30 – 0.49 36 52 11.1 16.0 0.50 – 0.69 69 121 21.3 37.3 0.70 – 0.89 79 200 24.4 61.7 0.90 – 1.09 71 271 21.9 83.6 1.10 – 1.30 30 301 9.3 92.9
> 1.30 23 324 7.1 100
N Mean Std. Dev. Min. 25% Median 75% Max. Optical Density 324 0.8 0.3 0.1 0.6 0.8 1.0 2.2
* See Appendix A for Phantom Diagram and Specifications
Figure 27.
Figure 27.
< 0.30 0.30-0.49 0.50-0.69 0.70-0.89 0.90-1.09 1.10-1.30 > 1.30 0
5
10
15
20
25
N=324Mean=0.8
Optical Density Difference between 3.0 cm Hole Image and Intraoral Phantom Film Background
Perc
ent o
f Sam
ple
Optical Density
30
< 0.20 0.20 - 0.39 0.40 - 0.59 0.60 - 0.79 0.80 - 1.00 > 1.000
5
10
15
20
25
30
35
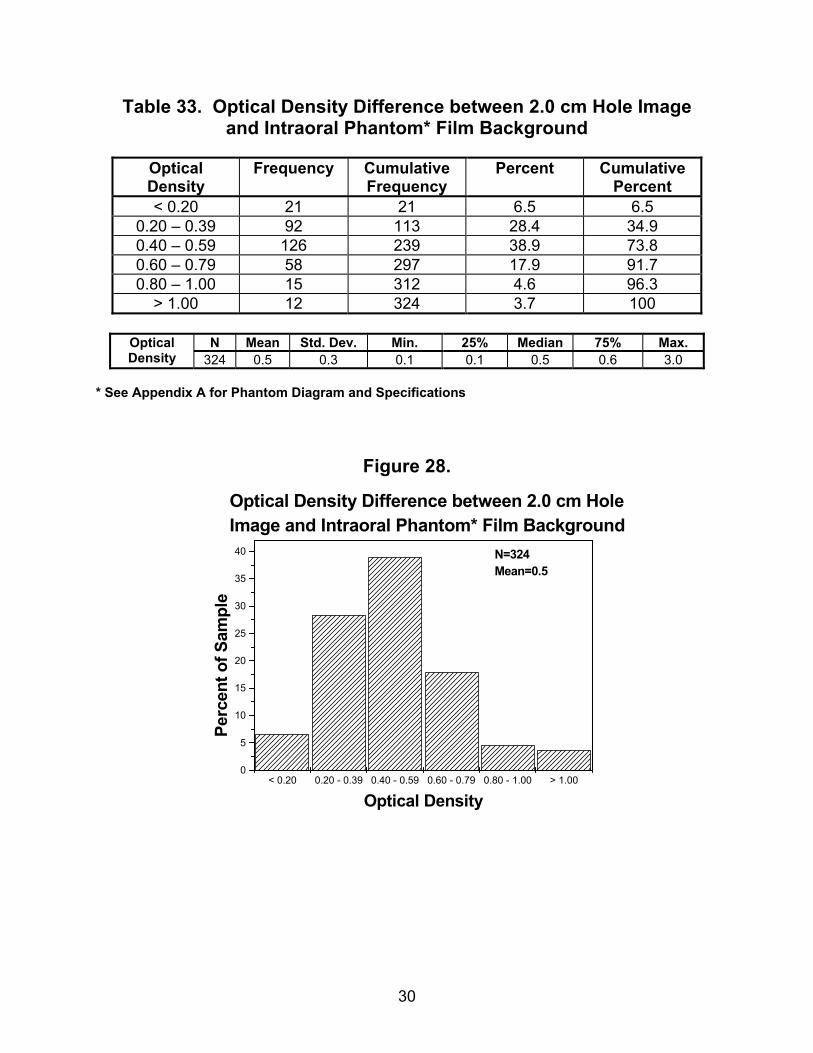
40 N=324Mean=0.5
Optical Density Difference between 2.0 cm HoleImage and Intraoral Phantom* Film Background
Perc
ent o
f Sam
ple
Optical Density
Table 33. Optical Density Difference between 2.0 cm Hole Image and Intraoral Phantom* Film Background
Optical Density
Frequency Cumulative Frequency
Percent Cumulative Percent
< 0.20 21 21 6.5 6.5 0.20 – 0.39 92 113 28.4 34.9 0.40 – 0.59 126 239 38.9 73.8 0.60 – 0.79 58 297 17.9 91.7 0.80 – 1.00 15 312 4.6 96.3
> 1.00 12 324 3.7 100
N Mean Std. Dev. Min. 25% Median 75% Max. Optical Density 324 0.5 0.3 0.1 0.1 0.5 0.6 3.0
* See Appendix A for Phantom Diagram and Specifications
Figure 28.
31
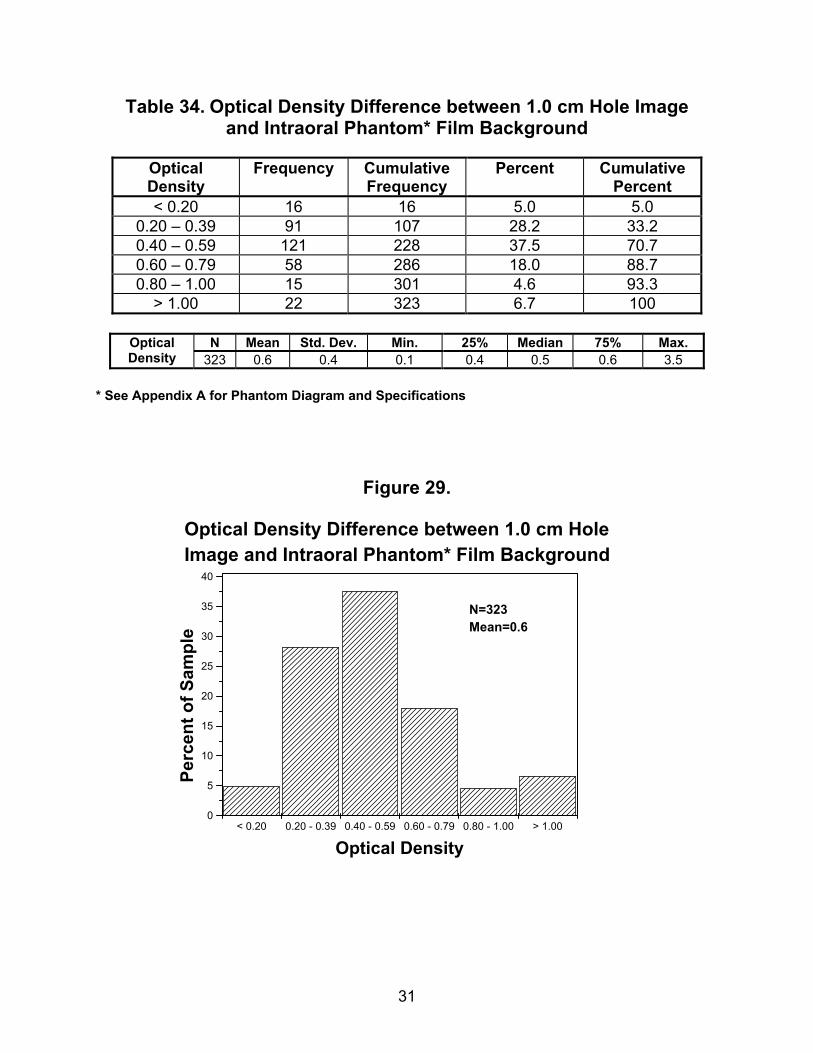
Table 34. Optical Density Difference between 1.0 cm Hole Image and Intraoral Phantom* Film Background
Optical Density
Frequency Cumulative Frequency
Percent Cumulative Percent
< 0.20 16 16 5.0 5.0 0.20 – 0.39 91 107 28.2 33.2 0.40 – 0.59 121 228 37.5 70.7 0.60 – 0.79 58 286 18.0 88.7 0.80 – 1.00 15 301 4.6 93.3
> 1.00 22 323 6.7 100
N Mean Std. Dev. Min. 25% Median 75% Max. Optical Density 323 0.6 0.4 0.1 0.4 0.5 0.6 3.5
* See Appendix A for Phantom Diagram and Specifications
Figure 29.
< 0.20 0.20 - 0.39 0.40 - 0.59 0.60 - 0.79 0.80 - 1.00 > 1.000
5
10
15
20
25
30
35
40
N=323Mean=0.6
Optical Density Difference between 1.0 cm HoleImage and Intraoral Phantom* Film Background
Perc
ent o
f Sam
ple
Optical Density
32
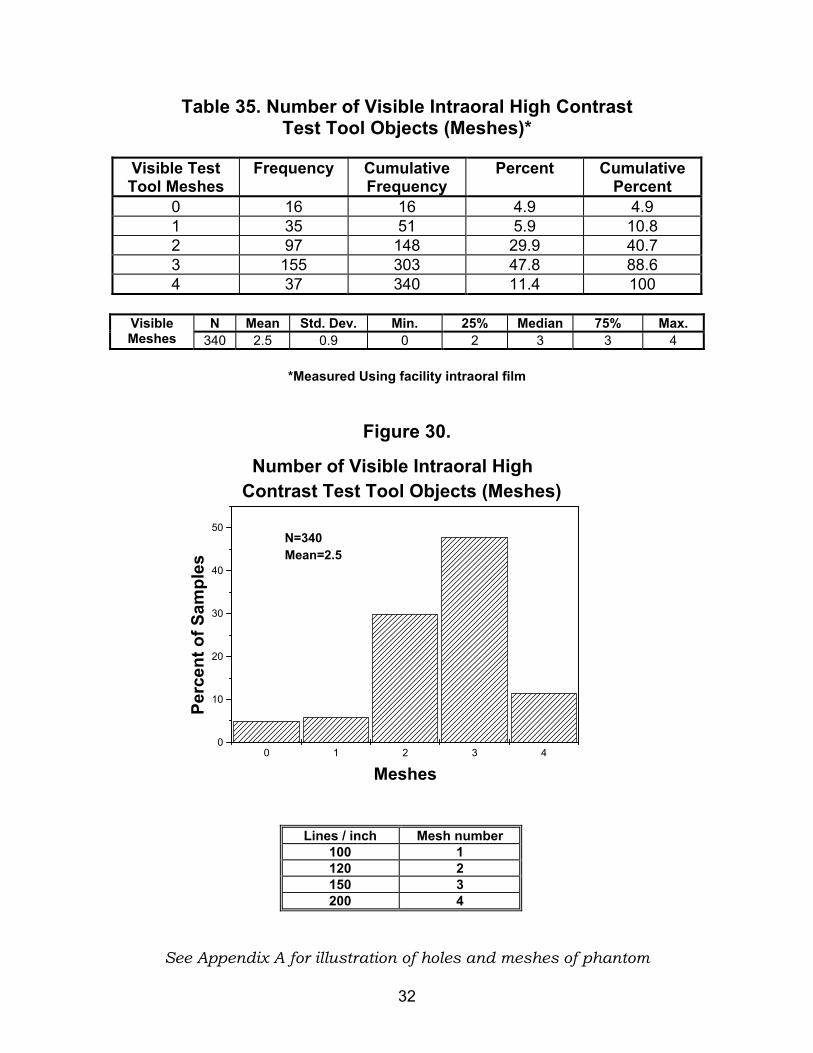
Table 35. Number of Visible Intraoral High Contrast Test Tool Objects (Meshes)*
Visible Test Tool Meshes
Frequency Cumulative Frequency
Percent Cumulative Percent
0 16 16 4.9 4.9 1 35 51 5.9 10.8 2 97 148 29.9 40.7 3 155 303 47.8 88.6 4 37 340 11.4 100
N Mean Std. Dev. Min. 25% Median 75% Max. Visible
Meshes 340 2.5 0.9 0 2 3 3 4
*Measured Using facility intraoral film
Figure 30.
Lines / inch Mesh number
100 1 120 2 150 3 200 4
See Appendix A for illustration of holes and meshes of phantom
0 1 2 3 40
10
20
30
40
50
Number of Visible Intraoral HighContrast Test Tool Objects (Meshes)
N=340Mean=2.5
Perc
ent o
f Sam
ples
Meshes
33
< 60 60 - 74 75 - 89 90 -104 105 -120 > 1200
5
10
15
20
25
30N=122Mean=99
Intraoral Automatic Film Processing Speed
Perc
ent o
f Sam
ple
Processing Speed
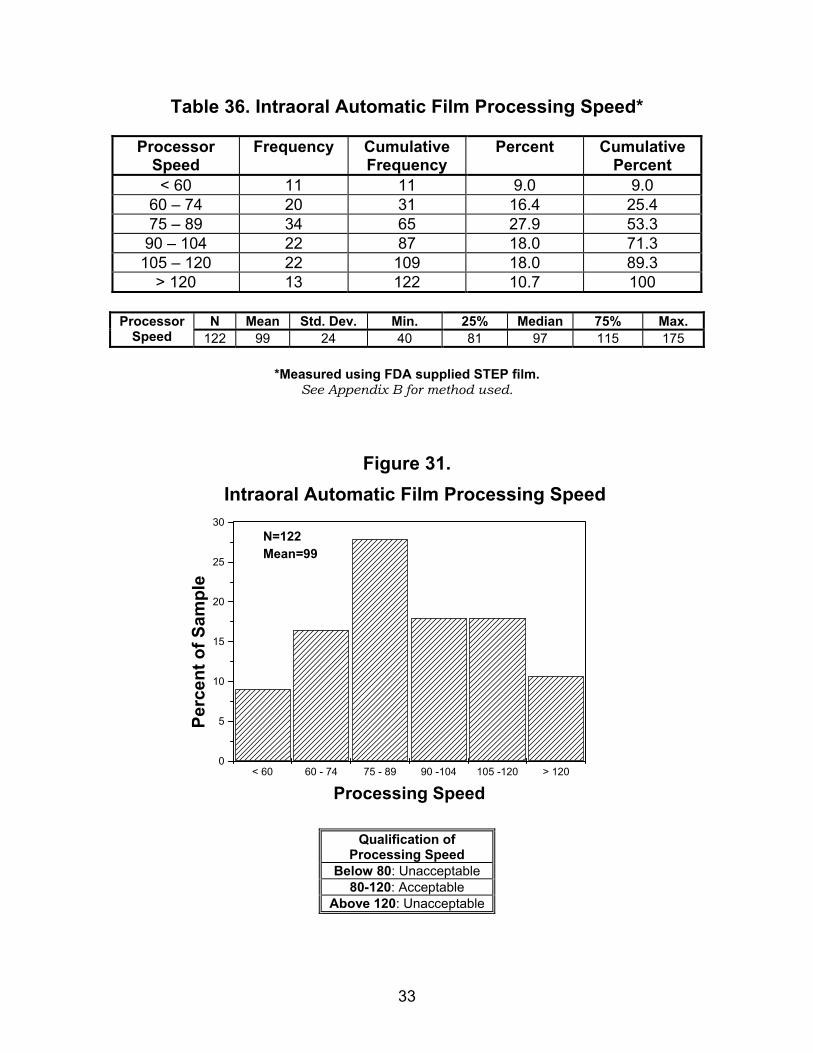
Table 36. Intraoral Automatic Film Processing Speed*
Processor Speed
Frequency Cumulative Frequency
Percent Cumulative Percent
< 60 11 11 9.0 9.0 60 – 74 20 31 16.4 25.4 75 – 89 34 65 27.9 53.3 90 – 104 22 87 18.0 71.3
105 – 120 22 109 18.0 89.3 > 120 13 122 10.7 100
N Mean Std. Dev. Min. 25% Median 75% Max. Processor
Speed 122 99 24 40 81 97 115 175
*Measured using FDA supplied STEP film. See Appendix B for method used.
Figure 31.
Qualification of
Processing Speed Below 80: Unacceptable
80-120: Acceptable Above 120: Unacceptable
34
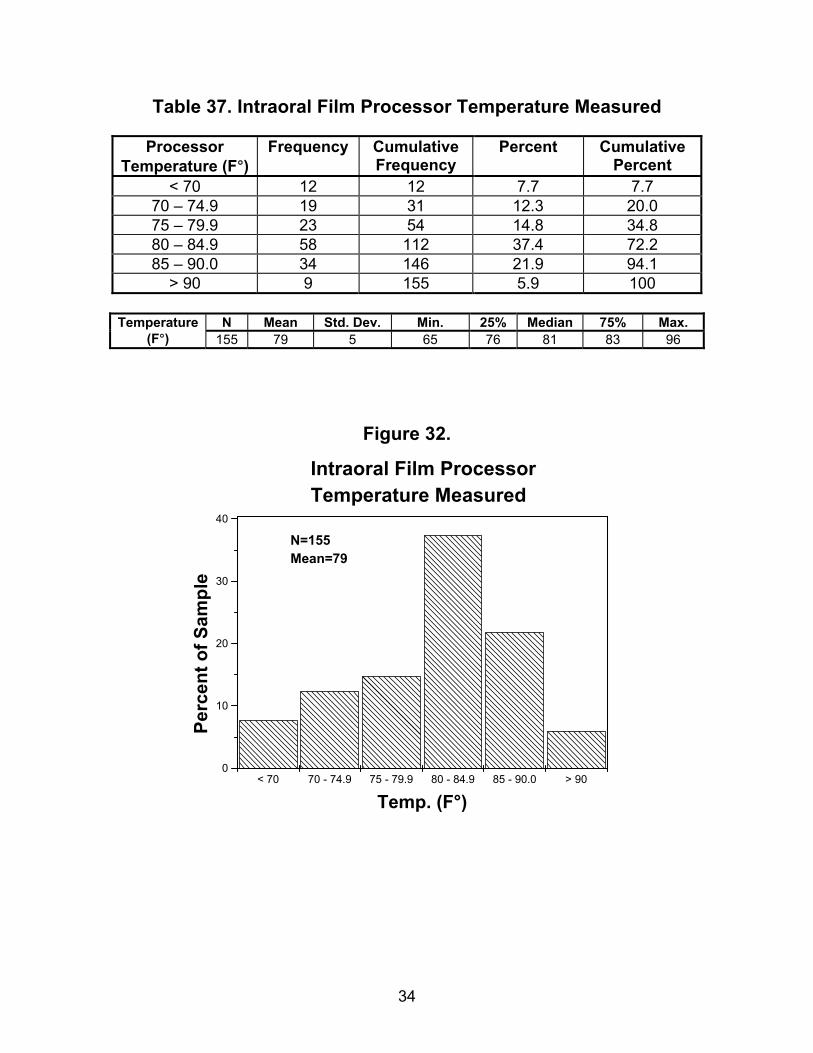
Table 37. Intraoral Film Processor Temperature Measured
Processor Temperature (F°)
Frequency Cumulative Frequency
Percent Cumulative Percent
< 70 12 12 7.7 7.7 70 – 74.9 19 31 12.3 20.0 75 – 79.9 23 54 14.8 34.8 80 – 84.9 58 112 37.4 72.2 85 – 90.0 34 146 21.9 94.1
> 90 9 155 5.9 100
N Mean Std. Dev. Min. 25% Median 75% Max. Temperature (F°) 155 79 5 65 76 81 83 96
Figure 32.
< 70 70 - 74.9 75 - 79.9 80 - 84.9 85 - 90.0 > 900
10
20
30
40
N=155Mean=79
Intraoral Film ProcessorTemperature Measured
Perc
ent o
f Sam
ple
Temp. (F°)
35
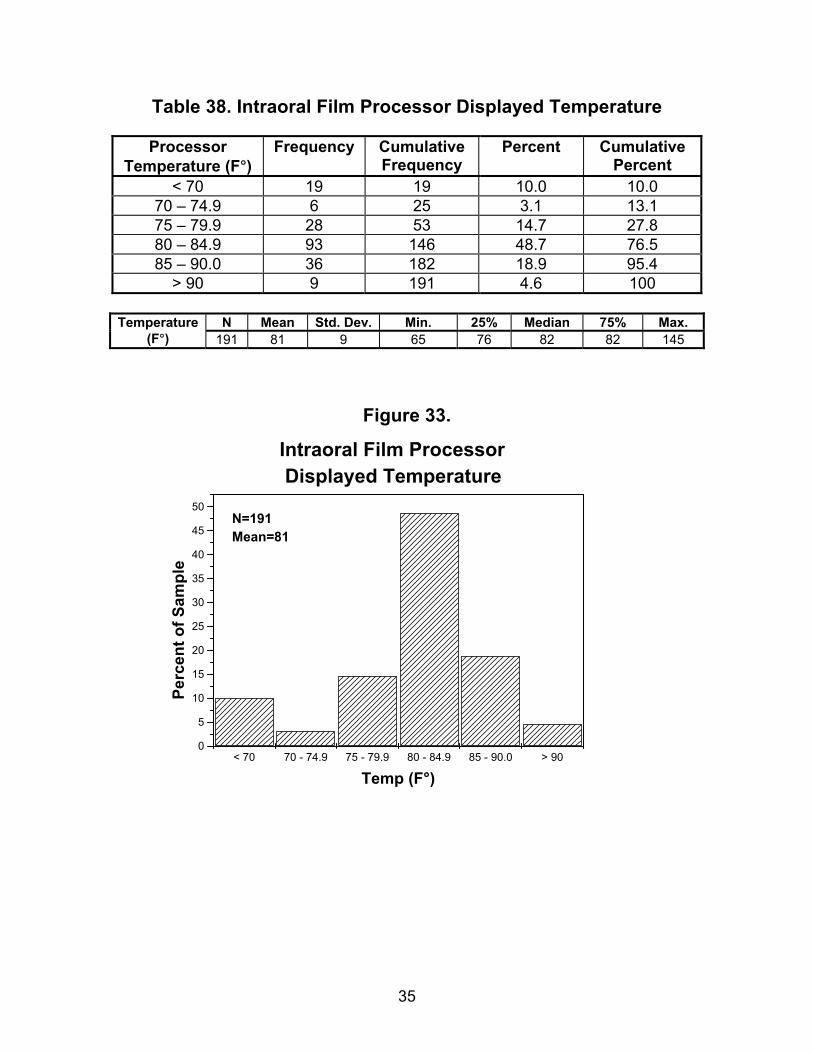
Table 38. Intraoral Film Processor Displayed Temperature
Processor Temperature (F°)
Frequency Cumulative Frequency
Percent Cumulative Percent
< 70 19 19 10.0 10.0 70 – 74.9 6 25 3.1 13.1 75 – 79.9 28 53 14.7 27.8 80 – 84.9 93 146 48.7 76.5 85 – 90.0 36 182 18.9 95.4
> 90 9 191 4.6 100
N Mean Std. Dev. Min. 25% Median 75% Max. Temperature (F°) 191 81 9 65 76 82 82 145
Figure 33.
< 70 70 - 74.9 75 - 79.9 80 - 84.9 85 - 90.0 > 900
5
10
15
20
25
30
35
40
45
50N=191Mean=81
Intraoral Film Processor Displayed Temperature
Perc
ent o
f Sam
ple
Temp (F°)

36
< 1.0 1.0 - 2.9 3.0 - 4.9 5.0 - 7.0 > 7.0 0
5
10
15
20
25
30
35
40
45
50 N=106Mean=2.5
Absolute Value of Difference of Processor Temperature: Displayed vs. Measured
Perc
ent o
f Sam
ple
Temperature Difference (F°)
Table 39. Absolute Value of Difference of Processor Temperature: Displayed vs. Measured
Temperature (F°)
Difference Frequency Cumulative
Frequency Percent Cumulative
Percent < 1.0 31 31 29.3 29.3
1.0 – 2.9 52 83 49.1 78.4 3.0 – 4.9 7 90 6.6 85.0 5.0 – 7.0 7 97 6.6 91.6
> 7.0 9 106 8.4 100
N Mean Std. Dev. Min. 25% Median 75% Max. Temperature (F°) 106 2.5 3.1 0.1 0.8 1.3 2.3 15.0
Figure 34.
37
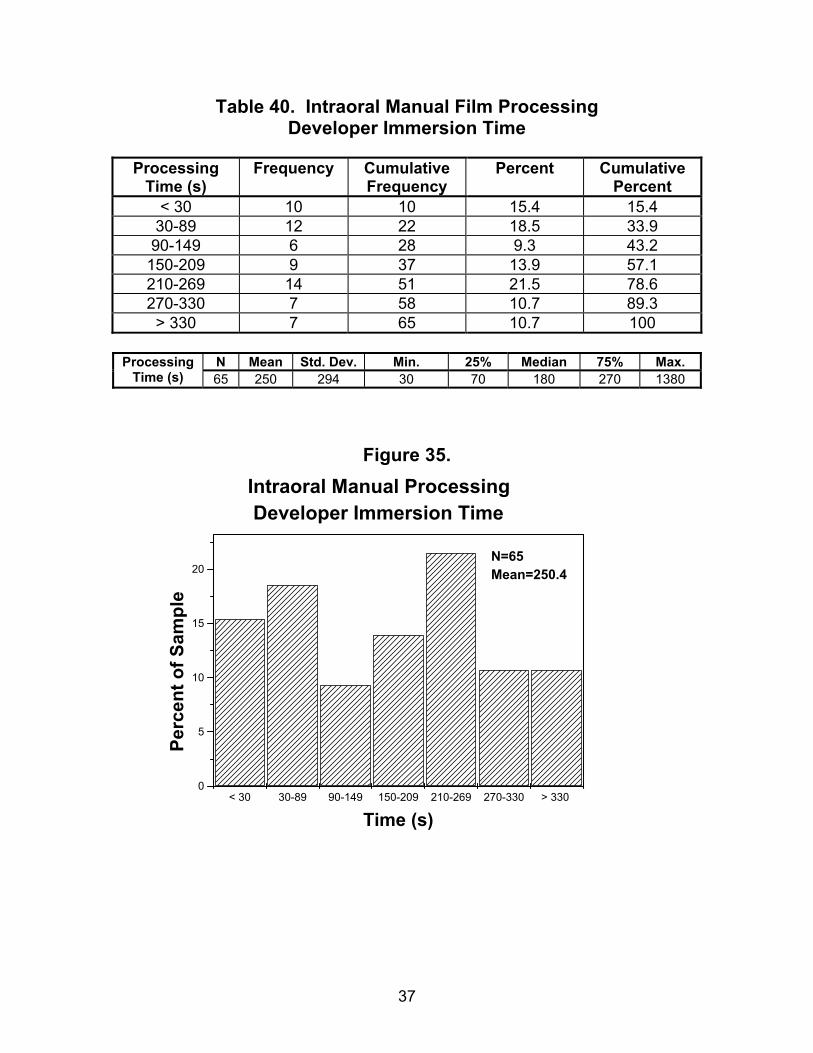
Table 40. Intraoral Manual Film Processing Developer Immersion Time
Processing
Time (s) Frequency Cumulative
Frequency Percent Cumulative
Percent < 30 10 10 15.4 15.4
30-89 12 22 18.5 33.9 90-149 6 28 9.3 43.2
150-209 9 37 13.9 57.1 210-269 14 51 21.5 78.6 270-330 7 58 10.7 89.3
> 330 7 65 10.7 100
N Mean Std. Dev. Min. 25% Median 75% Max. Processing Time (s) 65 250 294 30 70 180 270 1380
Figure 35.
< 30 30-89 90-149 150-209 210-269 270-330 > 330 0
5
10
15
20
Intraoral Manual Processing Developer Immersion Time
N=65Mean=250.4
Perc
ent o
f Sam
ple
Time (s)
38
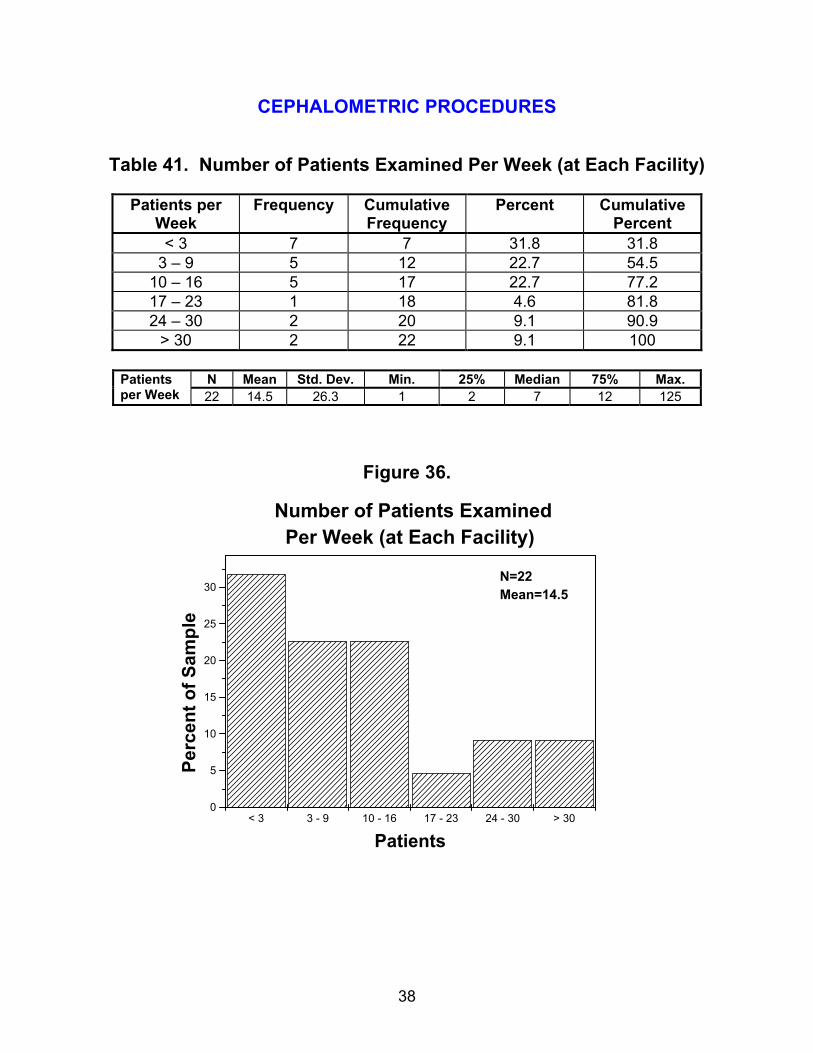
CEPHALOMETRIC PROCEDURES
Table 41. Number of Patients Examined Per Week (at Each Facility)
Patients per Week
Frequency Cumulative Frequency
Percent Cumulative Percent
< 3 7 7 31.8 31.8 3 – 9 5 12 22.7 54.5
10 – 16 5 17 22.7 77.2 17 – 23 1 18 4.6 81.8 24 – 30 2 20 9.1 90.9
> 30 2 22 9.1 100
N Mean Std. Dev. Min. 25% Median 75% Max. Patients per Week 22 14.5 26.3 1 2 7 12 125
Figure 36.
< 3 3 - 9 10 - 16 17 - 23 24 - 30 > 300
5
10
15
20
25
30
Number of Patients Examined Per Week (at Each Facility)
N=22Mean=14.5
Perc
ent o
f Sam
ple
Patients
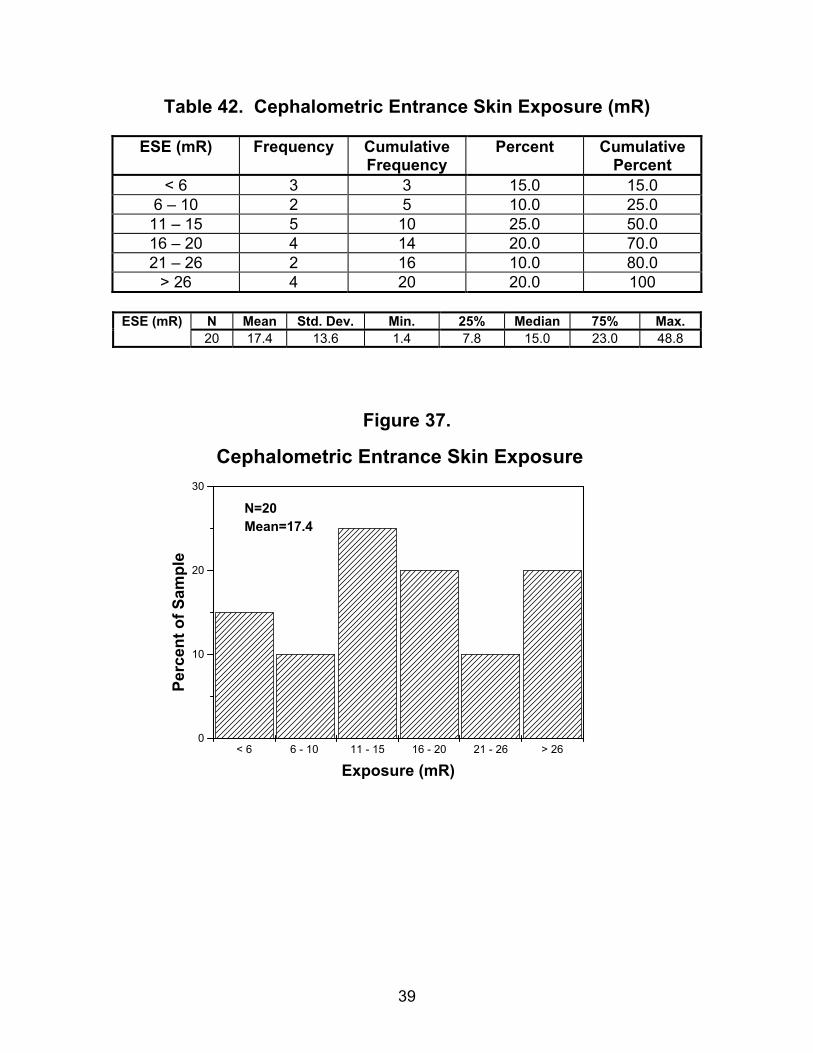
39
< 6 6 - 10 11 - 15 16 - 20 21 - 26 > 260
10
20
30
N=20Mean=17.4
Cephalometric Entrance Skin Exposure
Perc
ent o
f Sam
ple
Exposure (mR)
Table 42. Cephalometric Entrance Skin Exposure (mR)
ESE (mR) Frequency Cumulative Frequency
Percent Cumulative Percent
< 6 3 3 15.0 15.0 6 – 10 2 5 10.0 25.0
11 – 15 5 10 25.0 50.0 16 – 20 4 14 20.0 70.0 21 – 26 2 16 10.0 80.0
> 26 4 20 20.0 100
N Mean Std. Dev. Min. 25% Median 75% Max. ESE (mR) 20 17.4 13.6 1.4 7.8 15.0 23.0 48.8
Figure 37.
40
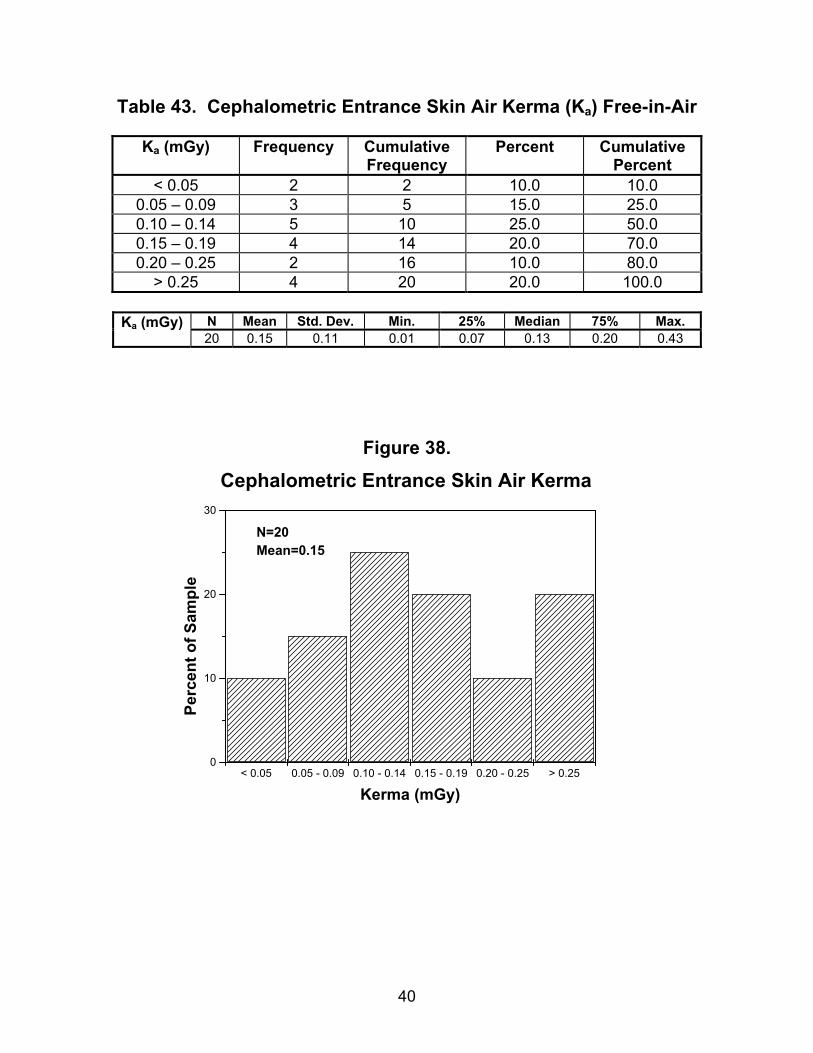
< 0.05 0.05 - 0.09 0.10 - 0.14 0.15 - 0.19 0.20 - 0.25 > 0.250
10
20
30
N=20Mean=0.15
Cephalometric Entrance Skin Air Kerma
Perc
ent o
f Sam
ple
Kerma (mGy)
Table 43. Cephalometric Entrance Skin Air Kerma (Ka) Free-in-Air
Ka (mGy) Frequency Cumulative Frequency
Percent Cumulative Percent
< 0.05 2 2 10.0 10.0 0.05 – 0.09 3 5 15.0 25.0 0.10 – 0.14 5 10 25.0 50.0 0.15 – 0.19 4 14 20.0 70.0 0.20 – 0.25 2 16 10.0 80.0
> 0.25 4 20 20.0 100.0
N Mean Std. Dev. Min. 25% Median 75% Max. Ka (mGy) 20 0.15 0.11 0.01 0.07 0.13 0.20 0.43
Figure 38.
41
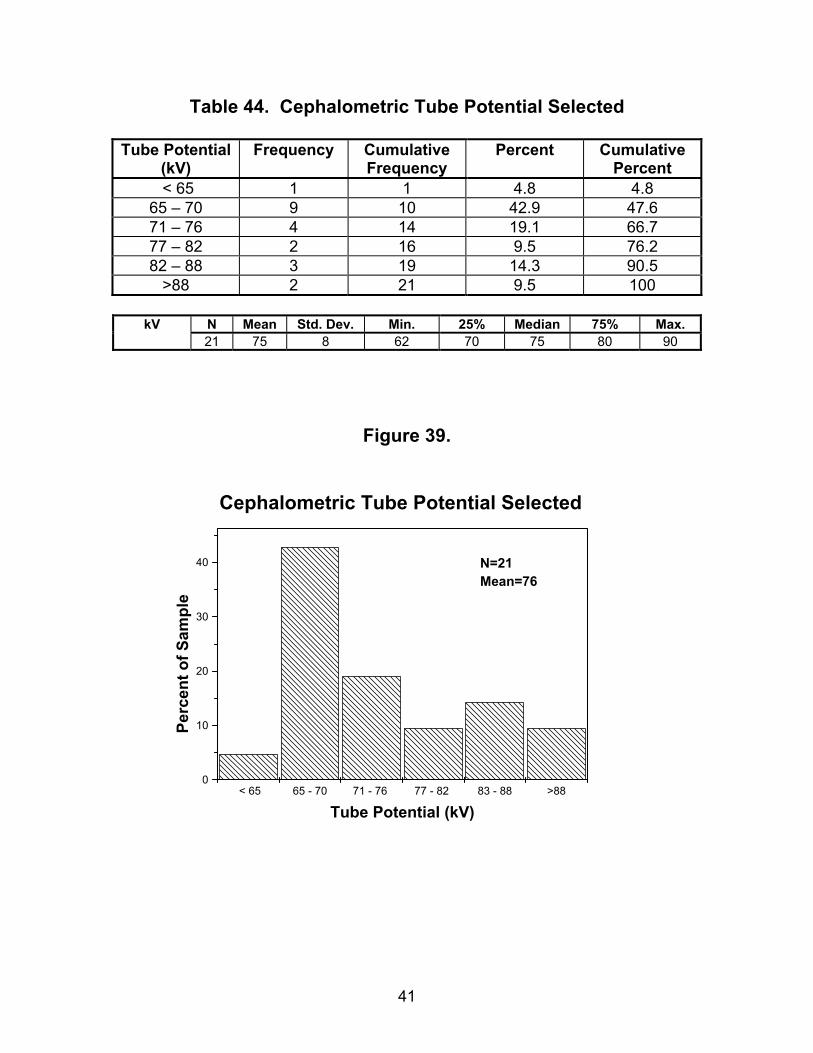
Table 44. Cephalometric Tube Potential Selected
Tube Potential (kV)
Frequency Cumulative Frequency
Percent Cumulative Percent
< 65 1 1 4.8 4.8 65 – 70 9 10 42.9 47.6 71 – 76 4 14 19.1 66.7 77 – 82 2 16 9.5 76.2 82 – 88 3 19 14.3 90.5
>88 2 21 9.5 100
N Mean Std. Dev. Min. 25% Median 75% Max. kV 21 75 8 62 70 75 80 90
Figure 39.
< 65 65 - 70 71 - 76 77 - 82 83 - 88 >880
10
20
30
40
Cephalometric Tube Potential Selected
N=21Mean=76
Perc
ent o
f Sam
ple
Tube Potential (kV)

42
< 65 65-69 70-75 > 750
10
20
30
40
50N=15Mean=72
Cephalometric Tube Potential: Measured with kVp Meter
Perc
ent o
f Sam
ple
Tube Potential (kV)
Table 45. Cephalometric Tube Potential Measured*
kVp Frequency Cumulative Frequency
Percent Cumulative Percent
< 65 2 2 12.5 12.5 65 – 69 8 10 50.0 62.5 70 – 75 2 12 12.5 75.0
> 75 4 16 25.0 100
N Mean Std. Dev. Min. 25% Median 75% Max. kVp 16 72 5 65 69 70 77 81
*Measured with kVp Meter
Figure 40.

43
Table 46. Absolute Value of Difference in Cephalometric Tube Potential: Measured vs. Selected
Difference in
kV Frequency Cumulative
Frequency Percent Cumulative
Percent < 1 4 4 25.0 25.0
1 – 3 5 9 31.3 56.3 4 – 6 1 10 6.3 62.6 6 – 8 3 13 18.7 82.3 > 8 3 16 18.7 100
N Mean Std. Dev. Min. 25% Median 75% Max. Difference
in kV 16 4.4 5.0 0.6 0.7 2.9 5.8 17
Figure 41.
< 1 1 - 3 4 - 6 6 - 8 > 80
5
10
15
20
25
30
35
N=16Mean=4.4
Absolute Value of Difference in Tube Potential: Measured vs. Selected
Perc
ent o
f Sam
ple
Difference of Tube Potential (kV)
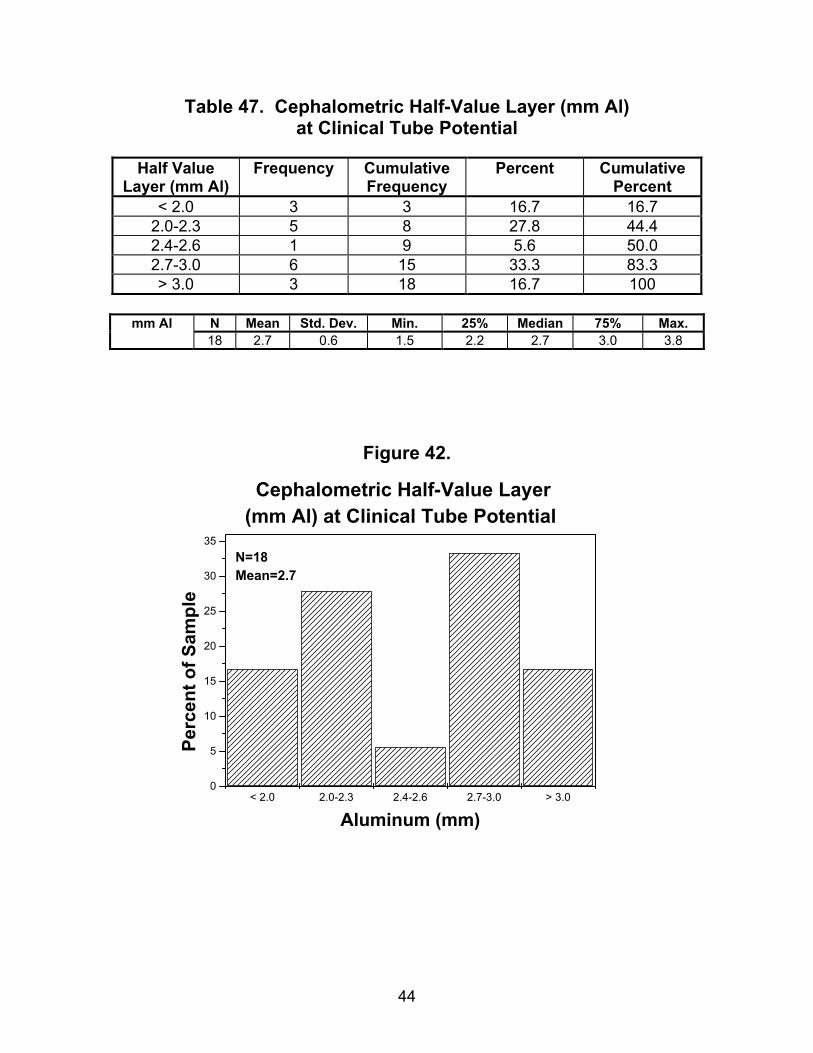
44
< 2.0 2.0-2.3 2.4-2.6 2.7-3.0 > 3.00
5
10
15
20
25
30
35N=18Mean=2.7
Cephalometric Half-Value Layer (mm Al) at Clinical Tube Potential
Perc
ent o
f Sam
ple
Aluminum (mm)
Table 47. Cephalometric Half-Value Layer (mm Al) at Clinical Tube Potential
Half Value
Layer (mm Al) Frequency Cumulative
Frequency Percent Cumulative
Percent < 2.0 3 3 16.7 16.7
2.0-2.3 5 8 27.8 44.4 2.4-2.6 1 9 5.6 50.0 2.7-3.0 6 15 33.3 83.3 > 3.0 3 18 16.7 100
N Mean Std. Dev. Min. 25% Median 75% Max. mm Al 18 2.7 0.6 1.5 2.2 2.7 3.0 3.8
Figure 42.
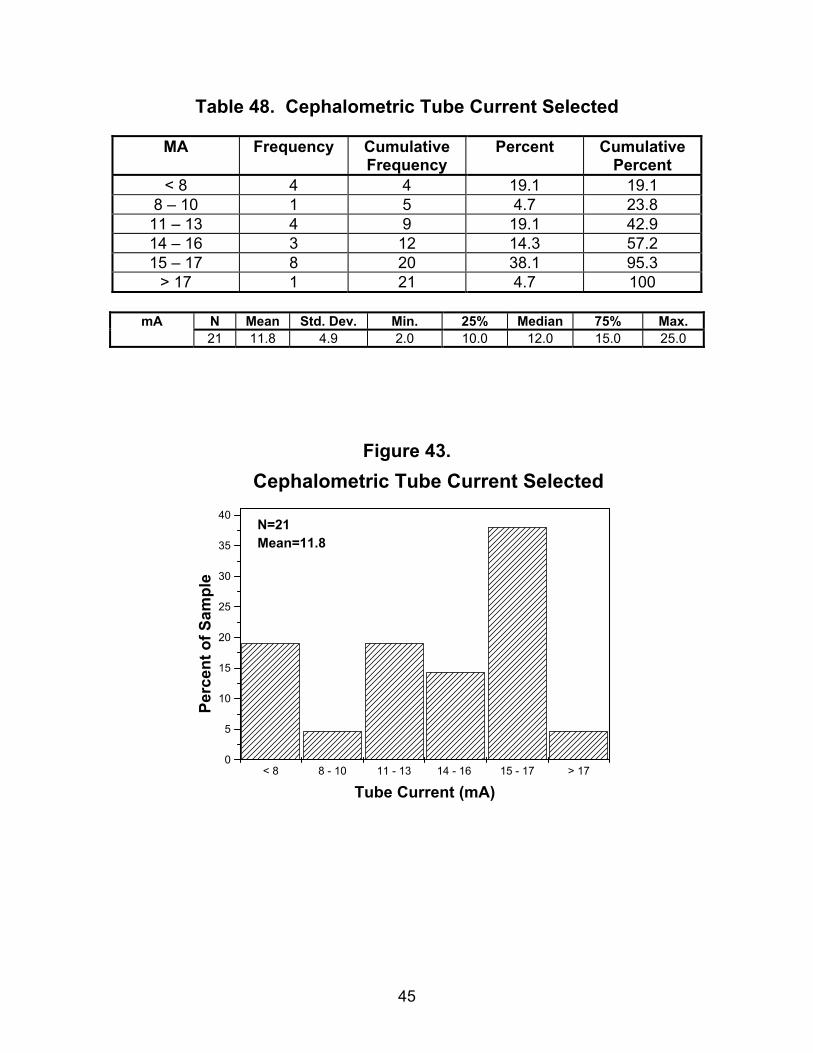
45
< 8 8 - 10 11 - 13 14 - 16 15 - 17 > 170
5
10
15
20
25
30
35
40N=21Mean=11.8
Cephalometric Tube Current Selected
Perc
ent o
f Sam
ple
Tube Current (mA)
Table 48. Cephalometric Tube Current Selected
MA Frequency Cumulative Frequency
Percent Cumulative Percent
< 8 4 4 19.1 19.1 8 – 10 1 5 4.7 23.8
11 – 13 4 9 19.1 42.9 14 – 16 3 12 14.3 57.2 15 – 17 8 20 38.1 95.3
> 17 1 21 4.7 100
N Mean Std. Dev. Min. 25% Median 75% Max. mA 21 11.8 4.9 2.0 10.0 12.0 15.0 25.0
Figure 43.
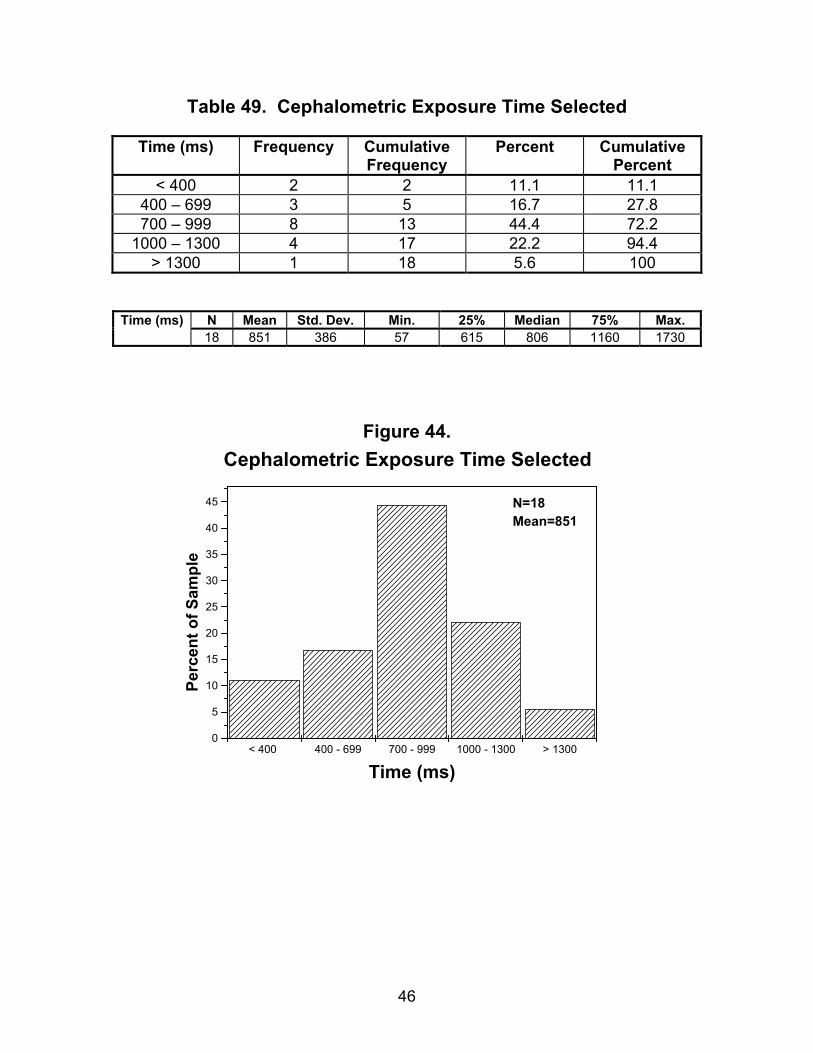
46
< 400 400 - 699 700 - 999 1000 - 1300 > 13000
5
10
15
20
25
30
35
40
45 N=18Mean=851
Cephalometric Exposure Time Selected
Perc
ent o
f Sam
ple
Time (ms)
Table 49. Cephalometric Exposure Time Selected
Time (ms) Frequency Cumulative Frequency
Percent Cumulative Percent
< 400 2 2 11.1 11.1 400 – 699 3 5 16.7 27.8 700 – 999 8 13 44.4 72.2
1000 – 1300 4 17 22.2 94.4 > 1300 1 18 5.6 100
N Mean Std. Dev. Min. 25% Median 75% Max. Time (ms) 18 851 386 57 615 806 1160 1730
Figure 44.
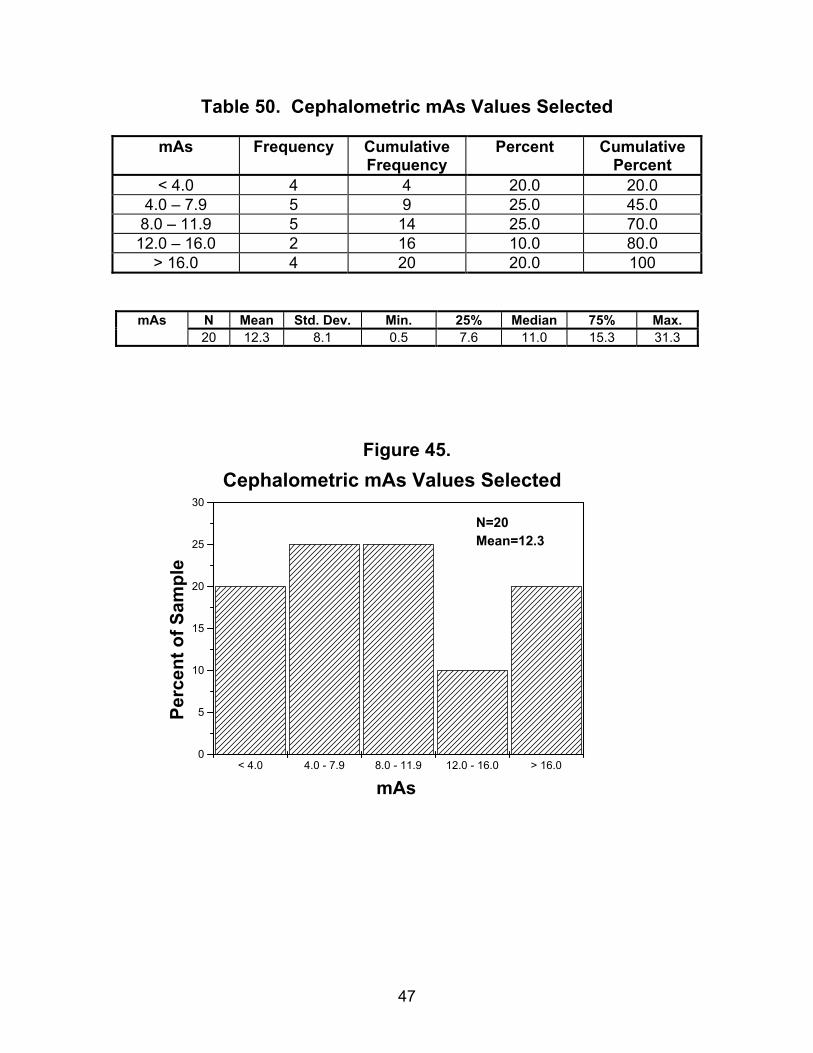
47
< 4.0 4.0 - 7.9 8.0 - 11.9 12.0 - 16.0 > 16.00
5
10
15
20
25
30
Cephalometric mAs Values Selected
N=20Mean=12.3
Perc
ent o
f Sam
ple
mAs
Table 50. Cephalometric mAs Values Selected
mAs Frequency Cumulative Frequency
Percent Cumulative Percent
< 4.0 4 4 20.0 20.0 4.0 – 7.9 5 9 25.0 45.0 8.0 – 11.9 5 14 25.0 70.0
12.0 – 16.0 2 16 10.0 80.0 > 16.0 4 20 20.0 100
N Mean Std. Dev. Min. 25% Median 75% Max. mAs 20 12.3 8.1 0.5 7.6 11.0 15.3 31.3
Figure 45.
48
0.0 .01 - .10 .11 - .20 .21 - .30 .31 - .40 .41 - .51 > 0.510
10
20
30
Darkroom Fog Optical Density for Cephalometric Facilities
N=52Mean=0.13
Perc
ent o
f Sam
ple
Optical Density
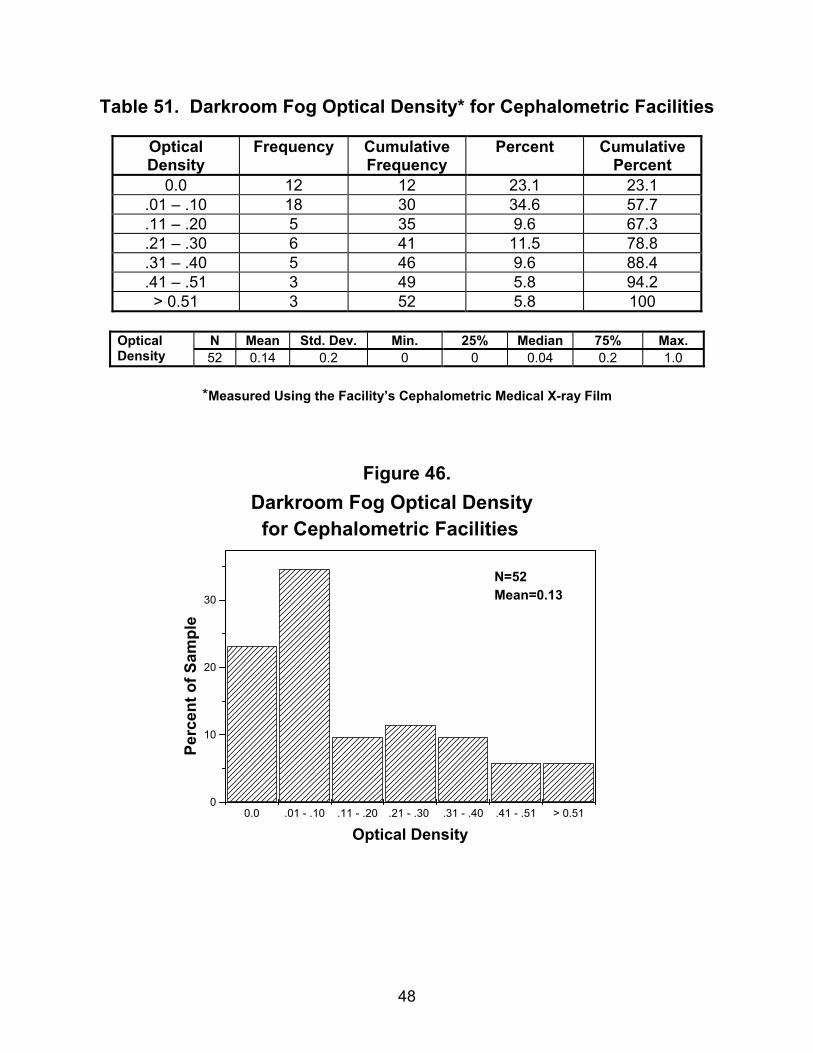
Table 51. Darkroom Fog Optical Density* for Cephalometric Facilities
Optical Density
Frequency Cumulative Frequency
Percent Cumulative Percent
0.0 12 12 23.1 23.1 .01 – .10 18 30 34.6 57.7 .11 – .20 5 35 9.6 67.3 .21 – .30 6 41 11.5 78.8 .31 – .40 5 46 9.6 88.4 .41 – .51 3 49 5.8 94.2 > 0.51 3 52 5.8 100
N Mean Std. Dev. Min. 25% Median 75% Max. Optical
Density 52 0.14 0.2 0 0 0.04 0.2 1.0
*Measured Using the Facility’s Cephalometric Medical X-ray Film
Figure 46.
49
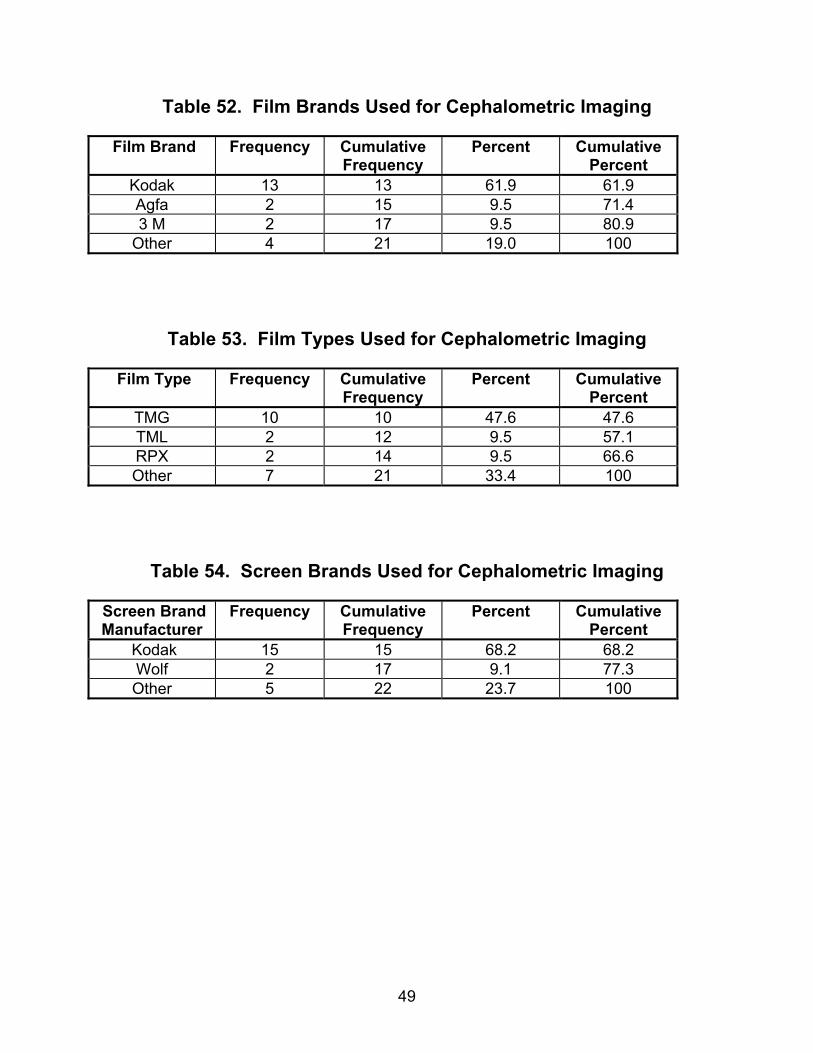
Table 52. Film Brands Used for Cephalometric Imaging
Film Brand Frequency Cumulative Frequency
Percent Cumulative Percent
Kodak 13 13 61.9 61.9 Agfa 2 15 9.5 71.4 3 M 2 17 9.5 80.9
Other 4 21 19.0 100
Table 53. Film Types Used for Cephalometric Imaging
Film Type Frequency Cumulative Frequency
Percent Cumulative Percent
TMG 10 10 47.6 47.6 TML 2 12 9.5 57.1 RPX 2 14 9.5 66.6 Other 7 21 33.4 100
Table 54. Screen Brands Used for Cephalometric Imaging Screen Brand Manufacturer
Frequency Cumulative Frequency
Percent Cumulative Percent
Kodak 15 15 68.2 68.2 Wolf 2 17 9.1 77.3 Other 5 22 23.7 100
50
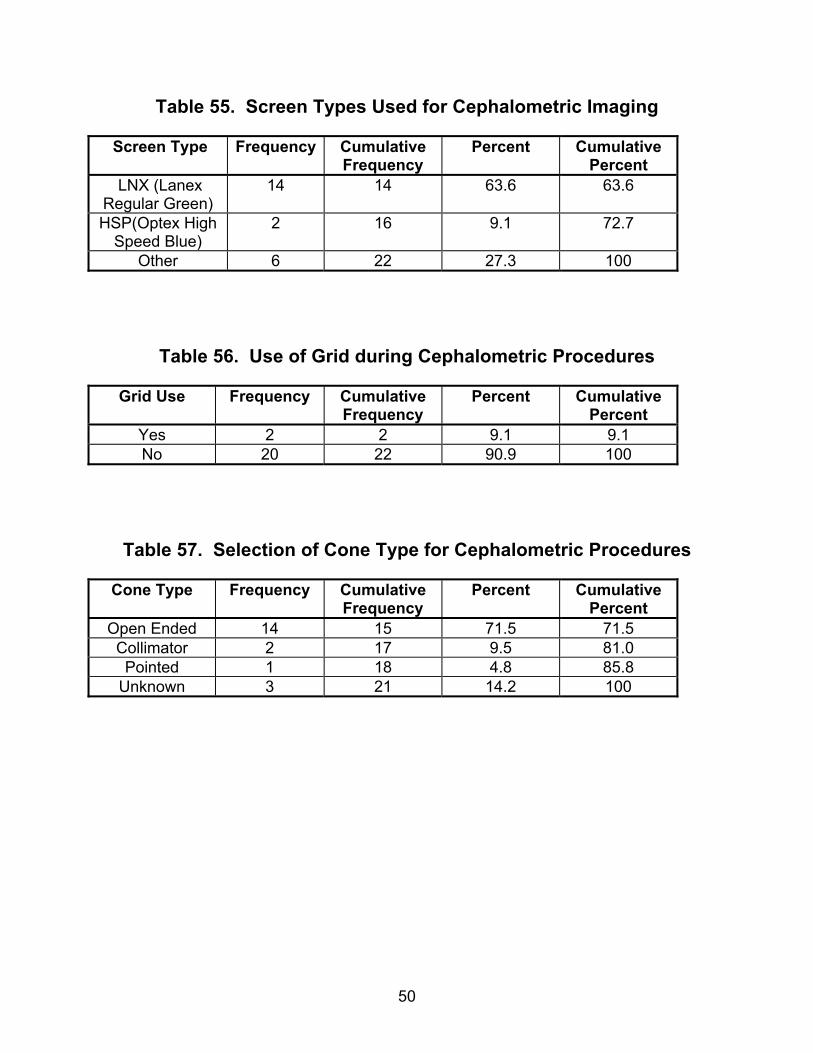
Table 55. Screen Types Used for Cephalometric Imaging
Screen Type Frequency Cumulative Frequency
Percent Cumulative Percent
LNX (Lanex Regular Green)
14 14 63.6 63.6
HSP(Optex High Speed Blue)
2 16 9.1 72.7
Other 6 22 27.3 100
Table 56. Use of Grid during Cephalometric Procedures
Grid Use Frequency Cumulative Frequency
Percent Cumulative Percent
Yes 2 2 9.1 9.1 No 20 22 90.9 100
Table 57. Selection of Cone Type for Cephalometric Procedures
Cone Type Frequency Cumulative Frequency
Percent Cumulative Percent
Open Ended 14 15 71.5 71.5 Collimator 2 17 9.5 81.0 Pointed 1 18 4.8 85.8
Unknown 3 21 14.2 100
51
PANORAMIC PROCEDURES
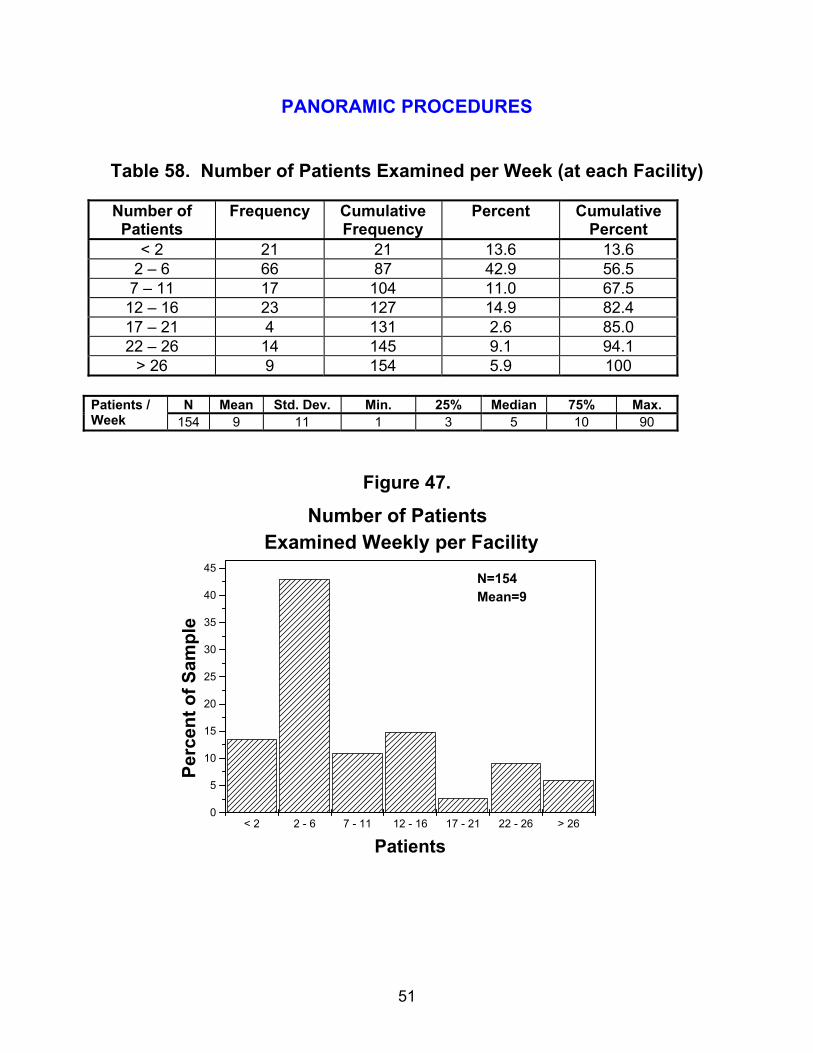
Table 58. Number of Patients Examined per Week (at each Facility)
Number of Patients
Frequency Cumulative Frequency
Percent Cumulative Percent
< 2 21 21 13.6 13.6 2 – 6 66 87 42.9 56.5 7 – 11 17 104 11.0 67.5
12 – 16 23 127 14.9 82.4 17 – 21 4 131 2.6 85.0 22 – 26 14 145 9.1 94.1
> 26 9 154 5.9 100
N Mean Std. Dev. Min. 25% Median 75% Max. Patients / Week 154 9 11 1 3 5 10 90
Figure 47.
< 2 2 - 6 7 - 11 12 - 16 17 - 21 22 - 26 > 260
5
10
15
20
25
30
35
40
45
Number of PatientsExamined Weekly per Facility
N=154Mean=9
Perc
ent o
f Sam
ple
Patients
52
< 65 65 - 69 70 - 74 75 - 79 80 - 84 85 - 90 > 900
5
10
15
20
25
Panoramic Tube Potential Selected
N=142Mean=79
Perc
ent o
f Sam
ple
Tube Potential (kV)
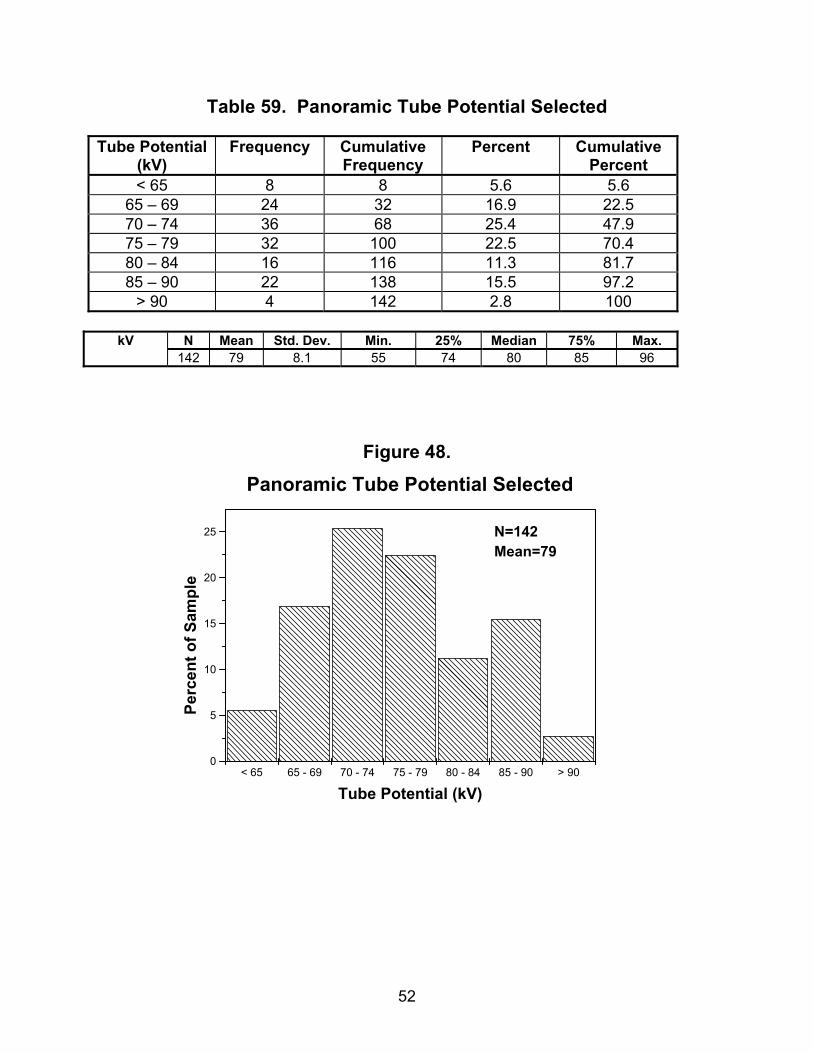
Table 59. Panoramic Tube Potential Selected Tube Potential
(kV) Frequency Cumulative
Frequency Percent Cumulative
Percent < 65 8 8 5.6 5.6
65 – 69 24 32 16.9 22.5 70 – 74 36 68 25.4 47.9 75 – 79 32 100 22.5 70.4 80 – 84 16 116 11.3 81.7 85 – 90 22 138 15.5 97.2
> 90 4 142 2.8 100
N Mean Std. Dev. Min. 25% Median 75% Max. kV 142 79 8.1 55 74 80 85 96
Figure 48.
53
< 4 4 - 6 7 - 9 10 - 12 > 120
5
10
15
20
25
30
35
40
45
Panoramic Tube Current Selected
N=142Mean=8.1
Perc
ent o
f Sam
ple
Tube Current (mA)
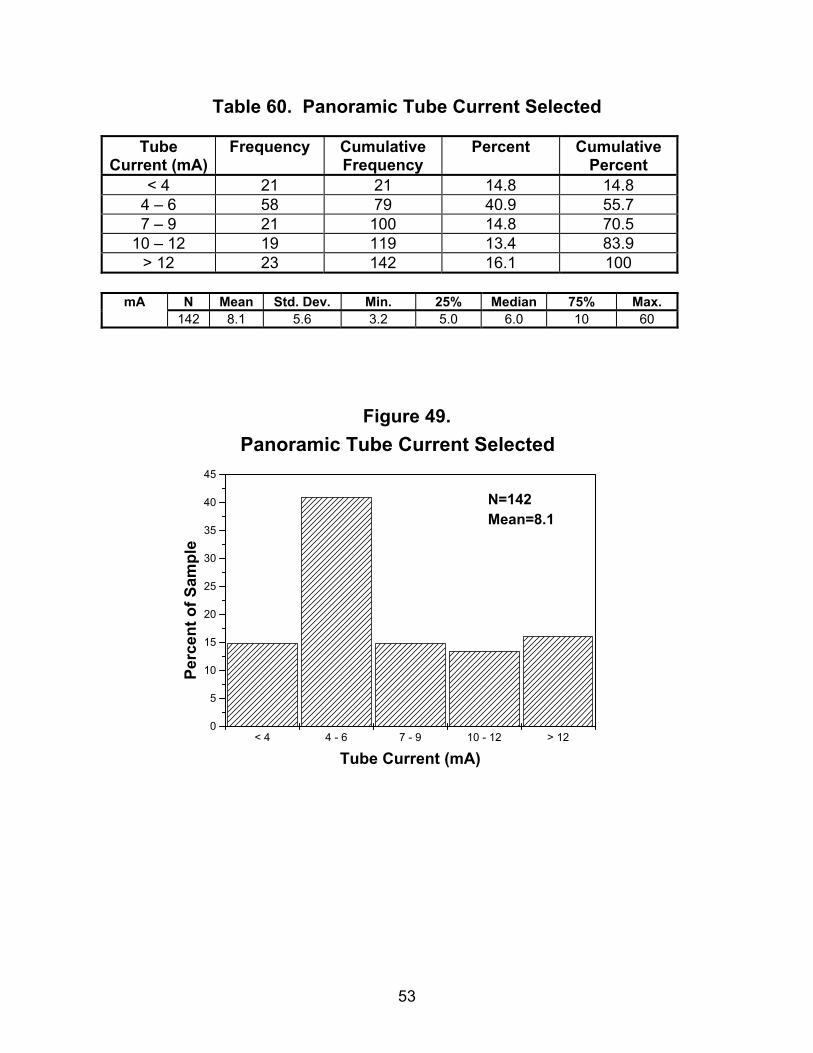
Table 60. Panoramic Tube Current Selected
Tube Current (mA)
Frequency Cumulative Frequency
Percent Cumulative Percent
< 4 21 21 14.8 14.8 4 – 6 58 79 40.9 55.7 7 – 9 21 100 14.8 70.5
10 – 12 19 119 13.4 83.9 > 12 23 142 16.1 100
N Mean Std. Dev. Min. 25% Median 75% Max. mA
142 8.1 5.6 3.2 5.0 6.0 10 60
Figure 49.

54
< 13.0 13.0 - 15.9 16.0 - 18.9 19.0 - 22.0 > 22.00
10
20
30
Panoramic Exposure Time Selected
N=136Mean=17
Perc
ent o
f Sam
ple
Time (s)
Table 61. Panoramic Exposure Time Selected
Time (s) Frequency Cumulative Frequency
Percent Cumulative Percent
< 13.0 19 19 14.0 14.0 13.0 – 15.9 40 59 29.4 43.4 16.0 – 18.9 39 98 28.7 72.1 19.0 – 22.0 27 125 19.9 92.0
> 22.0 11 136 8.0 100
N Mean Std. Dev. Min. 25% Median 75% Max. Time (s) 136 17.0 4.40 11.0 14.8 16.5 19.0 51.0
Figure 50.

55
< 100 101 - 150 151 - 200 201 - 250 > 2500
5
10
15
20
25
30
35
40
Panoramic mAs Values Selected
N=139Mean=123
Perc
ent o
f Sam
ple
mAs
Table 62. Panoramic mAs Values Selected
mAs Frequency Cumulative Frequency
Percent Cumulative Percent
< 100 34 34 24.5 24.5 101 – 150 53 87 38.1 62.6 151 – 200 19 106 13.7 76.3 201 – 250 18 124 12.9 89.2
> 250 15 139 10.8 100
N Mean Std. Dev. Min. 25% Median 75% Max. mAs 139 123 60.7 9.6 75 100 165 333
Figure 51.
56
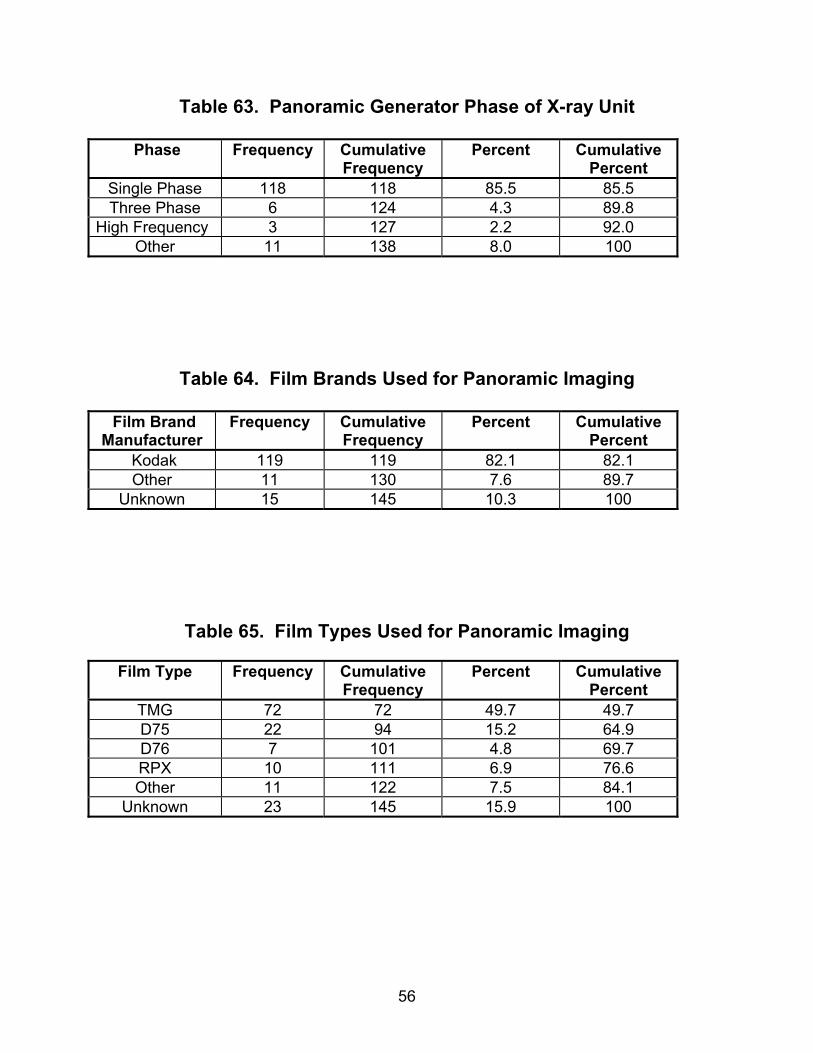
Table 63. Panoramic Generator Phase of X-ray Unit
Phase Frequency Cumulative Frequency
Percent Cumulative Percent
Single Phase 118 118 85.5 85.5 Three Phase 6 124 4.3 89.8
High Frequency 3 127 2.2 92.0 Other 11 138 8.0 100
Table 64. Film Brands Used for Panoramic Imaging
Film Brand Manufacturer
Frequency Cumulative Frequency
Percent Cumulative Percent
Kodak 119 119 82.1 82.1 Other 11 130 7.6 89.7
Unknown 15 145 10.3 100
Table 65. Film Types Used for Panoramic Imaging
Film Type Frequency Cumulative Frequency
Percent Cumulative Percent
TMG 72 72 49.7 49.7 D75 22 94 15.2 64.9 D76 7 101 4.8 69.7 RPX 10 111 6.9 76.6 Other 11 122 7.5 84.1
Unknown 23 145 15.9 100
57
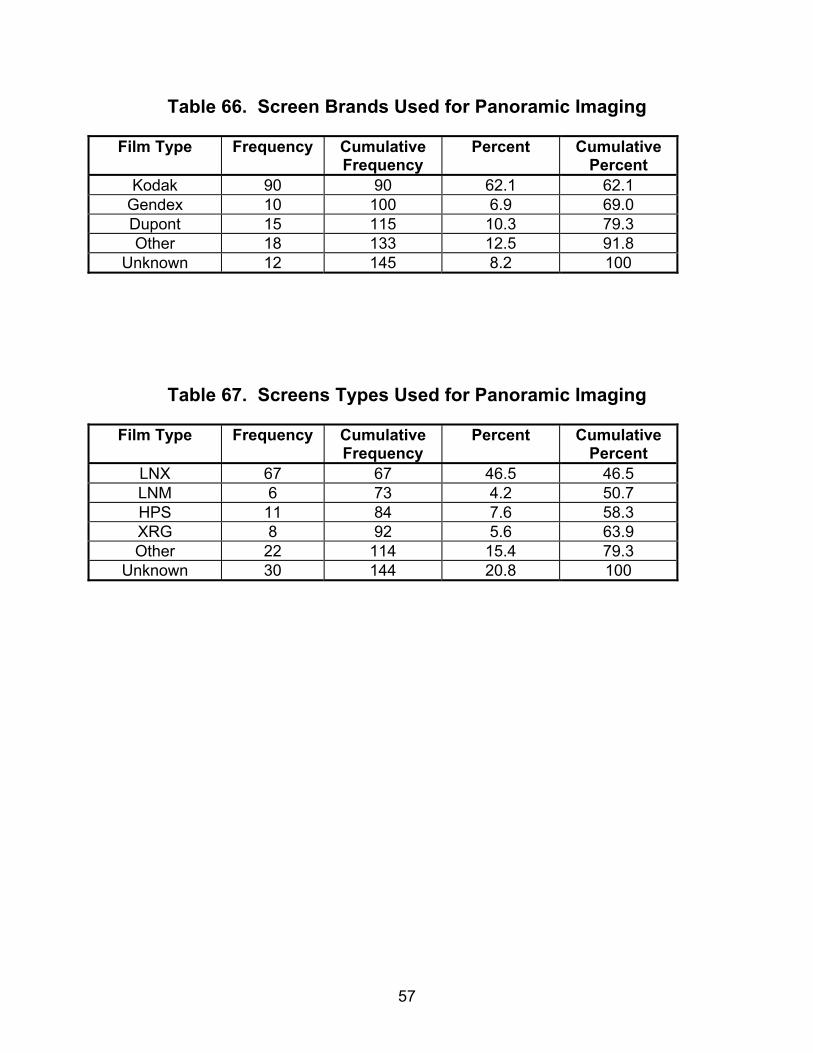
Table 66. Screen Brands Used for Panoramic Imaging
Film Type Frequency Cumulative Frequency
Percent Cumulative Percent
Kodak 90 90 62.1 62.1 Gendex 10 100 6.9 69.0 Dupont 15 115 10.3 79.3 Other 18 133 12.5 91.8
Unknown 12 145 8.2 100
Table 67. Screens Types Used for Panoramic Imaging
Film Type Frequency Cumulative Frequency
Percent Cumulative Percent
LNX 67 67 46.5 46.5 LNM 6 73 4.2 50.7 HPS 11 84 7.6 58.3 XRG 8 92 5.6 63.9 Other 22 114 15.4 79.3
Unknown 30 144 20.8 100

58
[This page is intentionally blank.]
59
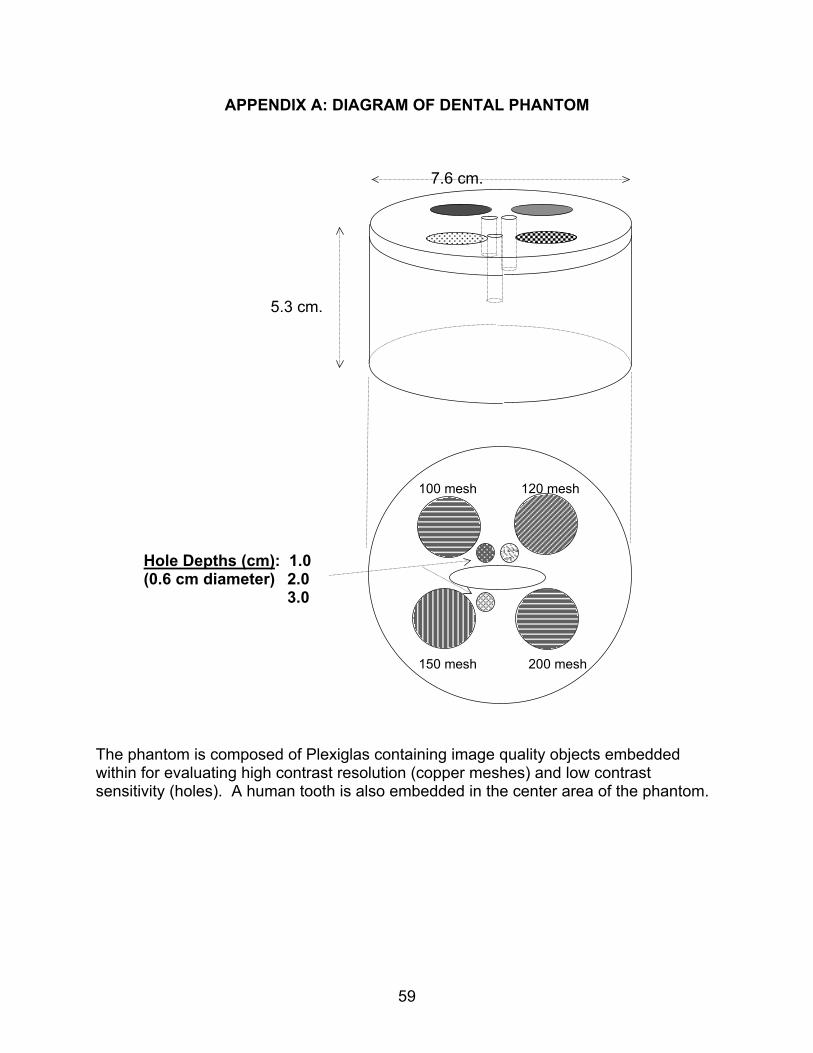
APPENDIX A: DIAGRAM OF DENTAL PHANTOM 7.6 cm. 5.3 cm. 100 mesh 120 mesh
Hole Depths (cm): 1.0 (0.6 cm diameter) 2.0 3.0 150 mesh 200 mesh The phantom is composed of Plexiglas containing image quality objects embedded within for evaluating high contrast resolution (copper meshes) and low contrast sensitivity (holes). A human tooth is also embedded in the center area of the phantom.

60
[This page is intentionally blank.]
61
APPENDIX B. SUMMARY OF DENTAL MEASUREMENT PROCEDURES
(Abridged Protocol)
INTRAORAL IMAGING PROCEDURE Entrance Skin Exposure / Air Kerma
Objective To measure the typical intraoral Entrance Skin Exposure (ESE) and Entrance Skin Air Kerma (ESAK) Free-in-Air for an average patient. Required Test Equipment
• Phantom cradle • MDH meter
Set-up 1. Place the NEXT CDRH dental phantom cradle on some form of support (a
tripod if available). The phantom cradle should be placed so that it is level and secure to avoid the possibility of damage due to a fall. If a tripod is utilized, it can be attached to the underside of the phantom cradle using the tripod mounting screw.
2. The phantom cradle should be placed at a height that enables easy
positioning of the intraoral tube so that the cone lies level and parallel to the phantom cradle. The probe holder should be opposite from the cone.
3. Attach the MDH probe to the probe holder. It should be attached to the probe
holder so that the sensitive volume of the chamber is centered in the phantom cradle. The end or tip of the intraoral tube cone should then be placed in the phantom cradle so that the cone just makes contact with the MDH probe.
Test Steps 1. Initialize the MDH
A) Turn on and warm up. B) Set the selector switch to the “Pulse Exposure” mode.
ONCE YOU HAVE ALIGNED THE MDH PROBE AND UNIT, DO NOT MOVE THEM UNTIL ALL MEASUREMENTS HAVE BEEN COMPLETED.
62
C) The pulse fraction threshold should be set at 0.2 for all single phase unit measurements. The majority of the units you encounter will be single-phase. If a unit is determined to be a three-phase unit, change the pulse fraction threshold to 0.5. For units that have pre-exposure filaments, set the pulse fraction threshold at 0.8.
D) Make an exposure with the technique factors set at the facility’s
standard technique and record this exposure as exposure #1. Do not record the time for this exposure.
2. Make an exposure. Record the exposure as exposure #2. Switch the MDH meter to “Pulse Duration” mode and record the measured time. Once completed, switch the MDH back to “Pulse Exposure.”
3. Repeat this procedure for exposures #3 and #4. 4. Calculate and record the average (Eavg) of the four exposure values. 5. Measure and record the Source to Cone Tip Distance or (SSD).
6. Measure and record the Cone Tip to Cheek Distance (CCD). 7. Calculate and record the ESE using the formula:
ESE = (Eavg) * ((SSD) / (SSD + CCD)) **2; Beam Quality Assessment
Objective To determine the half-value layer (HVL) of the x-ray beam. This would determine the total HVL of the x-ray tube assembly. The HVL is also a measure of beam quality, which is necessary to calculate patient dose.
THE NEXT THREE EXPOSURES WILL PROVIDE INFORMATION ON REPRODUCIBILITY. AS A REMINDER, DO NOT MANUALLY RE-SET THE MDH METER TO ZERO BETWEEN EXPOSURES.
63
Required Test Equipment • Phantom cradle • MDH meter • 1100 Aluminum Alloy Filters: one 0.5 mm Al, two 1.0 mm Al, and four 2.0
mm Al. Set-up 1. Use the same technique settings for this section that were used for collecting
the intraoral unit exposure data in the last section. 2. Slide the end of the cone away from the probe in the phantom cradle so that it
is aligned with the edge of the filter slot. 3. In order to position the dental cone, first insert a thickness of aluminum into
the slot and bring the cone tip as close to the aluminum as possible. The cone tip should make contact with the aluminum.
Test Steps 1. Remove the aluminum and make an exposure. Record the output (in mR) in
the boxes provided for the output for 0.0 mm of aluminum. 2. Insert a 1.0 mm aluminum filter in the slot of the phantom cradle. Make a
second exposure and record the mR for 1.0 mm Al.
3. Insert an additional 1.0 mm aluminum filter. Make an exposure and record the mR for 2.0 mm Al.
4. Insert an additional 1.0 mm aluminum filter. Make an exposure and record
the mR for 3.0 mm Al.
5. Insert an additional 1.0 mm aluminum filter. Make an exposure and record the mR for 4.0 mm Al.
6. Using the graph on the back of the worksheet, plot the exposure versus the
aluminum thicknesses used. Determine the HVL to the nearest tenth of a millimeter of aluminum by drawing the best straight line fit to all but the first (0.0 mm Al) data points.
Find the point on the line where the exposure is half that of the 0.0 mm aluminum exposure. The thickness of Al corresponding to this point is the HVL.
64
Optical Density and Image Quality Objectives • To determine the Optical Density (OD) of the phantom film. The phantom film
OD, which correlates with clinical film density, is a check on the exposure techniques to assure they are adequate to deliver a clinical image.
• To determine the imaging capabilities of the facility.
Required Test Equipment
• Dental Phantom • Film Packet • Densitometer • View Box
Test Steps 1. Insert the Dental phantom loaded with a film packet between the cone and
the MDH probe. 2. Make an exposure using the same technique as an exposure measurement
(See above). 3. Develop the film that utilized the facility’s standard technique settings.
Measure and record the optical density at the area adjacent to the lone contrast object of the phantom image.
4. Measure and record the densities of the three low contrast objects.
5. Count and record the number of different gauge wire meshes that are visible.
A wire mesh pattern is not counted if the “tiny” spaces that result from the mesh running vertically and horizontally are not seen.
Darkroom Fog Evaluation
Objective To determine the optical density of darkroom fog for Intraoral film processing. The following procedure is to be used to sensitize film for determining darkroom fog levels. A darkroom fog test tool has been provided for this measurement.
65
Required Test Equipment • Image Test Tool • Film Packets • Densitometer • View Box Set-up An optical density of 1.0 on one of the fog test tool steps is needed in order to evaluate fog. Because of this, two films will need to be taken. 1. Take the fog test tool and invert it. A visible depression lies underneath the
steps of the test tool.
2. Place a packet of the facility’s film in this depression making sure that the tube side or flat side of the film packet is in contact with the test tool. Take the test tool and turn it back over. The steps of the test tool should be facing upright toward the x-ray tube.
3. Bring the cone from the Intraoral unit down so that it makes contact with the
test tool. The cone should cover the steps of the test tool. Test Step 1. For the first film, make an exposure using the facility’s standard technique.
Remove the film from the fog test tool, mark the film and place it in a shielded area.
2. For the second film, insert a new packet of the facility’s film into the
depression area of the fog test tool and setup as you did previously. The kVp should remain unchanged. Divide the mAs setting by 10 and make this exposure.
3. In the darkroom, unwrap these exposed films from their packaging and insert
the films into the test tool. The long side of the films should be inserted into the slots located on the left and right hand sides of the test tool. The slots are located in the flat part of the test tool and not the step portion. Be sure that you are approximately bisecting the latent image.
4. Position the films and test tool in an area of the darkroom closest to a
safelight. This should represent an area where film is routinely handled and has the highest probability of safelight exposure. Expose the uncovered half of the films to normal safelight conditions for two minutes. Make sure that you do not accidentally shield the films from other potential fog sources such as light leaks or digital light sources.
5. After two minutes have elapsed, quickly remove the films from the step-
wedge and feed them into the processor.
66
6. If a visible line appears down the center of the film, then fog is present. Using the densitometer, measure the densities of both the left and right hand sides of the film at various steps. Record the greatest density difference.
CEPHALOMETRIC IMAGING PROCEDURE Entrance Skin Exposure / Air Kerma
Objective To measure the typical cephalometric entrance skin exposure (ESE) and entrance skin air kerma (ESAK) free-in-air for an average patient. Required Test Equipment
• Phantom • MDH meter
Set-up
1. Place the MDH so that it is mounted securely in the primary beam roughly midway between the image receptor and the tube, but preferably nearer the image receptor. Positioning the probe near the tube may make it difficult to ensure that the probe is fully within the useful beam.
2. If the unit has a collimator light, utilize it to insure that the entire sensitive volume of the probe lies in the beam.
Test Steps 1. Initialize the MDH
A) Turn on and warm up. B) Set the selector switch to the “Pulse Exposure” mode.
You may need to be creative here - • Try lowering the gantry to permit use of a cart or chair, etc. • On some units (on a Pan/Ceph combo for example) you can
hang the MDH probe down into the beam.
ONCE YOU HAVE ALIGNED THE MDH PROBE AND UNIT, DONOT MOVE THEM UNTIL ALL MEASUREMENTS HAVE BEENCOMPLETED.
67
C) The pulse fraction threshold should be set at 0.2 for all single phase
unit measurements. The majority of the units that you encounter will be single-phase. If a unit is determined to be three-phase, change the pulse fraction threshold to 0.5. For units that have pre-exposure filaments, set the pulse fraction threshold at 0.8.
D) Make an exposure with the technique factors set at the facility’s
standard technique and record this exposure as exposure #1. Do not record the time for this exposure.
THE NEXT THREE EXPOSURES WILL PROVIDE INFORMATION ON REPRODUCIBILITY. AS A REMINDER, DO NOT MANUALLY RE-SET THE MDH METER TO ZERO BETWEEN EXPOSURES.
2. Insert an unloaded cassette and make an exposure. Record the exposure as exposure #2. Switch the MDH meter to “Pulse Duration” mode and record the measured time. Switch the MDH meter back to “Pulse Exposure”.
3. Repeat this procedure for exposures #3 and #4. 4. Calculate and record the average (Eavg) of the four exposure values. 5. Measure the source-to-image distance (SID) and record this value on the
survey form along with the units of measure (cm).
6. Measure the source-to probe-distance (SPD) and use the same units (in/cm) as you did for SID.
7. Calculate and record the ESE using the formula:
ESE = (Eavg) *((SPD)/ (SID - 17.5)) **2;
(The Source-to-Skin-Distance (SSD) is approximated to be 17.5 cm)
Beam Quality Assessment Objective To determine the cephalometric half-value layer (HVL) of the x-ray beam. This would determine the total HVL of the x-ray tube assembly. The HVL is also a measure of beam quality, which is necessary to calculate patient dose.
Required Test Equipment
• MDH meter • 1100 Aluminum Alloy Filters: one 0.5 mm Al, two 1.0 mm Al, and four 2.0
mm Al.
68
Set-up Use the same set-up for this section that you used for collecting the cephalometric unit exposure data in this section.
Test Steps 1. Make an exposure without aluminum. Record the output (in mR) in the boxes
provided for the output for 0.0 mm of aluminum. 2. Tape a 1.0 mm aluminum filter to the end of the cone. Make a second
exposure and record the mR for 1.0 mm Al.
3. Add an additional 1.0 mm aluminum filter. Make an exposure and record the mR for 2.0 mm Al.
4. Add an additional 1.0 mm aluminum filter. Make an exposure and record the
mR for 3.0 mm Al.
5. Add an additional 1.0 mm aluminum filter. Make an exposure and record the mR for 4.0 mm Al.
6. Using the graph on the back of the worksheet, plot the exposure versus the
aluminum thicknesses used. Determine the HVL to the nearest tenth of a millimeter of aluminum by drawing the best straight line fit to all but the first (0.0 mm Al) data points.
Find the point on the line where the exposure is half that of the 0.0 mm aluminum exposure. The thickness of Al corresponding to this point is the HVL.
Darkroom Fog Evaluation
Objective To determine the optical density of darkroom fog for cephalometric film processing. This is performed in addition to the intraoral darkroom fog evaluation since intraoral film has a sensitometric response that is different from cephalometric film. Required Test Equipment • Fog folder • Loaded film cassette • Image Test Tool • Densitometer • View Box
69
Set-up An optical density of 1.2 on one of the fog test tool steps is needed in order to evaluate cephalometric fog. 1. Load a film cassette. 2. Position the tube so that it has a source-to-image distance of 40 inches.
Orient the tube so that it is facing downwards. 3. Place the image test tool on the center of the cassette with the long side of
the wedge parallel with the long side of the cassette. 4. Adjust the light field, or collimator, to the approximate size of the image test
tool.
Test Step 1. Take can exposure using 70 kVp and 5 mAs. This should be adequate to give
a density of 1.2 from one of the steps when the film is developed. 2. In the darkroom unwrap the exposed film from its packaging and insert the
film halfway into the fog folder. 3. Position the film and fog folder in an area of the darkroom closest to a
safelight. This should represent an area where film is routinely handled and has the highest probability of safelight exposure. Expose the uncovered half of the film to normal safelight conditions for two minutes. Make sure that you do not accidentally shield the film from other potential fog sources such as light leaks or digital light sources.
4. After two minutes have elapsed, quickly remove the film from the fog folder
and feed it into the processor. 5. If a visible line appears down the center of the film, then fog is present. Using
the densitometer, measure the densities of both the left and right hand sides of the film at various steps. Record the greatest density difference.
FILM PROCESSING EVALUATION (Cephalometric and Intraoral)
Objective To determine the efficiency of processing at the facility surveyed Required Test Equipment • Sensitometer • Control Film • Processor • Densitometer
70
Set-up 1. With a calibrated sensitometer, flash each of the four sides of the calibration
film. 2. Process the film. Test Steps 1. Determine the speed density by adding 1.00 to the optical density of the base
(background) plus fog of the film. Record this optical density on the STEP worksheet.
2. Select the two steps of the calibration film (i.e. Steps 9 and 10) that have
optical densities above and below the speed density. Record these two steps on the worksheet.
3. Measure the optical densities of the two selected steps for all four sides of the film.
4. Average the four measured densities for each step. Record these two
average densities on the worksheet. 5. Using these two average densities, refer to the STEP worksheet and
determine the resulting speed of the film processor.
CRCPD: A Partnership Dedicated to Radiation Protection
The Conference of Radiation Control Program Directors, Inc. (CRCPD) is a 501(c)(3) nonprofit non-governmental professional organization dedicated to radiation protection. CRCPD was formed in 1968.
• We promote radiological health in all aspects and phases; • We encourage and promote cooperative enforcement programs with federal
agencies and between related enforcement agencies within each state; • We encourage the interchange of experience among radiation control programs; • We collect and make accessible to the membership of the CRCPD such
information and data as might be of assistance to them in the proper fulfillment of their duties;
• We promote and foster uniformity of radiation control laws and regulations; • We encourage and support programs that will contribute to radiation control for
all; • We assist the membership in their technical work and development; and • We exercise leadership with radiation control professionals and consumers in
radiation control development and action.
CRCPD's mission is "to promote consistency in addressing and resolving radiation protection issues, to encourage high standards of quality in radiation protection programs, and to provide leadership in radiation safety and education." CRCPD's primary membership is made up of radiation professionals in state and local government who regulate the use of radiation sources. But anyone with an interest in radiation protection is eligible to join. Please join our Partnership.
CRCPD
205 Capital Avenue Frankfort, KY 40601
502/227-4543 Web Site: www.crcpd.org


![Destination B - Nationwide Financial · Nationwide Destination [ B ] is a variable annuity issued by Nationwide Life Insurance Company, Columbus, Ohio, a member of Nationwide Financial](https://img.pdfslide.us/doc/110x75/5ad411a57f8b9aff228b6535/destination-b-nationwide-financial-destination-b-is-a-variable-annuity-issued.jpg)