Embed Size (px)
Citation preview

National Water Commission
Dam Management in MexicoCajon de Peña Dam, Jalisco State
May 29, 2017

During extraordinary hydrometeorological events, it is important forthe safety of dams, population and infrastructure locateddownstream to maintain a permanent surveillance on theclimatological, meteorological, hydrological and hydraulic forecastscenarios in order to reduce the risks that could be generated by asudden discharge or dam failure.

Proper monitoring enables adequate and timely decision-making on storage management through an operation policy in accordance with
the evolution of the reservoir and rainfall forecast.
The operation of the Cajon de Peña dam in Jalisco during Hurricane Patricia in 2015 is particularly analysed.
The National Water Commission (CONAGUA), through the Technical Division
(SGT) has the authority to monitor and assess the development of severe
weather events that may influence the basins, channels and storage dams,
and implement actions to mitigate their negative effects.
In Mexico, policy management of Hydraulic Works including reservoirs is
dictated by the Technical Committee of Hydraulic Works Operation (CTOOH),
which is a multidisciplinary group composed of experts in different areas of
knowledge.

In order to support this decision-making, SGT provides evidence,such as: record of reservoir evolution; hydrological forecast ofreservoirs for inputs of 2, 25, 50, 75 and 98% of occurrencethrough continuity equation modelling, channel capacitydownstream of dams, whose water volume causes no damage,water volumes extracted under irrigation schemes, drinking waterdemand or requirements of the national electricity system.
SGT has reviewed over recent years the operating policies of the 50dams that have such policy, changing the "abrupt" extractions forsmoothed discharges in order to reduce damage downstream; the"steps" below OHWL were removed and design floodwaters wererevised to update protocols.

From September 2014 to March 2016 an anomaly in the Pacific region temperatureoccurred, creating favourable conditions for hurricane development. This situationworsened during October 2015.
Date Anomaly
Temp.
Date Anomaly
Temp.
Sep 14 0.5 July 15 1.6
Oct 14 0.5 Aug 15 2.1
Nov 14 0.9 Sep 15 2.3
Dec 14 0.8 Oct 15 4.9
Jan 15 0.5 Nov 15 3.0
Feb 15 0.6 Dec 15 2.8
Mar 15 0.6 Jan 16 2.6
April 15 0.8 Feb 16 2.4
May 15 1.0 Mar 16 1.7
June 15 1.3
Hurricane Patricia

Hurricane Patricia can be regarded as the most intense tropical cyclone
ever observed in the Western Hemisphere with maximum sustained winds
of 346 km/h.Hurricane Date Max winds
(Km/h)
Pressure
(hPa)
Patricia 20-24 Oct 2015 346 872
Linda 9-17 Sept 1997 295 902
Kenna 22-26 Oct 2002 270 913
Odile 10-19 Sept 2014 220 918

Hurricane Patricia Trajectory Hurricane Patricia at 7:00 hrs 23/Oct/2015

According to Weather Alert No. 068-15, 23 October 2015, the National Water Commissionreported at 18:00 hrs. Mexico Central Time, that Category 5 Hurricane Patricia wouldmake landfall in the vicinity of Tenacatita, Cuestecomate and Navidad Bays, a region wherethe towns of El Estrecho, La Manzanilla and Melaque are located, in the municipalities ofLa Huerta and Cihuatlán, Jalisco

CONAGUA through SGT monitored the hurricane and the conditions and evolution of dams likely to receivesudden inflows from rainfall generated by the hurricane.
Thus, 29 dams remained under permanent surveillance in order to carry out in a timely manner themanagement, control and discharge of storage volumes that were deemed necessary
A ctual N A M O
Aguamilpa, Nay. 4850 5540 87.55
El Cajón, Nay 1899.64 2551.7 74.45
La Yesca, Jal. 1687.55 2292.92 73.60
José Ma. Morelos, Mich. 482.9 540.8 89.29
Cajón de Peña, Jal. 480.87 466.69 103.04
Trigomil, Jal. 248.92 250 99.57
Trojes, Col. 219.41 220.81 99.37
Tacotán, Jal. 149.34 149.24 100.07
Basilio Badillo, Jal 134.2 145.72 92.09
San Juanico, Mich. 57.6 60.48 95.24
La Vega, Jal. 49.48 44 112.45
Laguna de Amela, Col. 38.11 38.34 99.40
Vicente C. Villaseñor, Jal. 14.44 14.44 100.00
Laguna Colorada, Jal. 13.32 12.8 104.06
Tenasco, Jal. 5 .97 10.5 56.86
Copándaro, Mich. 6.19 6.5 95.23
El Trigo, Jal. 2 .58 4.4 58.64
Santa Elena, Dgo. 14.7 15.1 97.35
Sant iago Bayacora, Nay. 130.15 130.05 100.08
Guadalupe Victoria 83.09 84.75 98.04
Achimec, Zac. 7.17 6.74 106.38
Excame, Zac. 51.82 71.61 72.36
El Chique, Zac. 139.48 139.95 99.66
Tayahua, Zac. 31.63 31.6 100.09
San Pedro Piedra Gorda, Zac. 0 5 0.00
San Marcos s/ d 3.5 s/ n
El Cazadero, Zac. 22.14 22.13 100.05
Jocoque, Ags. 10.97 10.98 99.91
Niágara, Ags 16.33 16.19 100.86
(hm 3)N om bre de presa % llenado

Of all dams under surveillance, the Cajon de Peña dam was considered to be the most atrisk, because it was located approximately 60 km from the eye of the hurricane; it wouldbe the first landfall impact zone; it had a storage of 480 hm3, 5% higher than OHWL(466.69 hm3); it is a curtain of graduated materials; and about 13,000 inhabitants wereliving downstream, according to INEGI census of 2010
0
20
40
60
80
100
120
0
1000
2000
3000
4000
5000
6000
Cajón de Peña Trigomil Trojes La Villita Aguamilpa El Cajón La Yesca
Monitoring dams during Hurricane Patricia
% fill Vol. NAMO

Cajon de Peña Dam in Jalisco State
It was built between 1974-1976 by the Secretariat of Hydraulic Resources (SRH). It islocated in the Tomatlan River, 16.8 km upstream of Tomatlan, Jalisco.
The dam consists of a main curtain and four closing dikes of graded materials. Thecurtain has a length of 1015m, maximum height of 68m from the excavation, crownwidth of 10m to a 142m elevation; clay core covered with selected gravel-sand filters,bank 0.7: 1 on both sides; gravel-sand supports were placed on filters to a side bank 2:1,covered with muck and tumbled stones.
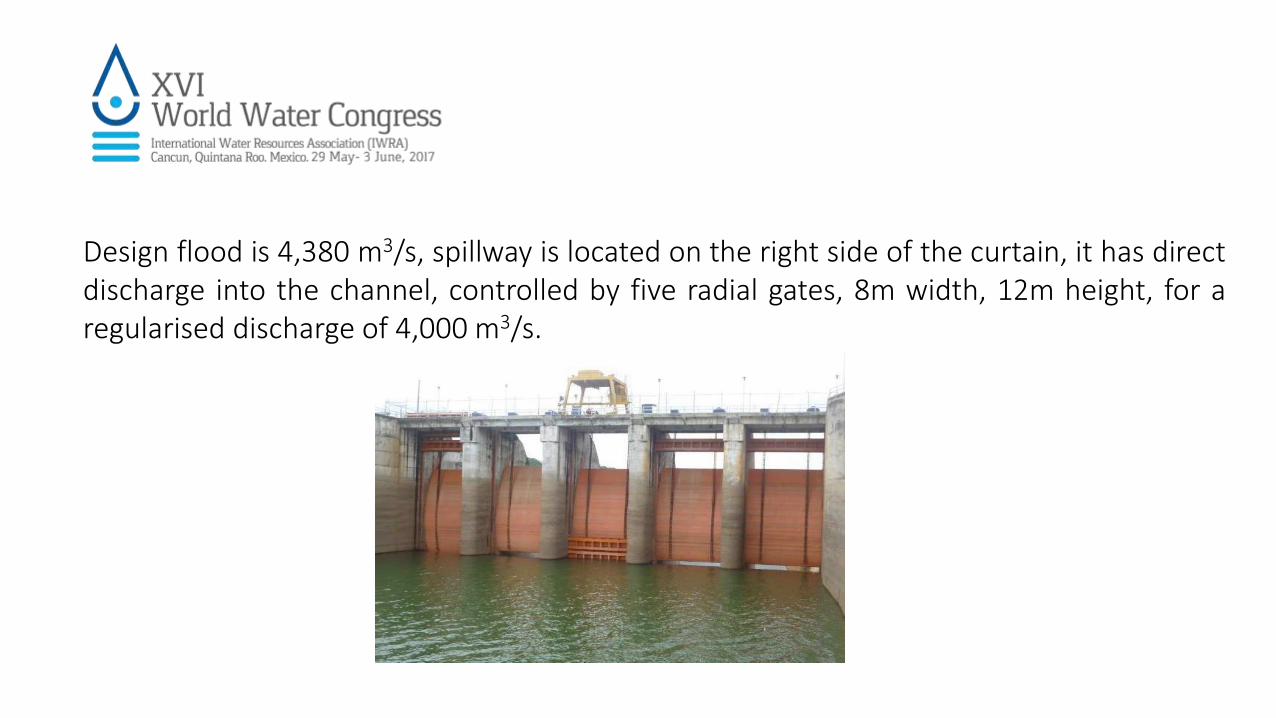
Design flood is 4,380 m3/s, spillway is located on the right side of the curtain, it has directdischarge into the channel, controlled by five radial gates, 8m width, 12m height, for aregularised discharge of 4,000 m3/s.
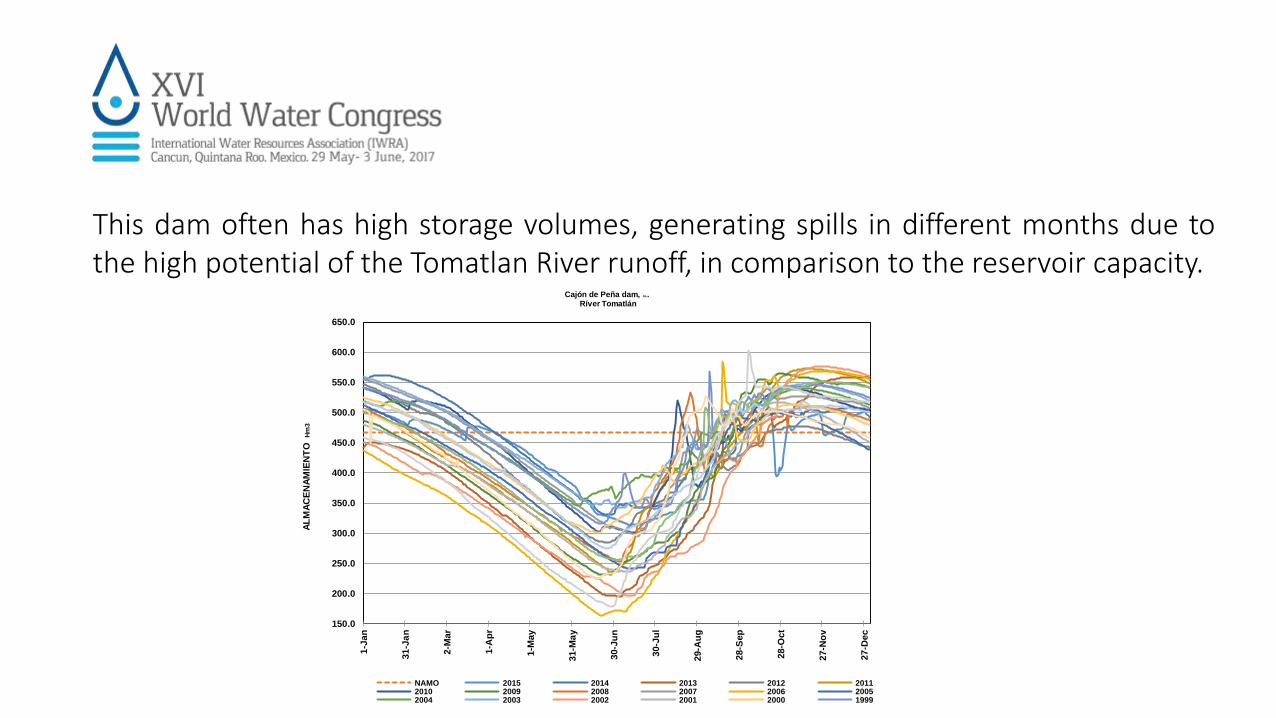
This dam often has high storage volumes, generating spills in different months due tothe high potential of the Tomatlan River runoff, in comparison to the reservoir capacity.
150.0
200.0
250.0
300.0
350.0
400.0
450.0
500.0
550.0
600.0
650.0
1-J
an
31-J
an
2-M
ar
1-A
pr
1-M
ay
31-M
ay
30-J
un
30-J
ul
29-A
ug
28-S
ep
28-O
ct
27-N
ov
27-D
ec
Cajón de Peña dam, JAL.Ríver Tomatlán
NAMO 2015 2014 2013 2012 20112010 2009 2008 2007 2006 20052004 2003 2002 2001 2000 1999
AL
MA
CE
NA
MIE
NT
OH
m3

Dam management in 2015
As previously described, CONAGUA through the SGT keeps national dams under
permanent surveillance, checking dam levels before the onset of the rainy season or
during an extraordinary weather event.
This was the case of Cajon de Peña dam prior to the rainy season of 2015.
By the end of the dry season, the dam stored volume was 476.74 hm3, which is higher
than its OHWL (466.69 hm3), Chart 4; preventive withdrawals were conducted to allow
for new storage to receive runoffs generated during the following rainy season.

420
430
440
450
460
470
480
490
500
510
1-Jan 11-Jan 21-Jan 31-Jan 10-Feb 20-Feb 2-Mar 12-Mar 22-Mar 1-Apr 11-Apr
Alm
acen
amie
nto
(h
m3
)
período
Cajón de Peña Dam
NAMO ALMACENAMIENTO
These control withdrawals were conducted under the Gate Operating Policy endorsed
by the Division of Technical Affairs (SGT) and the Lerma-Santiago-Pacific (OCLSP) Basin
Organization.
0
50
100
150
200
250
300
350
400
450
500
1-Apr 16-Apr 1-May 16-May 31-May 15-Jun 30-Jun 15-Jul 30-Jul
Alm
acen
amie
nto
(h
m3)
período
Cajon de Peña dam
NAMO ALMACENAMIENTO

On 20 October the dam storage recorded was 489.62 hm3, nearly 5% above OHWL, withdrawals wereconducted to allow for new storage to receive expected runoffs, as well as to prevent the reservoir level toreach or exceeded EHWL. If this situation had occurred, it would had lead to structural damage as it is anearthworks dam, and under no circumstances would be possible to allow water level exceed the EHWLprojected
0
100
200
300
400
500
600
20-Oct 21-Oct 22-Oct 23-Oct 24-Oct 25-Oct
Alm
acen
amie
nto
(h
m3)
Período
Cajón de Peña Dam
NAMO ALMACENAMIENTO
Dep
resi
ón
Tro
pic
al
Hu
racá
n C
ateg
ori
aI "
Pat
rici
a"
Hu
racá
n C
ateg
ori
aV
"P
atri
cia"
Hu
racá
n C
ateg
ori
aV
"P
atri
cia"
to
ca t
ierr
a
Dep
resi
ón
Tro
pic
al
Date Withdrawal (m3/s) Stored volume
(hm3)
Overall %
stored
21 October 99.54 489.62104.9
22 October 351.17 480.86103.0
23 October 658.59 432.4792.7
24 October 421.40 398.8685.5
25 October 0 394.9884.6

Analysis
Even though Hurricane Patricia generated lower rainfall than it was
expected, the preventive withdrawals helped to avoid the reservoir to reach
the forecasted storage levels of 562.10 hm3 at an elevation of 134.07 masl,
i. e. 3.69 m above OHWL and the consequential damage to the dam. The
population was evacuated in a timely manner.

By the end of the year, given the timely and adequate management of levels in the
dam, storage over the OHWL was reached, in spite that the released flows could be
considered as a "waste of water".
90.0
95.0
100.0
105.0
110.0
115.0
120.0
400
420
440
460
480
500
520
540
560
2004 2005 2006 2007 2008 2009 2010 2011 2012 2013 2014 2015
% A
L N
AM
O
VO
LUM
EN A
LMA
CEN
AM
IEN
TO (h
m3)
AÑOS
Niveles de almacenamiento al 31 de diciembre
ALMACENAMIENTO % DE LLENADO

The new policy implemented by CONAGUA enabled the following key operation objectivesof reservoirs to be met:
1) Timely implementation of emergency protocols for population evacuation and protectionof their property, and creating temporary shelters.
2) Safeguarding structural, hydrological, hydraulic and functional security of the dam.
3) Linking Federal, State and Municipal Bodies and the scientific and technical community indecision-making.
4) Providing sufficient water to meet the required water demands.

Conclusions
• The operation policy is an ongoing decision-making process to define reservoir storage levels and hence its releases, in order to avoid any damage to the dam and the infrastructure located downstream.
• At present the CONAGUA aims to detect and predict impending extreme events in orderto formulate early warnings from monitoring and studying of factors that influence theintensity and frequency of disasters.
• In the case of the Cajon de Peña Dam, Jalisco, permanent surveillance allowed for a seriesof withdrawals to be conducted in a timely manner in order to provide in advance amargin for manoeuvre in case of possible extraordinary inflows and prevent risks

Conclusions
• This new operating policy implemented by CONAGUA in all dams in the country enabledto stored a volume of 491.95 Mm3, 5.5% above its OHWL capacity by the end of the year,which proves the proper management of the dam.
“ It is better to prevent than to treat”

“ It is better to prevent than to treat”