Embed Size (px)
Citation preview
The 2002/2003National Wage & Salary
Survey
SurveyReport
CONFIDENTIAL
An Employers Association GroupSponsored Survey
Coordinated by:
© 2003 Property of Employers Association Group. All rights reserved.
© 2003 Employers Association Group EAG Sponsored Survey
The Proper Use of Employers Associations (EAG) Surveys
The Employers Association Group (EAG) conducts and compiles annual surveys solely to assistmanagement in determining relevant wages, salaries, benefits, and practices. The survey results areenhanced when used in conjunction with other sources of information.
Surveys provide a valuable tool for use in determining how a firm’s pay structure relates to those ina given area. Survey users should not use the data as absolute compensation standards. Manyfactors, such as changes in the mix of participating companies or the level of employment in thecommunity can affect the data and the results. Please exercise care when utilizing survey data.Specific results should be examined in the context of overall survey findings and the generaleconomic situation prevailing at the time the data was gathered.
Policy Statement – Administrative Board
Association surveys are most effectively used when employed as a guide for managementtogether with other data to determine the organization's position and its alternatives and inadvance of actual bargaining and as a reference during bargaining but removed from theactual bargaining sessions. Since this survey is confidential, it is suggested that no directreference be made to it in bargaining or in discussions with employees. There is little togain and much to lose by using or referring to our survey data directly in bargaining. Bothlegal and practical considerations are involved.
All Rights Reserved
This survey is for the exclusive use of the recipient. No part may be reproduced inwritten form or electronically without express written permission in advance.
Copyright 2003 Property of Employers Association Group
Please respect the confidentiality of the many organizations that have submittedthe data to make this report possible by restricting access to authorized personnel only.
© 2003 Employers Association Group EAG Sponsored Survey
Table of Contents
Page
Introduction .................................................................................................................. i
List of Participating Employer Associations (EAG) ..................................................... ii
Survey Methodology and Definitions .......................................................................... vi
Effective Data Dates ..................................................................................................... vii
National Averages (including job index & page numbers)
Office, Clerical and Technical Positions ................................................................. 3
Managerial and Professional Positions .................................................................. 4
Production and Maintenance Positions .................................................................. 5
Comparative Data Based on Geographic Region
Office, Clerical and Technical Positions ................................................................. 7
Managerial and Professional Positions .................................................................. 53
Production and Maintenance Positions .................................................................. 105
© 2003 Employers Association Group i EAG Sponsored Survey
Introduction
This 2002/2003 National Wage & Salary Survey report is authorized by the Employer AssociationGroup (EAG) and was conducted and published by a participating affiliate association. This reporthas been published annually since 1983.
The EAG hopes that this publication will aid employers by providing the most accurate, useful,comparative wage and salary data available between geographic regions in the continental UnitedStates. Although extensive, this survey is just a sample of data collected by EmployersAssociations throughout the United States.
It must be noted that sample input of under nine (9) organizations is not a valid sample andshould only be used as trend indicators in conjunction with other data contained within the surveyreport.
Users of this survey report are reminded that not all reporting associations compile surveyinformation on all of the “benchmark” positions used as the basis for comparison in this study.
Should you need compensation data on a specific geographic location or position not reported inthis survey report, please contact the association that provided your copy of this study.
© 2003 Employers Association Group ii EAG Sponsored Survey
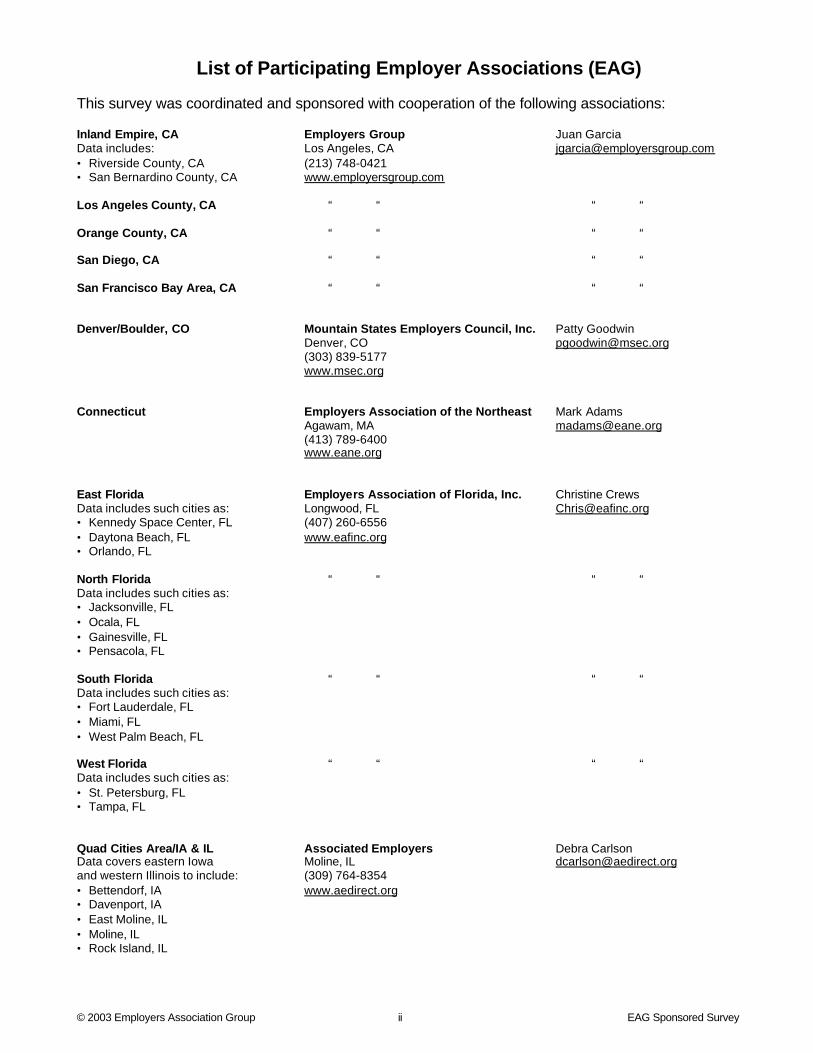
List of Participating Employer Associations (EAG)
This survey was coordinated and sponsored with cooperation of the following associations:
Inland Empire, CA Employers Group Juan GarciaData includes: Los Angeles, CA [email protected]• Riverside County, CA (213) 748-0421• San Bernardino County, CA www.employersgroup.com
Los Angeles County, CA “ “ “ “
Orange County, CA “ “ “ “
San Diego, CA “ “ “ “
San Francisco Bay Area, CA “ “ “ “
Denver/Boulder, CO Mountain States Employers Council, Inc. Patty GoodwinDenver, CO [email protected](303) 839-5177www.msec.org
Connecticut Employers Association of the Northeast Mark AdamsAgawam, MA [email protected](413) 789-6400www.eane.org
East Florida Employers Association of Florida, Inc. Christine CrewsData includes such cities as: Longwood, FL [email protected]• Kennedy Space Center, FL (407) 260-6556• Daytona Beach, FL www.eafinc.org• Orlando, FL
North Florida “ “ “ “Data includes such cities as:• Jacksonville, FL• Ocala, FL• Gainesville, FL• Pensacola, FL
South Florida “ “ “ “Data includes such cities as:• Fort Lauderdale, FL• Miami, FL• West Palm Beach, FL
West Florida “ “ “ “Data includes such cities as:• St. Petersburg, FL• Tampa, FL
Quad Cities Area/IA & IL Associated Employers Debra CarlsonData covers eastern Iowa Moline, IL [email protected] western Illinois to include: (309) 764-8354• Bettendorf, IA www.aedirect.org• Davenport, IA• East Moline, IL• Moline, IL• Rock Island, IL
© 2003 Employers Association Group iii EAG Sponsored Survey
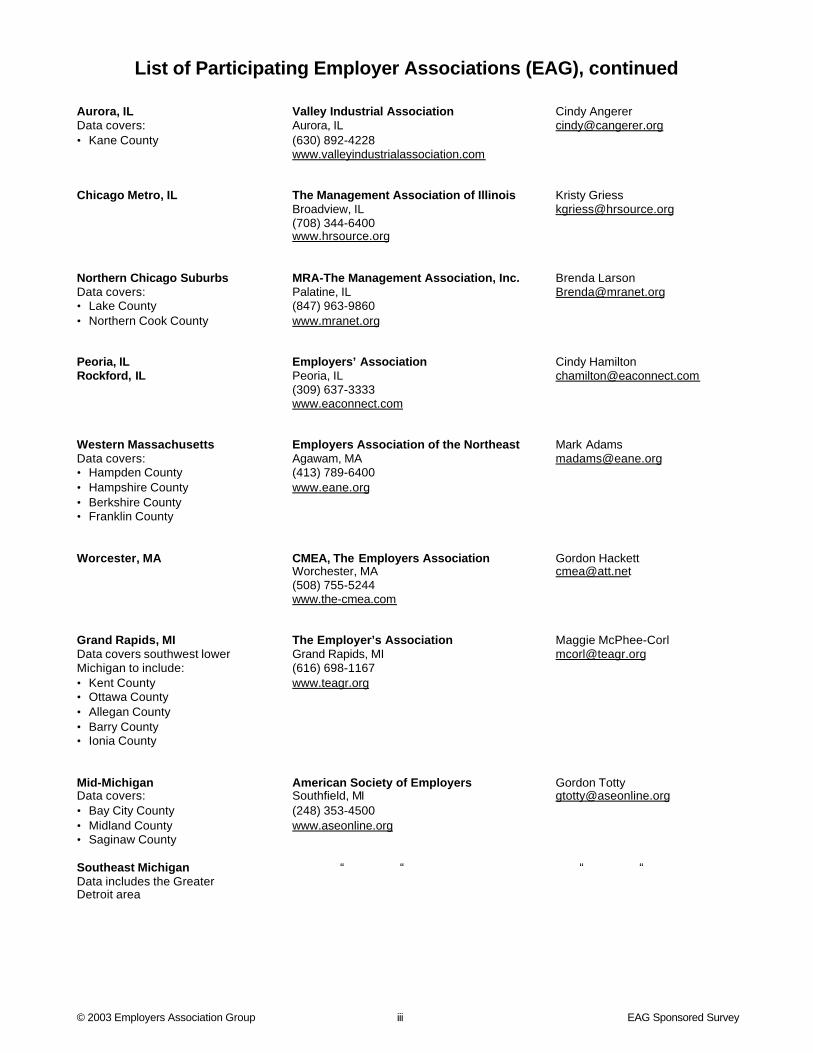
List of Participating Employer Associations (EAG), continued
Aurora, IL Valley Industrial Association Cindy AngererData covers: Aurora, IL [email protected]• Kane County (630) 892-4228
www.valleyindustrialassociation.com
Chicago Metro, IL The Management Association of Illinois Kristy GriessBroadview, IL [email protected](708) 344-6400www.hrsource.org
Northern Chicago Suburbs MRA-The Management Association, Inc. Brenda LarsonData covers: Palatine, IL [email protected]• Lake County (847) 963-9860• Northern Cook County www.mranet.org
Peoria, IL Employers’ Association Cindy HamiltonRockford, IL Peoria, IL [email protected]
(309) 637-3333www.eaconnect.com
Western Massachusetts Employers Association of the Northeast Mark AdamsData covers: Agawam, MA [email protected]• Hampden County (413) 789-6400• Hampshire County www.eane.org• Berkshire County• Franklin County
Worcester, MA CMEA, The Employers Association Gordon HackettWorchester, MA [email protected](508) 755-5244www.the-cmea.com
Grand Rapids, MI The Employer’s Association Maggie McPhee-CorlData covers southwest lower Grand Rapids, MI [email protected] to include: (616) 698-1167• Kent County www.teagr.org• Ottawa County• Allegan County• Barry County• Ionia County
Mid-Michigan American Society of Employers Gordon TottyData covers: Southfield, MI [email protected]• Bay City County (248) 353-4500• Midland County www.aseonline.org• Saginaw County
Southeast Michigan “ “ “ “Data includes the GreaterDetroit area
© 2003 Employers Association Group iv EAG Sponsored Survey
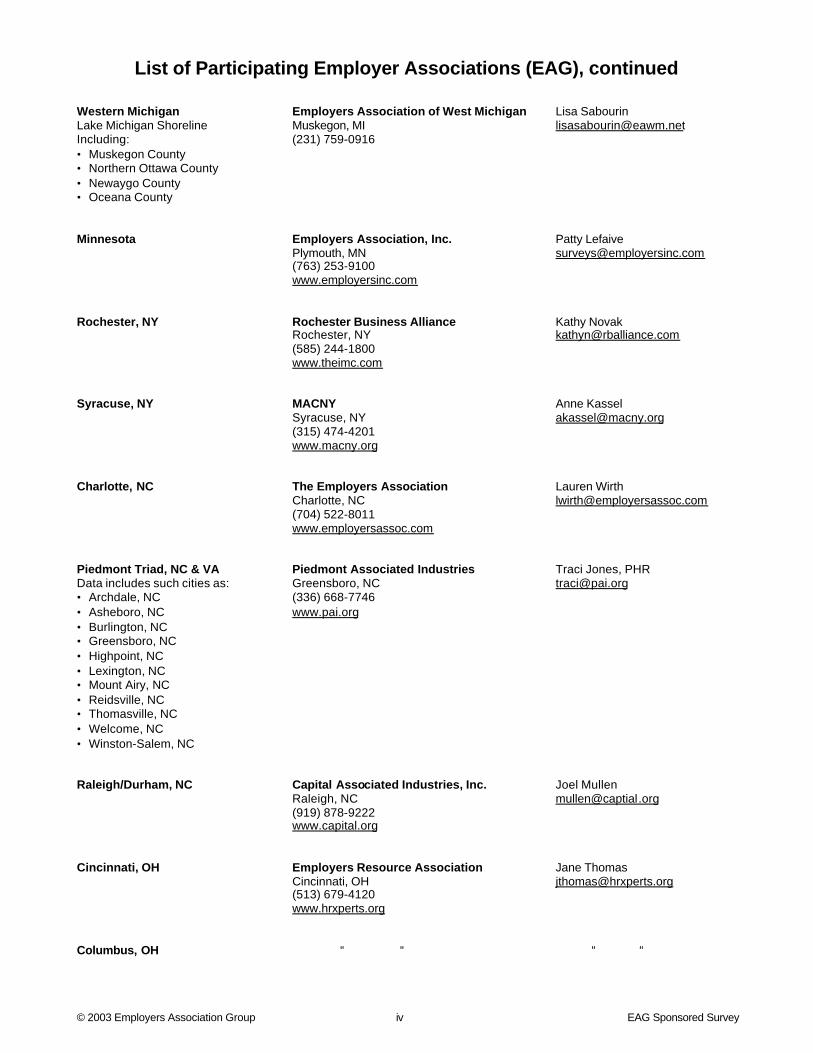
List of Participating Employer Associations (EAG), continued
Western Michigan Employers Association of West Michigan Lisa SabourinLake Michigan Shoreline Muskegon, MI [email protected]: (231) 759-0916• Muskegon County• Northern Ottawa County• Newaygo County• Oceana County
Minnesota Employers Association, Inc. Patty LefaivePlymouth, MN [email protected](763) 253-9100www.employersinc.com
Rochester, NY Rochester Business Alliance Kathy NovakRochester, NY [email protected](585) 244-1800www.theimc.com
Syracuse, NY MACNY Anne KasselSyracuse, NY [email protected](315) 474-4201www.macny.org
Charlotte, NC The Employers Association Lauren WirthCharlotte, NC [email protected](704) 522-8011www.employersassoc.com
Piedmont Triad, NC & VA Piedmont Associated Industries Traci Jones, PHRData includes such cities as: Greensboro, NC [email protected]• Archdale, NC (336) 668-7746• Asheboro, NC www.pai.org• Burlington, NC• Greensboro, NC• Highpoint, NC• Lexington, NC• Mount Airy, NC• Reidsville, NC• Thomasville, NC• Welcome, NC• Winston-Salem, NC
Raleigh/Durham, NC Capital Associated Industries, Inc. Joel MullenRaleigh, NC [email protected](919) 878-9222www.capital.org
Cincinnati, OH Employers Resource Association Jane ThomasCincinnati, OH [email protected](513) 679-4120www.hrxperts.org
Columbus, OH “ “ “ “
© 2003 Employers Association Group v EAG Sponsored Survey
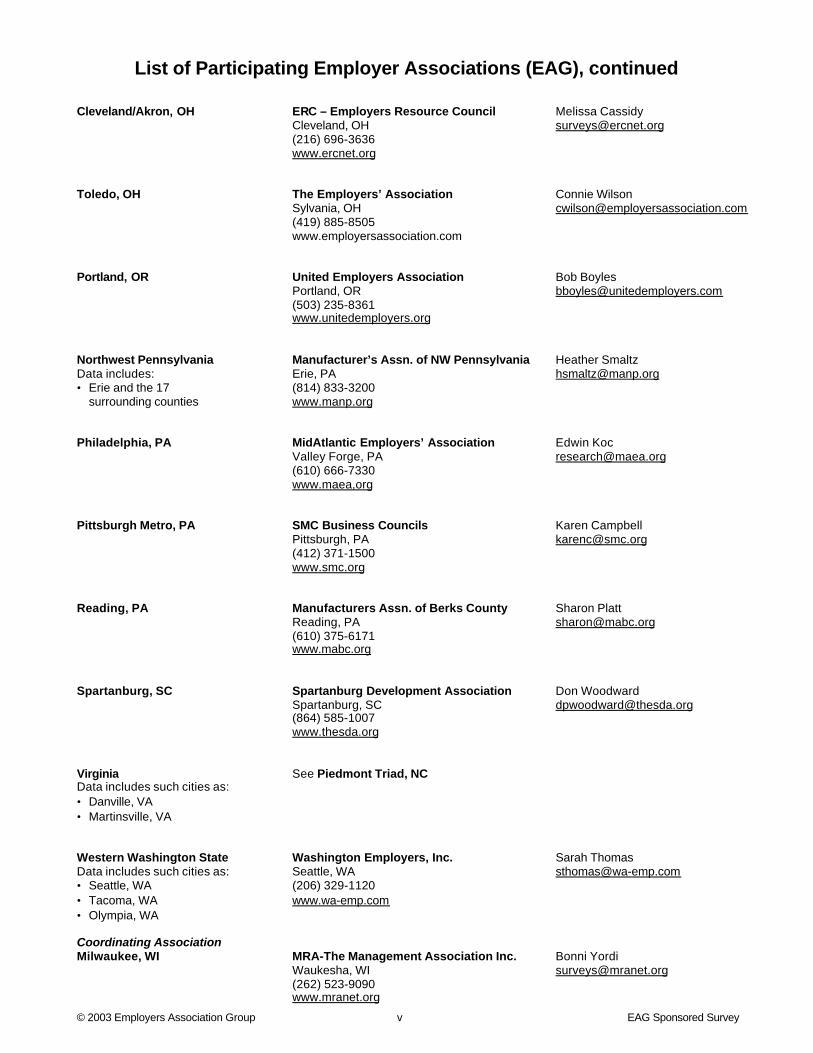
List of Participating Employer Associations (EAG), continued
Cleveland/Akron, OH ERC – Employers Resource Council Melissa CassidyCleveland, OH [email protected](216) 696-3636www.ercnet.org
Toledo, OH The Employers’ Association Connie WilsonSylvania, OH [email protected](419) 885-8505www.employersassociation.com
Portland, OR United Employers Association Bob BoylesPortland, OR [email protected](503) 235-8361www.unitedemployers.org
Northwest Pennsylvania Manufacturer’s Assn. of NW Pennsylvania Heather SmaltzData includes: Erie, PA [email protected]• Erie and the 17 (814) 833-3200
surrounding counties www.manp.org
Philadelphia, PA MidAtlantic Employers’ Association Edwin KocValley Forge, PA [email protected](610) 666-7330www.maea,org
Pittsburgh Metro, PA SMC Business Councils Karen CampbellPittsburgh, PA [email protected](412) 371-1500www.smc.org
Reading, PA Manufacturers Assn. of Berks County Sharon PlattReading, PA [email protected](610) 375-6171www.mabc.org
Spartanburg, SC Spartanburg Development Association Don WoodwardSpartanburg, SC [email protected](864) 585-1007www.thesda.org
Virginia See Piedmont Triad, NCData includes such cities as:• Danville, VA• Martinsville, VA
Western Washington State Washington Employers, Inc. Sarah ThomasData includes such cities as: Seattle, WA [email protected]• Seattle, WA (206) 329-1120• Tacoma, WA www.wa-emp.com• Olympia, WA
Coordinating AssociationMilwaukee, WI MRA-The Management Association Inc. Bonni Yordi
Waukesha, WI [email protected](262) 523-9090www.mranet.org
© 2003 Employers Association Group vi EAG Sponsored Survey
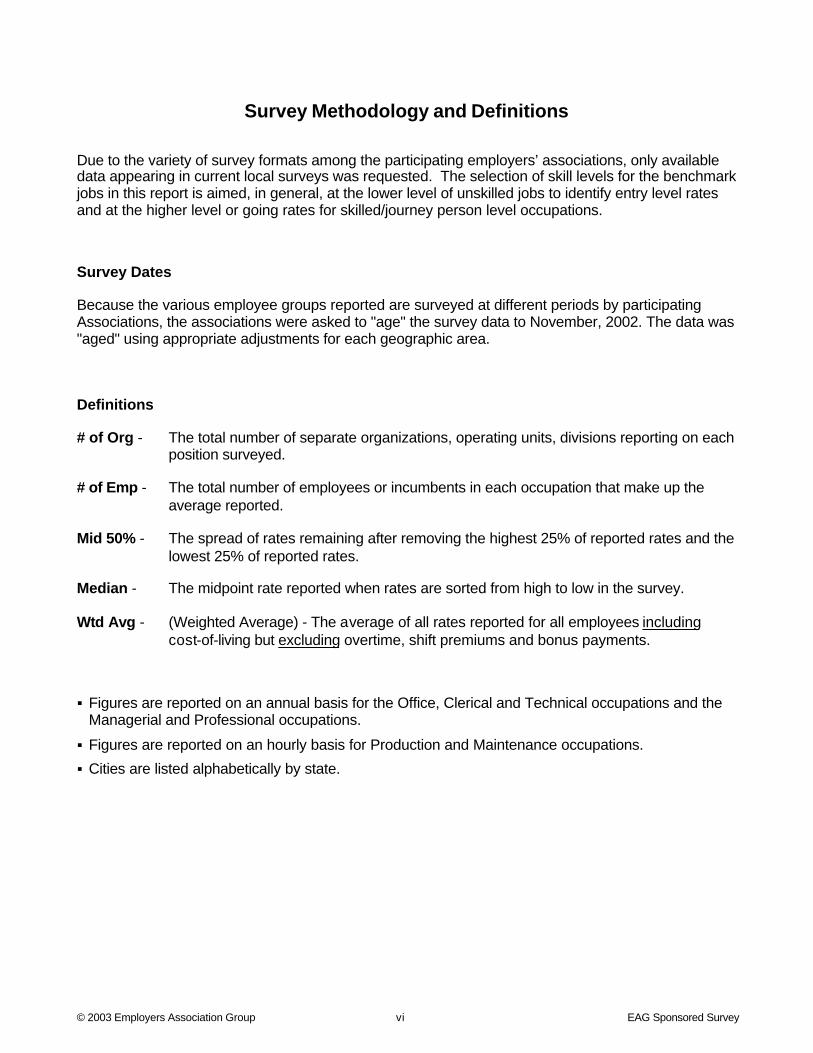
Survey Methodology and Definitions
Due to the variety of survey formats among the participating employers’ associations, only availabledata appearing in current local surveys was requested. The selection of skill levels for the benchmarkjobs in this report is aimed, in general, at the lower level of unskilled jobs to identify entry level ratesand at the higher level or going rates for skilled/journey person level occupations.
Survey Dates
Because the various employee groups reported are surveyed at different periods by participatingAssociations, the associations were asked to "age" the survey data to November, 2002. The data was"aged" using appropriate adjustments for each geographic area.
Definitions
# of Org - The total number of separate organizations, operating units, divisions reporting on eachposition surveyed.
# of Emp - The total number of employees or incumbents in each occupation that make up theaverage reported.
Mid 50% - The spread of rates remaining after removing the highest 25% of reported rates and thelowest 25% of reported rates.
Median - The midpoint rate reported when rates are sorted from high to low in the survey.
Wtd Avg - (Weighted Average) - The average of all rates reported for all employees includingcost-of-living but excluding overtime, shift premiums and bonus payments.
§ Figures are reported on an annual basis for the Office, Clerical and Technical occupations and theManagerial and Professional occupations.
§ Figures are reported on an hourly basis for Production and Maintenance occupations.
§ Cities are listed alphabetically by state.
© 2003 Employers Association Group vii EAG Sponsored Survey
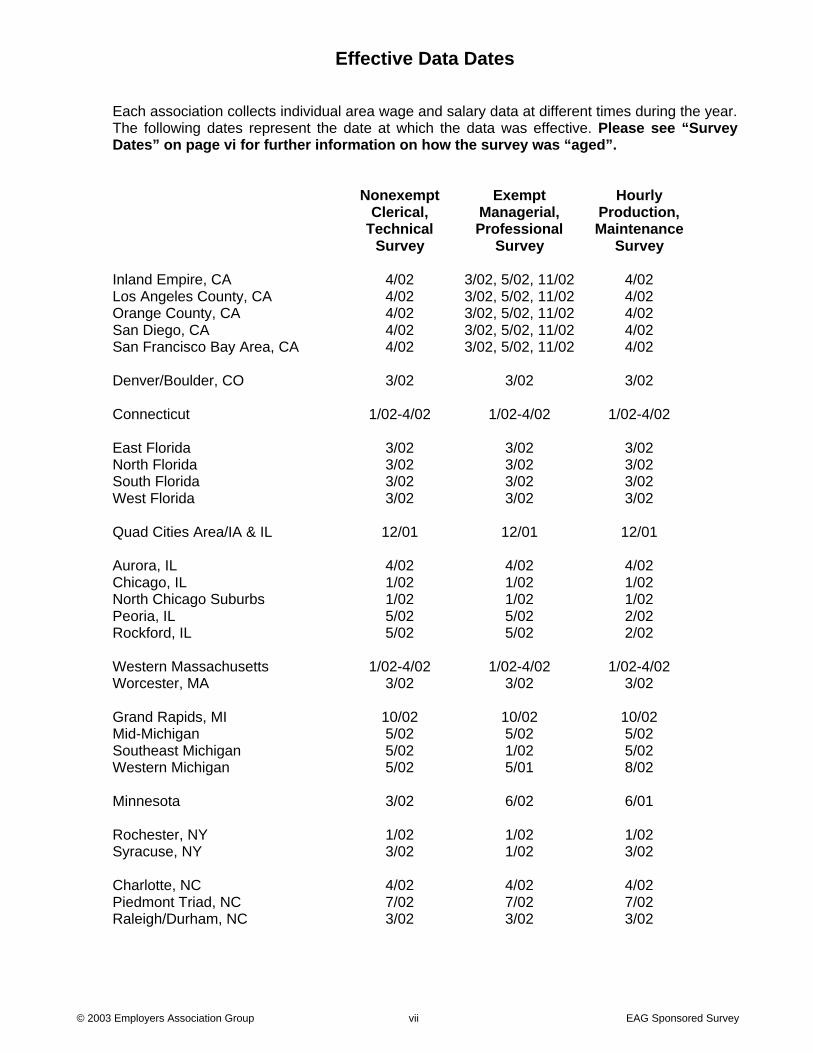
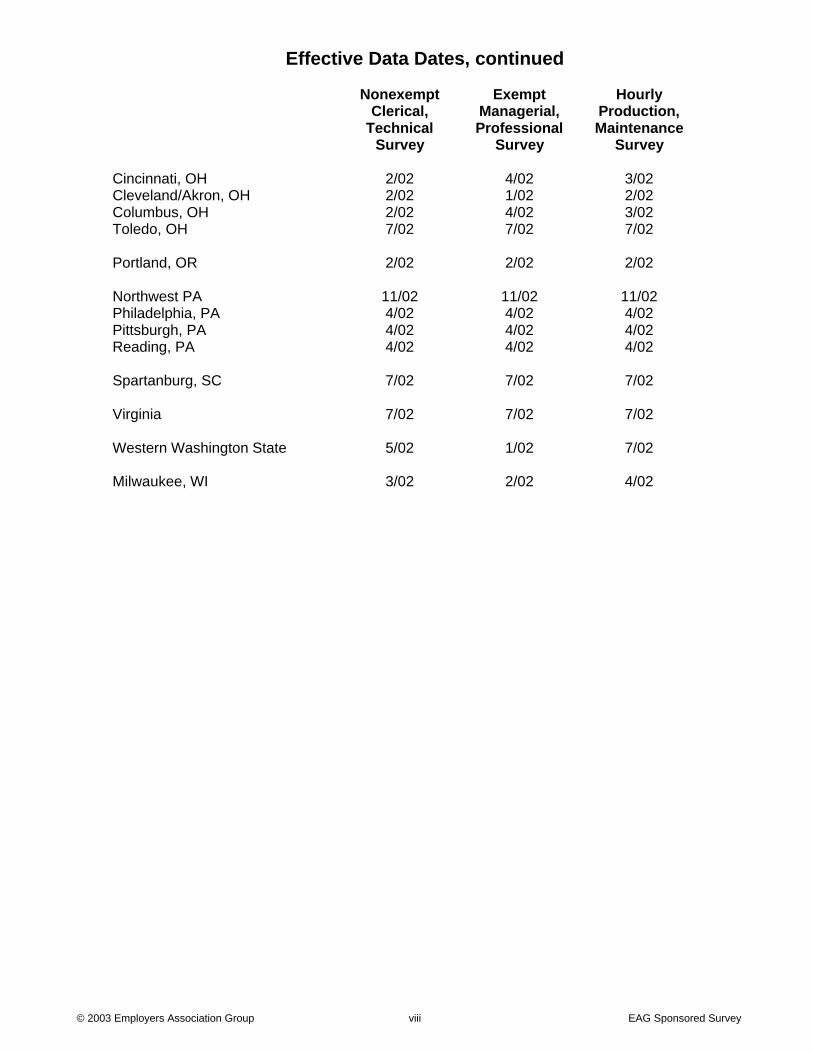
Effective Data Dates
Each association collects individual area wage and salary data at different times during the year.The following dates represent the date at which the data was effective. Please see “SurveyDates” on page vi for further information on how the survey was “aged”.
Nonexempt Exempt HourlyClerical, Managerial, Production,
Technical Professional MaintenanceSurvey Survey Survey
Inland Empire, CA 4/02 3/02, 5/02, 11/02 4/02Los Angeles County, CA 4/02 3/02, 5/02, 11/02 4/02Orange County, CA 4/02 3/02, 5/02, 11/02 4/02San Diego, CA 4/02 3/02, 5/02, 11/02 4/02San Francisco Bay Area, CA 4/02 3/02, 5/02, 11/02 4/02
Denver/Boulder, CO 3/02 3/02 3/02
Connecticut 1/02-4/02 1/02-4/02 1/02-4/02
East Florida 3/02 3/02 3/02North Florida 3/02 3/02 3/02South Florida 3/02 3/02 3/02West Florida 3/02 3/02 3/02
Quad Cities Area/IA & IL 12/01 12/01 12/01
Aurora, IL 4/02 4/02 4/02Chicago, IL 1/02 1/02 1/02North Chicago Suburbs 1/02 1/02 1/02Peoria, IL 5/02 5/02 2/02Rockford, IL 5/02 5/02 2/02
Western Massachusetts 1/02-4/02 1/02-4/02 1/02-4/02Worcester, MA 3/02 3/02 3/02
Grand Rapids, MI 10/02 10/02 10/02Mid-Michigan 5/02 5/02 5/02Southeast Michigan 5/02 1/02 5/02Western Michigan 5/02 5/01 8/02
Minnesota 3/02 6/02 6/01
Rochester, NY 1/02 1/02 1/02Syracuse, NY 3/02 1/02 3/02
Charlotte, NC 4/02 4/02 4/02Piedmont Triad, NC 7/02 7/02 7/02Raleigh/Durham, NC 3/02 3/02 3/02
© 2003 Employers Association Group viii EAG Sponsored Survey
Effective Data Dates, continued
Nonexempt Exempt HourlyClerical, Managerial, Production,
Technical Professional MaintenanceSurvey Survey Survey
Cincinnati, OH 2/02 4/02 3/02Cleveland/Akron, OH 2/02 1/02 2/02Columbus, OH 2/02 4/02 3/02Toledo, OH 7/02 7/02 7/02
Portland, OR 2/02 2/02 2/02
Northwest PA 11/02 11/02 11/02Philadelphia, PA 4/02 4/02 4/02Pittsburgh, PA 4/02 4/02 4/02Reading, PA 4/02 4/02 4/02
Spartanburg, SC 7/02 7/02 7/02
Virginia 7/02 7/02 7/02
Western Washington State 5/02 1/02 7/02
Milwaukee, WI 3/02 2/02 4/02

NATIONAL AVERAGES
1 © Property of Employer Association Group

(This Page is left blank.)
2 © Property of Employer Association Group
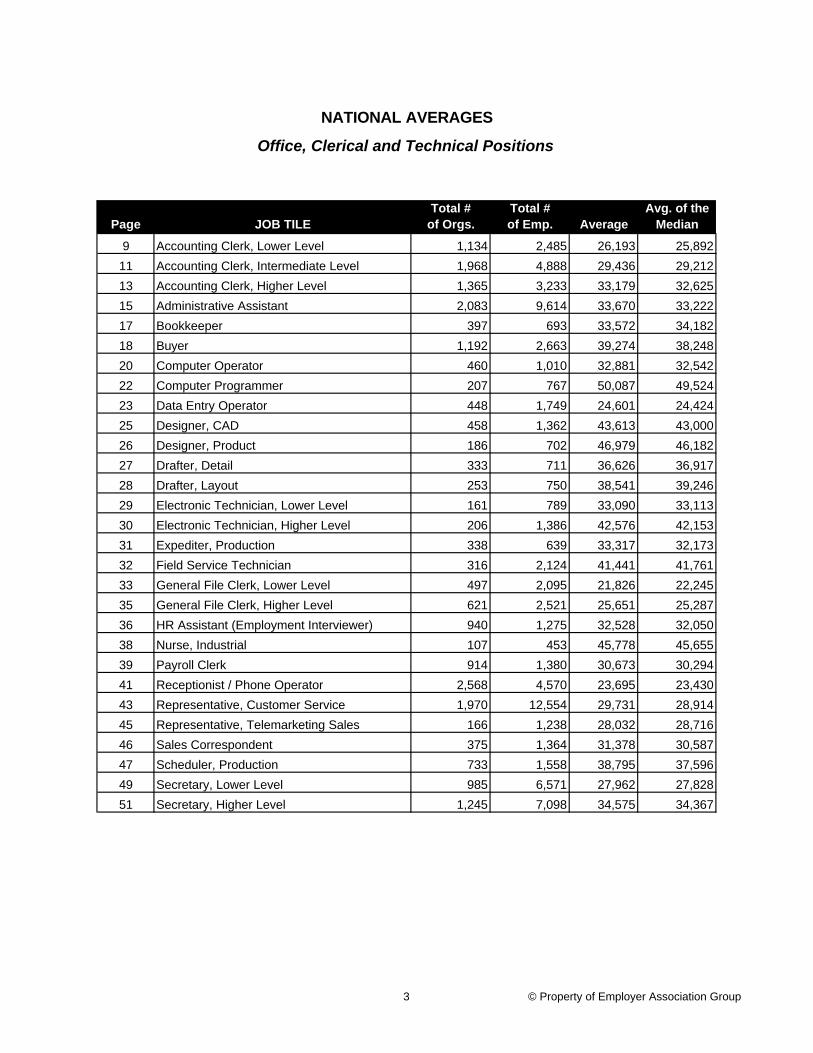
Page JOB TILETotal #
of Orgs.Total #of Emp. Average
Avg. of theMedian
9 Accounting Clerk, Lower Level 1,134 2,485 26,193 25,892
11 Accounting Clerk, Intermediate Level 1,968 4,888 29,436 29,212
13 Accounting Clerk, Higher Level 1,365 3,233 33,179 32,625
15 Administrative Assistant 2,083 9,614 33,670 33,222
17 Bookkeeper 397 693 33,572 34,182
18 Buyer 1,192 2,663 39,274 38,248
20 Computer Operator 460 1,010 32,881 32,542
22 Computer Programmer 207 767 50,087 49,524
23 Data Entry Operator 448 1,749 24,601 24,424
25 Designer, CAD 458 1,362 43,613 43,000
26 Designer, Product 186 702 46,979 46,182
27 Drafter, Detail 333 711 36,626 36,917
28 Drafter, Layout 253 750 38,541 39,246
29 Electronic Technician, Lower Level 161 789 33,090 33,113
30 Electronic Technician, Higher Level 206 1,386 42,576 42,153
31 Expediter, Production 338 639 33,317 32,173
32 Field Service Technician 316 2,124 41,441 41,761
33 General File Clerk, Lower Level 497 2,095 21,826 22,245
35 General File Clerk, Higher Level 621 2,521 25,651 25,287
36 HR Assistant (Employment Interviewer) 940 1,275 32,528 32,050
38 Nurse, Industrial 107 453 45,778 45,655
39 Payroll Clerk 914 1,380 30,673 30,294
41 Receptionist / Phone Operator 2,568 4,570 23,695 23,430
43 Representative, Customer Service 1,970 12,554 29,731 28,914
45 Representative, Telemarketing Sales 166 1,238 28,032 28,716
46 Sales Correspondent 375 1,364 31,378 30,587
47 Scheduler, Production 733 1,558 38,795 37,596
49 Secretary, Lower Level 985 6,571 27,962 27,828
51 Secretary, Higher Level 1,245 7,098 34,575 34,367
NATIONAL AVERAGES
Office, Clerical and Technical Positions
3 © Property of Employer Association Group
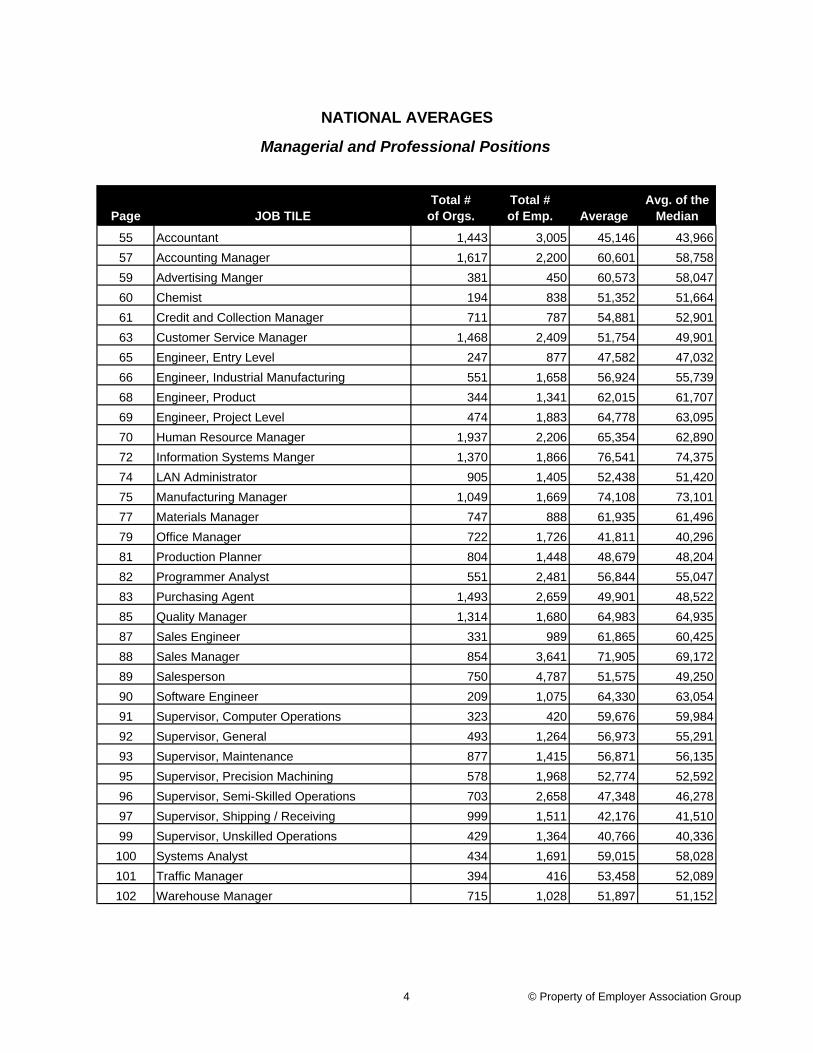
Page JOB TILETotal #
of Orgs.Total #of Emp. Average
Avg. of theMedian
55 Accountant 1,443 3,005 45,146 43,966
57 Accounting Manager 1,617 2,200 60,601 58,758
59 Advertising Manger 381 450 60,573 58,047
60 Chemist 194 838 51,352 51,664
61 Credit and Collection Manager 711 787 54,881 52,901
63 Customer Service Manager 1,468 2,409 51,754 49,901
65 Engineer, Entry Level 247 877 47,582 47,032
66 Engineer, Industrial Manufacturing 551 1,658 56,924 55,739
68 Engineer, Product 344 1,341 62,015 61,707
69 Engineer, Project Level 474 1,883 64,778 63,095
70 Human Resource Manager 1,937 2,206 65,354 62,890
72 Information Systems Manger 1,370 1,866 76,541 74,375
74 LAN Administrator 905 1,405 52,438 51,420
75 Manufacturing Manager 1,049 1,669 74,108 73,101
77 Materials Manager 747 888 61,935 61,496
79 Office Manager 722 1,726 41,811 40,296
81 Production Planner 804 1,448 48,679 48,204
82 Programmer Analyst 551 2,481 56,844 55,047
83 Purchasing Agent 1,493 2,659 49,901 48,522
85 Quality Manager 1,314 1,680 64,983 64,935
87 Sales Engineer 331 989 61,865 60,425
88 Sales Manager 854 3,641 71,905 69,172
89 Salesperson 750 4,787 51,575 49,250
90 Software Engineer 209 1,075 64,330 63,054
91 Supervisor, Computer Operations 323 420 59,676 59,984
92 Supervisor, General 493 1,264 56,973 55,291
93 Supervisor, Maintenance 877 1,415 56,871 56,135
95 Supervisor, Precision Machining 578 1,968 52,774 52,592
96 Supervisor, Semi-Skilled Operations 703 2,658 47,348 46,278
97 Supervisor, Shipping / Receiving 999 1,511 42,176 41,510
99 Supervisor, Unskilled Operations 429 1,364 40,766 40,336
100 Systems Analyst 434 1,691 59,015 58,028
101 Traffic Manager 394 416 53,458 52,089
102 Warehouse Manager 715 1,028 51,897 51,152
NATIONAL AVERAGES
Managerial and Professional Positions
4 © Property of Employer Association Group
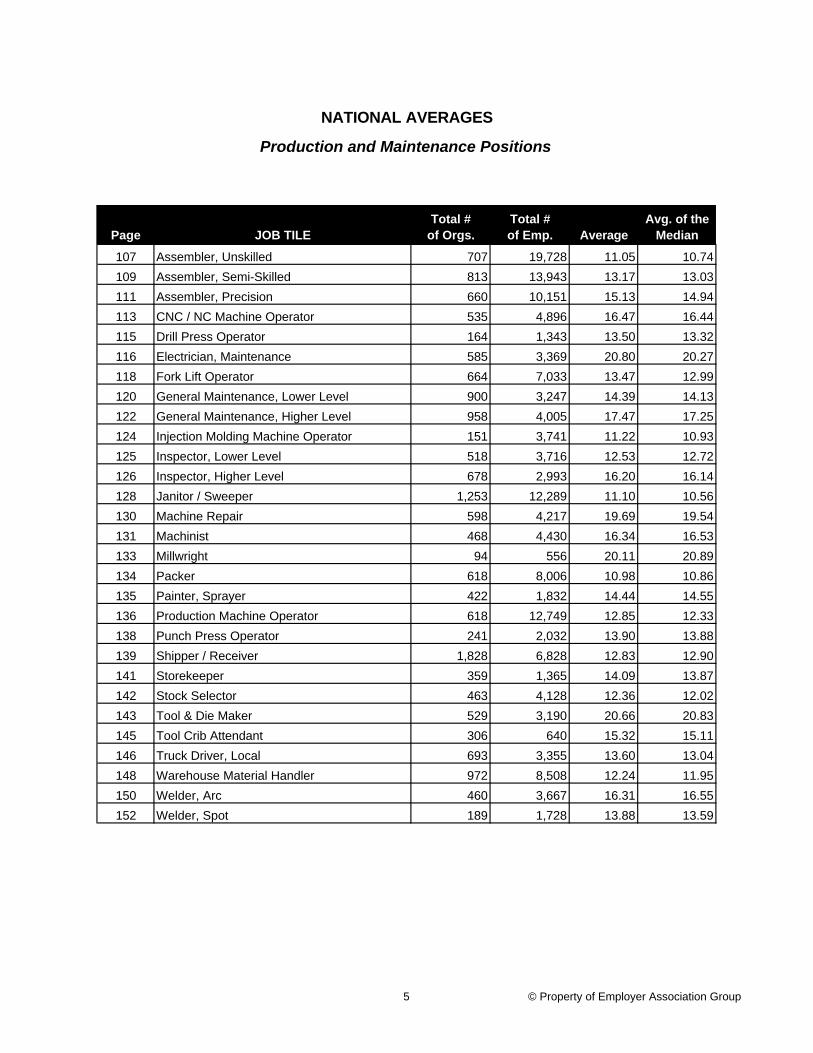
Page JOB TILETotal #
of Orgs.Total #of Emp. Average
Avg. of theMedian
107 Assembler, Unskilled 707 19,728 11.05 10.74
109 Assembler, Semi-Skilled 813 13,943 13.17 13.03
111 Assembler, Precision 660 10,151 15.13 14.94
113 CNC / NC Machine Operator 535 4,896 16.47 16.44
115 Drill Press Operator 164 1,343 13.50 13.32
116 Electrician, Maintenance 585 3,369 20.80 20.27
118 Fork Lift Operator 664 7,033 13.47 12.99
120 General Maintenance, Lower Level 900 3,247 14.39 14.13
122 General Maintenance, Higher Level 958 4,005 17.47 17.25
124 Injection Molding Machine Operator 151 3,741 11.22 10.93
125 Inspector, Lower Level 518 3,716 12.53 12.72
126 Inspector, Higher Level 678 2,993 16.20 16.14
128 Janitor / Sweeper 1,253 12,289 11.10 10.56
130 Machine Repair 598 4,217 19.69 19.54
131 Machinist 468 4,430 16.34 16.53
133 Millwright 94 556 20.11 20.89
134 Packer 618 8,006 10.98 10.86
135 Painter, Sprayer 422 1,832 14.44 14.55
136 Production Machine Operator 618 12,749 12.85 12.33
138 Punch Press Operator 241 2,032 13.90 13.88
139 Shipper / Receiver 1,828 6,828 12.83 12.90
141 Storekeeper 359 1,365 14.09 13.87
142 Stock Selector 463 4,128 12.36 12.02
143 Tool & Die Maker 529 3,190 20.66 20.83
145 Tool Crib Attendant 306 640 15.32 15.11
146 Truck Driver, Local 693 3,355 13.60 13.04
148 Warehouse Material Handler 972 8,508 12.24 11.95
150 Welder, Arc 460 3,667 16.31 16.55
152 Welder, Spot 189 1,728 13.88 13.59
NATIONAL AVERAGES
Production and Maintenance Positions
5 © Property of Employer Association Group

(This page is left blank.)
6 © Property of Employer Association Group
Office, Clerical and Technical Positions
7 © Property of Employer Association Group

(This Page is left blank.)
8 © Property of Employer Association Group
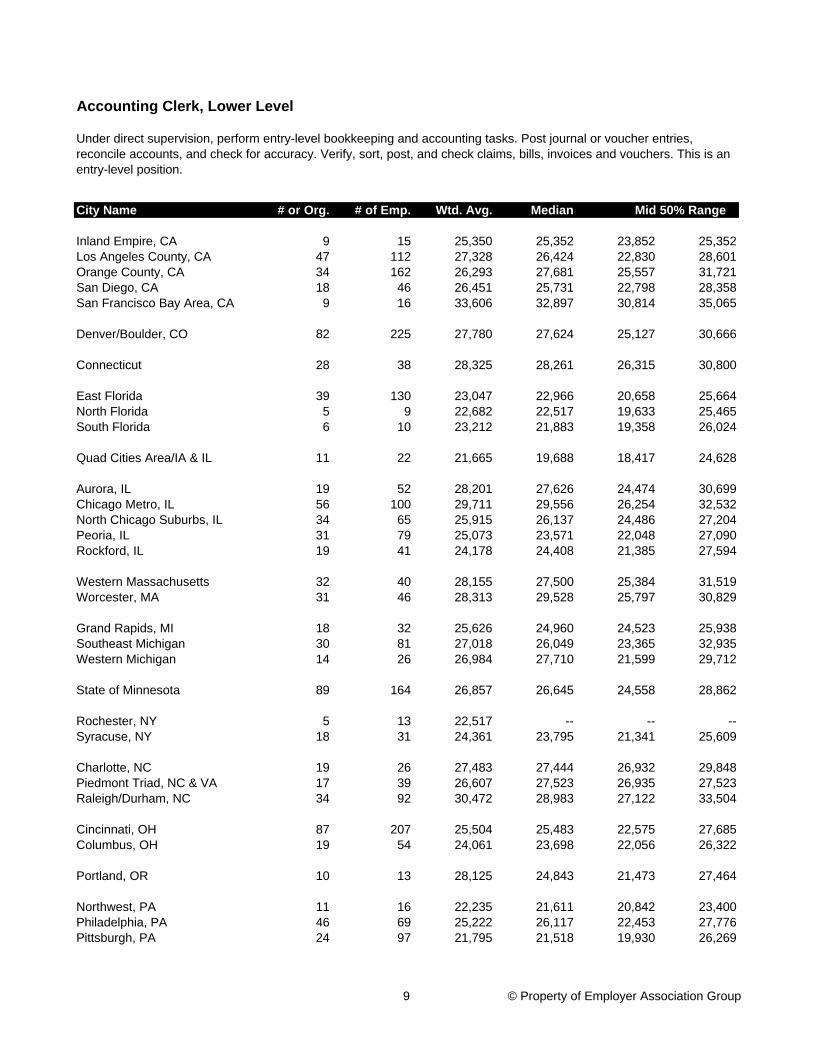
City Name # or Org. # of Emp. Wtd. Avg. Median
Inland Empire, CA 9 15 25,350 25,352 23,852 25,352Los Angeles County, CA 47 112 27,328 26,424 22,830 28,601Orange County, CA 34 162 26,293 27,681 25,557 31,721San Diego, CA 18 46 26,451 25,731 22,798 28,358San Francisco Bay Area, CA 9 16 33,606 32,897 30,814 35,065
Denver/Boulder, CO 82 225 27,780 27,624 25,127 30,666
Connecticut 28 38 28,325 28,261 26,315 30,800
East Florida 39 130 23,047 22,966 20,658 25,664North Florida 5 9 22,682 22,517 19,633 25,465South Florida 6 10 23,212 21,883 19,358 26,024
Quad Cities Area/IA & IL 11 22 21,665 19,688 18,417 24,628
Aurora, IL 19 52 28,201 27,626 24,474 30,699Chicago Metro, IL 56 100 29,711 29,556 26,254 32,532North Chicago Suburbs, IL 34 65 25,915 26,137 24,486 27,204Peoria, IL 31 79 25,073 23,571 22,048 27,090Rockford, IL 19 41 24,178 24,408 21,385 27,594
Western Massachusetts 32 40 28,155 27,500 25,384 31,519Worcester, MA 31 46 28,313 29,528 25,797 30,829
Grand Rapids, MI 18 32 25,626 24,960 24,523 25,938Southeast Michigan 30 81 27,018 26,049 23,365 32,935Western Michigan 14 26 26,984 27,710 21,599 29,712
State of Minnesota 89 164 26,857 26,645 24,558 28,862
Rochester, NY 5 13 22,517 -- -- --Syracuse, NY 18 31 24,361 23,795 21,341 25,609
Charlotte, NC 19 26 27,483 27,444 26,932 29,848Piedmont Triad, NC & VA 17 39 26,607 27,523 26,935 27,523Raleigh/Durham, NC 34 92 30,472 28,983 27,122 33,504
Cincinnati, OH 87 207 25,504 25,483 22,575 27,685Columbus, OH 19 54 24,061 23,698 22,056 26,322
Portland, OR 10 13 28,125 24,843 21,473 27,464
Northwest, PA 11 16 22,235 21,611 20,842 23,400Philadelphia, PA 46 69 25,222 26,117 22,453 27,776Pittsburgh, PA 24 97 21,795 21,518 19,930 26,269
Under direct supervision, perform entry-level bookkeeping and accounting tasks. Post journal or voucher entries, reconcile accounts, and check for accuracy. Verify, sort, post, and check claims, bills, invoices and vouchers. This is an entry-level position.
Accounting Clerk, Lower Level
Mid 50% Range
9 © Property of Employer Association Group
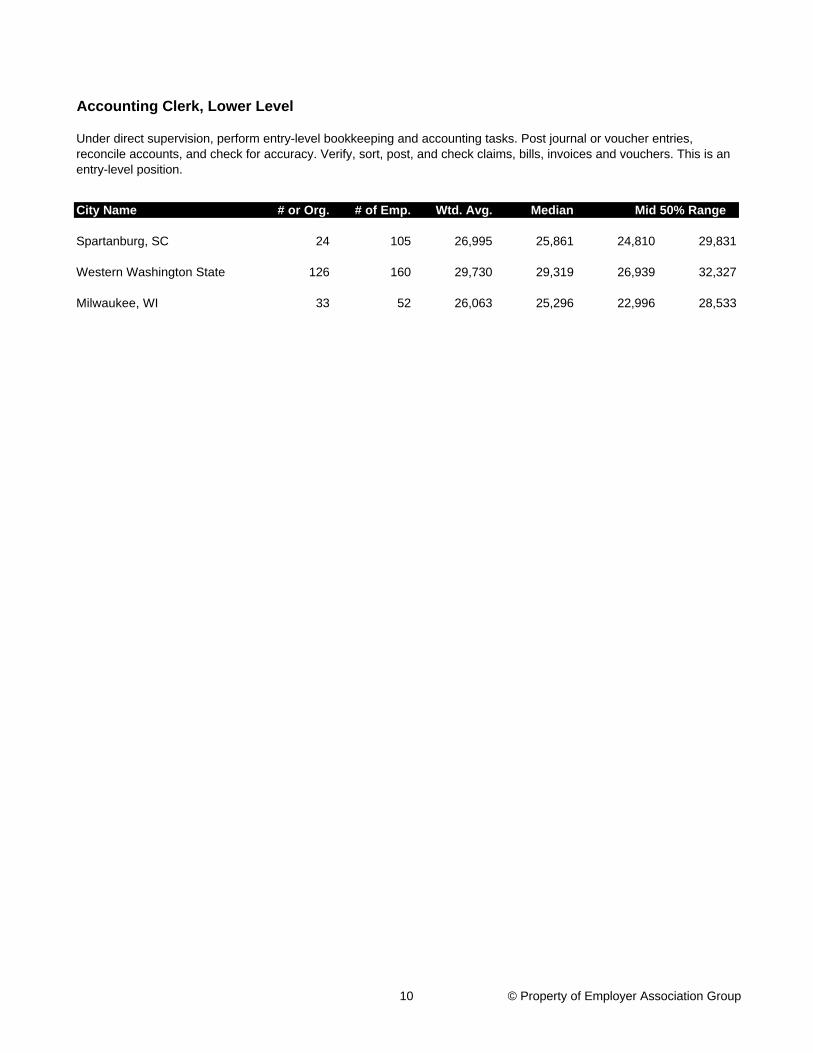
City Name # or Org. # of Emp. Wtd. Avg. Median
Under direct supervision, perform entry-level bookkeeping and accounting tasks. Post journal or voucher entries, reconcile accounts, and check for accuracy. Verify, sort, post, and check claims, bills, invoices and vouchers. This is an entry-level position.
Accounting Clerk, Lower Level
Mid 50% Range
Spartanburg, SC 24 105 26,995 25,861 24,810 29,831
Western Washington State 126 160 29,730 29,319 26,939 32,327
Milwaukee, WI 33 52 26,063 25,296 22,996 28,533
10 © Property of Employer Association Group
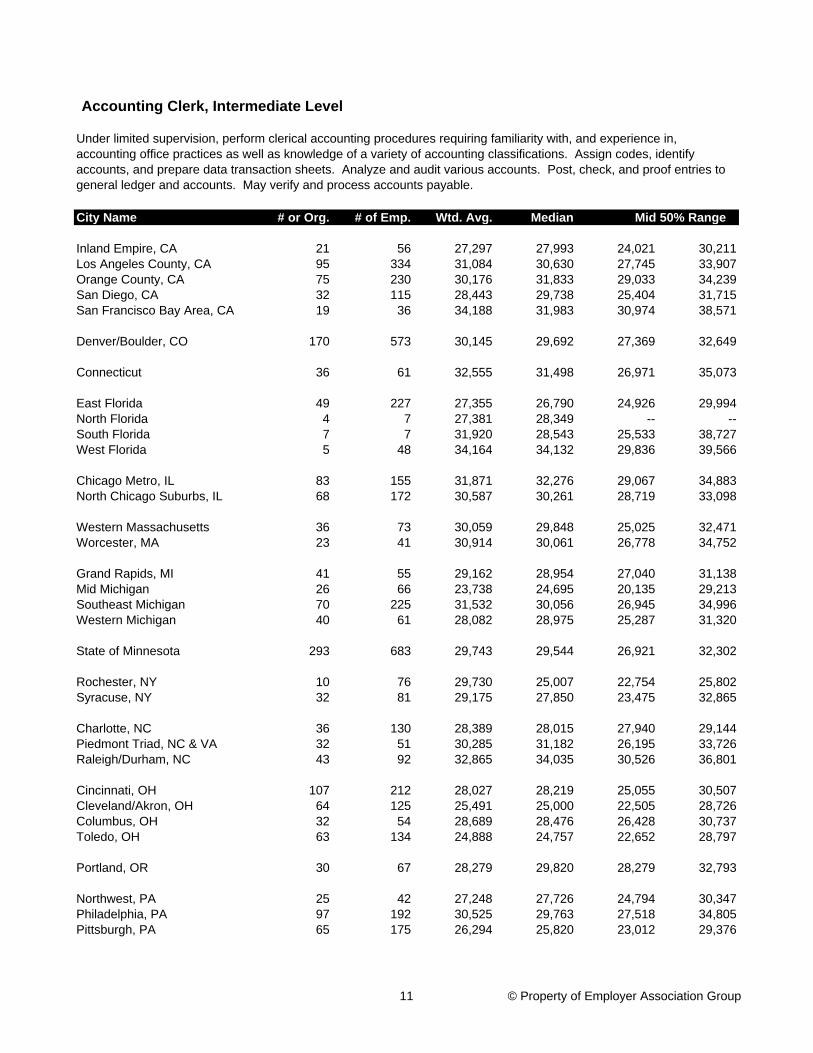
City Name # or Org. # of Emp. Wtd. Avg. Median
Inland Empire, CA 21 56 27,297 27,993 24,021 30,211Los Angeles County, CA 95 334 31,084 30,630 27,745 33,907Orange County, CA 75 230 30,176 31,833 29,033 34,239San Diego, CA 32 115 28,443 29,738 25,404 31,715San Francisco Bay Area, CA 19 36 34,188 31,983 30,974 38,571
Denver/Boulder, CO 170 573 30,145 29,692 27,369 32,649
Connecticut 36 61 32,555 31,498 26,971 35,073
East Florida 49 227 27,355 26,790 24,926 29,994North Florida 4 7 27,381 28,349 -- --South Florida 7 7 31,920 28,543 25,533 38,727West Florida 5 48 34,164 34,132 29,836 39,566
Chicago Metro, IL 83 155 31,871 32,276 29,067 34,883North Chicago Suburbs, IL 68 172 30,587 30,261 28,719 33,098
Western Massachusetts 36 73 30,059 29,848 25,025 32,471Worcester, MA 23 41 30,914 30,061 26,778 34,752
Grand Rapids, MI 41 55 29,162 28,954 27,040 31,138Mid Michigan 26 66 23,738 24,695 20,135 29,213Southeast Michigan 70 225 31,532 30,056 26,945 34,996Western Michigan 40 61 28,082 28,975 25,287 31,320
State of Minnesota 293 683 29,743 29,544 26,921 32,302
Rochester, NY 10 76 29,730 25,007 22,754 25,802Syracuse, NY 32 81 29,175 27,850 23,475 32,865
Charlotte, NC 36 130 28,389 28,015 27,940 29,144Piedmont Triad, NC & VA 32 51 30,285 31,182 26,195 33,726Raleigh/Durham, NC 43 92 32,865 34,035 30,526 36,801
Cincinnati, OH 107 212 28,027 28,219 25,055 30,507Cleveland/Akron, OH 64 125 25,491 25,000 22,505 28,726Columbus, OH 32 54 28,689 28,476 26,428 30,737Toledo, OH 63 134 24,888 24,757 22,652 28,797
Portland, OR 30 67 28,279 29,820 28,279 32,793
Northwest, PA 25 42 27,248 27,726 24,794 30,347Philadelphia, PA 97 192 30,525 29,763 27,518 34,805Pittsburgh, PA 65 175 26,294 25,820 23,012 29,376
Under limited supervision, perform clerical accounting procedures requiring familiarity with, and experience in, accounting office practices as well as knowledge of a variety of accounting classifications. Assign codes, identify accounts, and prepare data transaction sheets. Analyze and audit various accounts. Post, check, and proof entries to general ledger and accounts. May verify and process accounts payable.
Mid 50% Range
Accounting Clerk, Intermediate Level
11 © Property of Employer Association Group

City Name # or Org. # of Emp. Wtd. Avg. Median
Under limited supervision, perform clerical accounting procedures requiring familiarity with, and experience in, accounting office practices as well as knowledge of a variety of accounting classifications. Assign codes, identify accounts, and prepare data transaction sheets. Analyze and audit various accounts. Post, check, and proof entries to general ledger and accounts. May verify and process accounts payable.
Mid 50% Range
Accounting Clerk, Intermediate Level
Western Washington State 95 118 29,259 28,884 25,804 32,279
Milwaukee, WI 44 114 30,704 32,025 29,512 34,771
12 © Property of Employer Association Group
City Name # or Org. # of Emp. Wtd. Avg. Median
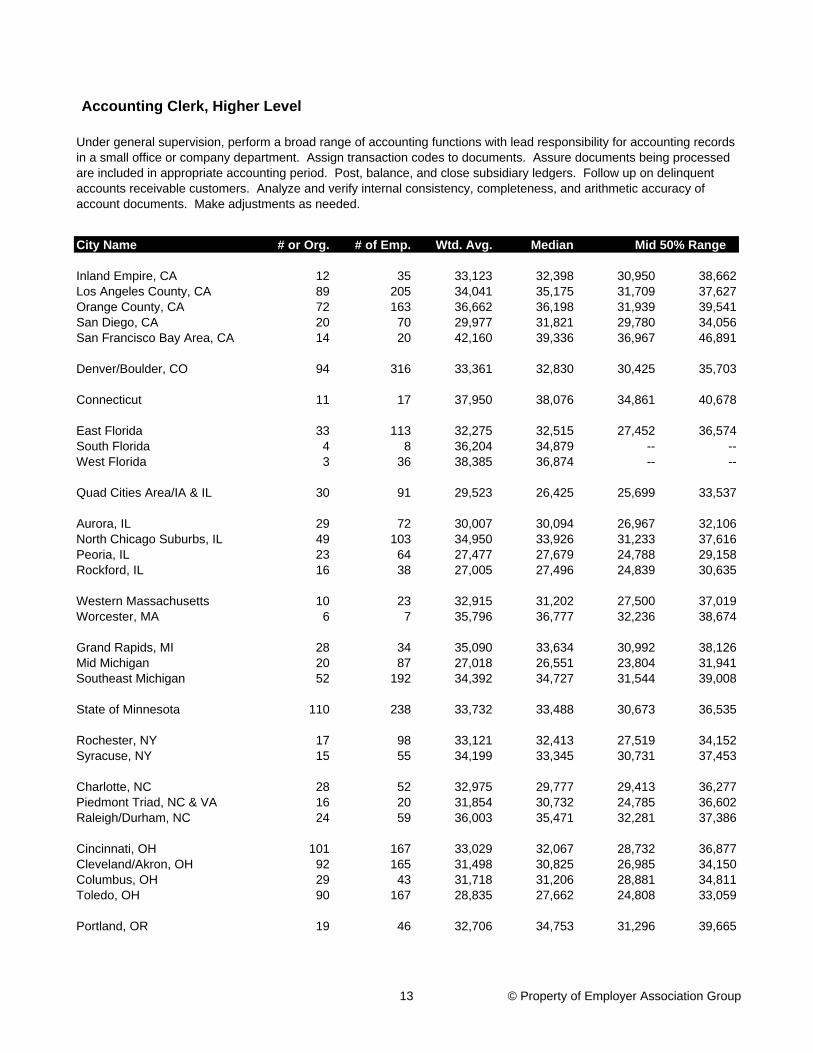
Inland Empire, CA 12 35 33,123 32,398 30,950 38,662Los Angeles County, CA 89 205 34,041 35,175 31,709 37,627Orange County, CA 72 163 36,662 36,198 31,939 39,541San Diego, CA 20 70 29,977 31,821 29,780 34,056San Francisco Bay Area, CA 14 20 42,160 39,336 36,967 46,891
Denver/Boulder, CO 94 316 33,361 32,830 30,425 35,703
Connecticut 11 17 37,950 38,076 34,861 40,678
East Florida 33 113 32,275 32,515 27,452 36,574South Florida 4 8 36,204 34,879 -- --West Florida 3 36 38,385 36,874 -- --
Quad Cities Area/IA & IL 30 91 29,523 26,425 25,699 33,537
Aurora, IL 29 72 30,007 30,094 26,967 32,106North Chicago Suburbs, IL 49 103 34,950 33,926 31,233 37,616Peoria, IL 23 64 27,477 27,679 24,788 29,158Rockford, IL 16 38 27,005 27,496 24,839 30,635
Western Massachusetts 10 23 32,915 31,202 27,500 37,019Worcester, MA 6 7 35,796 36,777 32,236 38,674
Grand Rapids, MI 28 34 35,090 33,634 30,992 38,126Mid Michigan 20 87 27,018 26,551 23,804 31,941Southeast Michigan 52 192 34,392 34,727 31,544 39,008
State of Minnesota 110 238 33,732 33,488 30,673 36,535
Rochester, NY 17 98 33,121 32,413 27,519 34,152Syracuse, NY 15 55 34,199 33,345 30,731 37,453
Charlotte, NC 28 52 32,975 29,777 29,413 36,277Piedmont Triad, NC & VA 16 20 31,854 30,732 24,785 36,602Raleigh/Durham, NC 24 59 36,003 35,471 32,281 37,386
Cincinnati, OH 101 167 33,029 32,067 28,732 36,877Cleveland/Akron, OH 92 165 31,498 30,825 26,985 34,150Columbus, OH 29 43 31,718 31,206 28,881 34,811Toledo, OH 90 167 28,835 27,662 24,808 33,059
Portland, OR 19 46 32,706 34,753 31,296 39,665
Accounting Clerk, Higher Level
Mid 50% Range
Under general supervision, perform a broad range of accounting functions with lead responsibility for accounting records in a small office or company department. Assign transaction codes to documents. Assure documents being processed are included in appropriate accounting period. Post, balance, and close subsidiary ledgers. Follow up on delinquent accounts receivable customers. Analyze and verify internal consistency, completeness, and arithmetic accuracy of account documents. Make adjustments as needed.
13 © Property of Employer Association Group
City Name # or Org. # of Emp. Wtd. Avg. Median
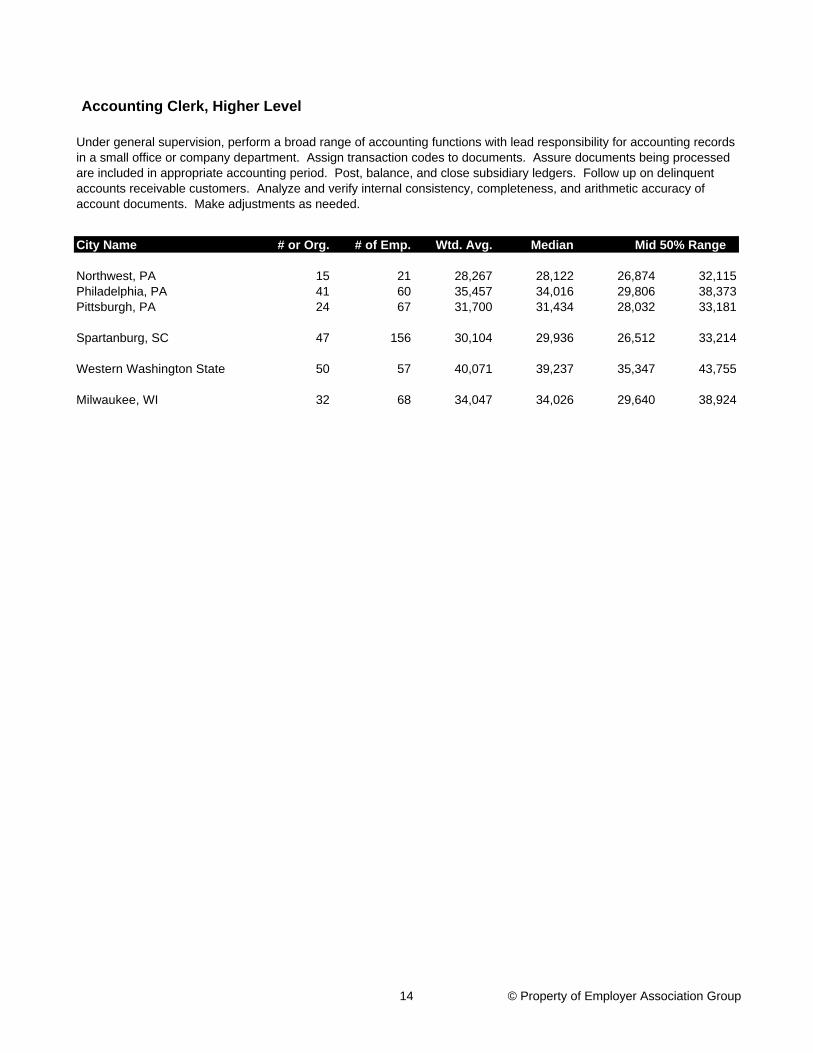
Accounting Clerk, Higher Level
Mid 50% Range
Under general supervision, perform a broad range of accounting functions with lead responsibility for accounting records in a small office or company department. Assign transaction codes to documents. Assure documents being processed are included in appropriate accounting period. Post, balance, and close subsidiary ledgers. Follow up on delinquent accounts receivable customers. Analyze and verify internal consistency, completeness, and arithmetic accuracy of account documents. Make adjustments as needed.
Northwest, PA 15 21 28,267 28,122 26,874 32,115Philadelphia, PA 41 60 35,457 34,016 29,806 38,373Pittsburgh, PA 24 67 31,700 31,434 28,032 33,181
Spartanburg, SC 47 156 30,104 29,936 26,512 33,214
Western Washington State 50 57 40,071 39,237 35,347 43,755
Milwaukee, WI 32 68 34,047 34,026 29,640 38,924
14 © Property of Employer Association Group
City Name # or Org. # of Emp. Wtd. Avg. Median
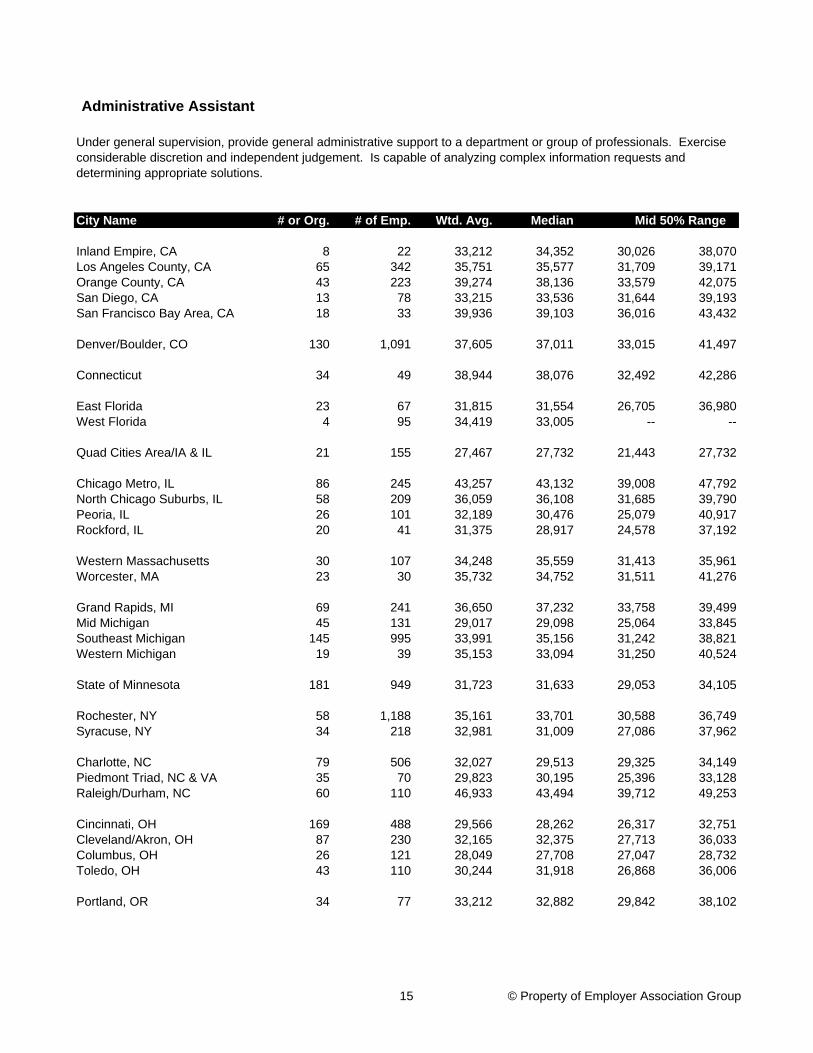
Inland Empire, CA 8 22 33,212 34,352 30,026 38,070Los Angeles County, CA 65 342 35,751 35,577 31,709 39,171Orange County, CA 43 223 39,274 38,136 33,579 42,075San Diego, CA 13 78 33,215 33,536 31,644 39,193San Francisco Bay Area, CA 18 33 39,936 39,103 36,016 43,432
Denver/Boulder, CO 130 1,091 37,605 37,011 33,015 41,497
Connecticut 34 49 38,944 38,076 32,492 42,286
East Florida 23 67 31,815 31,554 26,705 36,980West Florida 4 95 34,419 33,005 -- --
Quad Cities Area/IA & IL 21 155 27,467 27,732 21,443 27,732
Chicago Metro, IL 86 245 43,257 43,132 39,008 47,792North Chicago Suburbs, IL 58 209 36,059 36,108 31,685 39,790Peoria, IL 26 101 32,189 30,476 25,079 40,917Rockford, IL 20 41 31,375 28,917 24,578 37,192
Western Massachusetts 30 107 34,248 35,559 31,413 35,961Worcester, MA 23 30 35,732 34,752 31,511 41,276
Grand Rapids, MI 69 241 36,650 37,232 33,758 39,499Mid Michigan 45 131 29,017 29,098 25,064 33,845Southeast Michigan 145 995 33,991 35,156 31,242 38,821Western Michigan 19 39 35,153 33,094 31,250 40,524
State of Minnesota 181 949 31,723 31,633 29,053 34,105
Rochester, NY 58 1,188 35,161 33,701 30,588 36,749Syracuse, NY 34 218 32,981 31,009 27,086 37,962
Charlotte, NC 79 506 32,027 29,513 29,325 34,149Piedmont Triad, NC & VA 35 70 29,823 30,195 25,396 33,128Raleigh/Durham, NC 60 110 46,933 43,494 39,712 49,253
Cincinnati, OH 169 488 29,566 28,262 26,317 32,751Cleveland/Akron, OH 87 230 32,165 32,375 27,713 36,033Columbus, OH 26 121 28,049 27,708 27,047 28,732Toledo, OH 43 110 30,244 31,918 26,868 36,006
Portland, OR 34 77 33,212 32,882 29,842 38,102
Mid 50% Range
Administrative Assistant
Under general supervision, provide general administrative support to a department or group of professionals. Exercise considerable discretion and independent judgement. Is capable of analyzing complex information requests and determining appropriate solutions.
15 © Property of Employer Association Group

City Name # or Org. # of Emp. Wtd. Avg. Median Mid 50% Range
Administrative Assistant
Under general supervision, provide general administrative support to a department or group of professionals. Exercise considerable discretion and independent judgement. Is capable of analyzing complex information requests and determining appropriate solutions.
Northwest, PA 30 71 29,626 28,080 22,936 34,961Philadelphia, PA 60 200 30,547 31,263 28,079 35,147Pittsburgh, PA 50 236 28,568 30,866 25,908 35,525Reading, PA 55 125 35,017 33,741 30,409 38,905
Spartanburg, SC 65 145 30,924 31,281 27,752 33,970
Western Washington State 74 152 29,923 29,428 25,260 33,282
Milwaukee, WI 63 324 33,664 33,473 30,342 38,327
16 © Property of Employer Association Group
City Name # or Org. # of Emp. Wtd. Avg. Median
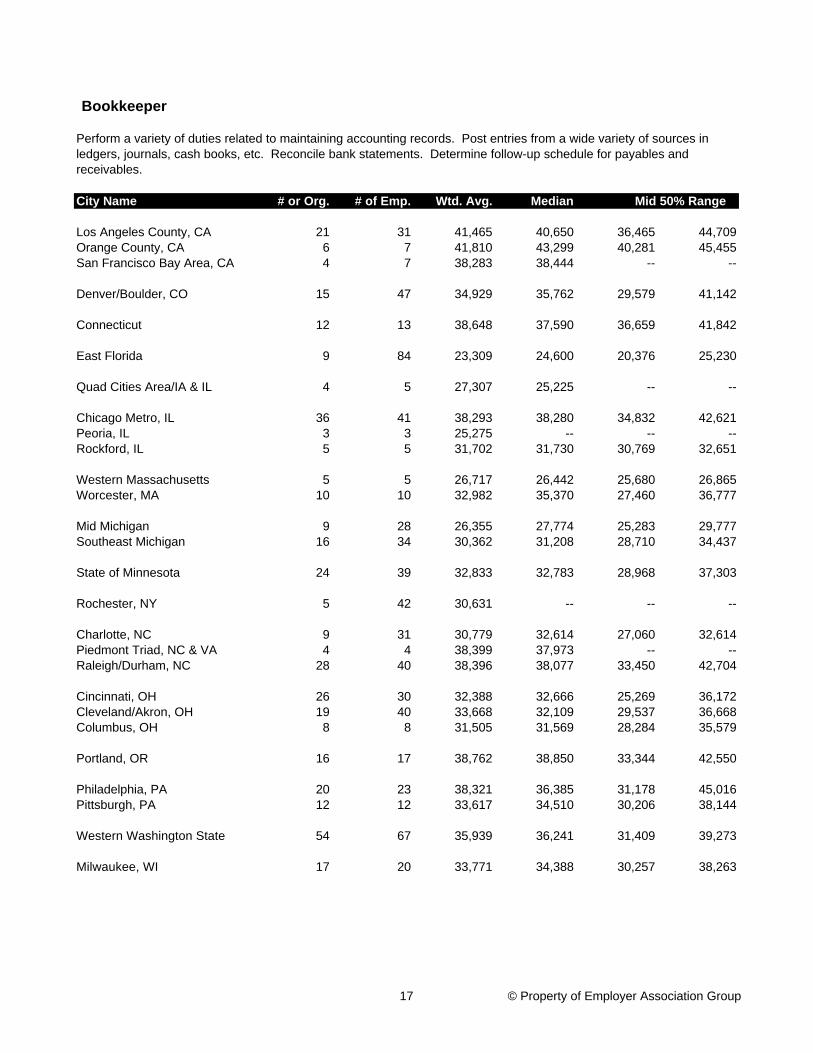
Los Angeles County, CA 21 31 41,465 40,650 36,465 44,709Orange County, CA 6 7 41,810 43,299 40,281 45,455San Francisco Bay Area, CA 4 7 38,283 38,444 -- --
Denver/Boulder, CO 15 47 34,929 35,762 29,579 41,142
Connecticut 12 13 38,648 37,590 36,659 41,842
East Florida 9 84 23,309 24,600 20,376 25,230
Quad Cities Area/IA & IL 4 5 27,307 25,225 -- --
Chicago Metro, IL 36 41 38,293 38,280 34,832 42,621Peoria, IL 3 3 25,275 -- -- --Rockford, IL 5 5 31,702 31,730 30,769 32,651
Western Massachusetts 5 5 26,717 26,442 25,680 26,865Worcester, MA 10 10 32,982 35,370 27,460 36,777
Mid Michigan 9 28 26,355 27,774 25,283 29,777Southeast Michigan 16 34 30,362 31,208 28,710 34,437
State of Minnesota 24 39 32,833 32,783 28,968 37,303
Rochester, NY 5 42 30,631 -- -- --
Charlotte, NC 9 31 30,779 32,614 27,060 32,614Piedmont Triad, NC & VA 4 4 38,399 37,973 -- --Raleigh/Durham, NC 28 40 38,396 38,077 33,450 42,704
Cincinnati, OH 26 30 32,388 32,666 25,269 36,172Cleveland/Akron, OH 19 40 33,668 32,109 29,537 36,668Columbus, OH 8 8 31,505 31,569 28,284 35,579
Portland, OR 16 17 38,762 38,850 33,344 42,550
Philadelphia, PA 20 23 38,321 36,385 31,178 45,016Pittsburgh, PA 12 12 33,617 34,510 30,206 38,144
Western Washington State 54 67 35,939 36,241 31,409 39,273
Milwaukee, WI 17 20 33,771 34,388 30,257 38,263
Mid 50% Range
Bookkeeper
Perform a variety of duties related to maintaining accounting records. Post entries from a wide variety of sources in ledgers, journals, cash books, etc. Reconcile bank statements. Determine follow-up schedule for payables and receivables.
17 © Property of Employer Association Group
City Name # or Org. # of Emp. Wtd. Avg. Median
Inland Empire, CA 4 7 47,871 44,126 -- --Los Angeles County, CA 37 56 38,967 38,942 31,974 45,296Orange County, CA 31 52 41,420 38,012 33,994 47,169San Diego, CA 12 22 44,706 41,804 37,773 51,615San Francisco Bay Area, CA 7 9 37,814 36,492 34,426 40,108
Denver/Boulder, CO 66 407 43,898 44,820 38,821 47,075
Connecticut 22 32 38,796 38,076 33,888 44,549
East Florida 16 30 32,704 32,013 29,077 36,061South Florida 4 7 34,560 34,294 -- --
Quad Cities Area/IA & IL 16 82 49,927 54,657 39,846 54,657
Aurora, IL 18 49 32,767 36,875 33,641 39,311North Chicago Suburbs, IL 47 89 38,176 37,339 35,390 41,032Peoria, IL 15 84 40,474 42,109 42,109 42,109Rockford, IL 15 31 53,533 47,807 42,413 66,231
Western Massachusetts 11 12 35,115 34,586 31,730 38,775Worcester, MA 9 15 31,298 33,622 28,377 36,756
Grand Rapids, MI 11 12 30,618 30,576 28,163 33,072Mid Michigan 27 47 35,256 35,371 32,422 40,715Southeast Michigan 99 370 52,381 48,425 40,843 57,129Western Michigan 30 58 41,424 36,007 34,770 47,616
State of Minnesota 111 214 45,688 45,112 40,754 50,163
Rochester, NY 44 76 42,790 38,719 34,474 45,278Syracuse, NY 26 61 42,627 39,398 35,114 49,248
Charlotte, NC 20 29 37,739 36,900 31,201 46,179Piedmont Triad, NC & VA 20 31 40,307 38,953 31,784 48,281Raleigh/Durham, NC 39 73 45,682 46,586 38,130 50,628
Cincinnati, OH 50 82 33,136 32,751 29,267 35,552Cleveland/Akron, OH 67 100 39,096 39,281 34,381 44,696Columbus, OH 13 18 30,353 28,647 27,836 33,019Toledo, OH 52 102 43,848 36,700 30,790 43,798
Portland, OR 31 37 38,938 39,445 35,106 41,890
Mid 50% Range
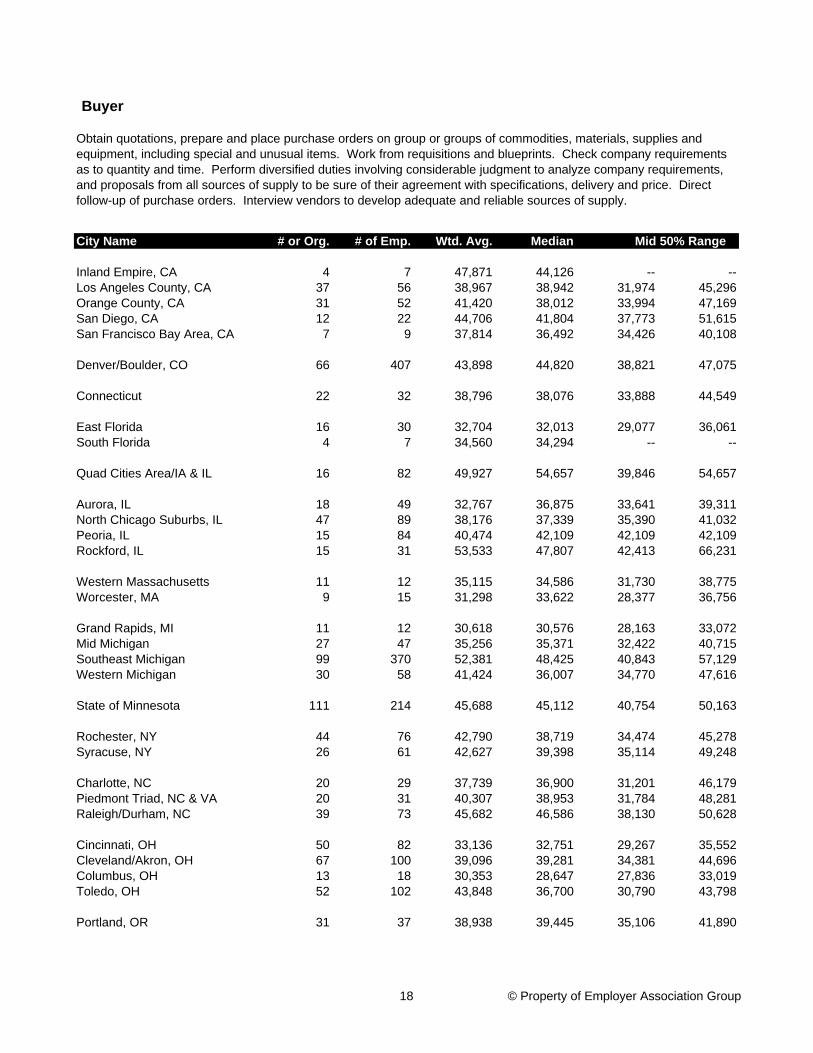
Buyer
Obtain quotations, prepare and place purchase orders on group or groups of commodities, materials, supplies and equipment, including special and unusual items. Work from requisitions and blueprints. Check company requirements as to quantity and time. Perform diversified duties involving considerable judgment to analyze company requirements, and proposals from all sources of supply to be sure of their agreement with specifications, delivery and price. Direct follow-up of purchase orders. Interview vendors to develop adequate and reliable sources of supply.
18 © Property of Employer Association Group
City Name # or Org. # of Emp. Wtd. Avg. Median Mid 50% Range
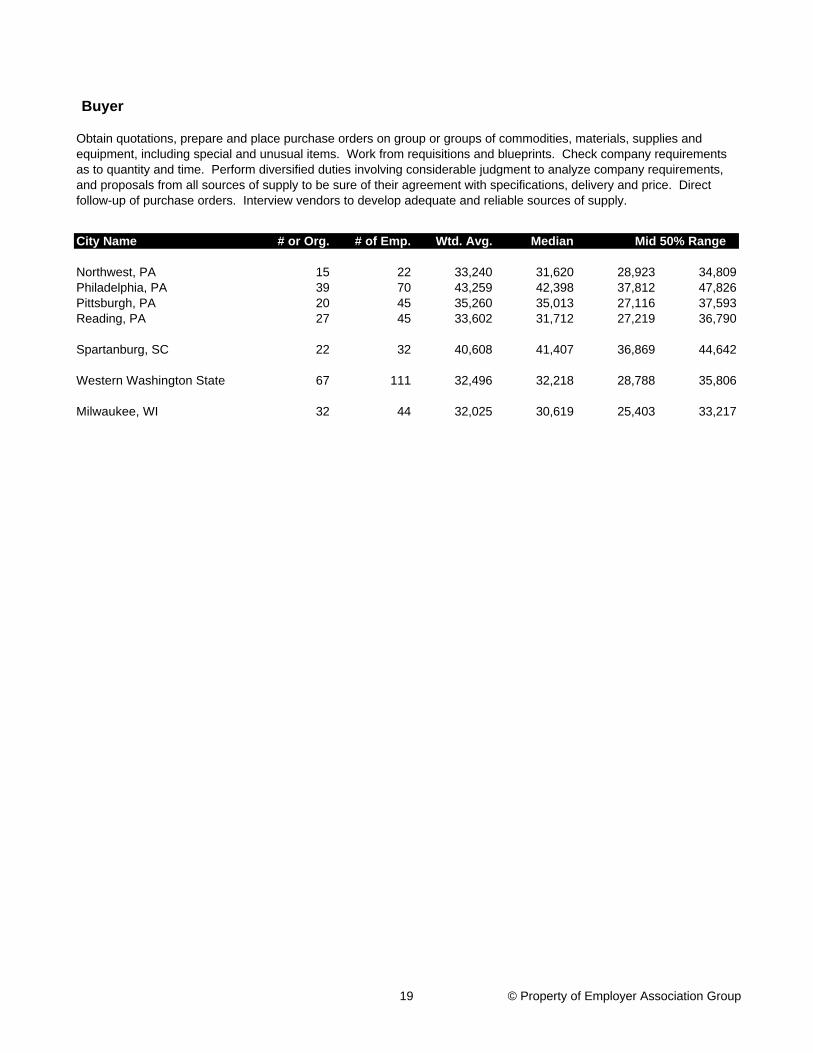
Buyer
Obtain quotations, prepare and place purchase orders on group or groups of commodities, materials, supplies and equipment, including special and unusual items. Work from requisitions and blueprints. Check company requirements as to quantity and time. Perform diversified duties involving considerable judgment to analyze company requirements, and proposals from all sources of supply to be sure of their agreement with specifications, delivery and price. Direct follow-up of purchase orders. Interview vendors to develop adequate and reliable sources of supply.
Northwest, PA 15 22 33,240 31,620 28,923 34,809Philadelphia, PA 39 70 43,259 42,398 37,812 47,826Pittsburgh, PA 20 45 35,260 35,013 27,116 37,593Reading, PA 27 45 33,602 31,712 27,219 36,790
Spartanburg, SC 22 32 40,608 41,407 36,869 44,642
Western Washington State 67 111 32,496 32,218 28,788 35,806
Milwaukee, WI 32 44 32,025 30,619 25,403 33,217
19 © Property of Employer Association Group
City Name # or Org. # of Emp. Wtd. Avg. Median
Los Angeles County, CA 19 40 33,464 34,858 28,939 37,659Orange County, CA 12 18 36,185 35,293 30,731 42,022San Diego, CA 5 13 32,419 33,706 32,920 37,662
Denver/Boulder, CO 25 104 36,154 34,206 30,394 42,884
Connecticut 8 12 36,448 37,125 33,952 38,753
East Florida 15 37 30,268 29,434 25,680 34,903
Quad Cities Area/IA & IL 11 21 32,257 33,569 28,932 36,654
Aurora, IL 5 6 40,272 40,097 37,361 43,357Chicago Metro, IL 42 96 35,478 35,795 31,467 39,050North Chicago Suburbs, IL 6 11 32,505 32,815 29,789 34,139Peoria, IL 7 12 33,504 36,213 27,073 38,169Rockford, IL 4 7 30,491 26,548 -- --
Western Massachusetts 5 14 35,263 36,426 35,453 36,426
Mid Michigan 7 17 24,804 22,350 19,673 30,441Southeast Michigan 33 85 39,189 38,843 33,571 43,396Western Michigan 6 9 33,723 32,873 32,765 34,032
State of Minnesota 33 78 31,237 31,693 27,902 34,843
Rochester, NY 12 47 30,932 31,082 28,893 35,075Syracuse, NY 12 17 30,394 28,661 25,801 33,313
Charlotte, NC 10 18 36,002 34,623 30,531 38,508Piedmont Triad, NC & VA 11 20 35,824 34,557 29,175 40,446Raleigh/Durham, NC 17 33 42,651 38,343 37,971 44,246
Cincinnati, OH 31 48 34,184 34,227 31,084 36,771Cleveland/Akron, OH 14 32 31,332 31,159 29,230 33,636Columbus, OH 10 23 31,249 30,673 28,177 32,678Toledo, OH 7 9 30,874 33,608 30,794 36,900
Portland, OR 3 3 31,495 -- -- --
Northwest, PA 10 15 22,350 24,089 18,996 27,732Philadelphia, PA 19 33 31,595 31,276 29,103 33,714Pittsburgh, PA 13 45 29,688 27,889 26,090 33,948Reading, PA 13 25 29,016 29,095 24,259 33,501
Mid 50% Range
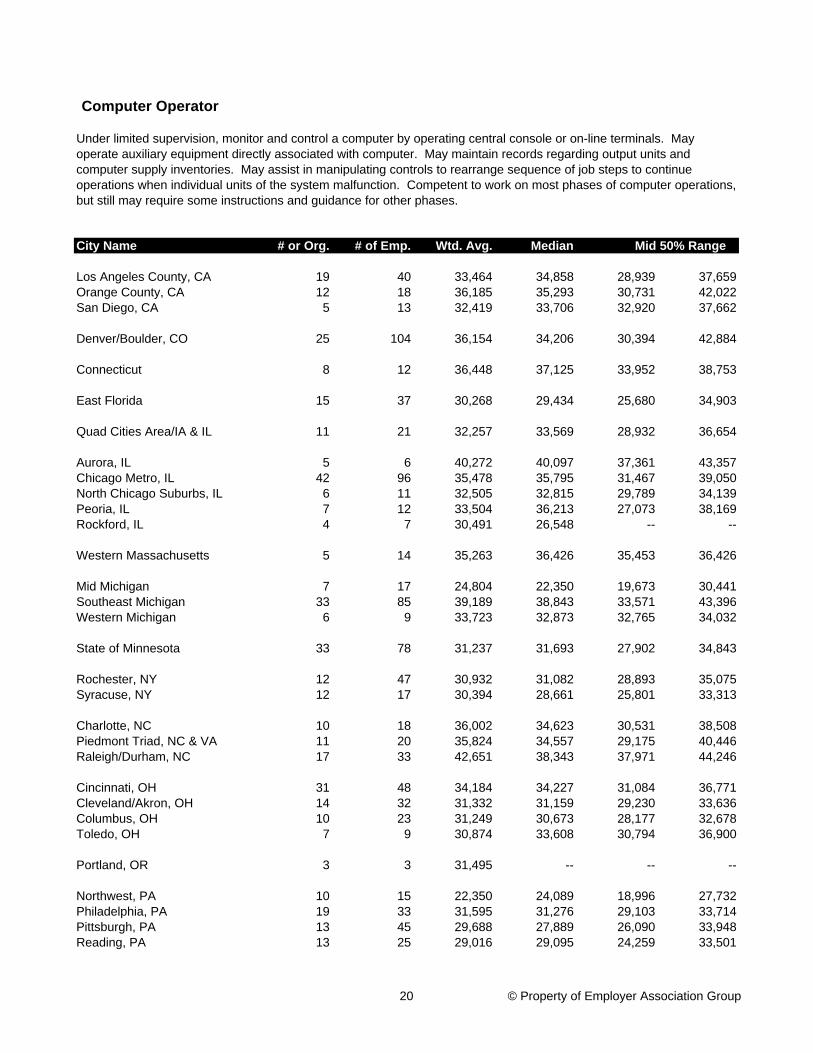
Computer Operator
Under limited supervision, monitor and control a computer by operating central console or on-line terminals. May operate auxiliary equipment directly associated with computer. May maintain records regarding output units and computer supply inventories. May assist in manipulating controls to rearrange sequence of job steps to continue operations when individual units of the system malfunction. Competent to work on most phases of computer operations, but still may require some instructions and guidance for other phases.
20 © Property of Employer Association Group
City Name # or Org. # of Emp. Wtd. Avg. Median Mid 50% Range
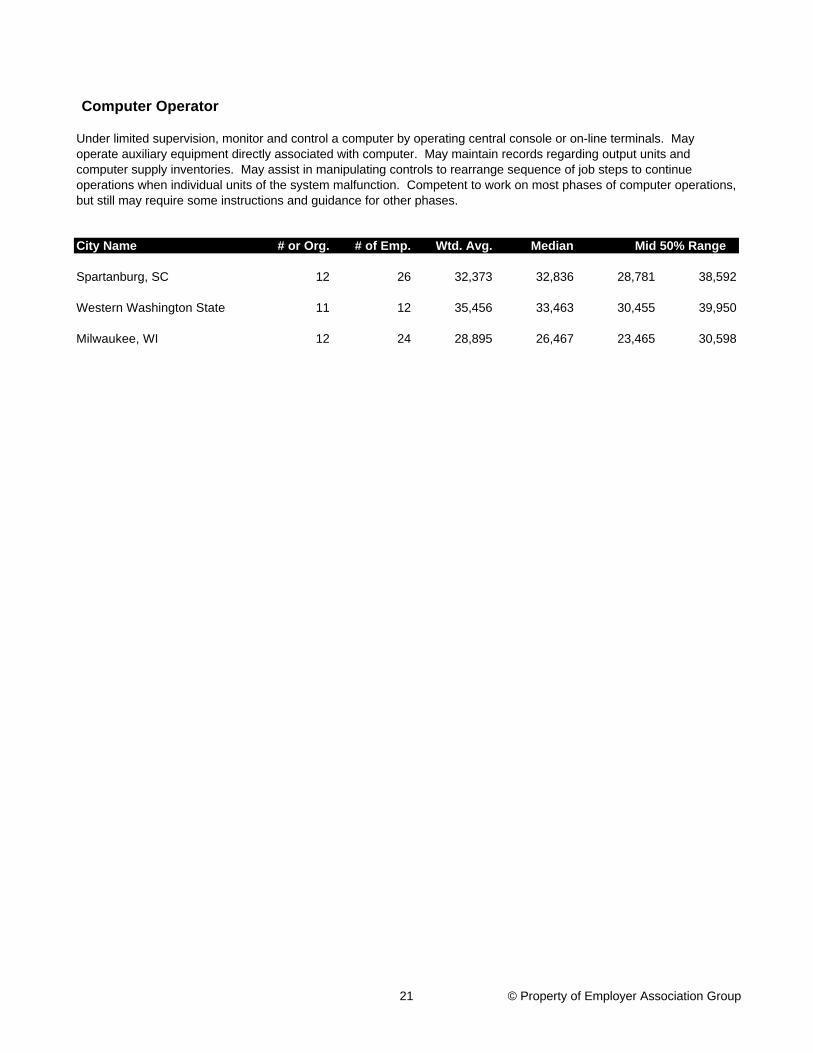
Computer Operator
Under limited supervision, monitor and control a computer by operating central console or on-line terminals. May operate auxiliary equipment directly associated with computer. May maintain records regarding output units and computer supply inventories. May assist in manipulating controls to rearrange sequence of job steps to continue operations when individual units of the system malfunction. Competent to work on most phases of computer operations, but still may require some instructions and guidance for other phases.
Spartanburg, SC 12 26 32,373 32,836 28,781 38,592
Western Washington State 11 12 35,456 33,463 30,455 39,950
Milwaukee, WI 12 24 28,895 26,467 23,465 30,598
21 © Property of Employer Association Group
City Name # or Org. # of Emp. Wtd. Avg. Median
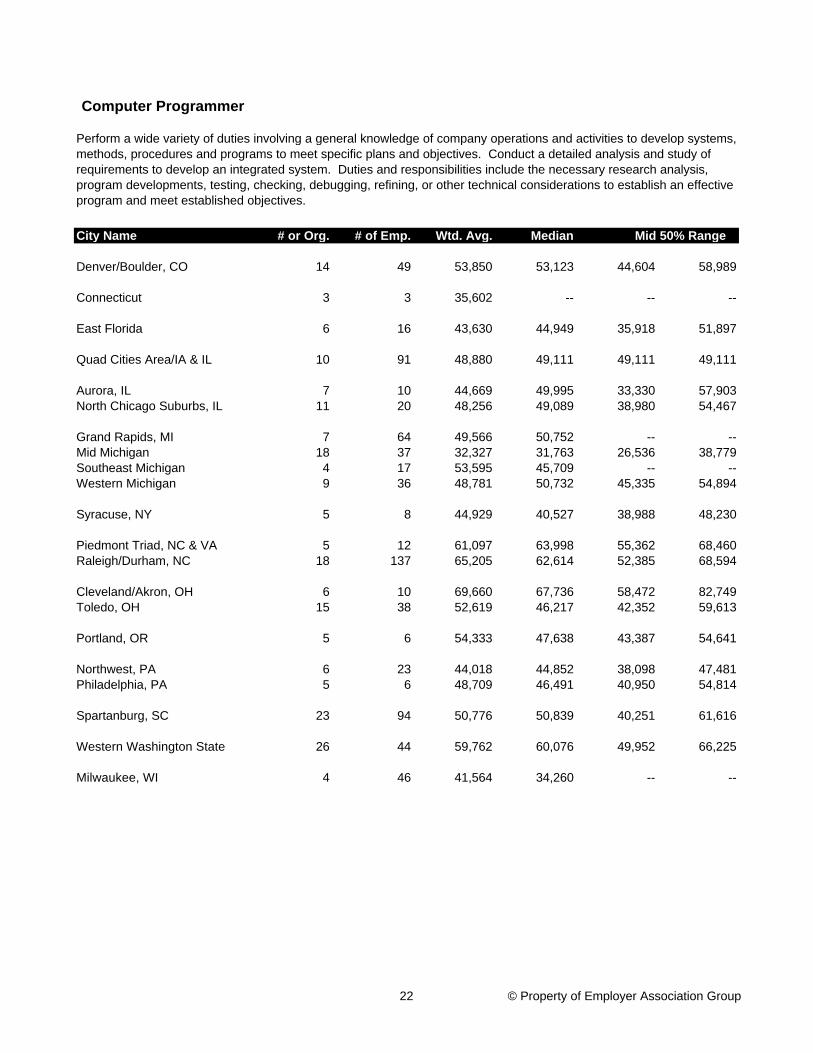
Denver/Boulder, CO 14 49 53,850 53,123 44,604 58,989
Connecticut 3 3 35,602 -- -- --
East Florida 6 16 43,630 44,949 35,918 51,897
Quad Cities Area/IA & IL 10 91 48,880 49,111 49,111 49,111
Aurora, IL 7 10 44,669 49,995 33,330 57,903North Chicago Suburbs, IL 11 20 48,256 49,089 38,980 54,467
Grand Rapids, MI 7 64 49,566 50,752 -- --Mid Michigan 18 37 32,327 31,763 26,536 38,779Southeast Michigan 4 17 53,595 45,709 -- --Western Michigan 9 36 48,781 50,732 45,335 54,894
Syracuse, NY 5 8 44,929 40,527 38,988 48,230
Piedmont Triad, NC & VA 5 12 61,097 63,998 55,362 68,460Raleigh/Durham, NC 18 137 65,205 62,614 52,385 68,594
Cleveland/Akron, OH 6 10 69,660 67,736 58,472 82,749Toledo, OH 15 38 52,619 46,217 42,352 59,613
Portland, OR 5 6 54,333 47,638 43,387 54,641
Northwest, PA 6 23 44,018 44,852 38,098 47,481Philadelphia, PA 5 6 48,709 46,491 40,950 54,814
Spartanburg, SC 23 94 50,776 50,839 40,251 61,616
Western Washington State 26 44 59,762 60,076 49,952 66,225
Milwaukee, WI 4 46 41,564 34,260 -- --
Mid 50% Range
Computer Programmer
Perform a wide variety of duties involving a general knowledge of company operations and activities to develop systems, methods, procedures and programs to meet specific plans and objectives. Conduct a detailed analysis and study of requirements to develop an integrated system. Duties and responsibilities include the necessary research analysis, program developments, testing, checking, debugging, refining, or other technical considerations to establish an effective program and meet established objectives.
22 © Property of Employer Association Group
City Name # or Org. # of Emp. Wtd. Avg. Median
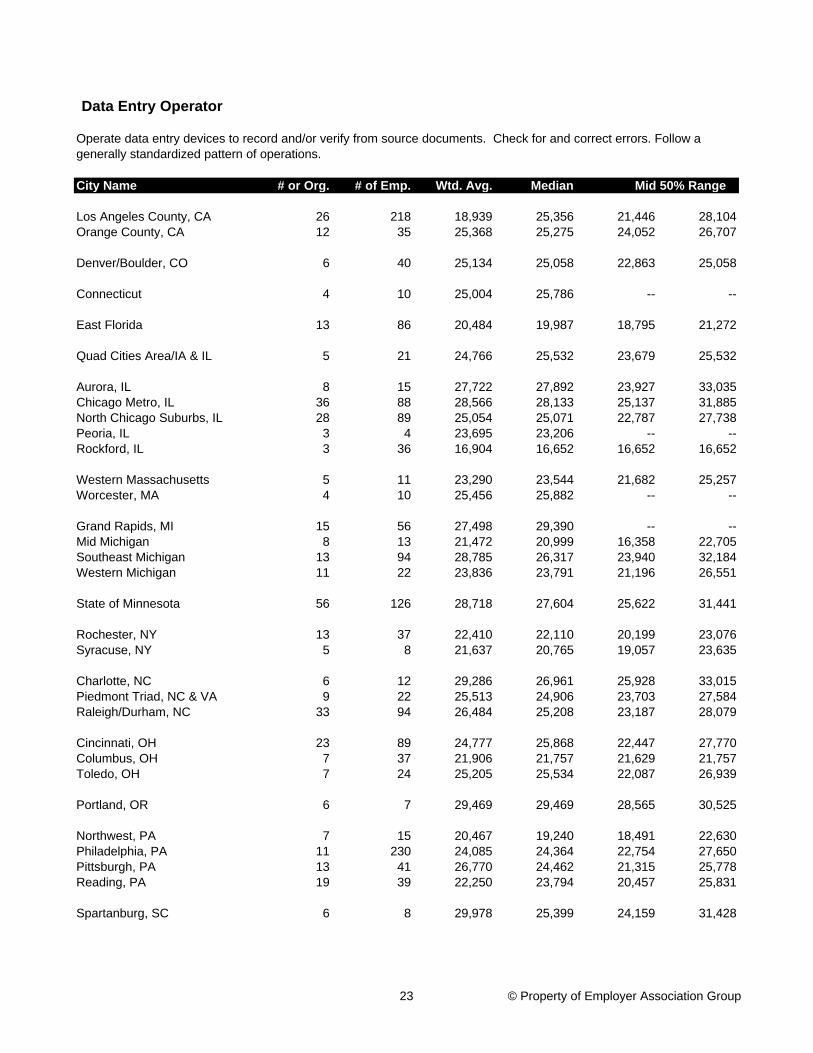
Los Angeles County, CA 26 218 18,939 25,356 21,446 28,104Orange County, CA 12 35 25,368 25,275 24,052 26,707
Denver/Boulder, CO 6 40 25,134 25,058 22,863 25,058
Connecticut 4 10 25,004 25,786 -- --
East Florida 13 86 20,484 19,987 18,795 21,272
Quad Cities Area/IA & IL 5 21 24,766 25,532 23,679 25,532
Aurora, IL 8 15 27,722 27,892 23,927 33,035Chicago Metro, IL 36 88 28,566 28,133 25,137 31,885North Chicago Suburbs, IL 28 89 25,054 25,071 22,787 27,738Peoria, IL 3 4 23,695 23,206 -- --Rockford, IL 3 36 16,904 16,652 16,652 16,652
Western Massachusetts 5 11 23,290 23,544 21,682 25,257Worcester, MA 4 10 25,456 25,882 -- --
Grand Rapids, MI 15 56 27,498 29,390 -- --Mid Michigan 8 13 21,472 20,999 16,358 22,705Southeast Michigan 13 94 28,785 26,317 23,940 32,184Western Michigan 11 22 23,836 23,791 21,196 26,551
State of Minnesota 56 126 28,718 27,604 25,622 31,441
Rochester, NY 13 37 22,410 22,110 20,199 23,076Syracuse, NY 5 8 21,637 20,765 19,057 23,635
Charlotte, NC 6 12 29,286 26,961 25,928 33,015Piedmont Triad, NC & VA 9 22 25,513 24,906 23,703 27,584Raleigh/Durham, NC 33 94 26,484 25,208 23,187 28,079
Cincinnati, OH 23 89 24,777 25,868 22,447 27,770Columbus, OH 7 37 21,906 21,757 21,629 21,757Toledo, OH 7 24 25,205 25,534 22,087 26,939
Portland, OR 6 7 29,469 29,469 28,565 30,525
Northwest, PA 7 15 20,467 19,240 18,491 22,630Philadelphia, PA 11 230 24,085 24,364 22,754 27,650Pittsburgh, PA 13 41 26,770 24,462 21,315 25,778Reading, PA 19 39 22,250 23,794 20,457 25,831
Spartanburg, SC 6 8 29,978 25,399 24,159 31,428
Mid 50% Range
Data Entry Operator
Operate data entry devices to record and/or verify from source documents. Check for and correct errors. Follow a generally standardized pattern of operations.
23 © Property of Employer Association Group

City Name # or Org. # of Emp. Wtd. Avg. Median Mid 50% Range
Data Entry Operator
Operate data entry devices to record and/or verify from source documents. Check for and correct errors. Follow a generally standardized pattern of operations.
Western Washington State 11 16 23,617 23,182 21,286 25,151
Milwaukee, WI 16 96 21,889 21,932 20,761 26,169
24 © Property of Employer Association Group
City Name # or Org. # of Emp. Wtd. Avg. Median
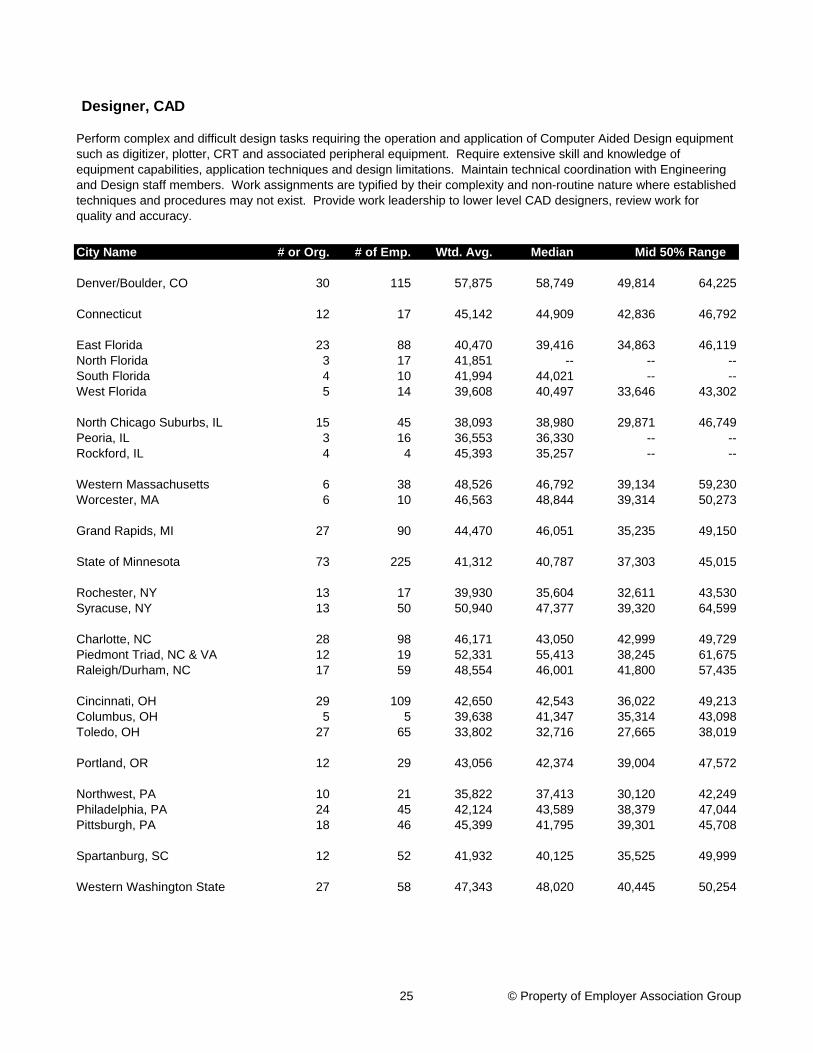
Denver/Boulder, CO 30 115 57,875 58,749 49,814 64,225
Connecticut 12 17 45,142 44,909 42,836 46,792
East Florida 23 88 40,470 39,416 34,863 46,119North Florida 3 17 41,851 -- -- --South Florida 4 10 41,994 44,021 -- --West Florida 5 14 39,608 40,497 33,646 43,302
North Chicago Suburbs, IL 15 45 38,093 38,980 29,871 46,749Peoria, IL 3 16 36,553 36,330 -- --Rockford, IL 4 4 45,393 35,257 -- --
Western Massachusetts 6 38 48,526 46,792 39,134 59,230Worcester, MA 6 10 46,563 48,844 39,314 50,273
Grand Rapids, MI 27 90 44,470 46,051 35,235 49,150
State of Minnesota 73 225 41,312 40,787 37,303 45,015
Rochester, NY 13 17 39,930 35,604 32,611 43,530Syracuse, NY 13 50 50,940 47,377 39,320 64,599
Charlotte, NC 28 98 46,171 43,050 42,999 49,729Piedmont Triad, NC & VA 12 19 52,331 55,413 38,245 61,675Raleigh/Durham, NC 17 59 48,554 46,001 41,800 57,435
Cincinnati, OH 29 109 42,650 42,543 36,022 49,213Columbus, OH 5 5 39,638 41,347 35,314 43,098Toledo, OH 27 65 33,802 32,716 27,665 38,019
Portland, OR 12 29 43,056 42,374 39,004 47,572
Northwest, PA 10 21 35,822 37,413 30,120 42,249Philadelphia, PA 24 45 42,124 43,589 38,379 47,044Pittsburgh, PA 18 46 45,399 41,795 39,301 45,708
Spartanburg, SC 12 52 41,932 40,125 35,525 49,999
Western Washington State 27 58 47,343 48,020 40,445 50,254
Mid 50% Range
Designer, CAD
Perform complex and difficult design tasks requiring the operation and application of Computer Aided Design equipment such as digitizer, plotter, CRT and associated peripheral equipment. Require extensive skill and knowledge of equipment capabilities, application techniques and design limitations. Maintain technical coordination with Engineering and Design staff members. Work assignments are typified by their complexity and non-routine nature where established techniques and procedures may not exist. Provide work leadership to lower level CAD designers, review work for quality and accuracy.
25 © Property of Employer Association Group
City Name # or Org. # of Emp. Wtd. Avg. Median
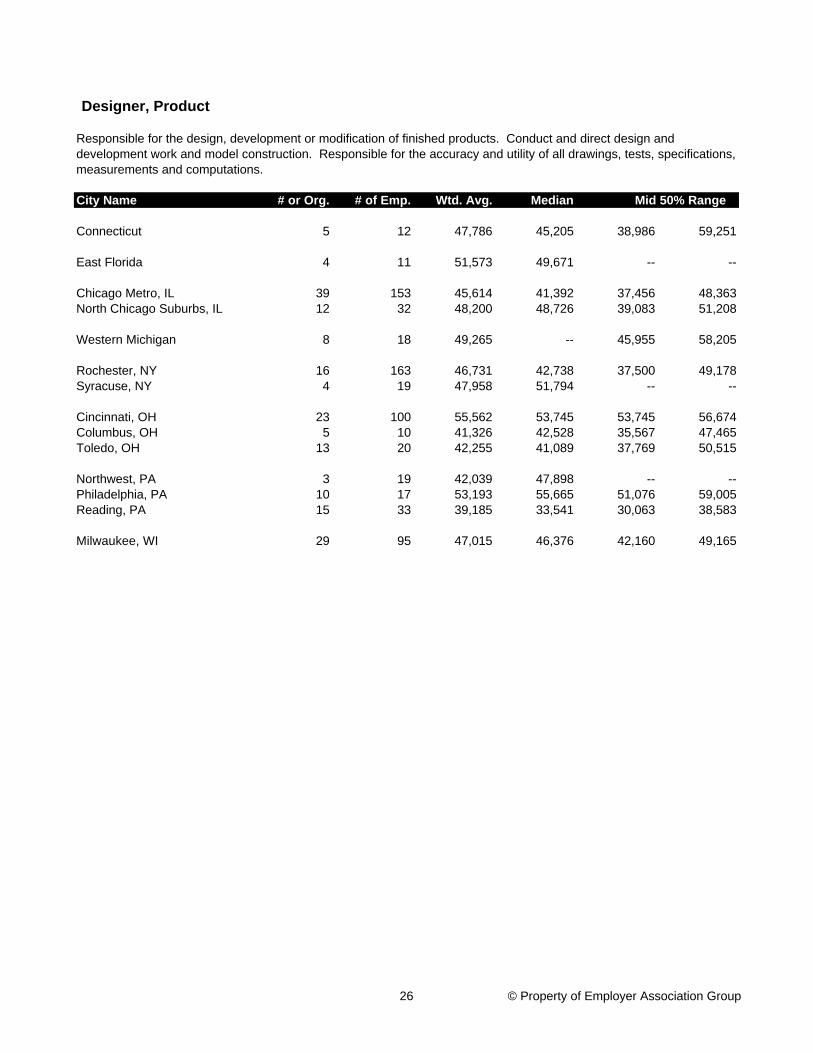
Connecticut 5 12 47,786 45,205 38,986 59,251
East Florida 4 11 51,573 49,671 -- --
Chicago Metro, IL 39 153 45,614 41,392 37,456 48,363North Chicago Suburbs, IL 12 32 48,200 48,726 39,083 51,208
Western Michigan 8 18 49,265 -- 45,955 58,205
Rochester, NY 16 163 46,731 42,738 37,500 49,178Syracuse, NY 4 19 47,958 51,794 -- --
Cincinnati, OH 23 100 55,562 53,745 53,745 56,674Columbus, OH 5 10 41,326 42,528 35,567 47,465Toledo, OH 13 20 42,255 41,089 37,769 50,515
Northwest, PA 3 19 42,039 47,898 -- --Philadelphia, PA 10 17 53,193 55,665 51,076 59,005Reading, PA 15 33 39,185 33,541 30,063 38,583
Milwaukee, WI 29 95 47,015 46,376 42,160 49,165
Mid 50% Range
Designer, Product
Responsible for the design, development or modification of finished products. Conduct and direct design and development work and model construction. Responsible for the accuracy and utility of all drawings, tests, specifications, measurements and computations.
26 © Property of Employer Association Group
City Name # or Org. # of Emp. Wtd. Avg. Median
Connecticut 14 22 36,215 36,575 32,830 39,346
East Florida 11 28 37,026 36,116 31,677 41,157West Florida 3 25 43,439 43,714 -- --
Quad Cities Area/IA & IL 7 8 34,759 32,432 30,176 41,570
Aurora, IL 7 16 38,683 31,565 28,533 45,586Chicago Metro, IL 67 164 35,477 36,814 33,304 39,737Peoria, IL 5 14 34,696 38,417 23,016 42,783
Western Massachusetts 6 10 28,071 30,313 19,038 31,984Worcester, MA 6 9 37,779 38,014 35,519 39,442
Grand Rapids, MI 5 14 39,874 38,771 36,400 44,928Western Michigan 9 11 31,975 -- 28,375 39,511
State of Minnesota 39 74 30,417 31,264 27,401 32,763
Rochester, NY 10 26 37,543 35,182 33,551 39,132Syracuse, NY 8 31 36,598 38,947 30,880 43,599
Charlotte, NC 10 46 46,480 49,533 34,850 55,290Piedmont Triad, NC & VA 6 11 38,434 36,987 31,151 47,211Raleigh/Durham, NC 5 6 38,928 38,715 37,758 44,299
Cincinnati, OH 9 14 37,711 37,861 31,405 43,719Cleveland/Akron, OH 15 28 48,870 48,904 43,602 52,709Columbus, OH 6 10 32,170 31,959 29,323 37,592Toledo, OH 8 12 33,192 34,291 28,859 36,842
Portland, OR 17 34 38,278 38,542 35,547 44,114
Northwest, PA 7 14 27,644 29,478 24,037 31,275Philadelphia, PA 13 16 34,262 33,911 30,601 36,647
Western Washington State 16 27 37,715 37,691 34,127 42,281
Milwaukee, WI 24 41 36,028 -- -- --
Mid 50% Range
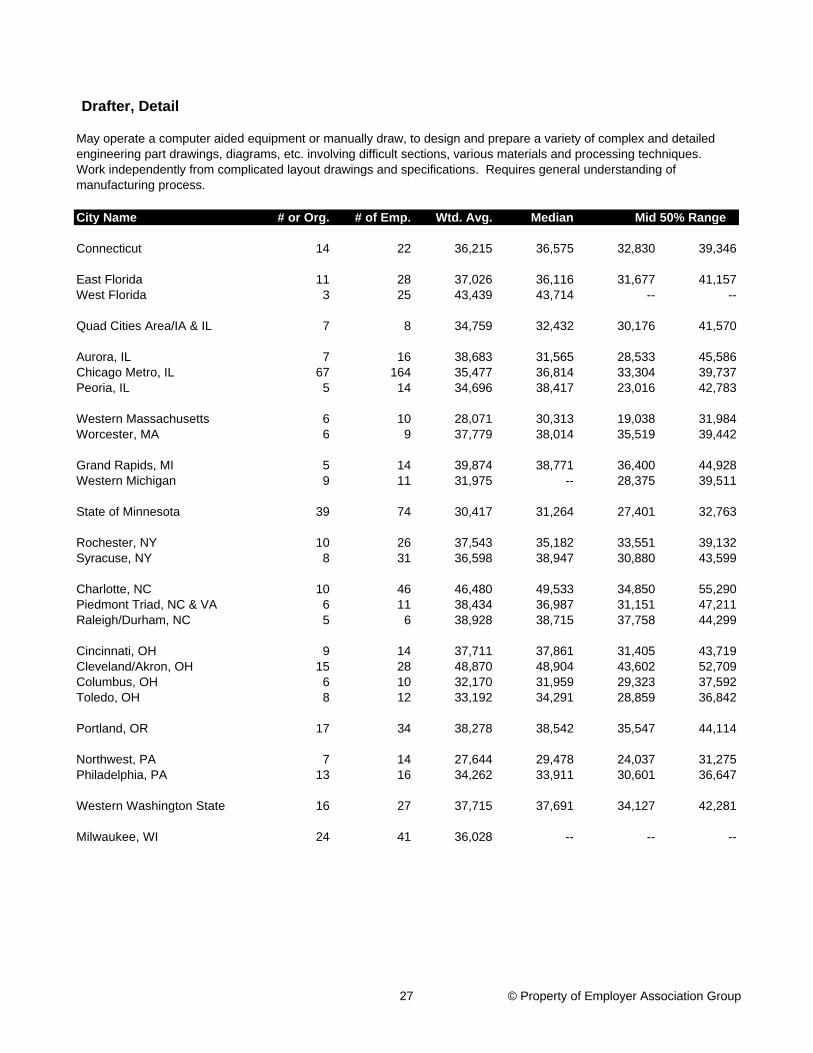
Drafter, Detail
May operate a computer aided equipment or manually draw, to design and prepare a variety of complex and detailed engineering part drawings, diagrams, etc. involving difficult sections, various materials and processing techniques. Work independently from complicated layout drawings and specifications. Requires general understanding of manufacturing process.
27 © Property of Employer Association Group
City Name # or Org. # of Emp. Wtd. Avg. Median
Denver/Boulder, CO 13 85 44,193 45,825 40,659 48,215
Quad Cities Area/IA & IL 17 47 35,726 34,755 29,000 41,699
Aurora, IL 15 109 45,644 44,333 39,705 47,801North Chicago Suburbs, IL 8 9 37,261 37,659 31,365 39,473Peoria, IL 3 9 36,747 40,642 -- --
Grand Rapids, MI 9 33 36,712 37,731 34,778 38,750Western Michigan 5 5 33,518 -- 33,278 36,649
State of Minnesota 79 216 35,668 35,462 32,208 38,369
Syracuse, NY 6 20 48,722 45,764 43,806 51,751
Cincinnati, OH 10 16 36,364 37,391 31,597 41,174Cleveland/Akron, OH 6 25 42,938 43,013 39,164 47,036Columbus, OH 6 12 31,812 33,035 25,589 37,929
Northwest, PA 4 9 30,003 30,264 -- --Philadelphia, PA 21 43 40,417 39,939 32,912 46,103Reading, PA 16 38 48,342 49,338 46,011 55,344
Spartanburg, SC 5 11 32,793 32,247 31,323 33,361
Western Washington State 17 25 45,253 45,724 41,375 47,222
Milwaukee, WI 13 38 31,620 34,069 32,536 35,048
Mid 50% Range
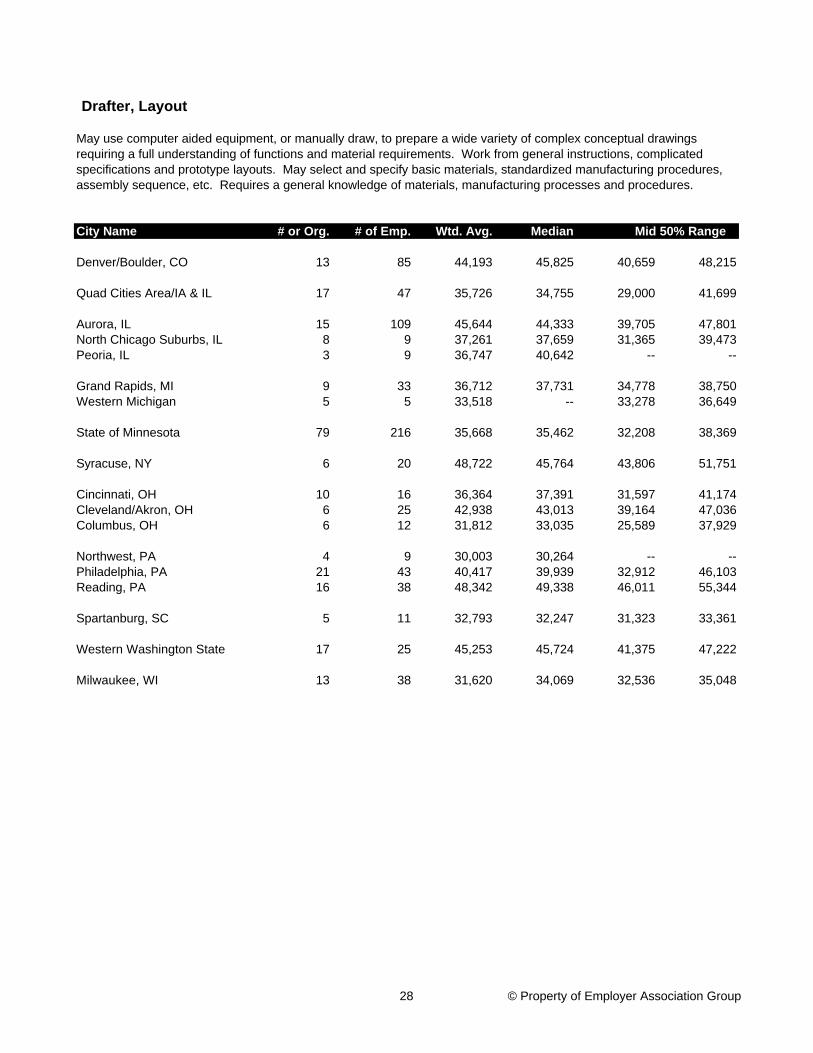
Drafter, Layout
May use computer aided equipment, or manually draw, to prepare a wide variety of complex conceptual drawings requiring a full understanding of functions and material requirements. Work from general instructions, complicated specifications and prototype layouts. May select and specify basic materials, standardized manufacturing procedures, assembly sequence, etc. Requires a general knowledge of materials, manufacturing processes and procedures.
28 © Property of Employer Association Group
City Name # or Org. # of Emp. Wtd. Avg. Median Mid 50% Range
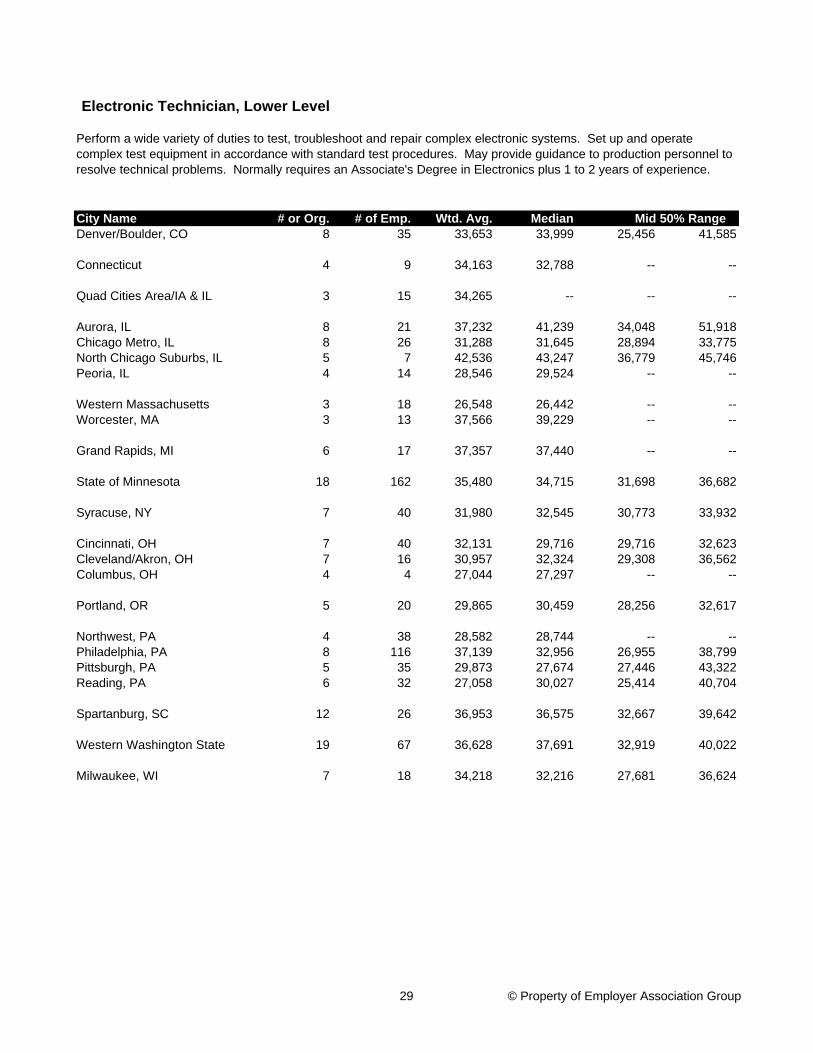
Electronic Technician, Lower Level
Perform a wide variety of duties to test, troubleshoot and repair complex electronic systems. Set up and operate complex test equipment in accordance with standard test procedures. May provide guidance to production personnel to resolve technical problems. Normally requires an Associate's Degree in Electronics plus 1 to 2 years of experience.
Denver/Boulder, CO 8 35 33,653 33,999 25,456 41,585
Connecticut 4 9 34,163 32,788 -- --
Quad Cities Area/IA & IL 3 15 34,265 -- -- --
Aurora, IL 8 21 37,232 41,239 34,048 51,918Chicago Metro, IL 8 26 31,288 31,645 28,894 33,775North Chicago Suburbs, IL 5 7 42,536 43,247 36,779 45,746Peoria, IL 4 14 28,546 29,524 -- --
Western Massachusetts 3 18 26,548 26,442 -- --Worcester, MA 3 13 37,566 39,229 -- --
Grand Rapids, MI 6 17 37,357 37,440 -- --
State of Minnesota 18 162 35,480 34,715 31,698 36,682
Syracuse, NY 7 40 31,980 32,545 30,773 33,932
Cincinnati, OH 7 40 32,131 29,716 29,716 32,623Cleveland/Akron, OH 7 16 30,957 32,324 29,308 36,562Columbus, OH 4 4 27,044 27,297 -- --
Portland, OR 5 20 29,865 30,459 28,256 32,617
Northwest, PA 4 38 28,582 28,744 -- --Philadelphia, PA 8 116 37,139 32,956 26,955 38,799Pittsburgh, PA 5 35 29,873 27,674 27,446 43,322Reading, PA 6 32 27,058 30,027 25,414 40,704
Spartanburg, SC 12 26 36,953 36,575 32,667 39,642
Western Washington State 19 67 36,628 37,691 32,919 40,022
Milwaukee, WI 7 18 34,218 32,216 27,681 36,624
29 © Property of Employer Association Group
City Name # or Org. # of Emp. Wtd. Avg. Median
Quad Cities Area/IA & IL 3 53 44,973 -- -- --
Chicago Metro, IL 13 142 48,699 45,888 41,661 51,331North Chicago Suburbs, IL 12 86 31,131 31,194 23,470 37,158Peoria, IL 5 237 41,746 41,901 41,901 41,901Rockford, IL 3 14 46,557 52,461 -- --
Western Massachusetts 6 27 37,188 35,580 32,682 43,576Worcester, MA 3 14 42,214 43,130 -- --
Grand Rapids, MI 24 197 47,403 48,339 44,949 50,378Western Michigan 10 19 40,617 40,875 37,751 48,468
State of Minnesota 19 210 45,383 43,896 40,365 45,908
Syracuse, NY 5 22 42,329 42,148 35,532 48,145
Raleigh/Durham, NC 11 30 38,237 38,662 36,109 44,884
Cincinnati, OH 8 27 36,407 35,958 32,987 40,512Cleveland/Akron, OH 16 53 43,658 44,825 40,093 48,190Columbus, OH 6 16 35,841 32,445 32,107 40,166
Portland, OR 7 21 45,039 38,630 36,075 48,078
Pittsburgh, PA 8 29 49,251 44,693 37,481 51,127Reading, PA 3 9 48,629 52,954 -- --
Spartanburg, SC 18 78 41,995 42,142 38,340 45,692
Western Washington State 17 76 46,969 45,809 41,979 49,385
Milwaukee, WI 9 26 39,839 41,521 38,476 49,293
Mid 50% Range
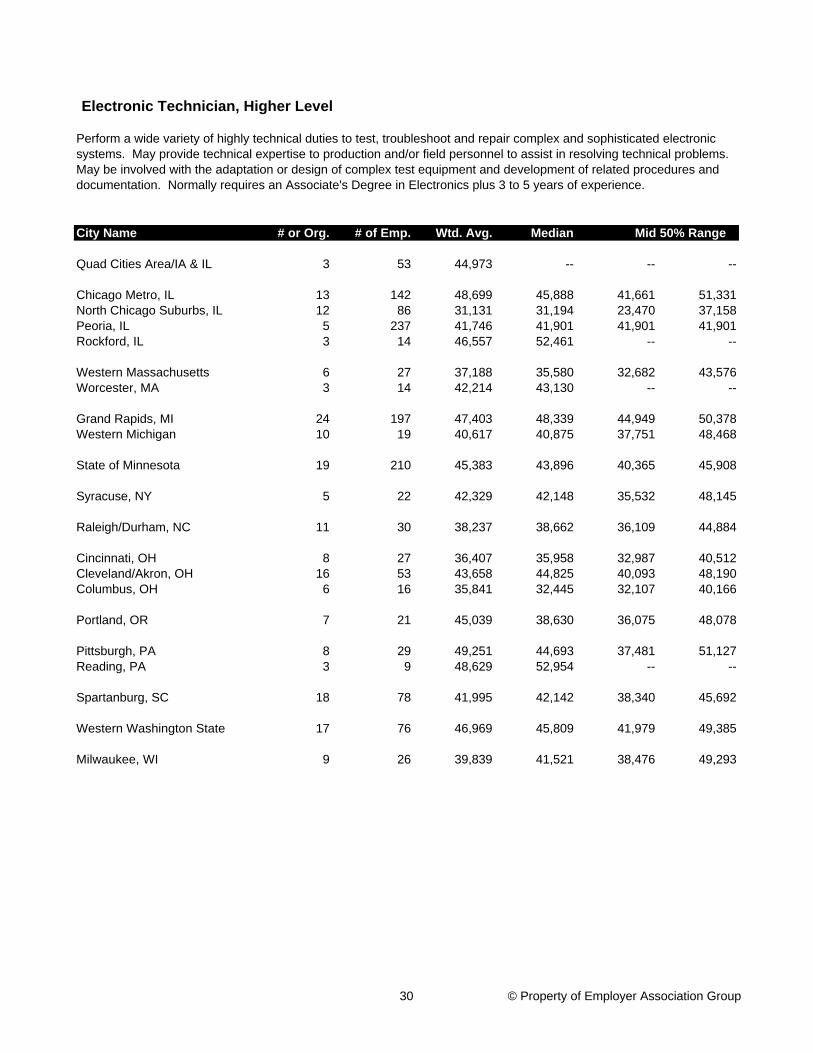
Electronic Technician, Higher Level
Perform a wide variety of highly technical duties to test, troubleshoot and repair complex and sophisticated electronic systems. May provide technical expertise to production and/or field personnel to assist in resolving technical problems. May be involved with the adaptation or design of complex test equipment and development of related procedures and documentation. Normally requires an Associate's Degree in Electronics plus 3 to 5 years of experience.
30 © Property of Employer Association Group
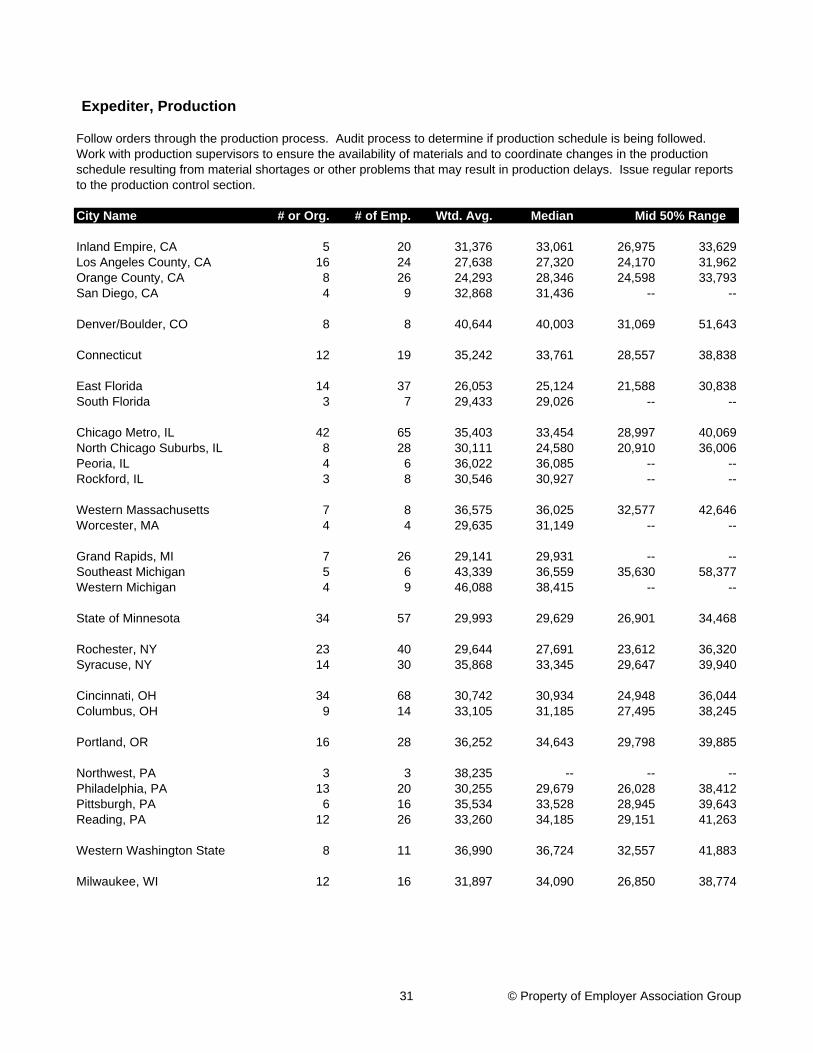
City Name # or Org. # of Emp. Wtd. Avg. Median
Inland Empire, CA 5 20 31,376 33,061 26,975 33,629Los Angeles County, CA 16 24 27,638 27,320 24,170 31,962Orange County, CA 8 26 24,293 28,346 24,598 33,793San Diego, CA 4 9 32,868 31,436 -- --
Denver/Boulder, CO 8 8 40,644 40,003 31,069 51,643
Connecticut 12 19 35,242 33,761 28,557 38,838
East Florida 14 37 26,053 25,124 21,588 30,838South Florida 3 7 29,433 29,026 -- --
Chicago Metro, IL 42 65 35,403 33,454 28,997 40,069North Chicago Suburbs, IL 8 28 30,111 24,580 20,910 36,006Peoria, IL 4 6 36,022 36,085 -- --Rockford, IL 3 8 30,546 30,927 -- --
Western Massachusetts 7 8 36,575 36,025 32,577 42,646Worcester, MA 4 4 29,635 31,149 -- --
Grand Rapids, MI 7 26 29,141 29,931 -- --Southeast Michigan 5 6 43,339 36,559 35,630 58,377Western Michigan 4 9 46,088 38,415 -- --
State of Minnesota 34 57 29,993 29,629 26,901 34,468
Rochester, NY 23 40 29,644 27,691 23,612 36,320Syracuse, NY 14 30 35,868 33,345 29,647 39,940
Cincinnati, OH 34 68 30,742 30,934 24,948 36,044Columbus, OH 9 14 33,105 31,185 27,495 38,245
Portland, OR 16 28 36,252 34,643 29,798 39,885
Northwest, PA 3 3 38,235 -- -- --Philadelphia, PA 13 20 30,255 29,679 26,028 38,412Pittsburgh, PA 6 16 35,534 33,528 28,945 39,643Reading, PA 12 26 33,260 34,185 29,151 41,263
Western Washington State 8 11 36,990 36,724 32,557 41,883
Milwaukee, WI 12 16 31,897 34,090 26,850 38,774
Mid 50% Range
Expediter, Production
Follow orders through the production process. Audit process to determine if production schedule is being followed. Work with production supervisors to ensure the availability of materials and to coordinate changes in the production schedule resulting from material shortages or other problems that may result in production delays. Issue regular reports to the production control section.
31 © Property of Employer Association Group
City Name # or Org. # of Emp. Wtd. Avg. Median
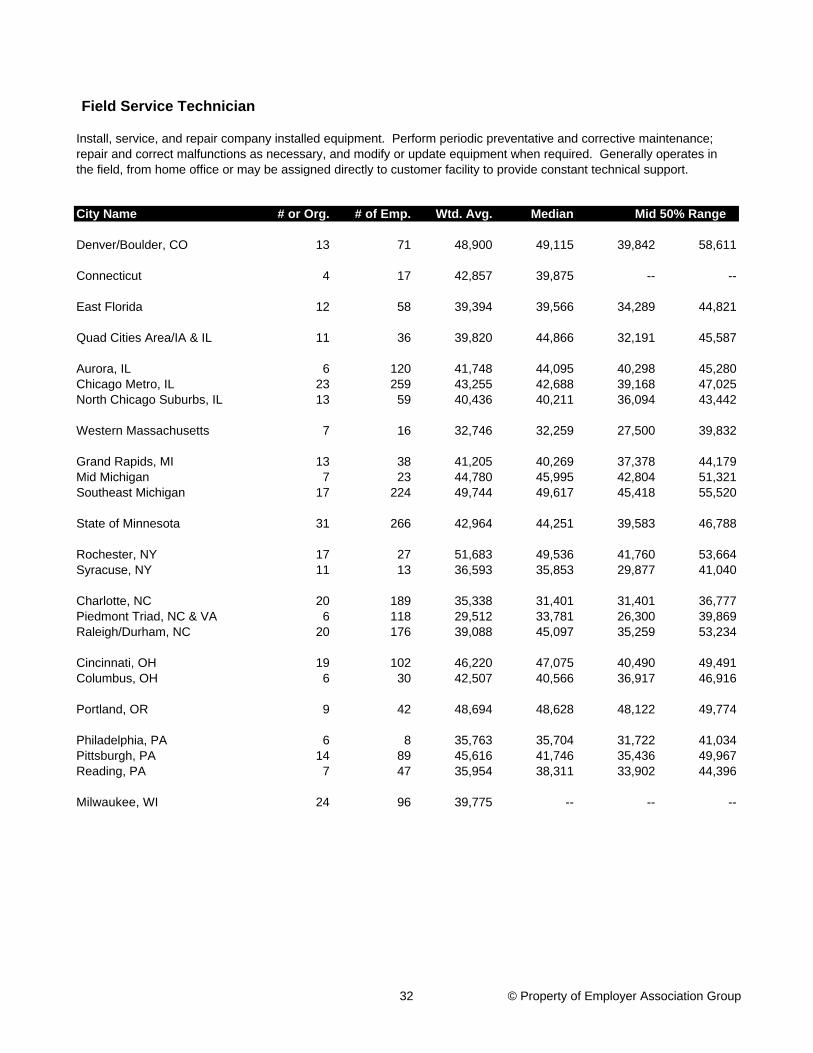
Denver/Boulder, CO 13 71 48,900 49,115 39,842 58,611
Connecticut 4 17 42,857 39,875 -- --
East Florida 12 58 39,394 39,566 34,289 44,821
Quad Cities Area/IA & IL 11 36 39,820 44,866 32,191 45,587
Aurora, IL 6 120 41,748 44,095 40,298 45,280Chicago Metro, IL 23 259 43,255 42,688 39,168 47,025North Chicago Suburbs, IL 13 59 40,436 40,211 36,094 43,442
Western Massachusetts 7 16 32,746 32,259 27,500 39,832
Grand Rapids, MI 13 38 41,205 40,269 37,378 44,179Mid Michigan 7 23 44,780 45,995 42,804 51,321Southeast Michigan 17 224 49,744 49,617 45,418 55,520
State of Minnesota 31 266 42,964 44,251 39,583 46,788
Rochester, NY 17 27 51,683 49,536 41,760 53,664Syracuse, NY 11 13 36,593 35,853 29,877 41,040
Charlotte, NC 20 189 35,338 31,401 31,401 36,777Piedmont Triad, NC & VA 6 118 29,512 33,781 26,300 39,869Raleigh/Durham, NC 20 176 39,088 45,097 35,259 53,234
Cincinnati, OH 19 102 46,220 47,075 40,490 49,491Columbus, OH 6 30 42,507 40,566 36,917 46,916
Portland, OR 9 42 48,694 48,628 48,122 49,774
Philadelphia, PA 6 8 35,763 35,704 31,722 41,034Pittsburgh, PA 14 89 45,616 41,746 35,436 49,967Reading, PA 7 47 35,954 38,311 33,902 44,396
Milwaukee, WI 24 96 39,775 -- -- --
Mid 50% Range
Field Service Technician
Install, service, and repair company installed equipment. Perform periodic preventative and corrective maintenance; repair and correct malfunctions as necessary, and modify or update equipment when required. Generally operates in the field, from home office or may be assigned directly to customer facility to provide constant technical support.
32 © Property of Employer Association Group
City Name # or Org. # of Emp. Wtd. Avg. Median
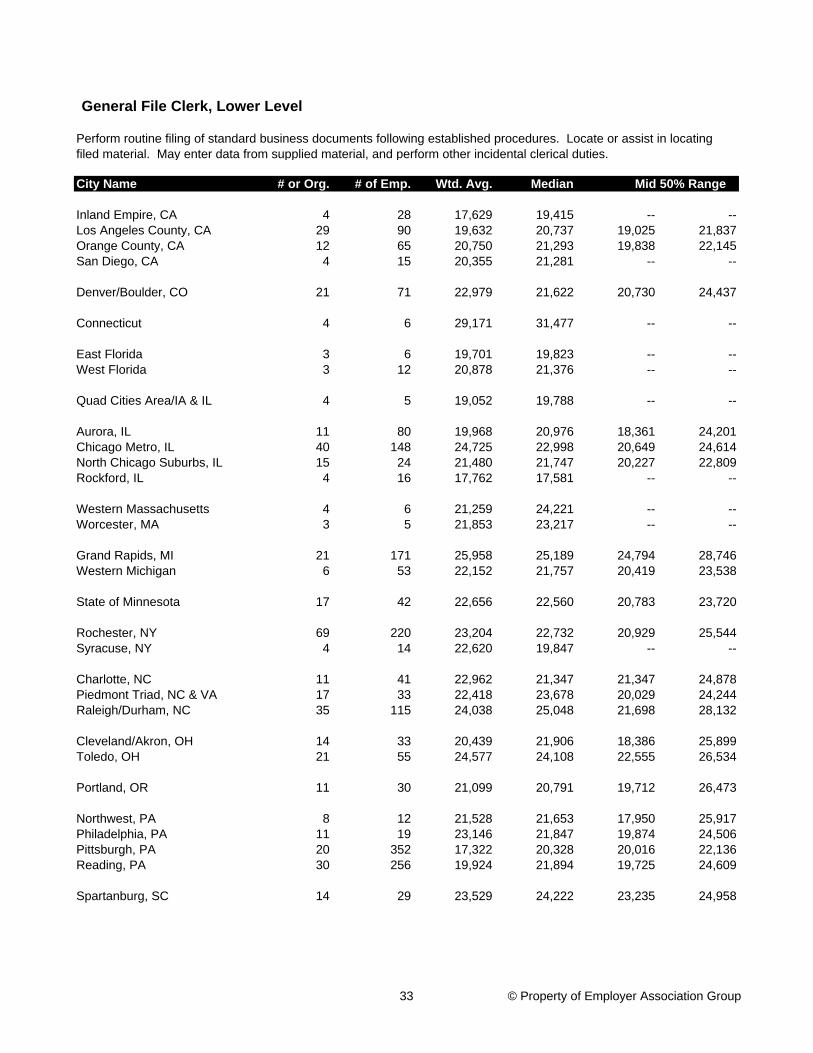
Inland Empire, CA 4 28 17,629 19,415 -- --Los Angeles County, CA 29 90 19,632 20,737 19,025 21,837Orange County, CA 12 65 20,750 21,293 19,838 22,145San Diego, CA 4 15 20,355 21,281 -- --
Denver/Boulder, CO 21 71 22,979 21,622 20,730 24,437
Connecticut 4 6 29,171 31,477 -- --
East Florida 3 6 19,701 19,823 -- --West Florida 3 12 20,878 21,376 -- --
Quad Cities Area/IA & IL 4 5 19,052 19,788 -- --
Aurora, IL 11 80 19,968 20,976 18,361 24,201Chicago Metro, IL 40 148 24,725 22,998 20,649 24,614North Chicago Suburbs, IL 15 24 21,480 21,747 20,227 22,809Rockford, IL 4 16 17,762 17,581 -- --
Western Massachusetts 4 6 21,259 24,221 -- --Worcester, MA 3 5 21,853 23,217 -- --
Grand Rapids, MI 21 171 25,958 25,189 24,794 28,746Western Michigan 6 53 22,152 21,757 20,419 23,538
State of Minnesota 17 42 22,656 22,560 20,783 23,720
Rochester, NY 69 220 23,204 22,732 20,929 25,544Syracuse, NY 4 14 22,620 19,847 -- --
Charlotte, NC 11 41 22,962 21,347 21,347 24,878Piedmont Triad, NC & VA 17 33 22,418 23,678 20,029 24,244Raleigh/Durham, NC 35 115 24,038 25,048 21,698 28,132
Cleveland/Akron, OH 14 33 20,439 21,906 18,386 25,899Toledo, OH 21 55 24,577 24,108 22,555 26,534
Portland, OR 11 30 21,099 20,791 19,712 26,473
Northwest, PA 8 12 21,528 21,653 17,950 25,917Philadelphia, PA 11 19 23,146 21,847 19,874 24,506Pittsburgh, PA 20 352 17,322 20,328 20,016 22,136Reading, PA 30 256 19,924 21,894 19,725 24,609
Spartanburg, SC 14 29 23,529 24,222 23,235 24,958
Mid 50% Range
General File Clerk, Lower Level
Perform routine filing of standard business documents following established procedures. Locate or assist in locating filed material. May enter data from supplied material, and perform other incidental clerical duties.
33 © Property of Employer Association Group
City Name # or Org. # of Emp. Wtd. Avg. Median Mid 50% Range
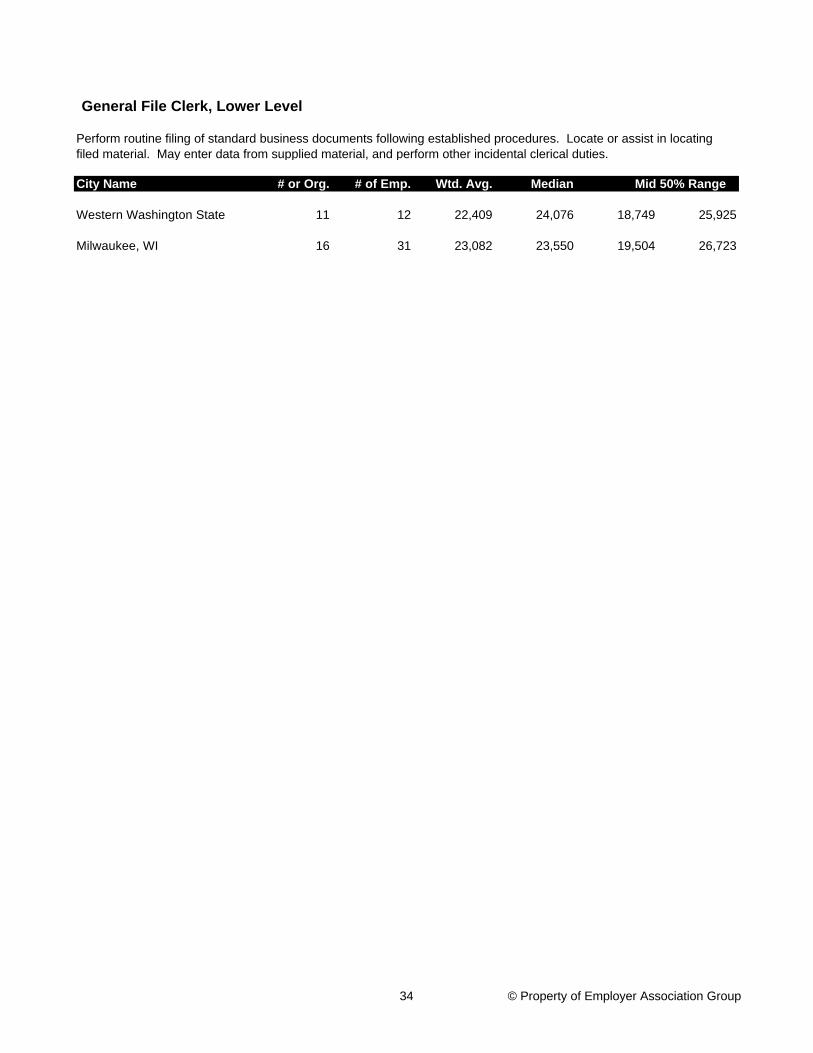
General File Clerk, Lower Level
Perform routine filing of standard business documents following established procedures. Locate or assist in locating filed material. May enter data from supplied material, and perform other incidental clerical duties.
Western Washington State 11 12 22,409 24,076 18,749 25,925
Milwaukee, WI 16 31 23,082 23,550 19,504 26,723
34 © Property of Employer Association Group
City Name # or Org. # of Emp. Wtd. Avg. Median
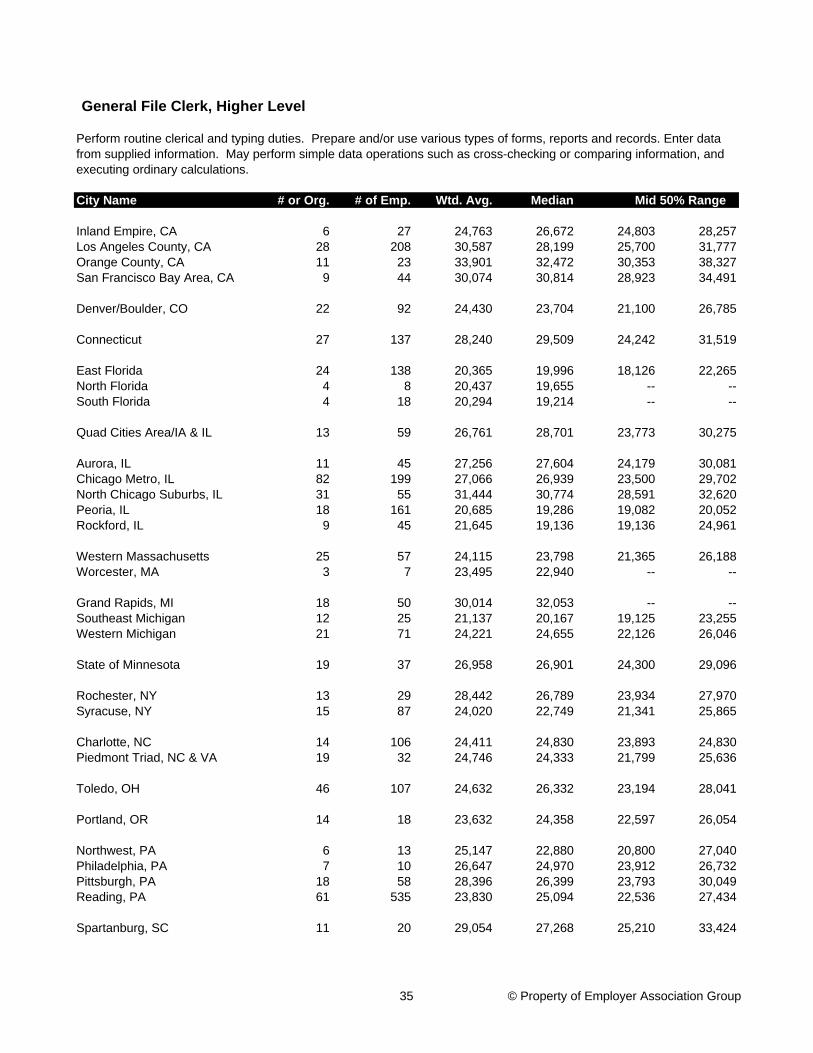
Inland Empire, CA 6 27 24,763 26,672 24,803 28,257Los Angeles County, CA 28 208 30,587 28,199 25,700 31,777Orange County, CA 11 23 33,901 32,472 30,353 38,327San Francisco Bay Area, CA 9 44 30,074 30,814 28,923 34,491
Denver/Boulder, CO 22 92 24,430 23,704 21,100 26,785
Connecticut 27 137 28,240 29,509 24,242 31,519
East Florida 24 138 20,365 19,996 18,126 22,265North Florida 4 8 20,437 19,655 -- --South Florida 4 18 20,294 19,214 -- --
Quad Cities Area/IA & IL 13 59 26,761 28,701 23,773 30,275
Aurora, IL 11 45 27,256 27,604 24,179 30,081Chicago Metro, IL 82 199 27,066 26,939 23,500 29,702North Chicago Suburbs, IL 31 55 31,444 30,774 28,591 32,620Peoria, IL 18 161 20,685 19,286 19,082 20,052Rockford, IL 9 45 21,645 19,136 19,136 24,961
Western Massachusetts 25 57 24,115 23,798 21,365 26,188Worcester, MA 3 7 23,495 22,940 -- --
Grand Rapids, MI 18 50 30,014 32,053 -- --Southeast Michigan 12 25 21,137 20,167 19,125 23,255Western Michigan 21 71 24,221 24,655 22,126 26,046
State of Minnesota 19 37 26,958 26,901 24,300 29,096
Rochester, NY 13 29 28,442 26,789 23,934 27,970Syracuse, NY 15 87 24,020 22,749 21,341 25,865
Charlotte, NC 14 106 24,411 24,830 23,893 24,830Piedmont Triad, NC & VA 19 32 24,746 24,333 21,799 25,636
Toledo, OH 46 107 24,632 26,332 23,194 28,041
Portland, OR 14 18 23,632 24,358 22,597 26,054
Northwest, PA 6 13 25,147 22,880 20,800 27,040Philadelphia, PA 7 10 26,647 24,970 23,912 26,732Pittsburgh, PA 18 58 28,396 26,399 23,793 30,049Reading, PA 61 535 23,830 25,094 22,536 27,434
Spartanburg, SC 11 20 29,054 27,268 25,210 33,424
Mid 50% Range
General File Clerk, Higher Level
Perform routine clerical and typing duties. Prepare and/or use various types of forms, reports and records. Enter data from supplied information. May perform simple data operations such as cross-checking or comparing information, and executing ordinary calculations.
35 © Property of Employer Association Group
City Name # or Org. # of Emp. Wtd. Avg. Median
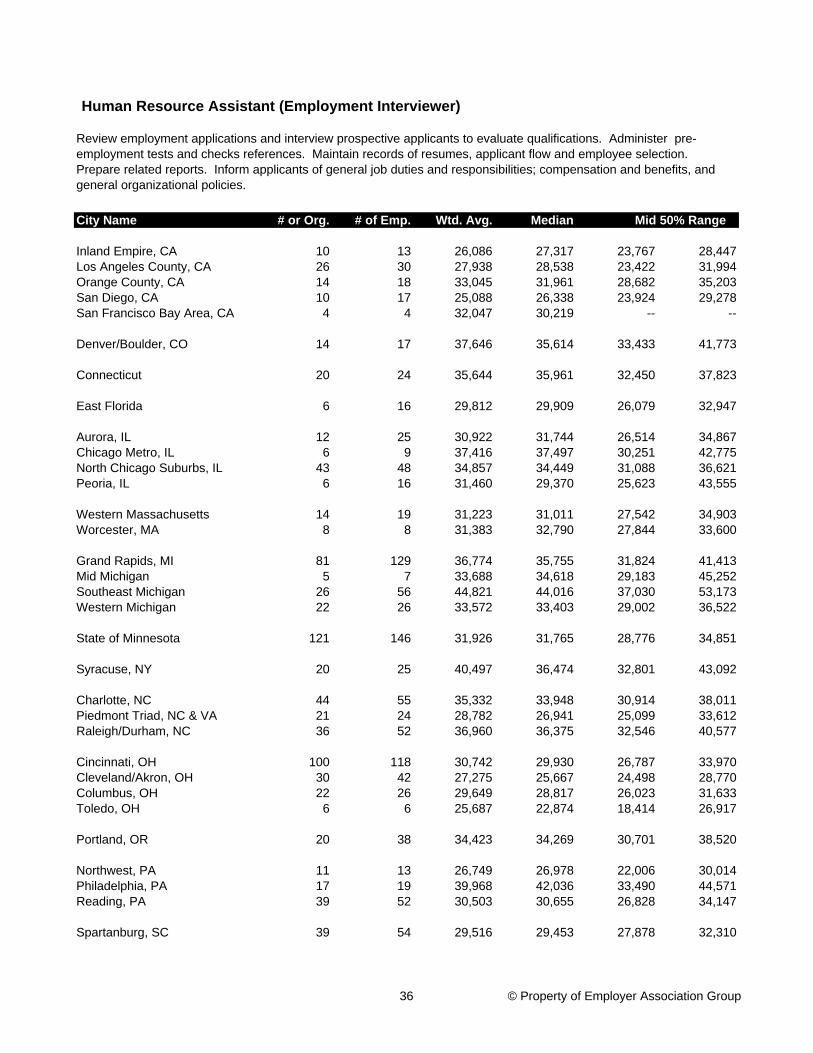
Inland Empire, CA 10 13 26,086 27,317 23,767 28,447Los Angeles County, CA 26 30 27,938 28,538 23,422 31,994Orange County, CA 14 18 33,045 31,961 28,682 35,203San Diego, CA 10 17 25,088 26,338 23,924 29,278San Francisco Bay Area, CA 4 4 32,047 30,219 -- --
Denver/Boulder, CO 14 17 37,646 35,614 33,433 41,773
Connecticut 20 24 35,644 35,961 32,450 37,823
East Florida 6 16 29,812 29,909 26,079 32,947
Aurora, IL 12 25 30,922 31,744 26,514 34,867Chicago Metro, IL 6 9 37,416 37,497 30,251 42,775North Chicago Suburbs, IL 43 48 34,857 34,449 31,088 36,621Peoria, IL 6 16 31,460 29,370 25,623 43,555
Western Massachusetts 14 19 31,223 31,011 27,542 34,903Worcester, MA 8 8 31,383 32,790 27,844 33,600
Grand Rapids, MI 81 129 36,774 35,755 31,824 41,413Mid Michigan 5 7 33,688 34,618 29,183 45,252Southeast Michigan 26 56 44,821 44,016 37,030 53,173Western Michigan 22 26 33,572 33,403 29,002 36,522
State of Minnesota 121 146 31,926 31,765 28,776 34,851
Syracuse, NY 20 25 40,497 36,474 32,801 43,092
Charlotte, NC 44 55 35,332 33,948 30,914 38,011Piedmont Triad, NC & VA 21 24 28,782 26,941 25,099 33,612Raleigh/Durham, NC 36 52 36,960 36,375 32,546 40,577
Cincinnati, OH 100 118 30,742 29,930 26,787 33,970Cleveland/Akron, OH 30 42 27,275 25,667 24,498 28,770Columbus, OH 22 26 29,649 28,817 26,023 31,633Toledo, OH 6 6 25,687 22,874 18,414 26,917
Portland, OR 20 38 34,423 34,269 30,701 38,520
Northwest, PA 11 13 26,749 26,978 22,006 30,014Philadelphia, PA 17 19 39,968 42,036 33,490 44,571Reading, PA 39 52 30,503 30,655 26,828 34,147
Spartanburg, SC 39 54 29,516 29,453 27,878 32,310
Mid 50% Range
Review employment applications and interview prospective applicants to evaluate qualifications. Administer pre-employment tests and checks references. Maintain records of resumes, applicant flow and employee selection. Prepare related reports. Inform applicants of general job duties and responsibilities; compensation and benefits, and general organizational policies.
Human Resource Assistant (Employment Interviewer)
36 © Property of Employer Association Group
City Name # or Org. # of Emp. Wtd. Avg. Median Mid 50% Range
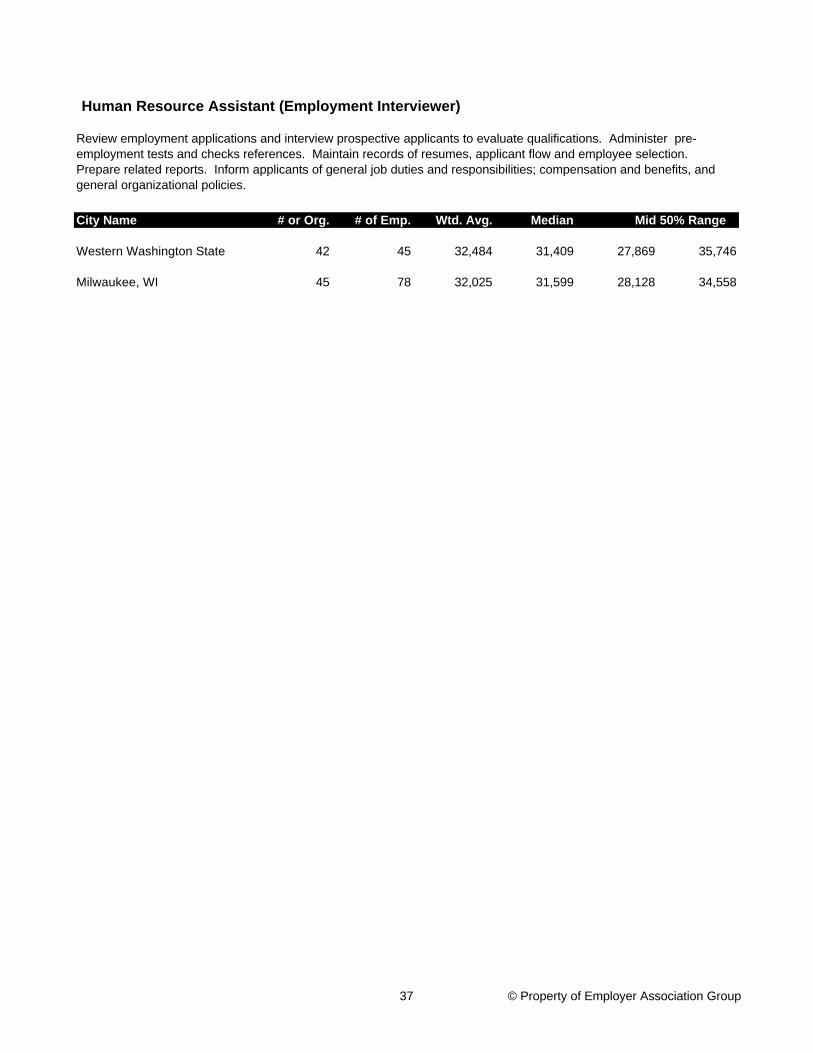
Review employment applications and interview prospective applicants to evaluate qualifications. Administer pre-employment tests and checks references. Maintain records of resumes, applicant flow and employee selection. Prepare related reports. Inform applicants of general job duties and responsibilities; compensation and benefits, and general organizational policies.
Human Resource Assistant (Employment Interviewer)
Western Washington State 42 45 32,484 31,409 27,869 35,746
Milwaukee, WI 45 78 32,025 31,599 28,128 34,558
37 © Property of Employer Association Group
City Name # or Org. # of Emp. Wtd. Avg. Median
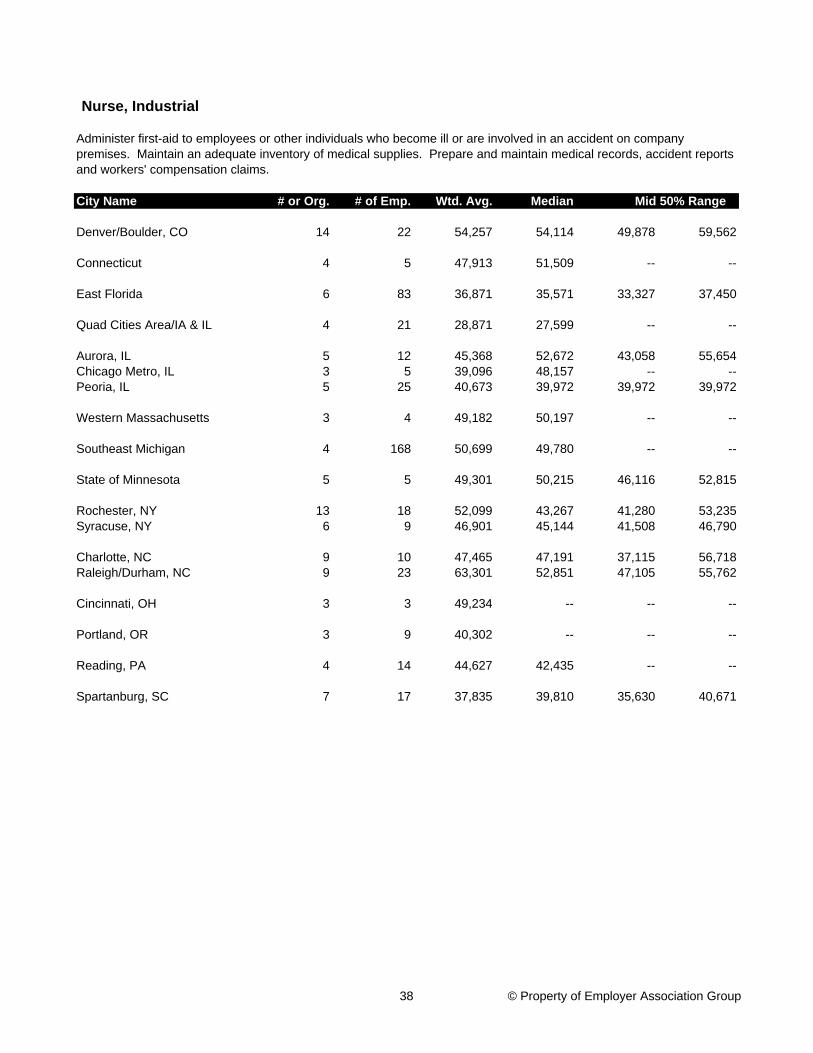
Denver/Boulder, CO 14 22 54,257 54,114 49,878 59,562
Connecticut 4 5 47,913 51,509 -- --
East Florida 6 83 36,871 35,571 33,327 37,450
Quad Cities Area/IA & IL 4 21 28,871 27,599 -- --
Aurora, IL 5 12 45,368 52,672 43,058 55,654Chicago Metro, IL 3 5 39,096 48,157 -- --Peoria, IL 5 25 40,673 39,972 39,972 39,972
Western Massachusetts 3 4 49,182 50,197 -- --
Southeast Michigan 4 168 50,699 49,780 -- --
State of Minnesota 5 5 49,301 50,215 46,116 52,815
Rochester, NY 13 18 52,099 43,267 41,280 53,235Syracuse, NY 6 9 46,901 45,144 41,508 46,790
Charlotte, NC 9 10 47,465 47,191 37,115 56,718Raleigh/Durham, NC 9 23 63,301 52,851 47,105 55,762
Cincinnati, OH 3 3 49,234 -- -- --
Portland, OR 3 9 40,302 -- -- --
Reading, PA 4 14 44,627 42,435 -- --
Spartanburg, SC 7 17 37,835 39,810 35,630 40,671
Mid 50% Range
Nurse, Industrial
Administer first-aid to employees or other individuals who become ill or are involved in an accident on company premises. Maintain an adequate inventory of medical supplies. Prepare and maintain medical records, accident reports and workers' compensation claims.
38 © Property of Employer Association Group
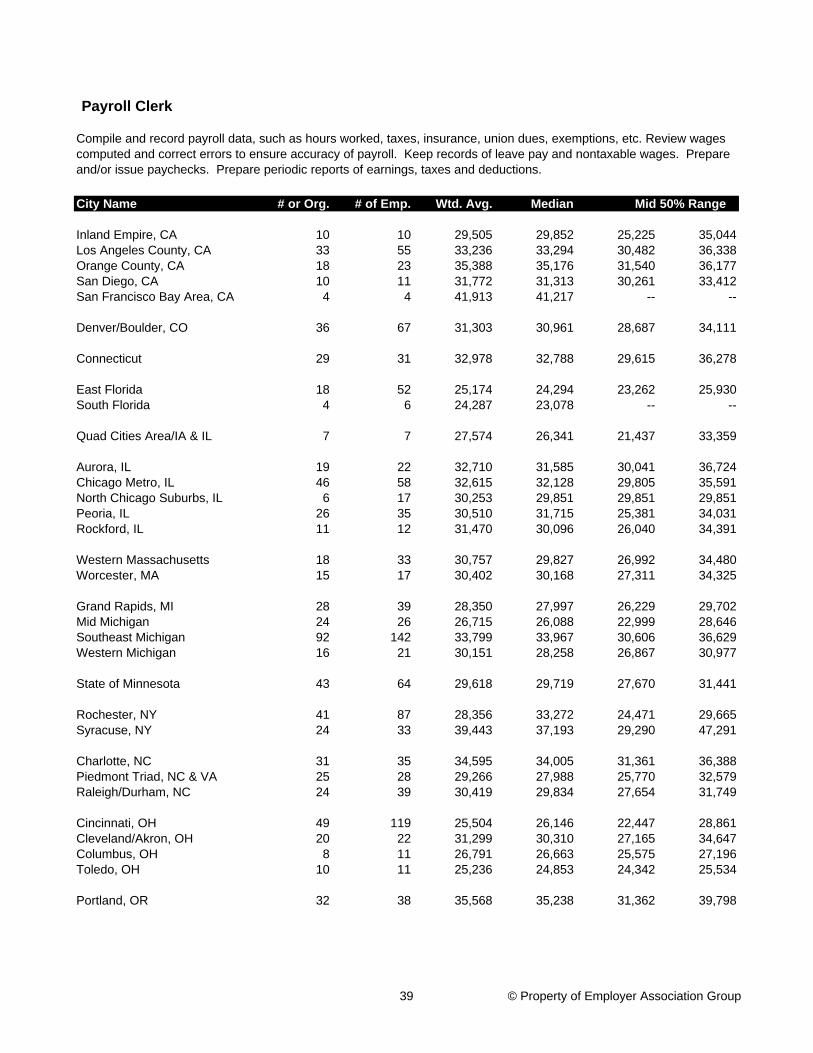
City Name # or Org. # of Emp. Wtd. Avg. Median
Inland Empire, CA 10 10 29,505 29,852 25,225 35,044Los Angeles County, CA 33 55 33,236 33,294 30,482 36,338Orange County, CA 18 23 35,388 35,176 31,540 36,177San Diego, CA 10 11 31,772 31,313 30,261 33,412San Francisco Bay Area, CA 4 4 41,913 41,217 -- --
Denver/Boulder, CO 36 67 31,303 30,961 28,687 34,111
Connecticut 29 31 32,978 32,788 29,615 36,278
East Florida 18 52 25,174 24,294 23,262 25,930South Florida 4 6 24,287 23,078 -- --
Quad Cities Area/IA & IL 7 7 27,574 26,341 21,437 33,359
Aurora, IL 19 22 32,710 31,585 30,041 36,724Chicago Metro, IL 46 58 32,615 32,128 29,805 35,591North Chicago Suburbs, IL 6 17 30,253 29,851 29,851 29,851Peoria, IL 26 35 30,510 31,715 25,381 34,031Rockford, IL 11 12 31,470 30,096 26,040 34,391
Western Massachusetts 18 33 30,757 29,827 26,992 34,480Worcester, MA 15 17 30,402 30,168 27,311 34,325
Grand Rapids, MI 28 39 28,350 27,997 26,229 29,702Mid Michigan 24 26 26,715 26,088 22,999 28,646Southeast Michigan 92 142 33,799 33,967 30,606 36,629Western Michigan 16 21 30,151 28,258 26,867 30,977
State of Minnesota 43 64 29,618 29,719 27,670 31,441
Rochester, NY 41 87 28,356 33,272 24,471 29,665Syracuse, NY 24 33 39,443 37,193 29,290 47,291
Charlotte, NC 31 35 34,595 34,005 31,361 36,388Piedmont Triad, NC & VA 25 28 29,266 27,988 25,770 32,579Raleigh/Durham, NC 24 39 30,419 29,834 27,654 31,749
Cincinnati, OH 49 119 25,504 26,146 22,447 28,861Cleveland/Akron, OH 20 22 31,299 30,310 27,165 34,647Columbus, OH 8 11 26,791 26,663 25,575 27,196Toledo, OH 10 11 25,236 24,853 24,342 25,534
Portland, OR 32 38 35,568 35,238 31,362 39,798
Mid 50% Range
Payroll Clerk
Compile and record payroll data, such as hours worked, taxes, insurance, union dues, exemptions, etc. Review wages computed and correct errors to ensure accuracy of payroll. Keep records of leave pay and nontaxable wages. Prepare and/or issue paychecks. Prepare periodic reports of earnings, taxes and deductions.
39 © Property of Employer Association Group
City Name # or Org. # of Emp. Wtd. Avg. Median Mid 50% Range
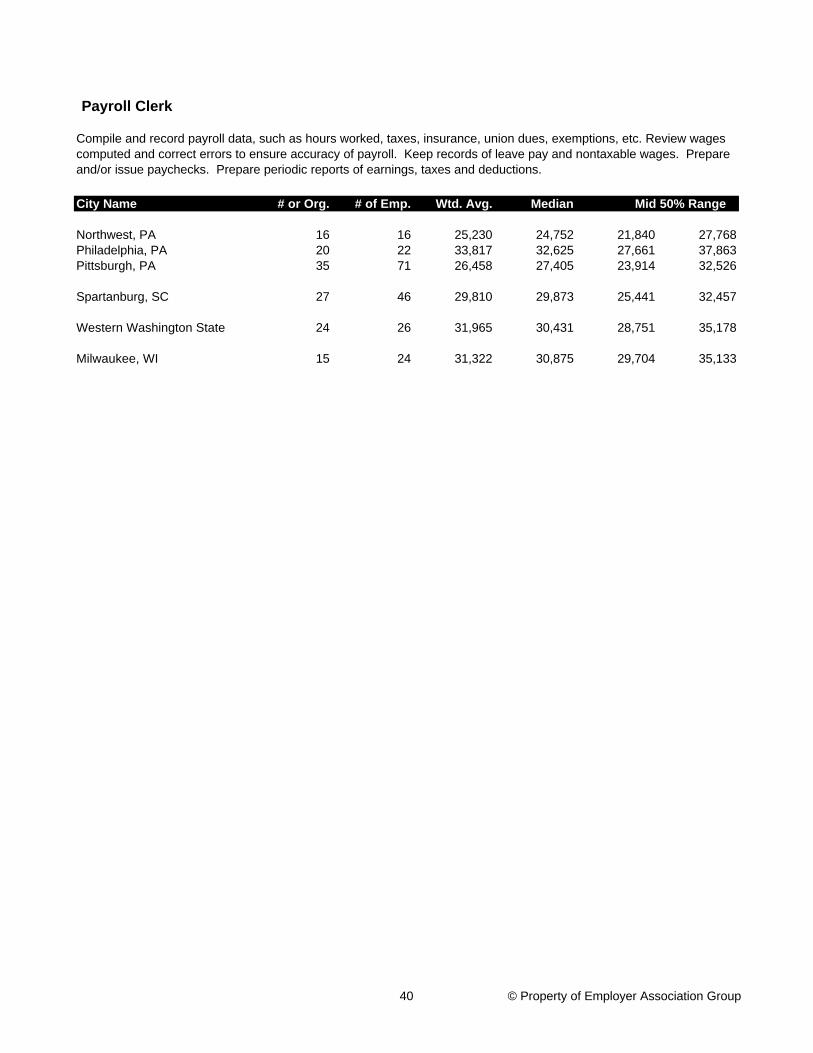
Payroll Clerk
Compile and record payroll data, such as hours worked, taxes, insurance, union dues, exemptions, etc. Review wages computed and correct errors to ensure accuracy of payroll. Keep records of leave pay and nontaxable wages. Prepare and/or issue paychecks. Prepare periodic reports of earnings, taxes and deductions.
Northwest, PA 16 16 25,230 24,752 21,840 27,768Philadelphia, PA 20 22 33,817 32,625 27,661 37,863Pittsburgh, PA 35 71 26,458 27,405 23,914 32,526
Spartanburg, SC 27 46 29,810 29,873 25,441 32,457
Western Washington State 24 26 31,965 30,431 28,751 35,178
Milwaukee, WI 15 24 31,322 30,875 29,704 35,133
40 © Property of Employer Association Group

City Name # or Org. # of Emp. Wtd. Avg. Median
Inland Empire, CA 13 22 22,434 22,183 19,225 23,239Los Angeles County, CA 77 176 24,325 25,367 23,168 28,453Orange County, CA 51 65 27,078 27,596 24,966 29,959San Diego, CA 17 36 24,420 25,519 22,329 27,603San Francisco Bay Area, CA 11 22 27,819 28,158 26,585 30,995
Denver/Boulder, CO 175 319 26,575 26,286 24,223 28,618
Connecticut 54 79 25,511 23,925 22,338 27,500
East Florida 87 173 20,377 19,761 17,534 22,619North Florida 5 7 20,283 20,830 18,565 21,515South Florida 17 29 21,356 21,349 17,827 23,331West Florida 15 80 24,757 24,080 22,445 26,720
Quad Cities Area/IA & IL 28 46 21,568 18,701 18,203 24,949
Aurora, IL 35 65 24,960 25,250 21,806 27,270Chicago Metro, IL 140 176 26,803 26,754 24,276 29,124North Chicago Suburbs, IL 73 90 26,623 26,055 23,758 27,738Peoria, IL 4 20 18,915 20,839 -- --
Western Massachusetts 51 94 23,290 22,211 20,286 25,448Worcester, MA 40 69 23,239 23,068 20,766 26,927
Grand Rapids, MI 105 191 23,816 23,920 20,800 26,312Mid Michigan 45 103 20,964 19,884 17,791 24,525Southeast Michigan 153 264 25,653 25,809 23,194 28,792Western Michigan 21 23 20,844 20,366 18,270 23,180
State of Minnesota 193 245 25,949 25,689 22,893 28,347
Rochester, NY 60 83 22,796 23,140 20,650 25,759Syracuse, NY 30 40 21,499 21,033 18,887 23,838
Charlotte, NC 94 505 24,402 24,554 24,229 24,554Piedmont Triad, NC & VA 66 82 23,564 23,173 21,158 25,764Raleigh/Durham, NC 110 222 26,962 25,580 24,091 28,717
Cincinnati, OH 123 180 24,393 23,751 22,126 26,274Cleveland/Akron, OH 61 100 24,344 21,960 19,240 25,678Columbus, OH 26 34 23,058 22,397 19,987 26,108Toledo, OH 82 120 21,683 21,278 19,661 24,385
Portland, OR 81 109 24,843 24,469 22,971 26,429
Mid 50% Range
Receptionist / Phone Operator
Operate multiline telephone system to answer incoming calls and direct callers to appropriate personnel. Take and deliver messages or transfer calls to voice mail when appropriate personnel are unavailable. Welcome on-site visitors, determine nature of business, announce visitors to appropriate personnel and issue passes when required. Receive, sort and route mail. Maintain fax machines, assist users, send faxes and retrieve and route incoming faxes.
41 © Property of Employer Association Group
City Name # or Org. # of Emp. Wtd. Avg. Median Mid 50% Range
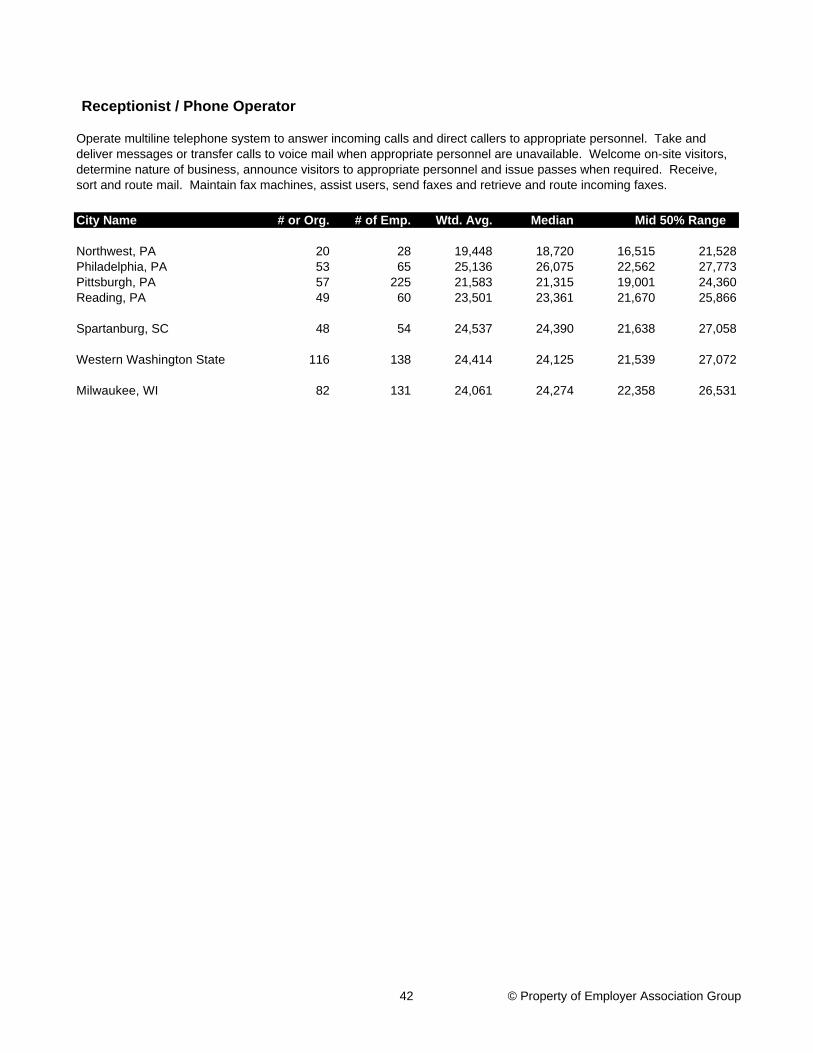
Receptionist / Phone Operator
Operate multiline telephone system to answer incoming calls and direct callers to appropriate personnel. Take and deliver messages or transfer calls to voice mail when appropriate personnel are unavailable. Welcome on-site visitors, determine nature of business, announce visitors to appropriate personnel and issue passes when required. Receive, sort and route mail. Maintain fax machines, assist users, send faxes and retrieve and route incoming faxes.
Northwest, PA 20 28 19,448 18,720 16,515 21,528Philadelphia, PA 53 65 25,136 26,075 22,562 27,773Pittsburgh, PA 57 225 21,583 21,315 19,001 24,360Reading, PA 49 60 23,501 23,361 21,670 25,866
Spartanburg, SC 48 54 24,537 24,390 21,638 27,058
Western Washington State 116 138 24,414 24,125 21,539 27,072
Milwaukee, WI 82 131 24,061 24,274 22,358 26,531
42 © Property of Employer Association Group
City Name # or Org. # of Emp. Wtd. Avg. Median
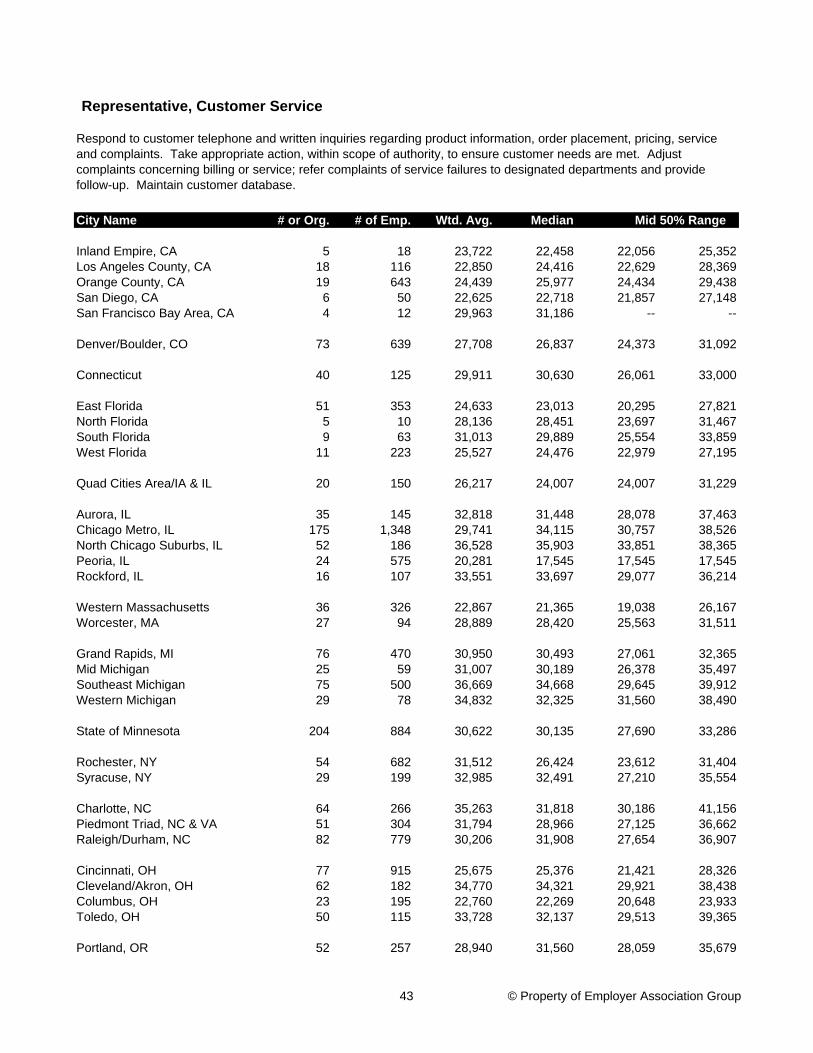
Inland Empire, CA 5 18 23,722 22,458 22,056 25,352Los Angeles County, CA 18 116 22,850 24,416 22,629 28,369Orange County, CA 19 643 24,439 25,977 24,434 29,438San Diego, CA 6 50 22,625 22,718 21,857 27,148San Francisco Bay Area, CA 4 12 29,963 31,186 -- --
Denver/Boulder, CO 73 639 27,708 26,837 24,373 31,092
Connecticut 40 125 29,911 30,630 26,061 33,000
East Florida 51 353 24,633 23,013 20,295 27,821North Florida 5 10 28,136 28,451 23,697 31,467South Florida 9 63 31,013 29,889 25,554 33,859West Florida 11 223 25,527 24,476 22,979 27,195
Quad Cities Area/IA & IL 20 150 26,217 24,007 24,007 31,229
Aurora, IL 35 145 32,818 31,448 28,078 37,463Chicago Metro, IL 175 1,348 29,741 34,115 30,757 38,526North Chicago Suburbs, IL 52 186 36,528 35,903 33,851 38,365Peoria, IL 24 575 20,281 17,545 17,545 17,545Rockford, IL 16 107 33,551 33,697 29,077 36,214
Western Massachusetts 36 326 22,867 21,365 19,038 26,167Worcester, MA 27 94 28,889 28,420 25,563 31,511
Grand Rapids, MI 76 470 30,950 30,493 27,061 32,365Mid Michigan 25 59 31,007 30,189 26,378 35,497Southeast Michigan 75 500 36,669 34,668 29,645 39,912Western Michigan 29 78 34,832 32,325 31,560 38,490
State of Minnesota 204 884 30,622 30,135 27,690 33,286
Rochester, NY 54 682 31,512 26,424 23,612 31,404Syracuse, NY 29 199 32,985 32,491 27,210 35,554
Charlotte, NC 64 266 35,263 31,818 30,186 41,156Piedmont Triad, NC & VA 51 304 31,794 28,966 27,125 36,662Raleigh/Durham, NC 82 779 30,206 31,908 27,654 36,907
Cincinnati, OH 77 915 25,675 25,376 21,421 28,326Cleveland/Akron, OH 62 182 34,770 34,321 29,921 38,438Columbus, OH 23 195 22,760 22,269 20,648 23,933Toledo, OH 50 115 33,728 32,137 29,513 39,365
Portland, OR 52 257 28,940 31,560 28,059 35,679
Mid 50% Range
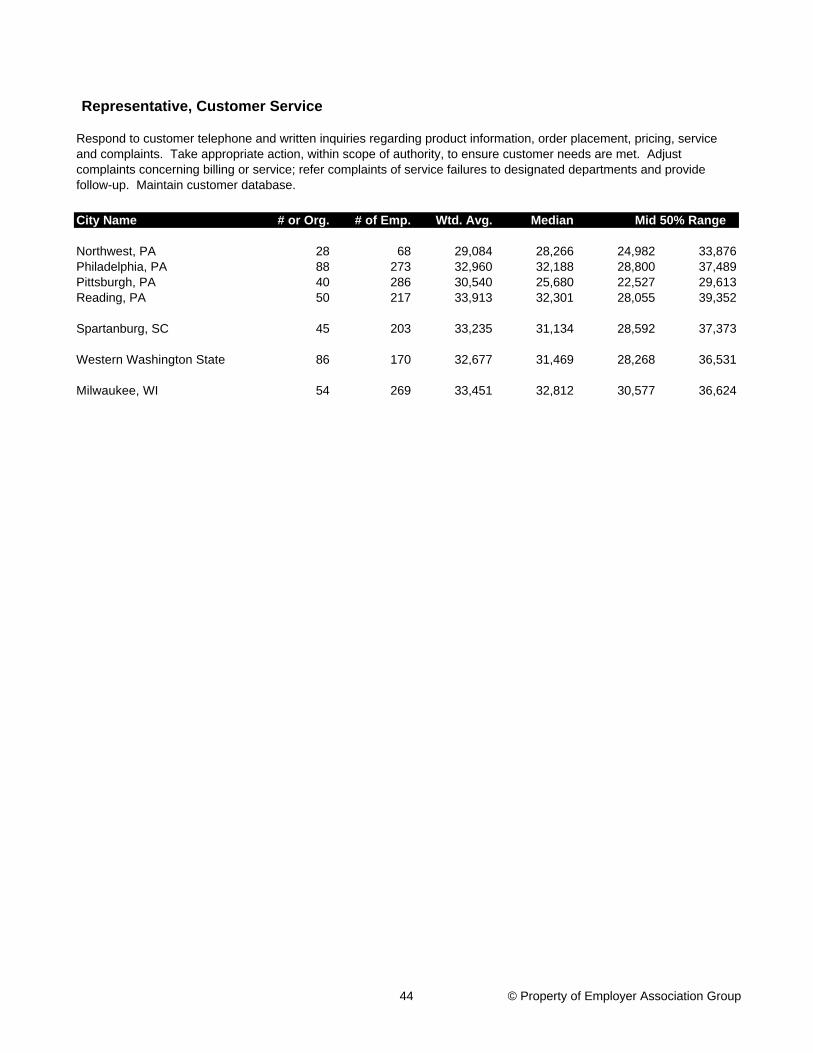
Respond to customer telephone and written inquiries regarding product information, order placement, pricing, service and complaints. Take appropriate action, within scope of authority, to ensure customer needs are met. Adjust complaints concerning billing or service; refer complaints of service failures to designated departments and provide follow-up. Maintain customer database.
Representative, Customer Service
43 © Property of Employer Association Group
City Name # or Org. # of Emp. Wtd. Avg. Median Mid 50% Range
Respond to customer telephone and written inquiries regarding product information, order placement, pricing, service and complaints. Take appropriate action, within scope of authority, to ensure customer needs are met. Adjust complaints concerning billing or service; refer complaints of service failures to designated departments and provide follow-up. Maintain customer database.
Representative, Customer Service
Northwest, PA 28 68 29,084 28,266 24,982 33,876Philadelphia, PA 88 273 32,960 32,188 28,800 37,489Pittsburgh, PA 40 286 30,540 25,680 22,527 29,613Reading, PA 50 217 33,913 32,301 28,055 39,352
Spartanburg, SC 45 203 33,235 31,134 28,592 37,373
Western Washington State 86 170 32,677 31,469 28,268 36,531
Milwaukee, WI 54 269 33,451 32,812 30,577 36,624
44 © Property of Employer Association Group
City Name # or Org. # of Emp. Wtd. Avg. Median
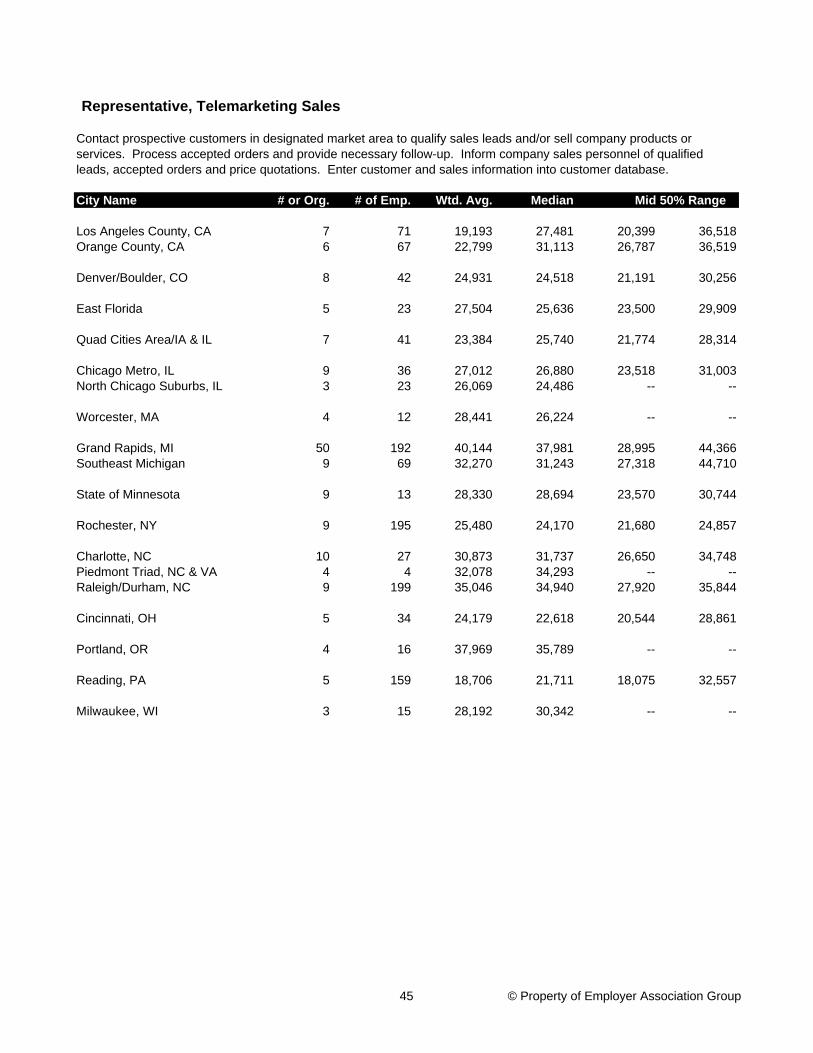
Los Angeles County, CA 7 71 19,193 27,481 20,399 36,518Orange County, CA 6 67 22,799 31,113 26,787 36,519
Denver/Boulder, CO 8 42 24,931 24,518 21,191 30,256
East Florida 5 23 27,504 25,636 23,500 29,909
Quad Cities Area/IA & IL 7 41 23,384 25,740 21,774 28,314
Chicago Metro, IL 9 36 27,012 26,880 23,518 31,003North Chicago Suburbs, IL 3 23 26,069 24,486 -- --
Worcester, MA 4 12 28,441 26,224 -- --
Grand Rapids, MI 50 192 40,144 37,981 28,995 44,366Southeast Michigan 9 69 32,270 31,243 27,318 44,710
State of Minnesota 9 13 28,330 28,694 23,570 30,744
Rochester, NY 9 195 25,480 24,170 21,680 24,857
Charlotte, NC 10 27 30,873 31,737 26,650 34,748Piedmont Triad, NC & VA 4 4 32,078 34,293 -- --Raleigh/Durham, NC 9 199 35,046 34,940 27,920 35,844
Cincinnati, OH 5 34 24,179 22,618 20,544 28,861
Portland, OR 4 16 37,969 35,789 -- --
Reading, PA 5 159 18,706 21,711 18,075 32,557
Milwaukee, WI 3 15 28,192 30,342 -- --
Mid 50% Range
Representative, Telemarketing Sales
Contact prospective customers in designated market area to qualify sales leads and/or sell company products or services. Process accepted orders and provide necessary follow-up. Inform company sales personnel of qualified leads, accepted orders and price quotations. Enter customer and sales information into customer database.
45 © Property of Employer Association Group
City Name # or Org. # of Emp. Wtd. Avg. Median
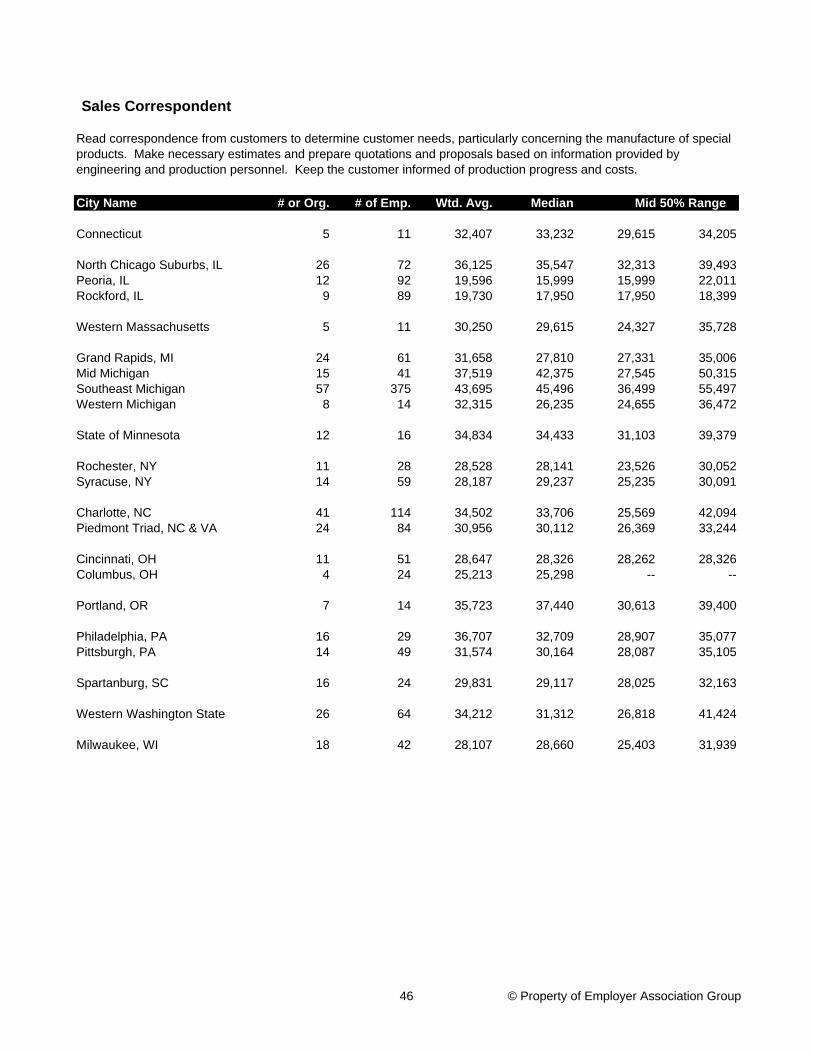
Connecticut 5 11 32,407 33,232 29,615 34,205
North Chicago Suburbs, IL 26 72 36,125 35,547 32,313 39,493Peoria, IL 12 92 19,596 15,999 15,999 22,011Rockford, IL 9 89 19,730 17,950 17,950 18,399
Western Massachusetts 5 11 30,250 29,615 24,327 35,728
Grand Rapids, MI 24 61 31,658 27,810 27,331 35,006Mid Michigan 15 41 37,519 42,375 27,545 50,315Southeast Michigan 57 375 43,695 45,496 36,499 55,497Western Michigan 8 14 32,315 26,235 24,655 36,472
State of Minnesota 12 16 34,834 34,433 31,103 39,379
Rochester, NY 11 28 28,528 28,141 23,526 30,052Syracuse, NY 14 59 28,187 29,237 25,235 30,091
Charlotte, NC 41 114 34,502 33,706 25,569 42,094Piedmont Triad, NC & VA 24 84 30,956 30,112 26,369 33,244
Cincinnati, OH 11 51 28,647 28,326 28,262 28,326Columbus, OH 4 24 25,213 25,298 -- --
Portland, OR 7 14 35,723 37,440 30,613 39,400
Philadelphia, PA 16 29 36,707 32,709 28,907 35,077Pittsburgh, PA 14 49 31,574 30,164 28,087 35,105
Spartanburg, SC 16 24 29,831 29,117 28,025 32,163
Western Washington State 26 64 34,212 31,312 26,818 41,424
Milwaukee, WI 18 42 28,107 28,660 25,403 31,939
Mid 50% Range
Sales Correspondent
Read correspondence from customers to determine customer needs, particularly concerning the manufacture of special products. Make necessary estimates and prepare quotations and proposals based on information provided by engineering and production personnel. Keep the customer informed of production progress and costs.
46 © Property of Employer Association Group
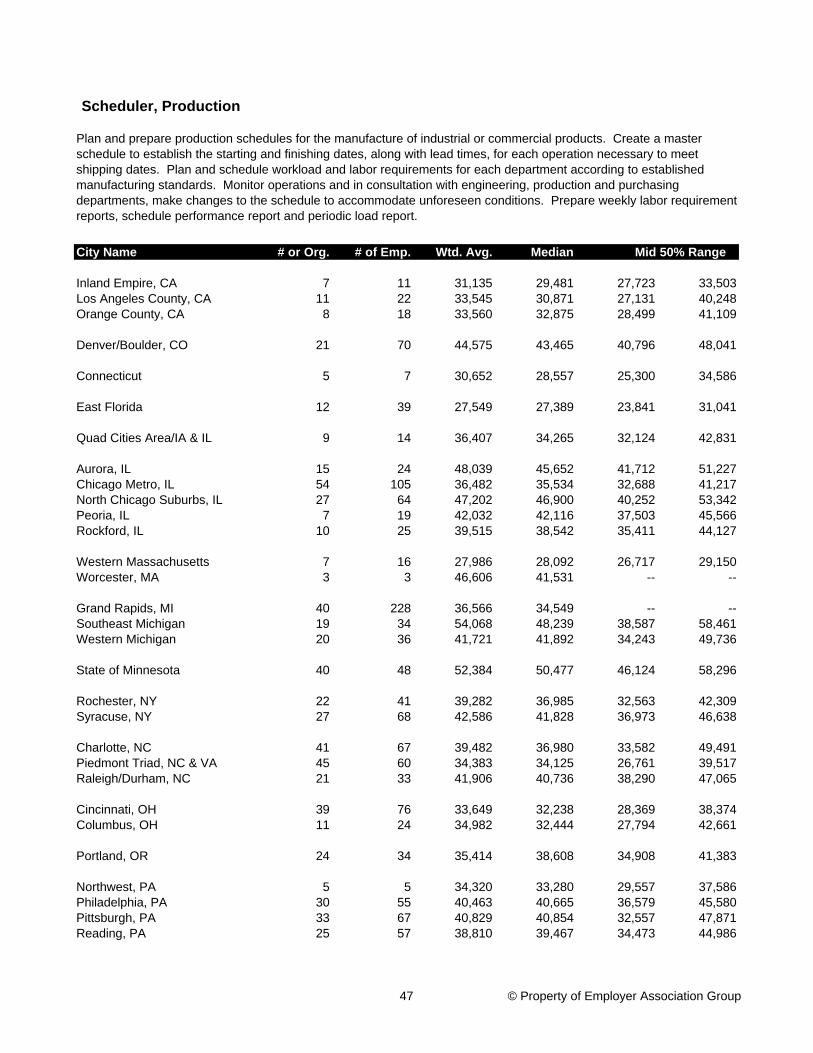
City Name # or Org. # of Emp. Wtd. Avg. Median
Inland Empire, CA 7 11 31,135 29,481 27,723 33,503Los Angeles County, CA 11 22 33,545 30,871 27,131 40,248Orange County, CA 8 18 33,560 32,875 28,499 41,109
Denver/Boulder, CO 21 70 44,575 43,465 40,796 48,041
Connecticut 5 7 30,652 28,557 25,300 34,586
East Florida 12 39 27,549 27,389 23,841 31,041
Quad Cities Area/IA & IL 9 14 36,407 34,265 32,124 42,831
Aurora, IL 15 24 48,039 45,652 41,712 51,227Chicago Metro, IL 54 105 36,482 35,534 32,688 41,217North Chicago Suburbs, IL 27 64 47,202 46,900 40,252 53,342Peoria, IL 7 19 42,032 42,116 37,503 45,566Rockford, IL 10 25 39,515 38,542 35,411 44,127
Western Massachusetts 7 16 27,986 28,092 26,717 29,150Worcester, MA 3 3 46,606 41,531 -- --
Grand Rapids, MI 40 228 36,566 34,549 -- --Southeast Michigan 19 34 54,068 48,239 38,587 58,461Western Michigan 20 36 41,721 41,892 34,243 49,736
State of Minnesota 40 48 52,384 50,477 46,124 58,296
Rochester, NY 22 41 39,282 36,985 32,563 42,309Syracuse, NY 27 68 42,586 41,828 36,973 46,638
Charlotte, NC 41 67 39,482 36,980 33,582 49,491Piedmont Triad, NC & VA 45 60 34,383 34,125 26,761 39,517Raleigh/Durham, NC 21 33 41,906 40,736 38,290 47,065
Cincinnati, OH 39 76 33,649 32,238 28,369 38,374Columbus, OH 11 24 34,982 32,444 27,794 42,661
Portland, OR 24 34 35,414 38,608 34,908 41,383
Northwest, PA 5 5 34,320 33,280 29,557 37,586Philadelphia, PA 30 55 40,463 40,665 36,579 45,580Pittsburgh, PA 33 67 40,829 40,854 32,557 47,871Reading, PA 25 57 38,810 39,467 34,473 44,986
Mid 50% Range
Scheduler, Production
Plan and prepare production schedules for the manufacture of industrial or commercial products. Create a master schedule to establish the starting and finishing dates, along with lead times, for each operation necessary to meet shipping dates. Plan and schedule workload and labor requirements for each department according to established manufacturing standards. Monitor operations and in consultation with engineering, production and purchasing departments, make changes to the schedule to accommodate unforeseen conditions. Prepare weekly labor requirement reports, schedule performance report and periodic load report.
47 © Property of Employer Association Group
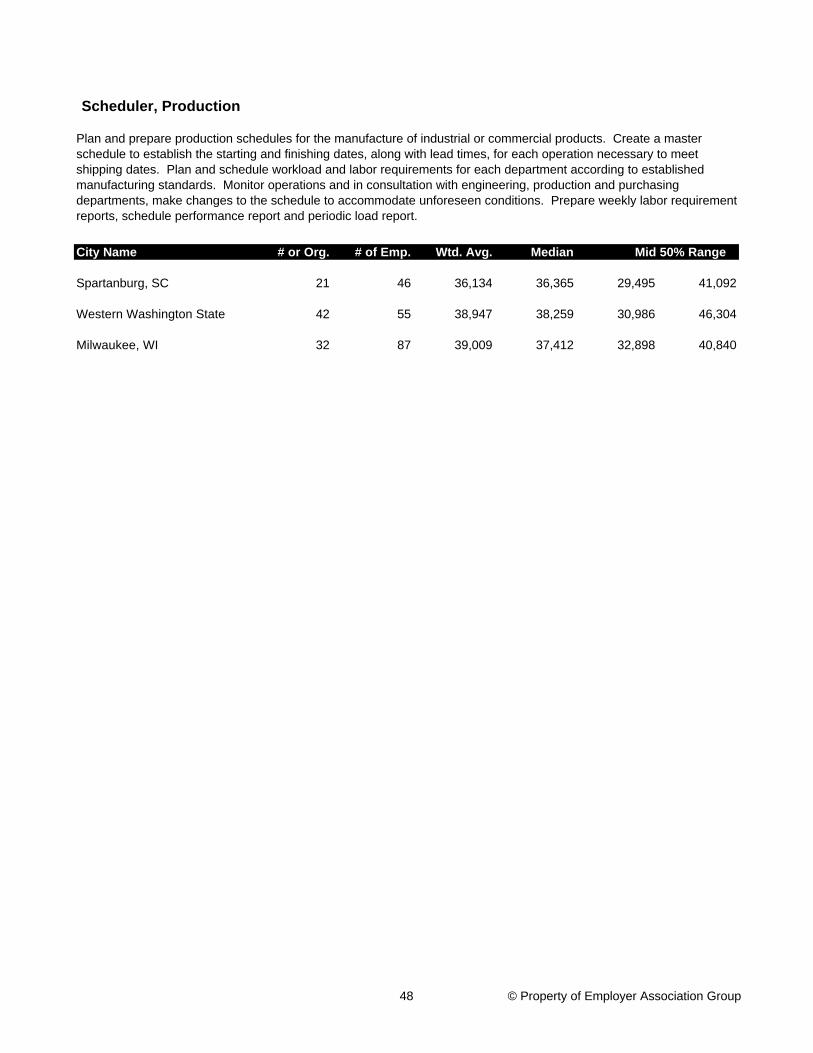
City Name # or Org. # of Emp. Wtd. Avg. Median Mid 50% Range
Scheduler, Production
Plan and prepare production schedules for the manufacture of industrial or commercial products. Create a master schedule to establish the starting and finishing dates, along with lead times, for each operation necessary to meet shipping dates. Plan and schedule workload and labor requirements for each department according to established manufacturing standards. Monitor operations and in consultation with engineering, production and purchasing departments, make changes to the schedule to accommodate unforeseen conditions. Prepare weekly labor requirement reports, schedule performance report and periodic load report.
Spartanburg, SC 21 46 36,134 36,365 29,495 41,092
Western Washington State 42 55 38,947 38,259 30,986 46,304
Milwaukee, WI 32 87 39,009 37,412 32,898 40,840
48 © Property of Employer Association Group

City Name # or Org. # of Emp. Wtd. Avg. Median
Los Angeles County, CA 6 29 29,609 29,161 25,219 31,328
Denver/Boulder, CO 86 972 30,459 30,440 27,632 32,656
Connecticut 15 23 31,392 32,302 29,150 34,142
East Florida 49 956 27,482 27,377 23,884 30,614North Florida 4 9 25,528 25,513 -- --South Florida 4 10 26,805 27,200 -- --West Florida 9 158 28,551 28,858 26,463 30,995
Aurora, IL 22 155 29,808 30,142 25,750 32,865Chicago Metro, IL 88 226 31,990 32,019 28,963 34,786North Chicago Suburbs, IL 23 114 34,336 36,153 32,826 36,153Peoria, IL 12 256 21,783 21,679 20,040 21,679Rockford, IL 8 18 25,920 25,110 23,128 28,487
Western Massachusetts 24 143 29,213 30,969 26,548 30,969Worcester, MA 7 16 28,761 28,953 26,224 31,682
Mid Michigan 35 215 27,900 26,127 20,126 30,559Southeast Michigan 43 340 30,776 29,637 26,884 34,833Western Michigan 7 17 26,540 26,941 25,603 28,869
State of Minnesota 105 419 27,030 26,659 24,513 29,193
Rochester, NY 55 433 26,660 25,608 22,303 28,227Syracuse, NY 10 21 27,307 26,463 24,427 29,750
Charlotte, NC 62 376 28,117 27,728 26,943 29,305Piedmont Triad, NC & VA 31 55 27,143 27,264 22,669 30,799Raleigh/Durham, NC 64 342 32,600 31,270 28,771 33,982
Cincinnati, OH 26 250 31,212 33,243 27,984 33,243Cleveland/Akron, OH 21 33 24,563 24,514 22,441 25,646Columbus, OH 6 9 24,061 23,549 20,904 26,108Toledo, OH 16 27 23,179 21,381 20,347 25,064
Portland, OR 11 64 31,340 29,732 27,794 31,605
Northwest, PA 10 52 23,317 22,651 20,800 26,728Pittsburgh, PA 23 371 25,523 24,360 21,355 27,814Reading, PA 49 241 29,372 27,601 24,599 34,095
Spartanburg, SC 19 58 25,966 26,890 23,067 28,508
Mid 50% Range
Secretary, Lower Level
Take dictation in shorthand or by machine and transcribe notes on computer. Compose and type routine correspondence. Organize and maintains file system. Coordinate manager's schedule, make appointments, arrange travel schedules, reservations and conference calls. Greet visitors; answer and screen manager's calls.
49 © Property of Employer Association Group
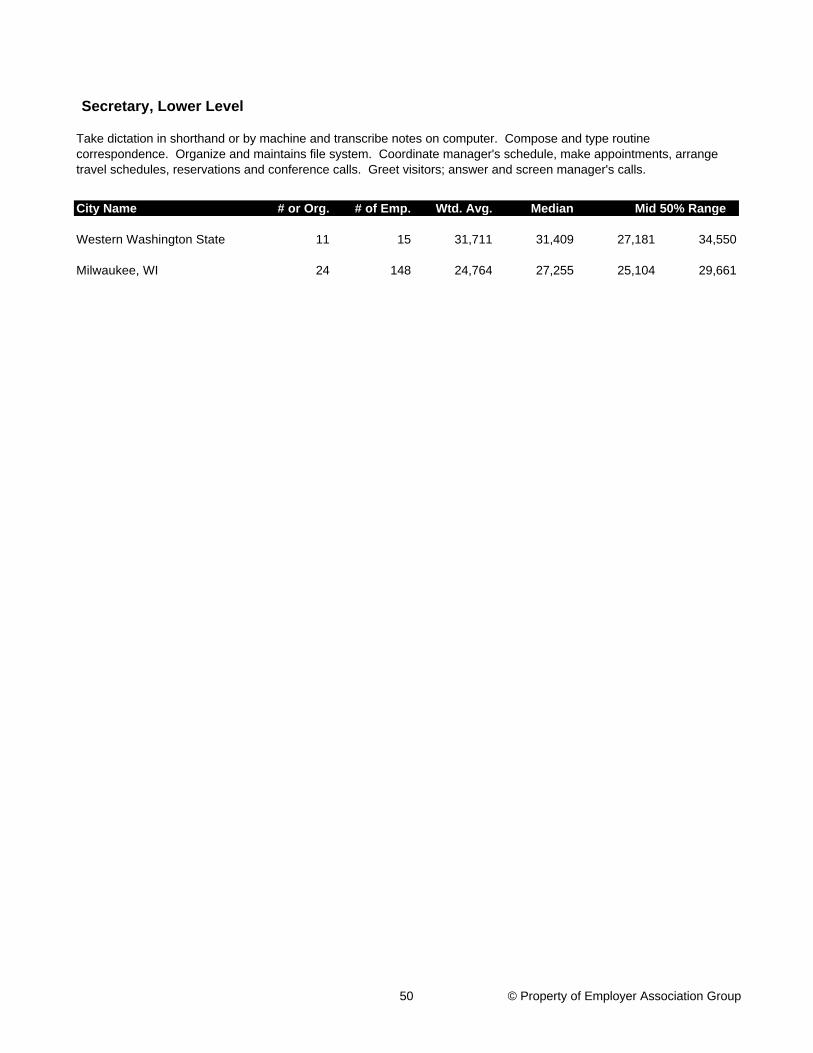
City Name # or Org. # of Emp. Wtd. Avg. Median Mid 50% Range
Secretary, Lower Level
Take dictation in shorthand or by machine and transcribe notes on computer. Compose and type routine correspondence. Organize and maintains file system. Coordinate manager's schedule, make appointments, arrange travel schedules, reservations and conference calls. Greet visitors; answer and screen manager's calls.
Western Washington State 11 15 31,711 31,409 27,181 34,550
Milwaukee, WI 24 148 24,764 27,255 25,104 29,661
50 © Property of Employer Association Group
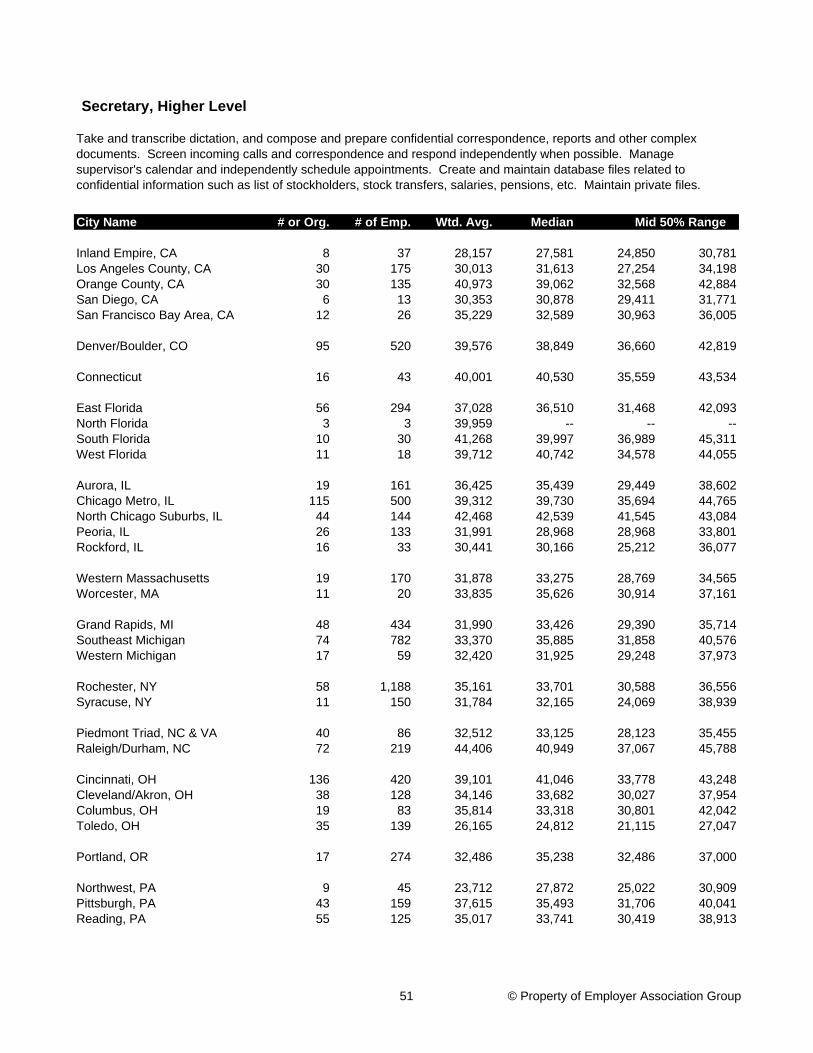
City Name # or Org. # of Emp. Wtd. Avg. Median
Inland Empire, CA 8 37 28,157 27,581 24,850 30,781Los Angeles County, CA 30 175 30,013 31,613 27,254 34,198Orange County, CA 30 135 40,973 39,062 32,568 42,884San Diego, CA 6 13 30,353 30,878 29,411 31,771San Francisco Bay Area, CA 12 26 35,229 32,589 30,963 36,005
Denver/Boulder, CO 95 520 39,576 38,849 36,660 42,819
Connecticut 16 43 40,001 40,530 35,559 43,534
East Florida 56 294 37,028 36,510 31,468 42,093North Florida 3 3 39,959 -- -- --South Florida 10 30 41,268 39,997 36,989 45,311West Florida 11 18 39,712 40,742 34,578 44,055
Aurora, IL 19 161 36,425 35,439 29,449 38,602Chicago Metro, IL 115 500 39,312 39,730 35,694 44,765North Chicago Suburbs, IL 44 144 42,468 42,539 41,545 43,084Peoria, IL 26 133 31,991 28,968 28,968 33,801Rockford, IL 16 33 30,441 30,166 25,212 36,077
Western Massachusetts 19 170 31,878 33,275 28,769 34,565Worcester, MA 11 20 33,835 35,626 30,914 37,161
Grand Rapids, MI 48 434 31,990 33,426 29,390 35,714Southeast Michigan 74 782 33,370 35,885 31,858 40,576Western Michigan 17 59 32,420 31,925 29,248 37,973
Rochester, NY 58 1,188 35,161 33,701 30,588 36,556Syracuse, NY 11 150 31,784 32,165 24,069 38,939
Piedmont Triad, NC & VA 40 86 32,512 33,125 28,123 35,455Raleigh/Durham, NC 72 219 44,406 40,949 37,067 45,788
Cincinnati, OH 136 420 39,101 41,046 33,778 43,248Cleveland/Akron, OH 38 128 34,146 33,682 30,027 37,954Columbus, OH 19 83 35,814 33,318 30,801 42,042Toledo, OH 35 139 26,165 24,812 21,115 27,047
Portland, OR 17 274 32,486 35,238 32,486 37,000
Northwest, PA 9 45 23,712 27,872 25,022 30,909Pittsburgh, PA 43 159 37,615 35,493 31,706 40,041Reading, PA 55 125 35,017 33,741 30,419 38,913
Secretary, Higher Level
Take and transcribe dictation, and compose and prepare confidential correspondence, reports and other complex documents. Screen incoming calls and correspondence and respond independently when possible. Manage supervisor's calendar and independently schedule appointments. Create and maintain database files related to confidential information such as list of stockholders, stock transfers, salaries, pensions, etc. Maintain private files.
Mid 50% Range
51 © Property of Employer Association Group
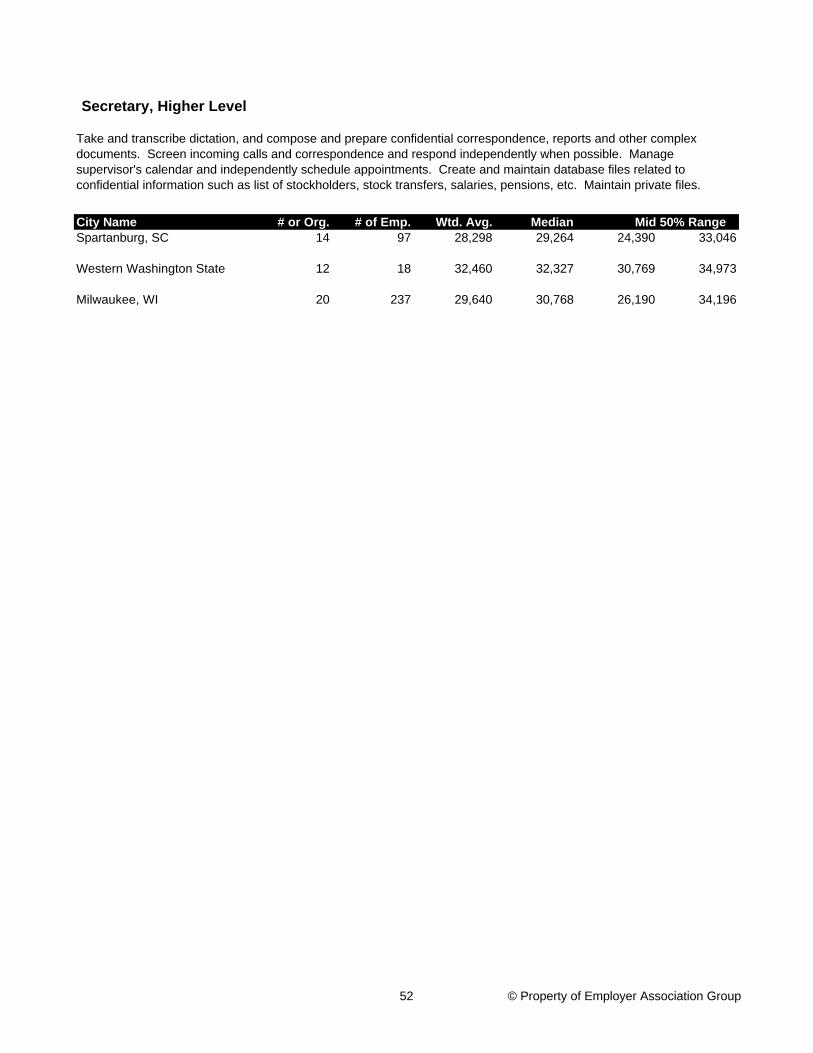
City Name # or Org. # of Emp. Wtd. Avg. Median
Secretary, Higher Level
Take and transcribe dictation, and compose and prepare confidential correspondence, reports and other complex documents. Screen incoming calls and correspondence and respond independently when possible. Manage supervisor's calendar and independently schedule appointments. Create and maintain database files related to confidential information such as list of stockholders, stock transfers, salaries, pensions, etc. Maintain private files.
Mid 50% Range Spartanburg, SC 14 97 28,298 29,264 24,390 33,046
Western Washington State 12 18 32,460 32,327 30,769 34,973
Milwaukee, WI 20 237 29,640 30,768 26,190 34,196
52 © Property of Employer Association Group
MANAGERIAL AND PROFESSIONAL POSITIONS
53 © Property of Employer Association Group

(This Page is left blank.)
54 © Property of Employer Association Group
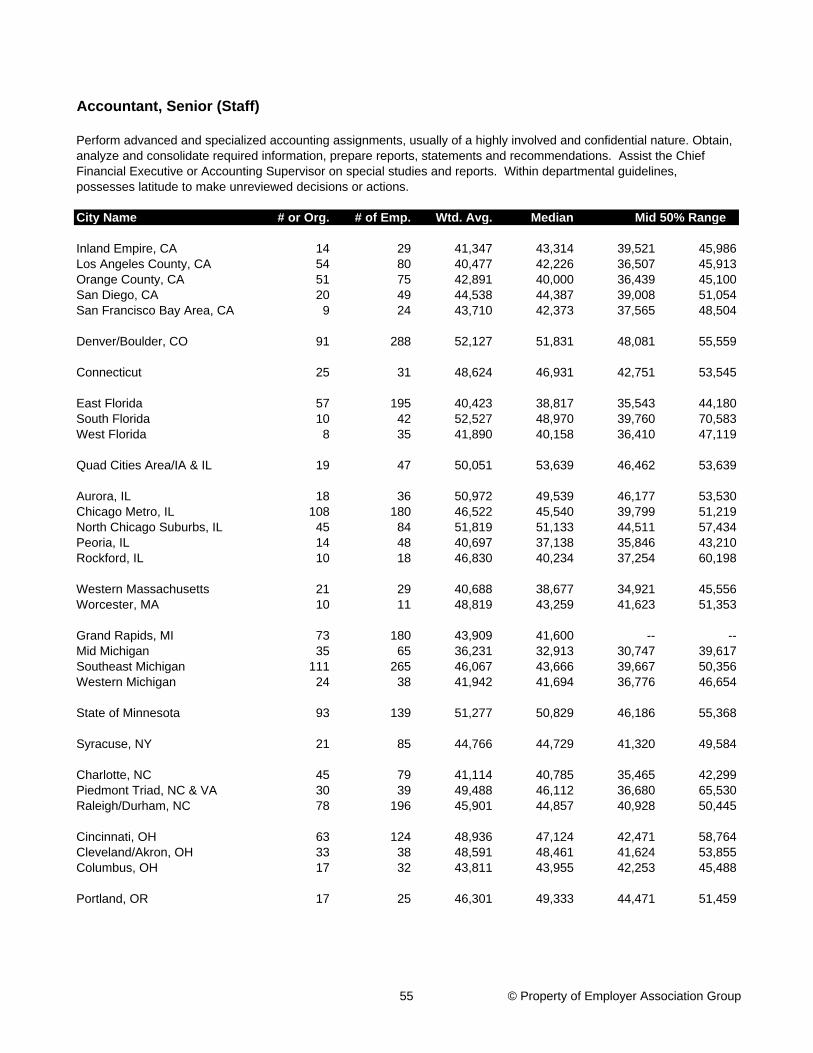
City Name # or Org. # of Emp. Wtd. Avg. Median
Inland Empire, CA 14 29 41,347 43,314 39,521 45,986Los Angeles County, CA 54 80 40,477 42,226 36,507 45,913Orange County, CA 51 75 42,891 40,000 36,439 45,100San Diego, CA 20 49 44,538 44,387 39,008 51,054San Francisco Bay Area, CA 9 24 43,710 42,373 37,565 48,504
Denver/Boulder, CO 91 288 52,127 51,831 48,081 55,559
Connecticut 25 31 48,624 46,931 42,751 53,545
East Florida 57 195 40,423 38,817 35,543 44,180South Florida 10 42 52,527 48,970 39,760 70,583West Florida 8 35 41,890 40,158 36,410 47,119
Quad Cities Area/IA & IL 19 47 50,051 53,639 46,462 53,639
Aurora, IL 18 36 50,972 49,539 46,177 53,530Chicago Metro, IL 108 180 46,522 45,540 39,799 51,219North Chicago Suburbs, IL 45 84 51,819 51,133 44,511 57,434Peoria, IL 14 48 40,697 37,138 35,846 43,210Rockford, IL 10 18 46,830 40,234 37,254 60,198
Western Massachusetts 21 29 40,688 38,677 34,921 45,556Worcester, MA 10 11 48,819 43,259 41,623 51,353
Grand Rapids, MI 73 180 43,909 41,600 -- --Mid Michigan 35 65 36,231 32,913 30,747 39,617Southeast Michigan 111 265 46,067 43,666 39,667 50,356Western Michigan 24 38 41,942 41,694 36,776 46,654
State of Minnesota 93 139 51,277 50,829 46,186 55,368
Syracuse, NY 21 85 44,766 44,729 41,320 49,584
Charlotte, NC 45 79 41,114 40,785 35,465 42,299Piedmont Triad, NC & VA 30 39 49,488 46,112 36,680 65,530Raleigh/Durham, NC 78 196 45,901 44,857 40,928 50,445
Cincinnati, OH 63 124 48,936 47,124 42,471 58,764Cleveland/Akron, OH 33 38 48,591 48,461 41,624 53,855Columbus, OH 17 32 43,811 43,955 42,253 45,488
Portland, OR 17 25 46,301 49,333 44,471 51,459
Accountant, Senior (Staff)
Mid 50% Range
Perform advanced and specialized accounting assignments, usually of a highly involved and confidential nature. Obtain, analyze and consolidate required information, prepare reports, statements and recommendations. Assist the Chief Financial Executive or Accounting Supervisor on special studies and reports. Within departmental guidelines, possesses latitude to make unreviewed decisions or actions.
55 © Property of Employer Association Group
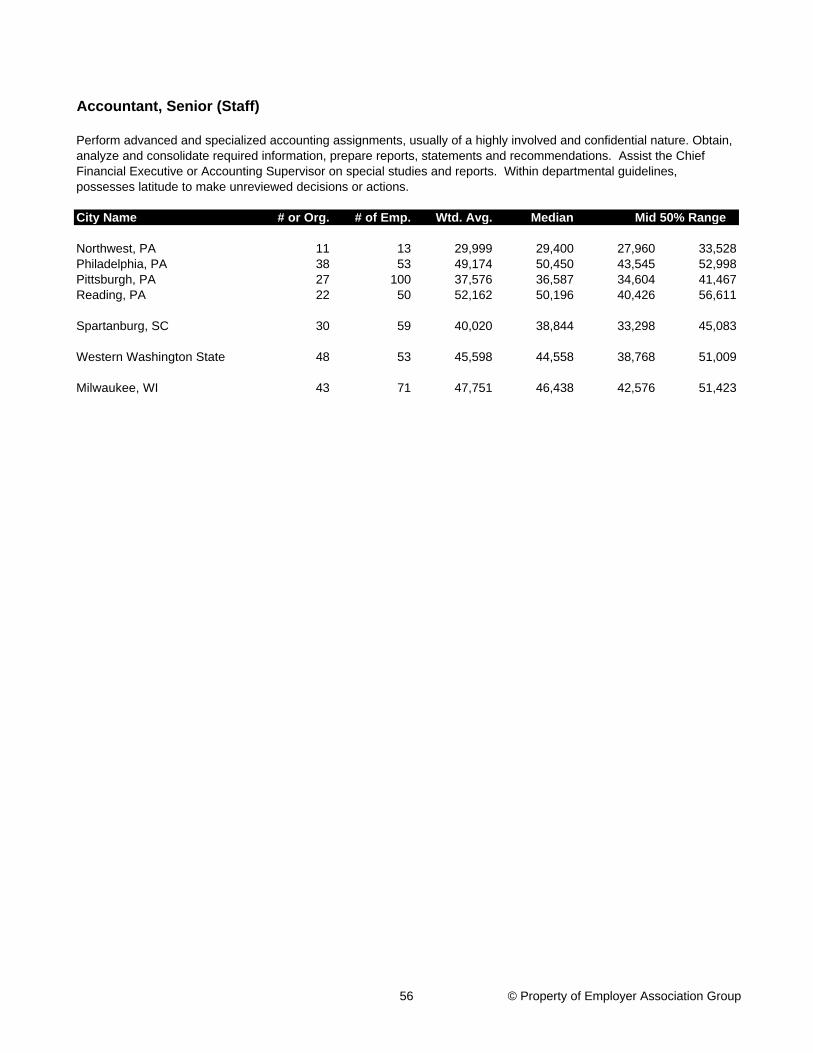
City Name # or Org. # of Emp. Wtd. Avg. Median
Accountant, Senior (Staff)
Mid 50% Range
Perform advanced and specialized accounting assignments, usually of a highly involved and confidential nature. Obtain, analyze and consolidate required information, prepare reports, statements and recommendations. Assist the Chief Financial Executive or Accounting Supervisor on special studies and reports. Within departmental guidelines, possesses latitude to make unreviewed decisions or actions.
Northwest, PA 11 13 29,999 29,400 27,960 33,528Philadelphia, PA 38 53 49,174 50,450 43,545 52,998Pittsburgh, PA 27 100 37,576 36,587 34,604 41,467Reading, PA 22 50 52,162 50,196 40,426 56,611
Spartanburg, SC 30 59 40,020 38,844 33,298 45,083
Western Washington State 48 53 45,598 44,558 38,768 51,009
Milwaukee, WI 43 71 47,751 46,438 42,576 51,423
56 © Property of Employer Association Group

City Name # or Org. # of Emp. Wtd. Avg. Median
Inland Empire, CA 8 10 66,857 56,377 50,206 73,730Los Angeles County, CA 37 42 65,022 68,059 60,745 76,185Orange County, CA 51 60 68,959 65,000 59,208 69,850San Diego, CA 21 21 64,565 63,995 56,129 69,989San Francisco Bay Area, CA 9 9 74,435 70,949 64,960 83,230
Denver/Boulder, CO 47 135 64,148 66,469 57,516 68,345
Connecticut 24 36 68,042 66,508 61,058 76,296
East Florida 47 70 60,854 58,541 52,141 68,559North Florida 5 5 59,824 54,539 46,836 76,095South Florida 8 15 66,542 61,661 58,990 71,939West Florida 5 14 57,783 55,134 50,128 57,722
Quad Cities Area/IA & IL 10 15 64,043 70,713 56,787 71,543
Aurora, IL 18 20 67,642 66,509 54,179 76,098Chicago Metro, IL 101 134 69,278 71,413 58,156 79,623North Chicago Suburbs, IL 54 69 68,259 68,443 59,519 76,766Peoria, IL 18 30 56,718 54,983 49,048 61,016Rockford, IL 4 4 47,605 45,714 -- --
Western Massachusetts 32 51 55,079 54,339 44,180 61,058Worcester, MA 24 25 63,148 62,090 52,890 69,495
Grand Rapids, MI 38 79 52,021 54,080 47,237 54,080Mid Michigan 26 43 63,176 50,114 43,278 70,617Southeast Michigan 100 165 70,067 66,176 56,999 75,068Western Michigan 23 35 55,109 55,721 46,611 63,293
State of Minnesota 162 193 63,473 64,700 55,653 71,155
Rochester, NY 68 79 55,780 51,600 45,158 62,436Syracuse, NY 24 30 61,223 59,079 51,381 67,145
Charlotte, NC 83 114 61,157 59,240 51,660 70,525Piedmont Triad, NC & VA 50 54 57,353 52,558 45,877 65,274Raleigh/Durham, NC 27 43 76,502 72,916 65,475 81,414
Cincinnati, OH 60 80 61,341 59,282 50,085 69,107Cleveland/Akron, OH 59 63 57,513 53,795 47,448 64,422Columbus, OH 19 22 57,047 58,010 46,142 65,370Toledo, OH 48 69 48,983 49,007 38,260 52,511
Portland, OR 21 23 47,543 49,120 41,136 50,824
Accounting Manager
Mid 50% Range
General responsibility for managing the accounting procedures of the organization. Assign and audit work of accountants, accounting clerks, etc., engaged in the procedure. Engage in the more critical and confidential aspects of accounting. Responsible for the development of policies, systems, special financial studies, etc. Exercise all normal supervisory functions. Under general direction as to facts and reports, general policies.
57 © Property of Employer Association Group
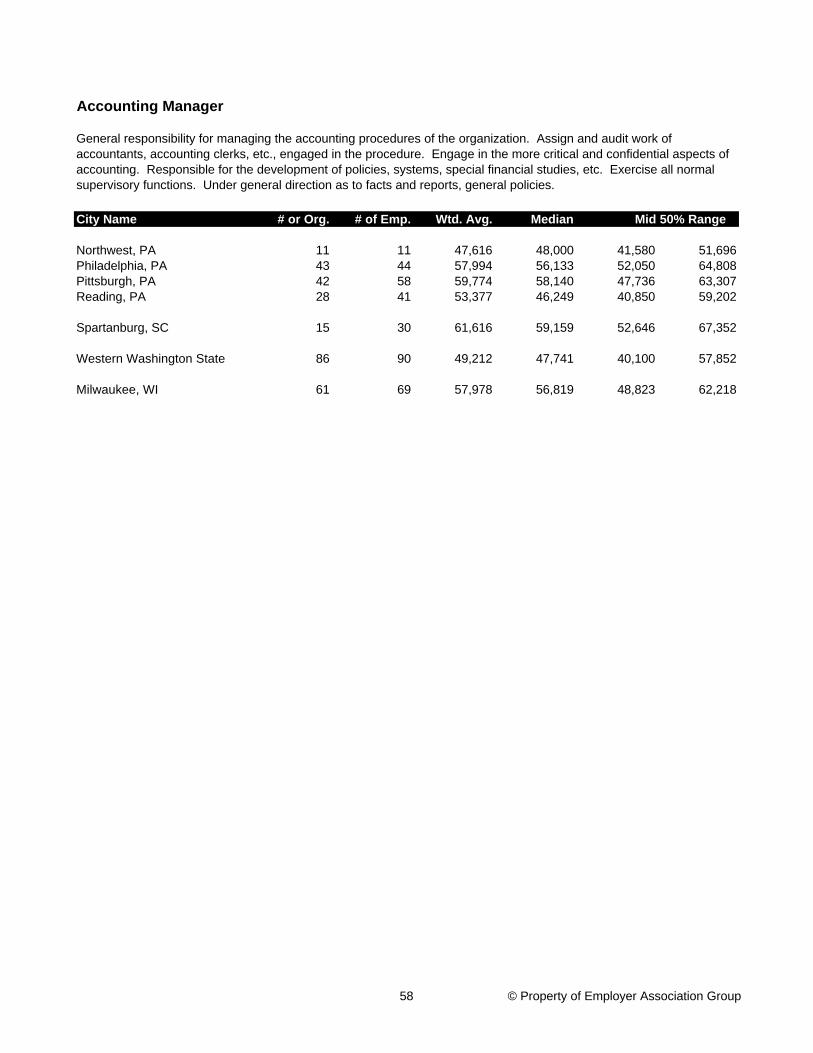
City Name # or Org. # of Emp. Wtd. Avg. Median
Accounting Manager
Mid 50% Range
General responsibility for managing the accounting procedures of the organization. Assign and audit work of accountants, accounting clerks, etc., engaged in the procedure. Engage in the more critical and confidential aspects of accounting. Responsible for the development of policies, systems, special financial studies, etc. Exercise all normal supervisory functions. Under general direction as to facts and reports, general policies.
Northwest, PA 11 11 47,616 48,000 41,580 51,696Philadelphia, PA 43 44 57,994 56,133 52,050 64,808Pittsburgh, PA 42 58 59,774 58,140 47,736 63,307Reading, PA 28 41 53,377 46,249 40,850 59,202
Spartanburg, SC 15 30 61,616 59,159 52,646 67,352
Western Washington State 86 90 49,212 47,741 40,100 57,852
Milwaukee, WI 61 69 57,978 56,819 48,823 62,218
58 © Property of Employer Association Group
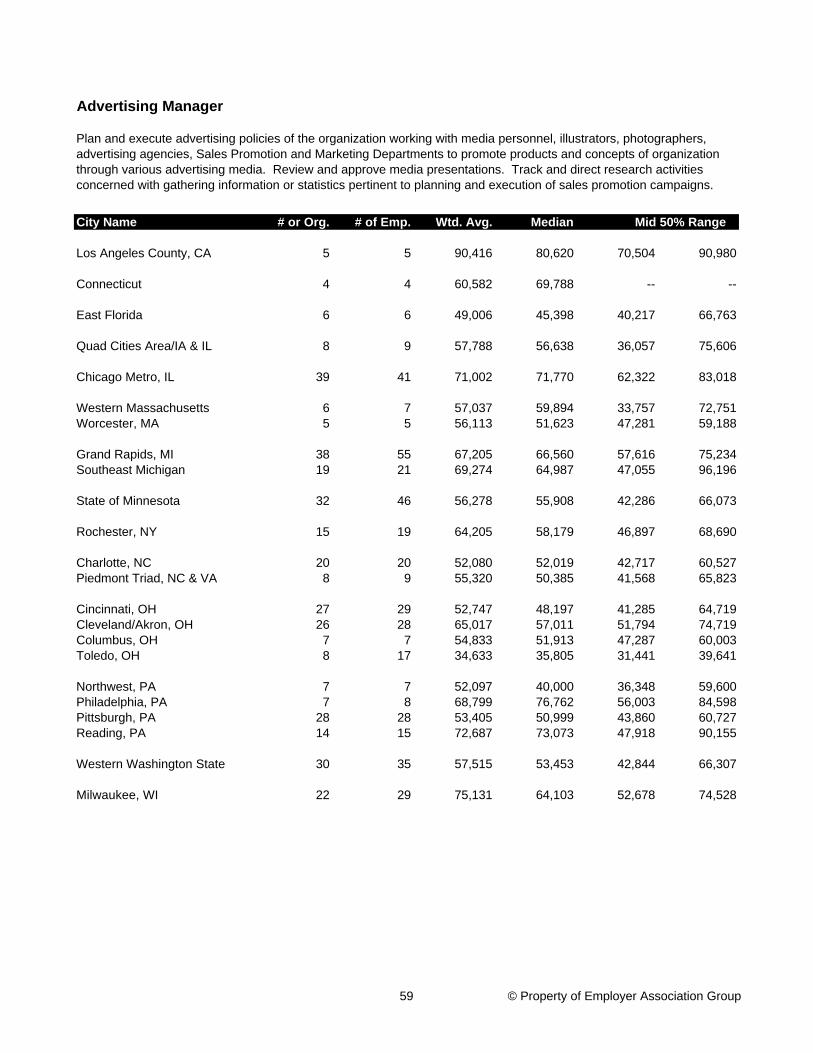
City Name # or Org. # of Emp. Wtd. Avg. Median
Los Angeles County, CA 5 5 90,416 80,620 70,504 90,980
Connecticut 4 4 60,582 69,788 -- --
East Florida 6 6 49,006 45,398 40,217 66,763
Quad Cities Area/IA & IL 8 9 57,788 56,638 36,057 75,606
Chicago Metro, IL 39 41 71,002 71,770 62,322 83,018
Western Massachusetts 6 7 57,037 59,894 33,757 72,751Worcester, MA 5 5 56,113 51,623 47,281 59,188
Grand Rapids, MI 38 55 67,205 66,560 57,616 75,234Southeast Michigan 19 21 69,274 64,987 47,055 96,196
State of Minnesota 32 46 56,278 55,908 42,286 66,073
Rochester, NY 15 19 64,205 58,179 46,897 68,690
Charlotte, NC 20 20 52,080 52,019 42,717 60,527Piedmont Triad, NC & VA 8 9 55,320 50,385 41,568 65,823
Cincinnati, OH 27 29 52,747 48,197 41,285 64,719Cleveland/Akron, OH 26 28 65,017 57,011 51,794 74,719Columbus, OH 7 7 54,833 51,913 47,287 60,003Toledo, OH 8 17 34,633 35,805 31,441 39,641
Northwest, PA 7 7 52,097 40,000 36,348 59,600Philadelphia, PA 7 8 68,799 76,762 56,003 84,598Pittsburgh, PA 28 28 53,405 50,999 43,860 60,727Reading, PA 14 15 72,687 73,073 47,918 90,155
Western Washington State 30 35 57,515 53,453 42,844 66,307
Milwaukee, WI 22 29 75,131 64,103 52,678 74,528
Advertising Manager
Mid 50% Range
Plan and execute advertising policies of the organization working with media personnel, illustrators, photographers, advertising agencies, Sales Promotion and Marketing Departments to promote products and concepts of organization through various advertising media. Review and approve media presentations. Track and direct research activities concerned with gathering information or statistics pertinent to planning and execution of sales promotion campaigns.
59 © Property of Employer Association Group
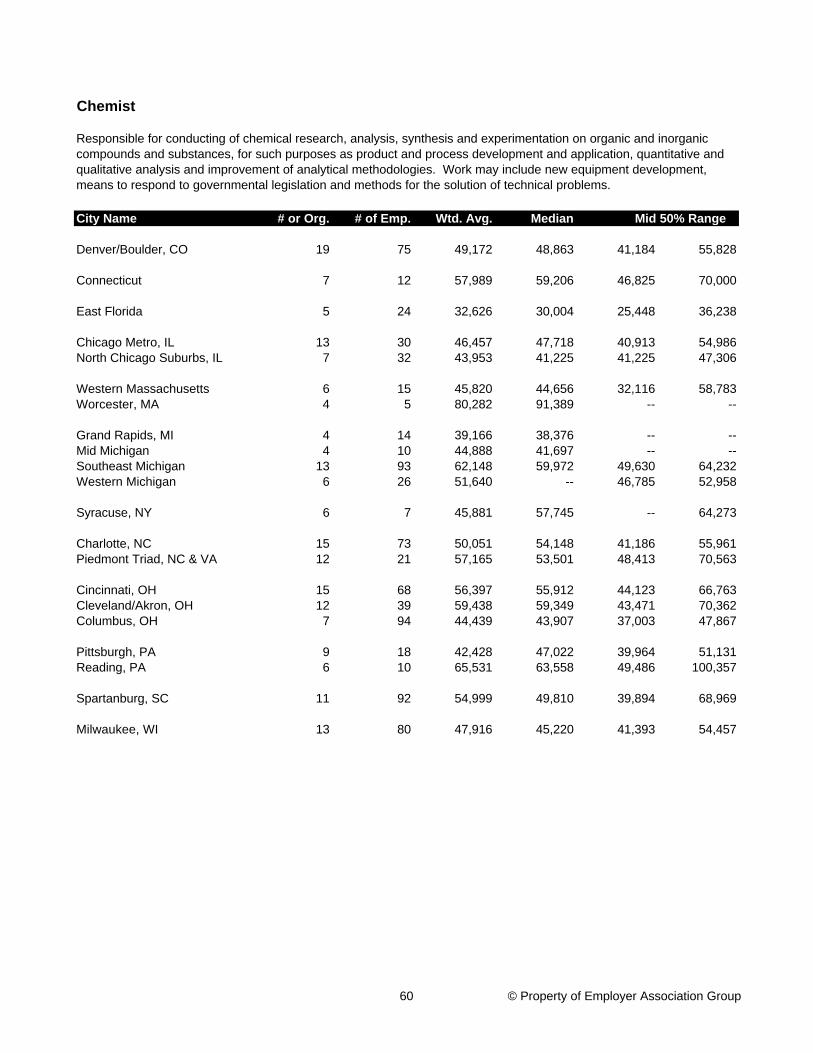
City Name # or Org. # of Emp. Wtd. Avg. Median
Denver/Boulder, CO 19 75 49,172 48,863 41,184 55,828
Connecticut 7 12 57,989 59,206 46,825 70,000
East Florida 5 24 32,626 30,004 25,448 36,238
Chicago Metro, IL 13 30 46,457 47,718 40,913 54,986North Chicago Suburbs, IL 7 32 43,953 41,225 41,225 47,306
Western Massachusetts 6 15 45,820 44,656 32,116 58,783Worcester, MA 4 5 80,282 91,389 -- --
Grand Rapids, MI 4 14 39,166 38,376 -- --Mid Michigan 4 10 44,888 41,697 -- --Southeast Michigan 13 93 62,148 59,972 49,630 64,232Western Michigan 6 26 51,640 -- 46,785 52,958
Syracuse, NY 6 7 45,881 57,745 -- 64,273
Charlotte, NC 15 73 50,051 54,148 41,186 55,961Piedmont Triad, NC & VA 12 21 57,165 53,501 48,413 70,563
Cincinnati, OH 15 68 56,397 55,912 44,123 66,763Cleveland/Akron, OH 12 39 59,438 59,349 43,471 70,362Columbus, OH 7 94 44,439 43,907 37,003 47,867
Pittsburgh, PA 9 18 42,428 47,022 39,964 51,131Reading, PA 6 10 65,531 63,558 49,486 100,357
Spartanburg, SC 11 92 54,999 49,810 39,894 68,969
Milwaukee, WI 13 80 47,916 45,220 41,393 54,457
Chemist
Mid 50% Range
Responsible for conducting of chemical research, analysis, synthesis and experimentation on organic and inorganic compounds and substances, for such purposes as product and process development and application, quantitative and qualitative analysis and improvement of analytical methodologies. Work may include new equipment development, means to respond to governmental legislation and methods for the solution of technical problems.
60 © Property of Employer Association Group
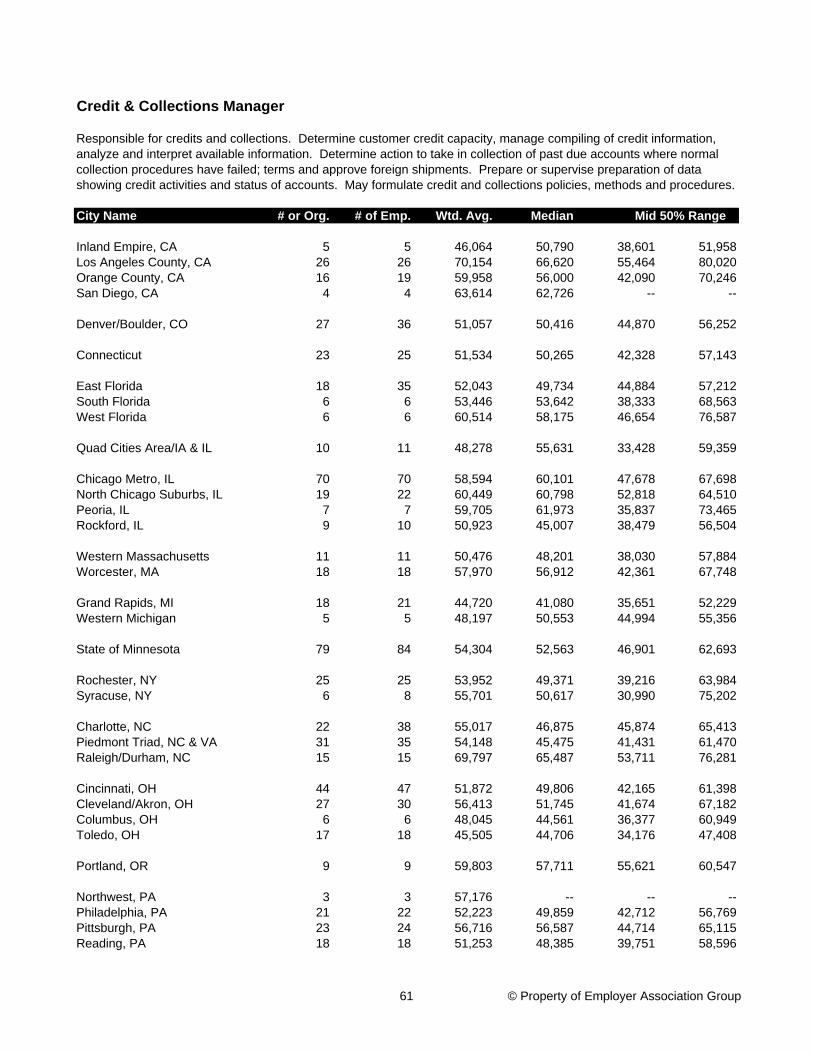
City Name # or Org. # of Emp. Wtd. Avg. Median
Inland Empire, CA 5 5 46,064 50,790 38,601 51,958Los Angeles County, CA 26 26 70,154 66,620 55,464 80,020Orange County, CA 16 19 59,958 56,000 42,090 70,246San Diego, CA 4 4 63,614 62,726 -- --
Denver/Boulder, CO 27 36 51,057 50,416 44,870 56,252
Connecticut 23 25 51,534 50,265 42,328 57,143
East Florida 18 35 52,043 49,734 44,884 57,212South Florida 6 6 53,446 53,642 38,333 68,563West Florida 6 6 60,514 58,175 46,654 76,587
Quad Cities Area/IA & IL 10 11 48,278 55,631 33,428 59,359
Chicago Metro, IL 70 70 58,594 60,101 47,678 67,698North Chicago Suburbs, IL 19 22 60,449 60,798 52,818 64,510Peoria, IL 7 7 59,705 61,973 35,837 73,465Rockford, IL 9 10 50,923 45,007 38,479 56,504
Western Massachusetts 11 11 50,476 48,201 38,030 57,884Worcester, MA 18 18 57,970 56,912 42,361 67,748
Grand Rapids, MI 18 21 44,720 41,080 35,651 52,229Western Michigan 5 5 48,197 50,553 44,994 55,356
State of Minnesota 79 84 54,304 52,563 46,901 62,693
Rochester, NY 25 25 53,952 49,371 39,216 63,984Syracuse, NY 6 8 55,701 50,617 30,990 75,202
Charlotte, NC 22 38 55,017 46,875 45,874 65,413Piedmont Triad, NC & VA 31 35 54,148 45,475 41,431 61,470Raleigh/Durham, NC 15 15 69,797 65,487 53,711 76,281
Cincinnati, OH 44 47 51,872 49,806 42,165 61,398Cleveland/Akron, OH 27 30 56,413 51,745 41,674 67,182Columbus, OH 6 6 48,045 44,561 36,377 60,949Toledo, OH 17 18 45,505 44,706 34,176 47,408
Portland, OR 9 9 59,803 57,711 55,621 60,547
Northwest, PA 3 3 57,176 -- -- --Philadelphia, PA 21 22 52,223 49,859 42,712 56,769Pittsburgh, PA 23 24 56,716 56,587 44,714 65,115Reading, PA 18 18 51,253 48,385 39,751 58,596
Credit & Collections Manager
Mid 50% Range
Responsible for credits and collections. Determine customer credit capacity, manage compiling of credit information, analyze and interpret available information. Determine action to take in collection of past due accounts where normal collection procedures have failed; terms and approve foreign shipments. Prepare or supervise preparation of data showing credit activities and status of accounts. May formulate credit and collections policies, methods and procedures.
61 © Property of Employer Association Group
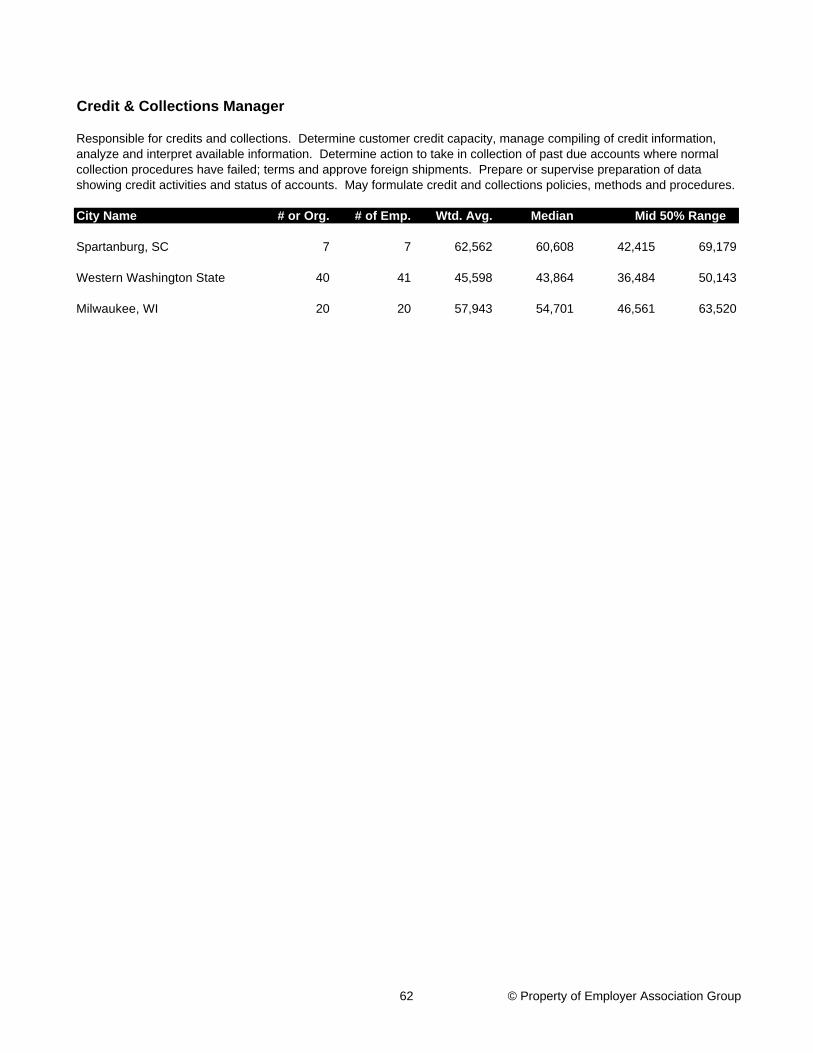
City Name # or Org. # of Emp. Wtd. Avg. Median
Credit & Collections Manager
Mid 50% Range
Responsible for credits and collections. Determine customer credit capacity, manage compiling of credit information, analyze and interpret available information. Determine action to take in collection of past due accounts where normal collection procedures have failed; terms and approve foreign shipments. Prepare or supervise preparation of data showing credit activities and status of accounts. May formulate credit and collections policies, methods and procedures.
Spartanburg, SC 7 7 62,562 60,608 42,415 69,179
Western Washington State 40 41 45,598 43,864 36,484 50,143
Milwaukee, WI 20 20 57,943 54,701 46,561 63,520
62 © Property of Employer Association Group
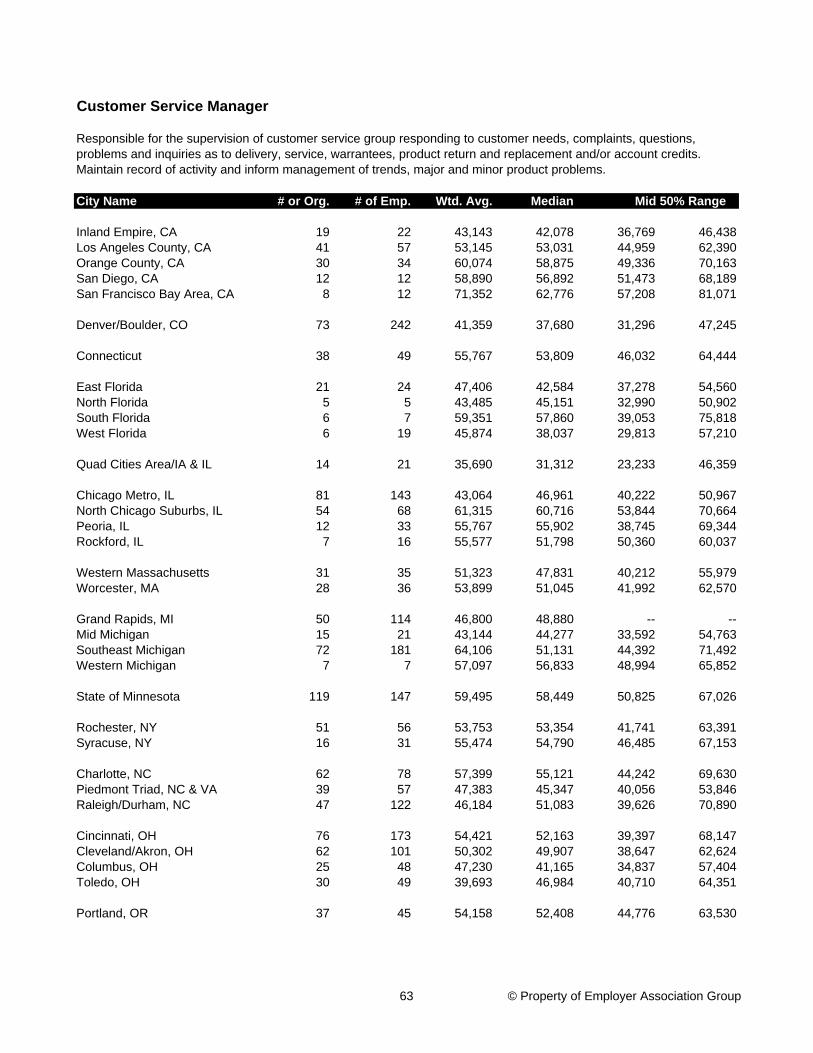
City Name # or Org. # of Emp. Wtd. Avg. Median
Inland Empire, CA 19 22 43,143 42,078 36,769 46,438Los Angeles County, CA 41 57 53,145 53,031 44,959 62,390Orange County, CA 30 34 60,074 58,875 49,336 70,163San Diego, CA 12 12 58,890 56,892 51,473 68,189San Francisco Bay Area, CA 8 12 71,352 62,776 57,208 81,071
Denver/Boulder, CO 73 242 41,359 37,680 31,296 47,245
Connecticut 38 49 55,767 53,809 46,032 64,444
East Florida 21 24 47,406 42,584 37,278 54,560North Florida 5 5 43,485 45,151 32,990 50,902South Florida 6 7 59,351 57,860 39,053 75,818West Florida 6 19 45,874 38,037 29,813 57,210
Quad Cities Area/IA & IL 14 21 35,690 31,312 23,233 46,359
Chicago Metro, IL 81 143 43,064 46,961 40,222 50,967North Chicago Suburbs, IL 54 68 61,315 60,716 53,844 70,664Peoria, IL 12 33 55,767 55,902 38,745 69,344Rockford, IL 7 16 55,577 51,798 50,360 60,037
Western Massachusetts 31 35 51,323 47,831 40,212 55,979Worcester, MA 28 36 53,899 51,045 41,992 62,570
Grand Rapids, MI 50 114 46,800 48,880 -- --Mid Michigan 15 21 43,144 44,277 33,592 54,763Southeast Michigan 72 181 64,106 51,131 44,392 71,492Western Michigan 7 7 57,097 56,833 48,994 65,852
State of Minnesota 119 147 59,495 58,449 50,825 67,026
Rochester, NY 51 56 53,753 53,354 41,741 63,391Syracuse, NY 16 31 55,474 54,790 46,485 67,153
Charlotte, NC 62 78 57,399 55,121 44,242 69,630Piedmont Triad, NC & VA 39 57 47,383 45,347 40,056 53,846Raleigh/Durham, NC 47 122 46,184 51,083 39,626 70,890
Cincinnati, OH 76 173 54,421 52,163 39,397 68,147Cleveland/Akron, OH 62 101 50,302 49,907 38,647 62,624Columbus, OH 25 48 47,230 41,165 34,837 57,404Toledo, OH 30 49 39,693 46,984 40,710 64,351
Portland, OR 37 45 54,158 52,408 44,776 63,530
Customer Service Manager
Mid 50% Range
Responsible for the supervision of customer service group responding to customer needs, complaints, questions, problems and inquiries as to delivery, service, warrantees, product return and replacement and/or account credits. Maintain record of activity and inform management of trends, major and minor product problems.
63 © Property of Employer Association Group

City Name # or Org. # of Emp. Wtd. Avg. Median
Customer Service Manager
Mid 50% Range
Responsible for the supervision of customer service group responding to customer needs, complaints, questions, problems and inquiries as to delivery, service, warrantees, product return and replacement and/or account credits. Maintain record of activity and inform management of trends, major and minor product problems.
Northwest, PA 16 19 44,641 41,927 37,479 54,246Philadelphia, PA 42 46 57,468 55,354 48,585 68,363Pittsburgh, PA 35 59 45,946 45,164 37,038 55,670Reading, PA 23 33 48,933 44,213 37,309 53,233
Spartanburg, SC 32 41 56,869 52,520 41,764 69,200
Western Washington State 64 65 51,943 49,682 41,059 59,676
Milwaukee, WI 62 81 51,237 50,968 44,607 62,470
64 © Property of Employer Association Group
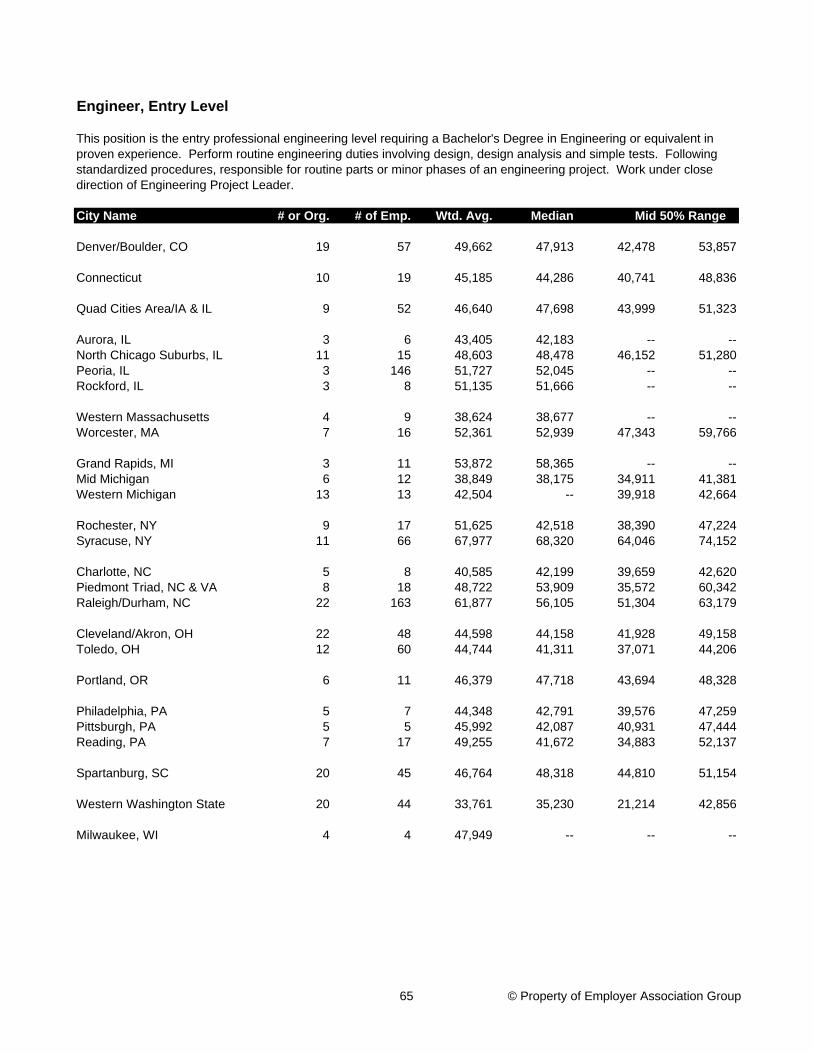
City Name # or Org. # of Emp. Wtd. Avg. Median
Denver/Boulder, CO 19 57 49,662 47,913 42,478 53,857
Connecticut 10 19 45,185 44,286 40,741 48,836
Quad Cities Area/IA & IL 9 52 46,640 47,698 43,999 51,323
Aurora, IL 3 6 43,405 42,183 -- --North Chicago Suburbs, IL 11 15 48,603 48,478 46,152 51,280Peoria, IL 3 146 51,727 52,045 -- --Rockford, IL 3 8 51,135 51,666 -- --
Western Massachusetts 4 9 38,624 38,677 -- --Worcester, MA 7 16 52,361 52,939 47,343 59,766
Grand Rapids, MI 3 11 53,872 58,365 -- --Mid Michigan 6 12 38,849 38,175 34,911 41,381Western Michigan 13 13 42,504 -- 39,918 42,664
Rochester, NY 9 17 51,625 42,518 38,390 47,224Syracuse, NY 11 66 67,977 68,320 64,046 74,152
Charlotte, NC 5 8 40,585 42,199 39,659 42,620Piedmont Triad, NC & VA 8 18 48,722 53,909 35,572 60,342Raleigh/Durham, NC 22 163 61,877 56,105 51,304 63,179
Cleveland/Akron, OH 22 48 44,598 44,158 41,928 49,158Toledo, OH 12 60 44,744 41,311 37,071 44,206
Portland, OR 6 11 46,379 47,718 43,694 48,328
Philadelphia, PA 5 7 44,348 42,791 39,576 47,259Pittsburgh, PA 5 5 45,992 42,087 40,931 47,444Reading, PA 7 17 49,255 41,672 34,883 52,137
Spartanburg, SC 20 45 46,764 48,318 44,810 51,154
Western Washington State 20 44 33,761 35,230 21,214 42,856
Milwaukee, WI 4 4 47,949 -- -- --
Engineer, Entry Level
Mid 50% Range
This position is the entry professional engineering level requiring a Bachelor's Degree in Engineering or equivalent in proven experience. Perform routine engineering duties involving design, design analysis and simple tests. Following standardized procedures, responsible for routine parts or minor phases of an engineering project. Work under close direction of Engineering Project Leader.
65 © Property of Employer Association Group
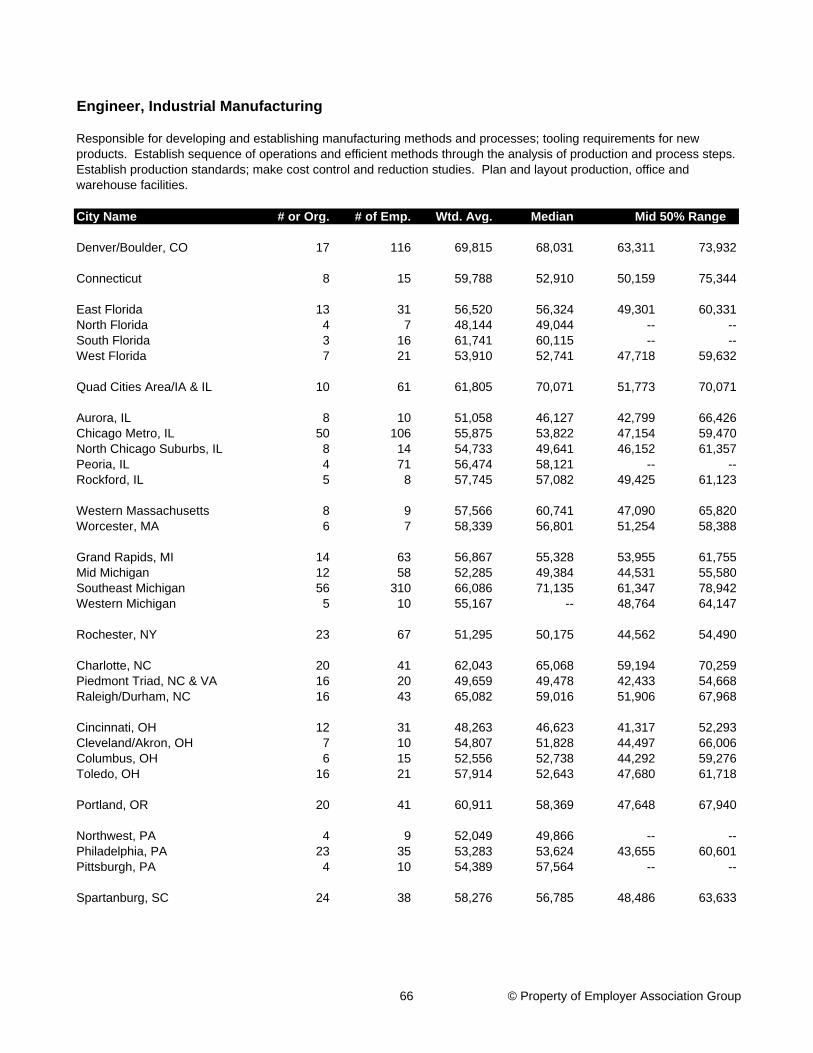
City Name # or Org. # of Emp. Wtd. Avg. Median
Denver/Boulder, CO 17 116 69,815 68,031 63,311 73,932
Connecticut 8 15 59,788 52,910 50,159 75,344
East Florida 13 31 56,520 56,324 49,301 60,331North Florida 4 7 48,144 49,044 -- --South Florida 3 16 61,741 60,115 -- --West Florida 7 21 53,910 52,741 47,718 59,632
Quad Cities Area/IA & IL 10 61 61,805 70,071 51,773 70,071
Aurora, IL 8 10 51,058 46,127 42,799 66,426Chicago Metro, IL 50 106 55,875 53,822 47,154 59,470North Chicago Suburbs, IL 8 14 54,733 49,641 46,152 61,357Peoria, IL 4 71 56,474 58,121 -- --Rockford, IL 5 8 57,745 57,082 49,425 61,123
Western Massachusetts 8 9 57,566 60,741 47,090 65,820Worcester, MA 6 7 58,339 56,801 51,254 58,388
Grand Rapids, MI 14 63 56,867 55,328 53,955 61,755Mid Michigan 12 58 52,285 49,384 44,531 55,580Southeast Michigan 56 310 66,086 71,135 61,347 78,942Western Michigan 5 10 55,167 -- 48,764 64,147
Rochester, NY 23 67 51,295 50,175 44,562 54,490
Charlotte, NC 20 41 62,043 65,068 59,194 70,259Piedmont Triad, NC & VA 16 20 49,659 49,478 42,433 54,668Raleigh/Durham, NC 16 43 65,082 59,016 51,906 67,968
Cincinnati, OH 12 31 48,263 46,623 41,317 52,293Cleveland/Akron, OH 7 10 54,807 51,828 44,497 66,006Columbus, OH 6 15 52,556 52,738 44,292 59,276Toledo, OH 16 21 57,914 52,643 47,680 61,718
Portland, OR 20 41 60,911 58,369 47,648 67,940
Northwest, PA 4 9 52,049 49,866 -- --Philadelphia, PA 23 35 53,283 53,624 43,655 60,601Pittsburgh, PA 4 10 54,389 57,564 -- --
Spartanburg, SC 24 38 58,276 56,785 48,486 63,633
Engineer, Industrial Manufacturing
Mid 50% Range
Responsible for developing and establishing manufacturing methods and processes; tooling requirements for new products. Establish sequence of operations and efficient methods through the analysis of production and process steps. Establish production standards; make cost control and reduction studies. Plan and layout production, office and warehouse facilities.
66 © Property of Employer Association Group

City Name # or Org. # of Emp. Wtd. Avg. Median
Engineer, Industrial Manufacturing
Mid 50% Range
Responsible for developing and establishing manufacturing methods and processes; tooling requirements for new products. Establish sequence of operations and efficient methods through the analysis of production and process steps. Establish production standards; make cost control and reduction studies. Plan and layout production, office and warehouse facilities.
Western Washington State 59 145 64,438 56,726 65,282 71,501
Milwaukee, WI 63 199 59,612 -- -- --
67 © Property of Employer Association Group
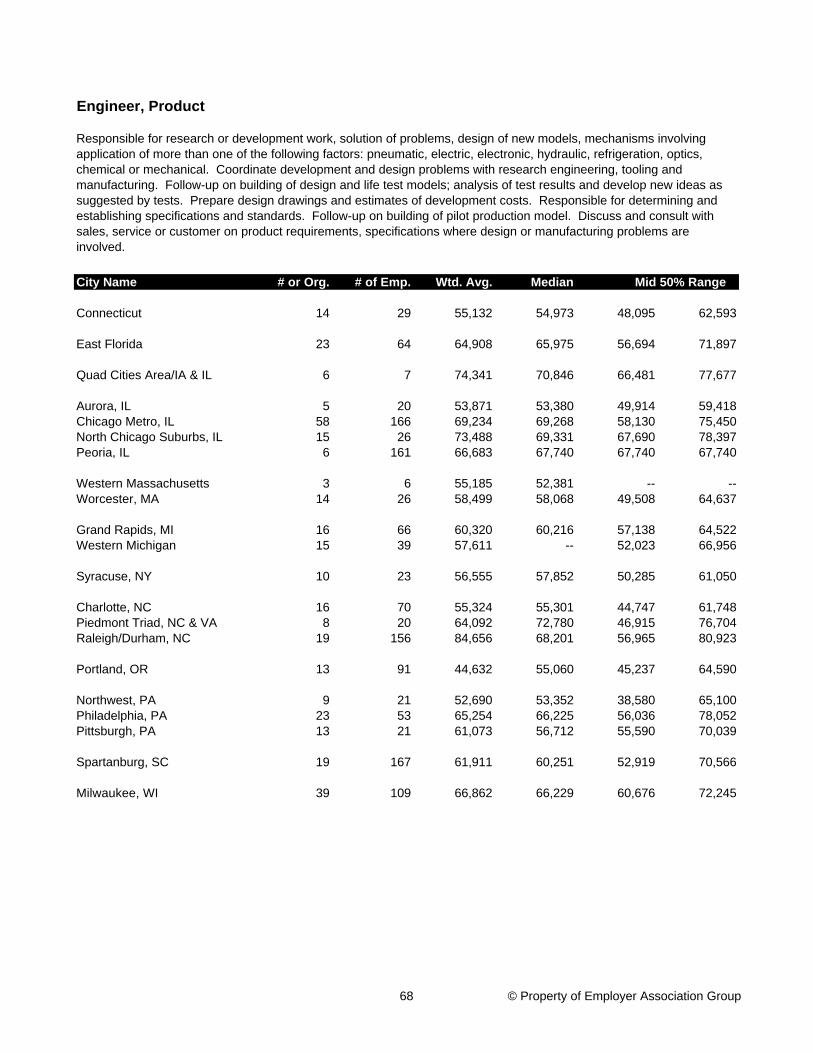
City Name # or Org. # of Emp. Wtd. Avg. Median
Connecticut 14 29 55,132 54,973 48,095 62,593
East Florida 23 64 64,908 65,975 56,694 71,897
Quad Cities Area/IA & IL 6 7 74,341 70,846 66,481 77,677
Aurora, IL 5 20 53,871 53,380 49,914 59,418Chicago Metro, IL 58 166 69,234 69,268 58,130 75,450North Chicago Suburbs, IL 15 26 73,488 69,331 67,690 78,397Peoria, IL 6 161 66,683 67,740 67,740 67,740
Western Massachusetts 3 6 55,185 52,381 -- --Worcester, MA 14 26 58,499 58,068 49,508 64,637
Grand Rapids, MI 16 66 60,320 60,216 57,138 64,522Western Michigan 15 39 57,611 -- 52,023 66,956
Syracuse, NY 10 23 56,555 57,852 50,285 61,050
Charlotte, NC 16 70 55,324 55,301 44,747 61,748Piedmont Triad, NC & VA 8 20 64,092 72,780 46,915 76,704Raleigh/Durham, NC 19 156 84,656 68,201 56,965 80,923
Portland, OR 13 91 44,632 55,060 45,237 64,590
Northwest, PA 9 21 52,690 53,352 38,580 65,100Philadelphia, PA 23 53 65,254 66,225 56,036 78,052Pittsburgh, PA 13 21 61,073 56,712 55,590 70,039
Spartanburg, SC 19 167 61,911 60,251 52,919 70,566
Milwaukee, WI 39 109 66,862 66,229 60,676 72,245
Engineer, Product
Mid 50% Range
Responsible for research or development work, solution of problems, design of new models, mechanisms involving application of more than one of the following factors: pneumatic, electric, electronic, hydraulic, refrigeration, optics, chemical or mechanical. Coordinate development and design problems with research engineering, tooling and manufacturing. Follow-up on building of design and life test models; analysis of test results and develop new ideas as suggested by tests. Prepare design drawings and estimates of development costs. Responsible for determining and establishing specifications and standards. Follow-up on building of pilot production model. Discuss and consult with sales, service or customer on product requirements, specifications where design or manufacturing problems are involved.
68 © Property of Employer Association Group
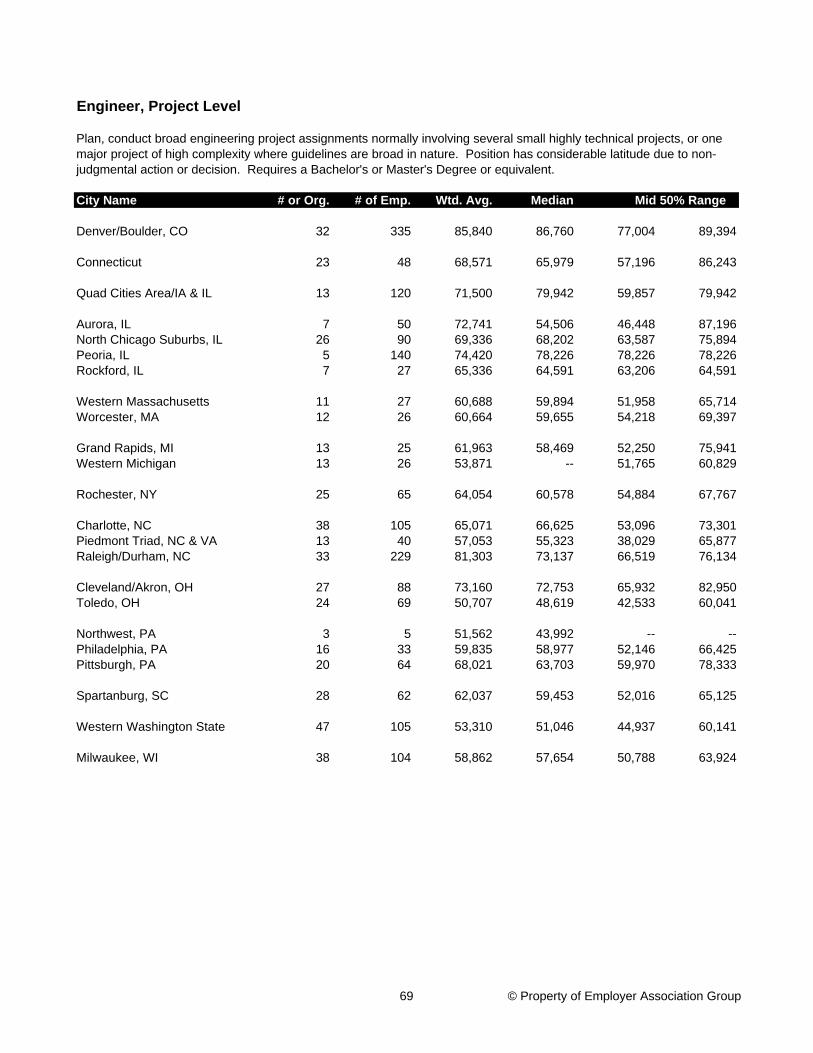
City Name # or Org. # of Emp. Wtd. Avg. Median
Denver/Boulder, CO 32 335 85,840 86,760 77,004 89,394
Connecticut 23 48 68,571 65,979 57,196 86,243
Quad Cities Area/IA & IL 13 120 71,500 79,942 59,857 79,942
Aurora, IL 7 50 72,741 54,506 46,448 87,196North Chicago Suburbs, IL 26 90 69,336 68,202 63,587 75,894Peoria, IL 5 140 74,420 78,226 78,226 78,226Rockford, IL 7 27 65,336 64,591 63,206 64,591
Western Massachusetts 11 27 60,688 59,894 51,958 65,714Worcester, MA 12 26 60,664 59,655 54,218 69,397
Grand Rapids, MI 13 25 61,963 58,469 52,250 75,941Western Michigan 13 26 53,871 -- 51,765 60,829
Rochester, NY 25 65 64,054 60,578 54,884 67,767
Charlotte, NC 38 105 65,071 66,625 53,096 73,301Piedmont Triad, NC & VA 13 40 57,053 55,323 38,029 65,877Raleigh/Durham, NC 33 229 81,303 73,137 66,519 76,134
Cleveland/Akron, OH 27 88 73,160 72,753 65,932 82,950Toledo, OH 24 69 50,707 48,619 42,533 60,041
Northwest, PA 3 5 51,562 43,992 -- --Philadelphia, PA 16 33 59,835 58,977 52,146 66,425Pittsburgh, PA 20 64 68,021 63,703 59,970 78,333
Spartanburg, SC 28 62 62,037 59,453 52,016 65,125
Western Washington State 47 105 53,310 51,046 44,937 60,141
Milwaukee, WI 38 104 58,862 57,654 50,788 63,924
Engineer, Project Level
Mid 50% Range
Plan, conduct broad engineering project assignments normally involving several small highly technical projects, or one major project of high complexity where guidelines are broad in nature. Position has considerable latitude due to non-judgmental action or decision. Requires a Bachelor's or Master's Degree or equivalent.
69 © Property of Employer Association Group
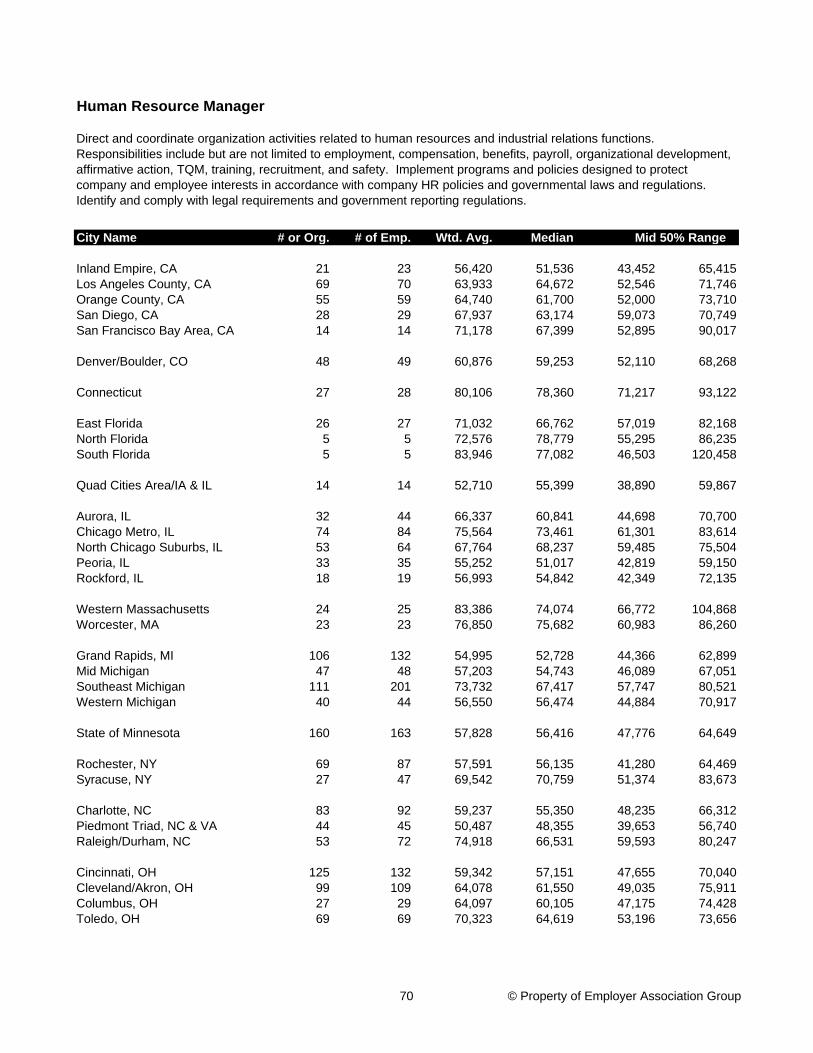
City Name # or Org. # of Emp. Wtd. Avg. Median
Inland Empire, CA 21 23 56,420 51,536 43,452 65,415Los Angeles County, CA 69 70 63,933 64,672 52,546 71,746Orange County, CA 55 59 64,740 61,700 52,000 73,710San Diego, CA 28 29 67,937 63,174 59,073 70,749San Francisco Bay Area, CA 14 14 71,178 67,399 52,895 90,017
Denver/Boulder, CO 48 49 60,876 59,253 52,110 68,268
Connecticut 27 28 80,106 78,360 71,217 93,122
East Florida 26 27 71,032 66,762 57,019 82,168North Florida 5 5 72,576 78,779 55,295 86,235South Florida 5 5 83,946 77,082 46,503 120,458
Quad Cities Area/IA & IL 14 14 52,710 55,399 38,890 59,867
Aurora, IL 32 44 66,337 60,841 44,698 70,700Chicago Metro, IL 74 84 75,564 73,461 61,301 83,614North Chicago Suburbs, IL 53 64 67,764 68,237 59,485 75,504Peoria, IL 33 35 55,252 51,017 42,819 59,150Rockford, IL 18 19 56,993 54,842 42,349 72,135
Western Massachusetts 24 25 83,386 74,074 66,772 104,868Worcester, MA 23 23 76,850 75,682 60,983 86,260
Grand Rapids, MI 106 132 54,995 52,728 44,366 62,899Mid Michigan 47 48 57,203 54,743 46,089 67,051Southeast Michigan 111 201 73,732 67,417 57,747 80,521Western Michigan 40 44 56,550 56,474 44,884 70,917
State of Minnesota 160 163 57,828 56,416 47,776 64,649
Rochester, NY 69 87 57,591 56,135 41,280 64,469Syracuse, NY 27 47 69,542 70,759 51,374 83,673
Charlotte, NC 83 92 59,237 55,350 48,235 66,312Piedmont Triad, NC & VA 44 45 50,487 48,355 39,653 56,740Raleigh/Durham, NC 53 72 74,918 66,531 59,593 80,247
Cincinnati, OH 125 132 59,342 57,151 47,655 70,040Cleveland/Akron, OH 99 109 64,078 61,550 49,035 75,911Columbus, OH 27 29 64,097 60,105 47,175 74,428Toledo, OH 69 69 70,323 64,619 53,196 73,656
Human Resource Manager
Mid 50% Range
Direct and coordinate organization activities related to human resources and industrial relations functions. Responsibilities include but are not limited to employment, compensation, benefits, payroll, organizational development, affirmative action, TQM, training, recruitment, and safety. Implement programs and policies designed to protect company and employee interests in accordance with company HR policies and governmental laws and regulations. Identify and comply with legal requirements and government reporting regulations.
70 © Property of Employer Association Group
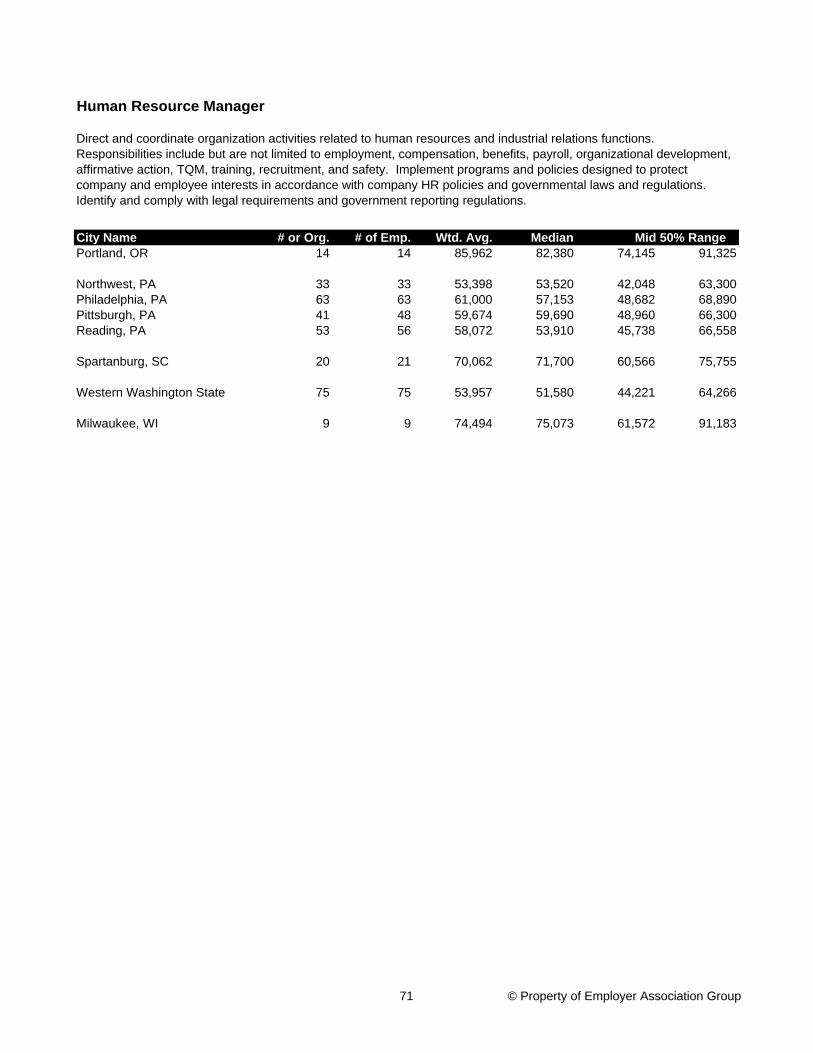
City Name # or Org. # of Emp. Wtd. Avg. Median
Human Resource Manager
Mid 50% Range
Direct and coordinate organization activities related to human resources and industrial relations functions. Responsibilities include but are not limited to employment, compensation, benefits, payroll, organizational development, affirmative action, TQM, training, recruitment, and safety. Implement programs and policies designed to protect company and employee interests in accordance with company HR policies and governmental laws and regulations. Identify and comply with legal requirements and government reporting regulations.
Portland, OR 14 14 85,962 82,380 74,145 91,325
Northwest, PA 33 33 53,398 53,520 42,048 63,300Philadelphia, PA 63 63 61,000 57,153 48,682 68,890Pittsburgh, PA 41 48 59,674 59,690 48,960 66,300Reading, PA 53 56 58,072 53,910 45,738 66,558
Spartanburg, SC 20 21 70,062 71,700 60,566 75,755
Western Washington State 75 75 53,957 51,580 44,221 64,266
Milwaukee, WI 9 9 74,494 75,073 61,572 91,183
71 © Property of Employer Association Group
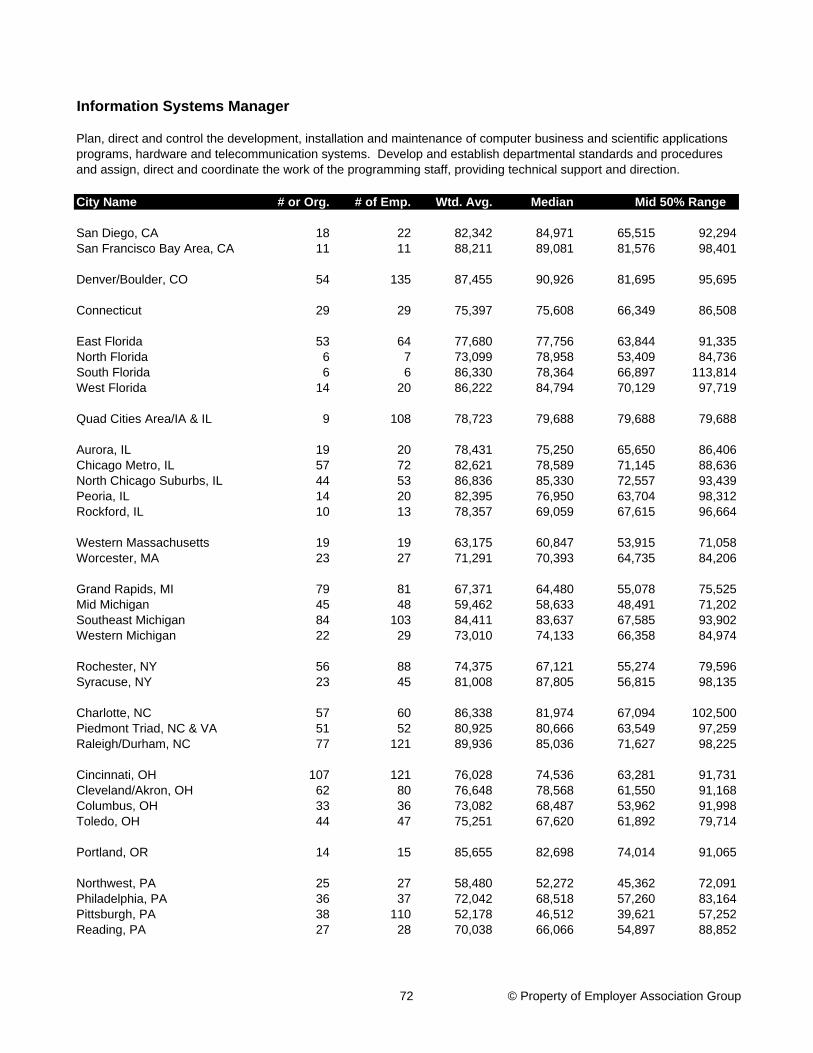
City Name # or Org. # of Emp. Wtd. Avg. Median
San Diego, CA 18 22 82,342 84,971 65,515 92,294San Francisco Bay Area, CA 11 11 88,211 89,081 81,576 98,401
Denver/Boulder, CO 54 135 87,455 90,926 81,695 95,695
Connecticut 29 29 75,397 75,608 66,349 86,508
East Florida 53 64 77,680 77,756 63,844 91,335North Florida 6 7 73,099 78,958 53,409 84,736South Florida 6 6 86,330 78,364 66,897 113,814West Florida 14 20 86,222 84,794 70,129 97,719
Quad Cities Area/IA & IL 9 108 78,723 79,688 79,688 79,688
Aurora, IL 19 20 78,431 75,250 65,650 86,406Chicago Metro, IL 57 72 82,621 78,589 71,145 88,636North Chicago Suburbs, IL 44 53 86,836 85,330 72,557 93,439Peoria, IL 14 20 82,395 76,950 63,704 98,312Rockford, IL 10 13 78,357 69,059 67,615 96,664
Western Massachusetts 19 19 63,175 60,847 53,915 71,058Worcester, MA 23 27 71,291 70,393 64,735 84,206
Grand Rapids, MI 79 81 67,371 64,480 55,078 75,525Mid Michigan 45 48 59,462 58,633 48,491 71,202Southeast Michigan 84 103 84,411 83,637 67,585 93,902Western Michigan 22 29 73,010 74,133 66,358 84,974
Rochester, NY 56 88 74,375 67,121 55,274 79,596Syracuse, NY 23 45 81,008 87,805 56,815 98,135
Charlotte, NC 57 60 86,338 81,974 67,094 102,500Piedmont Triad, NC & VA 51 52 80,925 80,666 63,549 97,259Raleigh/Durham, NC 77 121 89,936 85,036 71,627 98,225
Cincinnati, OH 107 121 76,028 74,536 63,281 91,731Cleveland/Akron, OH 62 80 76,648 78,568 61,550 91,168Columbus, OH 33 36 73,082 68,487 53,962 91,998Toledo, OH 44 47 75,251 67,620 61,892 79,714
Portland, OR 14 15 85,655 82,698 74,014 91,065
Northwest, PA 25 27 58,480 52,272 45,362 72,091Philadelphia, PA 36 37 72,042 68,518 57,260 83,164Pittsburgh, PA 38 110 52,178 46,512 39,621 57,252Reading, PA 27 28 70,038 66,066 54,897 88,852
Information Systems Manager
Mid 50% Range
Plan, direct and control the development, installation and maintenance of computer business and scientific applications programs, hardware and telecommunication systems. Develop and establish departmental standards and procedures and assign, direct and coordinate the work of the programming staff, providing technical support and direction.
72 © Property of Employer Association Group

City Name # or Org. # of Emp. Wtd. Avg. Median
Information Systems Manager
Mid 50% Range
Plan, direct and control the development, installation and maintenance of computer business and scientific applications programs, hardware and telecommunication systems. Develop and establish departmental standards and procedures and assign, direct and coordinate the work of the programming staff, providing technical support and direction.
Western Washington State 78 78 62,692 59,705 49,447 73,554
Milwaukee, WI 26 34 77,987 72,456 61,721 85,139
73 © Property of Employer Association Group
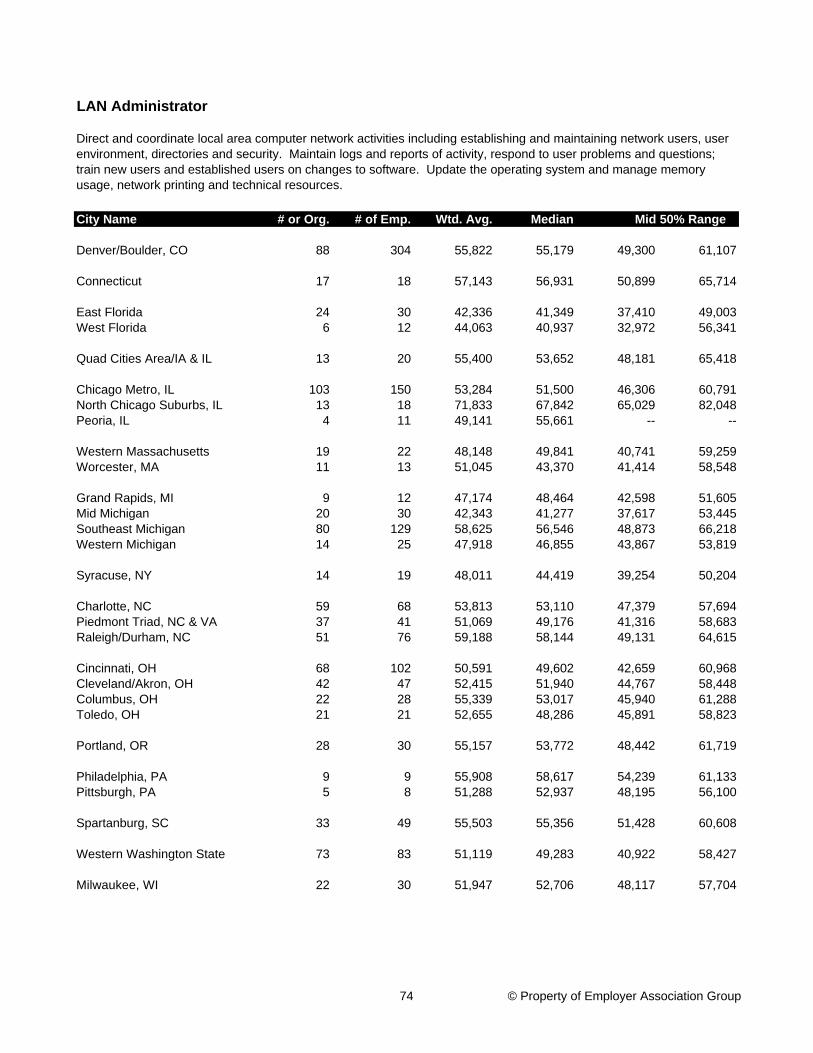
City Name # or Org. # of Emp. Wtd. Avg. Median
Denver/Boulder, CO 88 304 55,822 55,179 49,300 61,107
Connecticut 17 18 57,143 56,931 50,899 65,714
East Florida 24 30 42,336 41,349 37,410 49,003West Florida 6 12 44,063 40,937 32,972 56,341
Quad Cities Area/IA & IL 13 20 55,400 53,652 48,181 65,418
Chicago Metro, IL 103 150 53,284 51,500 46,306 60,791North Chicago Suburbs, IL 13 18 71,833 67,842 65,029 82,048Peoria, IL 4 11 49,141 55,661 -- --
Western Massachusetts 19 22 48,148 49,841 40,741 59,259Worcester, MA 11 13 51,045 43,370 41,414 58,548
Grand Rapids, MI 9 12 47,174 48,464 42,598 51,605Mid Michigan 20 30 42,343 41,277 37,617 53,445Southeast Michigan 80 129 58,625 56,546 48,873 66,218Western Michigan 14 25 47,918 46,855 43,867 53,819
Syracuse, NY 14 19 48,011 44,419 39,254 50,204
Charlotte, NC 59 68 53,813 53,110 47,379 57,694Piedmont Triad, NC & VA 37 41 51,069 49,176 41,316 58,683Raleigh/Durham, NC 51 76 59,188 58,144 49,131 64,615
Cincinnati, OH 68 102 50,591 49,602 42,659 60,968Cleveland/Akron, OH 42 47 52,415 51,940 44,767 58,448Columbus, OH 22 28 55,339 53,017 45,940 61,288Toledo, OH 21 21 52,655 48,286 45,891 58,823
Portland, OR 28 30 55,157 53,772 48,442 61,719
Philadelphia, PA 9 9 55,908 58,617 54,239 61,133Pittsburgh, PA 5 8 51,288 52,937 48,195 56,100
Spartanburg, SC 33 49 55,503 55,356 51,428 60,608
Western Washington State 73 83 51,119 49,283 40,922 58,427
Milwaukee, WI 22 30 51,947 52,706 48,117 57,704
LAN Administrator
Mid 50% Range
Direct and coordinate local area computer network activities including establishing and maintaining network users, user environment, directories and security. Maintain logs and reports of activity, respond to user problems and questions; train new users and established users on changes to software. Update the operating system and manage memory usage, network printing and technical resources.
74 © Property of Employer Association Group
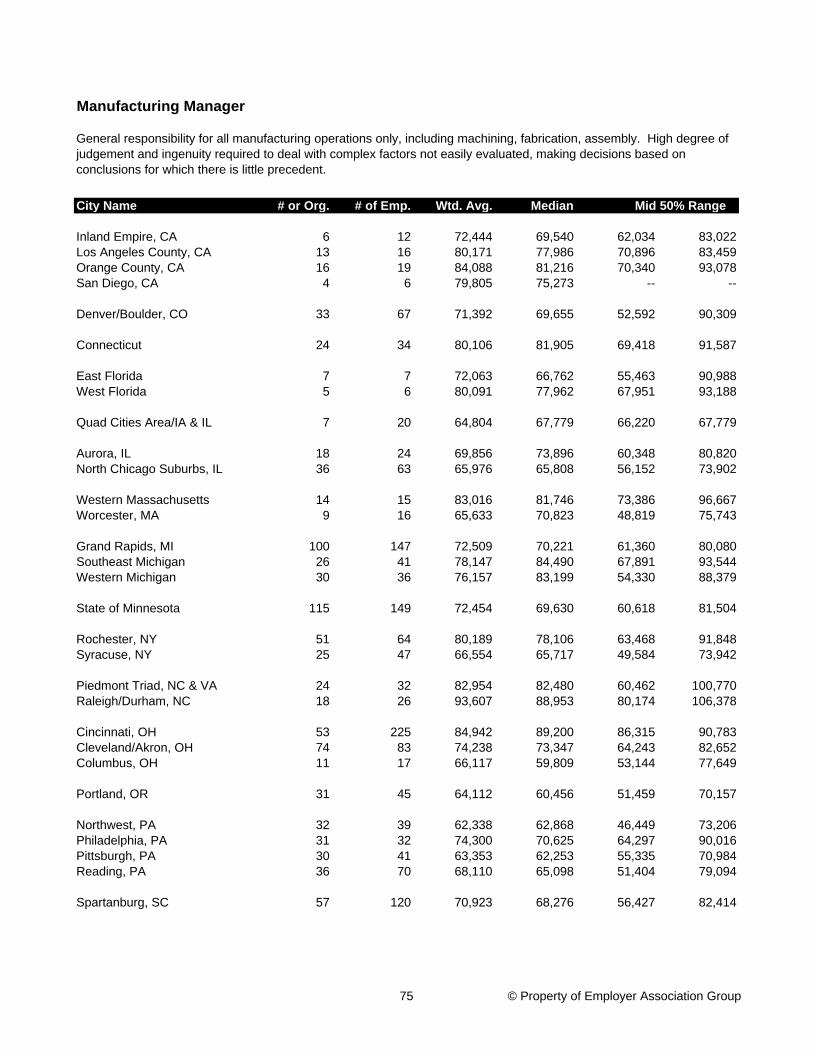
City Name # or Org. # of Emp. Wtd. Avg. Median
Inland Empire, CA 6 12 72,444 69,540 62,034 83,022Los Angeles County, CA 13 16 80,171 77,986 70,896 83,459Orange County, CA 16 19 84,088 81,216 70,340 93,078San Diego, CA 4 6 79,805 75,273 -- --
Denver/Boulder, CO 33 67 71,392 69,655 52,592 90,309
Connecticut 24 34 80,106 81,905 69,418 91,587
East Florida 7 7 72,063 66,762 55,463 90,988West Florida 5 6 80,091 77,962 67,951 93,188
Quad Cities Area/IA & IL 7 20 64,804 67,779 66,220 67,779
Aurora, IL 18 24 69,856 73,896 60,348 80,820North Chicago Suburbs, IL 36 63 65,976 65,808 56,152 73,902
Western Massachusetts 14 15 83,016 81,746 73,386 96,667Worcester, MA 9 16 65,633 70,823 48,819 75,743
Grand Rapids, MI 100 147 72,509 70,221 61,360 80,080Southeast Michigan 26 41 78,147 84,490 67,891 93,544Western Michigan 30 36 76,157 83,199 54,330 88,379
State of Minnesota 115 149 72,454 69,630 60,618 81,504
Rochester, NY 51 64 80,189 78,106 63,468 91,848Syracuse, NY 25 47 66,554 65,717 49,584 73,942
Piedmont Triad, NC & VA 24 32 82,954 82,480 60,462 100,770Raleigh/Durham, NC 18 26 93,607 88,953 80,174 106,378
Cincinnati, OH 53 225 84,942 89,200 86,315 90,783Cleveland/Akron, OH 74 83 74,238 73,347 64,243 82,652Columbus, OH 11 17 66,117 59,809 53,144 77,649
Portland, OR 31 45 64,112 60,456 51,459 70,157
Northwest, PA 32 39 62,338 62,868 46,449 73,206Philadelphia, PA 31 32 74,300 70,625 64,297 90,016Pittsburgh, PA 30 41 63,353 62,253 55,335 70,984Reading, PA 36 70 68,110 65,098 51,404 79,094
Spartanburg, SC 57 120 70,923 68,276 56,427 82,414
Manufacturing Manager
Mid 50% Range
General responsibility for all manufacturing operations only, including machining, fabrication, assembly. High degree of judgement and ingenuity required to deal with complex factors not easily evaluated, making decisions based on conclusions for which there is little precedent.
75 © Property of Employer Association Group

City Name # or Org. # of Emp. Wtd. Avg. Median
Manufacturing Manager
Mid 50% Range
General responsibility for all manufacturing operations only, including machining, fabrication, assembly. High degree of judgement and ingenuity required to deal with complex factors not easily evaluated, making decisions based on conclusions for which there is little precedent.
Western Washington State 78 98 61,724 61,267 51,388 71,412
Milwaukee, WI 35 52 89,298 82,889 68,343 95,641
76 © Property of Employer Association Group
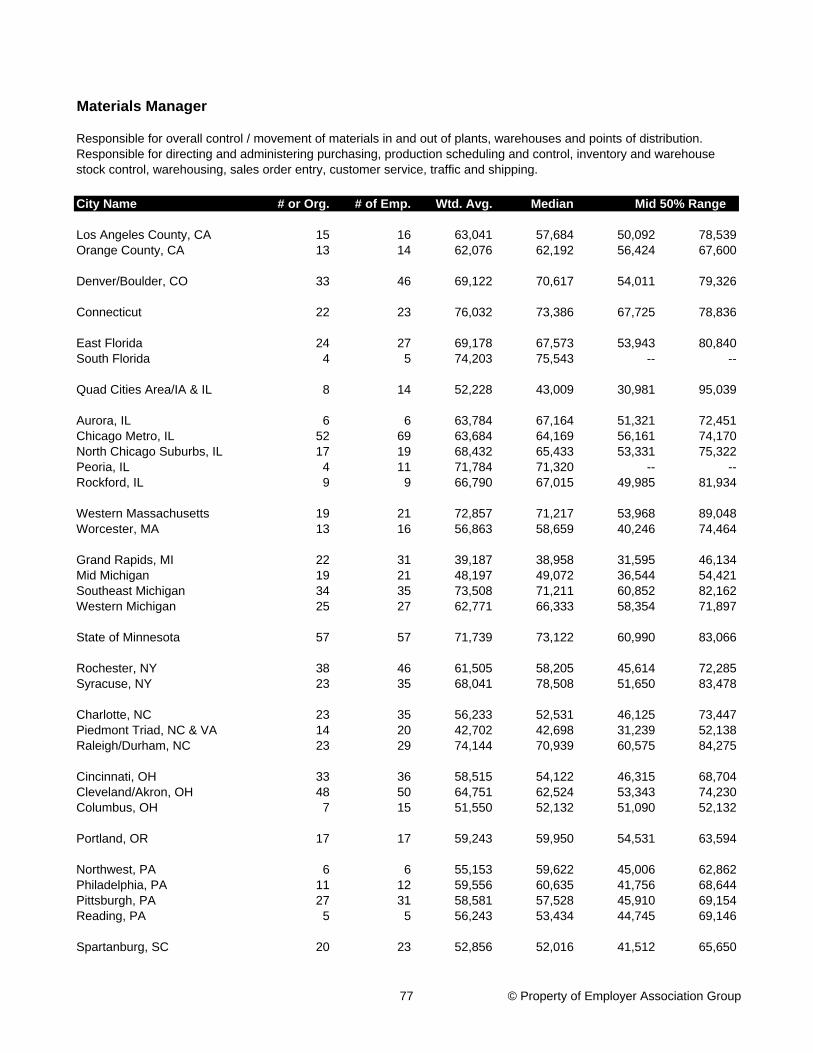
City Name # or Org. # of Emp. Wtd. Avg. Median
Los Angeles County, CA 15 16 63,041 57,684 50,092 78,539Orange County, CA 13 14 62,076 62,192 56,424 67,600
Denver/Boulder, CO 33 46 69,122 70,617 54,011 79,326
Connecticut 22 23 76,032 73,386 67,725 78,836
East Florida 24 27 69,178 67,573 53,943 80,840South Florida 4 5 74,203 75,543 -- --
Quad Cities Area/IA & IL 8 14 52,228 43,009 30,981 95,039
Aurora, IL 6 6 63,784 67,164 51,321 72,451Chicago Metro, IL 52 69 63,684 64,169 56,161 74,170North Chicago Suburbs, IL 17 19 68,432 65,433 53,331 75,322Peoria, IL 4 11 71,784 71,320 -- --Rockford, IL 9 9 66,790 67,015 49,985 81,934
Western Massachusetts 19 21 72,857 71,217 53,968 89,048Worcester, MA 13 16 56,863 58,659 40,246 74,464
Grand Rapids, MI 22 31 39,187 38,958 31,595 46,134Mid Michigan 19 21 48,197 49,072 36,544 54,421Southeast Michigan 34 35 73,508 71,211 60,852 82,162Western Michigan 25 27 62,771 66,333 58,354 71,897
State of Minnesota 57 57 71,739 73,122 60,990 83,066
Rochester, NY 38 46 61,505 58,205 45,614 72,285Syracuse, NY 23 35 68,041 78,508 51,650 83,478
Charlotte, NC 23 35 56,233 52,531 46,125 73,447Piedmont Triad, NC & VA 14 20 42,702 42,698 31,239 52,138Raleigh/Durham, NC 23 29 74,144 70,939 60,575 84,275
Cincinnati, OH 33 36 58,515 54,122 46,315 68,704Cleveland/Akron, OH 48 50 64,751 62,524 53,343 74,230Columbus, OH 7 15 51,550 52,132 51,090 52,132
Portland, OR 17 17 59,243 59,950 54,531 63,594
Northwest, PA 6 6 55,153 59,622 45,006 62,862Philadelphia, PA 11 12 59,556 60,635 41,756 68,644Pittsburgh, PA 27 31 58,581 57,528 45,910 69,154Reading, PA 5 5 56,243 53,434 44,745 69,146
Spartanburg, SC 20 23 52,856 52,016 41,512 65,650
Materials Manager
Mid 50% Range
Responsible for overall control / movement of materials in and out of plants, warehouses and points of distribution. Responsible for directing and administering purchasing, production scheduling and control, inventory and warehouse stock control, warehousing, sales order entry, customer service, traffic and shipping.
77 © Property of Employer Association Group
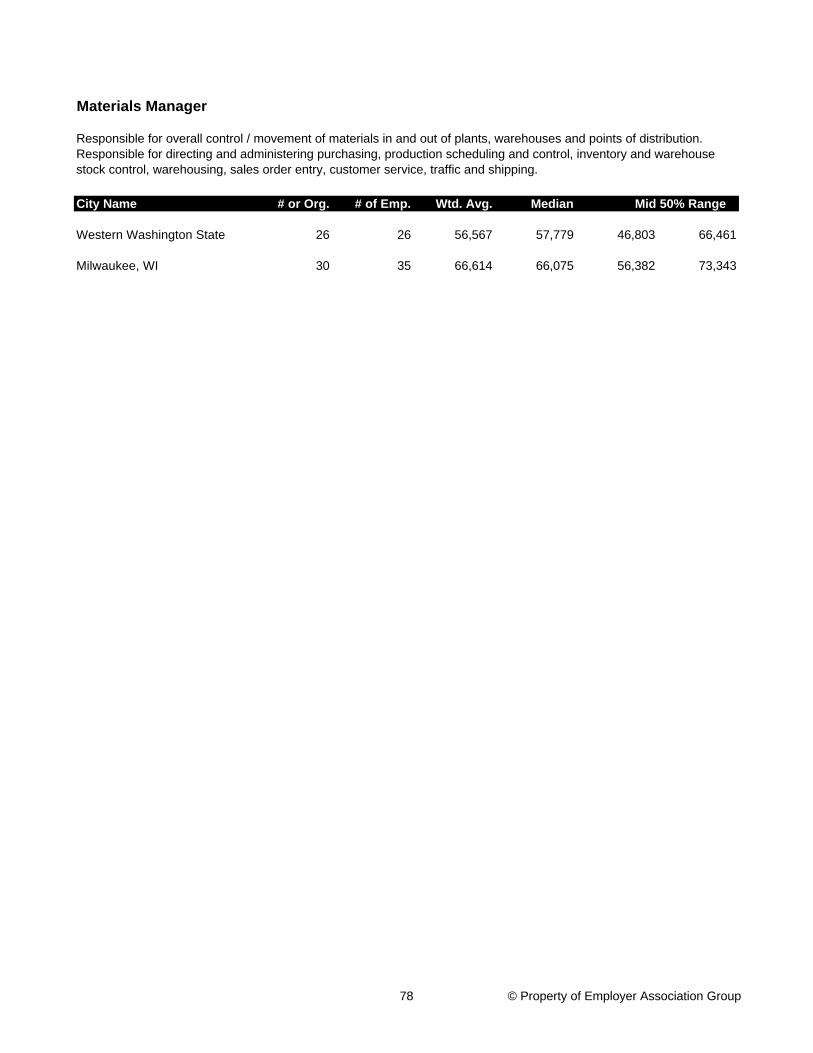
City Name # or Org. # of Emp. Wtd. Avg. Median
Materials Manager
Mid 50% Range
Responsible for overall control / movement of materials in and out of plants, warehouses and points of distribution. Responsible for directing and administering purchasing, production scheduling and control, inventory and warehouse stock control, warehousing, sales order entry, customer service, traffic and shipping.
Western Washington State 26 26 56,567 57,779 46,803 66,461
Milwaukee, WI 30 35 66,614 66,075 56,382 73,343
78 © Property of Employer Association Group
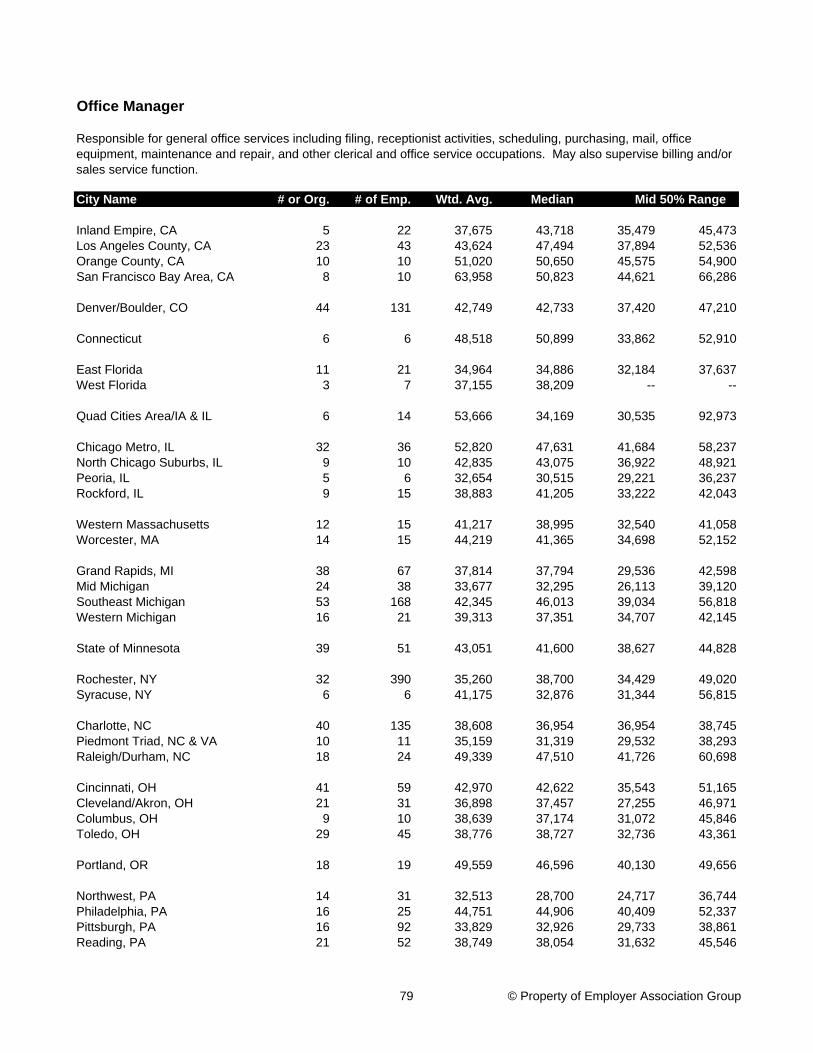
City Name # or Org. # of Emp. Wtd. Avg. Median
Inland Empire, CA 5 22 37,675 43,718 35,479 45,473Los Angeles County, CA 23 43 43,624 47,494 37,894 52,536Orange County, CA 10 10 51,020 50,650 45,575 54,900San Francisco Bay Area, CA 8 10 63,958 50,823 44,621 66,286
Denver/Boulder, CO 44 131 42,749 42,733 37,420 47,210
Connecticut 6 6 48,518 50,899 33,862 52,910
East Florida 11 21 34,964 34,886 32,184 37,637West Florida 3 7 37,155 38,209 -- --
Quad Cities Area/IA & IL 6 14 53,666 34,169 30,535 92,973
Chicago Metro, IL 32 36 52,820 47,631 41,684 58,237North Chicago Suburbs, IL 9 10 42,835 43,075 36,922 48,921Peoria, IL 5 6 32,654 30,515 29,221 36,237Rockford, IL 9 15 38,883 41,205 33,222 42,043
Western Massachusetts 12 15 41,217 38,995 32,540 41,058Worcester, MA 14 15 44,219 41,365 34,698 52,152
Grand Rapids, MI 38 67 37,814 37,794 29,536 42,598Mid Michigan 24 38 33,677 32,295 26,113 39,120Southeast Michigan 53 168 42,345 46,013 39,034 56,818Western Michigan 16 21 39,313 37,351 34,707 42,145
State of Minnesota 39 51 43,051 41,600 38,627 44,828
Rochester, NY 32 390 35,260 38,700 34,429 49,020Syracuse, NY 6 6 41,175 32,876 31,344 56,815
Charlotte, NC 40 135 38,608 36,954 36,954 38,745Piedmont Triad, NC & VA 10 11 35,159 31,319 29,532 38,293Raleigh/Durham, NC 18 24 49,339 47,510 41,726 60,698
Cincinnati, OH 41 59 42,970 42,622 35,543 51,165Cleveland/Akron, OH 21 31 36,898 37,457 27,255 46,971Columbus, OH 9 10 38,639 37,174 31,072 45,846Toledo, OH 29 45 38,776 38,727 32,736 43,361
Portland, OR 18 19 49,559 46,596 40,130 49,656
Northwest, PA 14 31 32,513 28,700 24,717 36,744Philadelphia, PA 16 25 44,751 44,906 40,409 52,337Pittsburgh, PA 16 92 33,829 32,926 29,733 38,861Reading, PA 21 52 38,749 38,054 31,632 45,546
Office Manager
Mid 50% Range
Responsible for general office services including filing, receptionist activities, scheduling, purchasing, mail, office equipment, maintenance and repair, and other clerical and office service occupations. May also supervise billing and/or sales service function.
79 © Property of Employer Association Group

City Name # or Org. # of Emp. Wtd. Avg. Median
Office Manager
Mid 50% Range
Responsible for general office services including filing, receptionist activities, scheduling, purchasing, mail, office equipment, maintenance and repair, and other clerical and office service occupations. May also supervise billing and/or sales service function.
Spartanburg, SC 17 23 44,432 42,919 35,693 54,663
Western Washington State 33 39 47,486 40,804 32,782 56,738
Milwaukee, WI 14 28 36,725 41,295 39,321 48,978
80 © Property of Employer Association Group
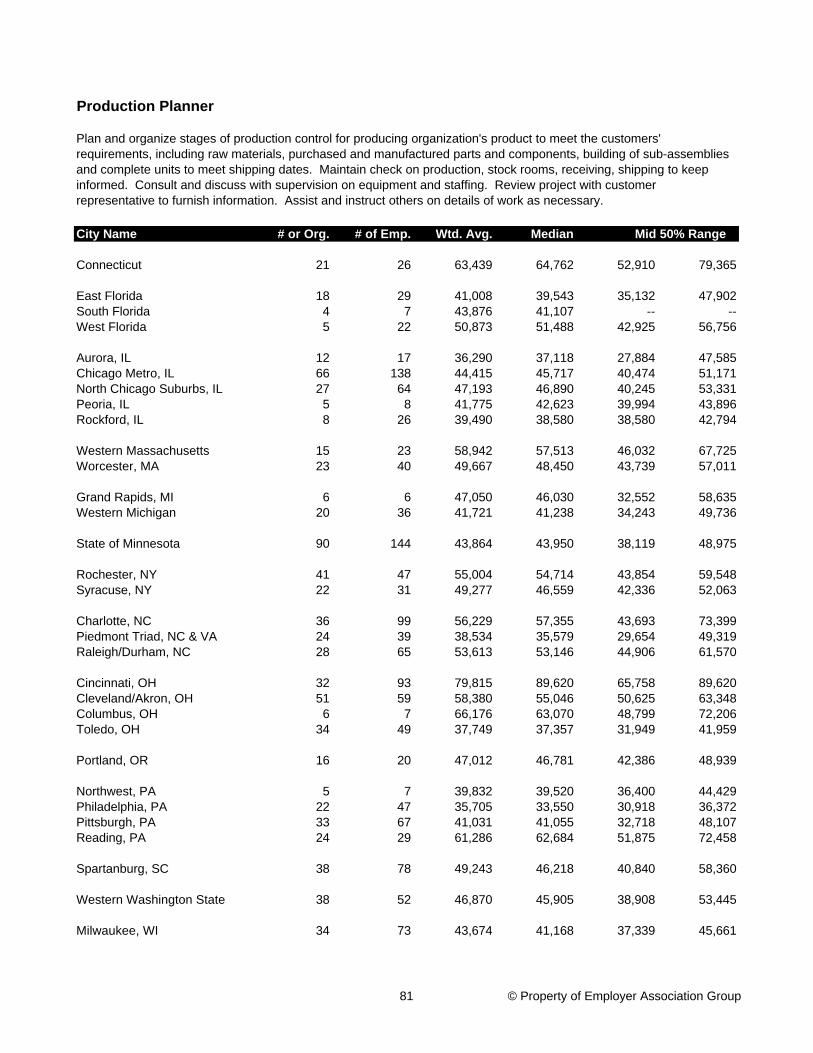
City Name # or Org. # of Emp. Wtd. Avg. Median
Connecticut 21 26 63,439 64,762 52,910 79,365
East Florida 18 29 41,008 39,543 35,132 47,902South Florida 4 7 43,876 41,107 -- --West Florida 5 22 50,873 51,488 42,925 56,756
Aurora, IL 12 17 36,290 37,118 27,884 47,585Chicago Metro, IL 66 138 44,415 45,717 40,474 51,171North Chicago Suburbs, IL 27 64 47,193 46,890 40,245 53,331Peoria, IL 5 8 41,775 42,623 39,994 43,896Rockford, IL 8 26 39,490 38,580 38,580 42,794
Western Massachusetts 15 23 58,942 57,513 46,032 67,725Worcester, MA 23 40 49,667 48,450 43,739 57,011
Grand Rapids, MI 6 6 47,050 46,030 32,552 58,635Western Michigan 20 36 41,721 41,238 34,243 49,736
State of Minnesota 90 144 43,864 43,950 38,119 48,975
Rochester, NY 41 47 55,004 54,714 43,854 59,548Syracuse, NY 22 31 49,277 46,559 42,336 52,063
Charlotte, NC 36 99 56,229 57,355 43,693 73,399Piedmont Triad, NC & VA 24 39 38,534 35,579 29,654 49,319Raleigh/Durham, NC 28 65 53,613 53,146 44,906 61,570
Cincinnati, OH 32 93 79,815 89,620 65,758 89,620Cleveland/Akron, OH 51 59 58,380 55,046 50,625 63,348Columbus, OH 6 7 66,176 63,070 48,799 72,206Toledo, OH 34 49 37,749 37,357 31,949 41,959
Portland, OR 16 20 47,012 46,781 42,386 48,939
Northwest, PA 5 7 39,832 39,520 36,400 44,429Philadelphia, PA 22 47 35,705 33,550 30,918 36,372Pittsburgh, PA 33 67 41,031 41,055 32,718 48,107Reading, PA 24 29 61,286 62,684 51,875 72,458
Spartanburg, SC 38 78 49,243 46,218 40,840 58,360
Western Washington State 38 52 46,870 45,905 38,908 53,445
Milwaukee, WI 34 73 43,674 41,168 37,339 45,661
Production Planner
Mid 50% Range
Plan and organize stages of production control for producing organization's product to meet the customers' requirements, including raw materials, purchased and manufactured parts and components, building of sub-assemblies and complete units to meet shipping dates. Maintain check on production, stock rooms, receiving, shipping to keep informed. Consult and discuss with supervision on equipment and staffing. Review project with customer representative to furnish information. Assist and instruct others on details of work as necessary.
81 © Property of Employer Association Group
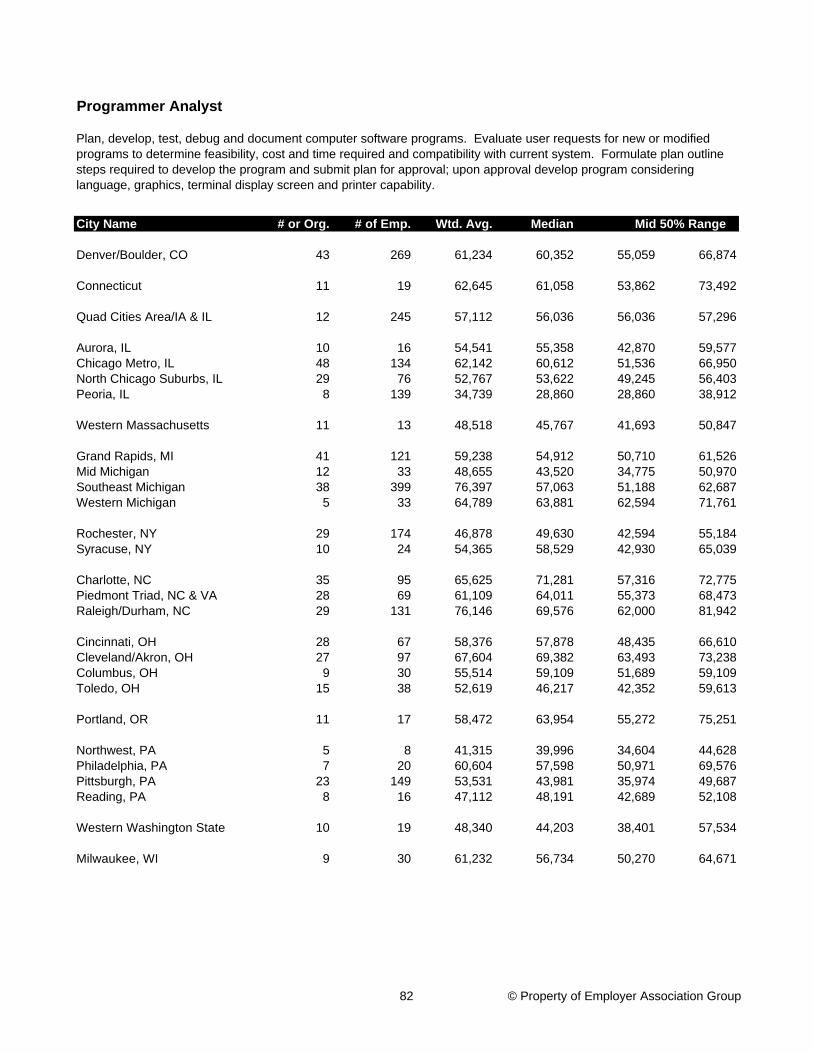
City Name # or Org. # of Emp. Wtd. Avg. Median
Denver/Boulder, CO 43 269 61,234 60,352 55,059 66,874
Connecticut 11 19 62,645 61,058 53,862 73,492
Quad Cities Area/IA & IL 12 245 57,112 56,036 56,036 57,296
Aurora, IL 10 16 54,541 55,358 42,870 59,577Chicago Metro, IL 48 134 62,142 60,612 51,536 66,950North Chicago Suburbs, IL 29 76 52,767 53,622 49,245 56,403Peoria, IL 8 139 34,739 28,860 28,860 38,912
Western Massachusetts 11 13 48,518 45,767 41,693 50,847
Grand Rapids, MI 41 121 59,238 54,912 50,710 61,526Mid Michigan 12 33 48,655 43,520 34,775 50,970Southeast Michigan 38 399 76,397 57,063 51,188 62,687Western Michigan 5 33 64,789 63,881 62,594 71,761
Rochester, NY 29 174 46,878 49,630 42,594 55,184Syracuse, NY 10 24 54,365 58,529 42,930 65,039
Charlotte, NC 35 95 65,625 71,281 57,316 72,775Piedmont Triad, NC & VA 28 69 61,109 64,011 55,373 68,473Raleigh/Durham, NC 29 131 76,146 69,576 62,000 81,942
Cincinnati, OH 28 67 58,376 57,878 48,435 66,610Cleveland/Akron, OH 27 97 67,604 69,382 63,493 73,238Columbus, OH 9 30 55,514 59,109 51,689 59,109Toledo, OH 15 38 52,619 46,217 42,352 59,613
Portland, OR 11 17 58,472 63,954 55,272 75,251
Northwest, PA 5 8 41,315 39,996 34,604 44,628Philadelphia, PA 7 20 60,604 57,598 50,971 69,576Pittsburgh, PA 23 149 53,531 43,981 35,974 49,687Reading, PA 8 16 47,112 48,191 42,689 52,108
Western Washington State 10 19 48,340 44,203 38,401 57,534
Milwaukee, WI 9 30 61,232 56,734 50,270 64,671
Programmer Analyst
Mid 50% Range
Plan, develop, test, debug and document computer software programs. Evaluate user requests for new or modified programs to determine feasibility, cost and time required and compatibility with current system. Formulate plan outline steps required to develop the program and submit plan for approval; upon approval develop program considering language, graphics, terminal display screen and printer capability.
82 © Property of Employer Association Group
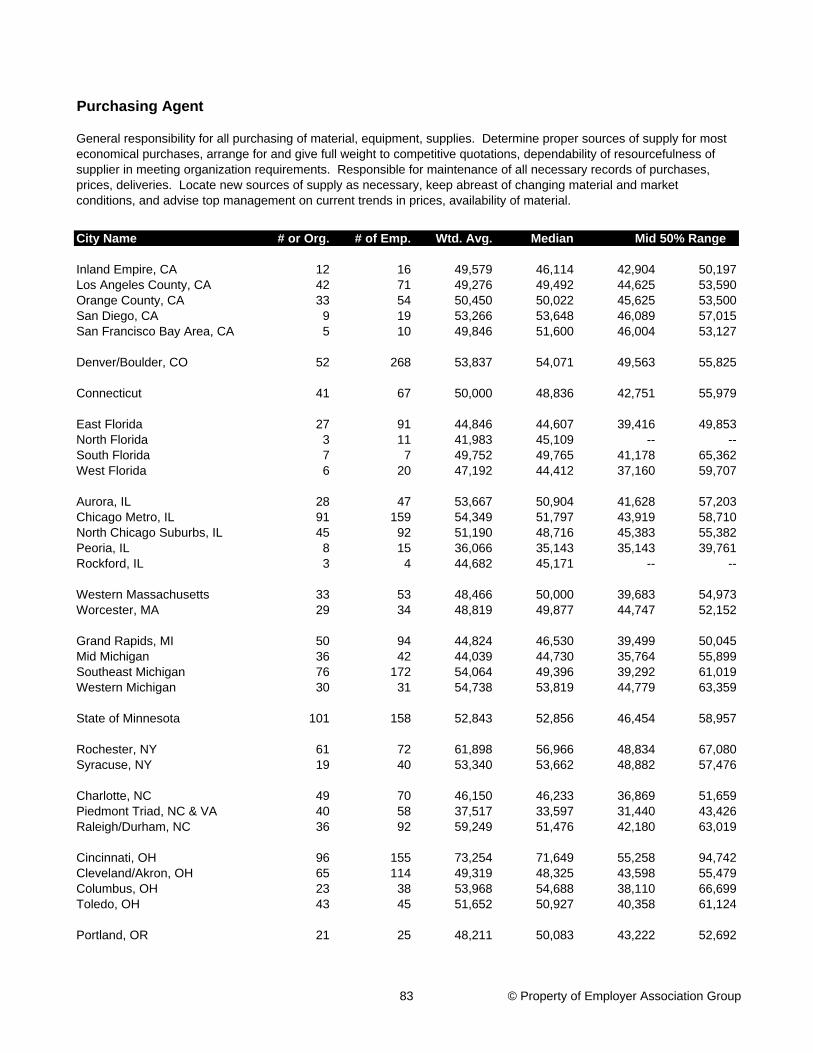
City Name # or Org. # of Emp. Wtd. Avg. Median
Inland Empire, CA 12 16 49,579 46,114 42,904 50,197Los Angeles County, CA 42 71 49,276 49,492 44,625 53,590Orange County, CA 33 54 50,450 50,022 45,625 53,500San Diego, CA 9 19 53,266 53,648 46,089 57,015San Francisco Bay Area, CA 5 10 49,846 51,600 46,004 53,127
Denver/Boulder, CO 52 268 53,837 54,071 49,563 55,825
Connecticut 41 67 50,000 48,836 42,751 55,979
East Florida 27 91 44,846 44,607 39,416 49,853North Florida 3 11 41,983 45,109 -- --South Florida 7 7 49,752 49,765 41,178 65,362West Florida 6 20 47,192 44,412 37,160 59,707
Aurora, IL 28 47 53,667 50,904 41,628 57,203Chicago Metro, IL 91 159 54,349 51,797 43,919 58,710North Chicago Suburbs, IL 45 92 51,190 48,716 45,383 55,382Peoria, IL 8 15 36,066 35,143 35,143 39,761Rockford, IL 3 4 44,682 45,171 -- --
Western Massachusetts 33 53 48,466 50,000 39,683 54,973Worcester, MA 29 34 48,819 49,877 44,747 52,152
Grand Rapids, MI 50 94 44,824 46,530 39,499 50,045Mid Michigan 36 42 44,039 44,730 35,764 55,899Southeast Michigan 76 172 54,064 49,396 39,292 61,019Western Michigan 30 31 54,738 53,819 44,779 63,359
State of Minnesota 101 158 52,843 52,856 46,454 58,957
Rochester, NY 61 72 61,898 56,966 48,834 67,080Syracuse, NY 19 40 53,340 53,662 48,882 57,476
Charlotte, NC 49 70 46,150 46,233 36,869 51,659Piedmont Triad, NC & VA 40 58 37,517 33,597 31,440 43,426Raleigh/Durham, NC 36 92 59,249 51,476 42,180 63,019
Cincinnati, OH 96 155 73,254 71,649 55,258 94,742Cleveland/Akron, OH 65 114 49,319 48,325 43,598 55,479Columbus, OH 23 38 53,968 54,688 38,110 66,699Toledo, OH 43 45 51,652 50,927 40,358 61,124
Portland, OR 21 25 48,211 50,083 43,222 52,692
Purchasing Agent
Mid 50% Range
General responsibility for all purchasing of material, equipment, supplies. Determine proper sources of supply for most economical purchases, arrange for and give full weight to competitive quotations, dependability of resourcefulness of supplier in meeting organization requirements. Responsible for maintenance of all necessary records of purchases, prices, deliveries. Locate new sources of supply as necessary, keep abreast of changing material and market conditions, and advise top management on current trends in prices, availability of material.
83 © Property of Employer Association Group

City Name # or Org. # of Emp. Wtd. Avg. Median
Purchasing Agent
Mid 50% Range
General responsibility for all purchasing of material, equipment, supplies. Determine proper sources of supply for most economical purchases, arrange for and give full weight to competitive quotations, dependability of resourcefulness of supplier in meeting organization requirements. Responsible for maintenance of all necessary records of purchases, prices, deliveries. Locate new sources of supply as necessary, keep abreast of changing material and market conditions, and advise top management on current trends in prices, availability of material.
Northwest, PA 17 25 33,735 29,004 25,968 37,489Philadelphia, PA 42 57 49,183 49,392 44,475 52,998Pittsburgh, PA 28 53 54,526 39,824 35,362 57,965Reading, PA 16 25 47,495 44,069 39,006 56,187
Spartanburg, SC 29 60 48,486 47,478 38,802 53,297
Western Washington State 74 75 53,291 51,005 43,966 60,696
Milwaukee, WI 67 120 46,986 45,867 40,776 49,363
84 © Property of Employer Association Group
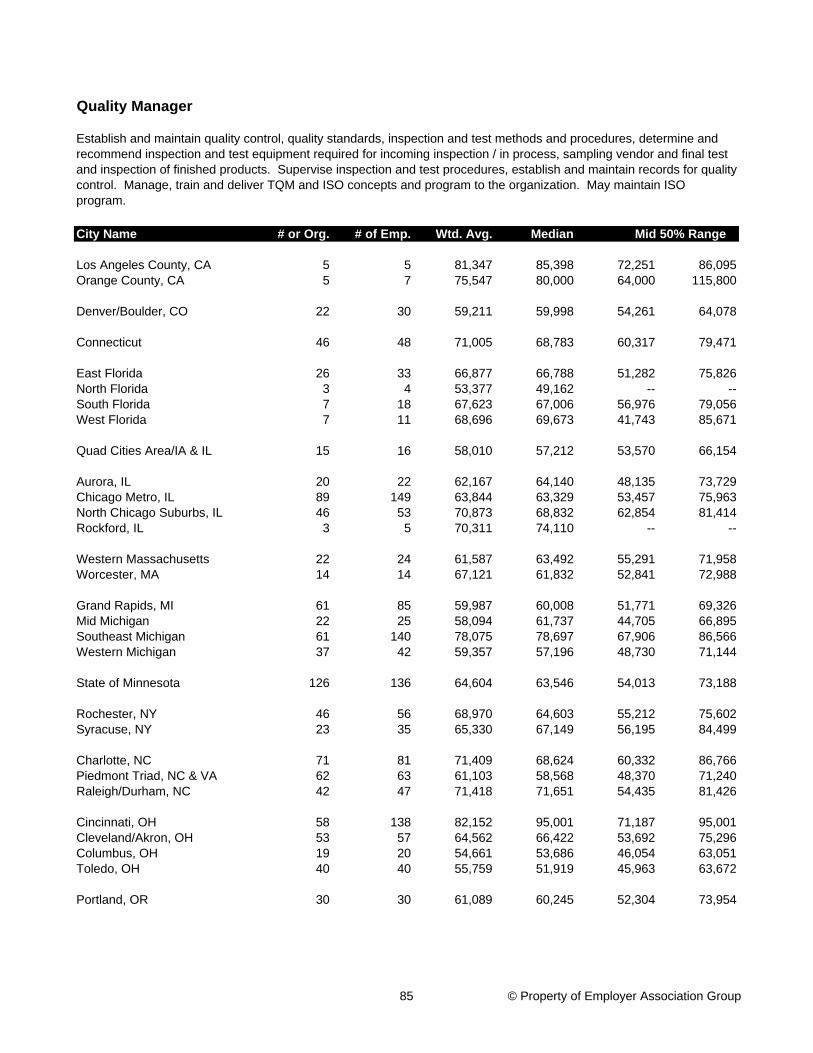
City Name # or Org. # of Emp. Wtd. Avg. Median
Los Angeles County, CA 5 5 81,347 85,398 72,251 86,095Orange County, CA 5 7 75,547 80,000 64,000 115,800
Denver/Boulder, CO 22 30 59,211 59,998 54,261 64,078
Connecticut 46 48 71,005 68,783 60,317 79,471
East Florida 26 33 66,877 66,788 51,282 75,826North Florida 3 4 53,377 49,162 -- --South Florida 7 18 67,623 67,006 56,976 79,056West Florida 7 11 68,696 69,673 41,743 85,671
Quad Cities Area/IA & IL 15 16 58,010 57,212 53,570 66,154
Aurora, IL 20 22 62,167 64,140 48,135 73,729Chicago Metro, IL 89 149 63,844 63,329 53,457 75,963North Chicago Suburbs, IL 46 53 70,873 68,832 62,854 81,414Rockford, IL 3 5 70,311 74,110 -- --
Western Massachusetts 22 24 61,587 63,492 55,291 71,958Worcester, MA 14 14 67,121 61,832 52,841 72,988
Grand Rapids, MI 61 85 59,987 60,008 51,771 69,326Mid Michigan 22 25 58,094 61,737 44,705 66,895Southeast Michigan 61 140 78,075 78,697 67,906 86,566Western Michigan 37 42 59,357 57,196 48,730 71,144
State of Minnesota 126 136 64,604 63,546 54,013 73,188
Rochester, NY 46 56 68,970 64,603 55,212 75,602Syracuse, NY 23 35 65,330 67,149 56,195 84,499
Charlotte, NC 71 81 71,409 68,624 60,332 86,766Piedmont Triad, NC & VA 62 63 61,103 58,568 48,370 71,240Raleigh/Durham, NC 42 47 71,418 71,651 54,435 81,426
Cincinnati, OH 58 138 82,152 95,001 71,187 95,001Cleveland/Akron, OH 53 57 64,562 66,422 53,692 75,296Columbus, OH 19 20 54,661 53,686 46,054 63,051Toledo, OH 40 40 55,759 51,919 45,963 63,672
Portland, OR 30 30 61,089 60,245 52,304 73,954
Quality Manager
Mid 50% Range
Establish and maintain quality control, quality standards, inspection and test methods and procedures, determine and recommend inspection and test equipment required for incoming inspection / in process, sampling vendor and final test and inspection of finished products. Supervise inspection and test procedures, establish and maintain records for quality control. Manage, train and deliver TQM and ISO concepts and program to the organization. May maintain ISO program.
85 © Property of Employer Association Group
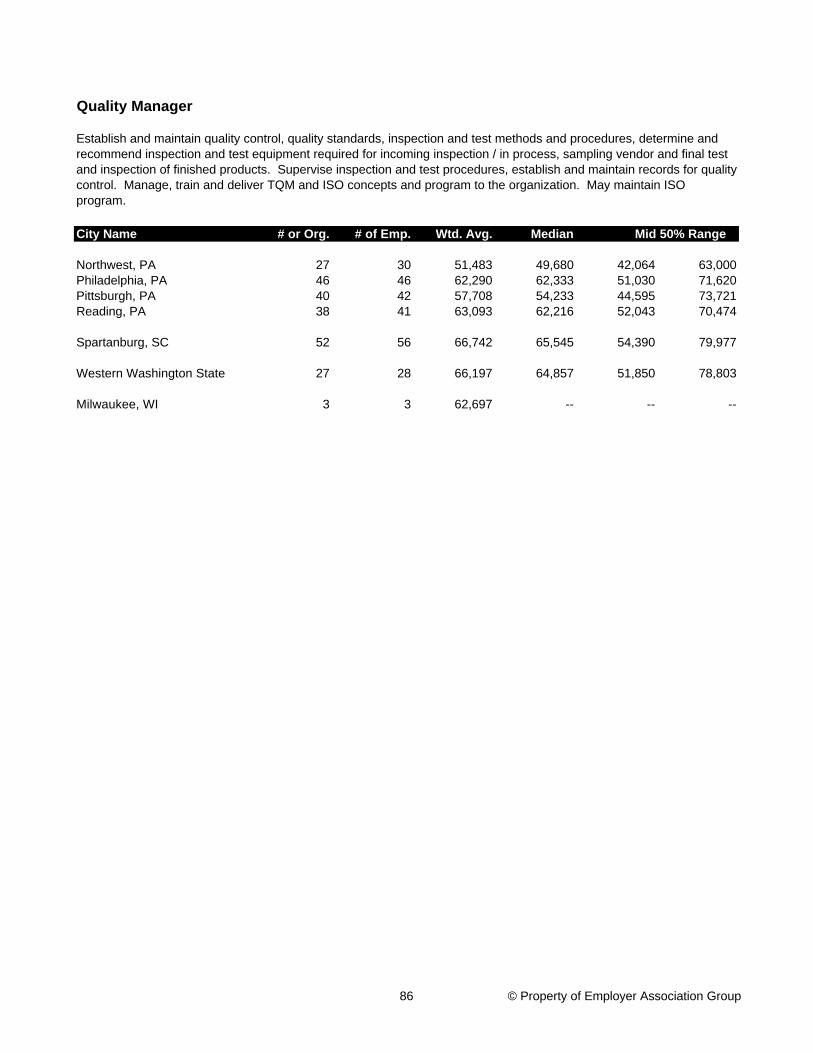
City Name # or Org. # of Emp. Wtd. Avg. Median
Quality Manager
Mid 50% Range
Establish and maintain quality control, quality standards, inspection and test methods and procedures, determine and recommend inspection and test equipment required for incoming inspection / in process, sampling vendor and final test and inspection of finished products. Supervise inspection and test procedures, establish and maintain records for quality control. Manage, train and deliver TQM and ISO concepts and program to the organization. May maintain ISO program.
Northwest, PA 27 30 51,483 49,680 42,064 63,000Philadelphia, PA 46 46 62,290 62,333 51,030 71,620Pittsburgh, PA 40 42 57,708 54,233 44,595 73,721Reading, PA 38 41 63,093 62,216 52,043 70,474
Spartanburg, SC 52 56 66,742 65,545 54,390 79,977
Western Washington State 27 28 66,197 64,857 51,850 78,803
Milwaukee, WI 3 3 62,697 -- -- --
86 © Property of Employer Association Group
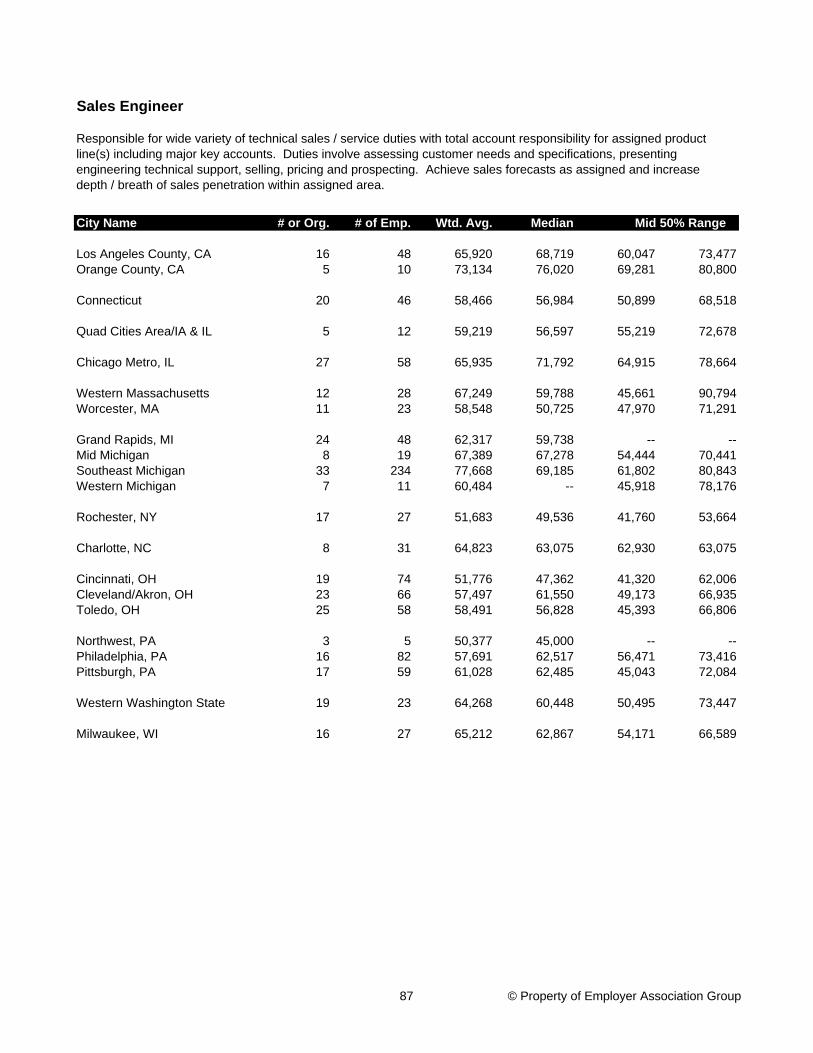
City Name # or Org. # of Emp. Wtd. Avg. Median
Los Angeles County, CA 16 48 65,920 68,719 60,047 73,477Orange County, CA 5 10 73,134 76,020 69,281 80,800
Connecticut 20 46 58,466 56,984 50,899 68,518
Quad Cities Area/IA & IL 5 12 59,219 56,597 55,219 72,678
Chicago Metro, IL 27 58 65,935 71,792 64,915 78,664
Western Massachusetts 12 28 67,249 59,788 45,661 90,794Worcester, MA 11 23 58,548 50,725 47,970 71,291
Grand Rapids, MI 24 48 62,317 59,738 -- --Mid Michigan 8 19 67,389 67,278 54,444 70,441Southeast Michigan 33 234 77,668 69,185 61,802 80,843Western Michigan 7 11 60,484 -- 45,918 78,176
Rochester, NY 17 27 51,683 49,536 41,760 53,664
Charlotte, NC 8 31 64,823 63,075 62,930 63,075
Cincinnati, OH 19 74 51,776 47,362 41,320 62,006Cleveland/Akron, OH 23 66 57,497 61,550 49,173 66,935Toledo, OH 25 58 58,491 56,828 45,393 66,806
Northwest, PA 3 5 50,377 45,000 -- --Philadelphia, PA 16 82 57,691 62,517 56,471 73,416Pittsburgh, PA 17 59 61,028 62,485 45,043 72,084
Western Washington State 19 23 64,268 60,448 50,495 73,447
Milwaukee, WI 16 27 65,212 62,867 54,171 66,589
Sales Engineer
Mid 50% Range
Responsible for wide variety of technical sales / service duties with total account responsibility for assigned product line(s) including major key accounts. Duties involve assessing customer needs and specifications, presenting engineering technical support, selling, pricing and prospecting. Achieve sales forecasts as assigned and increase depth / breath of sales penetration within assigned area.
87 © Property of Employer Association Group
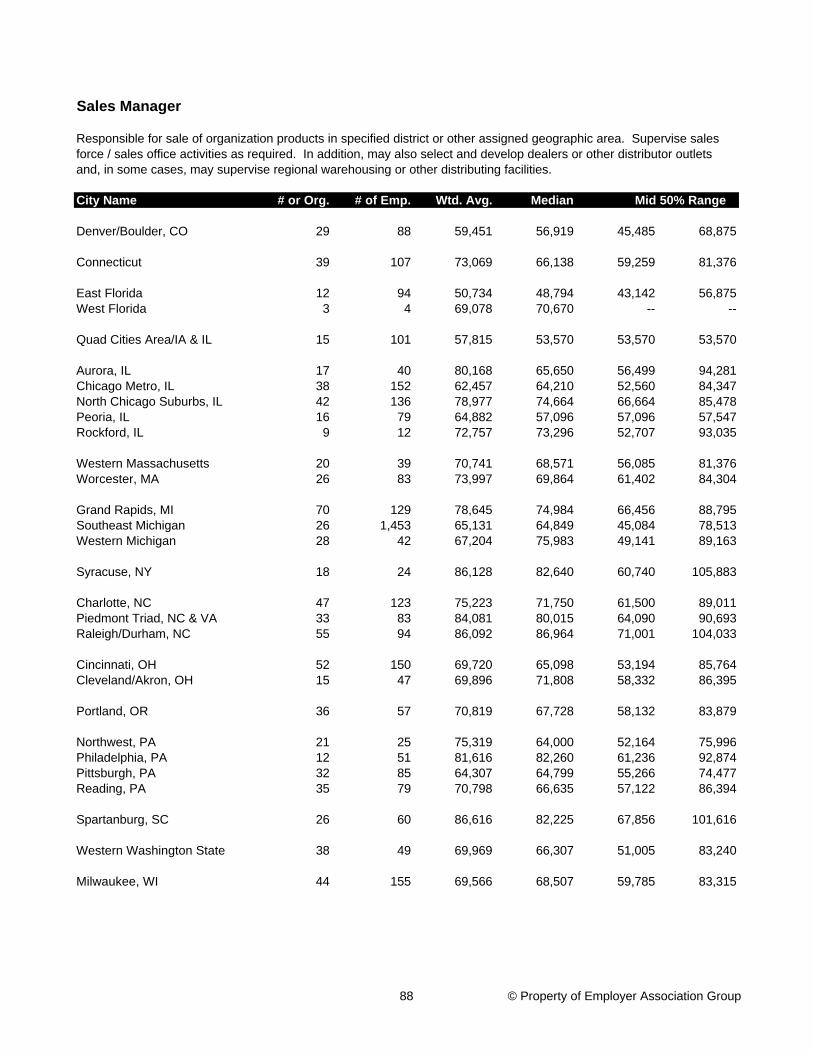
City Name # or Org. # of Emp. Wtd. Avg. Median
Denver/Boulder, CO 29 88 59,451 56,919 45,485 68,875
Connecticut 39 107 73,069 66,138 59,259 81,376
East Florida 12 94 50,734 48,794 43,142 56,875West Florida 3 4 69,078 70,670 -- --
Quad Cities Area/IA & IL 15 101 57,815 53,570 53,570 53,570
Aurora, IL 17 40 80,168 65,650 56,499 94,281Chicago Metro, IL 38 152 62,457 64,210 52,560 84,347North Chicago Suburbs, IL 42 136 78,977 74,664 66,664 85,478Peoria, IL 16 79 64,882 57,096 57,096 57,547Rockford, IL 9 12 72,757 73,296 52,707 93,035
Western Massachusetts 20 39 70,741 68,571 56,085 81,376Worcester, MA 26 83 73,997 69,864 61,402 84,304
Grand Rapids, MI 70 129 78,645 74,984 66,456 88,795Southeast Michigan 26 1,453 65,131 64,849 45,084 78,513Western Michigan 28 42 67,204 75,983 49,141 89,163
Syracuse, NY 18 24 86,128 82,640 60,740 105,883
Charlotte, NC 47 123 75,223 71,750 61,500 89,011Piedmont Triad, NC & VA 33 83 84,081 80,015 64,090 90,693Raleigh/Durham, NC 55 94 86,092 86,964 71,001 104,033
Cincinnati, OH 52 150 69,720 65,098 53,194 85,764Cleveland/Akron, OH 15 47 69,896 71,808 58,332 86,395
Portland, OR 36 57 70,819 67,728 58,132 83,879
Northwest, PA 21 25 75,319 64,000 52,164 75,996Philadelphia, PA 12 51 81,616 82,260 61,236 92,874Pittsburgh, PA 32 85 64,307 64,799 55,266 74,477Reading, PA 35 79 70,798 66,635 57,122 86,394
Spartanburg, SC 26 60 86,616 82,225 67,856 101,616
Western Washington State 38 49 69,969 66,307 51,005 83,240
Milwaukee, WI 44 155 69,566 68,507 59,785 83,315
Sales Manager
Mid 50% Range
Responsible for sale of organization products in specified district or other assigned geographic area. Supervise sales force / sales office activities as required. In addition, may also select and develop dealers or other distributor outlets and, in some cases, may supervise regional warehousing or other distributing facilities.
88 © Property of Employer Association Group
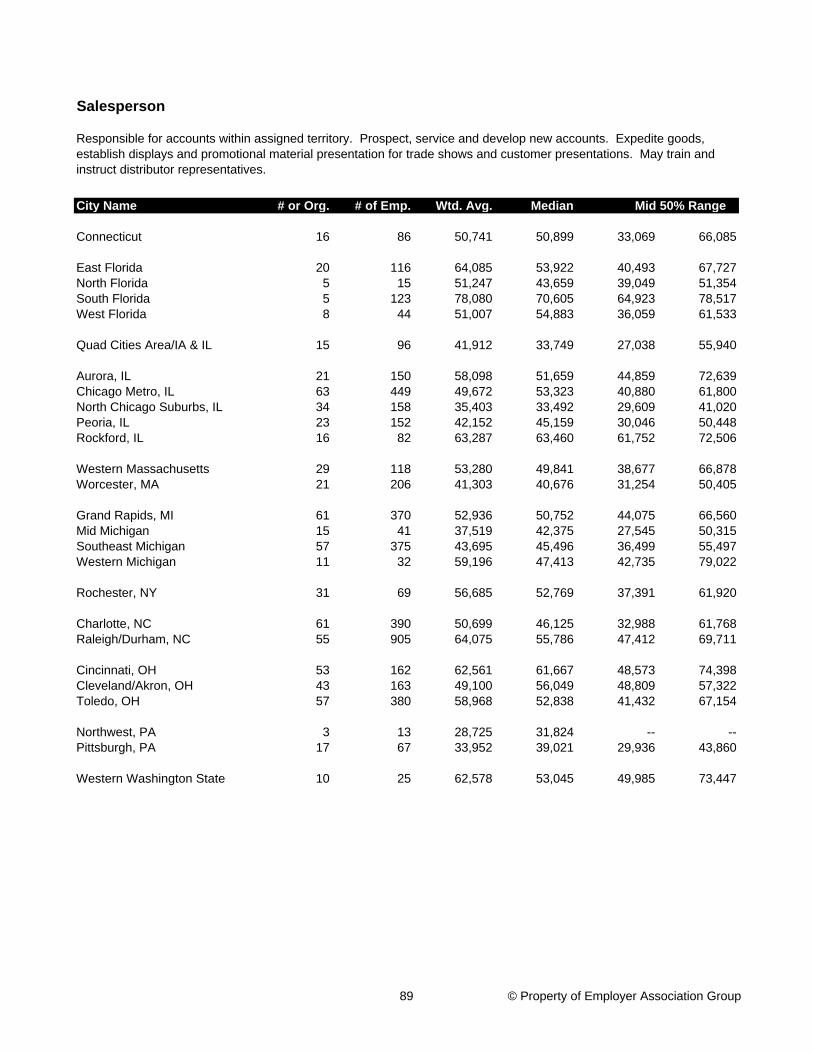
City Name # or Org. # of Emp. Wtd. Avg. Median
Connecticut 16 86 50,741 50,899 33,069 66,085
East Florida 20 116 64,085 53,922 40,493 67,727North Florida 5 15 51,247 43,659 39,049 51,354South Florida 5 123 78,080 70,605 64,923 78,517West Florida 8 44 51,007 54,883 36,059 61,533
Quad Cities Area/IA & IL 15 96 41,912 33,749 27,038 55,940
Aurora, IL 21 150 58,098 51,659 44,859 72,639Chicago Metro, IL 63 449 49,672 53,323 40,880 61,800North Chicago Suburbs, IL 34 158 35,403 33,492 29,609 41,020Peoria, IL 23 152 42,152 45,159 30,046 50,448Rockford, IL 16 82 63,287 63,460 61,752 72,506
Western Massachusetts 29 118 53,280 49,841 38,677 66,878Worcester, MA 21 206 41,303 40,676 31,254 50,405
Grand Rapids, MI 61 370 52,936 50,752 44,075 66,560Mid Michigan 15 41 37,519 42,375 27,545 50,315Southeast Michigan 57 375 43,695 45,496 36,499 55,497Western Michigan 11 32 59,196 47,413 42,735 79,022
Rochester, NY 31 69 56,685 52,769 37,391 61,920
Charlotte, NC 61 390 50,699 46,125 32,988 61,768Raleigh/Durham, NC 55 905 64,075 55,786 47,412 69,711
Cincinnati, OH 53 162 62,561 61,667 48,573 74,398Cleveland/Akron, OH 43 163 49,100 56,049 48,809 57,322Toledo, OH 57 380 58,968 52,838 41,432 67,154
Northwest, PA 3 13 28,725 31,824 -- --Pittsburgh, PA 17 67 33,952 39,021 29,936 43,860
Western Washington State 10 25 62,578 53,045 49,985 73,447
Salesperson
Mid 50% Range
Responsible for accounts within assigned territory. Prospect, service and develop new accounts. Expedite goods, establish displays and promotional material presentation for trade shows and customer presentations. May train and instruct distributor representatives.
89 © Property of Employer Association Group
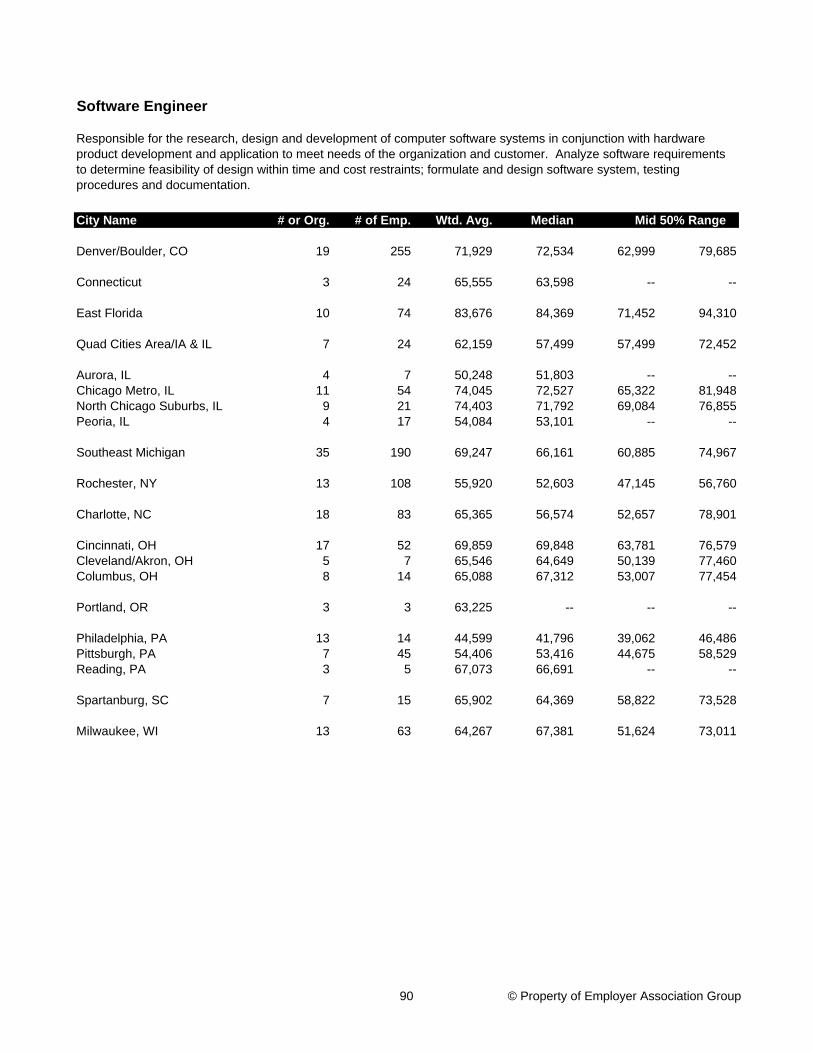
City Name # or Org. # of Emp. Wtd. Avg. Median
Denver/Boulder, CO 19 255 71,929 72,534 62,999 79,685
Connecticut 3 24 65,555 63,598 -- --
East Florida 10 74 83,676 84,369 71,452 94,310
Quad Cities Area/IA & IL 7 24 62,159 57,499 57,499 72,452
Aurora, IL 4 7 50,248 51,803 -- --Chicago Metro, IL 11 54 74,045 72,527 65,322 81,948North Chicago Suburbs, IL 9 21 74,403 71,792 69,084 76,855Peoria, IL 4 17 54,084 53,101 -- --
Southeast Michigan 35 190 69,247 66,161 60,885 74,967
Rochester, NY 13 108 55,920 52,603 47,145 56,760
Charlotte, NC 18 83 65,365 56,574 52,657 78,901
Cincinnati, OH 17 52 69,859 69,848 63,781 76,579Cleveland/Akron, OH 5 7 65,546 64,649 50,139 77,460Columbus, OH 8 14 65,088 67,312 53,007 77,454
Portland, OR 3 3 63,225 -- -- --
Philadelphia, PA 13 14 44,599 41,796 39,062 46,486Pittsburgh, PA 7 45 54,406 53,416 44,675 58,529Reading, PA 3 5 67,073 66,691 -- --
Spartanburg, SC 7 15 65,902 64,369 58,822 73,528
Milwaukee, WI 13 63 64,267 67,381 51,624 73,011
Software Engineer
Mid 50% Range
Responsible for the research, design and development of computer software systems in conjunction with hardware product development and application to meet needs of the organization and customer. Analyze software requirements to determine feasibility of design within time and cost restraints; formulate and design software system, testing procedures and documentation.
90 © Property of Employer Association Group
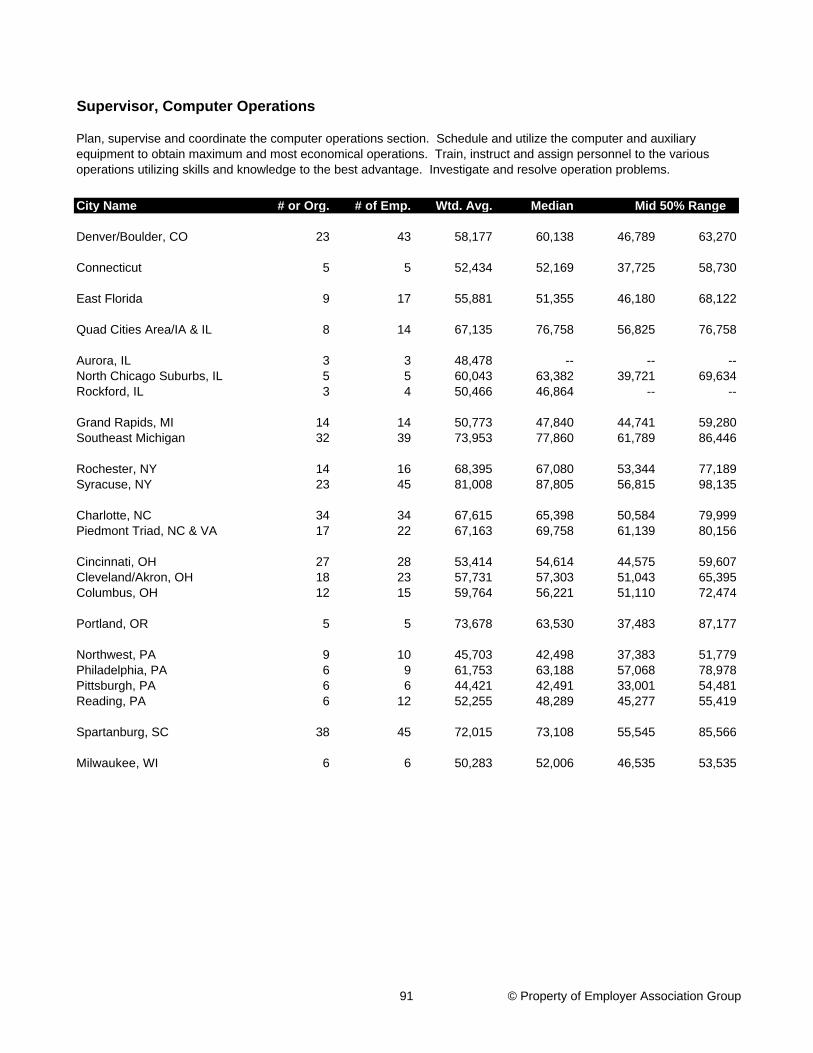
City Name # or Org. # of Emp. Wtd. Avg. Median
Denver/Boulder, CO 23 43 58,177 60,138 46,789 63,270
Connecticut 5 5 52,434 52,169 37,725 58,730
East Florida 9 17 55,881 51,355 46,180 68,122
Quad Cities Area/IA & IL 8 14 67,135 76,758 56,825 76,758
Aurora, IL 3 3 48,478 -- -- --North Chicago Suburbs, IL 5 5 60,043 63,382 39,721 69,634Rockford, IL 3 4 50,466 46,864 -- --
Grand Rapids, MI 14 14 50,773 47,840 44,741 59,280Southeast Michigan 32 39 73,953 77,860 61,789 86,446
Rochester, NY 14 16 68,395 67,080 53,344 77,189Syracuse, NY 23 45 81,008 87,805 56,815 98,135
Charlotte, NC 34 34 67,615 65,398 50,584 79,999Piedmont Triad, NC & VA 17 22 67,163 69,758 61,139 80,156
Cincinnati, OH 27 28 53,414 54,614 44,575 59,607Cleveland/Akron, OH 18 23 57,731 57,303 51,043 65,395Columbus, OH 12 15 59,764 56,221 51,110 72,474
Portland, OR 5 5 73,678 63,530 37,483 87,177
Northwest, PA 9 10 45,703 42,498 37,383 51,779Philadelphia, PA 6 9 61,753 63,188 57,068 78,978Pittsburgh, PA 6 6 44,421 42,491 33,001 54,481Reading, PA 6 12 52,255 48,289 45,277 55,419
Spartanburg, SC 38 45 72,015 73,108 55,545 85,566
Milwaukee, WI 6 6 50,283 52,006 46,535 53,535
Supervisor, Computer Operations
Mid 50% Range
Plan, supervise and coordinate the computer operations section. Schedule and utilize the computer and auxiliary equipment to obtain maximum and most economical operations. Train, instruct and assign personnel to the various operations utilizing skills and knowledge to the best advantage. Investigate and resolve operation problems.
91 © Property of Employer Association Group
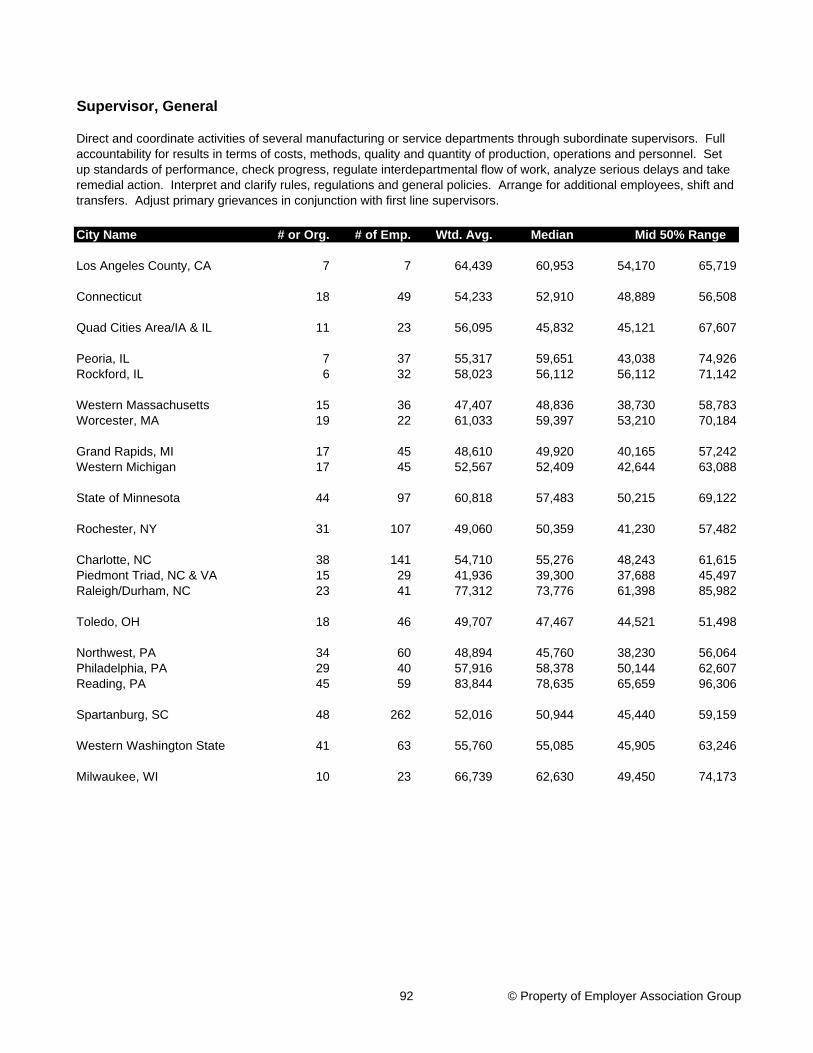
City Name # or Org. # of Emp. Wtd. Avg. Median
Los Angeles County, CA 7 7 64,439 60,953 54,170 65,719
Connecticut 18 49 54,233 52,910 48,889 56,508
Quad Cities Area/IA & IL 11 23 56,095 45,832 45,121 67,607
Peoria, IL 7 37 55,317 59,651 43,038 74,926Rockford, IL 6 32 58,023 56,112 56,112 71,142
Western Massachusetts 15 36 47,407 48,836 38,730 58,783Worcester, MA 19 22 61,033 59,397 53,210 70,184
Grand Rapids, MI 17 45 48,610 49,920 40,165 57,242Western Michigan 17 45 52,567 52,409 42,644 63,088
State of Minnesota 44 97 60,818 57,483 50,215 69,122
Rochester, NY 31 107 49,060 50,359 41,230 57,482
Charlotte, NC 38 141 54,710 55,276 48,243 61,615Piedmont Triad, NC & VA 15 29 41,936 39,300 37,688 45,497Raleigh/Durham, NC 23 41 77,312 73,776 61,398 85,982
Toledo, OH 18 46 49,707 47,467 44,521 51,498
Northwest, PA 34 60 48,894 45,760 38,230 56,064Philadelphia, PA 29 40 57,916 58,378 50,144 62,607Reading, PA 45 59 83,844 78,635 65,659 96,306
Spartanburg, SC 48 262 52,016 50,944 45,440 59,159
Western Washington State 41 63 55,760 55,085 45,905 63,246
Milwaukee, WI 10 23 66,739 62,630 49,450 74,173
Supervisor, General
Mid 50% Range
Direct and coordinate activities of several manufacturing or service departments through subordinate supervisors. Full accountability for results in terms of costs, methods, quality and quantity of production, operations and personnel. Set up standards of performance, check progress, regulate interdepartmental flow of work, analyze serious delays and take remedial action. Interpret and clarify rules, regulations and general policies. Arrange for additional employees, shift and transfers. Adjust primary grievances in conjunction with first line supervisors.
92 © Property of Employer Association Group
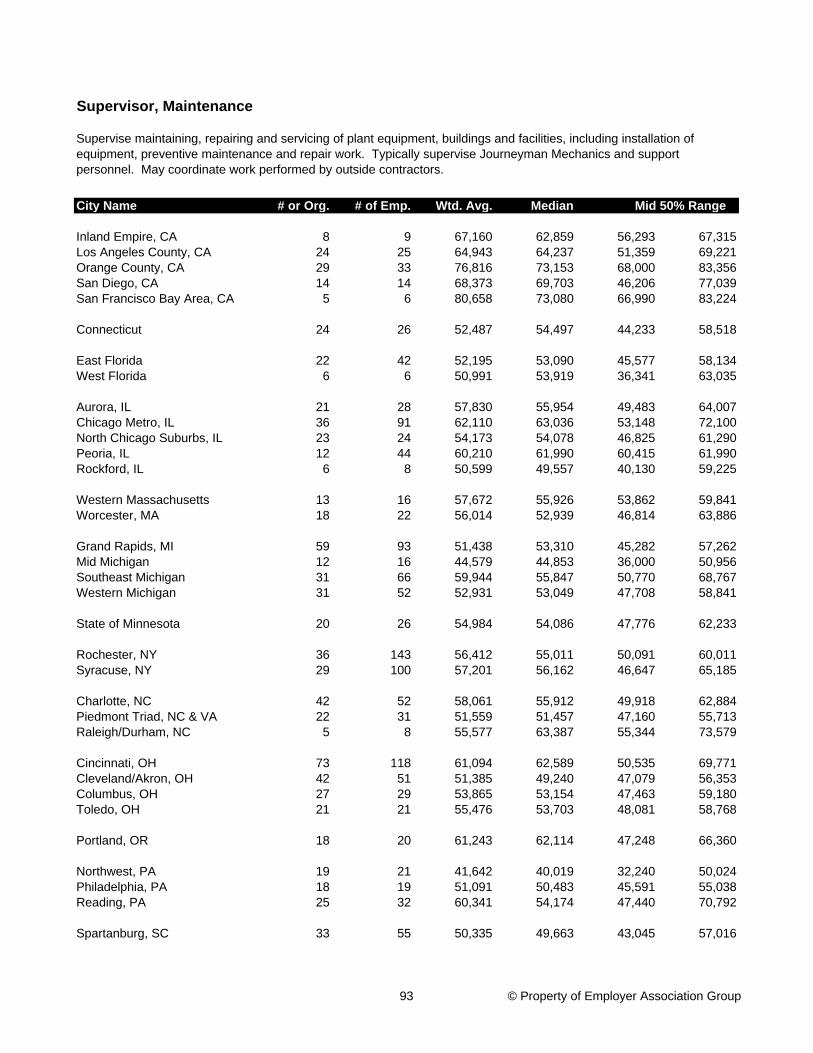
City Name # or Org. # of Emp. Wtd. Avg. Median
Inland Empire, CA 8 9 67,160 62,859 56,293 67,315Los Angeles County, CA 24 25 64,943 64,237 51,359 69,221Orange County, CA 29 33 76,816 73,153 68,000 83,356San Diego, CA 14 14 68,373 69,703 46,206 77,039San Francisco Bay Area, CA 5 6 80,658 73,080 66,990 83,224
Connecticut 24 26 52,487 54,497 44,233 58,518
East Florida 22 42 52,195 53,090 45,577 58,134West Florida 6 6 50,991 53,919 36,341 63,035
Aurora, IL 21 28 57,830 55,954 49,483 64,007Chicago Metro, IL 36 91 62,110 63,036 53,148 72,100North Chicago Suburbs, IL 23 24 54,173 54,078 46,825 61,290Peoria, IL 12 44 60,210 61,990 60,415 61,990Rockford, IL 6 8 50,599 49,557 40,130 59,225
Western Massachusetts 13 16 57,672 55,926 53,862 59,841Worcester, MA 18 22 56,014 52,939 46,814 63,886
Grand Rapids, MI 59 93 51,438 53,310 45,282 57,262Mid Michigan 12 16 44,579 44,853 36,000 50,956Southeast Michigan 31 66 59,944 55,847 50,770 68,767Western Michigan 31 52 52,931 53,049 47,708 58,841
State of Minnesota 20 26 54,984 54,086 47,776 62,233
Rochester, NY 36 143 56,412 55,011 50,091 60,011Syracuse, NY 29 100 57,201 56,162 46,647 65,185
Charlotte, NC 42 52 58,061 55,912 49,918 62,884Piedmont Triad, NC & VA 22 31 51,559 51,457 47,160 55,713Raleigh/Durham, NC 5 8 55,577 63,387 55,344 73,579
Cincinnati, OH 73 118 61,094 62,589 50,535 69,771Cleveland/Akron, OH 42 51 51,385 49,240 47,079 56,353Columbus, OH 27 29 53,865 53,154 47,463 59,180Toledo, OH 21 21 55,476 53,703 48,081 58,768
Portland, OR 18 20 61,243 62,114 47,248 66,360
Northwest, PA 19 21 41,642 40,019 32,240 50,024Philadelphia, PA 18 19 51,091 50,483 45,591 55,038Reading, PA 25 32 60,341 54,174 47,440 70,792
Spartanburg, SC 33 55 50,335 49,663 43,045 57,016
Supervisor, Maintenance
Mid 50% Range
Supervise maintaining, repairing and servicing of plant equipment, buildings and facilities, including installation of equipment, preventive maintenance and repair work. Typically supervise Journeyman Mechanics and support personnel. May coordinate work performed by outside contractors.
93 © Property of Employer Association Group

City Name # or Org. # of Emp. Wtd. Avg. Median
Supervisor, Maintenance
Mid 50% Range
Supervise maintaining, repairing and servicing of plant equipment, buildings and facilities, including installation of equipment, preventive maintenance and repair work. Typically supervise Journeyman Mechanics and support personnel. May coordinate work performed by outside contractors.
Western Washington State 33 41 48,497 45,905 42,436 55,369
Milwaukee, WI 20 27 57,472 58,726 52,783 65,623
94 © Property of Employer Association Group
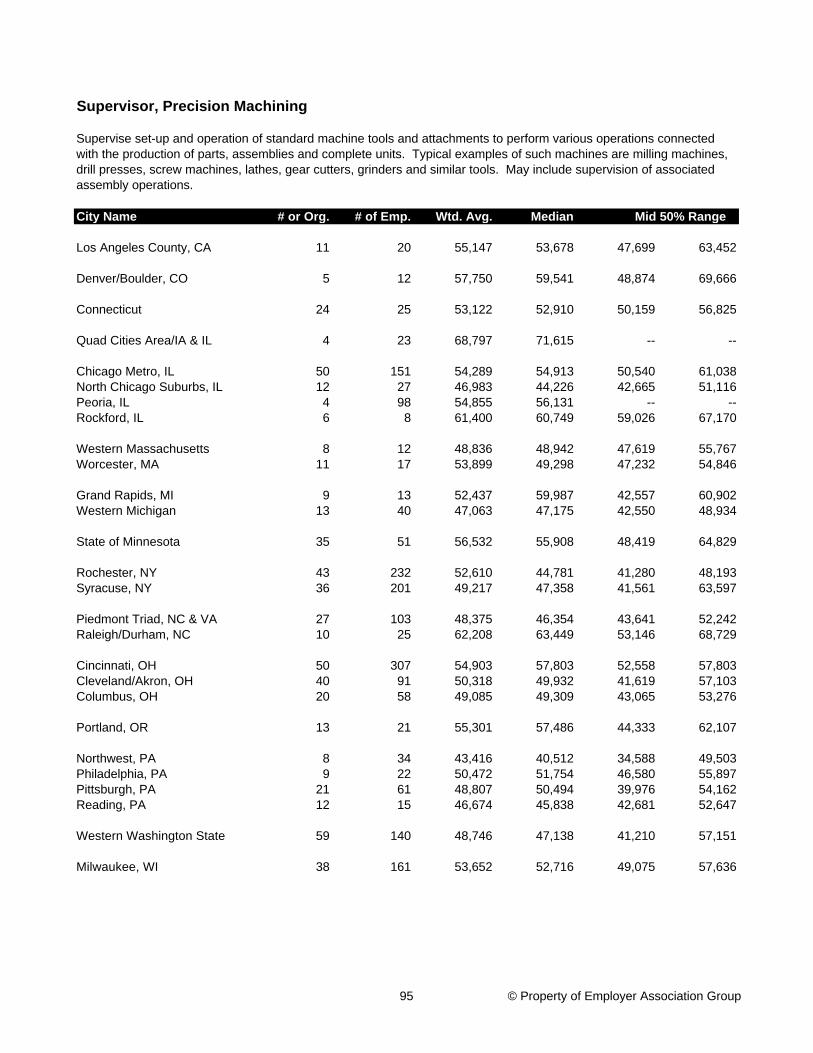
City Name # or Org. # of Emp. Wtd. Avg. Median
Los Angeles County, CA 11 20 55,147 53,678 47,699 63,452
Denver/Boulder, CO 5 12 57,750 59,541 48,874 69,666
Connecticut 24 25 53,122 52,910 50,159 56,825
Quad Cities Area/IA & IL 4 23 68,797 71,615 -- --
Chicago Metro, IL 50 151 54,289 54,913 50,540 61,038North Chicago Suburbs, IL 12 27 46,983 44,226 42,665 51,116Peoria, IL 4 98 54,855 56,131 -- --Rockford, IL 6 8 61,400 60,749 59,026 67,170
Western Massachusetts 8 12 48,836 48,942 47,619 55,767Worcester, MA 11 17 53,899 49,298 47,232 54,846
Grand Rapids, MI 9 13 52,437 59,987 42,557 60,902Western Michigan 13 40 47,063 47,175 42,550 48,934
State of Minnesota 35 51 56,532 55,908 48,419 64,829
Rochester, NY 43 232 52,610 44,781 41,280 48,193Syracuse, NY 36 201 49,217 47,358 41,561 63,597
Piedmont Triad, NC & VA 27 103 48,375 46,354 43,641 52,242Raleigh/Durham, NC 10 25 62,208 63,449 53,146 68,729
Cincinnati, OH 50 307 54,903 57,803 52,558 57,803Cleveland/Akron, OH 40 91 50,318 49,932 41,619 57,103Columbus, OH 20 58 49,085 49,309 43,065 53,276
Portland, OR 13 21 55,301 57,486 44,333 62,107
Northwest, PA 8 34 43,416 40,512 34,588 49,503Philadelphia, PA 9 22 50,472 51,754 46,580 55,897Pittsburgh, PA 21 61 48,807 50,494 39,976 54,162Reading, PA 12 15 46,674 45,838 42,681 52,647
Western Washington State 59 140 48,746 47,138 41,210 57,151
Milwaukee, WI 38 161 53,652 52,716 49,075 57,636
Supervisor, Precision Machining
Mid 50% Range
Supervise set-up and operation of standard machine tools and attachments to perform various operations connected with the production of parts, assemblies and complete units. Typical examples of such machines are milling machines, drill presses, screw machines, lathes, gear cutters, grinders and similar tools. May include supervision of associated assembly operations.
95 © Property of Employer Association Group
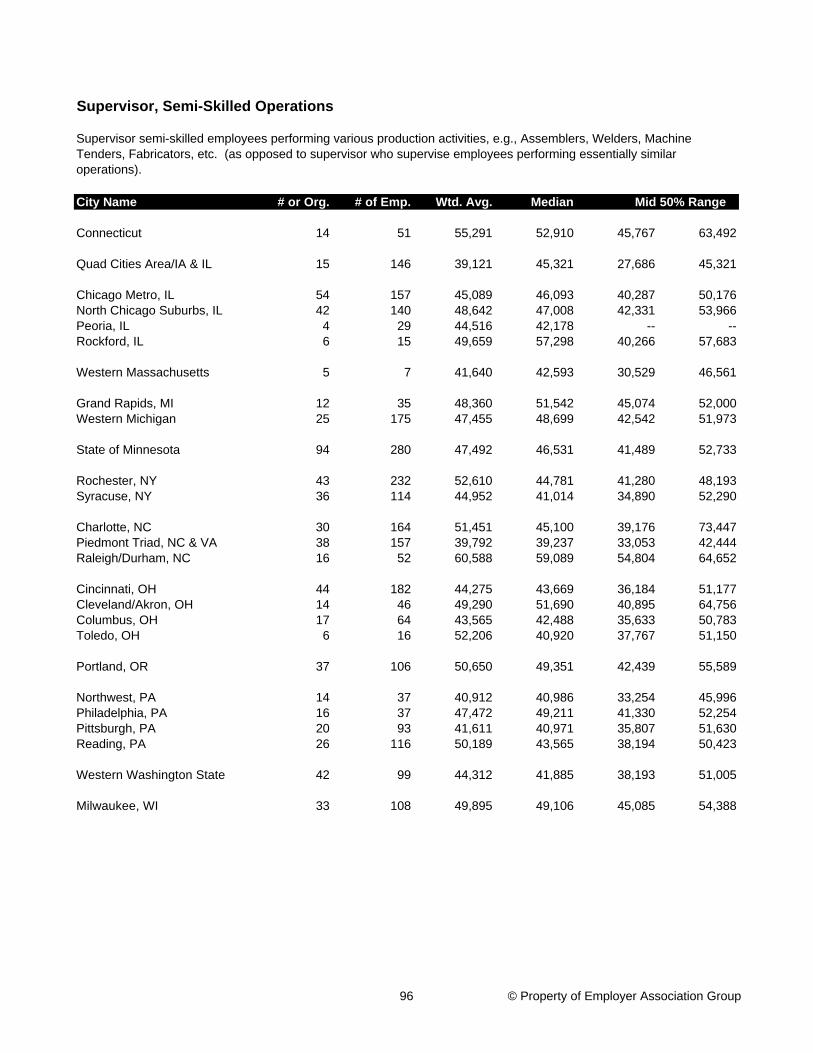
City Name # or Org. # of Emp. Wtd. Avg. Median
Connecticut 14 51 55,291 52,910 45,767 63,492
Quad Cities Area/IA & IL 15 146 39,121 45,321 27,686 45,321
Chicago Metro, IL 54 157 45,089 46,093 40,287 50,176North Chicago Suburbs, IL 42 140 48,642 47,008 42,331 53,966Peoria, IL 4 29 44,516 42,178 -- --Rockford, IL 6 15 49,659 57,298 40,266 57,683
Western Massachusetts 5 7 41,640 42,593 30,529 46,561
Grand Rapids, MI 12 35 48,360 51,542 45,074 52,000Western Michigan 25 175 47,455 48,699 42,542 51,973
State of Minnesota 94 280 47,492 46,531 41,489 52,733
Rochester, NY 43 232 52,610 44,781 41,280 48,193Syracuse, NY 36 114 44,952 41,014 34,890 52,290
Charlotte, NC 30 164 51,451 45,100 39,176 73,447Piedmont Triad, NC & VA 38 157 39,792 39,237 33,053 42,444Raleigh/Durham, NC 16 52 60,588 59,089 54,804 64,652
Cincinnati, OH 44 182 44,275 43,669 36,184 51,177Cleveland/Akron, OH 14 46 49,290 51,690 40,895 64,756Columbus, OH 17 64 43,565 42,488 35,633 50,783Toledo, OH 6 16 52,206 40,920 37,767 51,150
Portland, OR 37 106 50,650 49,351 42,439 55,589
Northwest, PA 14 37 40,912 40,986 33,254 45,996Philadelphia, PA 16 37 47,472 49,211 41,330 52,254Pittsburgh, PA 20 93 41,611 40,971 35,807 51,630Reading, PA 26 116 50,189 43,565 38,194 50,423
Western Washington State 42 99 44,312 41,885 38,193 51,005
Milwaukee, WI 33 108 49,895 49,106 45,085 54,388
Supervisor, Semi-Skilled Operations
Mid 50% Range
Supervisor semi-skilled employees performing various production activities, e.g., Assemblers, Welders, Machine Tenders, Fabricators, etc. (as opposed to supervisor who supervise employees performing essentially similar operations).
96 © Property of Employer Association Group
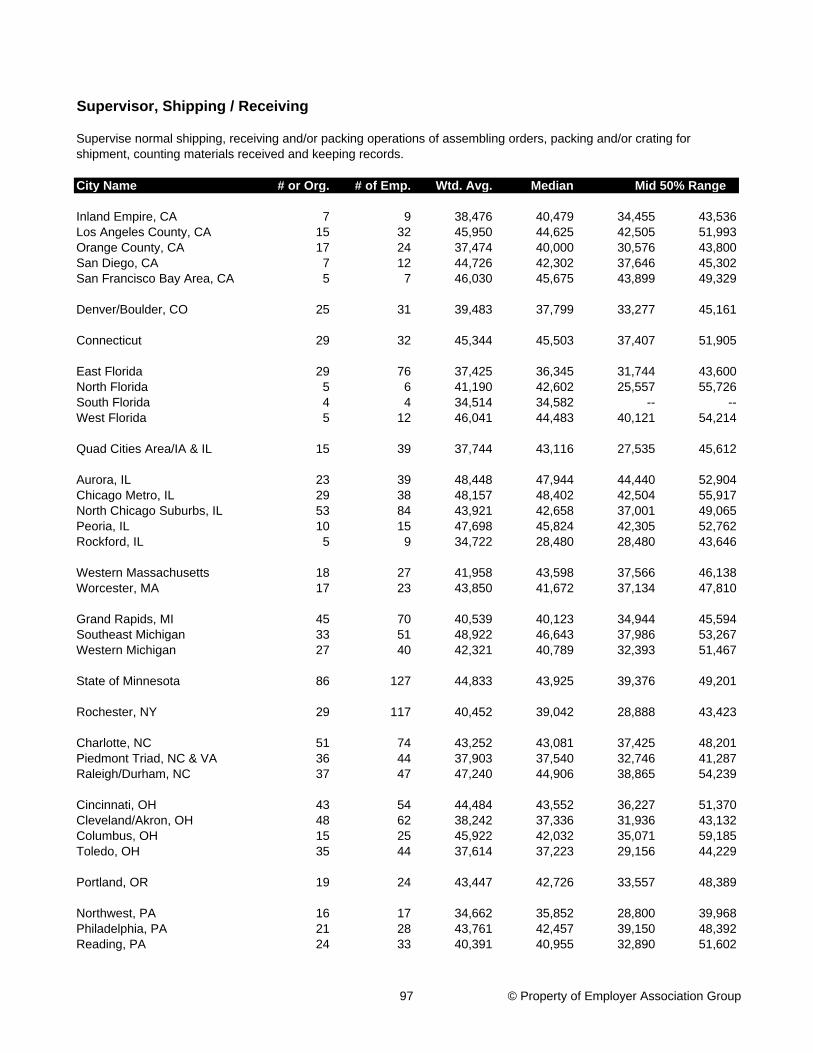
City Name # or Org. # of Emp. Wtd. Avg. Median
Inland Empire, CA 7 9 38,476 40,479 34,455 43,536Los Angeles County, CA 15 32 45,950 44,625 42,505 51,993Orange County, CA 17 24 37,474 40,000 30,576 43,800San Diego, CA 7 12 44,726 42,302 37,646 45,302San Francisco Bay Area, CA 5 7 46,030 45,675 43,899 49,329
Denver/Boulder, CO 25 31 39,483 37,799 33,277 45,161
Connecticut 29 32 45,344 45,503 37,407 51,905
East Florida 29 76 37,425 36,345 31,744 43,600North Florida 5 6 41,190 42,602 25,557 55,726South Florida 4 4 34,514 34,582 -- --West Florida 5 12 46,041 44,483 40,121 54,214
Quad Cities Area/IA & IL 15 39 37,744 43,116 27,535 45,612
Aurora, IL 23 39 48,448 47,944 44,440 52,904Chicago Metro, IL 29 38 48,157 48,402 42,504 55,917North Chicago Suburbs, IL 53 84 43,921 42,658 37,001 49,065Peoria, IL 10 15 47,698 45,824 42,305 52,762Rockford, IL 5 9 34,722 28,480 28,480 43,646
Western Massachusetts 18 27 41,958 43,598 37,566 46,138Worcester, MA 17 23 43,850 41,672 37,134 47,810
Grand Rapids, MI 45 70 40,539 40,123 34,944 45,594Southeast Michigan 33 51 48,922 46,643 37,986 53,267Western Michigan 27 40 42,321 40,789 32,393 51,467
State of Minnesota 86 127 44,833 43,925 39,376 49,201
Rochester, NY 29 117 40,452 39,042 28,888 43,423
Charlotte, NC 51 74 43,252 43,081 37,425 48,201Piedmont Triad, NC & VA 36 44 37,903 37,540 32,746 41,287Raleigh/Durham, NC 37 47 47,240 44,906 38,865 54,239
Cincinnati, OH 43 54 44,484 43,552 36,227 51,370Cleveland/Akron, OH 48 62 38,242 37,336 31,936 43,132Columbus, OH 15 25 45,922 42,032 35,071 59,185Toledo, OH 35 44 37,614 37,223 29,156 44,229
Portland, OR 19 24 43,447 42,726 33,557 48,389
Northwest, PA 16 17 34,662 35,852 28,800 39,968Philadelphia, PA 21 28 43,761 42,457 39,150 48,392Reading, PA 24 33 40,391 40,955 32,890 51,602
Supervisor, Shipping / Receiving
Mid 50% Range
Supervise normal shipping, receiving and/or packing operations of assembling orders, packing and/or crating for shipment, counting materials received and keeping records.
97 © Property of Employer Association Group
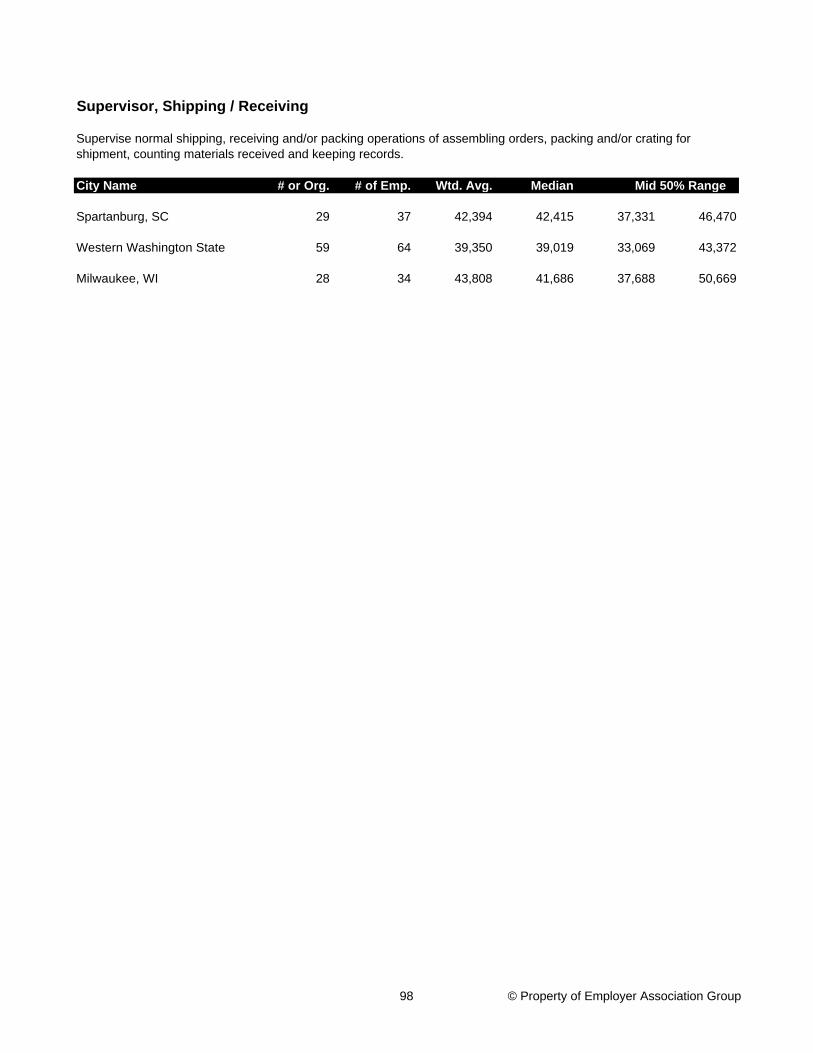
City Name # or Org. # of Emp. Wtd. Avg. Median
Supervisor, Shipping / Receiving
Mid 50% Range
Supervise normal shipping, receiving and/or packing operations of assembling orders, packing and/or crating for shipment, counting materials received and keeping records.
Spartanburg, SC 29 37 42,394 42,415 37,331 46,470
Western Washington State 59 64 39,350 39,019 33,069 43,372
Milwaukee, WI 28 34 43,808 41,686 37,688 50,669
98 © Property of Employer Association Group
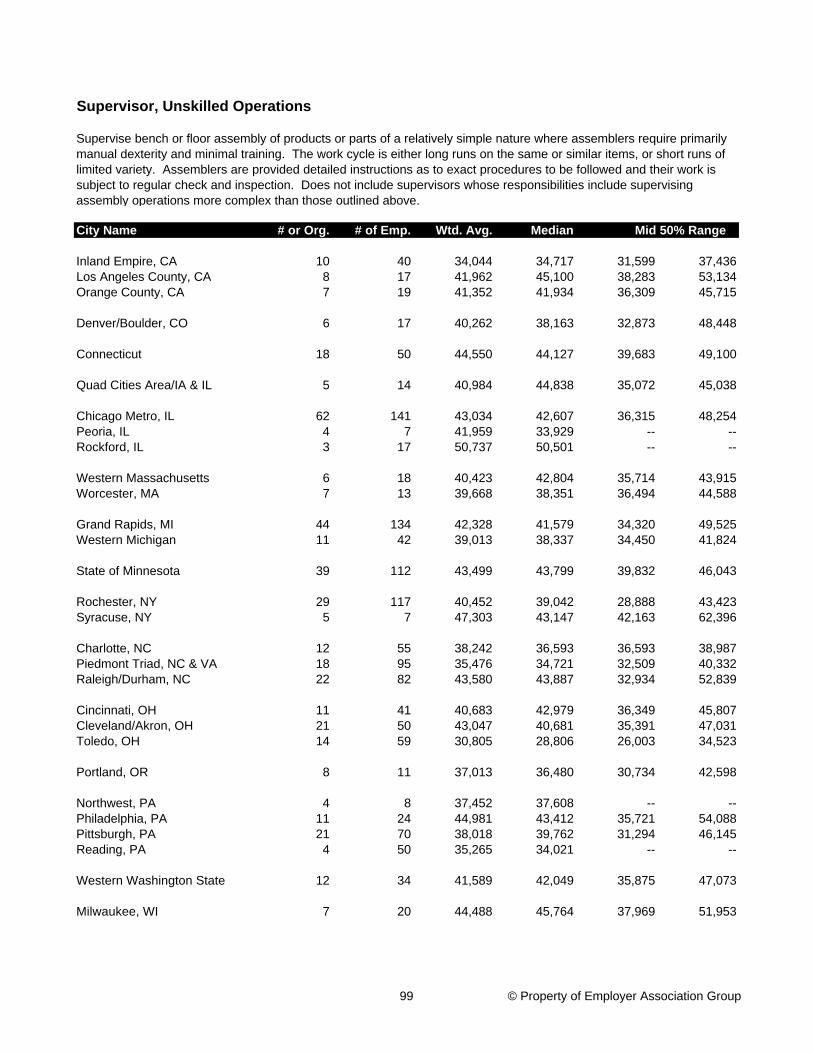
City Name # or Org. # of Emp. Wtd. Avg. Median
Inland Empire, CA 10 40 34,044 34,717 31,599 37,436Los Angeles County, CA 8 17 41,962 45,100 38,283 53,134Orange County, CA 7 19 41,352 41,934 36,309 45,715
Denver/Boulder, CO 6 17 40,262 38,163 32,873 48,448
Connecticut 18 50 44,550 44,127 39,683 49,100
Quad Cities Area/IA & IL 5 14 40,984 44,838 35,072 45,038
Chicago Metro, IL 62 141 43,034 42,607 36,315 48,254Peoria, IL 4 7 41,959 33,929 -- --Rockford, IL 3 17 50,737 50,501 -- --
Western Massachusetts 6 18 40,423 42,804 35,714 43,915Worcester, MA 7 13 39,668 38,351 36,494 44,588
Grand Rapids, MI 44 134 42,328 41,579 34,320 49,525Western Michigan 11 42 39,013 38,337 34,450 41,824
State of Minnesota 39 112 43,499 43,799 39,832 46,043
Rochester, NY 29 117 40,452 39,042 28,888 43,423Syracuse, NY 5 7 47,303 43,147 42,163 62,396
Charlotte, NC 12 55 38,242 36,593 36,593 38,987Piedmont Triad, NC & VA 18 95 35,476 34,721 32,509 40,332Raleigh/Durham, NC 22 82 43,580 43,887 32,934 52,839
Cincinnati, OH 11 41 40,683 42,979 36,349 45,807Cleveland/Akron, OH 21 50 43,047 40,681 35,391 47,031Toledo, OH 14 59 30,805 28,806 26,003 34,523
Portland, OR 8 11 37,013 36,480 30,734 42,598
Northwest, PA 4 8 37,452 37,608 -- --Philadelphia, PA 11 24 44,981 43,412 35,721 54,088Pittsburgh, PA 21 70 38,018 39,762 31,294 46,145Reading, PA 4 50 35,265 34,021 -- --
Western Washington State 12 34 41,589 42,049 35,875 47,073
Milwaukee, WI 7 20 44,488 45,764 37,969 51,953
Supervisor, Unskilled Operations
Mid 50% Range
Supervise bench or floor assembly of products or parts of a relatively simple nature where assemblers require primarily manual dexterity and minimal training. The work cycle is either long runs on the same or similar items, or short runs of limited variety. Assemblers are provided detailed instructions as to exact procedures to be followed and their work is subject to regular check and inspection. Does not include supervisors whose responsibilities include supervising assembly operations more complex than those outlined above.
99 © Property of Employer Association Group
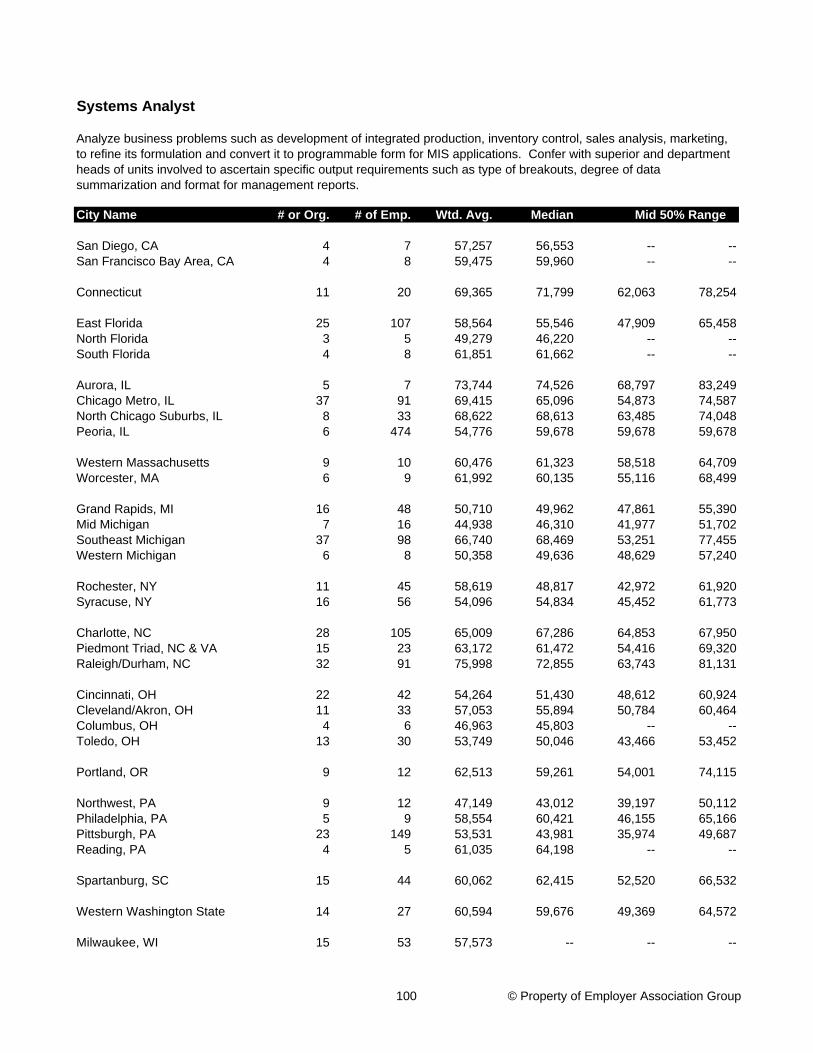
City Name # or Org. # of Emp. Wtd. Avg. Median
San Diego, CA 4 7 57,257 56,553 -- --San Francisco Bay Area, CA 4 8 59,475 59,960 -- --
Connecticut 11 20 69,365 71,799 62,063 78,254
East Florida 25 107 58,564 55,546 47,909 65,458North Florida 3 5 49,279 46,220 -- --South Florida 4 8 61,851 61,662 -- --
Aurora, IL 5 7 73,744 74,526 68,797 83,249Chicago Metro, IL 37 91 69,415 65,096 54,873 74,587North Chicago Suburbs, IL 8 33 68,622 68,613 63,485 74,048Peoria, IL 6 474 54,776 59,678 59,678 59,678
Western Massachusetts 9 10 60,476 61,323 58,518 64,709Worcester, MA 6 9 61,992 60,135 55,116 68,499
Grand Rapids, MI 16 48 50,710 49,962 47,861 55,390Mid Michigan 7 16 44,938 46,310 41,977 51,702Southeast Michigan 37 98 66,740 68,469 53,251 77,455Western Michigan 6 8 50,358 49,636 48,629 57,240
Rochester, NY 11 45 58,619 48,817 42,972 61,920Syracuse, NY 16 56 54,096 54,834 45,452 61,773
Charlotte, NC 28 105 65,009 67,286 64,853 67,950Piedmont Triad, NC & VA 15 23 63,172 61,472 54,416 69,320Raleigh/Durham, NC 32 91 75,998 72,855 63,743 81,131
Cincinnati, OH 22 42 54,264 51,430 48,612 60,924Cleveland/Akron, OH 11 33 57,053 55,894 50,784 60,464Columbus, OH 4 6 46,963 45,803 -- --Toledo, OH 13 30 53,749 50,046 43,466 53,452
Portland, OR 9 12 62,513 59,261 54,001 74,115
Northwest, PA 9 12 47,149 43,012 39,197 50,112Philadelphia, PA 5 9 58,554 60,421 46,155 65,166Pittsburgh, PA 23 149 53,531 43,981 35,974 49,687Reading, PA 4 5 61,035 64,198 -- --
Spartanburg, SC 15 44 60,062 62,415 52,520 66,532
Western Washington State 14 27 60,594 59,676 49,369 64,572
Milwaukee, WI 15 53 57,573 -- -- --
Systems Analyst
Mid 50% Range
Analyze business problems such as development of integrated production, inventory control, sales analysis, marketing, to refine its formulation and convert it to programmable form for MIS applications. Confer with superior and department heads of units involved to ascertain specific output requirements such as type of breakouts, degree of data summarization and format for management reports.
100 © Property of Employer Association Group
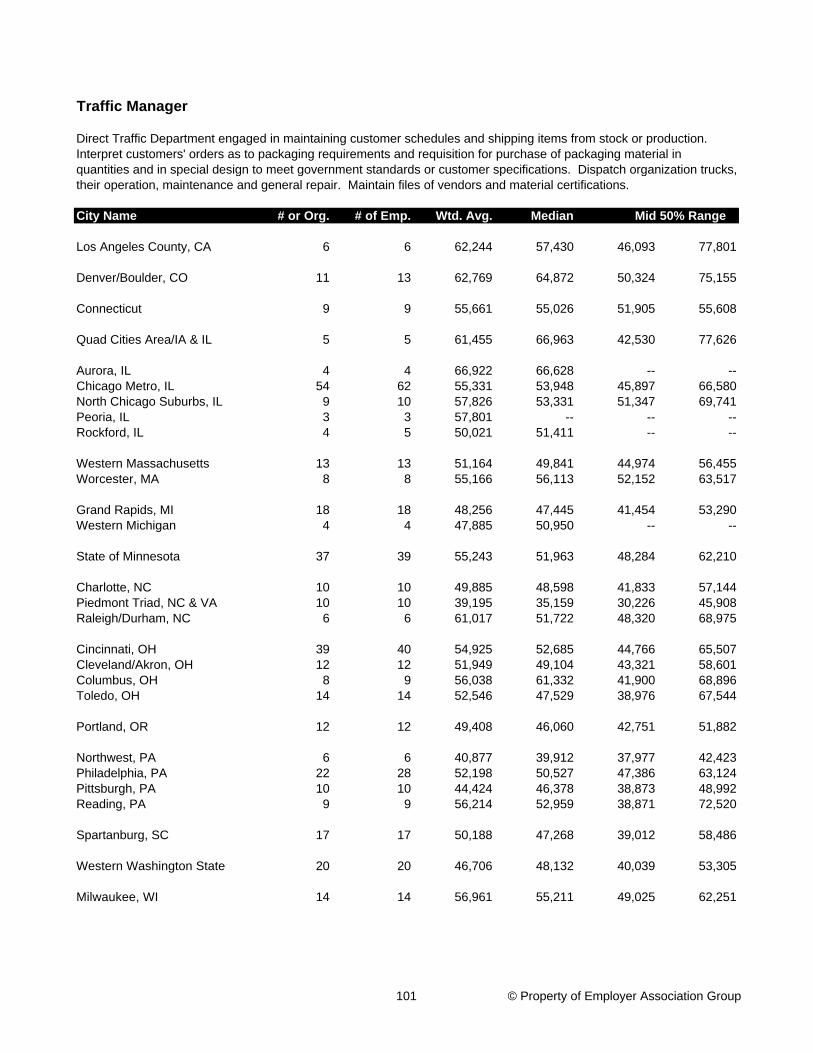
City Name # or Org. # of Emp. Wtd. Avg. Median
Los Angeles County, CA 6 6 62,244 57,430 46,093 77,801
Denver/Boulder, CO 11 13 62,769 64,872 50,324 75,155
Connecticut 9 9 55,661 55,026 51,905 55,608
Quad Cities Area/IA & IL 5 5 61,455 66,963 42,530 77,626
Aurora, IL 4 4 66,922 66,628 -- --Chicago Metro, IL 54 62 55,331 53,948 45,897 66,580North Chicago Suburbs, IL 9 10 57,826 53,331 51,347 69,741Peoria, IL 3 3 57,801 -- -- --Rockford, IL 4 5 50,021 51,411 -- --
Western Massachusetts 13 13 51,164 49,841 44,974 56,455Worcester, MA 8 8 55,166 56,113 52,152 63,517
Grand Rapids, MI 18 18 48,256 47,445 41,454 53,290Western Michigan 4 4 47,885 50,950 -- --
State of Minnesota 37 39 55,243 51,963 48,284 62,210
Charlotte, NC 10 10 49,885 48,598 41,833 57,144Piedmont Triad, NC & VA 10 10 39,195 35,159 30,226 45,908Raleigh/Durham, NC 6 6 61,017 51,722 48,320 68,975
Cincinnati, OH 39 40 54,925 52,685 44,766 65,507Cleveland/Akron, OH 12 12 51,949 49,104 43,321 58,601Columbus, OH 8 9 56,038 61,332 41,900 68,896Toledo, OH 14 14 52,546 47,529 38,976 67,544
Portland, OR 12 12 49,408 46,060 42,751 51,882
Northwest, PA 6 6 40,877 39,912 37,977 42,423Philadelphia, PA 22 28 52,198 50,527 47,386 63,124Pittsburgh, PA 10 10 44,424 46,378 38,873 48,992Reading, PA 9 9 56,214 52,959 38,871 72,520
Spartanburg, SC 17 17 50,188 47,268 39,012 58,486
Western Washington State 20 20 46,706 48,132 40,039 53,305
Milwaukee, WI 14 14 56,961 55,211 49,025 62,251
Traffic Manager
Mid 50% Range
Direct Traffic Department engaged in maintaining customer schedules and shipping items from stock or production. Interpret customers' orders as to packaging requirements and requisition for purchase of packaging material in quantities and in special design to meet government standards or customer specifications. Dispatch organization trucks, their operation, maintenance and general repair. Maintain files of vendors and material certifications.
101 © Property of Employer Association Group
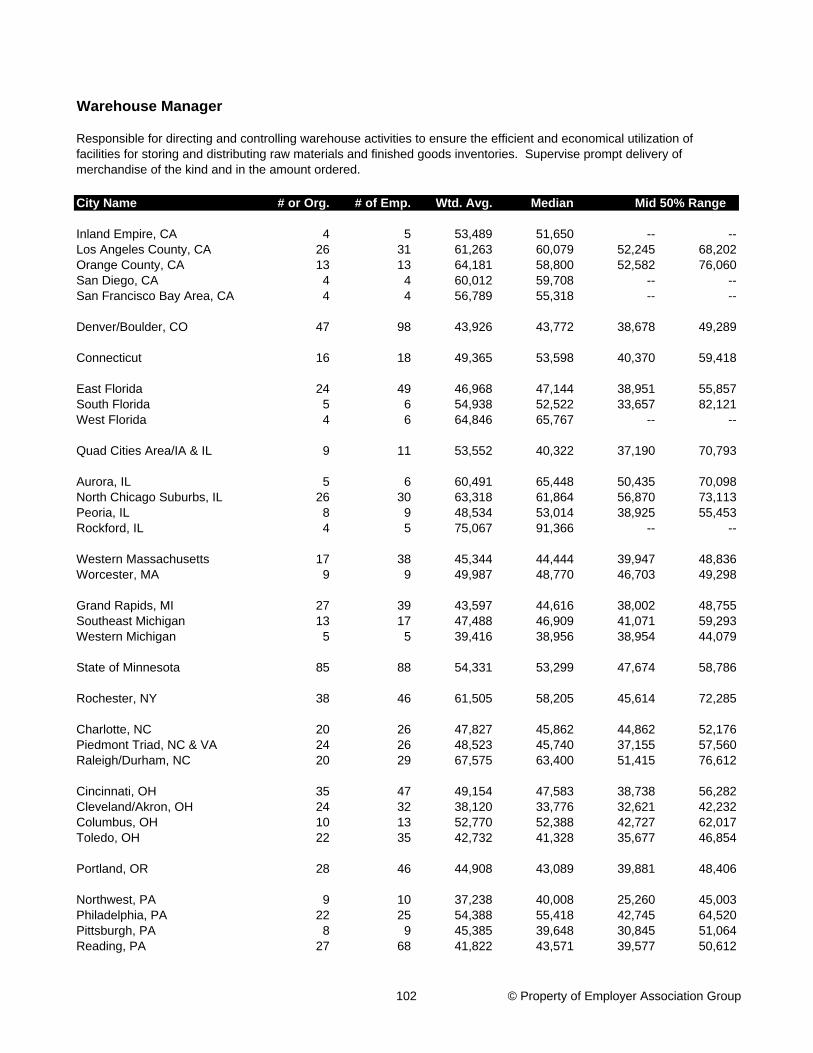
City Name # or Org. # of Emp. Wtd. Avg. Median
Inland Empire, CA 4 5 53,489 51,650 -- --Los Angeles County, CA 26 31 61,263 60,079 52,245 68,202Orange County, CA 13 13 64,181 58,800 52,582 76,060San Diego, CA 4 4 60,012 59,708 -- --San Francisco Bay Area, CA 4 4 56,789 55,318 -- --
Denver/Boulder, CO 47 98 43,926 43,772 38,678 49,289
Connecticut 16 18 49,365 53,598 40,370 59,418
East Florida 24 49 46,968 47,144 38,951 55,857South Florida 5 6 54,938 52,522 33,657 82,121West Florida 4 6 64,846 65,767 -- --
Quad Cities Area/IA & IL 9 11 53,552 40,322 37,190 70,793
Aurora, IL 5 6 60,491 65,448 50,435 70,098North Chicago Suburbs, IL 26 30 63,318 61,864 56,870 73,113Peoria, IL 8 9 48,534 53,014 38,925 55,453Rockford, IL 4 5 75,067 91,366 -- --
Western Massachusetts 17 38 45,344 44,444 39,947 48,836Worcester, MA 9 9 49,987 48,770 46,703 49,298
Grand Rapids, MI 27 39 43,597 44,616 38,002 48,755Southeast Michigan 13 17 47,488 46,909 41,071 59,293Western Michigan 5 5 39,416 38,956 38,954 44,079
State of Minnesota 85 88 54,331 53,299 47,674 58,786
Rochester, NY 38 46 61,505 58,205 45,614 72,285
Charlotte, NC 20 26 47,827 45,862 44,862 52,176Piedmont Triad, NC & VA 24 26 48,523 45,740 37,155 57,560Raleigh/Durham, NC 20 29 67,575 63,400 51,415 76,612
Cincinnati, OH 35 47 49,154 47,583 38,738 56,282Cleveland/Akron, OH 24 32 38,120 33,776 32,621 42,232Columbus, OH 10 13 52,770 52,388 42,727 62,017Toledo, OH 22 35 42,732 41,328 35,677 46,854
Portland, OR 28 46 44,908 43,089 39,881 48,406
Northwest, PA 9 10 37,238 40,008 25,260 45,003Philadelphia, PA 22 25 54,388 55,418 42,745 64,520Pittsburgh, PA 8 9 45,385 39,648 30,845 51,064Reading, PA 27 68 41,822 43,571 39,577 50,612
Warehouse Manager
Mid 50% Range
Responsible for directing and controlling warehouse activities to ensure the efficient and economical utilization of facilities for storing and distributing raw materials and finished goods inventories. Supervise prompt delivery of merchandise of the kind and in the amount ordered.
102 © Property of Employer Association Group
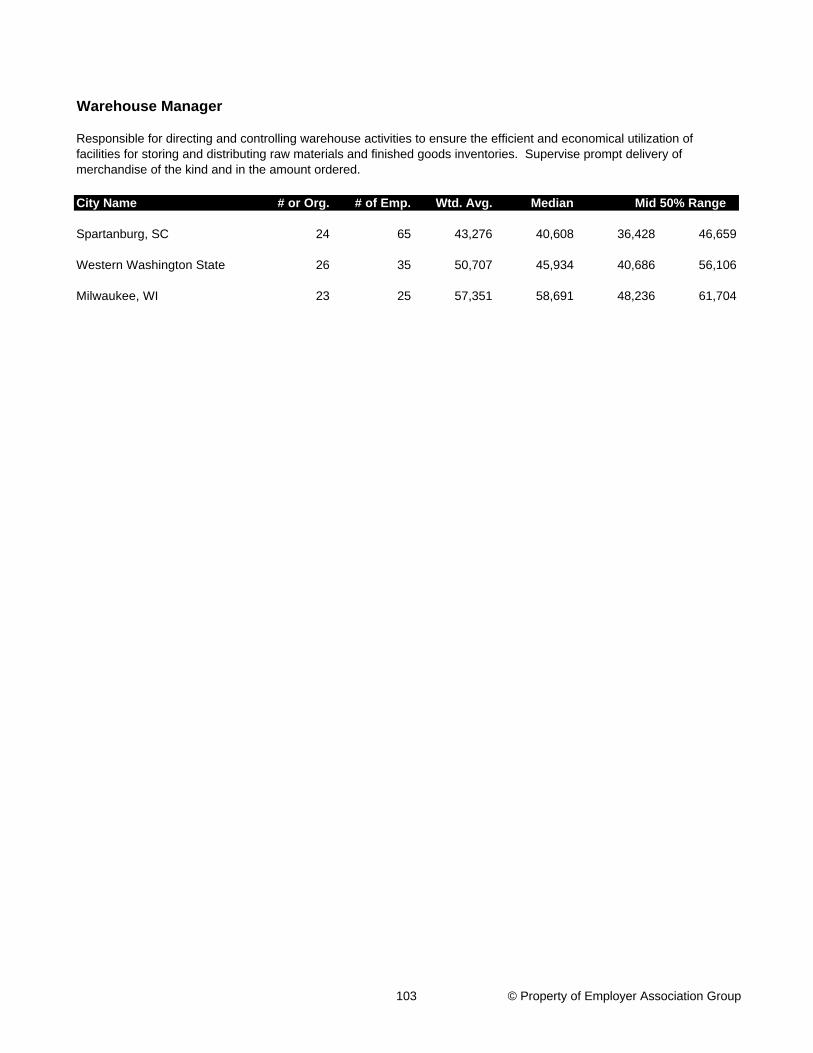
City Name # or Org. # of Emp. Wtd. Avg. Median
Warehouse Manager
Mid 50% Range
Responsible for directing and controlling warehouse activities to ensure the efficient and economical utilization of facilities for storing and distributing raw materials and finished goods inventories. Supervise prompt delivery of merchandise of the kind and in the amount ordered.
Spartanburg, SC 24 65 43,276 40,608 36,428 46,659
Western Washington State 26 35 50,707 45,934 40,686 56,106
Milwaukee, WI 23 25 57,351 58,691 48,236 61,704
103 © Property of Employer Association Group

(This Page is left blank.)
104 © Property of Employer Association Group
PRODUCTION AND MAINTENANCE POSITIONS
105 © Property of Employer Association Group

(This Page is left blank.)
106 © Property of Employer Association Group
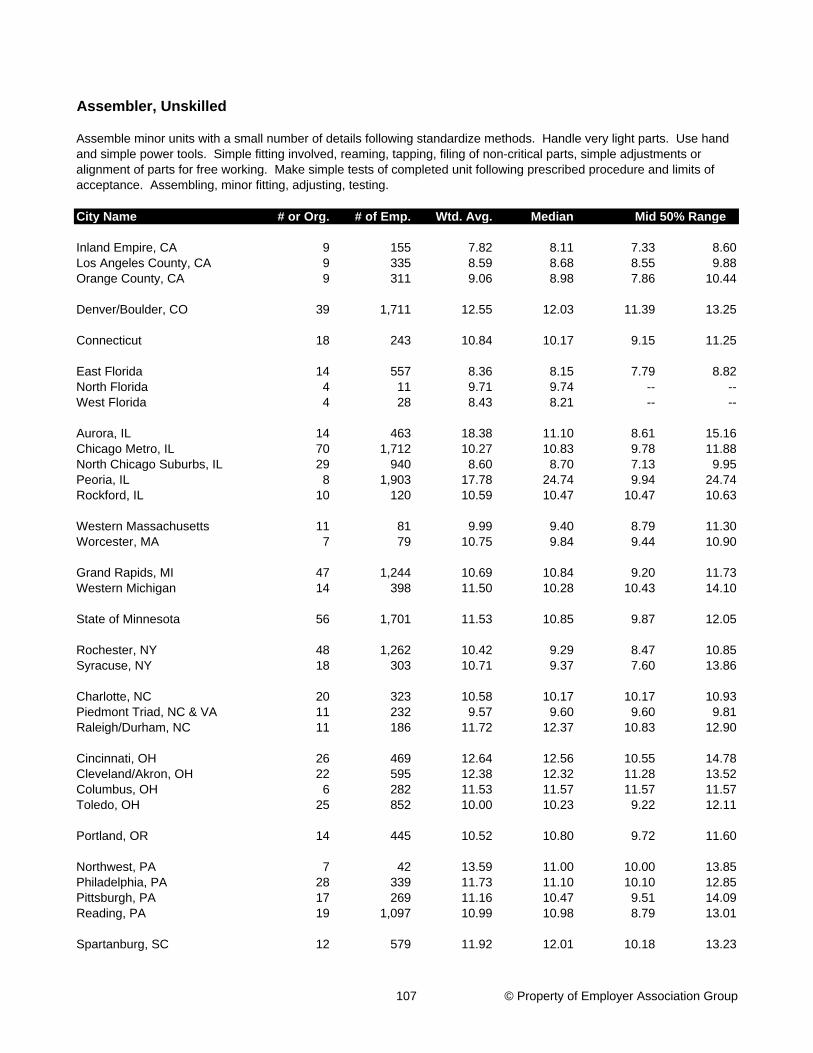
City Name # or Org. # of Emp. Wtd. Avg. Median
Inland Empire, CA 9 155 7.82 8.11 7.33 8.60Los Angeles County, CA 9 335 8.59 8.68 8.55 9.88Orange County, CA 9 311 9.06 8.98 7.86 10.44
Denver/Boulder, CO 39 1,711 12.55 12.03 11.39 13.25
Connecticut 18 243 10.84 10.17 9.15 11.25
East Florida 14 557 8.36 8.15 7.79 8.82North Florida 4 11 9.71 9.74 -- --West Florida 4 28 8.43 8.21 -- --
Aurora, IL 14 463 18.38 11.10 8.61 15.16Chicago Metro, IL 70 1,712 10.27 10.83 9.78 11.88North Chicago Suburbs, IL 29 940 8.60 8.70 7.13 9.95Peoria, IL 8 1,903 17.78 24.74 9.94 24.74Rockford, IL 10 120 10.59 10.47 10.47 10.63
Western Massachusetts 11 81 9.99 9.40 8.79 11.30Worcester, MA 7 79 10.75 9.84 9.44 10.90
Grand Rapids, MI 47 1,244 10.69 10.84 9.20 11.73Western Michigan 14 398 11.50 10.28 10.43 14.10
State of Minnesota 56 1,701 11.53 10.85 9.87 12.05
Rochester, NY 48 1,262 10.42 9.29 8.47 10.85Syracuse, NY 18 303 10.71 9.37 7.60 13.86
Charlotte, NC 20 323 10.58 10.17 10.17 10.93Piedmont Triad, NC & VA 11 232 9.57 9.60 9.60 9.81Raleigh/Durham, NC 11 186 11.72 12.37 10.83 12.90
Cincinnati, OH 26 469 12.64 12.56 10.55 14.78Cleveland/Akron, OH 22 595 12.38 12.32 11.28 13.52Columbus, OH 6 282 11.53 11.57 11.57 11.57Toledo, OH 25 852 10.00 10.23 9.22 12.11
Portland, OR 14 445 10.52 10.80 9.72 11.60
Northwest, PA 7 42 13.59 11.00 10.00 13.85Philadelphia, PA 28 339 11.73 11.10 10.10 12.85Pittsburgh, PA 17 269 11.16 10.47 9.51 14.09Reading, PA 19 1,097 10.99 10.98 8.79 13.01
Spartanburg, SC 12 579 11.92 12.01 10.18 13.23
Assembler, Unskilled
Mid 50% Range
Assemble minor units with a small number of details following standardize methods. Handle very light parts. Use hand and simple power tools. Simple fitting involved, reaming, tapping, filing of non-critical parts, simple adjustments or alignment of parts for free working. Make simple tests of completed unit following prescribed procedure and limits of acceptance. Assembling, minor fitting, adjusting, testing.
107 © Property of Employer Association Group

City Name # or Org. # of Emp. Wtd. Avg. Median
Assembler, Unskilled
Mid 50% Range
Assemble minor units with a small number of details following standardize methods. Handle very light parts. Use hand and simple power tools. Simple fitting involved, reaming, tapping, filing of non-critical parts, simple adjustments or alignment of parts for free working. Make simple tests of completed unit following prescribed procedure and limits of acceptance. Assembling, minor fitting, adjusting, testing.
Western Washington State 36 327 10.50 10.26 9.10 12.38
Milwaukee, WI 15 134 11.34 -- -- --
108 © Property of Employer Association Group

City Name # or Org. # of Emp. Wtd. Avg. Median
Los Angeles County, CA 8 132 13.07 12.03 11.17 12.67Orange County, CA 6 70 11.39 11.42 9.90 13.28
Denver/Boulder, CO 41 858 14.13 13.11 11.79 18.23
Connecticut 11 327 16.15 16.22 15.99 17.26
East Florida 19 303 9.59 8.92 7.95 11.26North Florida 4 129 13.16 13.80 -- --South Florida 6 95 10.07 9.47 8.31 11.98West Florida 5 249 10.63 9.34 8.52 13.97
Aurora, IL 15 131 14.84 15.52 12.11 16.41Chicago Metro, IL 82 1,080 12.27 12.46 11.32 14.51North Chicago Suburbs, IL 35 536 11.69 12.08 10.84 12.58Peoria, IL 7 184 16.98 16.82 14.17 20.66Rockford, IL 13 441 12.41 12.37 10.91 13.83
Western Massachusetts 6 34 13.14 12.70 12.70 12.70Worcester, MA 10 100 14.75 16.69 12.17 16.69
Grand Rapids, MI 30 479 11.85 11.18 -- --
State of Minnesota 94 2,482 12.93 12.87 11.56 13.90
Rochester, NY 51 1,000 14.20 10.47 9.55 12.85Syracuse, NY 20 1,179 18.19 20.72 14.53 22.92
Charlotte, NC 25 273 12.39 11.71 10.88 12.41Piedmont Triad, NC & VA 13 162 12.19 11.94 10.91 13.65Raleigh/Durham, NC 8 156 14.45 13.61 12.77 15.66
Cincinnati, OH 37 498 13.01 13.20 9.41 15.51Cleveland/Akron, OH 20 129 11.12 10.20 11.65 13.82Columbus, OH 6 40 14.71 16.46 11.56 17.44Toledo, OH 15 245 13.47 12.37 13.47 15.11
Portland, OR 12 148 12.45 12.68 11.10 13.69
Northwest, PA 4 23 17.70 17.00 -- --Philadelphia, PA 37 459 11.72 13.08 11.53 15.15Pittsburgh, PA 13 146 13.16 14.11 10.53 15.83Reading, PA 32 499 12.04 11.44 10.36 12.89
Assembler, Semi-Skilled
Mid 50% Range
Assemble a variety of products. Handle light and average weight parts, hand and power tools. Select assemble methods. Fit parts to close tolerances involving filing, scraping of bearings and flat surfaces. Align and adjust parts for free working and proper operation. Align and drill mating parts in assembly, drill and ream for dowel pins. Make operating tests and final adjustments.
109 © Property of Employer Association Group

City Name # or Org. # of Emp. Wtd. Avg. Median
Assembler, Semi-Skilled
Mid 50% Range
Assemble a variety of products. Handle light and average weight parts, hand and power tools. Select assemble methods. Fit parts to close tolerances involving filing, scraping of bearings and flat surfaces. Align and adjust parts for free working and proper operation. Align and drill mating parts in assembly, drill and ream for dowel pins. Make operating tests and final adjustments.
Western Washington State 42 290 11.73 11.02 9.37 13.26
Milwaukee, WI 86 1,066 12.98 -- -- --
110 © Property of Employer Association Group
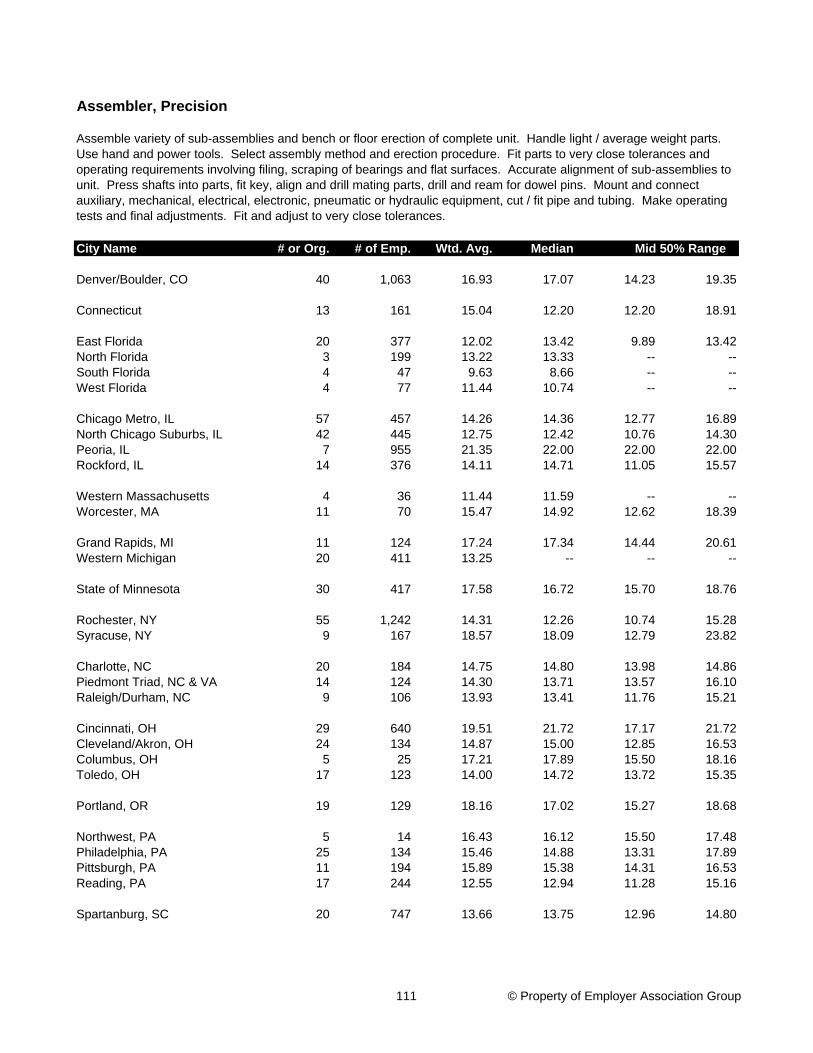
City Name # or Org. # of Emp. Wtd. Avg. Median
Denver/Boulder, CO 40 1,063 16.93 17.07 14.23 19.35
Connecticut 13 161 15.04 12.20 12.20 18.91
East Florida 20 377 12.02 13.42 9.89 13.42North Florida 3 199 13.22 13.33 -- --South Florida 4 47 9.63 8.66 -- --West Florida 4 77 11.44 10.74 -- --
Chicago Metro, IL 57 457 14.26 14.36 12.77 16.89North Chicago Suburbs, IL 42 445 12.75 12.42 10.76 14.30Peoria, IL 7 955 21.35 22.00 22.00 22.00Rockford, IL 14 376 14.11 14.71 11.05 15.57
Western Massachusetts 4 36 11.44 11.59 -- --Worcester, MA 11 70 15.47 14.92 12.62 18.39
Grand Rapids, MI 11 124 17.24 17.34 14.44 20.61Western Michigan 20 411 13.25 -- -- --
State of Minnesota 30 417 17.58 16.72 15.70 18.76
Rochester, NY 55 1,242 14.31 12.26 10.74 15.28Syracuse, NY 9 167 18.57 18.09 12.79 23.82
Charlotte, NC 20 184 14.75 14.80 13.98 14.86Piedmont Triad, NC & VA 14 124 14.30 13.71 13.57 16.10Raleigh/Durham, NC 9 106 13.93 13.41 11.76 15.21
Cincinnati, OH 29 640 19.51 21.72 17.17 21.72Cleveland/Akron, OH 24 134 14.87 15.00 12.85 16.53Columbus, OH 5 25 17.21 17.89 15.50 18.16Toledo, OH 17 123 14.00 14.72 13.72 15.35
Portland, OR 19 129 18.16 17.02 15.27 18.68
Northwest, PA 5 14 16.43 16.12 15.50 17.48Philadelphia, PA 25 134 15.46 14.88 13.31 17.89Pittsburgh, PA 11 194 15.89 15.38 14.31 16.53Reading, PA 17 244 12.55 12.94 11.28 15.16
Spartanburg, SC 20 747 13.66 13.75 12.96 14.80
Assembler, Precision
Mid 50% Range
Assemble variety of sub-assemblies and bench or floor erection of complete unit. Handle light / average weight parts. Use hand and power tools. Select assembly method and erection procedure. Fit parts to very close tolerances and operating requirements involving filing, scraping of bearings and flat surfaces. Accurate alignment of sub-assemblies to unit. Press shafts into parts, fit key, align and drill mating parts, drill and ream for dowel pins. Mount and connect auxiliary, mechanical, electrical, electronic, pneumatic or hydraulic equipment, cut / fit pipe and tubing. Make operating tests and final adjustments. Fit and adjust to very close tolerances.
111 © Property of Employer Association Group
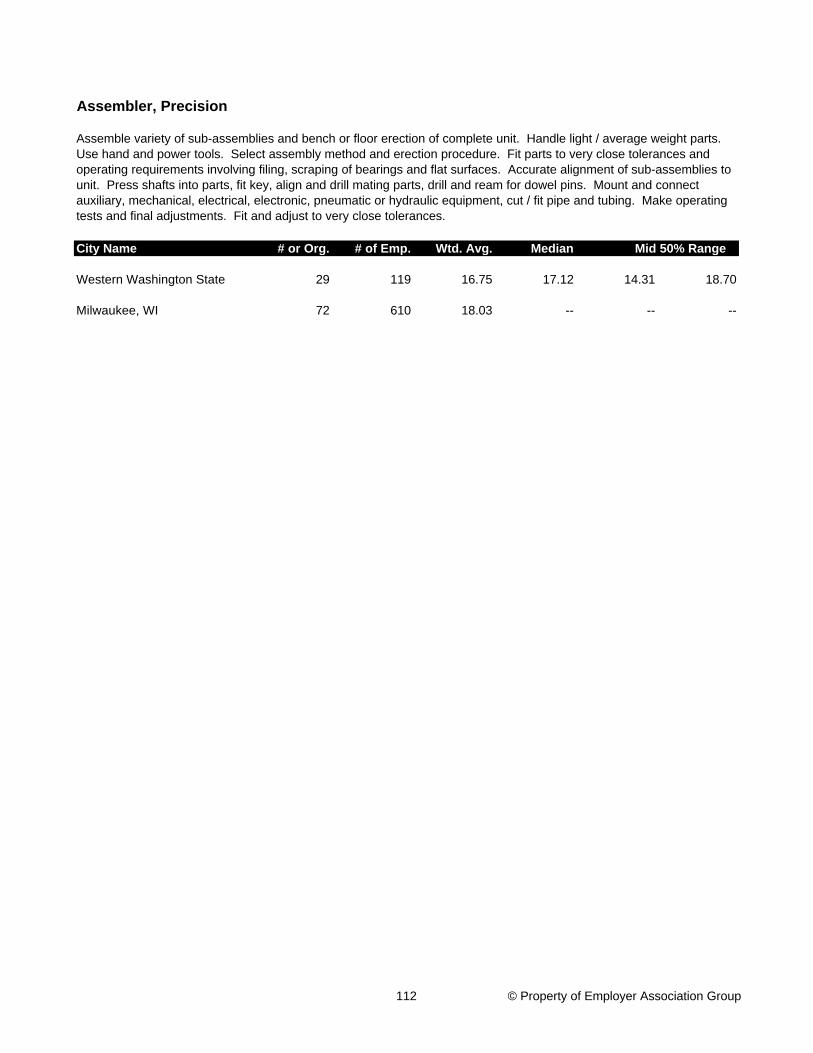
City Name # or Org. # of Emp. Wtd. Avg. Median
Assembler, Precision
Mid 50% Range
Assemble variety of sub-assemblies and bench or floor erection of complete unit. Handle light / average weight parts. Use hand and power tools. Select assembly method and erection procedure. Fit parts to very close tolerances and operating requirements involving filing, scraping of bearings and flat surfaces. Accurate alignment of sub-assemblies to unit. Press shafts into parts, fit key, align and drill mating parts, drill and ream for dowel pins. Mount and connect auxiliary, mechanical, electrical, electronic, pneumatic or hydraulic equipment, cut / fit pipe and tubing. Make operating tests and final adjustments. Fit and adjust to very close tolerances.
Western Washington State 29 119 16.75 17.12 14.31 18.70
Milwaukee, WI 72 610 18.03 -- -- --
112 © Property of Employer Association Group
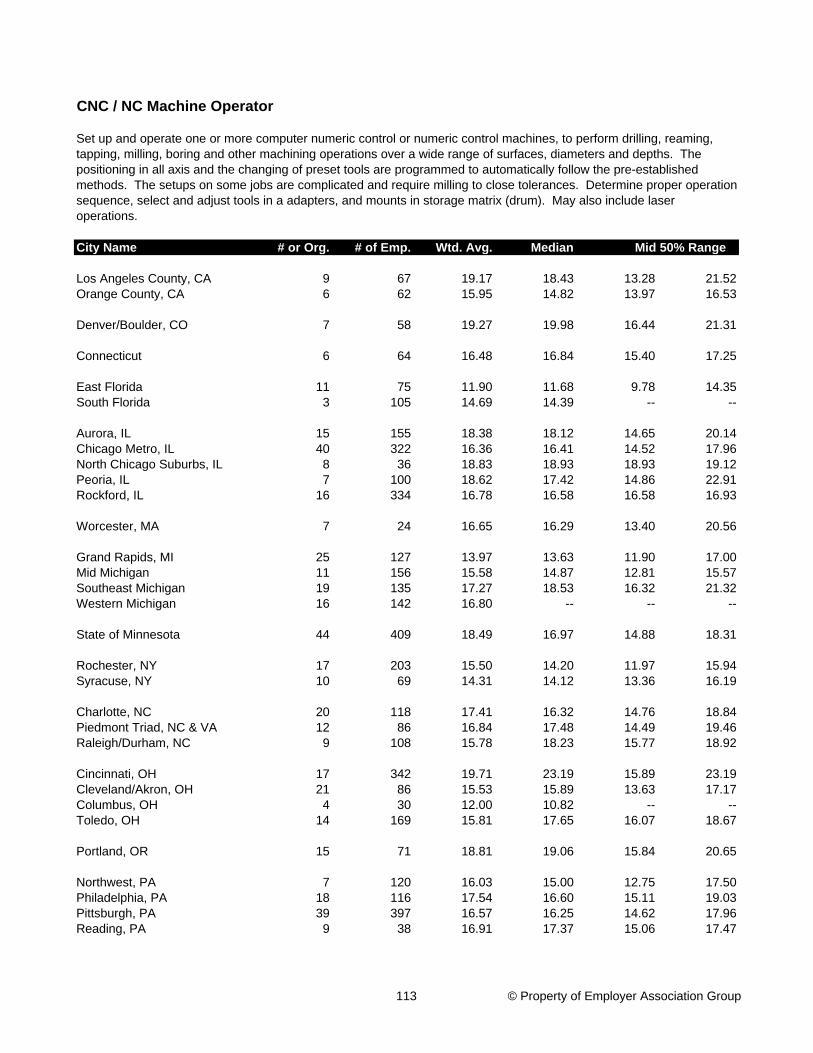
City Name # or Org. # of Emp. Wtd. Avg. Median
Los Angeles County, CA 9 67 19.17 18.43 13.28 21.52Orange County, CA 6 62 15.95 14.82 13.97 16.53
Denver/Boulder, CO 7 58 19.27 19.98 16.44 21.31
Connecticut 6 64 16.48 16.84 15.40 17.25
East Florida 11 75 11.90 11.68 9.78 14.35South Florida 3 105 14.69 14.39 -- --
Aurora, IL 15 155 18.38 18.12 14.65 20.14Chicago Metro, IL 40 322 16.36 16.41 14.52 17.96North Chicago Suburbs, IL 8 36 18.83 18.93 18.93 19.12Peoria, IL 7 100 18.62 17.42 14.86 22.91Rockford, IL 16 334 16.78 16.58 16.58 16.93
Worcester, MA 7 24 16.65 16.29 13.40 20.56
Grand Rapids, MI 25 127 13.97 13.63 11.90 17.00Mid Michigan 11 156 15.58 14.87 12.81 15.57Southeast Michigan 19 135 17.27 18.53 16.32 21.32Western Michigan 16 142 16.80 -- -- --
State of Minnesota 44 409 18.49 16.97 14.88 18.31
Rochester, NY 17 203 15.50 14.20 11.97 15.94Syracuse, NY 10 69 14.31 14.12 13.36 16.19
Charlotte, NC 20 118 17.41 16.32 14.76 18.84Piedmont Triad, NC & VA 12 86 16.84 17.48 14.49 19.46Raleigh/Durham, NC 9 108 15.78 18.23 15.77 18.92
Cincinnati, OH 17 342 19.71 23.19 15.89 23.19Cleveland/Akron, OH 21 86 15.53 15.89 13.63 17.17Columbus, OH 4 30 12.00 10.82 -- --Toledo, OH 14 169 15.81 17.65 16.07 18.67
Portland, OR 15 71 18.81 19.06 15.84 20.65
Northwest, PA 7 120 16.03 15.00 12.75 17.50Philadelphia, PA 18 116 17.54 16.60 15.11 19.03Pittsburgh, PA 39 397 16.57 16.25 14.62 17.96Reading, PA 9 38 16.91 17.37 15.06 17.47
CNC / NC Machine Operator
Mid 50% Range
Set up and operate one or more computer numeric control or numeric control machines, to perform drilling, reaming, tapping, milling, boring and other machining operations over a wide range of surfaces, diameters and depths. The positioning in all axis and the changing of preset tools are programmed to automatically follow the pre-established methods. The setups on some jobs are complicated and require milling to close tolerances. Determine proper operation sequence, select and adjust tools in a adapters, and mounts in storage matrix (drum). May also include laser operations.
113 © Property of Employer Association Group
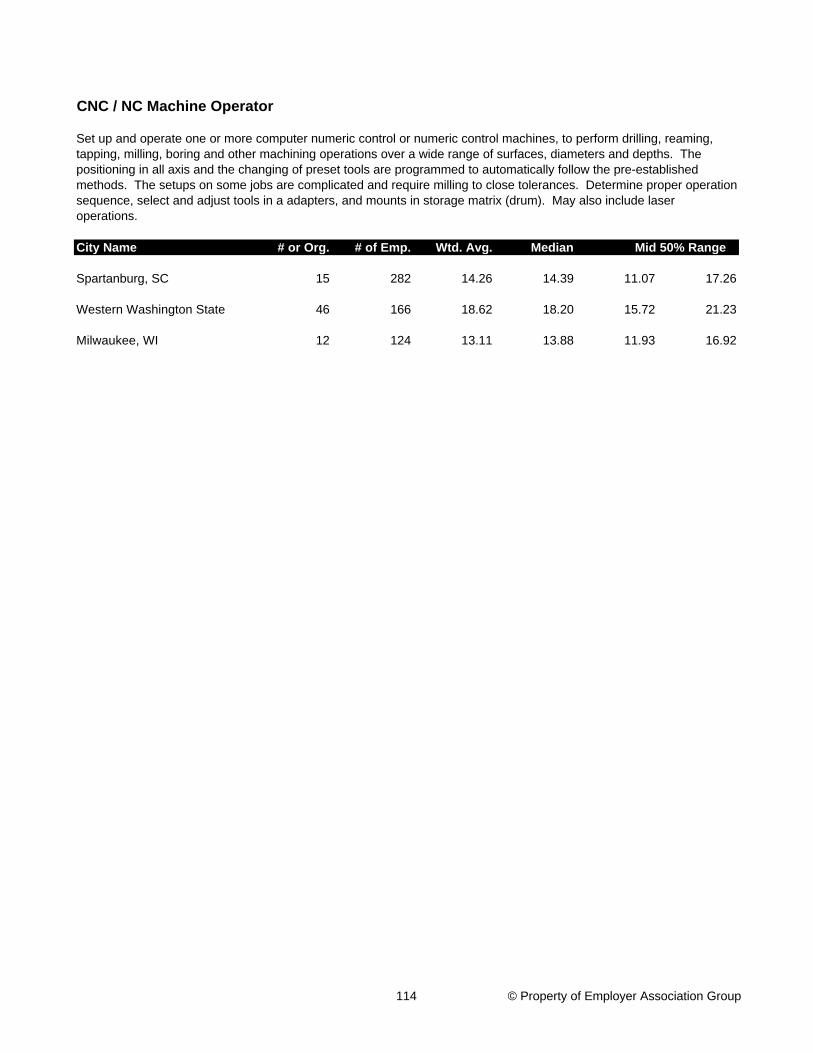
City Name # or Org. # of Emp. Wtd. Avg. Median
CNC / NC Machine Operator
Mid 50% Range
Set up and operate one or more computer numeric control or numeric control machines, to perform drilling, reaming, tapping, milling, boring and other machining operations over a wide range of surfaces, diameters and depths. The positioning in all axis and the changing of preset tools are programmed to automatically follow the pre-established methods. The setups on some jobs are complicated and require milling to close tolerances. Determine proper operation sequence, select and adjust tools in a adapters, and mounts in storage matrix (drum). May also include laser operations.
Spartanburg, SC 15 282 14.26 14.39 11.07 17.26
Western Washington State 46 166 18.62 18.20 15.72 21.23
Milwaukee, WI 12 124 13.11 13.88 11.93 16.92
114 © Property of Employer Association Group
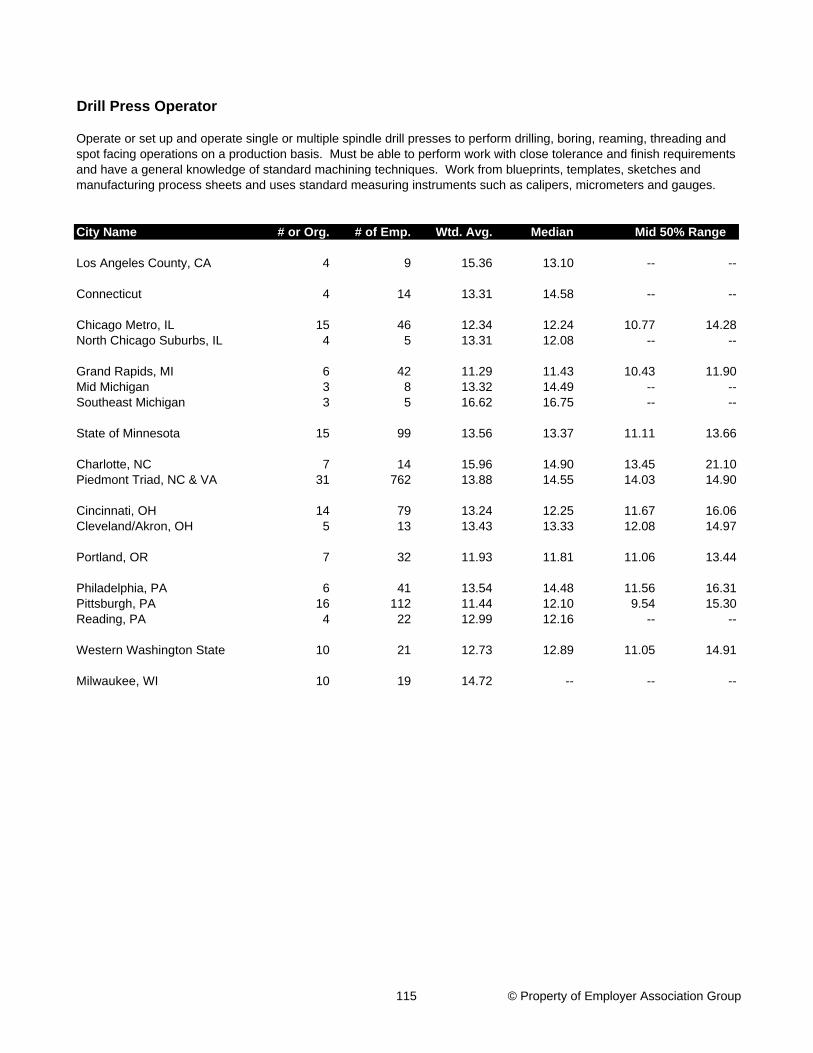
City Name # or Org. # of Emp. Wtd. Avg. Median
Los Angeles County, CA 4 9 15.36 13.10 -- --
Connecticut 4 14 13.31 14.58 -- --
Chicago Metro, IL 15 46 12.34 12.24 10.77 14.28North Chicago Suburbs, IL 4 5 13.31 12.08 -- --
Grand Rapids, MI 6 42 11.29 11.43 10.43 11.90Mid Michigan 3 8 13.32 14.49 -- --Southeast Michigan 3 5 16.62 16.75 -- --
State of Minnesota 15 99 13.56 13.37 11.11 13.66
Charlotte, NC 7 14 15.96 14.90 13.45 21.10Piedmont Triad, NC & VA 31 762 13.88 14.55 14.03 14.90
Cincinnati, OH 14 79 13.24 12.25 11.67 16.06Cleveland/Akron, OH 5 13 13.43 13.33 12.08 14.97
Portland, OR 7 32 11.93 11.81 11.06 13.44
Philadelphia, PA 6 41 13.54 14.48 11.56 16.31Pittsburgh, PA 16 112 11.44 12.10 9.54 15.30Reading, PA 4 22 12.99 12.16 -- --
Western Washington State 10 21 12.73 12.89 11.05 14.91
Milwaukee, WI 10 19 14.72 -- -- --
Drill Press Operator
Mid 50% Range
Operate or set up and operate single or multiple spindle drill presses to perform drilling, boring, reaming, threading and spot facing operations on a production basis. Must be able to perform work with close tolerance and finish requirements and have a general knowledge of standard machining techniques. Work from blueprints, templates, sketches and manufacturing process sheets and uses standard measuring instruments such as calipers, micrometers and gauges.
115 © Property of Employer Association Group
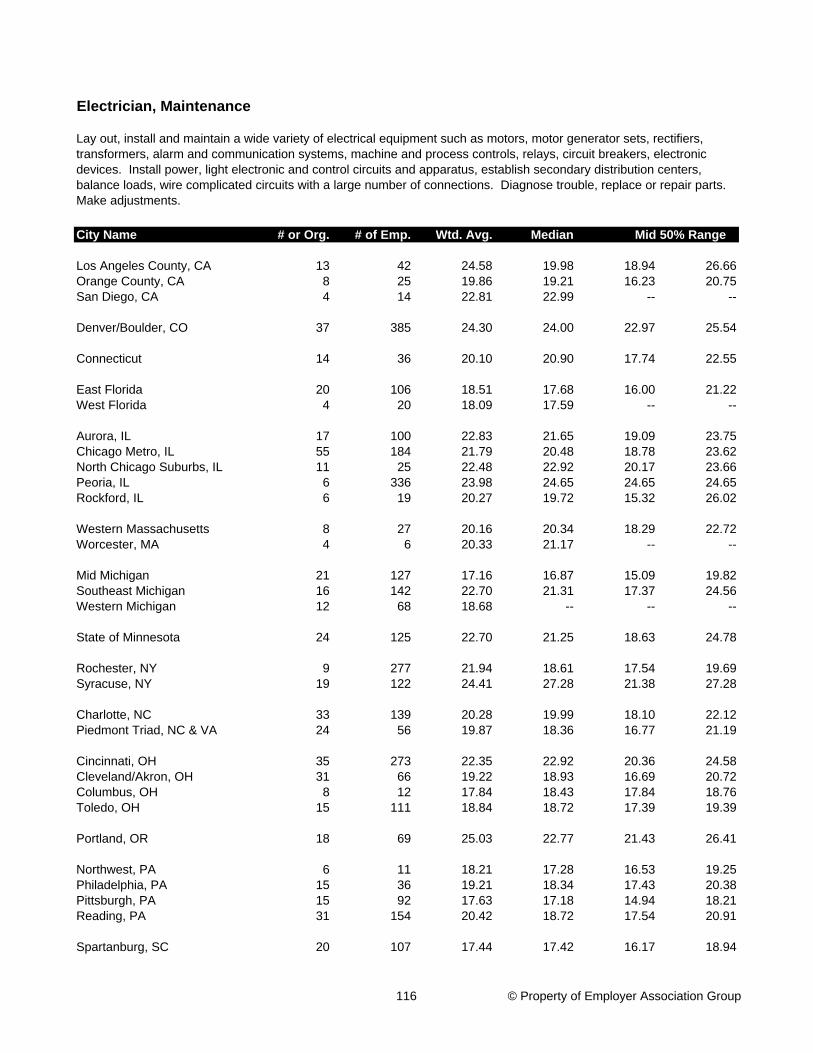
City Name # or Org. # of Emp. Wtd. Avg. Median
Los Angeles County, CA 13 42 24.58 19.98 18.94 26.66Orange County, CA 8 25 19.86 19.21 16.23 20.75San Diego, CA 4 14 22.81 22.99 -- --
Denver/Boulder, CO 37 385 24.30 24.00 22.97 25.54
Connecticut 14 36 20.10 20.90 17.74 22.55
East Florida 20 106 18.51 17.68 16.00 21.22West Florida 4 20 18.09 17.59 -- --
Aurora, IL 17 100 22.83 21.65 19.09 23.75Chicago Metro, IL 55 184 21.79 20.48 18.78 23.62North Chicago Suburbs, IL 11 25 22.48 22.92 20.17 23.66Peoria, IL 6 336 23.98 24.65 24.65 24.65Rockford, IL 6 19 20.27 19.72 15.32 26.02
Western Massachusetts 8 27 20.16 20.34 18.29 22.72Worcester, MA 4 6 20.33 21.17 -- --
Mid Michigan 21 127 17.16 16.87 15.09 19.82Southeast Michigan 16 142 22.70 21.31 17.37 24.56Western Michigan 12 68 18.68 -- -- --
State of Minnesota 24 125 22.70 21.25 18.63 24.78
Rochester, NY 9 277 21.94 18.61 17.54 19.69Syracuse, NY 19 122 24.41 27.28 21.38 27.28
Charlotte, NC 33 139 20.28 19.99 18.10 22.12Piedmont Triad, NC & VA 24 56 19.87 18.36 16.77 21.19
Cincinnati, OH 35 273 22.35 22.92 20.36 24.58Cleveland/Akron, OH 31 66 19.22 18.93 16.69 20.72Columbus, OH 8 12 17.84 18.43 17.84 18.76Toledo, OH 15 111 18.84 18.72 17.39 19.39
Portland, OR 18 69 25.03 22.77 21.43 26.41
Northwest, PA 6 11 18.21 17.28 16.53 19.25Philadelphia, PA 15 36 19.21 18.34 17.43 20.38Pittsburgh, PA 15 92 17.63 17.18 14.94 18.21Reading, PA 31 154 20.42 18.72 17.54 20.91
Spartanburg, SC 20 107 17.44 17.42 16.17 18.94
Electrician, Maintenance
Mid 50% Range
Lay out, install and maintain a wide variety of electrical equipment such as motors, motor generator sets, rectifiers, transformers, alarm and communication systems, machine and process controls, relays, circuit breakers, electronic devices. Install power, light electronic and control circuits and apparatus, establish secondary distribution centers, balance loads, wire complicated circuits with a large number of connections. Diagnose trouble, replace or repair parts. Make adjustments.
116 © Property of Employer Association Group
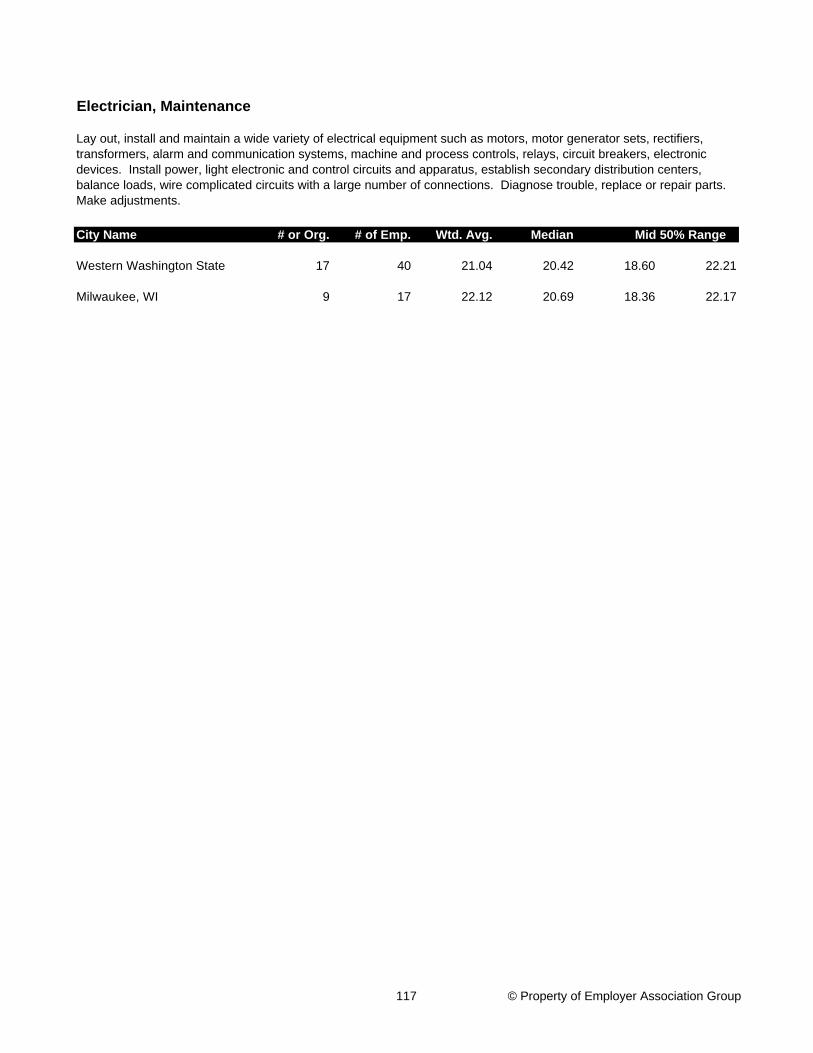
City Name # or Org. # of Emp. Wtd. Avg. Median
Electrician, Maintenance
Mid 50% Range
Lay out, install and maintain a wide variety of electrical equipment such as motors, motor generator sets, rectifiers, transformers, alarm and communication systems, machine and process controls, relays, circuit breakers, electronic devices. Install power, light electronic and control circuits and apparatus, establish secondary distribution centers, balance loads, wire complicated circuits with a large number of connections. Diagnose trouble, replace or repair parts. Make adjustments.
Western Washington State 17 40 21.04 20.42 18.60 22.21
Milwaukee, WI 9 17 22.12 20.69 18.36 22.17
117 © Property of Employer Association Group
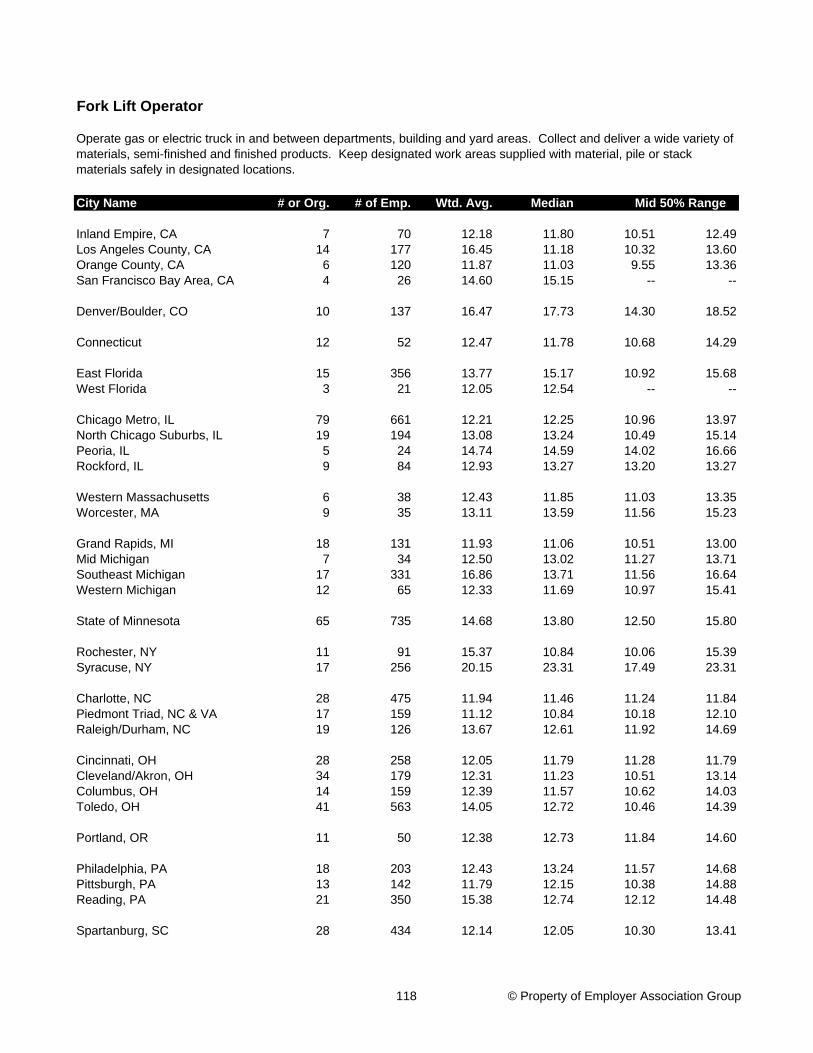
City Name # or Org. # of Emp. Wtd. Avg. Median
Inland Empire, CA 7 70 12.18 11.80 10.51 12.49Los Angeles County, CA 14 177 16.45 11.18 10.32 13.60Orange County, CA 6 120 11.87 11.03 9.55 13.36San Francisco Bay Area, CA 4 26 14.60 15.15 -- --
Denver/Boulder, CO 10 137 16.47 17.73 14.30 18.52
Connecticut 12 52 12.47 11.78 10.68 14.29
East Florida 15 356 13.77 15.17 10.92 15.68West Florida 3 21 12.05 12.54 -- --
Chicago Metro, IL 79 661 12.21 12.25 10.96 13.97North Chicago Suburbs, IL 19 194 13.08 13.24 10.49 15.14Peoria, IL 5 24 14.74 14.59 14.02 16.66Rockford, IL 9 84 12.93 13.27 13.20 13.27
Western Massachusetts 6 38 12.43 11.85 11.03 13.35Worcester, MA 9 35 13.11 13.59 11.56 15.23
Grand Rapids, MI 18 131 11.93 11.06 10.51 13.00Mid Michigan 7 34 12.50 13.02 11.27 13.71Southeast Michigan 17 331 16.86 13.71 11.56 16.64Western Michigan 12 65 12.33 11.69 10.97 15.41
State of Minnesota 65 735 14.68 13.80 12.50 15.80
Rochester, NY 11 91 15.37 10.84 10.06 15.39Syracuse, NY 17 256 20.15 23.31 17.49 23.31
Charlotte, NC 28 475 11.94 11.46 11.24 11.84Piedmont Triad, NC & VA 17 159 11.12 10.84 10.18 12.10Raleigh/Durham, NC 19 126 13.67 12.61 11.92 14.69
Cincinnati, OH 28 258 12.05 11.79 11.28 11.79Cleveland/Akron, OH 34 179 12.31 11.23 10.51 13.14Columbus, OH 14 159 12.39 11.57 10.62 14.03Toledo, OH 41 563 14.05 12.72 10.46 14.39
Portland, OR 11 50 12.38 12.73 11.84 14.60
Philadelphia, PA 18 203 12.43 13.24 11.57 14.68Pittsburgh, PA 13 142 11.79 12.15 10.38 14.88Reading, PA 21 350 15.38 12.74 12.12 14.48
Spartanburg, SC 28 434 12.14 12.05 10.30 13.41
Fork Lift Operator
Mid 50% Range
Operate gas or electric truck in and between departments, building and yard areas. Collect and deliver a wide variety of materials, semi-finished and finished products. Keep designated work areas supplied with material, pile or stack materials safely in designated locations.
118 © Property of Employer Association Group
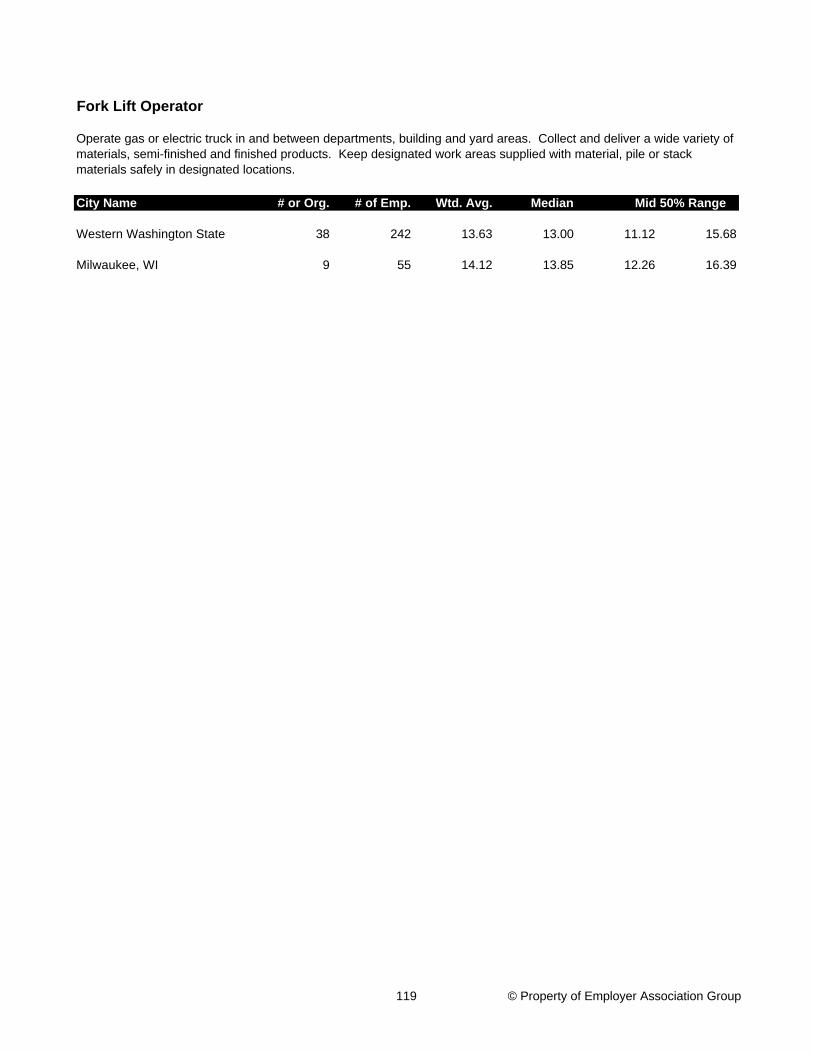
City Name # or Org. # of Emp. Wtd. Avg. Median
Fork Lift Operator
Mid 50% Range
Operate gas or electric truck in and between departments, building and yard areas. Collect and deliver a wide variety of materials, semi-finished and finished products. Keep designated work areas supplied with material, pile or stack materials safely in designated locations.
Western Washington State 38 242 13.63 13.00 11.12 15.68
Milwaukee, WI 9 55 14.12 13.85 12.26 16.39
119 © Property of Employer Association Group

City Name # or Org. # of Emp. Wtd. Avg. Median
Inland Empire, CA 6 19 10.34 12.02 9.35 14.12Los Angeles County, CA 47 121 14.73 13.70 11.59 16.37Orange County, CA 27 152 15.12 15.19 12.41 17.45San Diego, CA 7 11 15.67 15.33 15.08 16.04San Francisco Bay Area, CA 7 19 13.45 14.52 13.59 15.36
Denver/Boulder, CO 40 174 14.20 14.03 12.76 15.82
Connecticut 15 32 13.88 12.71 12.24 16.19
East Florida 26 218 10.88 10.25 8.97 11.61South Florida 6 10 9.96 8.90 7.05 13.16West Florida 9 33 11.63 11.54 10.06 12.46
Chicago Metro, IL 92 298 16.72 16.39 14.14 18.68North Chicago Suburbs, IL 15 17 11.51 11.26 10.57 12.28Peoria, IL 11 19 15.12 15.02 11.41 17.64Rockford, IL 14 31 15.10 15.52 12.72 17.59
Western Massachusetts 9 24 15.79 17.16 13.73 18.79Worcester, MA 16 35 14.52 14.62 12.66 16.81
Grand Rapids, MI 18 32 13.09 13.75 10.84 14.82Southeast Michigan 29 122 17.07 16.46 15.54 19.02Western Michigan 10 25 13.06 13.21 13.04 14.25
State of Minnesota 64 140 15.68 14.96 12.69 16.94
Rochester, NY 14 34 11.69 11.67 10.32 11.91Syracuse, NY 29 110 16.28 15.88 15.50 17.19
Charlotte, NC 28 150 14.39 14.51 14.35 15.38Piedmont Triad, NC & VA 24 102 16.81 15.67 14.60 19.33Raleigh/Durham, NC 7 47 15.59 15.49 14.31 16.97
Cincinnati, OH 58 184 13.22 13.10 10.84 14.87Columbus, OH 11 26 14.90 14.30 13.00 17.69
Portland, OR 11 32 14.31 12.59 9.53 16.68
Northwest, PA 23 74 13.24 12.27 10.31 14.11Philadelphia, PA 27 100 16.36 14.42 12.29 17.93Reading, PA 55 488 17.93 17.32 15.44 18.83
Spartanburg, SC 24 110 14.84 14.37 13.64 15.72
General Maintenance, Lower Level
Mid 50% Range
Perform generalists tasks on the maintenance of plants or office buildings. Perform basic carpentry, electric pipefitting and plumbing repair as necessary. Scrape, putty, and paint walls, woodwork and fixtures. Replace light bulbs, covers, and filters. May lubricate and do simple maintenance on machines and equipment. Call more skilled or contract service companies for major or complicated repairs.
120 © Property of Employer Association Group
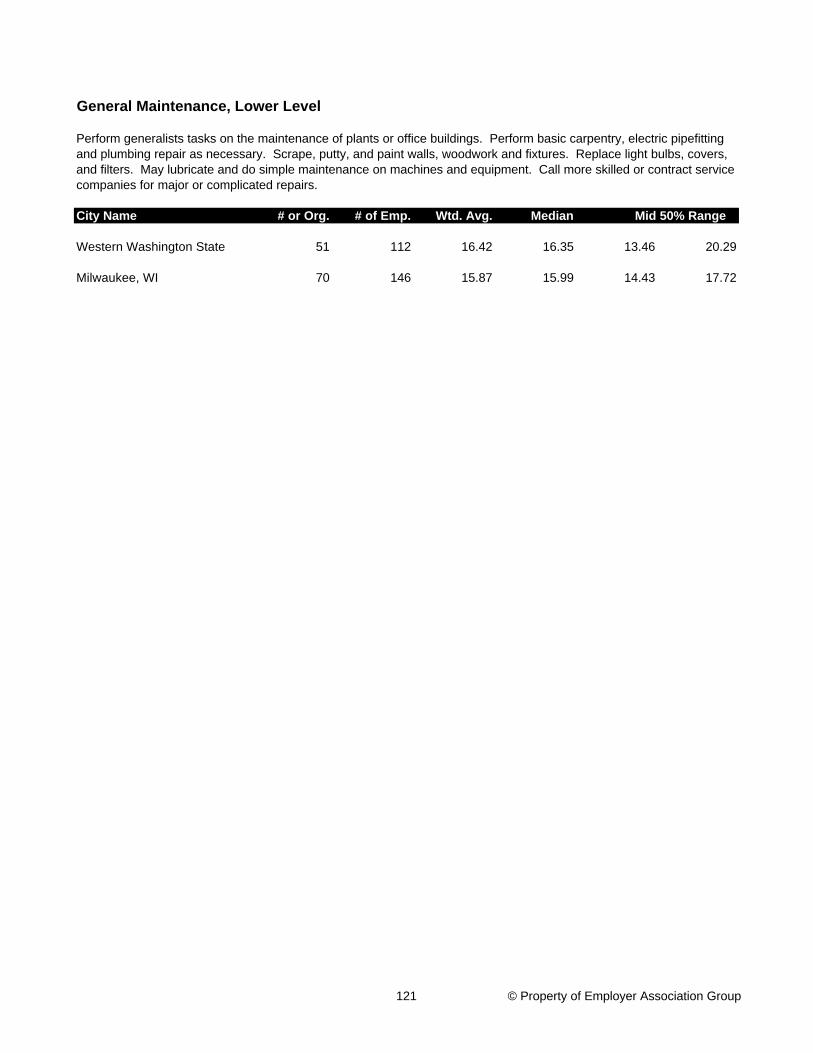
City Name # or Org. # of Emp. Wtd. Avg. Median
General Maintenance, Lower Level
Mid 50% Range
Perform generalists tasks on the maintenance of plants or office buildings. Perform basic carpentry, electric pipefitting and plumbing repair as necessary. Scrape, putty, and paint walls, woodwork and fixtures. Replace light bulbs, covers, and filters. May lubricate and do simple maintenance on machines and equipment. Call more skilled or contract service companies for major or complicated repairs.
Western Washington State 51 112 16.42 16.35 13.46 20.29
Milwaukee, WI 70 146 15.87 15.99 14.43 17.72
121 © Property of Employer Association Group

City Name # or Org. # of Emp. Wtd. Avg. Median
Inland Empire, CA 10 42 15.58 20.19 16.55 22.07Los Angeles County, CA 23 62 17.96 19.65 15.56 21.36Orange County, CA 18 41 20.11 20.36 17.84 21.50San Diego, CA 5 7 18.31 16.25 15.84 18.36
Denver/Boulder, CO 41 170 22.02 21.50 20.55 23.42
Connecticut 8 12 17.83 17.52 16.51 19.46
East Florida 44 264 13.90 13.80 11.71 15.84North Florida 5 33 15.21 15.44 15.44 15.44South Florida 6 13 11.36 9.99 9.23 13.21West Florida 7 94 12.36 10.51 10.15 15.65
Aurora, IL 14 33 15.08 15.48 13.34 16.68Chicago Metro, IL 86 295 19.03 18.44 17.00 20.27North Chicago Suburbs, IL 24 106 22.39 22.43 21.27 23.66Peoria, IL 12 303 23.29 21.64 21.64 28.87Rockford, IL 22 57 17.35 16.87 15.32 19.11
Western Massachusetts 9 26 15.76 16.17 14.07 18.81Worcester, MA 7 20 17.10 17.23 15.60 18.91
Grand Rapids, MI 74 281 15.94 16.12 14.82 17.30Southeast Michigan 38 188 22.32 18.85 17.56 21.80Western Michigan 34 163 17.94 18.15 17.14 18.74
Rochester, NY 31 73 14.48 13.96 11.79 16.00Syracuse, NY 23 168 18.87 19.12 15.16 21.14
Charlotte, NC 44 345 18.55 17.51 16.28 22.20Piedmont Triad, NC & VA 19 43 18.04 16.62 15.13 20.42Raleigh/Durham, NC 12 54 18.92 19.75 18.75 22.26
Cincinnati, OH 64 202 16.94 17.15 14.42 19.73Cleveland/Akron, OH 62 192 14.03 14.89 11.67 17.14Columbus, OH 15 37 15.82 15.32 14.74 17.20
Northwest, PA 25 76 15.67 15.20 13.56 17.33Philadelphia, PA 33 59 19.26 18.18 16.50 20.61Reading, PA 9 39 16.98 17.20 13.90 19.34
Spartanburg, SC 52 307 17.33 16.99 16.16 18.87
General Maintenance, Higher Level
Mid 50% Range
Perform more complicated tasks on the maintenance of plant, machines or office buildings. Perform carpentry, electric, pipefitting, hydraulics, pneumatics, refrigeration, and plumbing repairs as necessary. Troubleshoot and repair existing and potential problems. May have knowledge of two or more specific maintenance trades such as carpentry, pipefitting, electrical, or mechanical. May edit and program programmable logic controllers (PLC)
122 © Property of Employer Association Group

City Name # or Org. # of Emp. Wtd. Avg. Median
General Maintenance, Higher Level
Mid 50% Range
Perform more complicated tasks on the maintenance of plant, machines or office buildings. Perform carpentry, electric, pipefitting, hydraulics, pneumatics, refrigeration, and plumbing repairs as necessary. Troubleshoot and repair existing and potential problems. May have knowledge of two or more specific maintenance trades such as carpentry, pipefitting, electrical, or mechanical. May edit and program programmable logic controllers (PLC)
Western Washington State 38 76 18.27 17.84 16.58 20.62
Milwaukee, WI 44 124 20.07 20.11 18.86 22.06
123 © Property of Employer Association Group
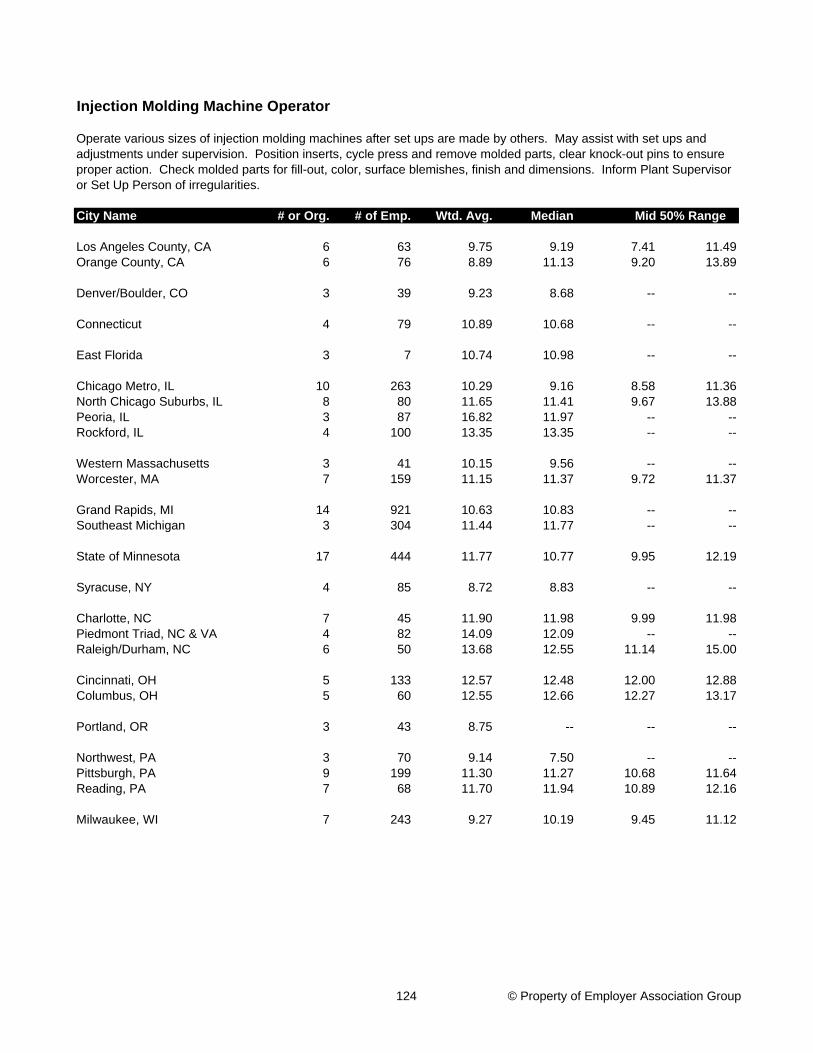
City Name # or Org. # of Emp. Wtd. Avg. Median
Los Angeles County, CA 6 63 9.75 9.19 7.41 11.49Orange County, CA 6 76 8.89 11.13 9.20 13.89
Denver/Boulder, CO 3 39 9.23 8.68 -- --
Connecticut 4 79 10.89 10.68 -- --
East Florida 3 7 10.74 10.98 -- --
Chicago Metro, IL 10 263 10.29 9.16 8.58 11.36North Chicago Suburbs, IL 8 80 11.65 11.41 9.67 13.88Peoria, IL 3 87 16.82 11.97 -- --Rockford, IL 4 100 13.35 13.35 -- --
Western Massachusetts 3 41 10.15 9.56 -- --Worcester, MA 7 159 11.15 11.37 9.72 11.37
Grand Rapids, MI 14 921 10.63 10.83 -- --Southeast Michigan 3 304 11.44 11.77 -- --
State of Minnesota 17 444 11.77 10.77 9.95 12.19
Syracuse, NY 4 85 8.72 8.83 -- --
Charlotte, NC 7 45 11.90 11.98 9.99 11.98Piedmont Triad, NC & VA 4 82 14.09 12.09 -- --Raleigh/Durham, NC 6 50 13.68 12.55 11.14 15.00
Cincinnati, OH 5 133 12.57 12.48 12.00 12.88Columbus, OH 5 60 12.55 12.66 12.27 13.17
Portland, OR 3 43 8.75 -- -- --
Northwest, PA 3 70 9.14 7.50 -- --Pittsburgh, PA 9 199 11.30 11.27 10.68 11.64Reading, PA 7 68 11.70 11.94 10.89 12.16
Milwaukee, WI 7 243 9.27 10.19 9.45 11.12
Injection Molding Machine Operator
Mid 50% Range
Operate various sizes of injection molding machines after set ups are made by others. May assist with set ups and adjustments under supervision. Position inserts, cycle press and remove molded parts, clear knock-out pins to ensure proper action. Check molded parts for fill-out, color, surface blemishes, finish and dimensions. Inform Plant Supervisor or Set Up Person of irregularities.
124 © Property of Employer Association Group

City Name # or Org. # of Emp. Wtd. Avg. Median
Connecticut 11 58 12.19 10.99 10.47 13.37
East Florida 9 25 10.27 9.53 9.43 11.49West Florida 3 8 12.65 13.14 -- --
Aurora, IL 12 108 11.01 12.84 9.00 14.93Chicago Metro, IL 16 77 10.52 10.44 9.55 12.07North Chicago Suburbs, IL 13 207 10.56 11.40 9.88 11.40Peoria, IL 9 338 22.87 25.13 21.65 25.13Rockford, IL 16 91 10.48 9.54 9.54 11.88
Western Massachusetts 3 5 11.98 11.68 -- --Worcester, MA 9 37 12.20 12.08 11.05 13.24
Grand Rapids, MI 23 165 10.49 10.00 9.19 11.01Mid Michigan 19 138 12.53 13.41 12.07 15.88Southeast Michigan 10 37 16.16 16.58 14.71 18.21Western Michigan 5 13 14.64 13.96 13.28 15.17
State of Minnesota 73 623 13.19 13.66 12.61 15.89
Rochester, NY 21 84 11.05 9.64 9.13 11.44Syracuse, NY 21 86 14.69 14.12 12.32 16.01
Charlotte, NC 22 154 14.72 13.89 11.25 16.33Piedmont Triad, NC & VA 17 113 11.21 10.90 8.23 12.09Raleigh/Durham, NC 8 107 9.43 12.55 10.83 14.20
Cincinnati, OH 20 186 12.94 13.23 12.60 14.02Cleveland/Akron, OH 15 150 11.81 12.19 10.61 13.63Columbus, OH 11 38 11.52 11.54 10.15 12.41Toledo, OH 15 185 11.60 12.80 11.61 15.09
Portland, OR 10 28 12.85 11.16 10.28 14.83
Northwest, PA 4 15 9.66 9.73 -- --Philadelphia, PA 25 116 13.65 15.03 13.26 16.22Pittsburgh, PA 17 48 12.26 12.06 11.12 14.87Reading, PA 15 89 14.93 13.87 12.71 16.04
Spartanburg, SC 19 159 11.77 11.25 10.63 13.48
Western Washington State 38 144 14.76 14.82 11.86 17.46
Milwaukee, WI 9 84 10.38 13.76 9.80 14.89
Inspector, Lower Level
Mid 50% Range
Follow standardized procedures or detailed instructions. Visually inspect or check a few points of small parts with acceptance limits clearly defined or reference samples furnished. Use simple gauges or "go-no-go" type, direct reading gauges requiring only reasonable care and dependability.
125 © Property of Employer Association Group
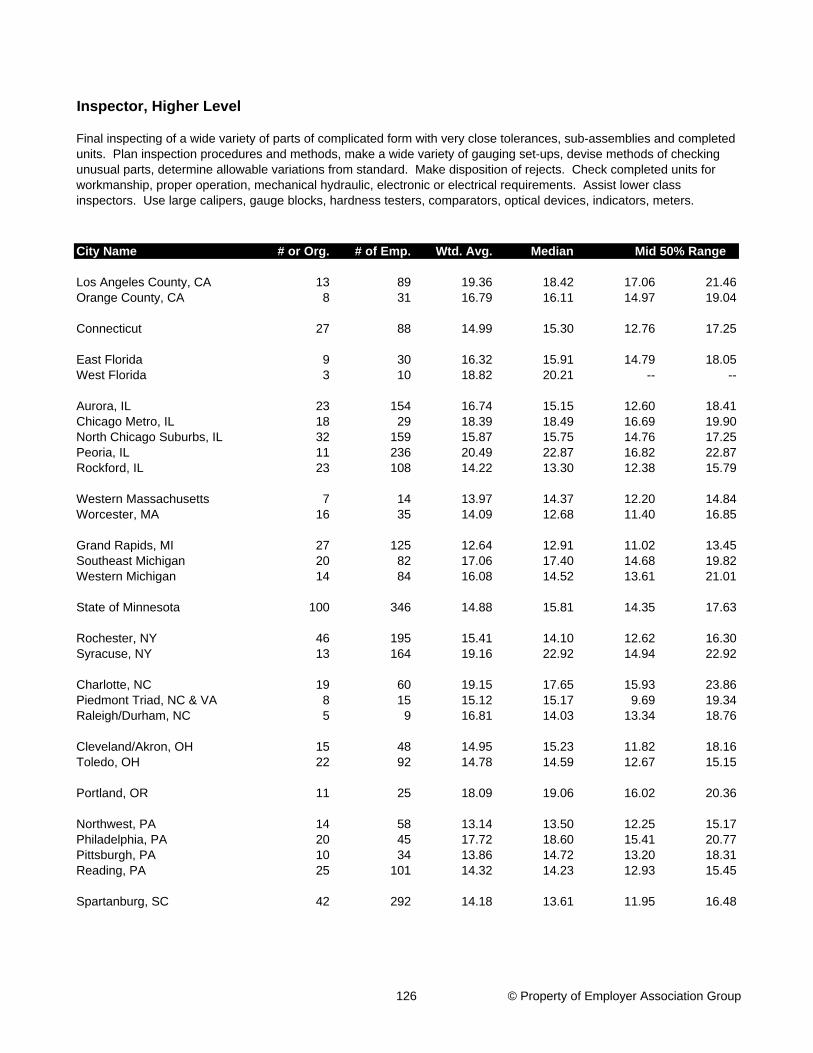
City Name # or Org. # of Emp. Wtd. Avg. Median
Los Angeles County, CA 13 89 19.36 18.42 17.06 21.46Orange County, CA 8 31 16.79 16.11 14.97 19.04
Connecticut 27 88 14.99 15.30 12.76 17.25
East Florida 9 30 16.32 15.91 14.79 18.05West Florida 3 10 18.82 20.21 -- --
Aurora, IL 23 154 16.74 15.15 12.60 18.41Chicago Metro, IL 18 29 18.39 18.49 16.69 19.90North Chicago Suburbs, IL 32 159 15.87 15.75 14.76 17.25Peoria, IL 11 236 20.49 22.87 16.82 22.87Rockford, IL 23 108 14.22 13.30 12.38 15.79
Western Massachusetts 7 14 13.97 14.37 12.20 14.84Worcester, MA 16 35 14.09 12.68 11.40 16.85
Grand Rapids, MI 27 125 12.64 12.91 11.02 13.45Southeast Michigan 20 82 17.06 17.40 14.68 19.82Western Michigan 14 84 16.08 14.52 13.61 21.01
State of Minnesota 100 346 14.88 15.81 14.35 17.63
Rochester, NY 46 195 15.41 14.10 12.62 16.30Syracuse, NY 13 164 19.16 22.92 14.94 22.92
Charlotte, NC 19 60 19.15 17.65 15.93 23.86Piedmont Triad, NC & VA 8 15 15.12 15.17 9.69 19.34Raleigh/Durham, NC 5 9 16.81 14.03 13.34 18.76
Cleveland/Akron, OH 15 48 14.95 15.23 11.82 18.16Toledo, OH 22 92 14.78 14.59 12.67 15.15
Portland, OR 11 25 18.09 19.06 16.02 20.36
Northwest, PA 14 58 13.14 13.50 12.25 15.17Philadelphia, PA 20 45 17.72 18.60 15.41 20.77Pittsburgh, PA 10 34 13.86 14.72 13.20 18.31Reading, PA 25 101 14.32 14.23 12.93 15.45
Spartanburg, SC 42 292 14.18 13.61 11.95 16.48
Inspector, Higher Level
Mid 50% Range
Final inspecting of a wide variety of parts of complicated form with very close tolerances, sub-assemblies and completed units. Plan inspection procedures and methods, make a wide variety of gauging set-ups, devise methods of checking unusual parts, determine allowable variations from standard. Make disposition of rejects. Check completed units for workmanship, proper operation, mechanical hydraulic, electronic or electrical requirements. Assist lower class inspectors. Use large calipers, gauge blocks, hardness testers, comparators, optical devices, indicators, meters.
126 © Property of Employer Association Group
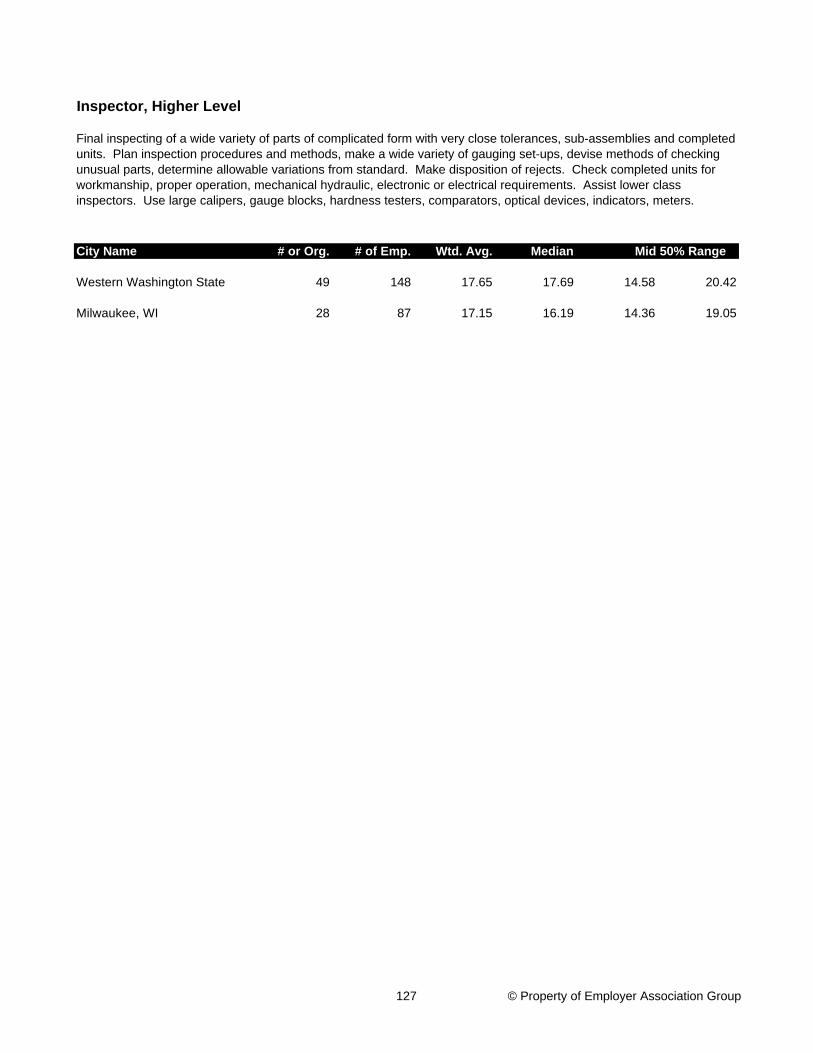
City Name # or Org. # of Emp. Wtd. Avg. Median
Inspector, Higher Level
Mid 50% Range
Final inspecting of a wide variety of parts of complicated form with very close tolerances, sub-assemblies and completed units. Plan inspection procedures and methods, make a wide variety of gauging set-ups, devise methods of checking unusual parts, determine allowable variations from standard. Make disposition of rejects. Check completed units for workmanship, proper operation, mechanical hydraulic, electronic or electrical requirements. Assist lower class inspectors. Use large calipers, gauge blocks, hardness testers, comparators, optical devices, indicators, meters.
Western Washington State 49 148 17.65 17.69 14.58 20.42
Milwaukee, WI 28 87 17.15 16.19 14.36 19.05
127 © Property of Employer Association Group
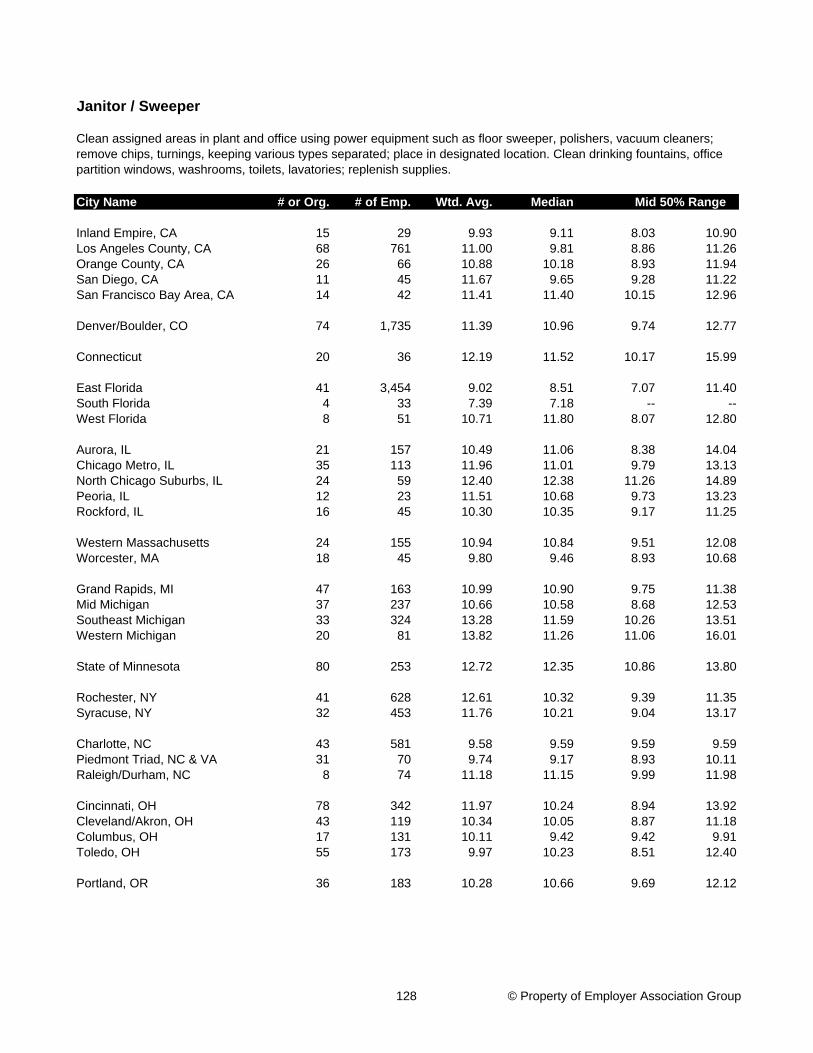
City Name # or Org. # of Emp. Wtd. Avg. Median
Inland Empire, CA 15 29 9.93 9.11 8.03 10.90Los Angeles County, CA 68 761 11.00 9.81 8.86 11.26Orange County, CA 26 66 10.88 10.18 8.93 11.94San Diego, CA 11 45 11.67 9.65 9.28 11.22San Francisco Bay Area, CA 14 42 11.41 11.40 10.15 12.96
Denver/Boulder, CO 74 1,735 11.39 10.96 9.74 12.77
Connecticut 20 36 12.19 11.52 10.17 15.99
East Florida 41 3,454 9.02 8.51 7.07 11.40South Florida 4 33 7.39 7.18 -- --West Florida 8 51 10.71 11.80 8.07 12.80
Aurora, IL 21 157 10.49 11.06 8.38 14.04Chicago Metro, IL 35 113 11.96 11.01 9.79 13.13North Chicago Suburbs, IL 24 59 12.40 12.38 11.26 14.89Peoria, IL 12 23 11.51 10.68 9.73 13.23Rockford, IL 16 45 10.30 10.35 9.17 11.25
Western Massachusetts 24 155 10.94 10.84 9.51 12.08Worcester, MA 18 45 9.80 9.46 8.93 10.68
Grand Rapids, MI 47 163 10.99 10.90 9.75 11.38Mid Michigan 37 237 10.66 10.58 8.68 12.53Southeast Michigan 33 324 13.28 11.59 10.26 13.51Western Michigan 20 81 13.82 11.26 11.06 16.01
State of Minnesota 80 253 12.72 12.35 10.86 13.80
Rochester, NY 41 628 12.61 10.32 9.39 11.35Syracuse, NY 32 453 11.76 10.21 9.04 13.17
Charlotte, NC 43 581 9.58 9.59 9.59 9.59Piedmont Triad, NC & VA 31 70 9.74 9.17 8.93 10.11Raleigh/Durham, NC 8 74 11.18 11.15 9.99 11.98
Cincinnati, OH 78 342 11.97 10.24 8.94 13.92Cleveland/Akron, OH 43 119 10.34 10.05 8.87 11.18Columbus, OH 17 131 10.11 9.42 9.42 9.91Toledo, OH 55 173 9.97 10.23 8.51 12.40
Portland, OR 36 183 10.28 10.66 9.69 12.12
Janitor / Sweeper
Mid 50% Range
Clean assigned areas in plant and office using power equipment such as floor sweeper, polishers, vacuum cleaners; remove chips, turnings, keeping various types separated; place in designated location. Clean drinking fountains, office partition windows, washrooms, toilets, lavatories; replenish supplies.
128 © Property of Employer Association Group
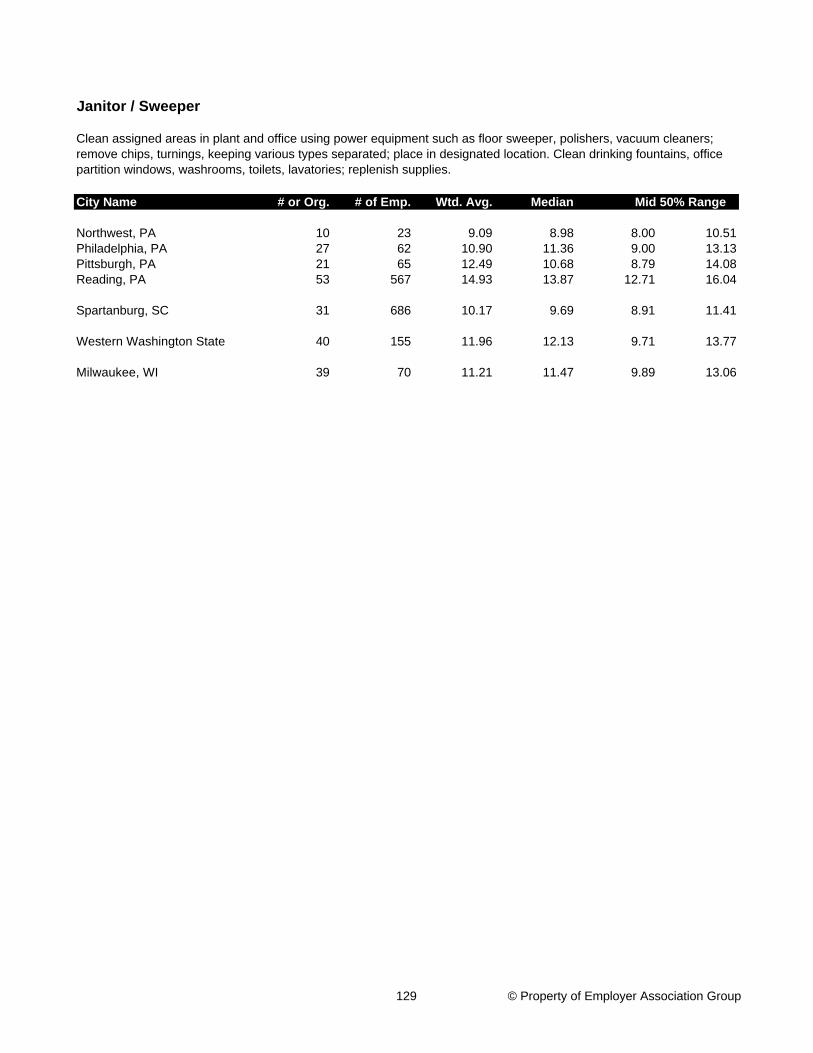
City Name # or Org. # of Emp. Wtd. Avg. Median
Janitor / Sweeper
Mid 50% Range
Clean assigned areas in plant and office using power equipment such as floor sweeper, polishers, vacuum cleaners; remove chips, turnings, keeping various types separated; place in designated location. Clean drinking fountains, office partition windows, washrooms, toilets, lavatories; replenish supplies.
Northwest, PA 10 23 9.09 8.98 8.00 10.51Philadelphia, PA 27 62 10.90 11.36 9.00 13.13Pittsburgh, PA 21 65 12.49 10.68 8.79 14.08Reading, PA 53 567 14.93 13.87 12.71 16.04
Spartanburg, SC 31 686 10.17 9.69 8.91 11.41
Western Washington State 40 155 11.96 12.13 9.71 13.77
Milwaukee, WI 39 70 11.21 11.47 9.89 13.06
129 © Property of Employer Association Group
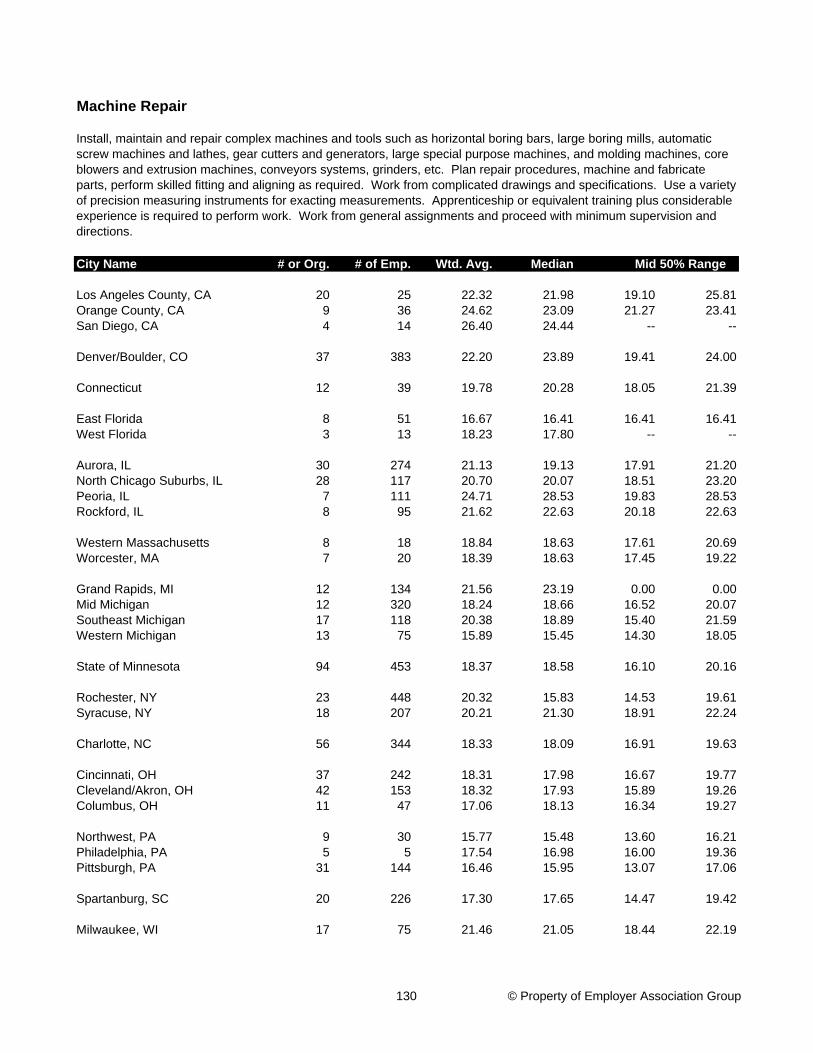
City Name # or Org. # of Emp. Wtd. Avg. Median
Los Angeles County, CA 20 25 22.32 21.98 19.10 25.81Orange County, CA 9 36 24.62 23.09 21.27 23.41San Diego, CA 4 14 26.40 24.44 -- --
Denver/Boulder, CO 37 383 22.20 23.89 19.41 24.00
Connecticut 12 39 19.78 20.28 18.05 21.39
East Florida 8 51 16.67 16.41 16.41 16.41West Florida 3 13 18.23 17.80 -- --
Aurora, IL 30 274 21.13 19.13 17.91 21.20North Chicago Suburbs, IL 28 117 20.70 20.07 18.51 23.20Peoria, IL 7 111 24.71 28.53 19.83 28.53Rockford, IL 8 95 21.62 22.63 20.18 22.63
Western Massachusetts 8 18 18.84 18.63 17.61 20.69Worcester, MA 7 20 18.39 18.63 17.45 19.22
Grand Rapids, MI 12 134 21.56 23.19 0.00 0.00Mid Michigan 12 320 18.24 18.66 16.52 20.07Southeast Michigan 17 118 20.38 18.89 15.40 21.59Western Michigan 13 75 15.89 15.45 14.30 18.05
State of Minnesota 94 453 18.37 18.58 16.10 20.16
Rochester, NY 23 448 20.32 15.83 14.53 19.61Syracuse, NY 18 207 20.21 21.30 18.91 22.24
Charlotte, NC 56 344 18.33 18.09 16.91 19.63
Cincinnati, OH 37 242 18.31 17.98 16.67 19.77Cleveland/Akron, OH 42 153 18.32 17.93 15.89 19.26Columbus, OH 11 47 17.06 18.13 16.34 19.27
Northwest, PA 9 30 15.77 15.48 13.60 16.21Philadelphia, PA 5 5 17.54 16.98 16.00 19.36Pittsburgh, PA 31 144 16.46 15.95 13.07 17.06
Spartanburg, SC 20 226 17.30 17.65 14.47 19.42
Milwaukee, WI 17 75 21.46 21.05 18.44 22.19
Machine Repair
Mid 50% Range
Install, maintain and repair complex machines and tools such as horizontal boring bars, large boring mills, automatic screw machines and lathes, gear cutters and generators, large special purpose machines, and molding machines, core blowers and extrusion machines, conveyors systems, grinders, etc. Plan repair procedures, machine and fabricate parts, perform skilled fitting and aligning as required. Work from complicated drawings and specifications. Use a variety of precision measuring instruments for exacting measurements. Apprenticeship or equivalent training plus considerable experience is required to perform work. Work from general assignments and proceed with minimum supervision and directions.
130 © Property of Employer Association Group
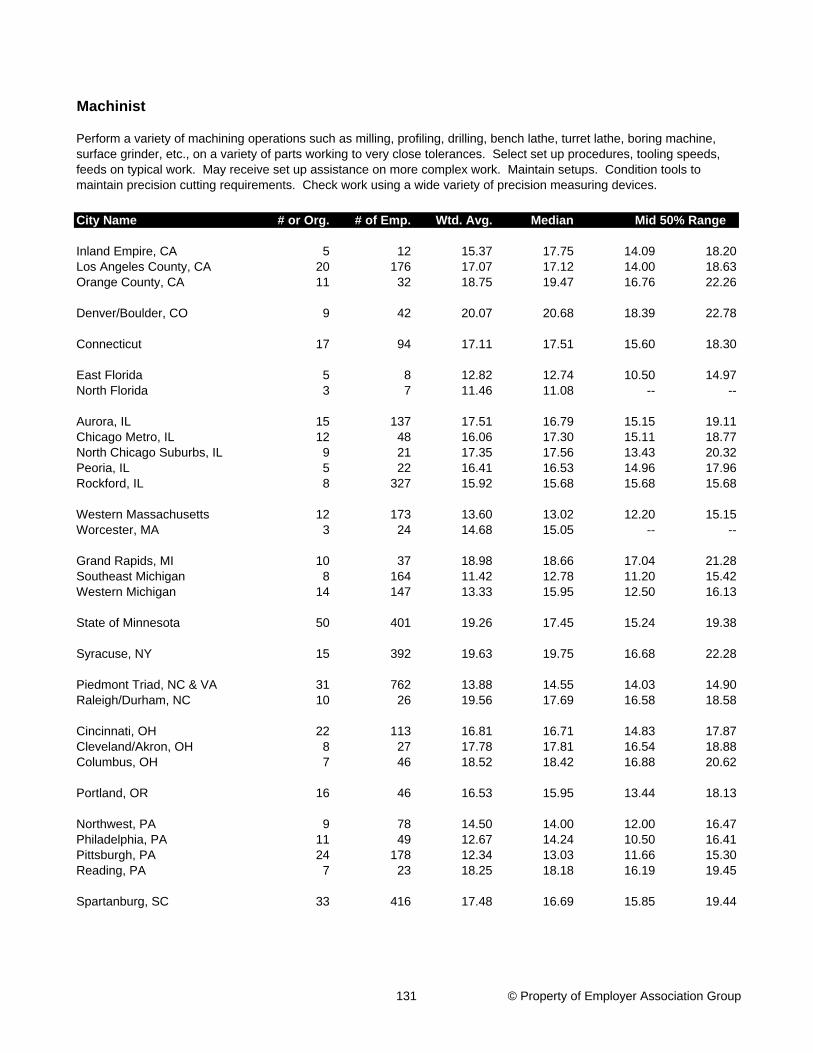
City Name # or Org. # of Emp. Wtd. Avg. Median
Inland Empire, CA 5 12 15.37 17.75 14.09 18.20Los Angeles County, CA 20 176 17.07 17.12 14.00 18.63Orange County, CA 11 32 18.75 19.47 16.76 22.26
Denver/Boulder, CO 9 42 20.07 20.68 18.39 22.78
Connecticut 17 94 17.11 17.51 15.60 18.30
East Florida 5 8 12.82 12.74 10.50 14.97North Florida 3 7 11.46 11.08 -- --
Aurora, IL 15 137 17.51 16.79 15.15 19.11Chicago Metro, IL 12 48 16.06 17.30 15.11 18.77North Chicago Suburbs, IL 9 21 17.35 17.56 13.43 20.32Peoria, IL 5 22 16.41 16.53 14.96 17.96Rockford, IL 8 327 15.92 15.68 15.68 15.68
Western Massachusetts 12 173 13.60 13.02 12.20 15.15Worcester, MA 3 24 14.68 15.05 -- --
Grand Rapids, MI 10 37 18.98 18.66 17.04 21.28Southeast Michigan 8 164 11.42 12.78 11.20 15.42Western Michigan 14 147 13.33 15.95 12.50 16.13
State of Minnesota 50 401 19.26 17.45 15.24 19.38
Syracuse, NY 15 392 19.63 19.75 16.68 22.28
Piedmont Triad, NC & VA 31 762 13.88 14.55 14.03 14.90Raleigh/Durham, NC 10 26 19.56 17.69 16.58 18.58
Cincinnati, OH 22 113 16.81 16.71 14.83 17.87Cleveland/Akron, OH 8 27 17.78 17.81 16.54 18.88Columbus, OH 7 46 18.52 18.42 16.88 20.62
Portland, OR 16 46 16.53 15.95 13.44 18.13
Northwest, PA 9 78 14.50 14.00 12.00 16.47Philadelphia, PA 11 49 12.67 14.24 10.50 16.41Pittsburgh, PA 24 178 12.34 13.03 11.66 15.30Reading, PA 7 23 18.25 18.18 16.19 19.45
Spartanburg, SC 33 416 17.48 16.69 15.85 19.44
Machinist
Mid 50% Range
Perform a variety of machining operations such as milling, profiling, drilling, bench lathe, turret lathe, boring machine, surface grinder, etc., on a variety of parts working to very close tolerances. Select set up procedures, tooling speeds, feeds on typical work. May receive set up assistance on more complex work. Maintain setups. Condition tools to maintain precision cutting requirements. Check work using a wide variety of precision measuring devices.
131 © Property of Employer Association Group
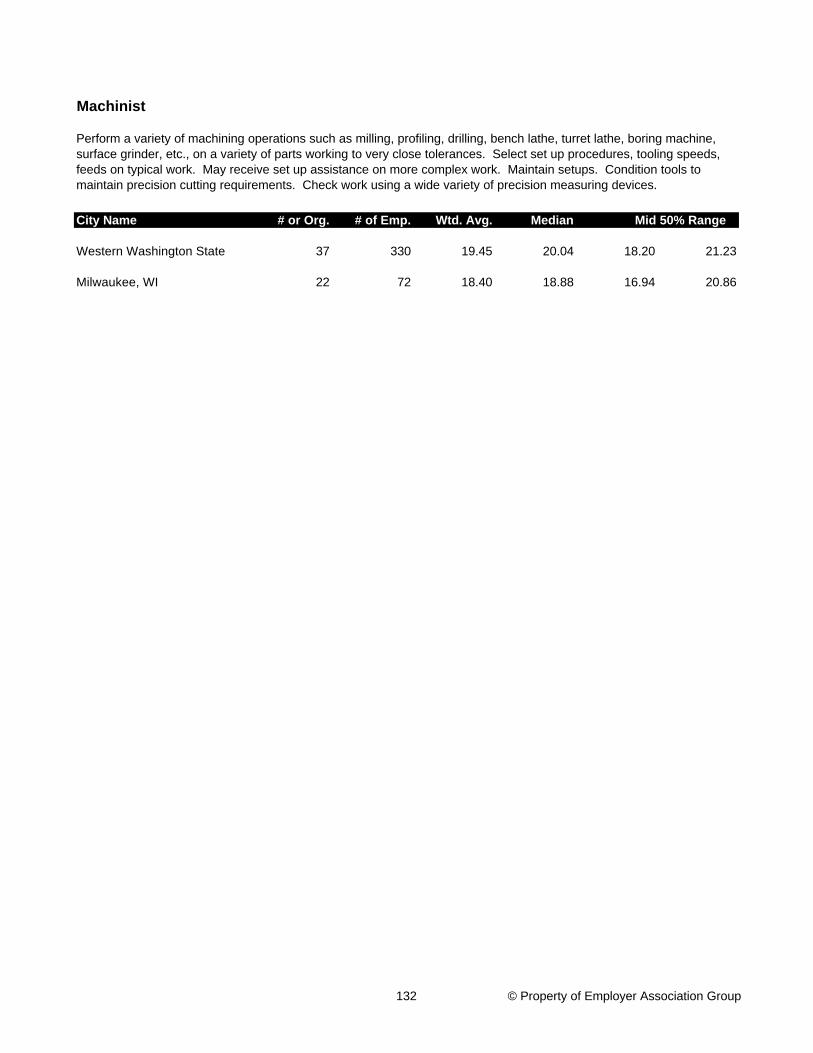
City Name # or Org. # of Emp. Wtd. Avg. Median
Machinist
Mid 50% Range
Perform a variety of machining operations such as milling, profiling, drilling, bench lathe, turret lathe, boring machine, surface grinder, etc., on a variety of parts working to very close tolerances. Select set up procedures, tooling speeds, feeds on typical work. May receive set up assistance on more complex work. Maintain setups. Condition tools to maintain precision cutting requirements. Check work using a wide variety of precision measuring devices.
Western Washington State 37 330 19.45 20.04 18.20 21.23
Milwaukee, WI 22 72 18.40 18.88 16.94 20.86
132 © Property of Employer Association Group
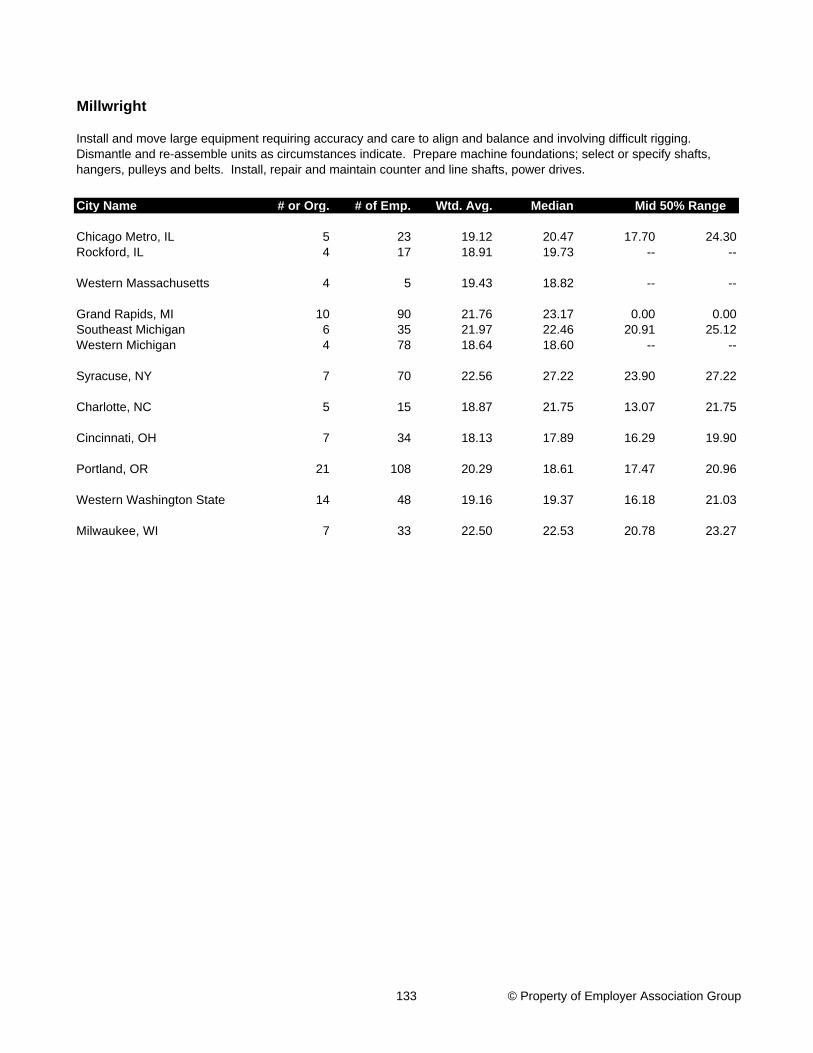
City Name # or Org. # of Emp. Wtd. Avg. Median
Chicago Metro, IL 5 23 19.12 20.47 17.70 24.30Rockford, IL 4 17 18.91 19.73 -- --
Western Massachusetts 4 5 19.43 18.82 -- --
Grand Rapids, MI 10 90 21.76 23.17 0.00 0.00Southeast Michigan 6 35 21.97 22.46 20.91 25.12Western Michigan 4 78 18.64 18.60 -- --
Syracuse, NY 7 70 22.56 27.22 23.90 27.22
Charlotte, NC 5 15 18.87 21.75 13.07 21.75
Cincinnati, OH 7 34 18.13 17.89 16.29 19.90
Portland, OR 21 108 20.29 18.61 17.47 20.96
Western Washington State 14 48 19.16 19.37 16.18 21.03
Milwaukee, WI 7 33 22.50 22.53 20.78 23.27
Millwright
Mid 50% Range
Install and move large equipment requiring accuracy and care to align and balance and involving difficult rigging. Dismantle and re-assemble units as circumstances indicate. Prepare machine foundations; select or specify shafts, hangers, pulleys and belts. Install, repair and maintain counter and line shafts, power drives.
133 © Property of Employer Association Group
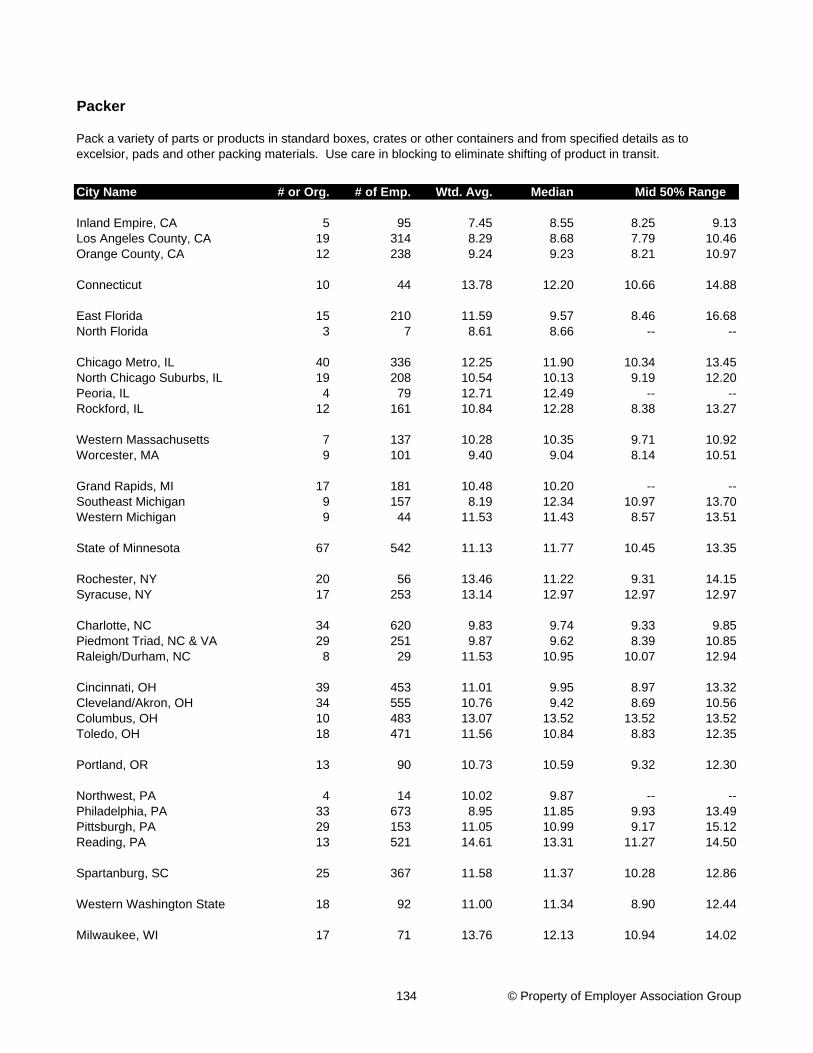
City Name # or Org. # of Emp. Wtd. Avg. Median
Inland Empire, CA 5 95 7.45 8.55 8.25 9.13Los Angeles County, CA 19 314 8.29 8.68 7.79 10.46Orange County, CA 12 238 9.24 9.23 8.21 10.97
Connecticut 10 44 13.78 12.20 10.66 14.88
East Florida 15 210 11.59 9.57 8.46 16.68North Florida 3 7 8.61 8.66 -- --
Chicago Metro, IL 40 336 12.25 11.90 10.34 13.45North Chicago Suburbs, IL 19 208 10.54 10.13 9.19 12.20Peoria, IL 4 79 12.71 12.49 -- --Rockford, IL 12 161 10.84 12.28 8.38 13.27
Western Massachusetts 7 137 10.28 10.35 9.71 10.92Worcester, MA 9 101 9.40 9.04 8.14 10.51
Grand Rapids, MI 17 181 10.48 10.20 -- --Southeast Michigan 9 157 8.19 12.34 10.97 13.70Western Michigan 9 44 11.53 11.43 8.57 13.51
State of Minnesota 67 542 11.13 11.77 10.45 13.35
Rochester, NY 20 56 13.46 11.22 9.31 14.15Syracuse, NY 17 253 13.14 12.97 12.97 12.97
Charlotte, NC 34 620 9.83 9.74 9.33 9.85Piedmont Triad, NC & VA 29 251 9.87 9.62 8.39 10.85Raleigh/Durham, NC 8 29 11.53 10.95 10.07 12.94
Cincinnati, OH 39 453 11.01 9.95 8.97 13.32Cleveland/Akron, OH 34 555 10.76 9.42 8.69 10.56Columbus, OH 10 483 13.07 13.52 13.52 13.52Toledo, OH 18 471 11.56 10.84 8.83 12.35
Portland, OR 13 90 10.73 10.59 9.32 12.30
Northwest, PA 4 14 10.02 9.87 -- --Philadelphia, PA 33 673 8.95 11.85 9.93 13.49Pittsburgh, PA 29 153 11.05 10.99 9.17 15.12Reading, PA 13 521 14.61 13.31 11.27 14.50
Spartanburg, SC 25 367 11.58 11.37 10.28 12.86
Western Washington State 18 92 11.00 11.34 8.90 12.44
Milwaukee, WI 17 71 13.76 12.13 10.94 14.02
Packer
Mid 50% Range
Pack a variety of parts or products in standard boxes, crates or other containers and from specified details as to excelsior, pads and other packing materials. Use care in blocking to eliminate shifting of product in transit.
134 © Property of Employer Association Group
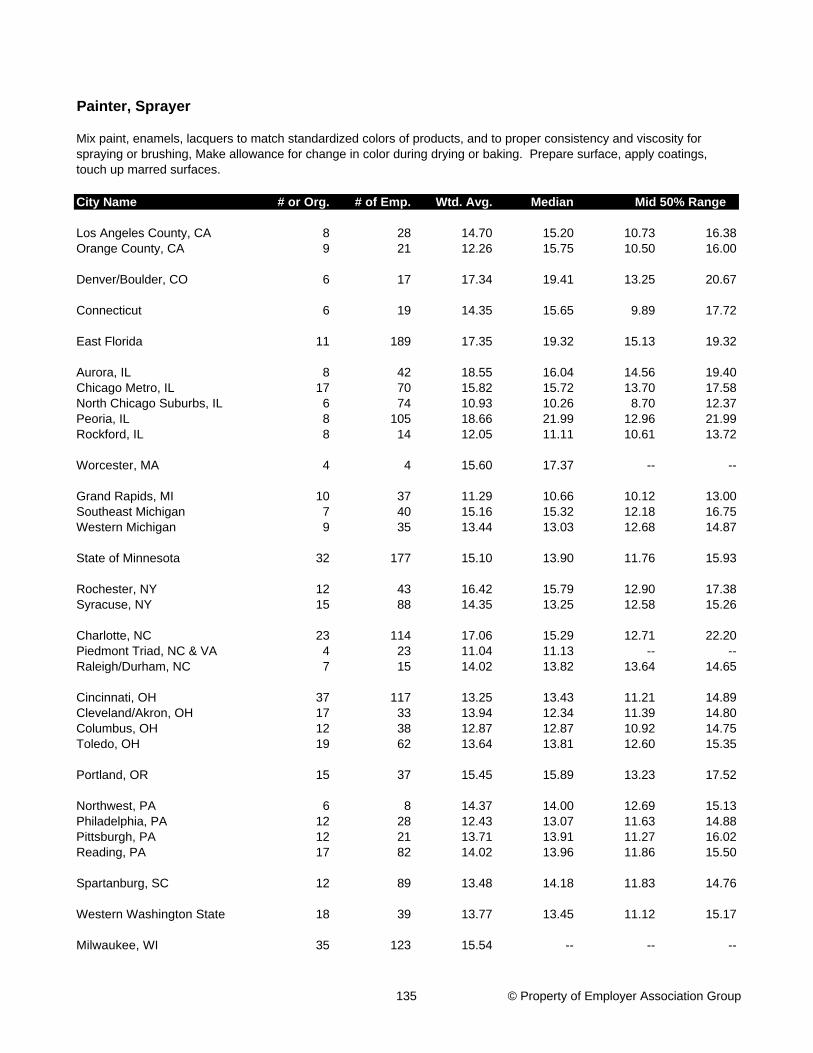
City Name # or Org. # of Emp. Wtd. Avg. Median
Los Angeles County, CA 8 28 14.70 15.20 10.73 16.38Orange County, CA 9 21 12.26 15.75 10.50 16.00
Denver/Boulder, CO 6 17 17.34 19.41 13.25 20.67
Connecticut 6 19 14.35 15.65 9.89 17.72
East Florida 11 189 17.35 19.32 15.13 19.32
Aurora, IL 8 42 18.55 16.04 14.56 19.40Chicago Metro, IL 17 70 15.82 15.72 13.70 17.58North Chicago Suburbs, IL 6 74 10.93 10.26 8.70 12.37Peoria, IL 8 105 18.66 21.99 12.96 21.99Rockford, IL 8 14 12.05 11.11 10.61 13.72
Worcester, MA 4 4 15.60 17.37 -- --
Grand Rapids, MI 10 37 11.29 10.66 10.12 13.00Southeast Michigan 7 40 15.16 15.32 12.18 16.75Western Michigan 9 35 13.44 13.03 12.68 14.87
State of Minnesota 32 177 15.10 13.90 11.76 15.93
Rochester, NY 12 43 16.42 15.79 12.90 17.38Syracuse, NY 15 88 14.35 13.25 12.58 15.26
Charlotte, NC 23 114 17.06 15.29 12.71 22.20Piedmont Triad, NC & VA 4 23 11.04 11.13 -- --Raleigh/Durham, NC 7 15 14.02 13.82 13.64 14.65
Cincinnati, OH 37 117 13.25 13.43 11.21 14.89Cleveland/Akron, OH 17 33 13.94 12.34 11.39 14.80Columbus, OH 12 38 12.87 12.87 10.92 14.75Toledo, OH 19 62 13.64 13.81 12.60 15.35
Portland, OR 15 37 15.45 15.89 13.23 17.52
Northwest, PA 6 8 14.37 14.00 12.69 15.13Philadelphia, PA 12 28 12.43 13.07 11.63 14.88Pittsburgh, PA 12 21 13.71 13.91 11.27 16.02Reading, PA 17 82 14.02 13.96 11.86 15.50
Spartanburg, SC 12 89 13.48 14.18 11.83 14.76
Western Washington State 18 39 13.77 13.45 11.12 15.17
Milwaukee, WI 35 123 15.54 -- -- --
Painter, Sprayer
Mid 50% Range
Mix paint, enamels, lacquers to match standardized colors of products, and to proper consistency and viscosity for spraying or brushing, Make allowance for change in color during drying or baking. Prepare surface, apply coatings, touch up marred surfaces.
135 © Property of Employer Association Group
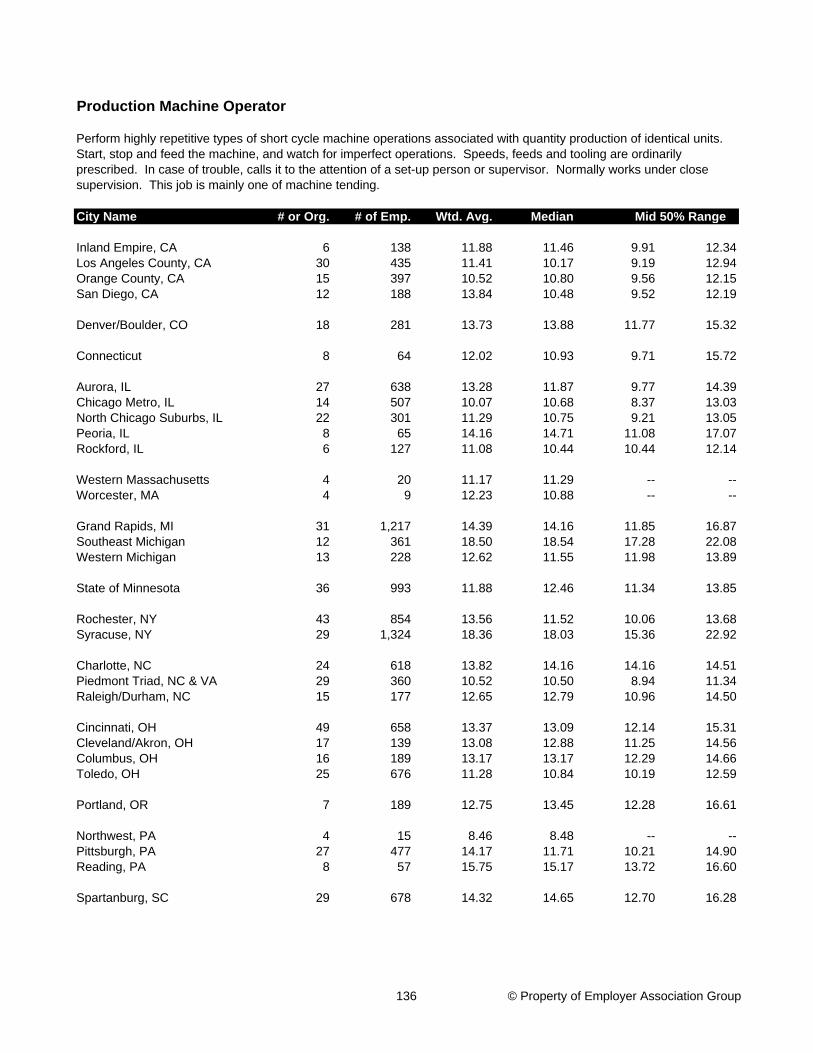
City Name # or Org. # of Emp. Wtd. Avg. Median
Inland Empire, CA 6 138 11.88 11.46 9.91 12.34Los Angeles County, CA 30 435 11.41 10.17 9.19 12.94Orange County, CA 15 397 10.52 10.80 9.56 12.15San Diego, CA 12 188 13.84 10.48 9.52 12.19
Denver/Boulder, CO 18 281 13.73 13.88 11.77 15.32
Connecticut 8 64 12.02 10.93 9.71 15.72
Aurora, IL 27 638 13.28 11.87 9.77 14.39Chicago Metro, IL 14 507 10.07 10.68 8.37 13.03North Chicago Suburbs, IL 22 301 11.29 10.75 9.21 13.05Peoria, IL 8 65 14.16 14.71 11.08 17.07Rockford, IL 6 127 11.08 10.44 10.44 12.14
Western Massachusetts 4 20 11.17 11.29 -- --Worcester, MA 4 9 12.23 10.88 -- --
Grand Rapids, MI 31 1,217 14.39 14.16 11.85 16.87Southeast Michigan 12 361 18.50 18.54 17.28 22.08Western Michigan 13 228 12.62 11.55 11.98 13.89
State of Minnesota 36 993 11.88 12.46 11.34 13.85
Rochester, NY 43 854 13.56 11.52 10.06 13.68Syracuse, NY 29 1,324 18.36 18.03 15.36 22.92
Charlotte, NC 24 618 13.82 14.16 14.16 14.51Piedmont Triad, NC & VA 29 360 10.52 10.50 8.94 11.34Raleigh/Durham, NC 15 177 12.65 12.79 10.96 14.50
Cincinnati, OH 49 658 13.37 13.09 12.14 15.31Cleveland/Akron, OH 17 139 13.08 12.88 11.25 14.56Columbus, OH 16 189 13.17 13.17 12.29 14.66Toledo, OH 25 676 11.28 10.84 10.19 12.59
Portland, OR 7 189 12.75 13.45 12.28 16.61
Northwest, PA 4 15 8.46 8.48 -- --Pittsburgh, PA 27 477 14.17 11.71 10.21 14.90Reading, PA 8 57 15.75 15.17 13.72 16.60
Spartanburg, SC 29 678 14.32 14.65 12.70 16.28
Production Machine Operator
Mid 50% Range
Perform highly repetitive types of short cycle machine operations associated with quantity production of identical units. Start, stop and feed the machine, and watch for imperfect operations. Speeds, feeds and tooling are ordinarily prescribed. In case of trouble, calls it to the attention of a set-up person or supervisor. Normally works under close supervision. This job is mainly one of machine tending.
136 © Property of Employer Association Group

City Name # or Org. # of Emp. Wtd. Avg. Median
Production Machine Operator
Mid 50% Range
Perform highly repetitive types of short cycle machine operations associated with quantity production of identical units. Start, stop and feed the machine, and watch for imperfect operations. Speeds, feeds and tooling are ordinarily prescribed. In case of trouble, calls it to the attention of a set-up person or supervisor. Normally works under close supervision. This job is mainly one of machine tending.
Western Washington State 23 173 10.78 10.21 9.60 11.83
Milwaukee, WI 7 196 14.00 11.18 10.59 14.40
137 © Property of Employer Association Group
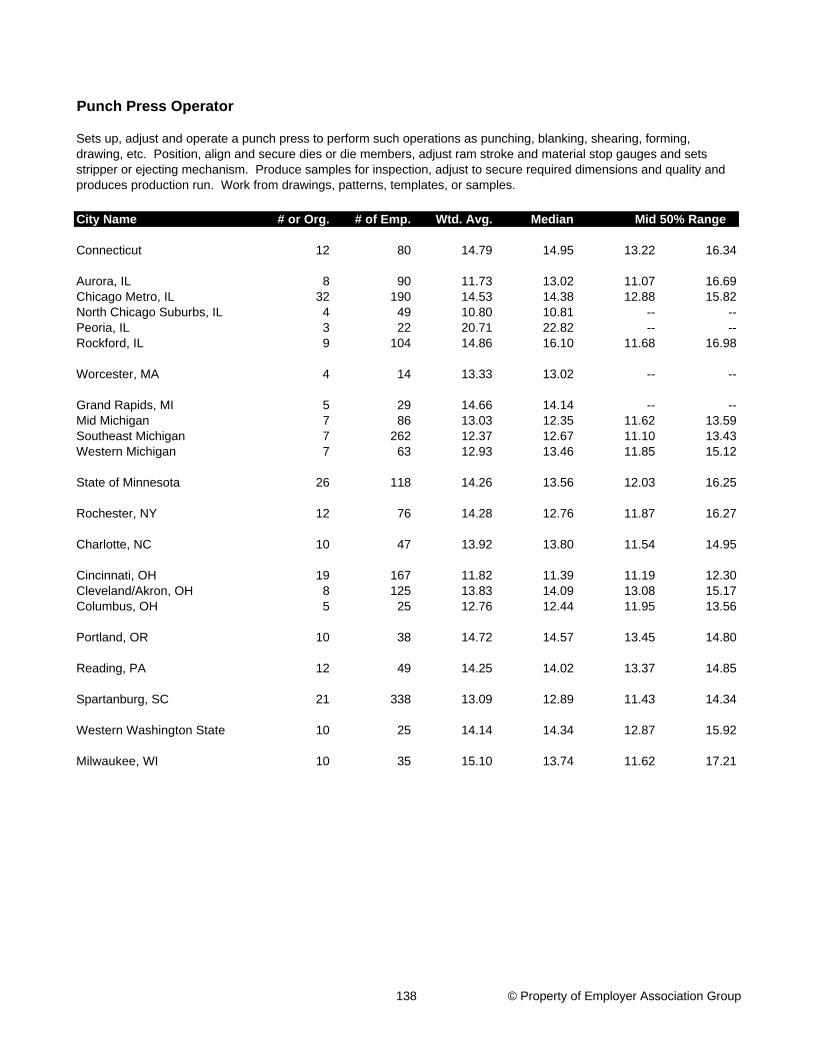
City Name # or Org. # of Emp. Wtd. Avg. Median
Connecticut 12 80 14.79 14.95 13.22 16.34
Aurora, IL 8 90 11.73 13.02 11.07 16.69Chicago Metro, IL 32 190 14.53 14.38 12.88 15.82North Chicago Suburbs, IL 4 49 10.80 10.81 -- --Peoria, IL 3 22 20.71 22.82 -- --Rockford, IL 9 104 14.86 16.10 11.68 16.98
Worcester, MA 4 14 13.33 13.02 -- --
Grand Rapids, MI 5 29 14.66 14.14 -- --Mid Michigan 7 86 13.03 12.35 11.62 13.59Southeast Michigan 7 262 12.37 12.67 11.10 13.43Western Michigan 7 63 12.93 13.46 11.85 15.12
State of Minnesota 26 118 14.26 13.56 12.03 16.25
Rochester, NY 12 76 14.28 12.76 11.87 16.27
Charlotte, NC 10 47 13.92 13.80 11.54 14.95
Cincinnati, OH 19 167 11.82 11.39 11.19 12.30Cleveland/Akron, OH 8 125 13.83 14.09 13.08 15.17Columbus, OH 5 25 12.76 12.44 11.95 13.56
Portland, OR 10 38 14.72 14.57 13.45 14.80
Reading, PA 12 49 14.25 14.02 13.37 14.85
Spartanburg, SC 21 338 13.09 12.89 11.43 14.34
Western Washington State 10 25 14.14 14.34 12.87 15.92
Milwaukee, WI 10 35 15.10 13.74 11.62 17.21
Punch Press Operator
Mid 50% Range
Sets up, adjust and operate a punch press to perform such operations as punching, blanking, shearing, forming, drawing, etc. Position, align and secure dies or die members, adjust ram stroke and material stop gauges and sets stripper or ejecting mechanism. Produce samples for inspection, adjust to secure required dimensions and quality and produces production run. Work from drawings, patterns, templates, or samples.
138 © Property of Employer Association Group
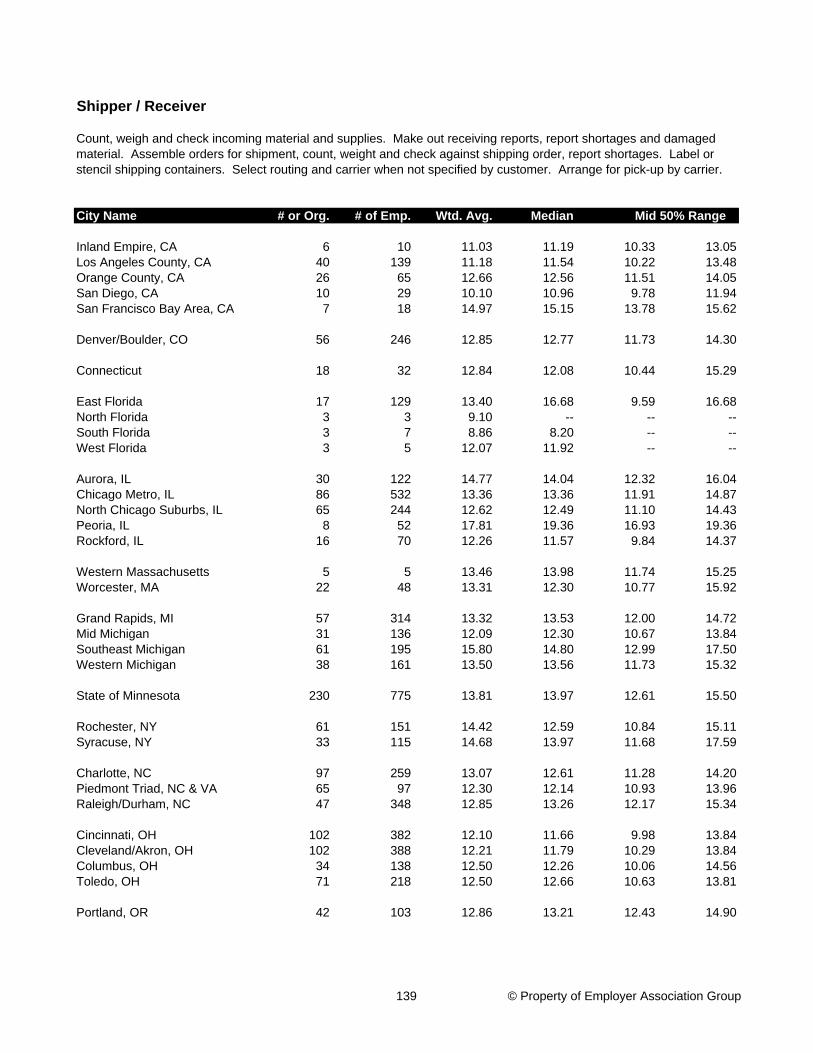
City Name # or Org. # of Emp. Wtd. Avg. Median
Inland Empire, CA 6 10 11.03 11.19 10.33 13.05Los Angeles County, CA 40 139 11.18 11.54 10.22 13.48Orange County, CA 26 65 12.66 12.56 11.51 14.05San Diego, CA 10 29 10.10 10.96 9.78 11.94San Francisco Bay Area, CA 7 18 14.97 15.15 13.78 15.62
Denver/Boulder, CO 56 246 12.85 12.77 11.73 14.30
Connecticut 18 32 12.84 12.08 10.44 15.29
East Florida 17 129 13.40 16.68 9.59 16.68North Florida 3 3 9.10 -- -- --South Florida 3 7 8.86 8.20 -- --West Florida 3 5 12.07 11.92 -- --
Aurora, IL 30 122 14.77 14.04 12.32 16.04Chicago Metro, IL 86 532 13.36 13.36 11.91 14.87North Chicago Suburbs, IL 65 244 12.62 12.49 11.10 14.43Peoria, IL 8 52 17.81 19.36 16.93 19.36Rockford, IL 16 70 12.26 11.57 9.84 14.37
Western Massachusetts 5 5 13.46 13.98 11.74 15.25Worcester, MA 22 48 13.31 12.30 10.77 15.92
Grand Rapids, MI 57 314 13.32 13.53 12.00 14.72Mid Michigan 31 136 12.09 12.30 10.67 13.84Southeast Michigan 61 195 15.80 14.80 12.99 17.50Western Michigan 38 161 13.50 13.56 11.73 15.32
State of Minnesota 230 775 13.81 13.97 12.61 15.50
Rochester, NY 61 151 14.42 12.59 10.84 15.11Syracuse, NY 33 115 14.68 13.97 11.68 17.59
Charlotte, NC 97 259 13.07 12.61 11.28 14.20Piedmont Triad, NC & VA 65 97 12.30 12.14 10.93 13.96Raleigh/Durham, NC 47 348 12.85 13.26 12.17 15.34
Cincinnati, OH 102 382 12.10 11.66 9.98 13.84Cleveland/Akron, OH 102 388 12.21 11.79 10.29 13.84Columbus, OH 34 138 12.50 12.26 10.06 14.56Toledo, OH 71 218 12.50 12.66 10.63 13.81
Portland, OR 42 103 12.86 13.21 12.43 14.90
Shipper / Receiver
Mid 50% Range
Count, weigh and check incoming material and supplies. Make out receiving reports, report shortages and damaged material. Assemble orders for shipment, count, weight and check against shipping order, report shortages. Label or stencil shipping containers. Select routing and carrier when not specified by customer. Arrange for pick-up by carrier.
139 © Property of Employer Association Group
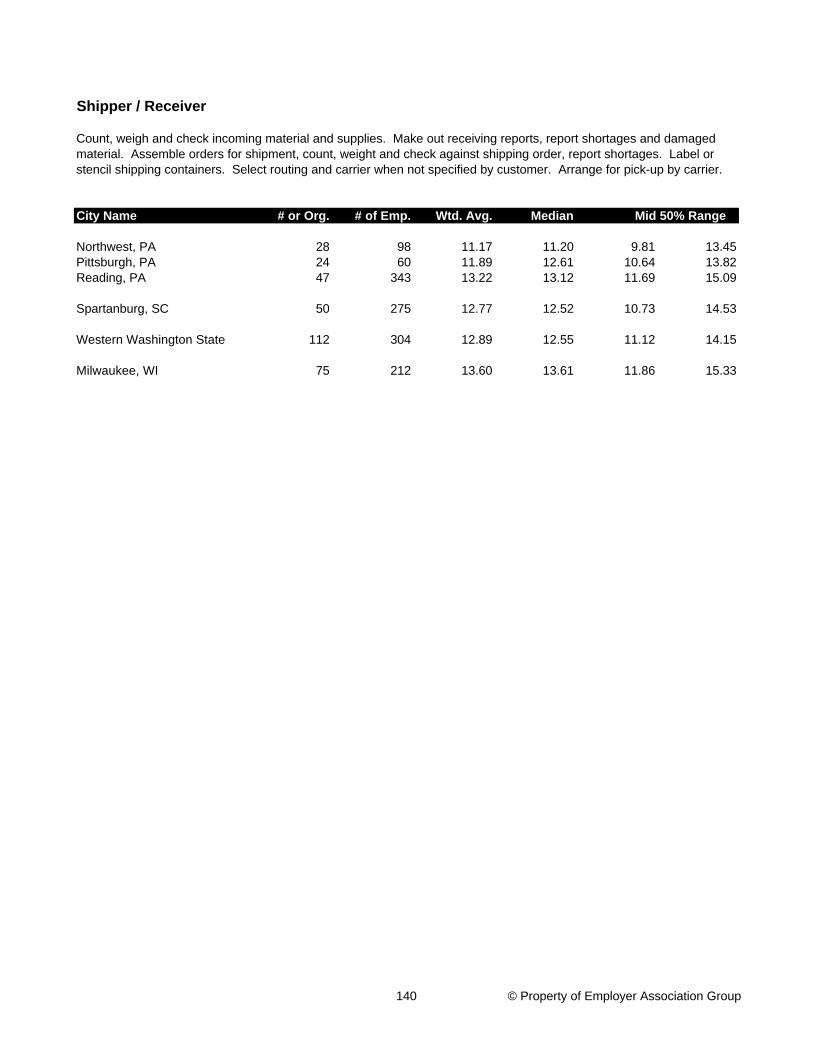
City Name # or Org. # of Emp. Wtd. Avg. Median
Shipper / Receiver
Mid 50% Range
Count, weigh and check incoming material and supplies. Make out receiving reports, report shortages and damaged material. Assemble orders for shipment, count, weight and check against shipping order, report shortages. Label or stencil shipping containers. Select routing and carrier when not specified by customer. Arrange for pick-up by carrier.
Northwest, PA 28 98 11.17 11.20 9.81 13.45Pittsburgh, PA 24 60 11.89 12.61 10.64 13.82Reading, PA 47 343 13.22 13.12 11.69 15.09
Spartanburg, SC 50 275 12.77 12.52 10.73 14.53
Western Washington State 112 304 12.89 12.55 11.12 14.15
Milwaukee, WI 75 212 13.60 13.61 11.86 15.33
140 © Property of Employer Association Group
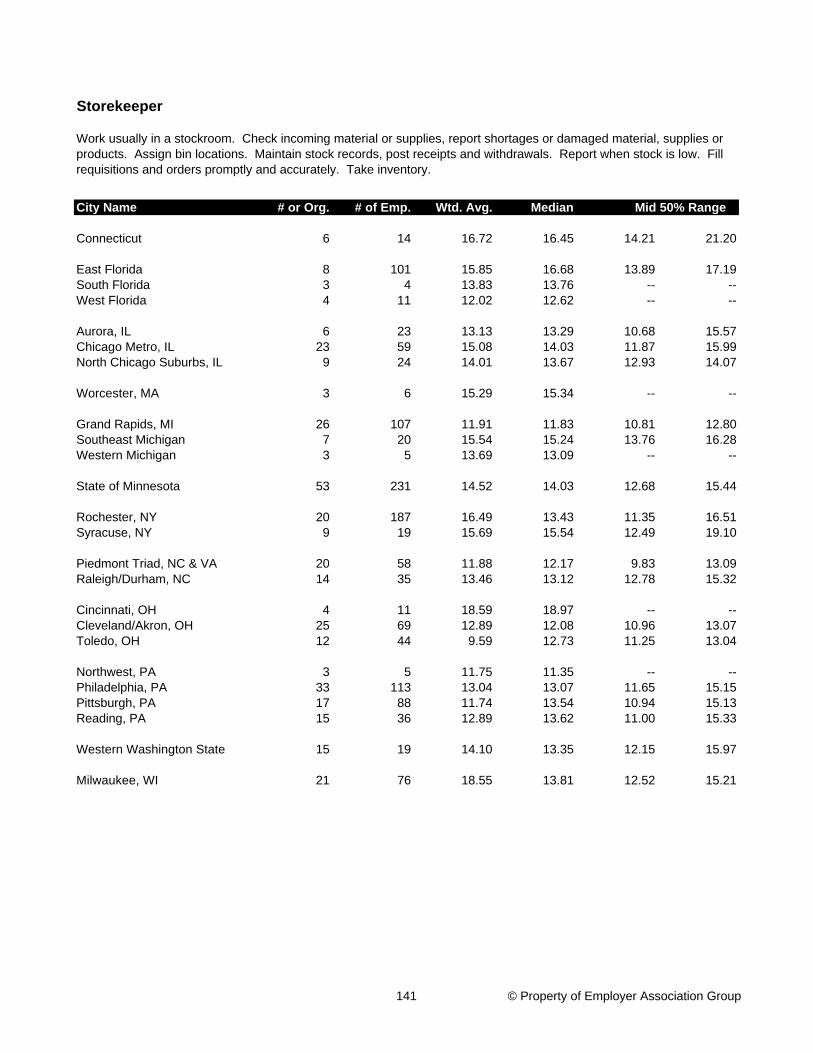
City Name # or Org. # of Emp. Wtd. Avg. Median
Connecticut 6 14 16.72 16.45 14.21 21.20
East Florida 8 101 15.85 16.68 13.89 17.19South Florida 3 4 13.83 13.76 -- --West Florida 4 11 12.02 12.62 -- --
Aurora, IL 6 23 13.13 13.29 10.68 15.57Chicago Metro, IL 23 59 15.08 14.03 11.87 15.99North Chicago Suburbs, IL 9 24 14.01 13.67 12.93 14.07
Worcester, MA 3 6 15.29 15.34 -- --
Grand Rapids, MI 26 107 11.91 11.83 10.81 12.80Southeast Michigan 7 20 15.54 15.24 13.76 16.28Western Michigan 3 5 13.69 13.09 -- --
State of Minnesota 53 231 14.52 14.03 12.68 15.44
Rochester, NY 20 187 16.49 13.43 11.35 16.51Syracuse, NY 9 19 15.69 15.54 12.49 19.10
Piedmont Triad, NC & VA 20 58 11.88 12.17 9.83 13.09Raleigh/Durham, NC 14 35 13.46 13.12 12.78 15.32
Cincinnati, OH 4 11 18.59 18.97 -- --Cleveland/Akron, OH 25 69 12.89 12.08 10.96 13.07Toledo, OH 12 44 9.59 12.73 11.25 13.04
Northwest, PA 3 5 11.75 11.35 -- --Philadelphia, PA 33 113 13.04 13.07 11.65 15.15Pittsburgh, PA 17 88 11.74 13.54 10.94 15.13Reading, PA 15 36 12.89 13.62 11.00 15.33
Western Washington State 15 19 14.10 13.35 12.15 15.97
Milwaukee, WI 21 76 18.55 13.81 12.52 15.21
Storekeeper
Mid 50% Range
Work usually in a stockroom. Check incoming material or supplies, report shortages or damaged material, supplies or products. Assign bin locations. Maintain stock records, post receipts and withdrawals. Report when stock is low. Fill requisitions and orders promptly and accurately. Take inventory.
141 © Property of Employer Association Group
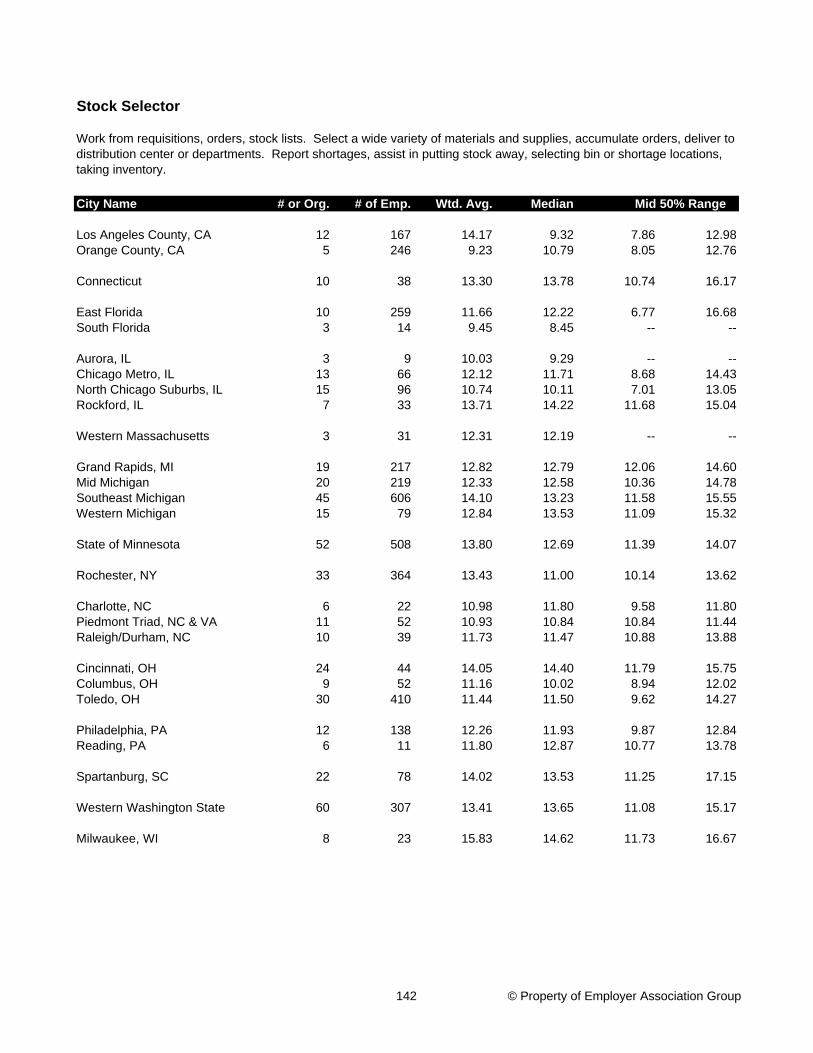
City Name # or Org. # of Emp. Wtd. Avg. Median
Los Angeles County, CA 12 167 14.17 9.32 7.86 12.98Orange County, CA 5 246 9.23 10.79 8.05 12.76
Connecticut 10 38 13.30 13.78 10.74 16.17
East Florida 10 259 11.66 12.22 6.77 16.68South Florida 3 14 9.45 8.45 -- --
Aurora, IL 3 9 10.03 9.29 -- --Chicago Metro, IL 13 66 12.12 11.71 8.68 14.43North Chicago Suburbs, IL 15 96 10.74 10.11 7.01 13.05Rockford, IL 7 33 13.71 14.22 11.68 15.04
Western Massachusetts 3 31 12.31 12.19 -- --
Grand Rapids, MI 19 217 12.82 12.79 12.06 14.60Mid Michigan 20 219 12.33 12.58 10.36 14.78Southeast Michigan 45 606 14.10 13.23 11.58 15.55Western Michigan 15 79 12.84 13.53 11.09 15.32
State of Minnesota 52 508 13.80 12.69 11.39 14.07
Rochester, NY 33 364 13.43 11.00 10.14 13.62
Charlotte, NC 6 22 10.98 11.80 9.58 11.80Piedmont Triad, NC & VA 11 52 10.93 10.84 10.84 11.44Raleigh/Durham, NC 10 39 11.73 11.47 10.88 13.88
Cincinnati, OH 24 44 14.05 14.40 11.79 15.75Columbus, OH 9 52 11.16 10.02 8.94 12.02Toledo, OH 30 410 11.44 11.50 9.62 14.27
Philadelphia, PA 12 138 12.26 11.93 9.87 12.84Reading, PA 6 11 11.80 12.87 10.77 13.78
Spartanburg, SC 22 78 14.02 13.53 11.25 17.15
Western Washington State 60 307 13.41 13.65 11.08 15.17
Milwaukee, WI 8 23 15.83 14.62 11.73 16.67
Stock Selector
Mid 50% Range
Work from requisitions, orders, stock lists. Select a wide variety of materials and supplies, accumulate orders, deliver to distribution center or departments. Report shortages, assist in putting stock away, selecting bin or shortage locations, taking inventory.
142 © Property of Employer Association Group

City Name # or Org. # of Emp. Wtd. Avg. Median
Los Angeles County, CA 12 42 21.40 22.43 21.14 24.00Orange County, CA 5 18 24.80 25.01 22.97 28.00
Denver/Boulder, CO 14 45 22.97 23.24 21.24 24.73
Connecticut 20 117 21.09 22.54 18.66 23.61
East Florida 4 18 17.47 17.57 -- --West Florida 4 10 20.30 21.06 -- --
Aurora, IL 15 73 21.80 22.52 19.41 24.19Chicago Metro, IL 44 186 22.78 22.40 19.94 23.93North Chicago Suburbs, IL 18 84 23.75 24.05 23.03 25.30Peoria, IL 7 129 24.25 24.36 19.59 29.16Rockford, IL 16 152 20.46 22.43 17.31 23.12
Western Massachusetts 5 9 17.45 17.61 17.59 19.06Worcester, MA 6 13 19.82 19.60 18.71 20.33
Grand Rapids, MI 22 391 22.11 21.42 20.64 23.19Mid Michigan 5 48 18.08 18.11 17.54 18.48Southeast Michigan 15 167 22.16 23.13 20.82 24.37Western Michigan 19 127 19.74 20.39 18.65 20.66
State of Minnesota 38 186 21.51 20.61 18.04 22.55
Rochester, NY 32 133 21.05 20.30 18.17 21.87Syracuse, NY 9 75 23.41 22.96 21.99 25.56
Charlotte, NC 12 47 20.19 20.24 18.88 22.12Piedmont Triad, NC & VA 7 21 18.46 19.34 15.11 21.57Raleigh/Durham, NC 11 29 22.29 21.25 19.64 25.99
Cincinnati, OH 34 235 21.67 21.83 18.83 26.39Cleveland/Akron, OH 18 70 18.61 18.81 17.30 20.53Columbus, OH 10 41 18.25 19.02 17.63 20.41Toledo, OH 20 126 18.67 19.04 17.50 20.10
Portland, OR 12 55 21.60 21.62 20.21 25.32
Northwest, PA 10 69 18.25 18.00 16.36 20.15Philadelphia, PA 8 36 19.91 19.13 17.87 21.68Pittsburgh, PA 10 130 18.15 18.00 17.46 19.10Reading, PA 16 93 20.09 19.04 18.30 21.13
Spartanburg, SC 22 146 19.35 20.12 16.82 21.26
Tool and Die Maker
Mid 50% Range
Plan, construct, alter and repair a wide variety of tools, dies, jigs, fixtures and gauges to very close tolerance. Perform development work, difficult toolroom operations, skilled fitting, timing and adjusting. Plan construction procedures and methods. Select materials. Make allowances for shrinkage during heat treating of tools, metal flow in dies. Make tool tryouts. Diagnose and correct trouble in complicated dies and tools.
143 © Property of Employer Association Group
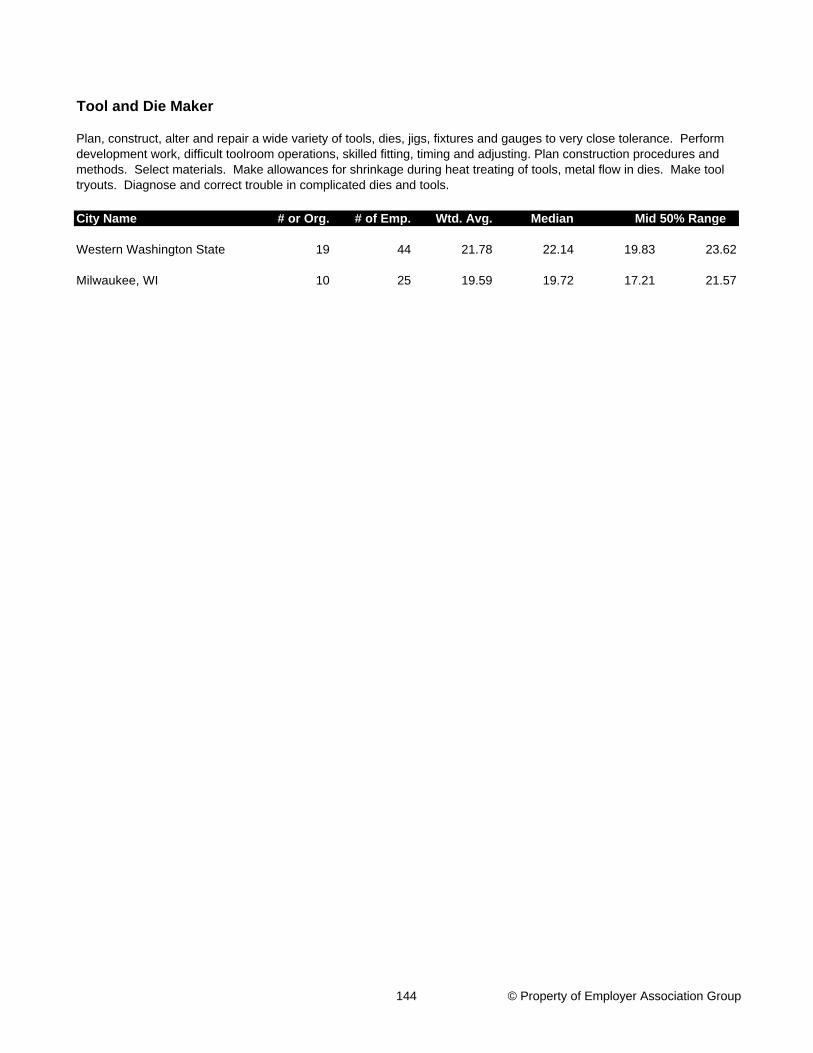
City Name # or Org. # of Emp. Wtd. Avg. Median
Tool and Die Maker
Mid 50% Range
Plan, construct, alter and repair a wide variety of tools, dies, jigs, fixtures and gauges to very close tolerance. Perform development work, difficult toolroom operations, skilled fitting, timing and adjusting. Plan construction procedures and methods. Select materials. Make allowances for shrinkage during heat treating of tools, metal flow in dies. Make tool tryouts. Diagnose and correct trouble in complicated dies and tools.
Western Washington State 19 44 21.78 22.14 19.83 23.62
Milwaukee, WI 10 25 19.59 19.72 17.21 21.57
144 © Property of Employer Association Group
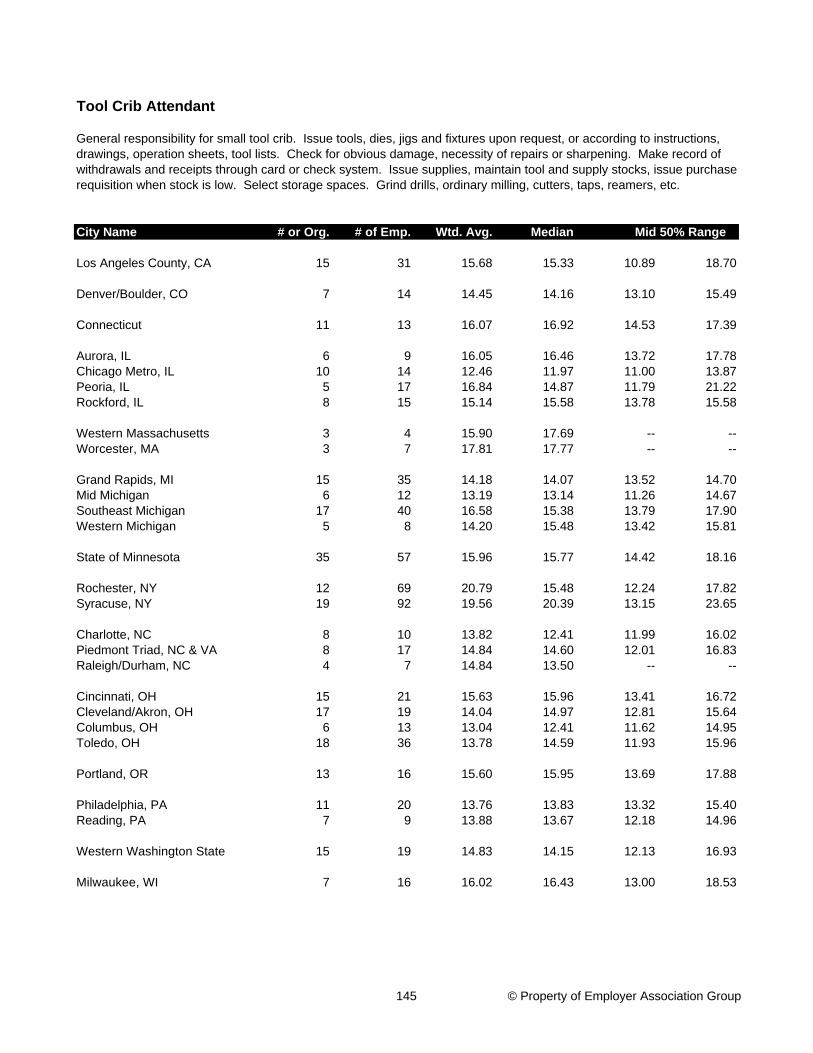
City Name # or Org. # of Emp. Wtd. Avg. Median
Los Angeles County, CA 15 31 15.68 15.33 10.89 18.70
Denver/Boulder, CO 7 14 14.45 14.16 13.10 15.49
Connecticut 11 13 16.07 16.92 14.53 17.39
Aurora, IL 6 9 16.05 16.46 13.72 17.78Chicago Metro, IL 10 14 12.46 11.97 11.00 13.87Peoria, IL 5 17 16.84 14.87 11.79 21.22Rockford, IL 8 15 15.14 15.58 13.78 15.58
Western Massachusetts 3 4 15.90 17.69 -- --Worcester, MA 3 7 17.81 17.77 -- --
Grand Rapids, MI 15 35 14.18 14.07 13.52 14.70Mid Michigan 6 12 13.19 13.14 11.26 14.67Southeast Michigan 17 40 16.58 15.38 13.79 17.90Western Michigan 5 8 14.20 15.48 13.42 15.81
State of Minnesota 35 57 15.96 15.77 14.42 18.16
Rochester, NY 12 69 20.79 15.48 12.24 17.82Syracuse, NY 19 92 19.56 20.39 13.15 23.65
Charlotte, NC 8 10 13.82 12.41 11.99 16.02Piedmont Triad, NC & VA 8 17 14.84 14.60 12.01 16.83Raleigh/Durham, NC 4 7 14.84 13.50 -- --
Cincinnati, OH 15 21 15.63 15.96 13.41 16.72Cleveland/Akron, OH 17 19 14.04 14.97 12.81 15.64Columbus, OH 6 13 13.04 12.41 11.62 14.95Toledo, OH 18 36 13.78 14.59 11.93 15.96
Portland, OR 13 16 15.60 15.95 13.69 17.88
Philadelphia, PA 11 20 13.76 13.83 13.32 15.40Reading, PA 7 9 13.88 13.67 12.18 14.96
Western Washington State 15 19 14.83 14.15 12.13 16.93
Milwaukee, WI 7 16 16.02 16.43 13.00 18.53
Tool Crib Attendant
Mid 50% Range
General responsibility for small tool crib. Issue tools, dies, jigs and fixtures upon request, or according to instructions, drawings, operation sheets, tool lists. Check for obvious damage, necessity of repairs or sharpening. Make record of withdrawals and receipts through card or check system. Issue supplies, maintain tool and supply stocks, issue purchase requisition when stock is low. Select storage spaces. Grind drills, ordinary milling, cutters, taps, reamers, etc.
145 © Property of Employer Association Group
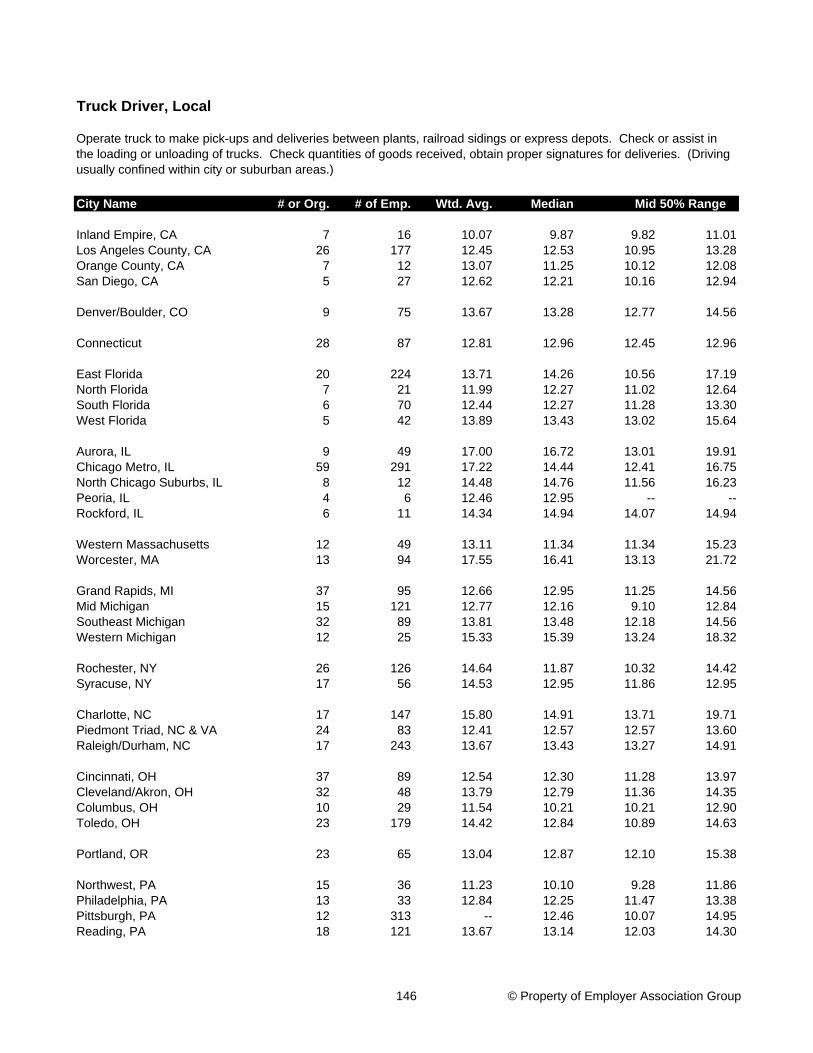
City Name # or Org. # of Emp. Wtd. Avg. Median
Inland Empire, CA 7 16 10.07 9.87 9.82 11.01Los Angeles County, CA 26 177 12.45 12.53 10.95 13.28Orange County, CA 7 12 13.07 11.25 10.12 12.08San Diego, CA 5 27 12.62 12.21 10.16 12.94
Denver/Boulder, CO 9 75 13.67 13.28 12.77 14.56
Connecticut 28 87 12.81 12.96 12.45 12.96
East Florida 20 224 13.71 14.26 10.56 17.19North Florida 7 21 11.99 12.27 11.02 12.64South Florida 6 70 12.44 12.27 11.28 13.30West Florida 5 42 13.89 13.43 13.02 15.64
Aurora, IL 9 49 17.00 16.72 13.01 19.91Chicago Metro, IL 59 291 17.22 14.44 12.41 16.75North Chicago Suburbs, IL 8 12 14.48 14.76 11.56 16.23Peoria, IL 4 6 12.46 12.95 -- --Rockford, IL 6 11 14.34 14.94 14.07 14.94
Western Massachusetts 12 49 13.11 11.34 11.34 15.23Worcester, MA 13 94 17.55 16.41 13.13 21.72
Grand Rapids, MI 37 95 12.66 12.95 11.25 14.56Mid Michigan 15 121 12.77 12.16 9.10 12.84Southeast Michigan 32 89 13.81 13.48 12.18 14.56Western Michigan 12 25 15.33 15.39 13.24 18.32
Rochester, NY 26 126 14.64 11.87 10.32 14.42Syracuse, NY 17 56 14.53 12.95 11.86 12.95
Charlotte, NC 17 147 15.80 14.91 13.71 19.71Piedmont Triad, NC & VA 24 83 12.41 12.57 12.57 13.60Raleigh/Durham, NC 17 243 13.67 13.43 13.27 14.91
Cincinnati, OH 37 89 12.54 12.30 11.28 13.97Cleveland/Akron, OH 32 48 13.79 12.79 11.36 14.35Columbus, OH 10 29 11.54 10.21 10.21 12.90Toledo, OH 23 179 14.42 12.84 10.89 14.63
Portland, OR 23 65 13.04 12.87 12.10 15.38
Northwest, PA 15 36 11.23 10.10 9.28 11.86Philadelphia, PA 13 33 12.84 12.25 11.47 13.38Pittsburgh, PA 12 313 -- 12.46 10.07 14.95Reading, PA 18 121 13.67 13.14 12.03 14.30
Truck Driver, Local
Mid 50% Range
Operate truck to make pick-ups and deliveries between plants, railroad sidings or express depots. Check or assist in the loading or unloading of trucks. Check quantities of goods received, obtain proper signatures for deliveries. (Driving usually confined within city or suburban areas.)
146 © Property of Employer Association Group
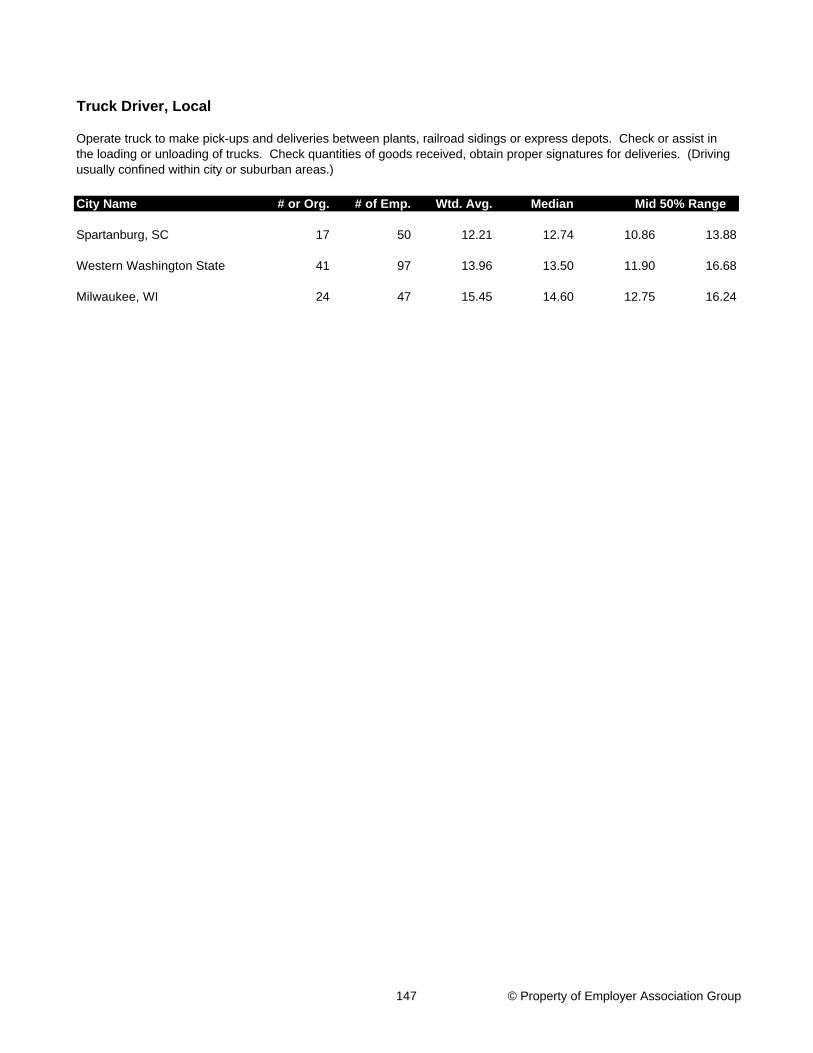
City Name # or Org. # of Emp. Wtd. Avg. Median
Truck Driver, Local
Mid 50% Range
Operate truck to make pick-ups and deliveries between plants, railroad sidings or express depots. Check or assist in the loading or unloading of trucks. Check quantities of goods received, obtain proper signatures for deliveries. (Driving usually confined within city or suburban areas.)
Spartanburg, SC 17 50 12.21 12.74 10.86 13.88
Western Washington State 41 97 13.96 13.50 11.90 16.68
Milwaukee, WI 24 47 15.45 14.60 12.75 16.24
147 © Property of Employer Association Group
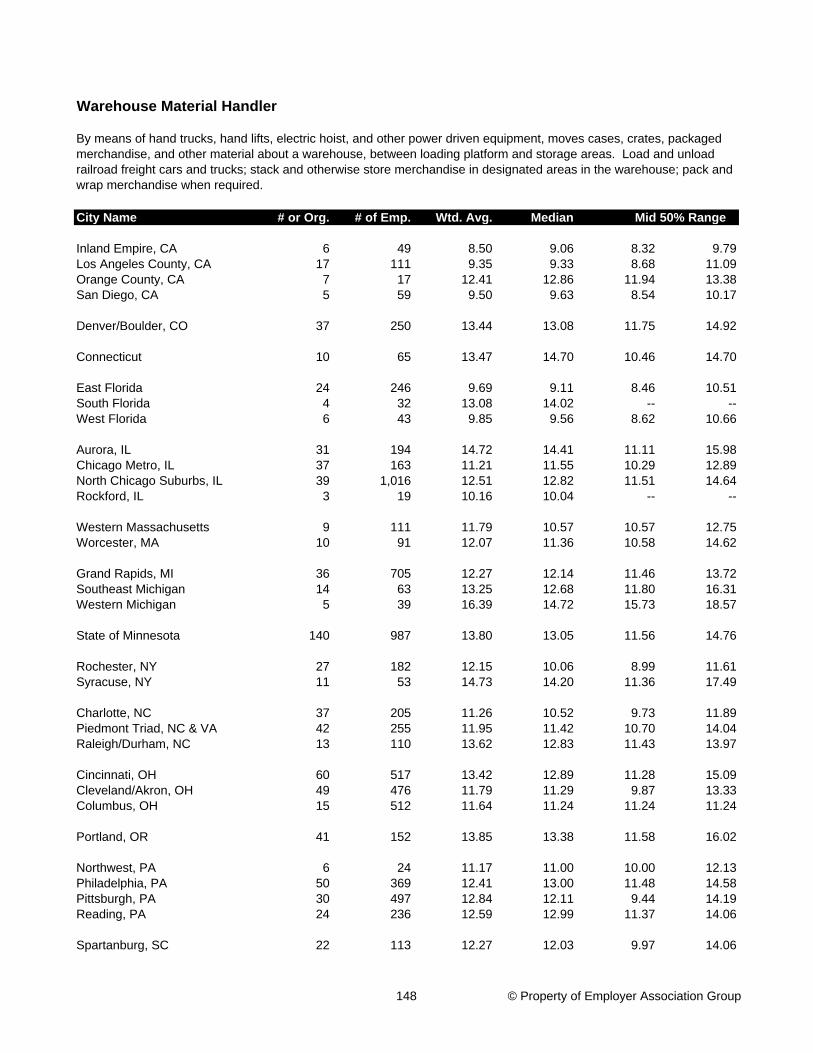
City Name # or Org. # of Emp. Wtd. Avg. Median
Inland Empire, CA 6 49 8.50 9.06 8.32 9.79Los Angeles County, CA 17 111 9.35 9.33 8.68 11.09Orange County, CA 7 17 12.41 12.86 11.94 13.38San Diego, CA 5 59 9.50 9.63 8.54 10.17
Denver/Boulder, CO 37 250 13.44 13.08 11.75 14.92
Connecticut 10 65 13.47 14.70 10.46 14.70
East Florida 24 246 9.69 9.11 8.46 10.51South Florida 4 32 13.08 14.02 -- --West Florida 6 43 9.85 9.56 8.62 10.66
Aurora, IL 31 194 14.72 14.41 11.11 15.98Chicago Metro, IL 37 163 11.21 11.55 10.29 12.89North Chicago Suburbs, IL 39 1,016 12.51 12.82 11.51 14.64Rockford, IL 3 19 10.16 10.04 -- --
Western Massachusetts 9 111 11.79 10.57 10.57 12.75Worcester, MA 10 91 12.07 11.36 10.58 14.62
Grand Rapids, MI 36 705 12.27 12.14 11.46 13.72Southeast Michigan 14 63 13.25 12.68 11.80 16.31Western Michigan 5 39 16.39 14.72 15.73 18.57
State of Minnesota 140 987 13.80 13.05 11.56 14.76
Rochester, NY 27 182 12.15 10.06 8.99 11.61Syracuse, NY 11 53 14.73 14.20 11.36 17.49
Charlotte, NC 37 205 11.26 10.52 9.73 11.89Piedmont Triad, NC & VA 42 255 11.95 11.42 10.70 14.04Raleigh/Durham, NC 13 110 13.62 12.83 11.43 13.97
Cincinnati, OH 60 517 13.42 12.89 11.28 15.09Cleveland/Akron, OH 49 476 11.79 11.29 9.87 13.33Columbus, OH 15 512 11.64 11.24 11.24 11.24
Portland, OR 41 152 13.85 13.38 11.58 16.02
Northwest, PA 6 24 11.17 11.00 10.00 12.13Philadelphia, PA 50 369 12.41 13.00 11.48 14.58Pittsburgh, PA 30 497 12.84 12.11 9.44 14.19Reading, PA 24 236 12.59 12.99 11.37 14.06
Spartanburg, SC 22 113 12.27 12.03 9.97 14.06
Warehouse Material Handler
Mid 50% Range
By means of hand trucks, hand lifts, electric hoist, and other power driven equipment, moves cases, crates, packaged merchandise, and other material about a warehouse, between loading platform and storage areas. Load and unload railroad freight cars and trucks; stack and otherwise store merchandise in designated areas in the warehouse; pack and wrap merchandise when required.
148 © Property of Employer Association Group
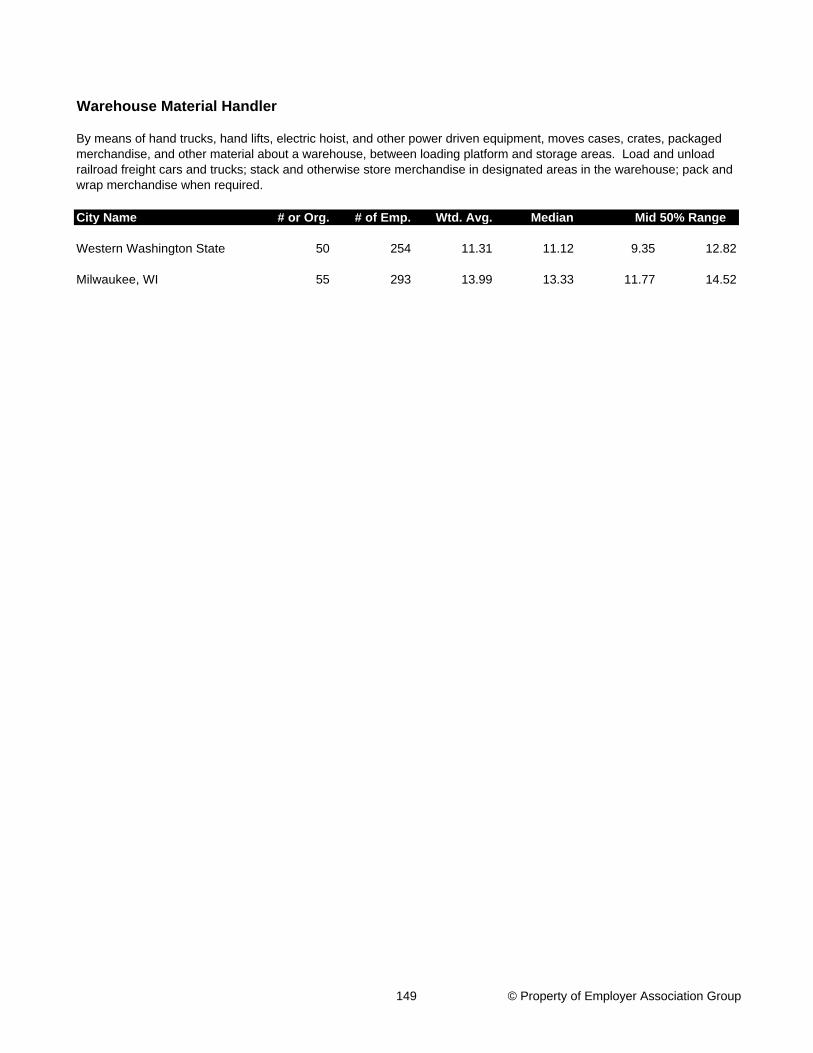
City Name # or Org. # of Emp. Wtd. Avg. Median
Warehouse Material Handler
Mid 50% Range
By means of hand trucks, hand lifts, electric hoist, and other power driven equipment, moves cases, crates, packaged merchandise, and other material about a warehouse, between loading platform and storage areas. Load and unload railroad freight cars and trucks; stack and otherwise store merchandise in designated areas in the warehouse; pack and wrap merchandise when required.
Western Washington State 50 254 11.31 11.12 9.35 12.82
Milwaukee, WI 55 293 13.99 13.33 11.77 14.52
149 © Property of Employer Association Group
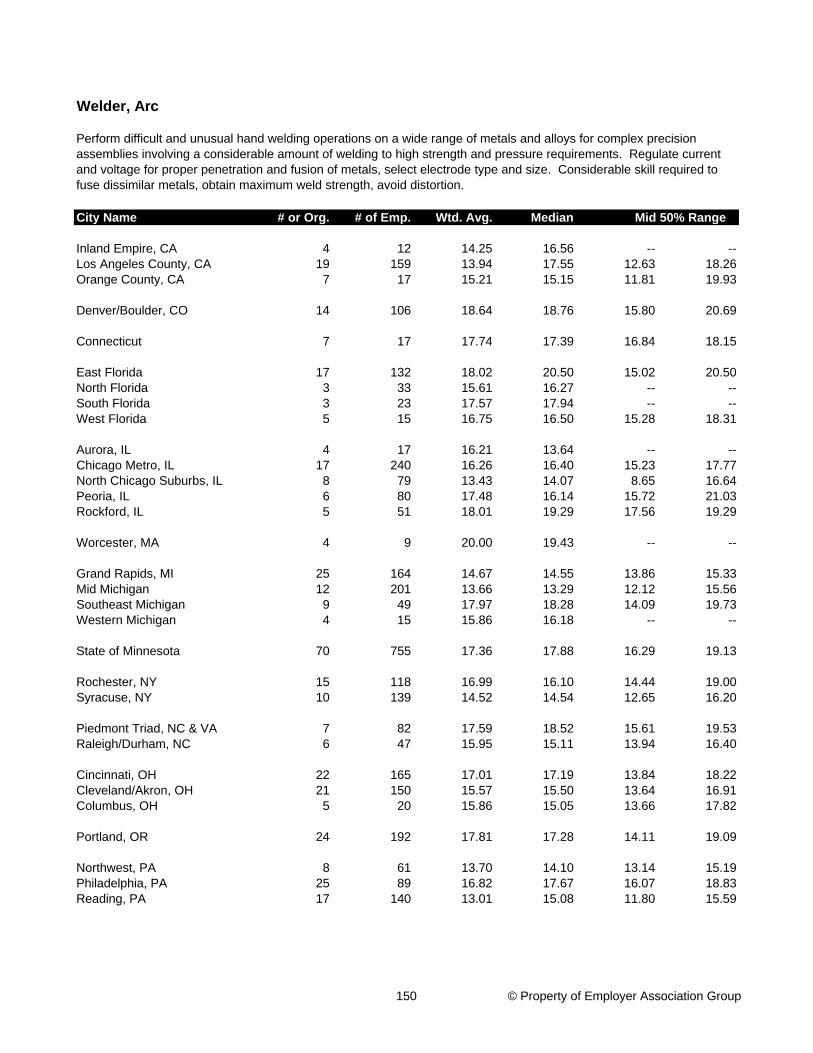
City Name # or Org. # of Emp. Wtd. Avg. Median
Inland Empire, CA 4 12 14.25 16.56 -- --Los Angeles County, CA 19 159 13.94 17.55 12.63 18.26Orange County, CA 7 17 15.21 15.15 11.81 19.93
Denver/Boulder, CO 14 106 18.64 18.76 15.80 20.69
Connecticut 7 17 17.74 17.39 16.84 18.15
East Florida 17 132 18.02 20.50 15.02 20.50North Florida 3 33 15.61 16.27 -- --South Florida 3 23 17.57 17.94 -- --West Florida 5 15 16.75 16.50 15.28 18.31
Aurora, IL 4 17 16.21 13.64 -- --Chicago Metro, IL 17 240 16.26 16.40 15.23 17.77North Chicago Suburbs, IL 8 79 13.43 14.07 8.65 16.64Peoria, IL 6 80 17.48 16.14 15.72 21.03Rockford, IL 5 51 18.01 19.29 17.56 19.29
Worcester, MA 4 9 20.00 19.43 -- --
Grand Rapids, MI 25 164 14.67 14.55 13.86 15.33Mid Michigan 12 201 13.66 13.29 12.12 15.56Southeast Michigan 9 49 17.97 18.28 14.09 19.73Western Michigan 4 15 15.86 16.18 -- --
State of Minnesota 70 755 17.36 17.88 16.29 19.13
Rochester, NY 15 118 16.99 16.10 14.44 19.00Syracuse, NY 10 139 14.52 14.54 12.65 16.20
Piedmont Triad, NC & VA 7 82 17.59 18.52 15.61 19.53Raleigh/Durham, NC 6 47 15.95 15.11 13.94 16.40
Cincinnati, OH 22 165 17.01 17.19 13.84 18.22Cleveland/Akron, OH 21 150 15.57 15.50 13.64 16.91Columbus, OH 5 20 15.86 15.05 13.66 17.82
Portland, OR 24 192 17.81 17.28 14.11 19.09
Northwest, PA 8 61 13.70 14.10 13.14 15.19Philadelphia, PA 25 89 16.82 17.67 16.07 18.83Reading, PA 17 140 13.01 15.08 11.80 15.59
Welder, Arc
Mid 50% Range
Perform difficult and unusual hand welding operations on a wide range of metals and alloys for complex precision assemblies involving a considerable amount of welding to high strength and pressure requirements. Regulate current and voltage for proper penetration and fusion of metals, select electrode type and size. Considerable skill required to fuse dissimilar metals, obtain maximum weld strength, avoid distortion.
150 © Property of Employer Association Group
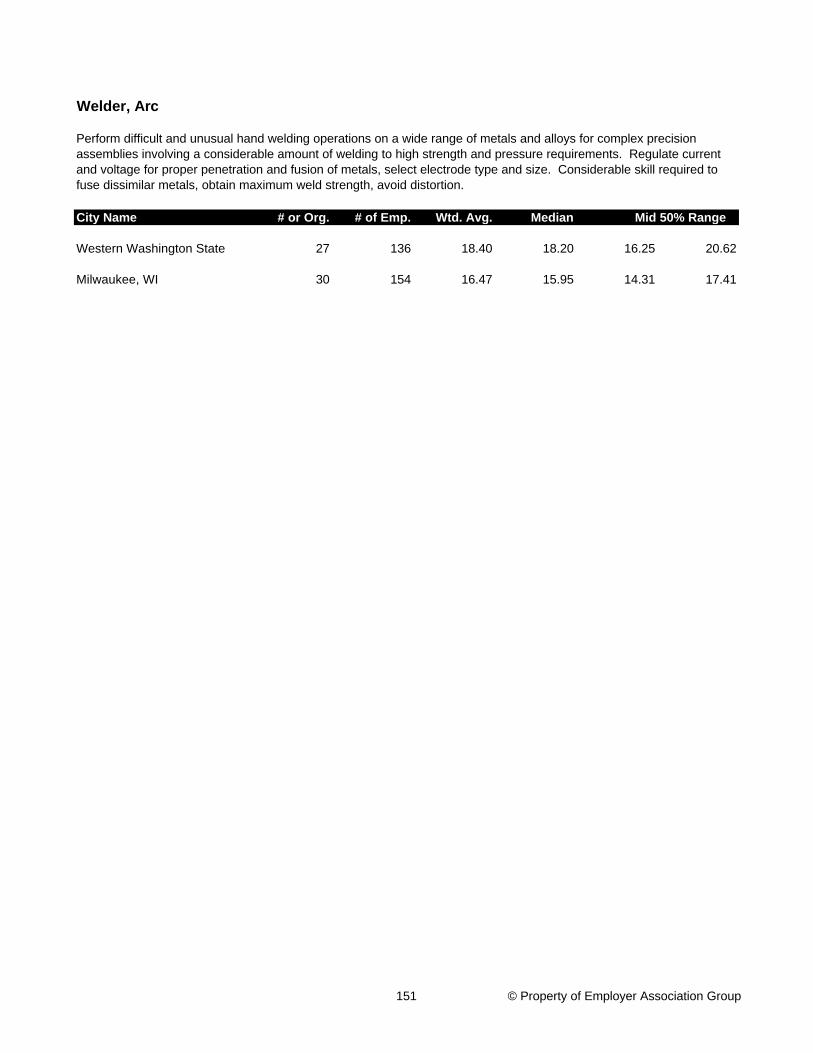
City Name # or Org. # of Emp. Wtd. Avg. Median
Welder, Arc
Mid 50% Range
Perform difficult and unusual hand welding operations on a wide range of metals and alloys for complex precision assemblies involving a considerable amount of welding to high strength and pressure requirements. Regulate current and voltage for proper penetration and fusion of metals, select electrode type and size. Considerable skill required to fuse dissimilar metals, obtain maximum weld strength, avoid distortion.
Western Washington State 27 136 18.40 18.20 16.25 20.62
Milwaukee, WI 30 154 16.47 15.95 14.31 17.41
151 © Property of Employer Association Group
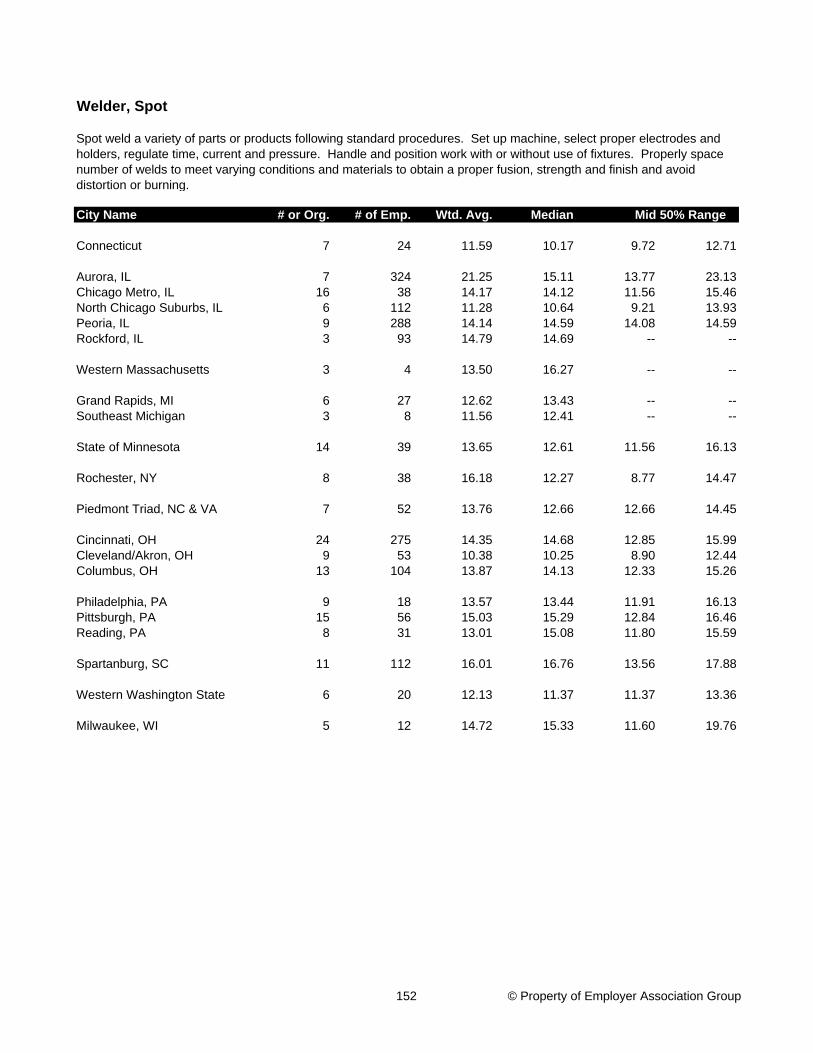
City Name # or Org. # of Emp. Wtd. Avg. Median
Connecticut 7 24 11.59 10.17 9.72 12.71
Aurora, IL 7 324 21.25 15.11 13.77 23.13Chicago Metro, IL 16 38 14.17 14.12 11.56 15.46North Chicago Suburbs, IL 6 112 11.28 10.64 9.21 13.93Peoria, IL 9 288 14.14 14.59 14.08 14.59Rockford, IL 3 93 14.79 14.69 -- --
Western Massachusetts 3 4 13.50 16.27 -- --
Grand Rapids, MI 6 27 12.62 13.43 -- --Southeast Michigan 3 8 11.56 12.41 -- --
State of Minnesota 14 39 13.65 12.61 11.56 16.13
Rochester, NY 8 38 16.18 12.27 8.77 14.47
Piedmont Triad, NC & VA 7 52 13.76 12.66 12.66 14.45
Cincinnati, OH 24 275 14.35 14.68 12.85 15.99Cleveland/Akron, OH 9 53 10.38 10.25 8.90 12.44Columbus, OH 13 104 13.87 14.13 12.33 15.26
Philadelphia, PA 9 18 13.57 13.44 11.91 16.13Pittsburgh, PA 15 56 15.03 15.29 12.84 16.46Reading, PA 8 31 13.01 15.08 11.80 15.59
Spartanburg, SC 11 112 16.01 16.76 13.56 17.88
Western Washington State 6 20 12.13 11.37 11.37 13.36
Milwaukee, WI 5 12 14.72 15.33 11.60 19.76
Welder, Spot
Mid 50% Range
Spot weld a variety of parts or products following standard procedures. Set up machine, select proper electrodes and holders, regulate time, current and pressure. Handle and position work with or without use of fixtures. Properly space number of welds to meet varying conditions and materials to obtain a proper fusion, strength and finish and avoid distortion or burning.
152 © Property of Employer Association Group