Embed Size (px)
Citation preview
National VitalStatistics ReportsVolume 67, Number 1 January 31, 2018
U.S. DEPARTMENT OF HEALTH AND HUMAN SERVICES Centers for Disease Control and Prevention
National Center for Health Statistics National Vital Statistics System
Births: Final Data for 2016by Joyce A. Martin, M.P.H.; Brady E. Hamilton, Ph.D.; Michelle J.K. Osterman, M.H.S.; Anne K. Driscoll, Ph.D.; and Patrick Drake, M.S., Division of Vital Statistics
AbstractObjectives—This report presents 2016 data on U.S. births
according to a wide variety of characteristics. Trends in fertility patterns and maternal and infant characteristics are described and interpreted.
Methods—Descriptive tabulations of data reported on the birth certificates of the 3.95 million births that occurred in
2016 are presented. Data are presented for maternal age, live-birth order, race and Hispanic origin, marital status, tobacco use, prenatal care, source of payment for the delivery, method of delivery, gestational age, birthweight, and plurality. Selected data by mother’s state of residence and birth rates by age also are shown. Trend data for 2010–2016 are presented for selected items.
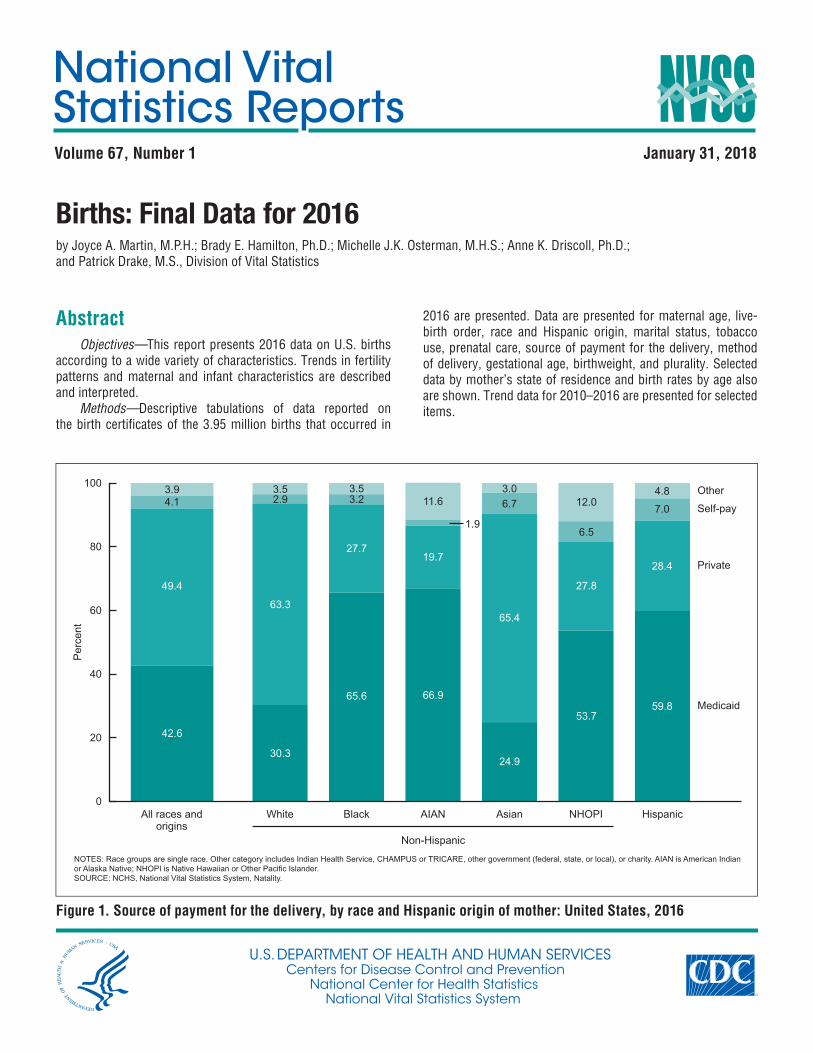
Figure 1. Source of payment for the delivery, by race and Hispanic origin of mother: United States, 2016
Perc
ent
OtherSelf-pay
Private
Medicaid
Non-Hispanic
0
20
40
60
80
100
HispanicNHOPIAsianAIANBlackWhite
3.52.9
63.3
30.3
3.53.2
27.7
65.6
11.6
1.9
19.7
66.9
3.06.7
65.4
24.9
12.0
6.5
27.8
53.7
4.87.0
28.4
59.8
All races andorigins
3.94.1
49.4
42.6
NOTES: Race groups are single race. Other category includes Indian Health Service, CHAMPUS or TRICARE, other government (federal, state, or local), or charity. AIAN is American Indianor Alaska Native; NHOPI is Native Hawaiian or Other Pacific Islander.SOURCE: NCHS, National Vital Statistics System, Natality.
Results—A total of 3,945,875 births were registered in the United States in 2016, down 1% from 2015. Compared with rates in 2015, the general fertility rate declined to 62.0 per 1,000 women aged 15–44. The birth rate for females aged 15–19 fell 9% in 2016. Birth rates declined for women in their 20s but increased for women in their 30s and early 40s. The total fertility rate declined to 1,820.5 births per 1,000 women in 2016. The birth rate for unmarried women declined, while the rate for married women increased. More than three-quarters of women began prenatal care in the first trimester of pregnancy (77.1%) in 2016, while 7.2% of all women smoked during pregnancy. The cesarean delivery rate declined for the fourth year in a row. Medicaid was the source of payment for 42.6% of all 2016 births. The preterm birth rate rose for the second straight year, and the rate of low birthweight increased 1%. Twin and triplet and higher-order multiple birth rates declined, although the changes were not statistically significant.
Keywords: birth certificate • maternal and infant health • birth rates • maternal characteristics
IntroductionThis report presents detailed data on numbers and
characteristics of births in 2016, birth and fertility rates, maternal demographic and health characteristics, medical and health care utilization, source of payment for the delivery, and infant health characteristics. A report of provisional birth statistics for 2016 presented data on selected topics based on a sample of nearly all 2016 births (99.96%) (1); an NCHS Data Brief presented selected characteristics for 2016 births (2).
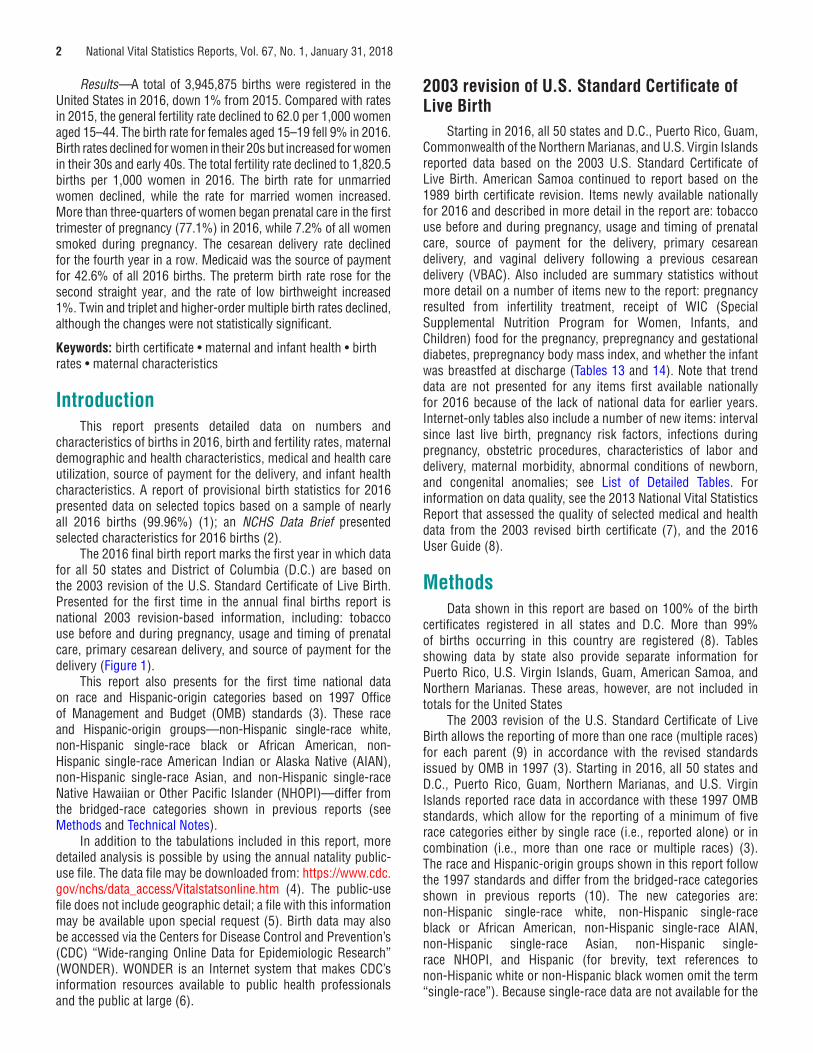
The 2016 final birth report marks the first year in which data for all 50 states and District of Columbia (D.C.) are based on the 2003 revision of the U.S. Standard Certificate of Live Birth. Presented for the first time in the annual final births report is national 2003 revision-based information, including: tobacco use before and during pregnancy, usage and timing of prenatal care, primary cesarean delivery, and source of payment for the delivery (Figure 1).
This report also presents for the first time national data on race and Hispanic-origin categories based on 1997 Office of Management and Budget (OMB) standards (3). These race and Hispanic-origin groups—non-Hispanic single-race white,non-Hispanic single-race black or African American, non-Hispanic single-race American Indian or Alaska Native (AIAN), non-Hispanic single-race Asian, and non-Hispanic single-race Native Hawaiian or Other Pacific Islander (NHOPI)—differ from the bridged-race categories shown in previous reports (see Methods and Technical Notes).
In addition to the tabulations included in this report, more detailed analysis is possible by using the annual natality public-use file. The data file may be downloaded from: https://www.cdc.gov/nchs/data_access/Vitalstatsonline.htm (4). The public-use file does not include geographic detail; a file with this information may be available upon special request (5). Birth data may also be accessed via the Centers for Disease Control and Prevention’s (CDC) “Wide-ranging Online Data for Epidemiologic Research” (WONDER). WONDER is an Internet system that makes CDC’s information resources available to public health professionals and the public at large (6).
2003 revision of U.S. Standard Certificate of Live Birth
Starting in 2016, all 50 states and D.C., Puerto Rico, Guam, Commonwealth of the Northern Marianas, and U.S. Virgin Islands reported data based on the 2003 U.S. Standard Certificate of Live Birth. American Samoa continued to report based on the 1989 birth certificate revision. Items newly available nationally for 2016 and described in more detail in the report are: tobacco use before and during pregnancy, usage and timing of prenatal care, source of payment for the delivery, primary cesarean delivery, and vaginal delivery following a previous cesarean delivery (VBAC). Also included are summary statistics without more detail on a number of items new to the report: pregnancy resulted from infertility treatment, receipt of WIC (Special Supplemental Nutrition Program for Women, Infants, and Children) food for the pregnancy, prepregnancy and gestational diabetes, prepregnancy body mass index, and whether the infant was breastfed at discharge (Tables 13 and 14). Note that trend data are not presented for any items first available nationally for 2016 because of the lack of national data for earlier years. Internet-only tables also include a number of new items: interval since last live birth, pregnancy risk factors, infections during pregnancy, obstetric procedures, characteristics of labor and delivery, maternal morbidity, abnormal conditions of newborn, and congenital anomalies; see List of Detailed Tables. For information on data quality, see the 2013 National Vital Statistics Report that assessed the quality of selected medical and health data from the 2003 revised birth certificate (7), and the 2016 User Guide (8).
MethodsData shown in this report are based on 100% of the birth
certificates registered in all states and D.C. More than 99% of births occurring in this country are registered (8). Tables showing data by state also provide separate information for Puerto Rico, U.S. Virgin Islands, Guam, American Samoa, and Northern Marianas. These areas, however, are not included in totals for the United States
The 2003 revision of the U.S. Standard Certificate of Live Birth allows the reporting of more than one race (multiple races) for each parent (9) in accordance with the revised standards issued by OMB in 1997 (3). Starting in 2016, all 50 states and D.C., Puerto Rico, Guam, Northern Marianas, and U.S. Virgin Islands reported race data in accordance with these 1997 OMB standards, which allow for the reporting of a minimum of five race categories either by single race (i.e., reported alone) or in combination (i.e., more than one race or multiple races) (3). The race and Hispanic-origin groups shown in this report follow the 1997 standards and differ from the bridged-race categories shown in previous reports (10). The new categories are: non-Hispanic single-race white, non-Hispanic single-race black or African American, non-Hispanic single-race AIAN, non-Hispanic single-race Asian, non-Hispanic single-race NHOPI, and Hispanic (for brevity, text references tonon-Hispanic white or non-Hispanic black women omit the term “single-race”). Because single-race data are not available for the
2 National Vital Statistics Reports, Vol. 67, No. 1, January 31, 2018
National Vital Statistics Reports, Vol. 67, No. 1, January 31, 2018 3
entire United States in 2015, comparisons between 2016 and 2015 by race are not made in this report; the Table in Technical Notes shows a comparison of bridged- and single-race statistics for selected measures for 2016. Internet tables I–26 through I–35 present 2010–2016 data for bridged-race categories for selected demographic and health items (e.g., fertility rates, births to unmarried women, and preterm birth rates). For further information on differences between single- and bridged-race groups, see Technical Notes and Table.
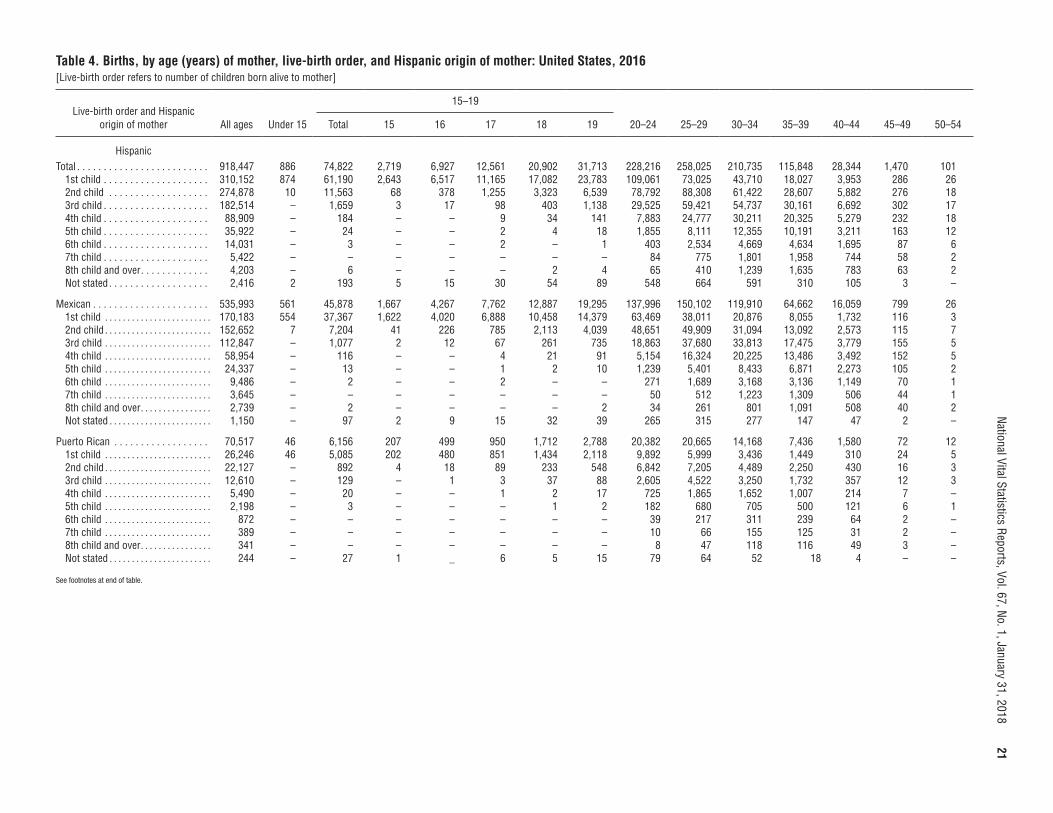
Race and Hispanic origin are reported independently on the birth certificate. Most tables in this report show data for the categories of non-Hispanic single-race white, non-Hispanic single-race black, and Hispanic. Selected tables also include data for the categories non-Hispanic single-race AIAN, non-Hispanic single-race Asian, and non-Hispanic single-race NHOPI. Data are also presented in some tables for specific Hispanic groups: Mexican, Puerto Rican, Cuban, Central and South American, and other and unknown Hispanic.
Trend tables included in the detailed tables for this report include the years 2010–2016 (see List of Detailed Tables). Longer-term trends previously shown in this report series can be found in earlier-year reports (e.g., “Births: Final Data for 2015”) (10).
In this report, the total number of births includes births to women up to age 64. In tables that include age of mother, the oldest age groups shown (40–54, 45–49, 45–54, or 50–54)
include births to mothers up to age 64 (births to mothers aged 55–64 are recategorized to age group 50–55).
For information on levels of incomplete reporting by state, see the User Guide (8). For information on the measurement of data items shown in this report and the Internet tables, imputation techniques used, computation of derived statistics, and definition of terms, see the User Guide (8).
Demographic Characteristics (Tables 1–12)
Births and birth ratesNumber of births
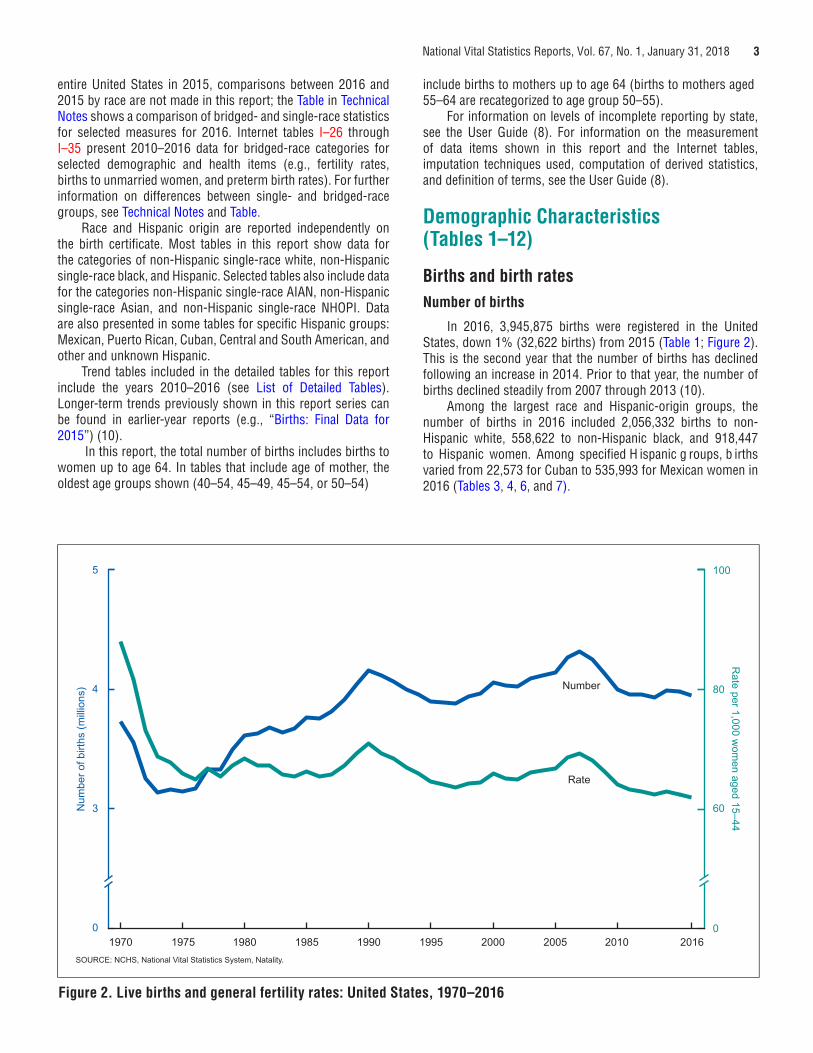
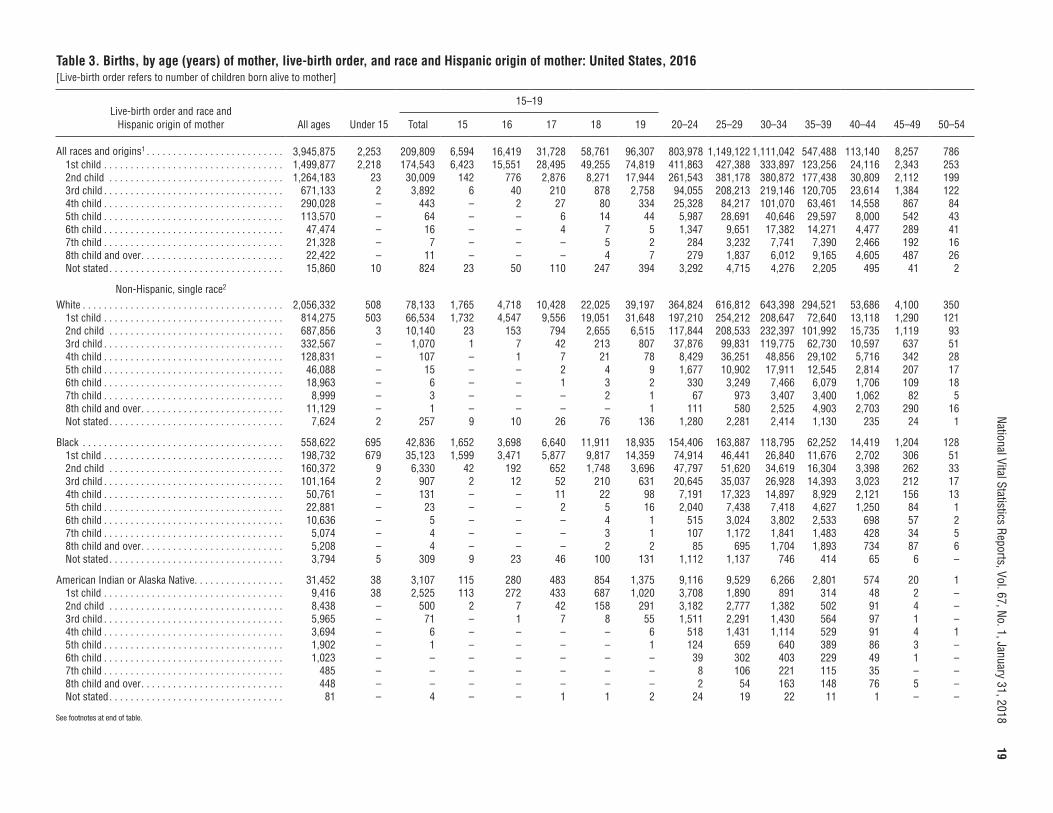
In 2016, 3,945,875 births were registered in the United States, down 1% (32,622 births) from 2015 (Table 1; Figure 2). This is the second year that the number of births has declined following an increase in 2014. Prior to that year, the number of births declined steadily from 2007 through 2013 (10).
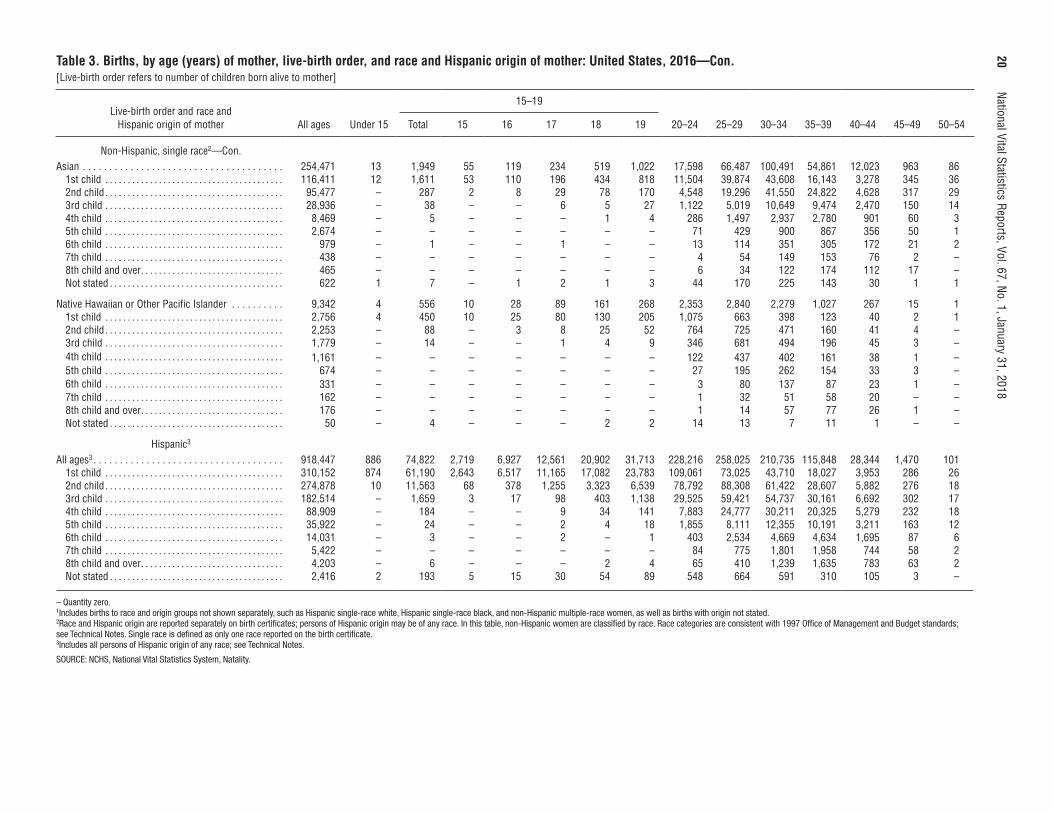
Among the largest race and Hispanic-origin groups, the number of births in 2016 included 2,056,332 births to non-Hispanic white, 558,622 to non-Hispanic black, and 918,447 to Hispanic women. Among specified H ispanic g roups, b irths varied from 22,573 for Cuban to 535,993 for Mexican women in 2016 (Tables 3, 4, 6, and 7).
Figure 2. Live births and general fertility rates: United States, 1970–2016
SOURCE: NCHS, National Vital Statistics System, Natality.
0
3
4
5
2010 201620052000199519901985198019751970
Num
ber o
f birt
hs (m
illion
s) Number
0
60
80
100
Rate per 1,000 w
omen aged 15–44
Rate
4 National Vital Statistics Reports, Vol. 67, No. 1, January 31, 2018
Fertility rate
The general fertility rate (GFR) for the United States in 2016 was 62.0 births per 1,000 women aged 15–44, down 1% from 2015 (62.5) and a record low rate for the nation (Table 1) (10,11). This is the second year that the rate has declined following an increase in 2014. From 2007 to 2013, GFR declined steadily.
Among the race and Hispanic-origin groups, GFR in 2016 ranged from 58.8 for non-Hispanic white women to 72.9 for non-Hispanic NHOPI women. For the remaining two largest race and Hispanic-origin groups, the rates were 63.3 for non-Hispanic black and 70.6 for Hispanic women.
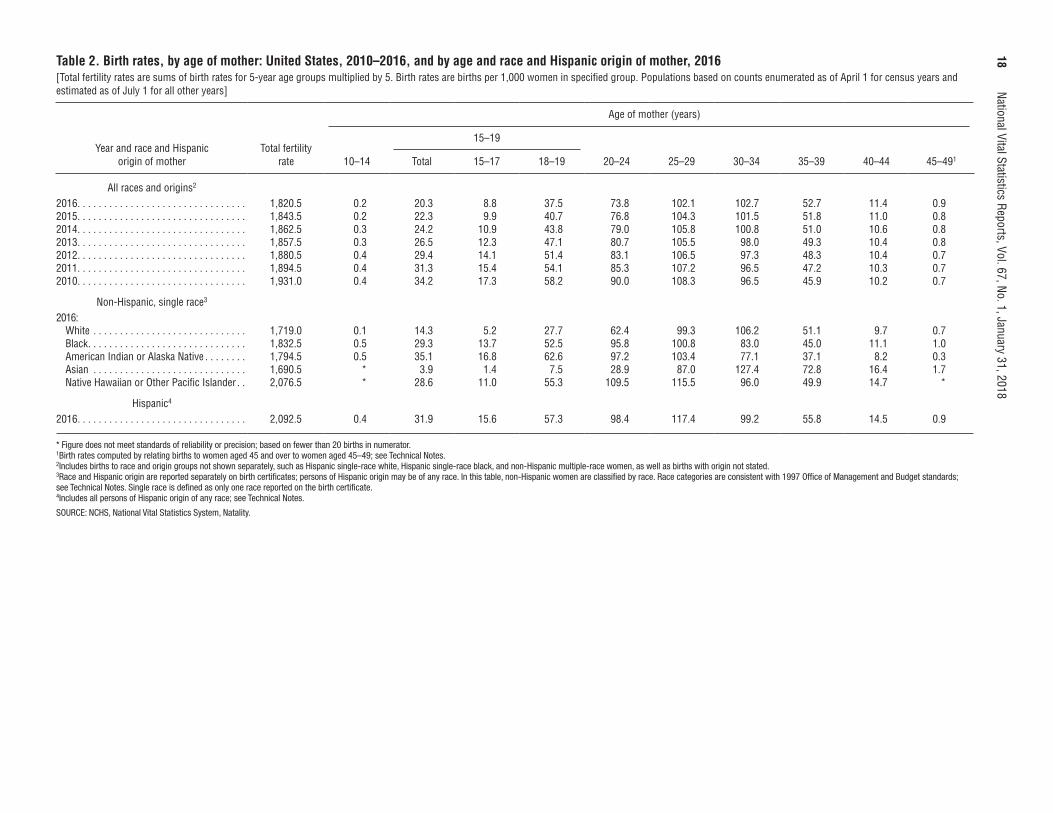
Age of motherBirth rates decreased for females aged 15–29, increased for
those aged 30–49, and were unchanged for those aged 10–14 in 2016 from 2015.
Teenagers—The birth rate for women aged 15–19 in the United States in 2016 was 20.3 births per 1,000 women, down 9% from 2015 (22.3) and another record low (Table 2) (11–13). Since 2009, the teen birth rate has fallen to a new low each year. The rate for this group has declined 51% (or an average of 8% per year) since 2007, which was the most recent high at 41.5, and 67% (or an average of 4% per year) since the 1991 high (61.8). The number of births to teenagers aged 15–19 was 209,809 in 2016, also down 9% from 229,715 in 2015 (10).
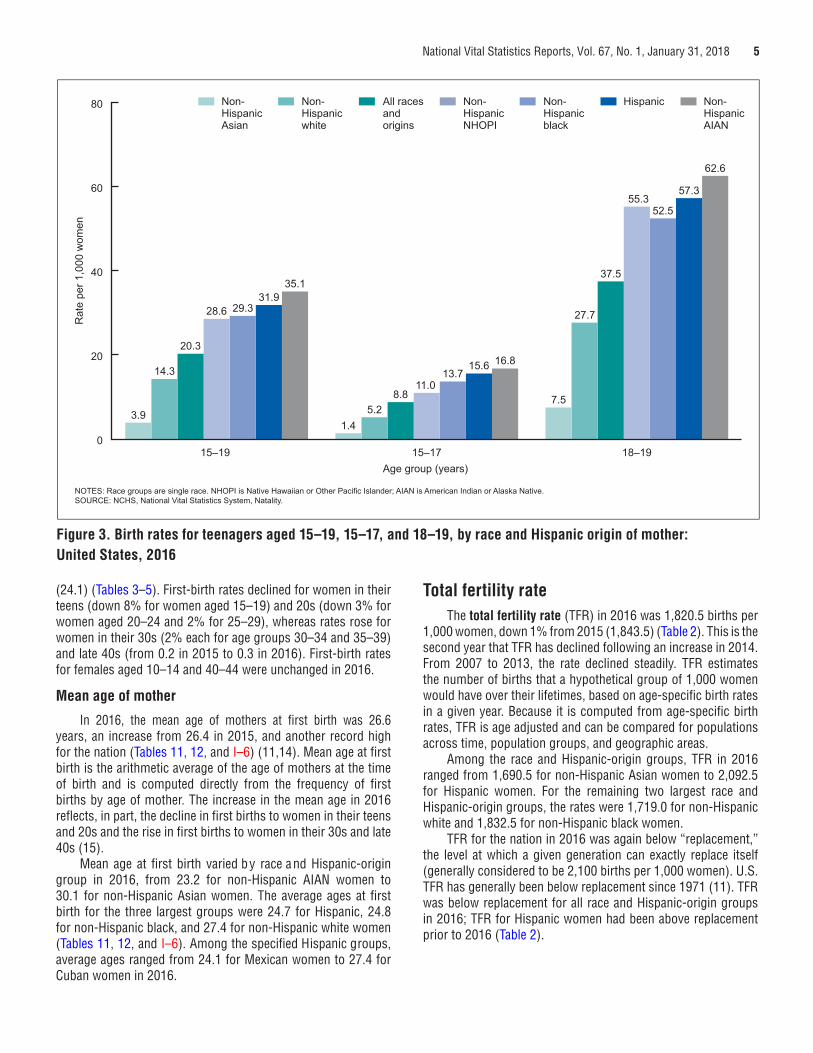
The 2016 birth rates for teenagers aged 15–17 and 18–19 were 8.8 and 37.5 births per 1,000 women, respectively, down 11% and 8% from 2015 to record lows for both groups. Rates for these age groups have fallen 59% and 48%, respectively, since 2007, and by 77% and 60% since 1991 (Table A). The birth rate for females aged 10–14 was unchanged in 2016 at 0.2 births per 1,000 females.
Among race and Hispanic-origin groups, the rates for teenagers aged 15–19 ranged from 3.9 for non-Hispanic Asian teenagers to 35.1 for non-Hispanic AIAN teenagers (Figure 3). Rates for other groups were 14.2 for non-Hispanic white, 29.3 for non-Hispanic black, and 31.9 for Hispanic teenagers.
Women in their 20s—The birth rate for women aged 20–24 was 73.8 births per 1,000 women in 2016, down 4% from 2015 (76.8), and another record low for this age group (Table 2). The rate for women in this age group has declined steadily since
2006. The number of births to women in their early 20s declined 5% from 2015 (10). The rate for women aged 25–29 was 102.1 births per 1,000 women, down 2% from 2015 (104.3). The rate for women in this age group has declined for all but 1 year since 2007. The number of births to women in their late 20s was down by less than 1% in 2016 (0.3%) from 2015 (Tables 3 and 4) (10).
Women in their 30s—The birth rate for women aged 30–34 was 102.7 births per 1,000 women in 2016, up 1% from 2015 (101.5) to the highest rate for this group since 1964 (11). The 2016 rate for women aged 30–34 was higher than the rate for women aged 25–29 for the first year since reliable national records were available (1940) (10,11). The number of births to women aged 30–34 rose 1% from 2015 to 2016. The birth rate for women aged 35–39 was 52.7 births per 1,000 women in 2016, up 2% from 2015 (51.8) to the highest rate for this group since 1962 (11). The number of births to women aged 35–39 increased 4% in 2016 (Tables 3 and 4) (10).
Women in their 40s—The birth rate for women aged 40–44 was 11.4 births per 1,000 women in 2016, up 4% from 2015 (11.0) (Table 2) to the highest rate for this group since 1966 (11). The number of births to women in their early 40s increased 1% from 2015 to 2016. The birth rate for women aged 45–49 (which includes births to women aged 50 and over) was 0.9 births per 1,000 women in 2016, up from 0.8 in 2015. The number of births to women aged 45 and over was essentially unchanged from 2015 to 2016.
Women aged 50 and over—A total of 786 births in 2016 were to women aged 50 and over, essentially unchanged from 2015 (754) (Table 3) (10). The number of births to women in this age group has generally increased since 1997 (144), when data for women aged 50 and over became available again. The birth rate for women aged 50–54 was 0.7 births per 10,000 women in 2016, unchanged from 2015. Because of the small number of births to women in this age group, the birth rate for women aged 50–54 is expressed per 10,000 women. For rates shown elsewhere in this report, births to women aged 50 and over are included with births to women aged 45–49 when computing birth rates by age of mother (the denominator for the rate is women aged 45–49).
Live-birth orderThe first-birth rate for the United States was 23.7 births
per 1,000 women aged 15–44 in 2016, down 2% from 2015
Table A. Birth rates for females aged 10–19 years, by age of mother: United States, 1991, 2007, 2015, and 2016[Rates per 1,000 women in specified age group. Population based on counts estimated as of July 1 for all years]
Age of mother (years)
Year Percent change
2016 2015 2007 1991 2015–2016 2007–2016 1991–2016
10–14 . . . . . . . . . . . . . . . . . . . . . . . . . . . . . . . . . 0.2 0.2 0.6 1.4 † –67 –8615–19 . . . . . . . . . . . . . . . . . . . . . . . . . . . . . . . . . 20.3 22.3 41.5 61.8 –9 –51 –67
15–17 . . . . . . . . . . . . . . . . . . . . . . . . . . . . . . 8.8 9.9 21.7 38.6 –11 –59 –7718–19 . . . . . . . . . . . . . . . . . . . . . . . . . . . . . . 37.5 40.7 71.7 94.0 –8 –48 –60
†Difference not statistically significant at p = 0.05.
NOTE: Comparisons are made with 2007 and 1991 data because these years represent recent and longer-term highs in teen birth rates.
SOURCE: NCHS, National Vital Statistics System, Natality.
National Vital Statistics Reports, Vol. 67, No. 1, January 31, 2018 5
(24.1) (Tables 3–5). First-birth rates declined for women in their teens (down 8% for women aged 15–19) and 20s (down 3% for women aged 20–24 and 2% for 25–29), whereas rates rose for women in their 30s (2% each for age groups 30–34 and 35–39) and late 40s (from 0.2 in 2015 to 0.3 in 2016). First-birth rates for females aged 10–14 and 40–44 were unchanged in 2016.
Mean age of mother
In 2016, the mean age of mothers at first birth was 26.6 years, an increase from 26.4 in 2015, and another record high for the nation (Tables 11, 12, and I–6) (11,14). Mean age at first birth is the arithmetic average of the age of mothers at the time of birth and is computed directly from the frequency of first births by age of mother. The increase in the mean age in 2016 reflects, in part, the decline in first births to women in their teens and 20s and the rise in first births to women in their 30s and late 40s (15).
Total fertility rateThe total fertility rate (TFR) in 2016 was 1,820.5 births per
1,000 women, down 1% from 2015 (1,843.5) (Table 2). This is the second year that TFR has declined following an increase in 2014. From 2007 to 2013, the rate declined steadily. TFR estimates the number of births that a hypothetical group of 1,000 women would have over their lifetimes, based on age-specific birth rates in a given year. Because it is computed from age-specific birth rates, TFR is age adjusted and can be compared for populations across time, population groups, and geographic areas.
Among the race and Hispanic-origin groups, TFR in 2016 ranged from 1,690.5 for non-Hispanic Asian women to 2,092.5 for Hispanic women. For the remaining two largest race and Hispanic-origin groups, the rates were 1,719.0 for non-Hispanic white and 1,832.5 for non-Hispanic black women.
TFR for the nation in 2016 was again below “replacement,” the level at which a given generation can exactly replace itself (generally considered to be 2,100 births per 1,000 women). U.S. TFR has generally been below replacement since 1971 (11). TFR was below replacement for all race and Hispanic-origin groups in 2016; TFR for Hispanic women had been above replacement prior to 2016 (Table 2).
Figure 3. Birth rates for teenagers aged 15–19, 15–17, and 18–19, by race and Hispanic origin of mother: United States, 2016
Rat
e pe
r 1,0
00 w
omen
Age group (years)
NOTES: Race groups are single race. NHOPI is Native Hawaiian or Other Pacific Islander; AIAN is American Indian or Alaska Native.SOURCE: NCHS, National Vital Statistics System, Natality.
0
20
40
60
80 Non-HispanicAIAN
18–1915–1715–19
HispanicNon-Hispanicblack
Non-HispanicNHOPI
All racesandorigins
Non-Hispanicwhite
Non-HispanicAsian
3.9
14.3
20.3
28.6 29.331.9
35.1
1.45.2
8.811.0
13.715.6 16.8
7.5
27.7
37.5
55.352.5
57.3
62.6
Mean age at first birth varied by race and Hispanic-origin group in 2016, from 23.2 for non-Hispanic AIAN women to 30.1 for non-Hispanic Asian women. The average ages at first birth for the three largest groups were 24.7 for Hispanic, 24.8 for non-Hispanic black, and 27.4 for non-Hispanic white women (Tables 11, 12, and I–6). Among the specified Hispanic groups, average ages ranged from 24.1 for Mexican women to 27.4 for Cuban women in 2016.
6 National Vital Statistics Reports, Vol. 67, No. 1, January 31, 2018
Births and birth rates by stateThe general fertility rate or GFR—the number of births
per 1,000 women aged 15–44—declined from 2015 to 2016 by less than 1% to 4% in 18 states (Arizona, Arkansas, California, Colorado, Georgia, Idaho, Illinois, Kansas, Louisiana, Montana, New Mexico, Oregon, South Carolina, Tennessee, Texas, Utah, West Virginia, and Wyoming), was essentially unchanged in 31 states and D.C., and rose in 1 state (by 2% in Connecticut). Rates among the states ranged from 50.3 births per 1,000 women aged 15–44 in Vermont, to 77.7 in South Dakota (Table 8). Among U.S. territories, GFR declined in Puerto Rico (by 7%) and U.S. Virgin Islands (by 14%), was essentially unchanged in Guam and American Samoa, and rose for Northern Marianas. For the number of births by state in 2016, see Tables 6 and 7.
Birth rates for teenagers by stateIn 2016, the birth rate for teenagers aged 15–19 declined in
40 states from 2015, with declines ranging from 4% for Oklahoma to 15% for New Hampshire. Rates were essentially unchanged in the remaining 10 states (Connecticut, Delaware, Hawaii, Maine, Montana, North Dakota, Rhode Island, South Dakota, Vermont, and Wyoming) and D.C. Rates among the states ranged from 8.5 births per 1,000 teenagers aged 15–19 in Massachusetts to 34.6 in Arkansas (Table 8). The wide range in state-specific teen rates is consistent with patterns observed in previous analyses (13,16). Teen birth rates declined in Puerto Rico (by 13%) and U.S. Virgin Islands (by 35%), and were essentially unchanged for Guam, American Samoa, and Northern Marianas. Rates among U.S. territories ranged from 25.4 births per 1,000 teenagers aged 15–19 in U.S. Virgin Islands to 40.8 in American Samoa (Table 8).
Births to unmarried womenThe birth rate for unmarried women was 42.4 births per
1,000 unmarried women aged 15–44 in 2016, down 2% from 2015 (43.4), (Tables 10 and I–32). The 2016 nonmarital birth rate was 18% lower than the peak of 51.8 in 2007 and 2008 (10).
In contrast to trends among unmarried women, the birth rate for married women—which had declined 4% over the period 2005–2010—rose from 2015 to 2016 and is up 6% since 2010, the most recent low (from 84.3 per 1,000 married women aged 15–44 to 89.6).
The percentage of all births to unmarried women was 39.8% in 2016, a 1% decline from the 2015 percentage of 40.3% and the lowest level since 2007 (10). The percentage of all births to unmarried women peaked in 2009 at 41.0% (10). In 2016, the percentage of nonmarital births varied widely among race and Hispanic-origin groups, from 12.0% for non-Hispanic Asian mothers to 69.8% for non-Hispanic black mothers (Table 9). The number of nonmarital births decreased by less than 1% from 2015 (1,601,527) to 2016 (1,596,796).
Nonmarital birth rates declined from 2015 to 2016 for women in age groups under 35, with the rate for teenagers aged 15–19 dropping 8% (to 18.5 per 1,000 in 2016), and the rate for females aged 15–17 at an all-time low (8.6). Conversely, rates
rose for all age groups aged 35 and over, reaching historic peaks for women aged 35–39 (35.6) and 40–44 (10.0).
Compositional differences by race and Hispanic origin and maternal age among states are major contributing factors to the geographic variation in the percentage of births to unmarried mothers (Table I–7). The percentages ranged from less than one in five births in Utah (18.6%) to more than one-half of births in Louisiana, Mississippi, and New Mexico.
Tobacco Use Before and During Pregnancy (Tables 13–15)
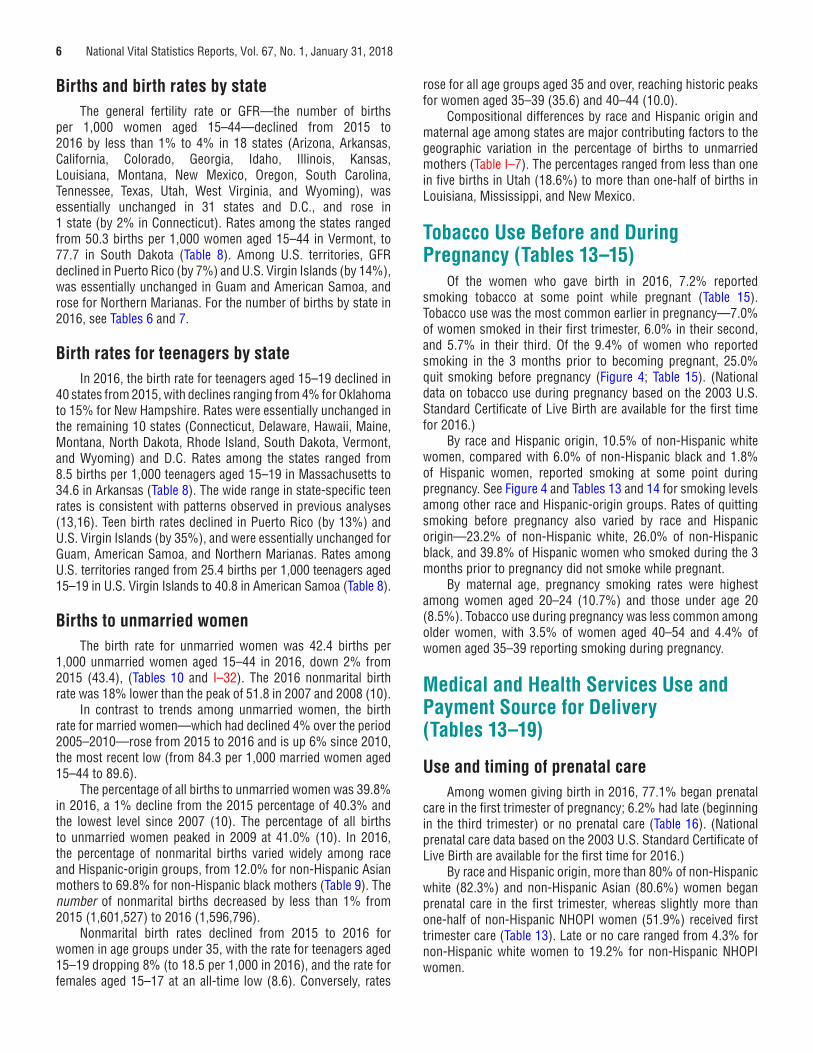
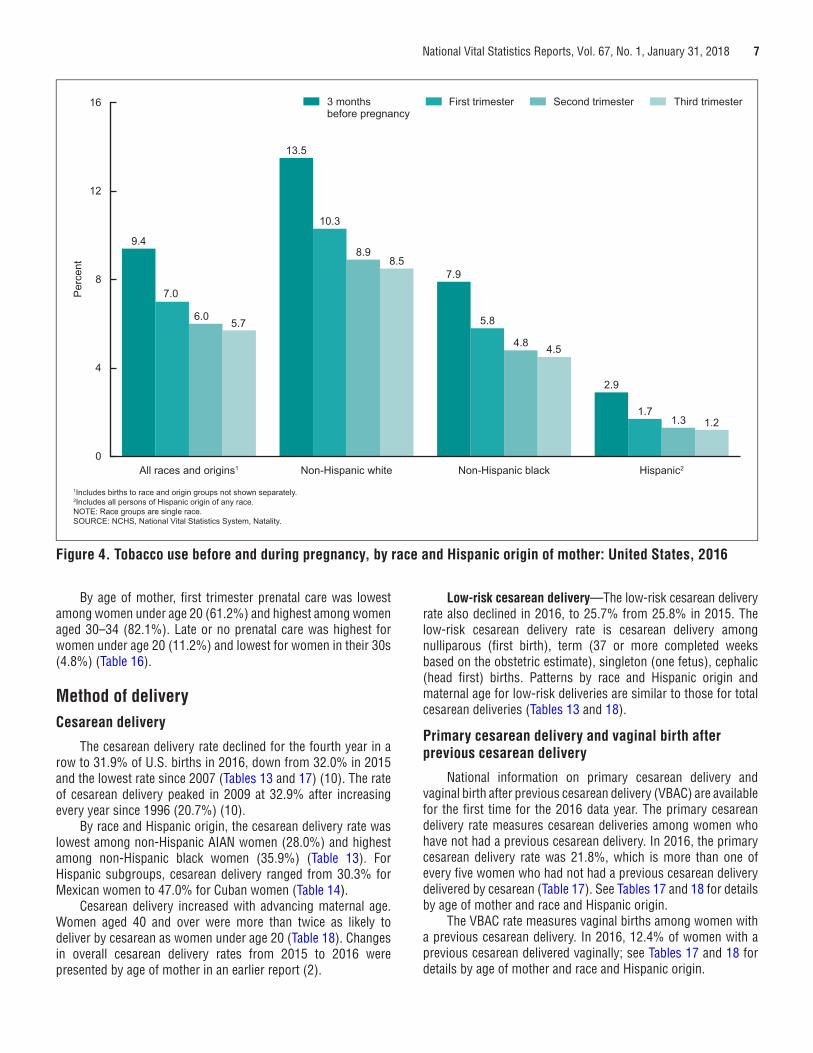
Of the women who gave birth in 2016, 7.2% reported smoking tobacco at some point while pregnant (Table 15). Tobacco use was the most common earlier in pregnancy—7.0% of women smoked in their first trimester, 6.0% in their second, and 5.7% in their third. Of the 9.4% of women who reported smoking in the 3 months prior to becoming pregnant, 25.0% quit smoking before pregnancy (Figure 4; Table 15). (National data on tobacco use during pregnancy based on the 2003 U.S. Standard Certificate of Live Birth are available for the first time for 2016.)
By race and Hispanic origin, 10.5% of non-Hispanic white women, compared with 6.0% of non-Hispanic black and 1.8% of Hispanic women, reported smoking at some point during pregnancy. See Figure 4 and Tables 13 and 14 for smoking levels among other race and Hispanic-origin groups. Rates of quitting smoking before pregnancy also varied by race and Hispanic origin—23.2% of non-Hispanic white, 26.0% of non-Hispanic black, and 39.8% of Hispanic women who smoked during the 3 months prior to pregnancy did not smoke while pregnant.
By maternal age, pregnancy smoking rates were highest among women aged 20–24 (10.7%) and those under age 20 (8.5%). Tobacco use during pregnancy was less common among older women, with 3.5% of women aged 40–54 and 4.4% of women aged 35–39 reporting smoking during pregnancy.
Medical and Health Services Use and Payment Source for Delivery (Tables 13–19)
Use and timing of prenatal careAmong women giving birth in 2016, 77.1% began prenatal
care in the first trimester of pregnancy; 6.2% had late (beginning in the third trimester) or no prenatal care (Table 16). (National prenatal care data based on the 2003 U.S. Standard Certificate of Live Birth are available for the first time for 2016.)
By race and Hispanic origin, more than 80% of non-Hispanic white (82.3%) and non-Hispanic Asian (80.6%) women began prenatal care in the first trimester, whereas slightly more than one-half of non-Hispanic NHOPI women (51.9%) received first trimester care (Table 13). Late or no care ranged from 4.3% for non-Hispanic white women to 19.2% for non-Hispanic NHOPI women.
National Vital Statistics Reports, Vol. 67, No. 1, January 31, 2018 7
By age of mother, first trimester prenatal care was lowest among women under age 20 (61.2%) and highest among women aged 30–34 (82.1%). Late or no prenatal care was highest for women under age 20 (11.2%) and lowest for women in their 30s (4.8%) (T
Method of deliveryCesarean delivery
The cesarean delivery rate declined for the fourth year in a row to 31.9% of U.S. births in 2016, down from 32.0% in 2015 and the lowest rate since 2007 (Tables 13 and 17) (10). The rate of cesarean delivery peaked in 2009 at 32.9% after increasing every year since 1996 (20.7%) (10).
By race and Hispanic origin, the cesarean delivery rate was lowest among non-Hispanic AIAN women (28.0%) and highest among non-Hispanic black women (35.9%) (Table 13). For Hispanic subgroups, cesarean delivery ranged from 30.3% for Mexican women to 47.0% for Cuban women (Table 14).
Cesarean delivery increased with advancing maternal age. Women aged 40 and over were more than twice as likely to deliver by cesarean as women under age 20 (Table 18). Changes in overall cesarean delivery rates from 2015 to 2016 were presented by age of mother in an earlier report (2).
Low-risk cesarean delivery—The low-risk cesarean delivery rate also declined in 2016, to 25.7% from 25.8% in 2015. The low-risk cesarean delivery rate is cesarean delivery among nulliparous (first birth), term (37 or more completed weeks based on the obstetric estimate), singleton (one fetus), cephalic (head first) births. Patterns by race and Hispanic origin and maternal age for low-risk deliveries are similar to those for total cesarean deliveries (Tables 13 and 18).
Primary cesarean delivery and vaginal birth after previous cesarean delivery
National information on primary cesarean delivery and vaginal birth after previous cesarean delivery (VBAC) are available for the first time for the 2016 data year. The primary cesarean delivery rate measures cesarean deliveries among women who have not had a previous cesarean delivery. In 2016, the primary cesarean delivery rate was 21.8%, which is more than one of every five women who had not had a previous cesarean delivery delivered by cesarean (Table 17). See Tables 17 and 18 for details by age of mother and race and Hispanic origin.
The VBAC rate measures vaginal births among women with a previous cesarean delivery. In 2016, 12.4% of women with a previous cesarean delivered vaginally; see Tables 17 and 18 for details by age of mother and race and Hispanic origin.
Second trimester
Perc
ent
1Includes births to race and origin groups not shown separately. 2Includes all persons of Hispanic origin of any race.NOTE: Race groups are single race.SOURCE: NCHS, National Vital Statistics System, Natality.
0
4
8
12
16 Third trimesterFirst trimester3 monthsbefore pregnancy
Hispanic2Non-Hispanic blackNon-Hispanic whiteAll races and origins1
9.4
7.0
6.0 5.7
13.5
10.3
8.98.5
7.9
5.8
4.8 4.5
2.9
1.71.3 1.2
Figure 4. Tobacco use before and during pregnancy, by race and Hispanic origin of mother: United States, 2016
able 16).
8 National Vital Statistics Reports, Vol. 67, No. 1, January 31, 2018
Source of payment for the deliveryThe principal source of payment for the delivery of most
births in 2016 was either private insurance (49.4%) or Medicaid (42.6%). The category “self-pay,” generally considered to indicate uninsured deliveries, accounted for 4.1%. The remainder of births were covered by other insurance (3.9%), which includes Indian Health Service, CHAMPUS or TRICARE, other government (federal, state, or local), and charity (Table 19). National source of payment data based on the 2003 U.S. Standard Certificate of Live Birth are available for the first time for 2016.
Figure 1 and Tables 13 and 14 show differences in source of payment for the delivery by race and Hispanic origin. Medicaid coverage ranged from 24.9% for non-Hispanic Asian women to 66.9% for non-Hispanic AIAN women. Private insurance ranged from approximately 20% for non-Hispanic AIAN women (19.7%) to more than 60% for non-Hispanic white (63.3%) and non-Hispanic Asian (65.4%) women. Levels of self-pay ranged from slightly less than 2% for non-Hispanic AIAN women (1.9%) to 6%–7% for non-Hispanic NHOPI (6.5%), non-Hispanic Asian (6.7%), and Hispanic (7.0%) women. Non-Hispanic AIAN (11.6%) and non-Hispanic NHOPI (12.0%) women had the highest percentages of other sources of payment (including Indian Health Service) compared with 3.5% or less for non-Hispanic white, non-Hispanic black, and non-Hispanic Asian women.
By age of mother, Medicaid levels were lowest among women aged 35–39 (27.0%) and highest among women under age 20 (76.7%). Private insurance percentages were highest for women aged 35–39 (65.2%) and lowest for women under age 20 (15.9%) (Table 19).
Infant Health Characteristics (Tables 20–25)
Period of gestationThe U.S. preterm birth rate rose to 9.85% in 2016, a 2% rise
from 2015 (9.63%) and the second straight year of increase for this rate (9.57% in 2014). The preterm birth rate (percentage of all births delivered at less than 37 completed weeks of gestation)
had declined steadily from 2007 (10.44%) (10) to 2014 (Table 20). (National data based on the obstetric estimate of gestation are available only from 2007 (17); see Technical Notes.)
Most of the increase in the 2016 total preterm birth rate from 2015 was among infants born late preterm (34–36 weeks), up from 6.87% to 7.09%. Increases in late preterm birth rates for this period were seen across the age groups of under 20, 20–29, 30–39, and 40 and over (2) (see Table 21 for 2016 data for 5-year age groups). The early preterm birth rate (less than 34 weeks) was unchanged at 2.76% in 2016 but is down from 2.93% in 2007 (10,17).
Changes in the distribution of births delivered at term and later (37 weeks or more) were also observed from 2015 to 2016. The percentage of infants born early term (37–38 weeks) rose by 2% in 2016, from 24.99% to 25.47%, and the full-term birth rate declined, from 58.47% to 57.94%. From 2007 to 2014, the early-term birth rate had generally been on the decline, and the full-term rate had been on the rise (10) (Table 20). Declines were also seen from 2015 to 2016 in late-term (41 weeks) and post-term (42 weeks or more) births.
For 2016, preterm birth rates for race and Hispanic-origin groups ranged from a high of 13.77% among births to non-Hispanic black mothers to 8.63% among those to non-Hispanic Asian mothers (Table 13). Preterm levels for Hispanic subgroups ranged from 9.14% (Central and South American) to 11.05% (Puerto Rican) (Table 14).
Analyzing births in singleton deliveries separately from all births can also be important because of the shorter average gestations of multiple births and their corresponding potential influence on preterm birth rates (see “Multiple births”). The 2016 preterm birth rate for singleton births only was 8.02%, a 3% increase over 2015 (7.82%). From 2007 to 2014, the singleton preterm rate had declined from 8.59% to 7.74% (see Table B for 2016 data) (10).
Increases in preterm birth rates in 2016 from 2015 were observed in 13 states: California, Georgia, Idaho, Indiana, Kentucky, Michigan, Minnesota, Mississippi, New York, Oregon, Tennessee, Texas, and Virginia. Nonsignificant increases were reported for most other states and D.C.; no state reported a decline in its preterm birth rate for this period. See Table I–19 for 2016 data.
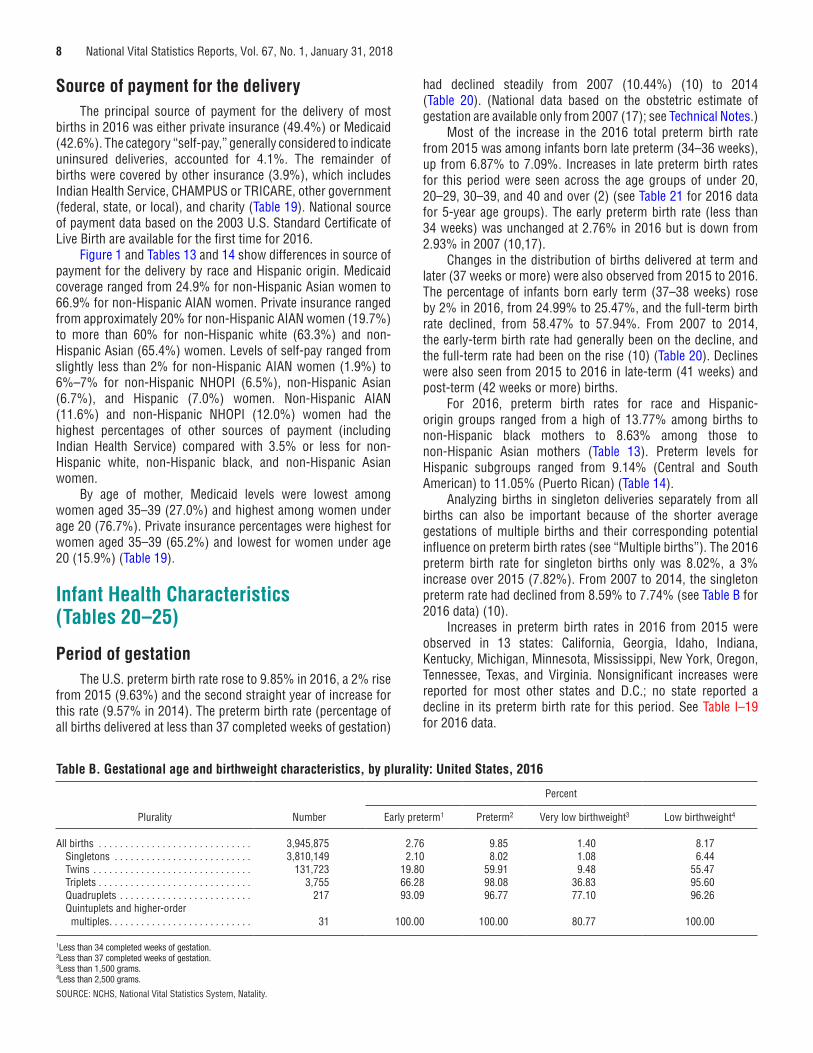
Table B. Gestational age and birthweight characteristics, by plurality: United States, 2016
Plurality Number
Percent
Early preterm1 Preterm2 Very low birthweight3 Low birthweight4
All births . . . . . . . . . . . . . . . . . . . . . . . . . . . . . 3,945,875 2.76 9.85 1.40 8.17Singletons . . . . . . . . . . . . . . . . . . . . . . . . . . 3,810,149 2.10 8.02 1.08 6.44Twins . . . . . . . . . . . . . . . . . . . . . . . . . . . . . . 131,723 19.80 59.91 9.48 55.47Triplets . . . . . . . . . . . . . . . . . . . . . . . . . . . . . 3,755 66.28 98.08 36.83 95.60Quadruplets . . . . . . . . . . . . . . . . . . . . . . . . . 217 93.09 96.77 77.10 96.26Quintuplets and higher-order multiples . . . . . . . . . . . . . . . . . . . . . . . . . . . 31 100.00 100.00 80.77 100.00
1Less than 34 completed weeks of gestation. 2Less than 37 completed weeks of gestation. 3Less than 1,500 grams. 4Less than 2,500 grams.
SOURCE: NCHS, National Vital Statistics System, Natality.
National Vital Statistics Reports, Vol. 67, No. 1, January 31, 2018 9
BirthweightThe percentage of infants born low birthweight (LBW)
rose 1% in 2016 to 8.17%, from 8.07% in 2015. This rate (the percentage of infants born at less than 2,500 grams or 5 pounds, 8 ounces) has also risen slightly from 2014 (8.00%) (Tables 22 and 23). The LBW rate has trended slowly upward since the 2012 low of 7.99%. From 1990 to 2006, LBW levels rose nearly 20%, but then declined from 2007 to 2012 (10).
The percentage of infants born very low birthweight (VLBW, less than 1,500 grams) was unchanged at 1.40% in 2016. The VLBW rate has been essentially stable at 1.40% since 2014, but is down from a high of 1.49% for 2005–2007 (10). The percentage of moderately low birthweight (1,500–2,499 grams) infants increased from 6.67% to 6.77% from 2015 to 2016, matching the peak reported for 2006 (Table 22).
LBW levels among race and Hispanic-origin groups in 2016 ranged from 6.97% for births to non-Hispanic white women to 13.68% among those to non-Hispanic black women. Rates among Hispanic subgroups ranged from 6.90% for births to Mexican women to 9.50% for births to Puerto Rican women. See Tables 13, 14, I–21, and I–22 for 2016 VLBW and LBW rates by state and race and Hispanic origin.
The LBW rate among singleton births only rose from 6.34% in 2015 to 6.44% in 2016 (10). As with LBW among all births, the increase was for infants born at moderately very low birthweight. Examining births in singleton deliveries separately can be informative because infants in multiple births tend to be born smaller than singletons, and changes in multiple-birth incidence can influence overall LBW levels; see T able B and “Multiple births.”
Multiple birthsThe 2016 twin birth rate was 33.4 twins per 1,000 births in
2016, a nonsignificant decline from the 2015 rate of 33.5. The twinning rate (births in twin deliveries per 1,000 total births) rose 76% from 1980 to 2009 (from 18.9 to 33.2 per 1,000), was generally stable for 2009–2012, and then rose for 2013 and 2014. The 2014 rate of 33.9 was the highest ever reported (Tables 24 and 25) (10).
The triplet and higher-order multiple birth rate (triplet/+) was 101.4 per 100,000 births for 2016, a nonsignificant decline from 2015 (103.6) and the lowest level reported in more than 2 decades (1992). The triplet/+ birth rate (number of triplets, quadruplets, and quintuplets and other higher-order multiples per 100,000 births) rose more than 400% from 1980 to 1998, but has fallen 48% since the 1998 peak (193.5). Rates are down over this period for all 10-year age groups of 20 and over (Tables 24 and 25) (2,10).
A total of 131,723 infants were born in twin deliveries in 2016 (Table 25). The number of triplet/+ infants born in 2016, 4,003, was the lowest number reported since 1992. In 2016, triplet/+ births included 3,755 triplets, 217 quadruplets, and 31 quintuplets and higher-order multiple births (Table B).
In 2016, twin birth rates were highest among non-Hispanic black (39.9 per 1,000) and non-Hispanic white (35.7) women, and lowest for non-Hispanic NHOPI (24.4) and Hispanic (24.6)
women. Non-Hispanic white (121.7 per 100,000) and non-Hispanic black (112.4) women were about twice as likely to have a triplet/+ birth as Hispanic (58.6) women in 2016 (Tables 13 and 14). For state-specific twin and triplet/+ rates, see Table I–23.
References1. Hamilton BE, Martin JA, Osterman MJK, Driscoll AK, Rossen LM.
Births: Provisional data for 2016. Vital Statistics Rapid Release;no 2. Hyattsville, MD: National Center for Health Statistics. 2017.Available from: https://www.cdc.gov/nchs/data/vsrr/report002.pdf.
2. Martin JA, Hamilton BE, Osterman MJK. Births in the UnitedStates, 2016. NCHS Data Brief, no 287. Hyattsville, MD: NationalCenter for Health Statistics. 2017.
3. Office of Management and Budget. Revisions to the standards forthe classification of federal data on race and ethnicity. Fed Regist62(210):58782–90. 1997.
4. National Center for Health Statistics. Vital statistics data availableonline: Natality public-use file and CD–ROM. Hyattsville, MD:National Center for Health Statistics. Published annually. Availablefrom: https://www.cdc.gov/nchs/data_access/VitalStatsOnline.htm.
5. National Center for Health Statistics. National Vital StatisticsSystem: NCHS data release and access policy for micro-data andcompressed vital statistics files. Available from: https://www.cdc.gov/nchs/nvss/dvs_data_release.htm.
6. CDC. CDC WONDER: Natality information, live births. Availablefrom: https://wonder.cdc.gov/Natality.html.
7. Martin JA, Wilson EC, Osterman MJK, Saadi EW, Sutton SR,Hamilton BE. Assessing the quality of medical and health datafrom the 2003 birth certificate revision: Results from two states.National Vital Statistics Reports; vol 62 no 2. Hyattsville, MD:National Center for Health Statistics. 2013.
8. National Center for Health Statistics. User guide to the 2016natality public use file. Hyattsville, MD. Available from:https://www.cdc.gov/nchs/data_access/Vitalstatsonline.htm.
9. National Center for Health Statistics. 2003 revisions of the U.S.Standard Certificates of Live Birth and Death and fetal deathreport. Available from: https://www.cdc.gov/nchs/nvss/vital_certificate_revisions.htm.
10. Martin JA, Hamilton BE, Osterman MJK, Driscoll AK, Mathews TJ.Births: Final data for 2015. National Vital Statistics Reports; vol 66 no1. Hyattsville, MD: National Center for Health Statistics. 2017. Available from: https://www.cdc.gov/nchs/data/nvsr/nvsr66/nvsr66_01.pdf.
11. National Center for Health Statistics. Vital statistics of the UnitedStates, 2003, volume I, natality. Available from: https://www.cdc.gov/nchs/products/vsus/vsus_1980_2003.htm.
12. Hamilton BE, Mathews TJ. Continued declines in teen births inthe United States, 2015. NCHS Data Brief, no 259. Hyattsville,MD: National Center for Health Statistics. 2016. Available from:https://www.cdc.gov/nchs/data/databriefs/db259.pdf.
13. Ventura SJ, Hamilton BE, Mathews TJ. National and state patternsof teen births in the United States, 1940–2013. National VitalStatistics Reports; vol 63 no 4. Hyattsville, MD: National Centerfor Health Statistics. 2014. Available from: https://www.cdc.gov/nchs/data/nvsr/nvsr63/nvsr63_04.pdf.
14. Mathews TJ, Hamilton BE. Delayed childbearing: More womenare having their first child later in life. NCHS Data Brief, no 21.Hyattsville, MD: National Center for Health Statistics. 2009.
15. Mathews TJ, Hamilton BE. Mean age of mothers is on the rise:United States, 2000–2014. NCHS Data Brief, no 232. Hyattsville,MD: National Center for Health Statistics. 2016. Available from:https://www.cdc.gov/nchs/data/databriefs/db232.pdf.
10 National Vital Statistics Reports, Vol. 67, No. 1, January 31, 2018
16. Hamilton BE, Rossen LM, Branum AM. Teen birth rates for urban and rural areas in the United States, 2007–2015. NCHS Data Brief, no 264. Hyattsville, MD: National Center for Health Statistics. 2016. Available from: https://www.cdc.gov/nchs/data/databriefs/db264.pdf.
17. Martin JA, Osterman MJK, Kirmeyer SE, Gregory ECW. Measuring gestational age in vital statistics data: Transitioning to the obstetric estimate. National Vital Statistics Reports; vol 64 no 5. Hyattsville, MD: National Center for Health Statistics. 2015.
18. National Center for Health Statistics. Report of the Panel to Evaluate the U.S. Standard Certificates. 2000.
19. Ramirez RR, Ennis SR. Item nonresponse, allocation, and data editing of the question on Hispanic origin in the American Community Survey (ACS): 2000 to 2007. U.S. Census Bureau: Population Division Working Paper No. 86. 2010.
20. Office of Management and Budget. Race and ethnic standards for federal statistics and administrative reporting. Statistical Policy Directive No. 15. 1977.
21. U.S. Census Bureau. 2016 population estimates. Annual estimates of the resident population by sex, single year of age, race, and Hispanic origin for the United States: April 1, 2010 to July 1, 2016. Available from: https://factfinder.census.gov/bkmk/table/1.0/en/PEP/2016/PEPALL6N.
22. National Center for Health Statistics. Vintage 2016 postcensal estimates of the resident population of the United States (April 1, 2010, July 1, 2010–July 1, 2016), by year, county, single-year of age (0, 1, 2, .., 85 years and over), bridged race, Hispanic origin, and sex. Prepared under a collaborative arrangement with the U.S. Census Bureau. Available from: https://www.cdc.gov/nchs/nvss/bridged_race.htm as of June 26, 2017, following release by U.S. Census Bureau of unbridged Vintage 2016 postcensal estimates by 5-year age group on June 22, 2017, and from: https://www.cdc.gov/nchs/nvss/bridged_race/data_documentation.htm#vintage2016.
23. U.S. Census Bureau. International data base. Population by single years of age and sex, 2016. 2017. Available from: https://www.census.gov/data-tools/demo/idb/informationGateway.php.
24. U.S. Census Bureau. 2016 population estimates. Annual estimates of the resident population by single year of age and sex for the United States, states, and Puerto Rico Commonwealth: April 1, 2010 to July 1, 2016. 2017. Available from: https://factfinder.census.gov/bkmk/table/1.0/en/PEP/2016/PEPSYASEX/0400000US72.
25. U.S. Census Bureau. The Data Web: DataFerrett. Current Population Survey. 2015 March Annual Social and Economic Supplement. 2016. Available from: https://dataferrett.census.gov/.
26. U.S. Census Bureau. The Data Web: DataFerrett. Current Population Survey. 2016 March Annual Social and Economic Supplement. 2017. Available from: https://dataferrett.census.gov/.
27. U.S. Census Bureau. The Data Web: DataFerrett. Current Population Survey. 2017 March Annual Social and Economic Supplement. 2017. Available from: https://dataferrett.census.gov/.
28. Ventura SJ, Bachrach CA. Nonmarital childbearing in the United States, 1940–99. National Vital Statistics Reports; vol 48 no 16. Hyattsville, MD: National Center for Health Statistics. 2000.
29. U.S. Census Bureau. American Community Survey (ACS), 2016 1-year estimates (st31001_2016_010_flags), by sex, age, nativity, and Hispanic origin. Population estimates for 2016 based on unpublished tabulations. 2018 [Forthcoming].
30. National Center for Health Statistics. User guide to the 2010 natality public use file. Hyattsville, MD. Available from: https://www.cdc.gov/nchs/data_access/Vitalstatsonline.htm.
31. National Center for Health Statistics. Guide to completing the facility worksheets for the certificate of live birth and report of fetal death (2003 revision). 2016 update. Available from: https://www.cdc.gov/nchs/data/dvs/GuidetoCompleteFacilityWks.pdf.
National Vital Statistics Reports, Vol. 67, No. 1, January 31, 2018 11
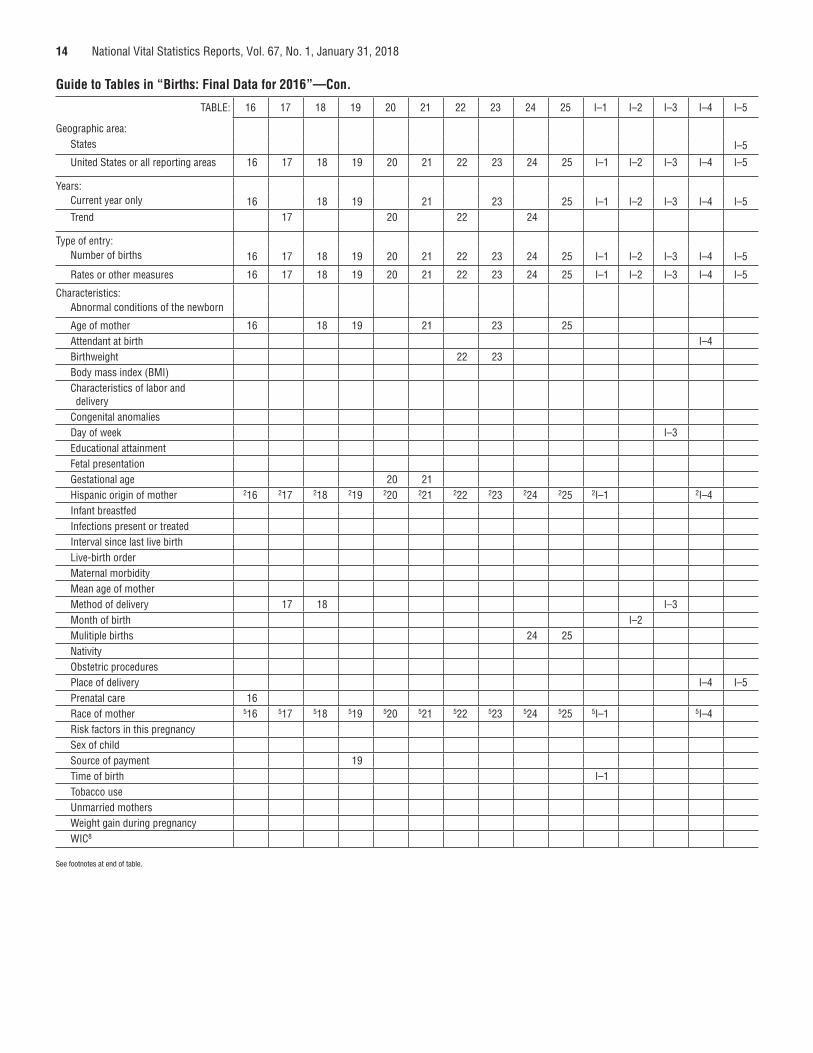
List of Detailed Tables
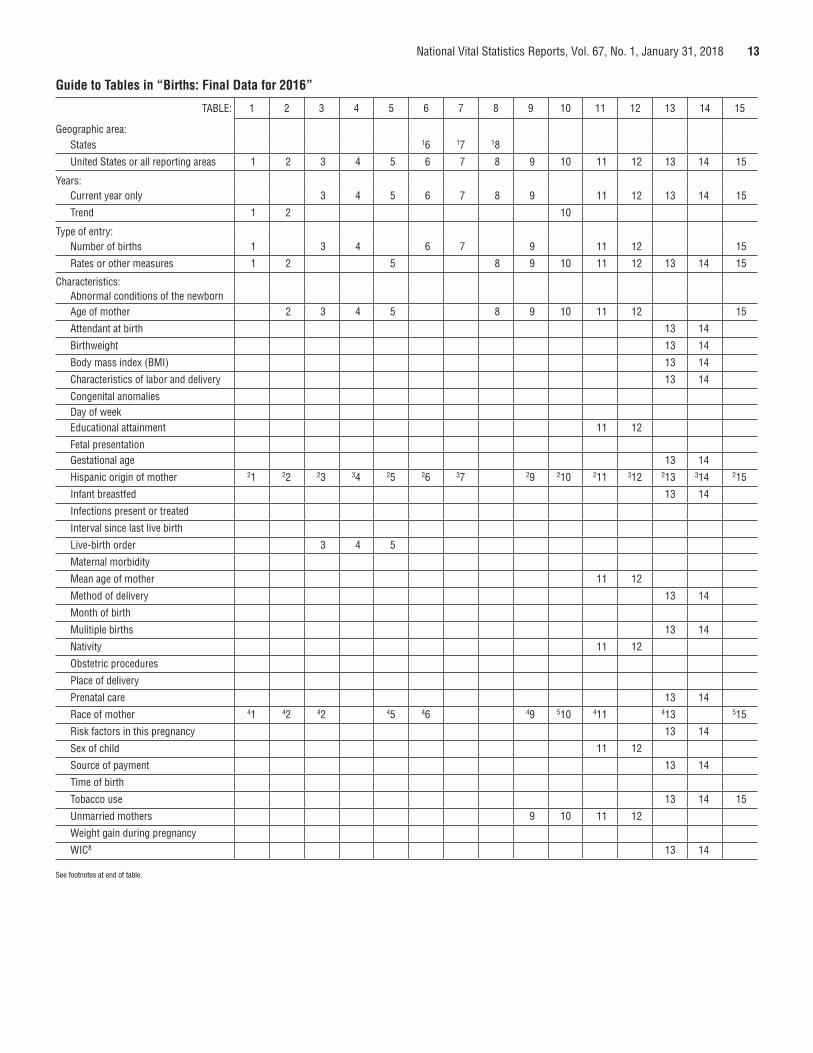
Report tablesGuide to Tables in “Births: Final Data for 2016” . . . . . . . . . . . . . . . . . 13
1. Births and birth rates: United States, 2010–2016, and by race and Hispanic origin, 2016 . . . . . . . . . . . . . . . . . . . . . . . . . . . . . 17
2. Birth rates, by age of mother: United States, 2010–2016, and by age and race and Hispanic origin of mother, 2016 . . . . . . . . . . 18
3. Births, by age (years) of mother, live-birth order, and race and Hispanic origin of mother: United States, 2016 . . . . . . . . . . . . . 19
4. Births, by age (years) of mother, live-birth order, and Hispanic origin of mother: United States, 2016 . . . . . . . . . . . . . . . . . . . . 21
5. Birth rates, by age of mother, live-birth order, and race and Hispanic origin of mother: United States, 2016 . . . . . . . . . . . . . 23
6. Births, by race and Hispanic origin of mother: United States, each state and territory, 2016 . . . . . . . . . . . . . . . . . . . . . . . . . . 25
7. Births, by Hispanic origin of mother: Untied States, each state and territory, 2016 . . . . . . . . . . . . . . . . . . . . . . . . . . . . . . . . . . 27
8. Birth rates, by age of mother: United States, each state and territory, 2016 . . . . . . . . . . . . . . . . . . . . . . . . . . . . . . . . . . . . . 29
9. Births and percentage of births to unmarried women, by age and race and Hispanic origin of mother: United States, 2016 . . 31
10. Birth rates for unmarried women: United States, 2010–2016, and by age and race and Hispanic origin of mother, 2016 . . . . . 32
11. Selected demographic characteristics of births, by race and Hispanic origin of mother: United States, 2016 . . . . . . . . . . . . . 33
12. Selected demographic characteristics of births, by Hispanic origin of mother: United States, 2016 . . . . . . . . . . . . . . . . . . . . 34
13. Selected medical and health characteristics of births, by race and Hispanic origin of mother: United States, 2016 . . . . . . . . . . 35
14. Selected medical and health characteristics of births, by Hispanic origin of mother: United States, 2016 . . . . . . . . . . . . . 36
15. Mothers who smoked for 3 months before and anytime during pregnancy and those who quit before and during pregnancy, by age (years) and race and Hispanic origin of mother: United States, 2016 . . . . . . . . . . . . . . . . . . . . . . . . . . . . . . . . . . . . . . . 37
16. Trimester prenatal care began, by age (years) and race and Hispanic origin of mother: United States, 2016 . . . . . . . . . . . . . 39
17. Births, by method of delivery: United States, 2010–2016, and by race and Hispanic origin of mother, 2016 . . . . . . . . . . . . . . . . . 40
18. Births, by method of delivery and by age and race and Hispanic origin of mother: United States, 2016 . . . . . . . . . . . . . . . . . . . . 41
19. Principal source of payment for the delivery, by age (years) and race and Hispanic origin of mother: United States, 2016 . . . . . . 42
20. Births, by gestational age (weeks): United States, 2010–2016, and by race and Hispanic origin of mother, 2016 . . . . . . . . . . . 43
21. Births, by gestational age (weeks) and by age and race and Hispanic origin of mother: United States, 2016 . . . . . . . . . . . . . 44
22. Births, by birthweight: United States, 2010–2016, and by race and Hispanic origin of mother, 2016 . . . . . . . . . . . . . . . . . . . . . 46
23. Births, by birthweight (grams) and by age and race and Hispanic origin of mother: United States, 2016 . . . . . . . . . . . . . . . . . . . . 47
24. Twin and triplet and higher-order multiple births: United States, 2010–2016, and by race and Hispanic origin of mother, 2016 . . . . . . . . . . . . . . . . . . . . . . . . . . . . . . . . . . . . 49
25. Births, by plurality and by age and race and Hispanic origin of mother: United States, 2016 . . . . . . . . . . . . . . . . . . . . . . . . . . . 50
List of Internet Tables(Available from: https://www.cdc.gov/nchs/data/nvsr/nvsr67/nvsr67 _01_tables.pdf)
I–1. Time of birth, by day of week of birth and by race and Hispanic origin of mother: United States, 2016
I–2. Births and seasonally adjusted birth rates, by month: United States, 2016
I–3. Births, by day of week and method of delivery: United States, 2016
I–4. Births, by attendant, place of delivery, and race and Hispanic origin of mother: United States, 2016
I–5. Births occurring at home: United States and each state, 2016I–6. Mean age of mother, by live-birth order: United States,
2010–2016, and by race and Hispanic origin of mother, 2016I–7. Births to unmarried women, by race and Hispanic origin of
mother: United States, each state and territory, 2016I–8. Educational attainment of mother, by age (years) and race and
Hispanic origin of mother: United States, 2016I–9. Maternal prepregnancy body mass index, by age (years) and
race and Hispanic origin of mother: United States, 2016I–10. Live births, by interval since last live birth and by age (years) and
race and Hispanic origin of mother: United States, 2016I–11. Mother received WIC food for herself during this pregnancy and
infant was breastfed at discharge, by age (years) and race and Hispanic origin of mother: United States, 2016
I–12. Pregnancy risk factors, by age (years) and race and Hispanic origin of mother: United States, 2016
I–13. Infections present or treated during this pregnancy, by age (years) and race and Hispanic origin of mother: United States, 2016
I–14. External cephalic version, by age (years) and race and Hispanic origin of mother: United States, 2016
I–15. Characteristics of labor and delivery, by age (years) and race and Hispanic origin of mother: United States, 2016
I–16. Total cesarean delivery and low-risk cesarean delivery, by race and Hispanic origin of mother: United States, each state and territory, 2016
I–17. Method of delivery, by age (years) and race and Hispanic origin of mother: United States, 2016
I–18. Maternal morbidity, by age (years) and race and Hispanic origin of mother: United States, 2016
I–19. Preterm births, by race and Hispanic origin of mother: United States, each state and territory, 2016
I–20. Late preterm births, by race and Hispanic origin of mother: United States, each state and territory, 2016
I–21. Low birthweight births, by race and Hispanic origin of mother: United States, each state and territory, 2016
I–22. Very low birthweight births, by race and Hispanic origin of mother: United States, each state and territory, 2016
I–23. Twin and triplet or higher-order multiple births: United States and each state, 2014–2016
I–24. Abnormal conditions of the newborn, by age (years) and race and Hispanic origin of mother: United States, 2016
I–25. Congenital anomalies of the newborn, by age (years) of mother: United States, 2016
I–26. Births and birth rates, by bridged race: United States, 2010–2016I–27. Birth rates, by age (years) and bridged race of mother: United
States, 2010–2016I–28. Births and birth rates, by Hispanic origin of mother and by
bridged race for mothers of non-Hispanic origin: United States, 2010–2016
12 National Vital Statistics Reports, Vol. 67, No. 1, January 31, 2018
I–29. Birth rates, by age (years) and Hispanic origin of mother and by bridged race for mothers of non-Hispanic origin: United States, 2010–2016
I–30. Birth rates, by live-birth order and by bridged race and Hispanic origin of mother: United States, 2010–2016
I–31. Mean age of mother, by live-birth order and by bridged race and Hispanic origin of mother: United States, 2010–2016
I–32. Birth rates for unmarried women, by age (years) of mother and by bridged race and Hispanic origin of mother: United States, 2010–2016
I–33. Births, by method of delivery and bridged race and Hispanic origin of mother: United States, 2010–2016
I–34. Very preterm and preterm and very low birthweight and low birthweight births, by bridged race and Hispanic origin of mother: United States, 2010–2016
I–35. Twin and triplet and higher-order multiple births, by bridged race and Hispanic origin of mother: United States, 2010–2016
National Vital Statistics Reports, Vol. 67, No. 1, January 31, 2018 13
Guide to Tables in “Births: Final Data for 2016”
TABLE: 1 2 3 4 5 6 7 8 9 10 11 12 13 14 15
Geographic area:States 16 17 18
United States or all reporting areas 1 2 3 4 5 6 7 8 9 10 11 12 13 14 15
Years:Current year only 3 4 5 6 7 8 9 11 12 13 14 15
Trend 1 2 10
Type of entry:Number of births 1 3 4 6 7 9 11 12 15
Rates or other measures 1 2 5 8 9 10 11 12 13 14 15
Characteristics:Abnormal conditions of the newbornAge of mother 2 3 4 5 8 9 10 11 12 15
Attendant at birth 13 14
Birthweight 13 14
Body mass index (BMI) 13 14
Characteristics of labor and delivery 13 14
Congenital anomalies Day of week Educational attainment 11 12
Fetal presentation Gestational age 13 14
Hispanic origin of mother 21 22 23 34 25 26 37 29 210 211 312 213 314 215
Infant breastfed 13 14
Infections present or treated
Interval since last live birth
Live-birth order 3 4 5
Maternal morbidity
Mean age of mother 11 12
Method of delivery 13 14
Month of birth
Mulitiple births 13 14
Nativity 11 12
Obstetric procedures
Place of delivery
Prenatal care 13 14
Race of mother 41 42 42 45 46 49 510 411 413 515
Risk factors in this pregnancy 13 14
Sex of child 11 12
Source of payment 13 14
Time of birth
Tobacco use 13 14 15
Unmarried mothers 9 10 11 12
Weight gain during pregnancy
WIC8 13 14
See footnotes at end of table.
14 National Vital Statistics Reports, Vol. 67, No. 1, January 31, 2018
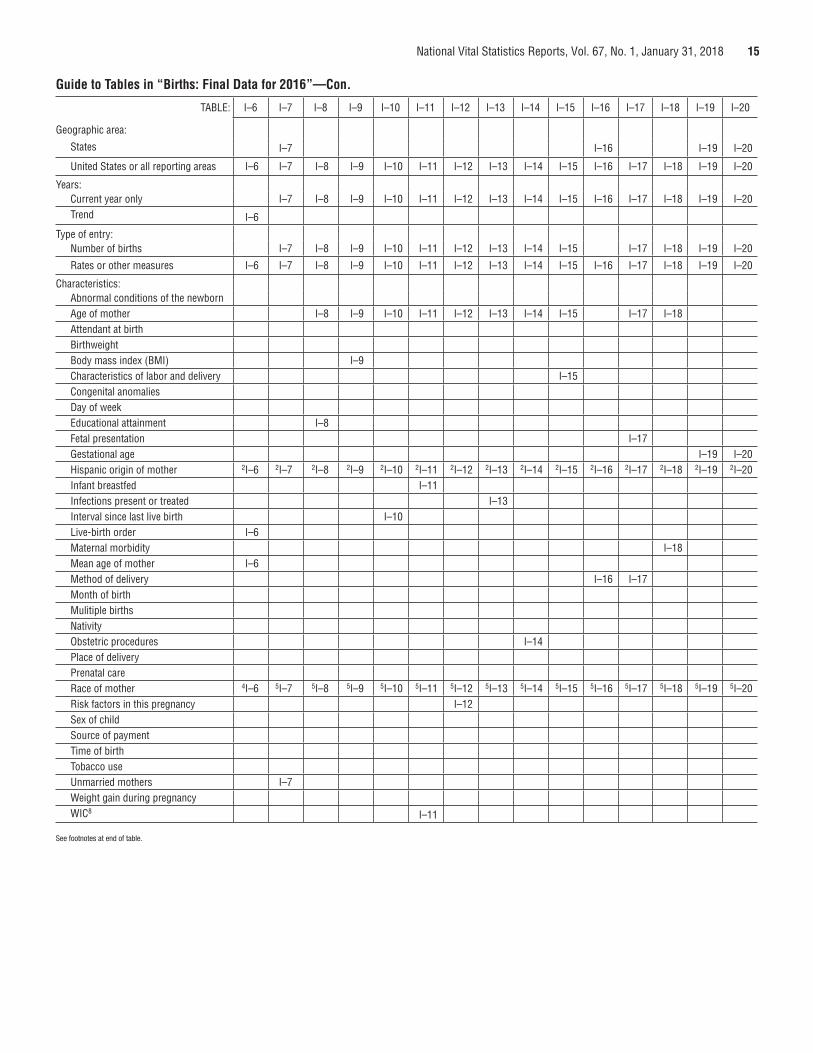
Guide to Tables in “Births: Final Data for 2016”—Con.
TABLE: 16 17 18 19 20 21 22 23 24 25 I–1 I–2 I–3 I–4 I–5
Geographic area:States I–5
United States or all reporting areas 16 17 18 19 20 21 22 23 24 25 I–1 I–2 I–3 I–4 I–5
Years:Current year only 16 18 19 21 23 25 I–1 I–2 I–3 I–4 I–5Trend 17 20 22 24
Type of entry:Number of births 16 17 18 19 20 21 22 23 24 25 I–1 I–2 I–3 I–4 I–5
Rates or other measures 16 17 18 19 20 21 22 23 24 25 I–1 I–2 I–3 I–4 I–5
Characteristics:Abnormal conditions of the newborn
Age of mother 16 18 19 21 23 25Attendant at birth I–4Birthweight 22 23Body mass index (BMI) Characteristics of labor and delivery
Congenital anomalies Day of week I–3Educational attainment Fetal presentation Gestational age 20 21Hispanic origin of mother 216 217 218 219 220 221 222 223 224 225 2I–1 2I–4Infant breastfed Infections present or treated Interval since last live birth Live-birth order Maternal morbidity Mean age of mother Method of delivery 17 18 I–3Month of birth I–2Mulitiple births 24 25Nativity Obstetric procedures Place of delivery I–4 I–5Prenatal care 16Race of mother 516 517 518 519 520 521 522 523 524 525 5I–1 5I–4Risk factors in this pregnancy Sex of child Source of payment 19Time of birth I–1Tobacco use Unmarried mothers Weight gain during pregnancy WIC8
See footnotes at end of table.
National Vital Statistics Reports, Vol. 67, No. 1, January 31, 2018 15
Guide to Tables in “Births: Final Data for 2016”—Con.
TABLE: I–6 I–7 I–8 I–9 I–10 I–11 I–12 I–13 I–14 I–15 I–16 I–17 I–18 I–19 I–20
Geographic area:
States I–7 I–16 I–19 I–20
United States or all reporting areas I–6 I–7 I–8 I–9 I–10 I–11 I–12 I–13 I–14 I–15 I–16 I–17 I–18 I–19 I–20
Years:Current year only I–7 I–8 I–9 I–10 I–11 I–12 I–13 I–14 I–15 I–16 I–17 I–18 I–19 I–20Trend I–6
Type of entry:Number of births I–7 I–8 I–9 I–10 I–11 I–12 I–13 I–14 I–15 I–17 I–18 I–19 I–20
Rates or other measures I–6 I–7 I–8 I–9 I–10 I–11 I–12 I–13 I–14 I–15 I–16 I–17 I–18 I–19 I–20
Characteristics:Abnormal conditions of the newborn Age of mother I–8 I–9 I–10 I–11 I–12 I–13 I–14 I–15 I–17 I–18Attendant at birth Birthweight Body mass index (BMI) I–9Characteristics of labor and delivery I–15Congenital anomalies Day of week Educational attainment I–8Fetal presentation I–17Gestational age I–19 I–20Hispanic origin of mother 2I–6 2I–7 2I–8 2I–9 2I–10 2I–11 2I–12 2I–13 2I–14 2I–15 2I–16 2I–17 2I–18 2I–19 2I–20Infant breastfed I–11Infections present or treated I–13Interval since last live birth I–10Live-birth order I–6Maternal morbidity I–18Mean age of mother I–6Method of delivery I–16 I–17Month of birth Mulitiple births Nativity Obstetric procedures I–14Place of delivery Prenatal care Race of mother 4I–6 5I–7 5I–8 5I–9 5I–10 5I–11 5I–12 5I–13 5I–14 5I–15 5I–16 5I–17 5I–18 5I–19 5I–20Risk factors in this pregnancy I–12Sex of child Source of payment Time of birth Tobacco use Unmarried mothers I–7Weight gain during pregnancy WIC8 I–11
See footnotes at end of table.
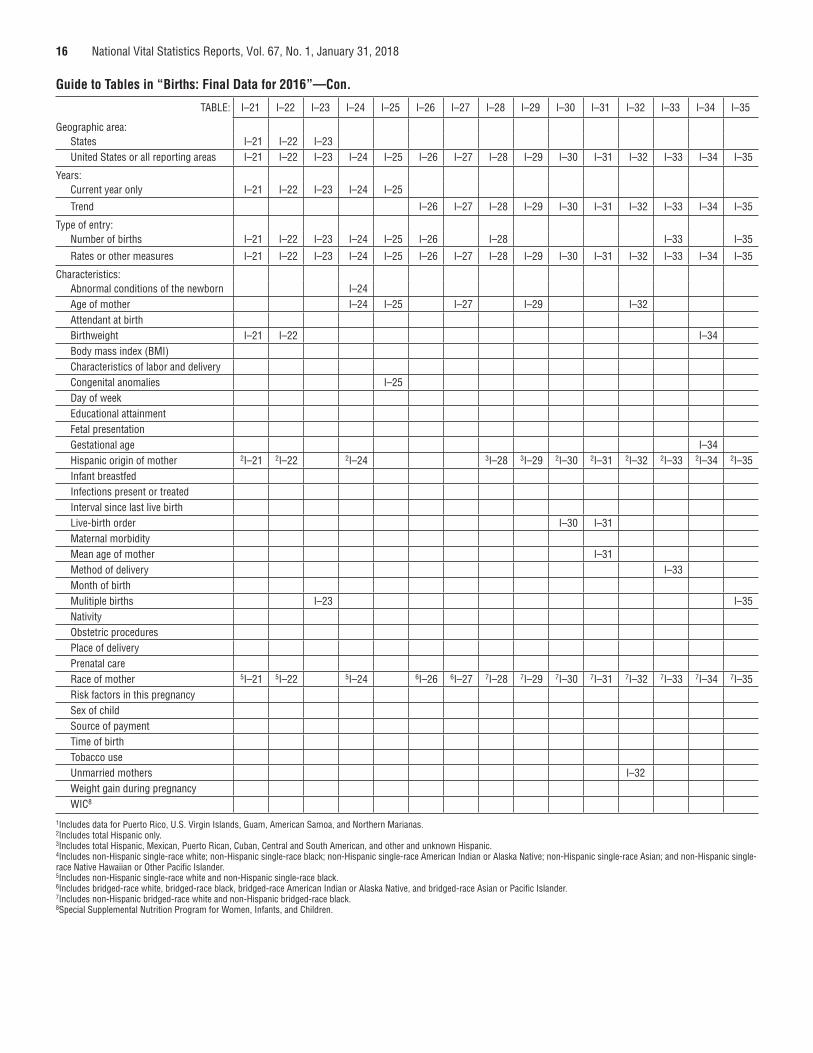
16 National Vital Statistics Reports, Vol. 67, No. 1, January 31, 2018
Guide to Tables in “Births: Final Data for 2016”—Con.
TABLE: I–21 I–22 I–23 I–24 I–25 I–26 I–27 I–28 I–29 I–30 I–31 I–32 I–33 I–34 I–35
Geographic area:States I–21 I–22 I–23United States or all reporting areas I–21 I–22 I–23 I–24 I–25 I–26 I–27 I–28 I–29 I–30 I–31 I–32 I–33 I–34 I–35
Years:Current year only I–21 I–22 I–23 I–24 I–25
Trend I–26 I–27 I–28 I–29 I–30 I–31 I–32 I–33 I–34 I–35
Type of entry:Number of births I–21 I–22 I–23 I–24 I–25 I–26 I–28 I–33 I–35
Rates or other measures I–21 I–22 I–23 I–24 I–25 I–26 I–27 I–28 I–29 I–30 I–31 I–32 I–33 I–34 I–35
Characteristics:Abnormal conditions of the newborn I–24Age of mother I–24 I–25 I–27 I–29 I–32Attendant at birth Birthweight I–21 I–22 I–34Body mass index (BMI) Characteristics of labor and delivery Congenital anomalies I–25Day of week Educational attainment Fetal presentation Gestational age I–34Hispanic origin of mother 2I–21 2I–22 2I–24 3I–28 3I–29 2I–30 2I–31 2I–32 2I–33 2I–34 2I–35Infant breastfed Infections present or treated Interval since last live birth Live-birth order I–30 I–31Maternal morbidity Mean age of mother I–31Method of delivery I–33Month of birth Mulitiple births I–23 I–35Nativity Obstetric procedures Place of delivery Prenatal care Race of mother 5I–21 5I–22 5I–24 6I–26 6I–27 7I–28 7I–29 7I–30 7I–31 7I–32 7I–33 7I–34 7I–35Risk factors in this pregnancy Sex of child Source of payment Time of birth Tobacco use Unmarried mothers I–32Weight gain during pregnancy WIC8
1Includes data for Puerto Rico, U.S. Virgin Islands, Guam, American Samoa, and Northern Marianas.2Includes total Hispanic only.3Includes total Hispanic, Mexican, Puerto Rican, Cuban, Central and South American, and other and unknown Hispanic.4Includes non-Hispanic single-race white; non-Hispanic single-race black; non-Hispanic single-race American Indian or Alaska Native; non-Hispanic single-race Asian; and non-Hispanic single-race Native Hawaiian or Other Pacific Islander.5Includes non-Hispanic single-race white and non-Hispanic single-race black.6Includes bridged-race white, bridged-race black, bridged-race American Indian or Alaska Native, and bridged-race Asian or Pacific Islander.7Includes non-Hispanic bridged-race white and non-Hispanic bridged-race black.8Special Supplemental Nutrition Program for Women, Infants, and Children.
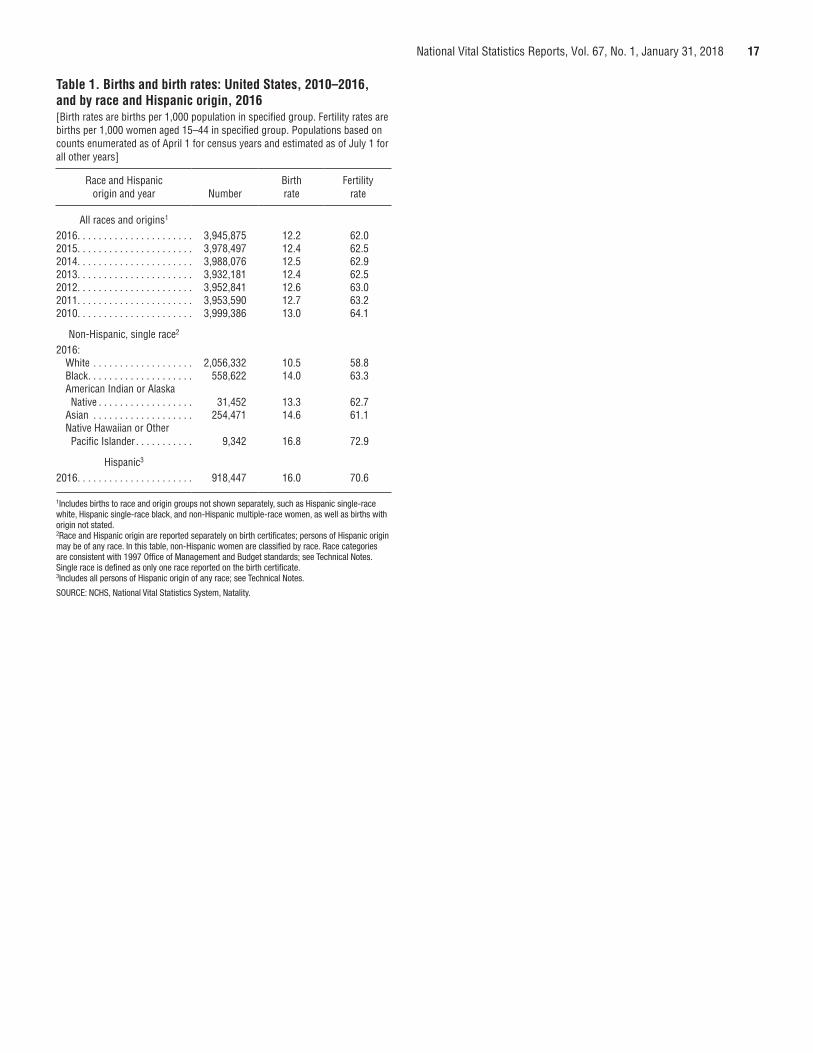
National Vital Statistics Reports, Vol. 67, No. 1, January 31, 2018 17
Table 1. Births and birth rates: United States, 2010–2016, and by race and Hispanic origin, 2016[Birth rates are births per 1,000 population in specified group. Fertility rates are births per 1,000 women aged 15–44 in specified group. Populations based on counts enumerated as of April 1 for census years and estimated as of July 1 for all other years]
Race and Hispanic origin and year Number
Birth rate
Fertility rate
All races and origins1
2016. . . . . . . . . . . . . . . . . . . . . . 3,945,875 12.2 62.0 2015. . . . . . . . . . . . . . . . . . . . . . 3,978,497 12.4 62.5 2014. . . . . . . . . . . . . . . . . . . . . . 3,988,076 12.5 62.9 2013. . . . . . . . . . . . . . . . . . . . . . 3,932,181 12.4 62.5 2012. . . . . . . . . . . . . . . . . . . . . . 3,952,841 12.6 63.0 2011. . . . . . . . . . . . . . . . . . . . . . 3,953,590 12.7 63.2 2010. . . . . . . . . . . . . . . . . . . . . . 3,999,386 13.0 64.1
Non-Hispanic, single race2
2016:White . . . . . . . . . . . . . . . . . . . 2,056,332 10.5 58.8 Black . . . . . . . . . . . . . . . . . . . . 558,622 14.0 63.3 American Indian or Alaska Native . . . . . . . . . . . . . . . . . . 31,452 13.3 62.7
Asian . . . . . . . . . . . . . . . . . . . 254,471 14.6 61.1 Native Hawaiian or Other Pacific Islander . . . . . . . . . . . 9,342 16.8 72.9
Hispanic3
2016. . . . . . . . . . . . . . . . . . . . . . 918,447 16.0 70.6
1Includes births to race and origin groups not shown separately, such as Hispanic single-race white, Hispanic single-race black, and non-Hispanic multiple-race women, as well as births with origin not stated. 2Race and Hispanic origin are reported separately on birth certificates; persons of Hispanic origin may be of any race. In this table, non-Hispanic women are classified by race. Race categories are consistent with 1997 Office of Management and Budget standards; see Technical Notes. Single race is defined as only one race reported on the birth certificate. 3Includes all persons of Hispanic origin of any race; see Technical Notes.
SOURCE: NCHS, National Vital Statistics System, Natality.
18
National Vital Statistics Reports, Vol. 67, No. 1, January 31, 2018Table 2. Birth rates, by age of mother: United States, 2010–2016, and by age and race and Hispanic origin of mother, 2016[Total fertility rates are sums of birth rates for 5-year age groups multiplied by 5. Birth rates are births per 1,000 women in specified group. Populations based on counts enumerated as of April 1 for census years and estimated as of July 1 for all other years]
Age of mother (years)
Year and race and Hispanic origin of mother
Total fertility rate 10–14
15–19
20–24 25–29 30–34 35–39 40–44 45–491Total 15–17 18–19
All races and origins2
2016. . . . . . . . . . . . . . . . . . . . . . . . . . . . . . . . 1,820.5 0.2 20.3 8.8 37.5 73.8 102.1 102.7 52.7 11.4 0.92015. . . . . . . . . . . . . . . . . . . . . . . . . . . . . . . . 1,843.5 0.2 22.3 9.9 40.7 76.8 104.3 101.5 51.8 11.0 0.82014. . . . . . . . . . . . . . . . . . . . . . . . . . . . . . . . 1,862.5 0.3 24.2 10.9 43.8 79.0 105.8 100.8 51.0 10.6 0.82013. . . . . . . . . . . . . . . . . . . . . . . . . . . . . . . . 1,857.5 0.3 26.5 12.3 47.1 80.7 105.5 98.0 49.3 10.4 0.82012. . . . . . . . . . . . . . . . . . . . . . . . . . . . . . . . 1,880.5 0.4 29.4 14.1 51.4 83.1 106.5 97.3 48.3 10.4 0.72011. . . . . . . . . . . . . . . . . . . . . . . . . . . . . . . . 1,894.5 0.4 31.3 15.4 54.1 85.3 107.2 96.5 47.2 10.3 0.72010. . . . . . . . . . . . . . . . . . . . . . . . . . . . . . . . 1,931.0 0.4 34.2 17.3 58.2 90.0 108.3 96.5 45.9 10.2 0.7
Non-Hispanic, single race3
2016:White . . . . . . . . . . . . . . . . . . . . . . . . . . . . . 1,719.0 0.1 14.3 5.2 27.7 62.4 99.3 106.2 51.1 9.7 0.7Black . . . . . . . . . . . . . . . . . . . . . . . . . . . . . . 1,832.5 0.5 29.3 13.7 52.5 95.8 100.8 83.0 45.0 11.1 1.0American Indian or Alaska Native . . . . . . . . 1,794.5 0.5 35.1 16.8 62.6 97.2 103.4 77.1 37.1 8.2 0.3Asian . . . . . . . . . . . . . . . . . . . . . . . . . . . . . 1,690.5 * 3.9 1.4 7.5 28.9 87.0 127.4 72.8 16.4 1.7Native Hawaiian or Other Pacific Islander . . 2,076.5 * 28.6 11.0 55.3 109.5 115.5 96.0 49.9 14.7 *
Hispanic4
2016. . . . . . . . . . . . . . . . . . . . . . . . . . . . . . . . 2,092.5 0.4 31.9 15.6 57.3 98.4 117.4 99.2 55.8 14.5 0.9
* Figure does not meet standards of reliability or precision; based on fewer than 20 births in numerator. 1Birth rates computed by relating births to women aged 45 and over to women aged 45–49; see Technical Notes. 2Includes births to race and origin groups not shown separately, such as Hispanic single-race white, Hispanic single-race black, and non-Hispanic multiple-race women, as well as births with origin not stated. 3Race and Hispanic origin are reported separately on birth certificates; persons of Hispanic origin may be of any race. In this table, non-Hispanic women are classified by race. Race categories are consistent with 1997 Office of Management and Budget standards; see Technical Notes. Single race is defined as only one race reported on the birth certificate. 4Includes all persons of Hispanic origin of any race; see Technical Notes.
SOURCE: NCHS, National Vital Statistics System, Natality.
National Vital Statistics Reports, Vol. 67, No. 1, January 31, 2018
19Table 3. Births, by age (years) of mother, live-birth order, and race and Hispanic origin of mother: United States, 2016[Live-birth order refers to number of children born alive to mother]
Live-birth order and race and Hispanic origin of mother All ages Under 15
15–19
20–24 25–29 30–34 35–39 40–44 45–49 50–54Total 15 16 17 18 19
All races and origins1 . . . . . . . . . . . . . . . . . . . . . . . . . . 3,945,875 2,253 209,809 6,594 16,419 31,728 58,761 96,307 803,978 1,149,122 1,111,042 547,488 113,140 8,257 7861st child . . . . . . . . . . . . . . . . . . . . . . . . . . . . . . . . . . 1,499,877 2,218 174,543 6,423 15,551 28,495 49,255 74,819 411,863 427,388 333,897 123,256 24,116 2,343 2532nd child . . . . . . . . . . . . . . . . . . . . . . . . . . . . . . . . . 1,264,183 23 30,009 142 776 2,876 8,271 17,944 261,543 381,178 380,872 177,438 30,809 2,112 1993rd child . . . . . . . . . . . . . . . . . . . . . . . . . . . . . . . . . . 671,133 2 3,892 6 40 210 878 2,758 94,055 208,213 219,146 120,705 23,614 1,384 1224th child . . . . . . . . . . . . . . . . . . . . . . . . . . . . . . . . . . 290,028 – 443 – 2 27 80 334 25,328 84,217 101,070 63,461 14,558 867 845th child . . . . . . . . . . . . . . . . . . . . . . . . . . . . . . . . . . 113,570 – 64 – – 6 14 44 5,987 28,691 40,646 29,597 8,000 542 436th child . . . . . . . . . . . . . . . . . . . . . . . . . . . . . . . . . . 47,474 – 16 – – 4 7 5 1,347 9,651 17,382 14,271 4,477 289 417th child . . . . . . . . . . . . . . . . . . . . . . . . . . . . . . . . . . 21,328 – 7 – – – 5 2 284 3,232 7,741 7,390 2,466 192 168th child and over . . . . . . . . . . . . . . . . . . . . . . . . . . . 22,422 – 11 – – – 4 7 279 1,837 6,012 9,165 4,605 487 26Not stated . . . . . . . . . . . . . . . . . . . . . . . . . . . . . . . . . 15,860 10 824 23 50 110 247 394 3,292 4,715 4,276 2,205 495 41 2
Non-Hispanic, single race2
White . . . . . . . . . . . . . . . . . . . . . . . . . . . . . . . . . . . . . . 2,056,332 508 78,133 1,765 4,718 10,428 22,025 39,197 364,824 616,812 643,398 294,521 53,686 4,100 3501st child . . . . . . . . . . . . . . . . . . . . . . . . . . . . . . . . . . 814,275 503 66,534 1,732 4,547 9,556 19,051 31,648 197,210 254,212 208,647 72,640 13,118 1,290 1212nd child . . . . . . . . . . . . . . . . . . . . . . . . . . . . . . . . . 687,856 3 10,140 23 153 794 2,655 6,515 117,844 208,533 232,397 101,992 15,735 1,119 933rd child . . . . . . . . . . . . . . . . . . . . . . . . . . . . . . . . . . 332,567 – 1,070 1 7 42 213 807 37,876 99,831 119,775 62,730 10,597 637 514th child . . . . . . . . . . . . . . . . . . . . . . . . . . . . . . . . . . 128,831 – 107 – 1 7 21 78 8,429 36,251 48,856 29,102 5,716 342 285th child . . . . . . . . . . . . . . . . . . . . . . . . . . . . . . . . . . 46,088 – 15 – – 2 4 9 1,677 10,902 17,911 12,545 2,814 207 176th child . . . . . . . . . . . . . . . . . . . . . . . . . . . . . . . . . . 18,963 – 6 – – 1 3 2 330 3,249 7,466 6,079 1,706 109 187th child . . . . . . . . . . . . . . . . . . . . . . . . . . . . . . . . . . 8,999 – 3 – – – 2 1 67 973 3,407 3,400 1,062 82 58th child and over . . . . . . . . . . . . . . . . . . . . . . . . . . . 11,129 – 1 – – – – 1 111 580 2,525 4,903 2,703 290 16Not stated . . . . . . . . . . . . . . . . . . . . . . . . . . . . . . . . . 7,624 2 257 9 10 26 76 136 1,280 2,281 2,414 1,130 235 24 1
Black . . . . . . . . . . . . . . . . . . . . . . . . . . . . . . . . . . . . . . 558,622 695 42,836 1,652 3,698 6,640 11,911 18,935 154,406 163,887 118,795 62,252 14,419 1,204 1281st child . . . . . . . . . . . . . . . . . . . . . . . . . . . . . . . . . . 198,732 679 35,123 1,599 3,471 5,877 9,817 14,359 74,914 46,441 26,840 11,676 2,702 306 512nd child . . . . . . . . . . . . . . . . . . . . . . . . . . . . . . . . . 160,372 9 6,330 42 192 652 1,748 3,696 47,797 51,620 34,619 16,304 3,398 262 333rd child . . . . . . . . . . . . . . . . . . . . . . . . . . . . . . . . . . 101,164 2 907 2 12 52 210 631 20,645 35,037 26,928 14,393 3,023 212 174th child . . . . . . . . . . . . . . . . . . . . . . . . . . . . . . . . . . 50,761 – 131 – – 11 22 98 7,191 17,323 14,897 8,929 2,121 156 135th child . . . . . . . . . . . . . . . . . . . . . . . . . . . . . . . . . . 22,881 – 23 – – 2 5 16 2,040 7,438 7,418 4,627 1,250 84 16th child . . . . . . . . . . . . . . . . . . . . . . . . . . . . . . . . . . 10,636 – 5 – – – 4 1 515 3,024 3,802 2,533 698 57 27th child . . . . . . . . . . . . . . . . . . . . . . . . . . . . . . . . . . 5,074 – 4 – – – 3 1 107 1,172 1,841 1,483 428 34 58th child and over . . . . . . . . . . . . . . . . . . . . . . . . . . . 5,208 – 4 – – – 2 2 85 695 1,704 1,893 734 87 6Not stated . . . . . . . . . . . . . . . . . . . . . . . . . . . . . . . . . 3,794 5 309 9 23 46 100 131 1,112 1,137 746 414 65 6 –
American Indian or Alaska Native . . . . . . . . . . . . . . . . . 31,452 38 3,107 115 280 483 854 1,375 9,116 9,529 6,266 2,801 574 20 11st child . . . . . . . . . . . . . . . . . . . . . . . . . . . . . . . . . . 9,416 38 2,525 113 272 433 687 1,020 3,708 1,890 891 314 48 2 –2nd child . . . . . . . . . . . . . . . . . . . . . . . . . . . . . . . . . 8,438 – 500 2 7 42 158 291 3,182 2,777 1,382 502 91 4 –3rd child . . . . . . . . . . . . . . . . . . . . . . . . . . . . . . . . . . 5,965 – 71 – 1 7 8 55 1,511 2,291 1,430 564 97 1 –4th child . . . . . . . . . . . . . . . . . . . . . . . . . . . . . . . . . . 3,694 – 6 – – – – 6 518 1,431 1,114 529 91 4 15th child . . . . . . . . . . . . . . . . . . . . . . . . . . . . . . . . . . 1,902 – 1 – – – – 1 124 659 640 389 86 3 –6th child . . . . . . . . . . . . . . . . . . . . . . . . . . . . . . . . . . 1,023 – – – – – – – 39 302 403 229 49 1 –7th child . . . . . . . . . . . . . . . . . . . . . . . . . . . . . . . . . . 485 – – – – – – – 8 106 221 115 35 – –8th child and over . . . . . . . . . . . . . . . . . . . . . . . . . . . 448 – – – – – – – 2 54 163 148 76 5 –Not stated . . . . . . . . . . . . . . . . . . . . . . . . . . . . . . . . . 81 – 4 – – 1 1 2 24 19 22 11 1 – –
See footnotes at end of table.
20
National Vital Statistics Reports, Vol. 67, No. 1, January 31, 2018Table 3. Births, by age (years) of mother, live-birth order, and race and Hispanic origin of mother: United States, 2016—Con.[Live-birth order refers to number of children born alive to mother]
Live-birth order and race and Hispanic origin of mother All ages Under 15
15–19
20–24 25–29 30–34 35–39 40–44 45–49 50–54Total 15 16 17 18 19
Non-Hispanic, single race2—Con.Asian . . . . . . . . . . . . . . . . . . . . . . . . . . . . . . . . . . . . . . 254,471 13 1,949 55 119 234 519 1,022 17,598 66,487 100,491 54,861 12,023 963 86
1st child . . . . . . . . . . . . . . . . . . . . . . . . . . . . . . . . . . . . . . . . 116,411 12 1,611 53 110 196 434 818 11,504 39,874 43,608 16,143 3,278 345 362nd child . . . . . . . . . . . . . . . . . . . . . . . . . . . . . . . . . . . . . . . . 95,477 – 287 2 8 29 78 170 4,548 19,296 41,550 24,822 4,628 317 293rd child . . . . . . . . . . . . . . . . . . . . . . . . . . . . . . . . . . . . . . . . 28,936 – 38 – – 6 5 27 1,122 5,019 10,649 9,474 2,470 150 144th child . . . . . . . . . . . . . . . . . . . . . . . . . . . . . . . . . . . . . . . . 8,469 – 5 – – – 1 4 286 1,497 2,937 2,780 901 60 35th child . . . . . . . . . . . . . . . . . . . . . . . . . . . . . . . . . . . . . . . . 2,674 – – – – – – – 71 429 900 867 356 50 16th child . . . . . . . . . . . . . . . . . . . . . . . . . . . . . . . . . . . . . . . . 979 – 1 – – 1 – – 13 114 351 305 172 21 27th child . . . . . . . . . . . . . . . . . . . . . . . . . . . . . . . . . . . . . . . . 438 – – – – – – – 4 54 149 153 76 2 –8th child and over . . . . . . . . . . . . . . . . . . . . . . . . . . . . . . . . 465 – – – – – – – 6 34 122 174 112 17 –Not stated . . . . . . . . . . . . . . . . . . . . . . . . . . . . . . . . . . . . . . . 622 1 7 – 1 2 1 3 44 170 225 143 30 1 1
Native Hawaiian or Other Pacific Islander . . . . . . . . . . 9,342 4 556 10 28 89 161 268 2,353 2,840 2,279 1,027 267 15 11st child . . . . . . . . . . . . . . . . . . . . . . . . . . . . . . . . . . . . . . . . 2,756 4 450 10 25 80 130 205 1,075 663 398 123 40 2 12nd child . . . . . . . . . . . . . . . . . . . . . . . . . . . . . . . . . . . . . . . . 2,253 – 88 – 3 8 25 52 764 725 471 160 41 4 –3rd child . . . . . . . . . . . . . . . . . . . . . . . . . . . . . . . . . . . . . . . . 1,779 – 14 – – 1 4 9 346 681 494 196 45 3 –4th child . . . . . . . . . . . . . . . . . . . . . . . . . . . . . . . . . . . . . . . . 1,161 – – – – – – – 122 437 402 161 38 1 –5th child . . . . . . . . . . . . . . . . . . . . . . . . . . . . . . . . . . . . . . . . 674 – – – – – – – 27 195 262 154 33 3 –6th child . . . . . . . . . . . . . . . . . . . . . . . . . . . . . . . . . . . . . . . . 331 – – – – – – – 3 80 137 87 23 1 –7th child . . . . . . . . . . . . . . . . . . . . . . . . . . . . . . . . . . . . . . . . 162 – – – – – – – 1 32 51 58 20 – –8th child and over . . . . . . . . . . . . . . . . . . . . . . . . . . . . . . . . 176 – – – – – – – 1 14 57 77 26 1 –Not stated . . . . . . . . . . . . . . . . . . . . . . . . . . . . . . . . . . . . . . . 50 – 4 – – – 2 2 14 13 7 11 1 – –
Hispanic3
All ages3 . . . . . . . . . . . . . . . . . . . . . . . . . . . . . . . . . . . . 918,447 886 74,822 2,719 6,927 12,561 20,902 31,713 228,216 258,025 210,735 115,848 28,344 1,470 1011st child . . . . . . . . . . . . . . . . . . . . . . . . . . . . . . . . . . . . . . . . 310,152 874 61,190 2,643 6,517 11,165 17,082 23,783 109,061 73,025 43,710 18,027 3,953 286 262nd child . . . . . . . . . . . . . . . . . . . . . . . . . . . . . . . . . . . . . . . . 274,878 10 11,563 68 378 1,255 3,323 6,539 78,792 88,308 61,422 28,607 5,882 276 183rd child . . . . . . . . . . . . . . . . . . . . . . . . . . . . . . . . . . . . . . . . 182,514 – 1,659 3 17 98 403 1,138 29,525 59,421 54,737 30,161 6,692 302 174th child . . . . . . . . . . . . . . . . . . . . . . . . . . . . . . . . . . . . . . . . 88,909 – 184 – – 9 34 141 7,883 24,777 30,211 20,325 5,279 232 185th child . . . . . . . . . . . . . . . . . . . . . . . . . . . . . . . . . . . . . . . . 35,922 – 24 – – 2 4 18 1,855 8,111 12,355 10,191 3,211 163 126th child . . . . . . . . . . . . . . . . . . . . . . . . . . . . . . . . . . . . . . . . 14,031 – 3 – – 2 – 1 403 2,534 4,669 4,634 1,695 87 67th child . . . . . . . . . . . . . . . . . . . . . . . . . . . . . . . . . . . . . . . . 5,422 – – – – – – – 84 775 1,801 1,958 744 58 28th child and over . . . . . . . . . . . . . . . . . . . . . . . . . . . . . . . . 4,203 – 6 – – – 2 4 65 410 1,239 1,635 783 63 2Not stated . . . . . . . . . . . . . . . . . . . . . . . . . . . . . . . . . . . . . . . 2,416 2 193 5 15 30 54 89 548 664 591 310 105 3 –
– Quantity zero. 1Includes births to race and origin groups not shown separately, such as Hispanic single-race white, Hispanic single-race black, and non-Hispanic multiple-race women, as well as births with origin not stated. 2Race and Hispanic origin are reported separately on birth certificates; persons of Hispanic origin may be of any race. In this table, non-Hispanic women are classified by race. Race categories are consistent with 1997 Office of Management and Budget standards; see Technical Notes. Single race is defined as only one race reported on the birth certificate. 3Includes all persons of Hispanic origin of any race; see Technical Notes.
SOURCE: NCHS, National Vital Statistics System, Natality.
National Vital Statistics Reports, Vol. 67, No. 1, January 31, 2018
21Table 4. Births, by age (years) of mother, live-birth order, and Hispanic origin of mother: United States, 2016[Live-birth order refers to number of children born alive to mother]
Live-birth order and Hispanic origin of mother All ages Under 15
15–19
20–24 25–29 30–34 35–39 40–44 45–49 50–54Total 15 16 17 18 19
HispanicTotal . . . . . . . . . . . . . . . . . . . . . . . . . 918,447 886 74,822 2,719 6,927 12,561 20,902 31,713 228,216 258,025 210,735 115,848 28,344 1,470 101
1st child . . . . . . . . . . . . . . . . . . . . 310,152 874 61,190 2,643 6,517 11,165 17,082 23,783 109,061 73,025 43,710 18,027 3,953 286 262nd child . . . . . . . . . . . . . . . . . . . 274,878 10 11,563 68 378 1,255 3,323 6,539 78,792 88,308 61,422 28,607 5,882 276 183rd child . . . . . . . . . . . . . . . . . . . . 182,514 – 1,659 3 17 98 403 1,138 29,525 59,421 54,737 30,161 6,692 302 174th child . . . . . . . . . . . . . . . . . . . . 88,909 – 184 – – 9 34 141 7,883 24,777 30,211 20,325 5,279 232 185th child . . . . . . . . . . . . . . . . . . . . 35,922 – 24 – – 2 4 18 1,855 8,111 12,355 10,191 3,211 163 126th child . . . . . . . . . . . . . . . . . . . . 14,031 – 3 – – 2 – 1 403 2,534 4,669 4,634 1,695 87 67th child . . . . . . . . . . . . . . . . . . . . 5,422 – – – – – – – 84 775 1,801 1,958 744 58 28th child and over . . . . . . . . . . . . . 4,203 – 6 – – – 2 4 65 410 1,239 1,635 783 63 2Not stated . . . . . . . . . . . . . . . . . . . 2,416 2 193 5 15 30 54 89 548 664 591 310 105 3 –
Mexican . . . . . . . . . . . . . . . . . . . . . . 535,993 561 45,878 1,667 4,267 7,762 12,887 19,295 137,996 150,102 119,910 64,662 16,059 799 261st child . . . . . . . . . . . . . . . . . . . . . . . . 170,183 554 37,367 1,622 4,020 6,888 10,458 14,379 63,469 38,011 20,876 8,055 1,732 116 32nd child . . . . . . . . . . . . . . . . . . . . . . . . 152,652 7 7,204 41 226 785 2,113 4,039 48,651 49,909 31,094 13,092 2,573 115 73rd child . . . . . . . . . . . . . . . . . . . . . . . . 112,847 – 1,077 2 12 67 261 735 18,863 37,680 33,813 17,475 3,779 155 54th child . . . . . . . . . . . . . . . . . . . . . . . . 58,954 – 116 – – 4 21 91 5,154 16,324 20,225 13,486 3,492 152 55th child . . . . . . . . . . . . . . . . . . . . . . . . 24,337 – 13 – – 1 2 10 1,239 5,401 8,433 6,871 2,273 105 26th child . . . . . . . . . . . . . . . . . . . . . . . . 9,486 – 2 – – 2 – – 271 1,689 3,168 3,136 1,149 70 17th child . . . . . . . . . . . . . . . . . . . . . . . . 3,645 – – – – – – – 50 512 1,223 1,309 506 44 18th child and over . . . . . . . . . . . . . . . . 2,739 – 2 – – – – 2 34 261 801 1,091 508 40 2Not stated . . . . . . . . . . . . . . . . . . . . . . . 1,150 – 97 2 9 15 32 39 265 315 277 147 47 2 –
Puerto Rican . . . . . . . . . . . . . . . . . . 70,517 46 6,156 207 499 950 1,712 2,788 20,382 20,665 14,168 7,436 1,580 72 121st child . . . . . . . . . . . . . . . . . . . . . . . . 26,246 46 5,085 202 480 851 1,434 2,118 9,892 5,999 3,436 1,449 310 24 52nd child . . . . . . . . . . . . . . . . . . . . . . . . 22,127 – 892 4 18 89 233 548 6,842 7,205 4,489 2,250 430 16 33rd child . . . . . . . . . . . . . . . . . . . . . . . . 12,610 – 129 – 1 3 37 88 2,605 4,522 3,250 1,732 357 12 34th child . . . . . . . . . . . . . . . . . . . . . . . . 5,490 – 20 – – 1 2 17 725 1,865 1,652 1,007 214 7 –5th child . . . . . . . . . . . . . . . . . . . . . . . . 2,198 – 3 – – – 1 2 182 680 705 500 121 6 16th child . . . . . . . . . . . . . . . . . . . . . . . . 872 – – – – – – – 39 217 311 239 64 2 –7th child . . . . . . . . . . . . . . . . . . . . . . . . 389 – – – – – – – 10 66 155 125 31 2 –8th child and over . . . . . . . . . . . . . . . . 341 – – – – – – – 8 47 118 116 49 3 –Not stated . . . . . . . . . . . . . . . . . . . . . . . 244 – 27 1 _ 6 5 15 79 64 52 18 4 – –
See footnotes at end of table.
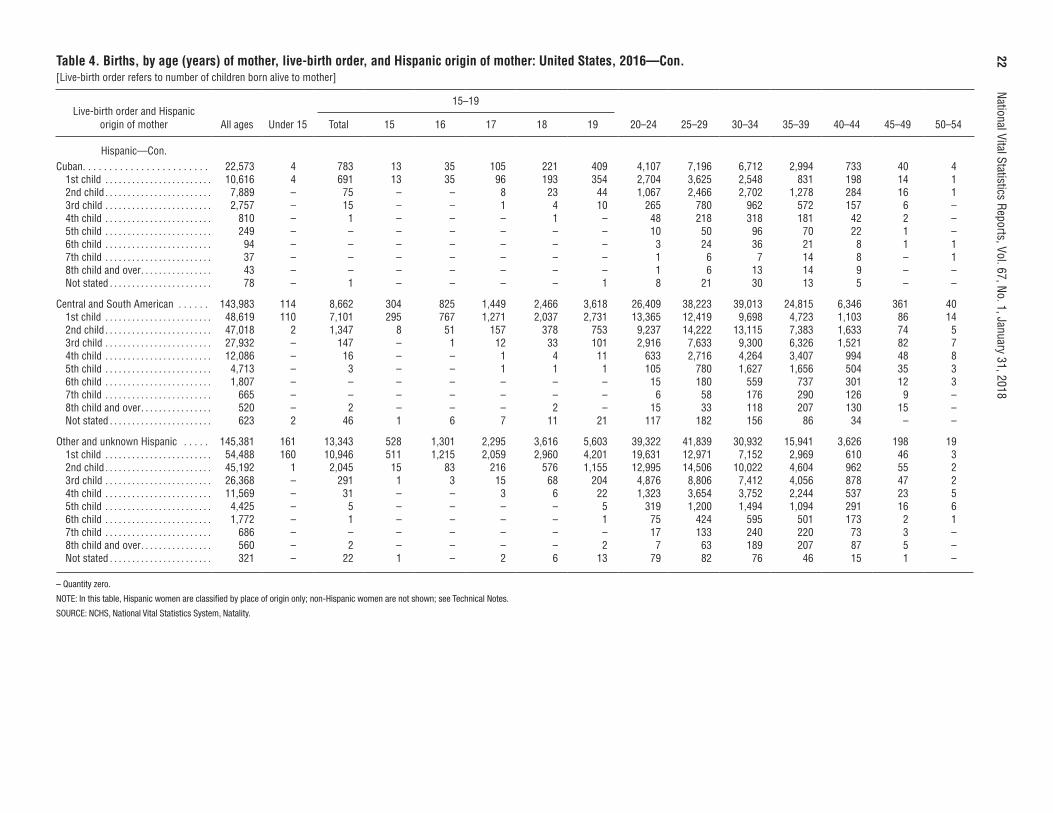
22
National Vital Statistics Reports, Vol. 67, No. 1, January 31, 2018Table 4. Births, by age (years) of mother, live-birth order, and Hispanic origin of mother: United States, 2016—Con.[Live-birth order refers to number of children born alive to mother]
Live-birth order and Hispanic origin of mother All ages Under 15
15–19
20–24 25–29 30–34 35–39 40–44 45–49 50–54Total 15 16 17 18 19
Hispanic—Con.Cuban . . . . . . . . . . . . . . . . . . . . . . . . 22,573 4 783 13 35 105 221 409 4,107 7,196 6,712 2,994 733 40 4
1st child . . . . . . . . . . . . . . . . . . . . . . . . 10,616 4 691 13 35 96 193 354 2,704 3,625 2,548 831 198 14 12nd child . . . . . . . . . . . . . . . . . . . . . . . . 7,889 – 75 – – 8 23 44 1,067 2,466 2,702 1,278 284 16 13rd child . . . . . . . . . . . . . . . . . . . . . . . . 2,757 – 15 – – 1 4 10 265 780 962 572 157 6 –4th child . . . . . . . . . . . . . . . . . . . . . . . . 810 – 1 – – – 1 – 48 218 318 181 42 2 –5th child . . . . . . . . . . . . . . . . . . . . . . . . 249 – – – – – – – 10 50 96 70 22 1 –6th child . . . . . . . . . . . . . . . . . . . . . . . . 94 – – – – – – – 3 24 36 21 8 1 17th child . . . . . . . . . . . . . . . . . . . . . . . . 37 – – – – – – – 1 6 7 14 8 – 18th child and over . . . . . . . . . . . . . . . . 43 – – – – – – – 1 6 13 14 9 – –Not stated . . . . . . . . . . . . . . . . . . . . . . . 78 – 1 – – – – 1 8 21 30 13 5 – –
Central and South American . . . . . . 143,983 114 8,662 304 825 1,449 2,466 3,618 26,409 38,223 39,013 24,815 6,346 361 401st child . . . . . . . . . . . . . . . . . . . . . . . . 48,619 110 7,101 295 767 1,271 2,037 2,731 13,365 12,419 9,698 4,723 1,103 86 142nd child . . . . . . . . . . . . . . . . . . . . . . . . 47,018 2 1,347 8 51 157 378 753 9,237 14,222 13,115 7,383 1,633 74 53rd child . . . . . . . . . . . . . . . . . . . . . . . . 27,932 – 147 – 1 12 33 101 2,916 7,633 9,300 6,326 1,521 82 74th child . . . . . . . . . . . . . . . . . . . . . . . . 12,086 – 16 – – 1 4 11 633 2,716 4,264 3,407 994 48 85th child . . . . . . . . . . . . . . . . . . . . . . . . 4,713 – 3 – – 1 1 1 105 780 1,627 1,656 504 35 36th child . . . . . . . . . . . . . . . . . . . . . . . . 1,807 – – – – – – – 15 180 559 737 301 12 37th child . . . . . . . . . . . . . . . . . . . . . . . . 665 – – – – – – – 6 58 176 290 126 9 –8th child and over . . . . . . . . . . . . . . . . 520 – 2 – – – 2 – 15 33 118 207 130 15 –Not stated . . . . . . . . . . . . . . . . . . . . . . . 623 2 46 1 6 7 11 21 117 182 156 86 34 – –
Other and unknown Hispanic . . . . . 145,381 161 13,343 528 1,301 2,295 3,616 5,603 39,322 41,839 30,932 15,941 3,626 198 191st child . . . . . . . . . . . . . . . . . . . . . . . . 54,488 160 10,946 511 1,215 2,059 2,960 4,201 19,631 12,971 7,152 2,969 610 46 32nd child . . . . . . . . . . . . . . . . . . . . . . . . 45,192 1 2,045 15 83 216 576 1,155 12,995 14,506 10,022 4,604 962 55 23rd child . . . . . . . . . . . . . . . . . . . . . . . . 26,368 – 291 1 3 15 68 204 4,876 8,806 7,412 4,056 878 47 24th child . . . . . . . . . . . . . . . . . . . . . . . . 11,569 – 31 – – 3 6 22 1,323 3,654 3,752 2,244 537 23 55th child . . . . . . . . . . . . . . . . . . . . . . . . 4,425 – 5 – – – – 5 319 1,200 1,494 1,094 291 16 66th child . . . . . . . . . . . . . . . . . . . . . . . . 1,772 – 1 – – – – 1 75 424 595 501 173 2 17th child . . . . . . . . . . . . . . . . . . . . . . . . 686 – – – – – – – 17 133 240 220 73 3 –8th child and over . . . . . . . . . . . . . . . . 560 – 2 – – – – 2 7 63 189 207 87 5 –Not stated . . . . . . . . . . . . . . . . . . . . . . . 321 – 22 1 – 2 6 13 79 82 76 46 15 1 –
– Quantity zero.
NOTE: In this table, Hispanic women are classified by place of origin only; non-Hispanic women are not shown; see Technical Notes.
SOURCE: NCHS, National Vital Statistics System, Natality.
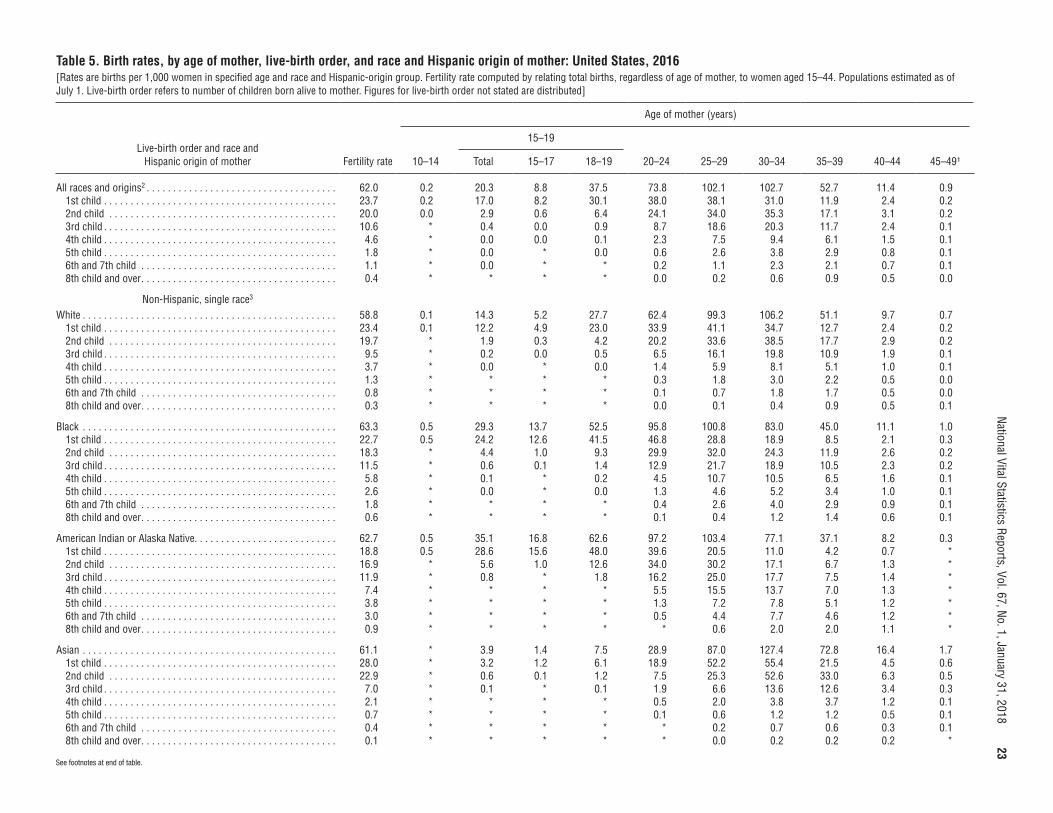
National Vital Statistics Reports, Vol. 67, No. 1, January 31, 2018
23Table 5. Birth rates, by age of mother, live-birth order, and race and Hispanic origin of mother: United States, 2016[Rates are births per 1,000 women in specified age and race and Hispanic-origin group. Fertility rate computed by relating total births, regardless of age of mother, to women aged 15–44. Populations estimated as of July 1. Live-birth order refers to number of children born alive to mother. Figures for live-birth order not stated are distributed]
Age of mother (years)
Live-birth order and race and Hispanic origin of mother Fertility rate 10–14
15–19
20–24 25–29 30–34 35–39 40–44 45–49¹Total 15–17 18–19
All races and origins2 . . . . . . . . . . . . . . . . . . . . . . . . . . . . . . . . . . . . 62.0 0.2 20.3 8.8 37.5 73.8 102.1 102.7 52.7 11.4 0.91st child . . . . . . . . . . . . . . . . . . . . . . . . . . . . . . . . . . . . . . . . . . . . 23.7 0.2 17.0 8.2 30.1 38.0 38.1 31.0 11.9 2.4 0.22nd child . . . . . . . . . . . . . . . . . . . . . . . . . . . . . . . . . . . . . . . . . . . 20.0 0.0 2.9 0.6 6.4 24.1 34.0 35.3 17.1 3.1 0.23rd child . . . . . . . . . . . . . . . . . . . . . . . . . . . . . . . . . . . . . . . . . . . . 10.6 * 0.4 0.0 0.9 8.7 18.6 20.3 11.7 2.4 0.14th child . . . . . . . . . . . . . . . . . . . . . . . . . . . . . . . . . . . . . . . . . . . . 4.6 * 0.0 0.0 0.1 2.3 7.5 9.4 6.1 1.5 0.15th child . . . . . . . . . . . . . . . . . . . . . . . . . . . . . . . . . . . . . . . . . . . . 1.8 * 0.0 * 0.0 0.6 2.6 3.8 2.9 0.8 0.16th and 7th child . . . . . . . . . . . . . . . . . . . . . . . . . . . . . . . . . . . . . 1.1 * 0.0 * * 0.2 1.1 2.3 2.1 0.7 0.18th child and over . . . . . . . . . . . . . . . . . . . . . . . . . . . . . . . . . . . . . 0.4 * * * * 0.0 0.2 0.6 0.9 0.5 0.0
Non-Hispanic, single race3
White . . . . . . . . . . . . . . . . . . . . . . . . . . . . . . . . . . . . . . . . . . . . . . . . 58.8 0.1 14.3 5.2 27.7 62.4 99.3 106.2 51.1 9.7 0.71st child . . . . . . . . . . . . . . . . . . . . . . . . . . . . . . . . . . . . . . . . . . . . 23.4 0.1 12.2 4.9 23.0 33.9 41.1 34.7 12.7 2.4 0.22nd child . . . . . . . . . . . . . . . . . . . . . . . . . . . . . . . . . . . . . . . . . . . 19.7 * 1.9 0.3 4.2 20.2 33.6 38.5 17.7 2.9 0.23rd child . . . . . . . . . . . . . . . . . . . . . . . . . . . . . . . . . . . . . . . . . . . . 9.5 * 0.2 0.0 0.5 6.5 16.1 19.8 10.9 1.9 0.14th child . . . . . . . . . . . . . . . . . . . . . . . . . . . . . . . . . . . . . . . . . . . . 3.7 * 0.0 * 0.0 1.4 5.9 8.1 5.1 1.0 0.15th child . . . . . . . . . . . . . . . . . . . . . . . . . . . . . . . . . . . . . . . . . . . . 1.3 * * * * 0.3 1.8 3.0 2.2 0.5 0.06th and 7th child . . . . . . . . . . . . . . . . . . . . . . . . . . . . . . . . . . . . . 0.8 * * * * 0.1 0.7 1.8 1.7 0.5 0.08th child and over . . . . . . . . . . . . . . . . . . . . . . . . . . . . . . . . . . . . . 0.3 * * * * 0.0 0.1 0.4 0.9 0.5 0.1
Black . . . . . . . . . . . . . . . . . . . . . . . . . . . . . . . . . . . . . . . . . . . . . . . . 63.3 0.5 29.3 13.7 52.5 95.8 100.8 83.0 45.0 11.1 1.01st child . . . . . . . . . . . . . . . . . . . . . . . . . . . . . . . . . . . . . . . . . . . . 22.7 0.5 24.2 12.6 41.5 46.8 28.8 18.9 8.5 2.1 0.32nd child . . . . . . . . . . . . . . . . . . . . . . . . . . . . . . . . . . . . . . . . . . . 18.3 * 4.4 1.0 9.3 29.9 32.0 24.3 11.9 2.6 0.23rd child . . . . . . . . . . . . . . . . . . . . . . . . . . . . . . . . . . . . . . . . . . . . 11.5 * 0.6 0.1 1.4 12.9 21.7 18.9 10.5 2.3 0.24th child . . . . . . . . . . . . . . . . . . . . . . . . . . . . . . . . . . . . . . . . . . . . 5.8 * 0.1 * 0.2 4.5 10.7 10.5 6.5 1.6 0.15th child . . . . . . . . . . . . . . . . . . . . . . . . . . . . . . . . . . . . . . . . . . . . 2.6 * 0.0 * 0.0 1.3 4.6 5.2 3.4 1.0 0.16th and 7th child . . . . . . . . . . . . . . . . . . . . . . . . . . . . . . . . . . . . . 1.8 * * * * 0.4 2.6 4.0 2.9 0.9 0.18th child and over . . . . . . . . . . . . . . . . . . . . . . . . . . . . . . . . . . . . . 0.6 * * * * 0.1 0.4 1.2 1.4 0.6 0.1
American Indian or Alaska Native . . . . . . . . . . . . . . . . . . . . . . . . . . . 62.7 0.5 35.1 16.8 62.6 97.2 103.4 77.1 37.1 8.2 0.31st child . . . . . . . . . . . . . . . . . . . . . . . . . . . . . . . . . . . . . . . . . . . . 18.8 0.5 28.6 15.6 48.0 39.6 20.5 11.0 4.2 0.7 *2nd child . . . . . . . . . . . . . . . . . . . . . . . . . . . . . . . . . . . . . . . . . . . 16.9 * 5.6 1.0 12.6 34.0 30.2 17.1 6.7 1.3 *3rd child . . . . . . . . . . . . . . . . . . . . . . . . . . . . . . . . . . . . . . . . . . . . 11.9 * 0.8 * 1.8 16.2 25.0 17.7 7.5 1.4 *4th child . . . . . . . . . . . . . . . . . . . . . . . . . . . . . . . . . . . . . . . . . . . . 7.4 * * * * 5.5 15.5 13.7 7.0 1.3 *5th child . . . . . . . . . . . . . . . . . . . . . . . . . . . . . . . . . . . . . . . . . . . . 3.8 * * * * 1.3 7.2 7.8 5.1 1.2 *6th and 7th child . . . . . . . . . . . . . . . . . . . . . . . . . . . . . . . . . . . . . 3.0 * * * * 0.5 4.4 7.7 4.6 1.2 *8th child and over . . . . . . . . . . . . . . . . . . . . . . . . . . . . . . . . . . . . . 0.9 * * * * * 0.6 2.0 2.0 1.1 *
Asian . . . . . . . . . . . . . . . . . . . . . . . . . . . . . . . . . . . . . . . . . . . . . . . . 61.1 * 3.9 1.4 7.5 28.9 87.0 127.4 72.8 16.4 1.71st child . . . . . . . . . . . . . . . . . . . . . . . . . . . . . . . . . . . . . . . . . . . . 28.0 * 3.2 1.2 6.1 18.9 52.2 55.4 21.5 4.5 0.62nd child . . . . . . . . . . . . . . . . . . . . . . . . . . . . . . . . . . . . . . . . . . . 22.9 * 0.6 0.1 1.2 7.5 25.3 52.6 33.0 6.3 0.53rd child . . . . . . . . . . . . . . . . . . . . . . . . . . . . . . . . . . . . . . . . . . . . 7.0 * 0.1 * 0.1 1.9 6.6 13.6 12.6 3.4 0.34th child . . . . . . . . . . . . . . . . . . . . . . . . . . . . . . . . . . . . . . . . . . . . 2.1 * * * * 0.5 2.0 3.8 3.7 1.2 0.15th child . . . . . . . . . . . . . . . . . . . . . . . . . . . . . . . . . . . . . . . . . . . . 0.7 * * * * 0.1 0.6 1.2 1.2 0.5 0.16th and 7th child . . . . . . . . . . . . . . . . . . . . . . . . . . . . . . . . . . . . . 0.4 * * * * * 0.2 0.7 0.6 0.3 0.18th child and over . . . . . . . . . . . . . . . . . . . . . . . . . . . . . . . . . . . . . 0.1 * * * * * 0.0 0.2 0.2 0.2 *
See footnotes at end of table.
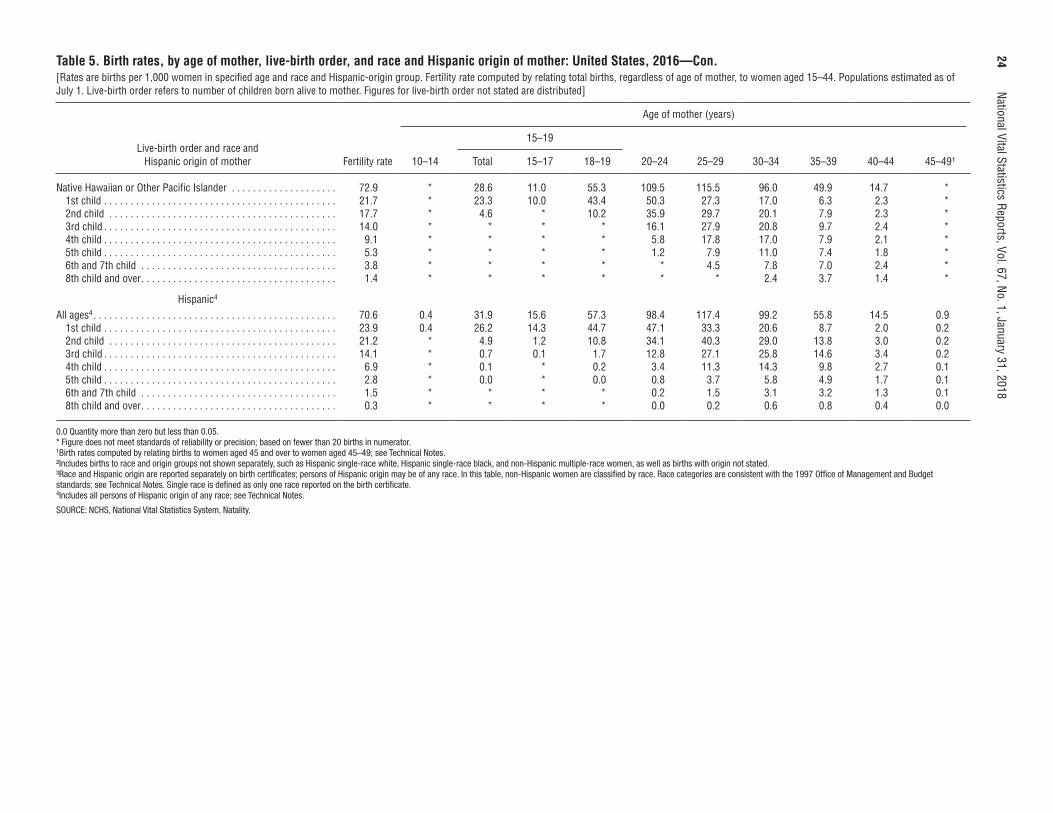
24
National Vital Statistics Reports, Vol. 67, No. 1, January 31, 2018Table 5. Birth rates, by age of mother, live-birth order, and race and Hispanic origin of mother: United States, 2016—Con.[Rates are births per 1,000 women in specified age and race and Hispanic-origin group. Fertility rate computed by relating total births, regardless of age of mother, to women aged 15–44. Populations estimated as of July 1. Live-birth order refers to number of children born alive to mother. Figures for live-birth order not stated are distributed]
Age of mother (years)
Live-birth order and race and Hispanic origin of mother Fertility rate 10–14
15–19
20–24 25–29 30–34 35–39 40–44 45–49¹Total 15–17 18–19
Native Hawaiian or Other Pacific Islander . . . . . . . . . . . . . . . . . . . . 72.9 * 28.6 11.0 55.3 109.5 115.5 96.0 49.9 14.7 *1st child . . . . . . . . . . . . . . . . . . . . . . . . . . . . . . . . . . . . . . . . . . . . 21.7 * 23.3 10.0 43.4 50.3 27.3 17.0 6.3 2.3 *2nd child . . . . . . . . . . . . . . . . . . . . . . . . . . . . . . . . . . . . . . . . . . . 17.7 * 4.6 * 10.2 35.9 29.7 20.1 7.9 2.3 *3rd child . . . . . . . . . . . . . . . . . . . . . . . . . . . . . . . . . . . . . . . . . . . . 14.0 * * * * 16.1 27.9 20.8 9.7 2.4 *4th child . . . . . . . . . . . . . . . . . . . . . . . . . . . . . . . . . . . . . . . . . . . . 9.1 * * * * 5.8 17.8 17.0 7.9 2.1 *5th child . . . . . . . . . . . . . . . . . . . . . . . . . . . . . . . . . . . . . . . . . . . . 5.3 * * * * 1.2 7.9 11.0 7.4 1.8 *6th and 7th child . . . . . . . . . . . . . . . . . . . . . . . . . . . . . . . . . . . . . 3.8 * * * * * 4.5 7.8 7.0 2.4 *8th child and over . . . . . . . . . . . . . . . . . . . . . . . . . . . . . . . . . . . . . 1.4 * * * * * * 2.4 3.7 1.4 *
Hispanic4
All ages4 . . . . . . . . . . . . . . . . . . . . . . . . . . . . . . . . . . . . . . . . . . . . . . 70.6 0.4 31.9 15.6 57.3 98.4 117.4 99.2 55.8 14.5 0.91st child . . . . . . . . . . . . . . . . . . . . . . . . . . . . . . . . . . . . . . . . . . . . 23.9 0.4 26.2 14.3 44.7 47.1 33.3 20.6 8.7 2.0 0.22nd child . . . . . . . . . . . . . . . . . . . . . . . . . . . . . . . . . . . . . . . . . . . 21.2 * 4.9 1.2 10.8 34.1 40.3 29.0 13.8 3.0 0.23rd child . . . . . . . . . . . . . . . . . . . . . . . . . . . . . . . . . . . . . . . . . . . . 14.1 * 0.7 0.1 1.7 12.8 27.1 25.8 14.6 3.4 0.24th child . . . . . . . . . . . . . . . . . . . . . . . . . . . . . . . . . . . . . . . . . . . . 6.9 * 0.1 * 0.2 3.4 11.3 14.3 9.8 2.7 0.15th child . . . . . . . . . . . . . . . . . . . . . . . . . . . . . . . . . . . . . . . . . . . . 2.8 * 0.0 * 0.0 0.8 3.7 5.8 4.9 1.7 0.16th and 7th child . . . . . . . . . . . . . . . . . . . . . . . . . . . . . . . . . . . . . 1.5 * * * * 0.2 1.5 3.1 3.2 1.3 0.18th child and over . . . . . . . . . . . . . . . . . . . . . . . . . . . . . . . . . . . . . 0.3 * * * * 0.0 0.2 0.6 0.8 0.4 0.0
0.0 Quantity more than zero but less than 0.05.* Figure does not meet standards of reliability or precision; based on fewer than 20 births in numerator. 1Birth rates computed by relating births to women aged 45 and over to women aged 45–49; see Technical Notes. ²Includes births to race and origin groups not shown separately, such as Hispanic single-race white, Hispanic single-race black, and non-Hispanic multiple-race women, as well as births with origin not stated. ³Race and Hispanic origin are reported separately on birth certificates; persons of Hispanic origin may be of any race. In this table, non-Hispanic women are classified by race. Race categories are consistent with the 1997 Office of Management and Budget standards; see Technical Notes. Single race is defined as only one race reported on the birth certificate. 4Includes all persons of Hispanic origin of any race; see Technical Notes.
SOURCE: NCHS, National Vital Statistics System, Natality.
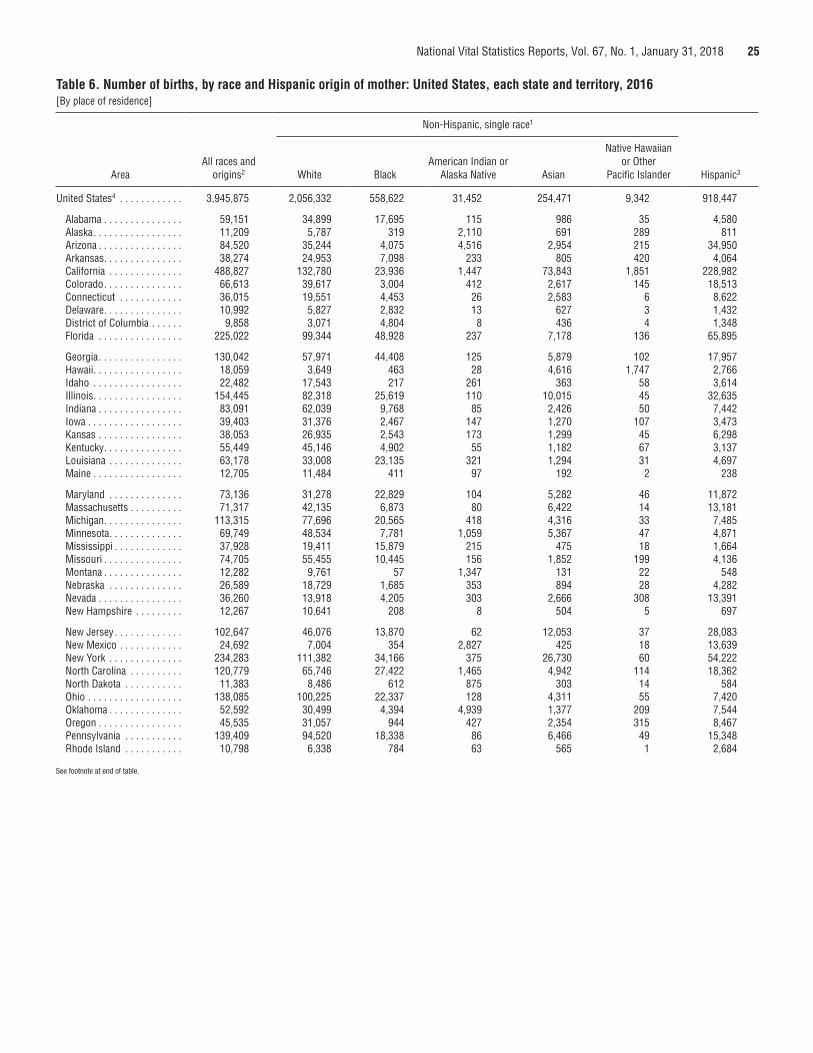
National Vital Statistics Reports, Vol. 67, No. 1, January 31, 2018 25
Table 6. Number of births, by race and Hispanic origin of mother: United States, each state and territory, 2016[By place of residence]
AreaAll races and
origins2
Non-Hispanic, single race1
Hispanic3White BlackAmerican Indian or
Alaska Native Asian
Native Hawaiian or Other
Pacific Islander
United States4 . . . . . . . . . . . . 3,945,875 2,056,332 558,622 31,452 254,471 9,342 918,447
Alabama . . . . . . . . . . . . . . . 59,151 34,899 17,695 115 986 35 4,580Alaska . . . . . . . . . . . . . . . . . 11,209 5,787 319 2,110 691 289 811Arizona . . . . . . . . . . . . . . . . 84,520 35,244 4,075 4,516 2,954 215 34,950Arkansas . . . . . . . . . . . . . . . 38,274 24,953 7,098 233 805 420 4,064California . . . . . . . . . . . . . . 488,827 132,780 23,936 1,447 73,843 1,851 228,982Colorado . . . . . . . . . . . . . . . 66,613 39,617 3,004 412 2,617 145 18,513Connecticut . . . . . . . . . . . . 36,015 19,551 4,453 26 2,583 6 8,622Delaware . . . . . . . . . . . . . . . 10,992 5,827 2,832 13 627 3 1,432District of Columbia . . . . . . 9,858 3,071 4,804 8 436 4 1,348Florida . . . . . . . . . . . . . . . . 225,022 99,344 48,928 237 7,178 136 65,895
Georgia . . . . . . . . . . . . . . . . 130,042 57,971 44,408 125 5,879 102 17,957Hawaii . . . . . . . . . . . . . . . . . 18,059 3,649 463 28 4,616 1,747 2,766Idaho . . . . . . . . . . . . . . . . . 22,482 17,543 217 261 363 58 3,614Illinois . . . . . . . . . . . . . . . . . 154,445 82,318 25,619 110 10,015 45 32,635Indiana . . . . . . . . . . . . . . . . 83,091 62,039 9,768 85 2,426 50 7,442Iowa . . . . . . . . . . . . . . . . . . 39,403 31,376 2,467 147 1,270 107 3,473Kansas . . . . . . . . . . . . . . . . 38,053 26,935 2,543 173 1,299 45 6,298Kentucky . . . . . . . . . . . . . . . 55,449 45,146 4,902 55 1,182 67 3,137Louisiana . . . . . . . . . . . . . . 63,178 33,008 23,135 321 1,294 31 4,697Maine . . . . . . . . . . . . . . . . . 12,705 11,484 411 97 192 2 238
Maryland . . . . . . . . . . . . . . 73,136 31,278 22,829 104 5,282 46 11,872Massachusetts . . . . . . . . . . 71,317 42,135 6,873 80 6,422 14 13,181Michigan . . . . . . . . . . . . . . . 113,315 77,696 20,565 418 4,316 33 7,485Minnesota . . . . . . . . . . . . . . 69,749 48,534 7,781 1,059 5,367 47 4,871Mississippi . . . . . . . . . . . . . 37,928 19,411 15,879 215 475 18 1,664Missouri . . . . . . . . . . . . . . . 74,705 55,455 10,445 156 1,852 199 4,136Montana . . . . . . . . . . . . . . . 12,282 9,761 57 1,347 131 22 548Nebraska . . . . . . . . . . . . . . 26,589 18,729 1,685 353 894 28 4,282Nevada . . . . . . . . . . . . . . . . 36,260 13,918 4,205 303 2,666 308 13,391New Hampshire . . . . . . . . . 12,267 10,641 208 8 504 5 697
New Jersey . . . . . . . . . . . . . 102,647 46,076 13,870 62 12,053 37 28,083New Mexico . . . . . . . . . . . . 24,692 7,004 354 2,827 425 18 13,639New York . . . . . . . . . . . . . . 234,283 111,382 34,166 375 26,730 60 54,222North Carolina . . . . . . . . . . 120,779 65,746 27,422 1,465 4,942 114 18,362North Dakota . . . . . . . . . . . 11,383 8,486 612 875 303 14 584Ohio . . . . . . . . . . . . . . . . . . 138,085 100,225 22,337 128 4,311 55 7,420Oklahoma . . . . . . . . . . . . . . 52,592 30,499 4,394 4,939 1,377 209 7,544Oregon . . . . . . . . . . . . . . . . 45,535 31,057 944 427 2,354 315 8,467Pennsylvania . . . . . . . . . . . 139,409 94,520 18,338 86 6,466 49 15,348Rhode Island . . . . . . . . . . . 10,798 6,338 784 63 565 1 2,684
See footnote at end of table.
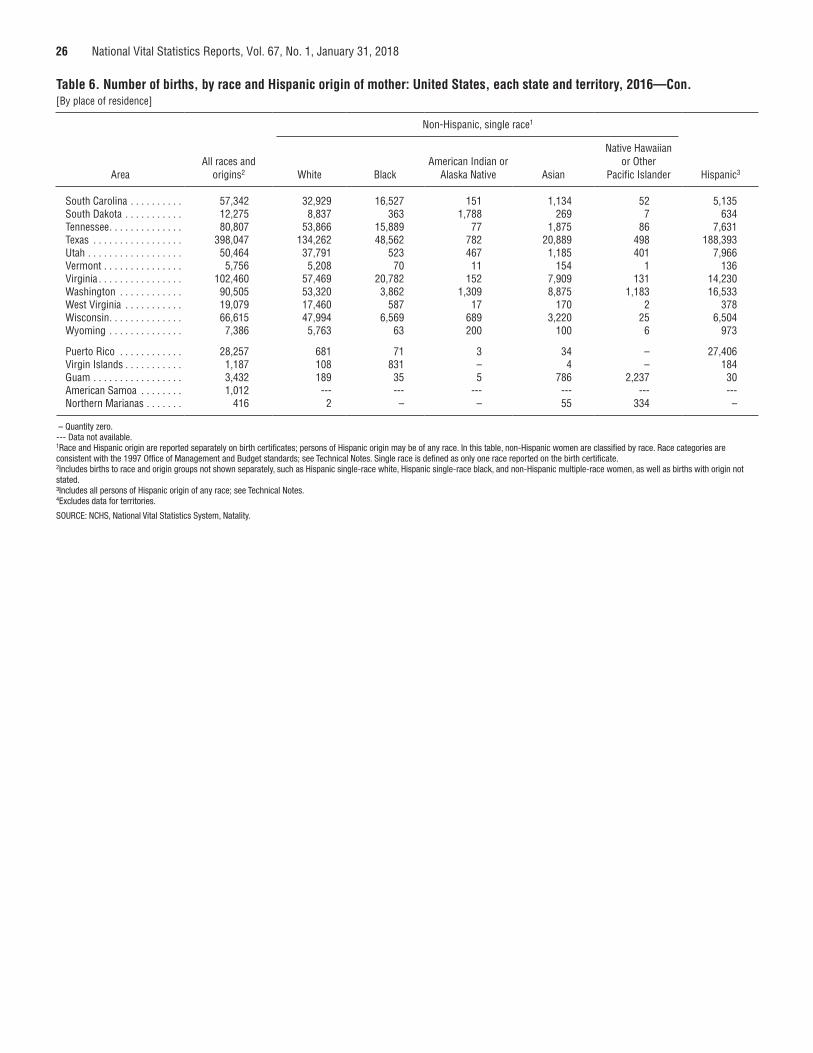
26 National Vital Statistics Reports, Vol. 67, No. 1, January 31, 2018
Table 6. Number of births, by race and Hispanic origin of mother: United States, each state and territory, 2016—Con.[By place of residence]
AreaAll races and
origins2
Non-Hispanic, single race1
Hispanic3White BlackAmerican Indian or
Alaska Native Asian
Native Hawaiian or Other
Pacific Islander
South Carolina . . . . . . . . . . 57,342 32,929 16,527 151 1,134 52 5,135South Dakota . . . . . . . . . . . 12,275 8,837 363 1,788 269 7 634Tennessee . . . . . . . . . . . . . . 80,807 53,866 15,889 77 1,875 86 7,631Texas . . . . . . . . . . . . . . . . . 398,047 134,262 48,562 782 20,889 498 188,393Utah . . . . . . . . . . . . . . . . . . 50,464 37,791 523 467 1,185 401 7,966Vermont . . . . . . . . . . . . . . . 5,756 5,208 70 11 154 1 136Virginia . . . . . . . . . . . . . . . . 102,460 57,469 20,782 152 7,909 131 14,230Washington . . . . . . . . . . . . 90,505 53,320 3,862 1,309 8,875 1,183 16,533West Virginia . . . . . . . . . . . 19,079 17,460 587 17 170 2 378Wisconsin . . . . . . . . . . . . . . 66,615 47,994 6,569 689 3,220 25 6,504Wyoming . . . . . . . . . . . . . . 7,386 5,763 63 200 100 6 973
Puerto Rico . . . . . . . . . . . . 28,257 681 71 3 34 – 27,406Virgin Islands . . . . . . . . . . . 1,187 108 831 – 4 – 184Guam . . . . . . . . . . . . . . . . . 3,432 189 35 5 786 2,237 30American Samoa . . . . . . . . 1,012 --- --- --- --- --- ---Northern Marianas . . . . . . . 416 2 – – 55 334 –
– Quantity zero. --- Data not available. 1Race and Hispanic origin are reported separately on birth certificates; persons of Hispanic origin may be of any race. In this table, non-Hispanic women are classified by race. Race categories are consistent with the 1997 Office of Management and Budget standards; see Technical Notes. Single race is defined as only one race reported on the birth certificate. 2Includes births to race and origin groups not shown separately, such as Hispanic single-race white, Hispanic single-race black, and non-Hispanic multiple-race women, as well as births with origin not stated. ³Includes all persons of Hispanic origin of any race; see Technical Notes. 4Excludes data for territories.
SOURCE: NCHS, National Vital Statistics System, Natality.
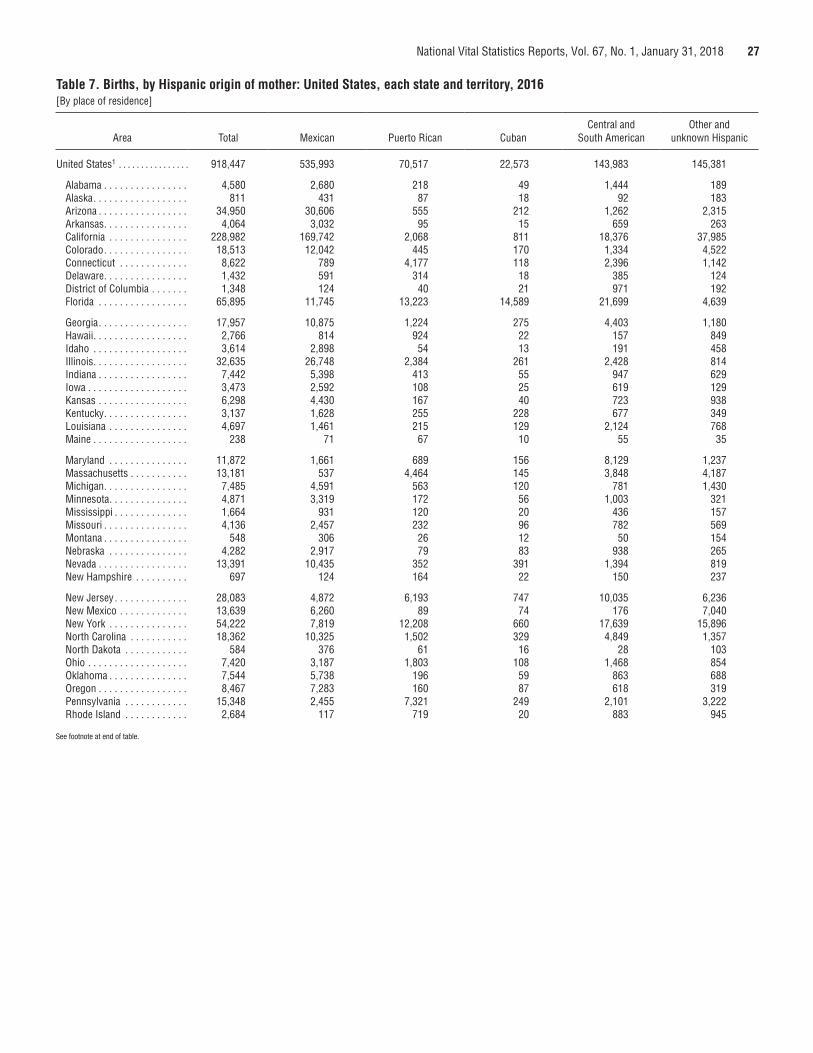
National Vital Statistics Reports, Vol. 67, No. 1, January 31, 2018 27
Table 7. Births, by Hispanic origin of mother: United States, each state and territory, 2016[By place of residence]
Area Total Mexican Puerto Rican CubanCentral and
South AmericanOther and
unknown Hispanic
United States1 . . . . . . . . . . . . . . . . 918,447 535,993 70,517 22,573 143,983 145,381
Alabama . . . . . . . . . . . . . . . . 4,580 2,680 218 49 1,444 189Alaska . . . . . . . . . . . . . . . . . . 811 431 87 18 92 183Arizona . . . . . . . . . . . . . . . . . 34,950 30,606 555 212 1,262 2,315Arkansas . . . . . . . . . . . . . . . . 4,064 3,032 95 15 659 263California . . . . . . . . . . . . . . . 228,982 169,742 2,068 811 18,376 37,985Colorado . . . . . . . . . . . . . . . . 18,513 12,042 445 170 1,334 4,522Connecticut . . . . . . . . . . . . . 8,622 789 4,177 118 2,396 1,142Delaware . . . . . . . . . . . . . . . . 1,432 591 314 18 385 124District of Columbia . . . . . . . 1,348 124 40 21 971 192Florida . . . . . . . . . . . . . . . . . 65,895 11,745 13,223 14,589 21,699 4,639
Georgia . . . . . . . . . . . . . . . . . 17,957 10,875 1,224 275 4,403 1,180Hawaii . . . . . . . . . . . . . . . . . . 2,766 814 924 22 157 849Idaho . . . . . . . . . . . . . . . . . . 3,614 2,898 54 13 191 458Illinois . . . . . . . . . . . . . . . . . . 32,635 26,748 2,384 261 2,428 814Indiana . . . . . . . . . . . . . . . . . 7,442 5,398 413 55 947 629Iowa . . . . . . . . . . . . . . . . . . . 3,473 2,592 108 25 619 129Kansas . . . . . . . . . . . . . . . . . 6,298 4,430 167 40 723 938Kentucky . . . . . . . . . . . . . . . . 3,137 1,628 255 228 677 349Louisiana . . . . . . . . . . . . . . . 4,697 1,461 215 129 2,124 768Maine . . . . . . . . . . . . . . . . . . 238 71 67 10 55 35
Maryland . . . . . . . . . . . . . . . 11,872 1,661 689 156 8,129 1,237Massachusetts . . . . . . . . . . . 13,181 537 4,464 145 3,848 4,187Michigan . . . . . . . . . . . . . . . . 7,485 4,591 563 120 781 1,430Minnesota . . . . . . . . . . . . . . . 4,871 3,319 172 56 1,003 321Mississippi . . . . . . . . . . . . . . 1,664 931 120 20 436 157Missouri . . . . . . . . . . . . . . . . 4,136 2,457 232 96 782 569Montana . . . . . . . . . . . . . . . . 548 306 26 12 50 154Nebraska . . . . . . . . . . . . . . . 4,282 2,917 79 83 938 265Nevada . . . . . . . . . . . . . . . . . 13,391 10,435 352 391 1,394 819New Hampshire . . . . . . . . . . 697 124 164 22 150 237
New Jersey . . . . . . . . . . . . . . 28,083 4,872 6,193 747 10,035 6,236New Mexico . . . . . . . . . . . . . 13,639 6,260 89 74 176 7,040New York . . . . . . . . . . . . . . . 54,222 7,819 12,208 660 17,639 15,896North Carolina . . . . . . . . . . . 18,362 10,325 1,502 329 4,849 1,357North Dakota . . . . . . . . . . . . 584 376 61 16 28 103Ohio . . . . . . . . . . . . . . . . . . . 7,420 3,187 1,803 108 1,468 854Oklahoma . . . . . . . . . . . . . . . 7,544 5,738 196 59 863 688Oregon . . . . . . . . . . . . . . . . . 8,467 7,283 160 87 618 319Pennsylvania . . . . . . . . . . . . 15,348 2,455 7,321 249 2,101 3,222Rhode Island . . . . . . . . . . . . 2,684 117 719 20 883 945
See footnote at end of table.
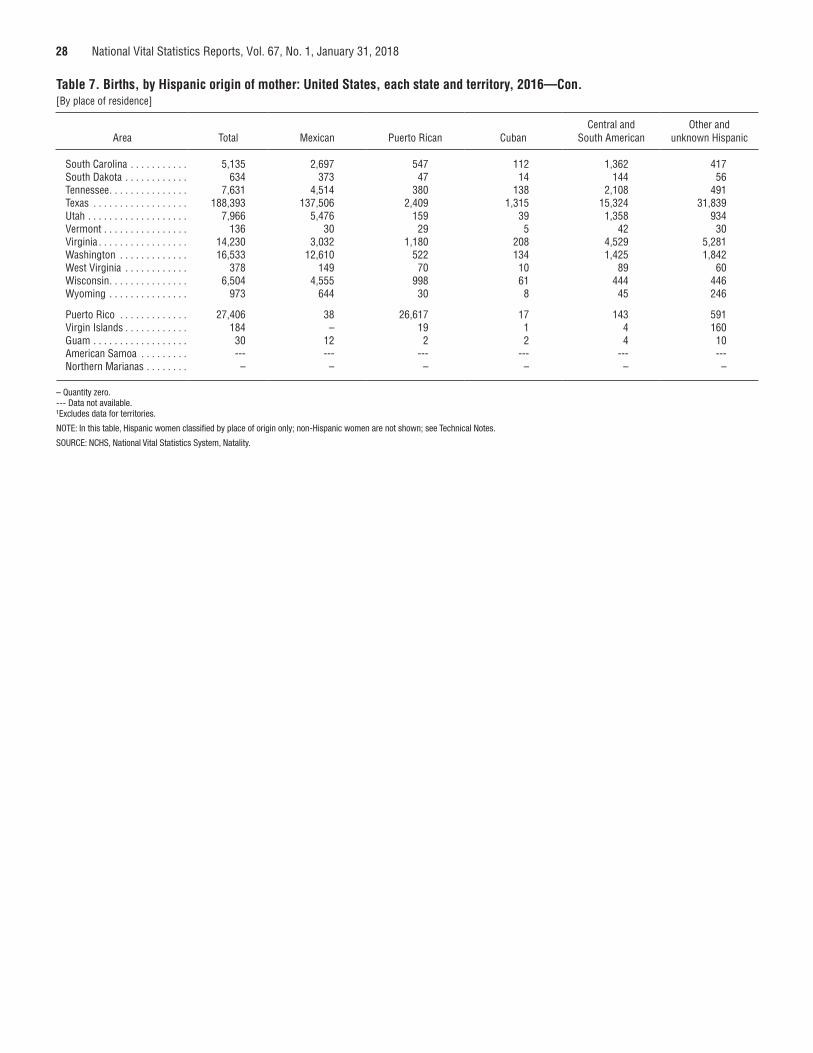
28 National Vital Statistics Reports, Vol. 67, No. 1, January 31, 2018
Table 7. Births, by Hispanic origin of mother: United States, each state and territory, 2016—Con.[By place of residence]
Area Total Mexican Puerto Rican CubanCentral and
South AmericanOther and
unknown Hispanic
South Carolina . . . . . . . . . . . 5,135 2,697 547 112 1,362 417South Dakota . . . . . . . . . . . . 634 373 47 14 144 56Tennessee . . . . . . . . . . . . . . . 7,631 4,514 380 138 2,108 491Texas . . . . . . . . . . . . . . . . . . 188,393 137,506 2,409 1,315 15,324 31,839Utah . . . . . . . . . . . . . . . . . . . 7,966 5,476 159 39 1,358 934Vermont . . . . . . . . . . . . . . . . 136 30 29 5 42 30Virginia . . . . . . . . . . . . . . . . . 14,230 3,032 1,180 208 4,529 5,281Washington . . . . . . . . . . . . . 16,533 12,610 522 134 1,425 1,842West Virginia . . . . . . . . . . . . 378 149 70 10 89 60Wisconsin . . . . . . . . . . . . . . . 6,504 4,555 998 61 444 446Wyoming . . . . . . . . . . . . . . . 973 644 30 8 45 246
Puerto Rico . . . . . . . . . . . . . 27,406 38 26,617 17 143 591Virgin Islands . . . . . . . . . . . . 184 – 19 1 4 160Guam . . . . . . . . . . . . . . . . . . 30 12 2 2 4 10American Samoa . . . . . . . . . --- --- --- --- --- ---Northern Marianas . . . . . . . . – – – – – –
– Quantity zero.--- Data not available.¹Excludes data for territories.
NOTE: In this table, Hispanic women classified by place of origin only; non-Hispanic women are not shown; see Technical Notes.
SOURCE: NCHS, National Vital Statistics System, Natality.
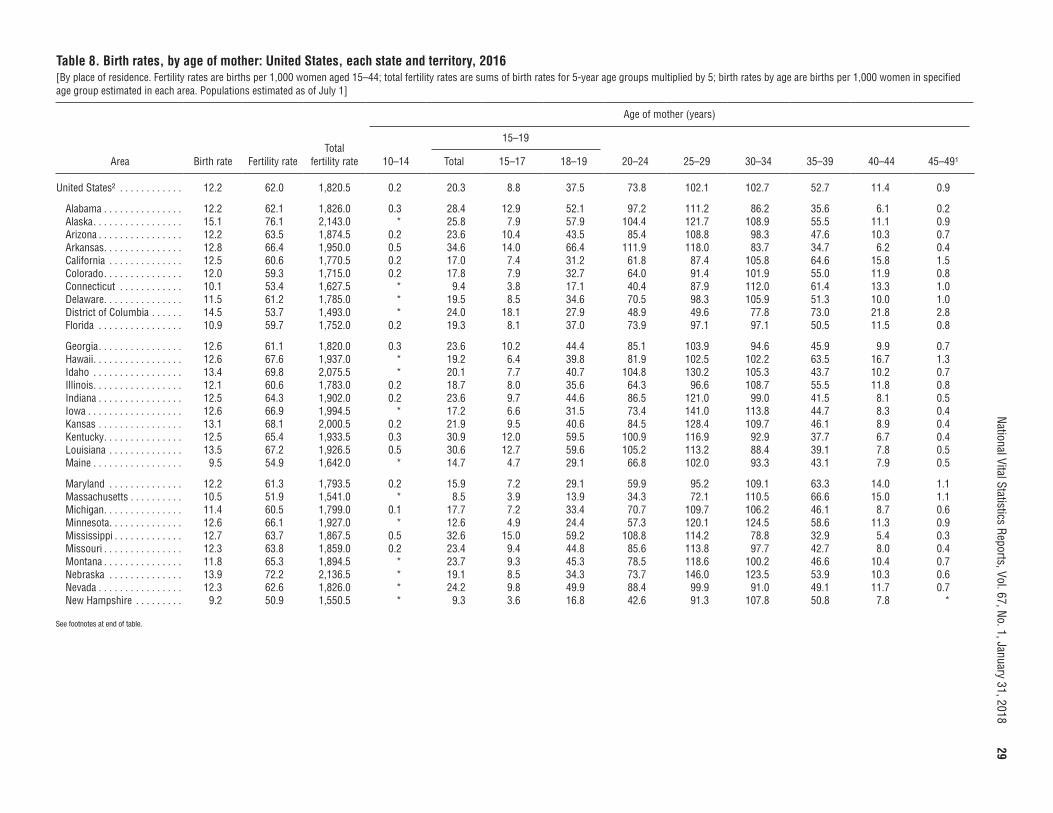
National Vital Statistics Reports, Vol. 67, No. 1, January 31, 2018
29Table 8. Birth rates, by age of mother: United States, each state and territory, 2016[By place of residence. Fertility rates are births per 1,000 women aged 15–44; total fertility rates are sums of birth rates for 5-year age groups multiplied by 5; birth rates by age are births per 1,000 women in specified age group estimated in each area. Populations estimated as of July 1]
Age of mother (years)
Area Birth rate Fertility rateTotal
fertility rate 10–14
15–19
20–24 25–29 30–34 35–39 40–44 45–49¹Total 15–17 18–19
United States² . . . . . . . . . . . . 12.2 62.0 1,820.5 0.2 20.3 8.8 37.5 73.8 102.1 102.7 52.7 11.4 0.9
Alabama . . . . . . . . . . . . . . . 12.2 62.1 1,826.0 0.3 28.4 12.9 52.1 97.2 111.2 86.2 35.6 6.1 0.2Alaska . . . . . . . . . . . . . . . . . 15.1 76.1 2,143.0 * 25.8 7.9 57.9 104.4 121.7 108.9 55.5 11.1 0.9Arizona . . . . . . . . . . . . . . . . 12.2 63.5 1,874.5 0.2 23.6 10.4 43.5 85.4 108.8 98.3 47.6 10.3 0.7Arkansas . . . . . . . . . . . . . . . 12.8 66.4 1,950.0 0.5 34.6 14.0 66.4 111.9 118.0 83.7 34.7 6.2 0.4California . . . . . . . . . . . . . . 12.5 60.6 1,770.5 0.2 17.0 7.4 31.2 61.8 87.4 105.8 64.6 15.8 1.5Colorado . . . . . . . . . . . . . . . 12.0 59.3 1,715.0 0.2 17.8 7.9 32.7 64.0 91.4 101.9 55.0 11.9 0.8Connecticut . . . . . . . . . . . . 10.1 53.4 1,627.5 * 9.4 3.8 17.1 40.4 87.9 112.0 61.4 13.3 1.0Delaware . . . . . . . . . . . . . . . 11.5 61.2 1,785.0 * 19.5 8.5 34.6 70.5 98.3 105.9 51.3 10.0 1.0District of Columbia . . . . . . 14.5 53.7 1,493.0 * 24.0 18.1 27.9 48.9 49.6 77.8 73.0 21.8 2.8Florida . . . . . . . . . . . . . . . . 10.9 59.7 1,752.0 0.2 19.3 8.1 37.0 73.9 97.1 97.1 50.5 11.5 0.8
Georgia . . . . . . . . . . . . . . . . 12.6 61.1 1,820.0 0.3 23.6 10.2 44.4 85.1 103.9 94.6 45.9 9.9 0.7Hawaii . . . . . . . . . . . . . . . . . 12.6 67.6 1,937.0 * 19.2 6.4 39.8 81.9 102.5 102.2 63.5 16.7 1.3Idaho . . . . . . . . . . . . . . . . . 13.4 69.8 2,075.5 * 20.1 7.7 40.7 104.8 130.2 105.3 43.7 10.2 0.7Illinois . . . . . . . . . . . . . . . . . 12.1 60.6 1,783.0 0.2 18.7 8.0 35.6 64.3 96.6 108.7 55.5 11.8 0.8Indiana . . . . . . . . . . . . . . . . 12.5 64.3 1,902.0 0.2 23.6 9.7 44.6 86.5 121.0 99.0 41.5 8.1 0.5Iowa . . . . . . . . . . . . . . . . . . 12.6 66.9 1,994.5 * 17.2 6.6 31.5 73.4 141.0 113.8 44.7 8.3 0.4Kansas . . . . . . . . . . . . . . . . 13.1 68.1 2,000.5 0.2 21.9 9.5 40.6 84.5 128.4 109.7 46.1 8.9 0.4Kentucky . . . . . . . . . . . . . . . 12.5 65.4 1,933.5 0.3 30.9 12.0 59.5 100.9 116.9 92.9 37.7 6.7 0.4Louisiana . . . . . . . . . . . . . . 13.5 67.2 1,926.5 0.5 30.6 12.7 59.6 105.2 113.2 88.4 39.1 7.8 0.5Maine . . . . . . . . . . . . . . . . . 9.5 54.9 1,642.0 * 14.7 4.7 29.1 66.8 102.0 93.3 43.1 7.9 0.5
Maryland . . . . . . . . . . . . . . 12.2 61.3 1,793.5 0.2 15.9 7.2 29.1 59.9 95.2 109.1 63.3 14.0 1.1Massachusetts . . . . . . . . . . 10.5 51.9 1,541.0 * 8.5 3.9 13.9 34.3 72.1 110.5 66.6 15.0 1.1Michigan . . . . . . . . . . . . . . . 11.4 60.5 1,799.0 0.1 17.7 7.2 33.4 70.7 109.7 106.2 46.1 8.7 0.6Minnesota . . . . . . . . . . . . . . 12.6 66.1 1,927.0 * 12.6 4.9 24.4 57.3 120.1 124.5 58.6 11.3 0.9Mississippi . . . . . . . . . . . . . 12.7 63.7 1,867.5 0.5 32.6 15.0 59.2 108.8 114.2 78.8 32.9 5.4 0.3Missouri . . . . . . . . . . . . . . . 12.3 63.8 1,859.0 0.2 23.4 9.4 44.8 85.6 113.8 97.7 42.7 8.0 0.4Montana . . . . . . . . . . . . . . . 11.8 65.3 1,894.5 * 23.7 9.3 45.3 78.5 118.6 100.2 46.6 10.4 0.7Nebraska . . . . . . . . . . . . . . 13.9 72.2 2,136.5 * 19.1 8.5 34.3 73.7 146.0 123.5 53.9 10.3 0.6Nevada . . . . . . . . . . . . . . . . 12.3 62.6 1,826.0 * 24.2 9.8 49.9 88.4 99.9 91.0 49.1 11.7 0.7New Hampshire . . . . . . . . . 9.2 50.9 1,550.5 * 9.3 3.6 16.8 42.6 91.3 107.8 50.8 7.8 *
See footnotes at end of table.
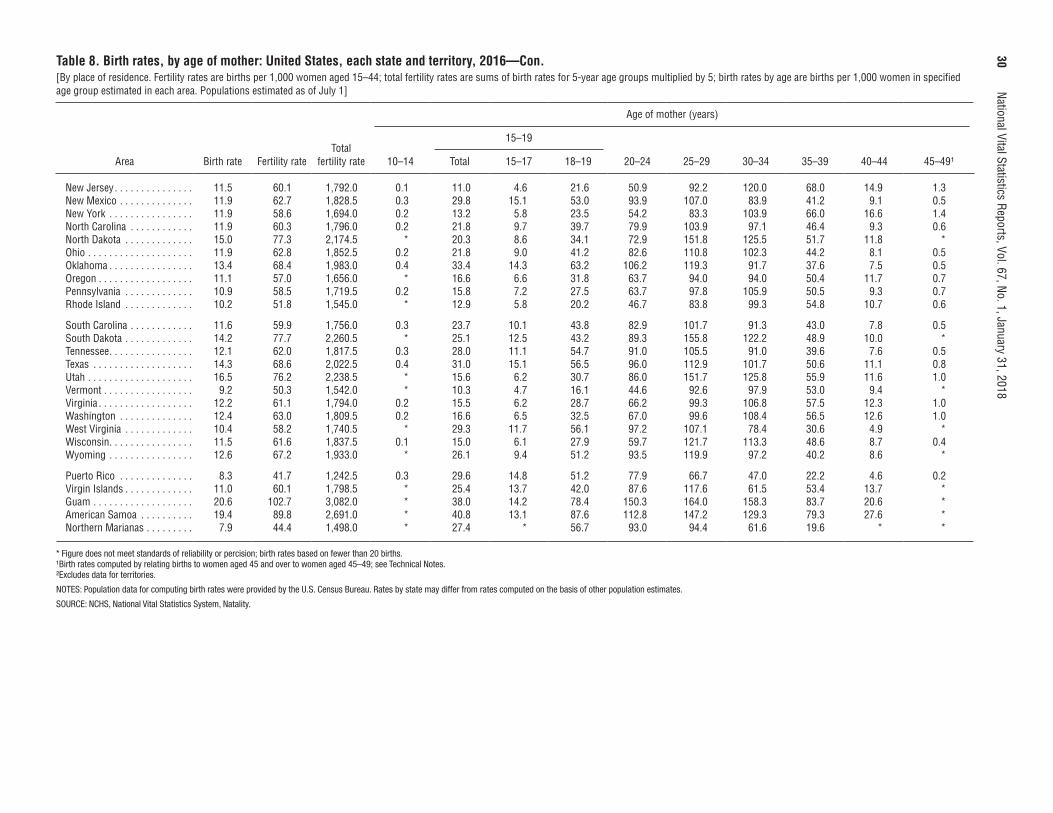
30
National Vital Statistics Reports, Vol. 67, No. 1, January 31, 2018Table 8. Birth rates, by age of mother: United States, each state and territory, 2016—Con.[By place of residence. Fertility rates are births per 1,000 women aged 15–44; total fertility rates are sums of birth rates for 5-year age groups multiplied by 5; birth rates by age are births per 1,000 women in specified age group estimated in each area. Populations estimated as of July 1]
Age of mother (years)
Area Birth rate Fertility rateTotal
fertility rate 10–14
15–19
20–24 25–29 30–34 35–39 40–44 45–49¹Total 15–17 18–19
New Jersey . . . . . . . . . . . . . . . 11.5 60.1 1,792.0 0.1 11.0 4.6 21.6 50.9 92.2 120.0 68.0 14.9 1.3New Mexico . . . . . . . . . . . . . . 11.9 62.7 1,828.5 0.3 29.8 15.1 53.0 93.9 107.0 83.9 41.2 9.1 0.5New York . . . . . . . . . . . . . . . . 11.9 58.6 1,694.0 0.2 13.2 5.8 23.5 54.2 83.3 103.9 66.0 16.6 1.4North Carolina . . . . . . . . . . . . 11.9 60.3 1,796.0 0.2 21.8 9.7 39.7 79.9 103.9 97.1 46.4 9.3 0.6North Dakota . . . . . . . . . . . . . 15.0 77.3 2,174.5 * 20.3 8.6 34.1 72.9 151.8 125.5 51.7 11.8 *Ohio . . . . . . . . . . . . . . . . . . . . 11.9 62.8 1,852.5 0.2 21.8 9.0 41.2 82.6 110.8 102.3 44.2 8.1 0.5Oklahoma . . . . . . . . . . . . . . . . 13.4 68.4 1,983.0 0.4 33.4 14.3 63.2 106.2 119.3 91.7 37.6 7.5 0.5Oregon . . . . . . . . . . . . . . . . . . 11.1 57.0 1,656.0 * 16.6 6.6 31.8 63.7 94.0 94.0 50.4 11.7 0.7Pennsylvania . . . . . . . . . . . . . 10.9 58.5 1,719.5 0.2 15.8 7.2 27.5 63.7 97.8 105.9 50.5 9.3 0.7Rhode Island . . . . . . . . . . . . . 10.2 51.8 1,545.0 * 12.9 5.8 20.2 46.7 83.8 99.3 54.8 10.7 0.6
South Carolina . . . . . . . . . . . . 11.6 59.9 1,756.0 0.3 23.7 10.1 43.8 82.9 101.7 91.3 43.0 7.8 0.5South Dakota . . . . . . . . . . . . . 14.2 77.7 2,260.5 * 25.1 12.5 43.2 89.3 155.8 122.2 48.9 10.0 *Tennessee . . . . . . . . . . . . . . . . 12.1 62.0 1,817.5 0.3 28.0 11.1 54.7 91.0 105.5 91.0 39.6 7.6 0.5Texas . . . . . . . . . . . . . . . . . . . 14.3 68.6 2,022.5 0.4 31.0 15.1 56.5 96.0 112.9 101.7 50.6 11.1 0.8Utah . . . . . . . . . . . . . . . . . . . . 16.5 76.2 2,238.5 * 15.6 6.2 30.7 86.0 151.7 125.8 55.9 11.6 1.0Vermont . . . . . . . . . . . . . . . . . 9.2 50.3 1,542.0 * 10.3 4.7 16.1 44.6 92.6 97.9 53.0 9.4 *Virginia . . . . . . . . . . . . . . . . . . 12.2 61.1 1,794.0 0.2 15.5 6.2 28.7 66.2 99.3 106.8 57.5 12.3 1.0Washington . . . . . . . . . . . . . . 12.4 63.0 1,809.5 0.2 16.6 6.5 32.5 67.0 99.6 108.4 56.5 12.6 1.0West Virginia . . . . . . . . . . . . . 10.4 58.2 1,740.5 * 29.3 11.7 56.1 97.2 107.1 78.4 30.6 4.9 *Wisconsin . . . . . . . . . . . . . . . . 11.5 61.6 1,837.5 0.1 15.0 6.1 27.9 59.7 121.7 113.3 48.6 8.7 0.4Wyoming . . . . . . . . . . . . . . . . 12.6 67.2 1,933.0 * 26.1 9.4 51.2 93.5 119.9 97.2 40.2 8.6 *
Puerto Rico . . . . . . . . . . . . . . 8.3 41.7 1,242.5 0.3 29.6 14.8 51.2 77.9 66.7 47.0 22.2 4.6 0.2Virgin Islands . . . . . . . . . . . . . 11.0 60.1 1,798.5 * 25.4 13.7 42.0 87.6 117.6 61.5 53.4 13.7 *Guam . . . . . . . . . . . . . . . . . . . 20.6 102.7 3,082.0 * 38.0 14.2 78.4 150.3 164.0 158.3 83.7 20.6 *American Samoa . . . . . . . . . . 19.4 89.8 2,691.0 * 40.8 13.1 87.6 112.8 147.2 129.3 79.3 27.6 *Northern Marianas . . . . . . . . . 7.9 44.4 1,498.0 * 27.4 * 56.7 93.0 94.4 61.6 19.6 * *
* Figure does not meet standards of reliability or percision; birth rates based on fewer than 20 births. ¹Birth rates computed by relating births to women aged 45 and over to women aged 45–49; see Technical Notes. ²Excludes data for territories.
NOTES: Population data for computing birth rates were provided by the U.S. Census Bureau. Rates by state may differ from rates computed on the basis of other population estimates.
SOURCE: NCHS, National Vital Statistics System, Natality.
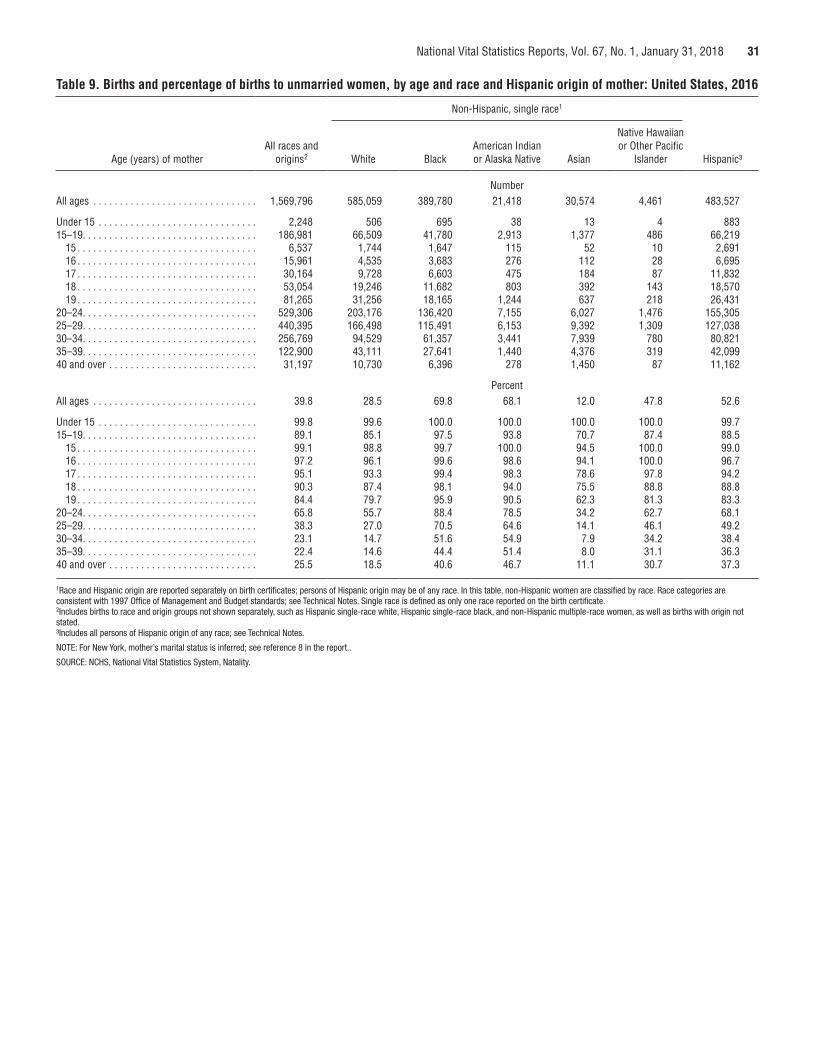
National Vital Statistics Reports, Vol. 67, No. 1, January 31, 2018 31
Table 9. Births and percentage of births to unmarried women, by age and race and Hispanic origin of mother: United States, 2016
Age (years) of motherAll races and
origins2
Non-Hispanic, single race1
Hispanic³White BlackAmerican Indian or Alaska Native Asian
Native Hawaiian or Other Pacific
Islander
NumberAll ages . . . . . . . . . . . . . . . . . . . . . . . . . . . . . . . 1,569,796 585,059 389,780 21,418 30,574 4,461 483,527
Under 15 . . . . . . . . . . . . . . . . . . . . . . . . . . . . . . 2,248 506 695 38 13 4 88315–19. . . . . . . . . . . . . . . . . . . . . . . . . . . . . . . . . 186,981 66,509 41,780 2,913 1,377 486 66,219
15 . . . . . . . . . . . . . . . . . . . . . . . . . . . . . . . . . . 6,537 1,744 1,647 115 52 10 2,69116 . . . . . . . . . . . . . . . . . . . . . . . . . . . . . . . . . . 15,961 4,535 3,683 276 112 28 6,69517 . . . . . . . . . . . . . . . . . . . . . . . . . . . . . . . . . . 30,164 9,728 6,603 475 184 87 11,83218 . . . . . . . . . . . . . . . . . . . . . . . . . . . . . . . . . . 53,054 19,246 11,682 803 392 143 18,57019 . . . . . . . . . . . . . . . . . . . . . . . . . . . . . . . . . . 81,265 31,256 18,165 1,244 637 218 26,431
20–24. . . . . . . . . . . . . . . . . . . . . . . . . . . . . . . . . 529,306 203,176 136,420 7,155 6,027 1,476 155,30525–29. . . . . . . . . . . . . . . . . . . . . . . . . . . . . . . . . 440,395 166,498 115,491 6,153 9,392 1,309 127,03830–34. . . . . . . . . . . . . . . . . . . . . . . . . . . . . . . . . 256,769 94,529 61,357 3,441 7,939 780 80,82135–39. . . . . . . . . . . . . . . . . . . . . . . . . . . . . . . . . 122,900 43,111 27,641 1,440 4,376 319 42,09940 and over . . . . . . . . . . . . . . . . . . . . . . . . . . . . 31,197 10,730 6,396 278 1,450 87 11,162
PercentAll ages . . . . . . . . . . . . . . . . . . . . . . . . . . . . . . . 39.8 28.5 69.8 68.1 12.0 47.8 52.6
Under 15 . . . . . . . . . . . . . . . . . . . . . . . . . . . . . . 99.8 99.6 100.0 100.0 100.0 100.0 99.715–19. . . . . . . . . . . . . . . . . . . . . . . . . . . . . . . . . 89.1 85.1 97.5 93.8 70.7 87.4 88.5
15 . . . . . . . . . . . . . . . . . . . . . . . . . . . . . . . . . . 99.1 98.8 99.7 100.0 94.5 100.0 99.016 . . . . . . . . . . . . . . . . . . . . . . . . . . . . . . . . . . 97.2 96.1 99.6 98.6 94.1 100.0 96.717 . . . . . . . . . . . . . . . . . . . . . . . . . . . . . . . . . . 95.1 93.3 99.4 98.3 78.6 97.8 94.218 . . . . . . . . . . . . . . . . . . . . . . . . . . . . . . . . . . 90.3 87.4 98.1 94.0 75.5 88.8 88.819 . . . . . . . . . . . . . . . . . . . . . . . . . . . . . . . . . . 84.4 79.7 95.9 90.5 62.3 81.3 83.3
20–24. . . . . . . . . . . . . . . . . . . . . . . . . . . . . . . . . 65.8 55.7 88.4 78.5 34.2 62.7 68.125–29. . . . . . . . . . . . . . . . . . . . . . . . . . . . . . . . . 38.3 27.0 70.5 64.6 14.1 46.1 49.230–34. . . . . . . . . . . . . . . . . . . . . . . . . . . . . . . . . 23.1 14.7 51.6 54.9 7.9 34.2 38.435–39. . . . . . . . . . . . . . . . . . . . . . . . . . . . . . . . . 22.4 14.6 44.4 51.4 8.0 31.1 36.340 and over . . . . . . . . . . . . . . . . . . . . . . . . . . . . 25.5 18.5 40.6 46.7 11.1 30.7 37.3
1Race and Hispanic origin are reported separately on birth certificates; persons of Hispanic origin may be of any race. In this table, non-Hispanic women are classified by race. Race categories are consistent with 1997 Office of Management and Budget standards; see Technical Notes. Single race is defined as only one race reported on the birth certificate.2Includes births to race and origin groups not shown separately, such as Hispanic single-race white, Hispanic single-race black, and non-Hispanic multiple-race women, as well as births with origin not stated. ³Includes all persons of Hispanic origin of any race; see Technical Notes.
NOTE: For New York, mother’s marital status is inferred; see reference 8 in the report..
SOURCE: NCHS, National Vital Statistics System, Natality.
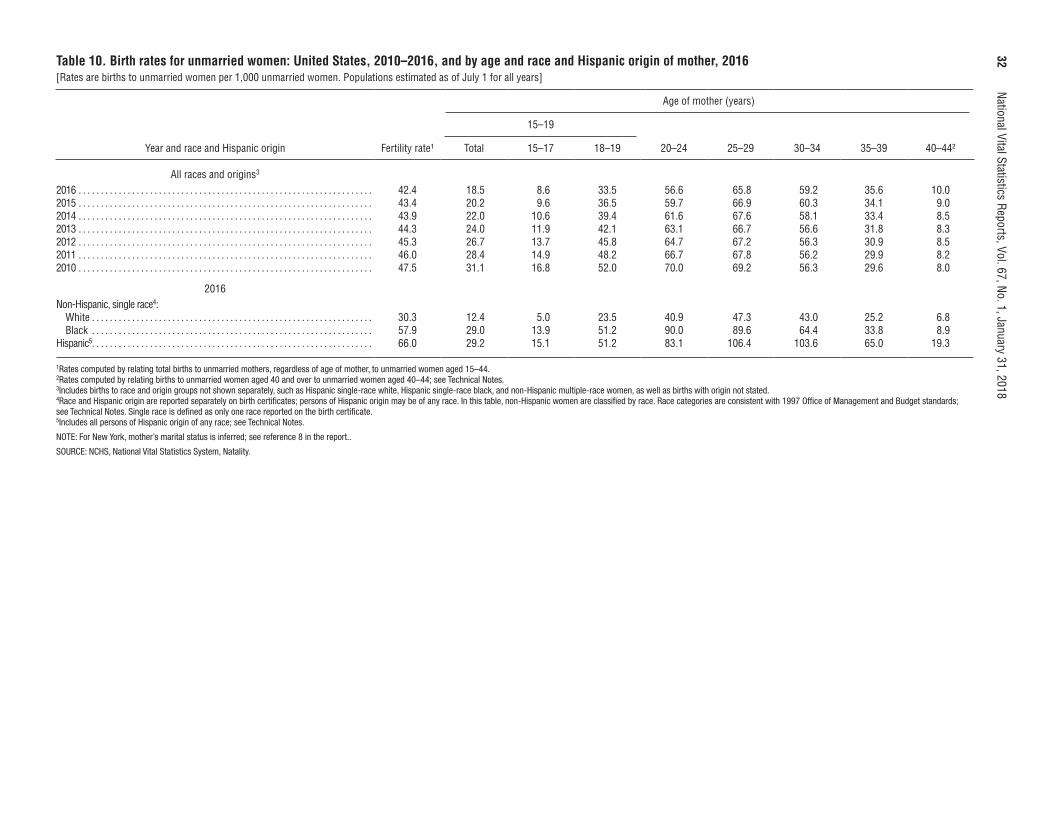
32
National Vital Statistics Reports, Vol. 67, No. 1, January 31, 2018Table 10. Birth rates for unmarried women: United States, 2010–2016, and by age and race and Hispanic origin of mother, 2016[Rates are births to unmarried women per 1,000 unmarried women. Populations estimated as of July 1 for all years]
Age of mother (years)
Year and race and Hispanic origin Fertility rate¹
15–19
20–24 25–29 30–34 35–39 40–44²Total 15–17 18–19
All races and origins3
2016 . . . . . . . . . . . . . . . . . . . . . . . . . . . . . . . . . . . . . . . . . . . . . . . . . . . . . . . . . . . . . . . . . . 42.4 18.5 8.6 33.5 56.6 65.8 59.2 35.6 10.02015 . . . . . . . . . . . . . . . . . . . . . . . . . . . . . . . . . . . . . . . . . . . . . . . . . . . . . . . . . . . . . . . . . . 43.4 20.2 9.6 36.5 59.7 66.9 60.3 34.1 9.02014 . . . . . . . . . . . . . . . . . . . . . . . . . . . . . . . . . . . . . . . . . . . . . . . . . . . . . . . . . . . . . . . . . . 43.9 22.0 10.6 39.4 61.6 67.6 58.1 33.4 8.52013 . . . . . . . . . . . . . . . . . . . . . . . . . . . . . . . . . . . . . . . . . . . . . . . . . . . . . . . . . . . . . . . . . . 44.3 24.0 11.9 42.1 63.1 66.7 56.6 31.8 8.32012 . . . . . . . . . . . . . . . . . . . . . . . . . . . . . . . . . . . . . . . . . . . . . . . . . . . . . . . . . . . . . . . . . . 45.3 26.7 13.7 45.8 64.7 67.2 56.3 30.9 8.52011 . . . . . . . . . . . . . . . . . . . . . . . . . . . . . . . . . . . . . . . . . . . . . . . . . . . . . . . . . . . . . . . . . . 46.0 28.4 14.9 48.2 66.7 67.8 56.2 29.9 8.22010 . . . . . . . . . . . . . . . . . . . . . . . . . . . . . . . . . . . . . . . . . . . . . . . . . . . . . . . . . . . . . . . . . . 47.5 31.1 16.8 52.0 70.0 69.2 56.3 29.6 8.0
2016Non-Hispanic, single race4:
White . . . . . . . . . . . . . . . . . . . . . . . . . . . . . . . . . . . . . . . . . . . . . . . . . . . . . . . . . . . . . . . 30.3 12.4 5.0 23.5 40.9 47.3 43.0 25.2 6.8Black . . . . . . . . . . . . . . . . . . . . . . . . . . . . . . . . . . . . . . . . . . . . . . . . . . . . . . . . . . . . . . . 57.9 29.0 13.9 51.2 90.0 89.6 64.4 33.8 8.9
Hispanic5. . . . . . . . . . . . . . . . . . . . . . . . . . . . . . . . . . . . . . . . . . . . . . . . . . . . . . . . . . . . . . . 66.0 29.2 15.1 51.2 83.1 106.4 103.6 65.0 19.3
1Rates computed by relating total births to unmarried mothers, regardless of age of mother, to unmarried women aged 15–44. 2Rates computed by relating births to unmarried women aged 40 and over to unmarried women aged 40–44; see Technical Notes. 3Includes births to race and origin groups not shown separately, such as Hispanic single-race white, Hispanic single-race black, and non-Hispanic multiple-race women, as well as births with origin not stated. 4Race and Hispanic origin are reported separately on birth certificates; persons of Hispanic origin may be of any race. In this table, non-Hispanic women are classified by race. Race categories are consistent with 1997 Office of Management and Budget standards; see Technical Notes. Single race is defined as only one race reported on the birth certificate. 5Includes all persons of Hispanic origin of any race; see Technical Notes.
NOTE: For New York, mother’s marital status is inferred; see reference 8 in the report..
SOURCE: NCHS, National Vital Statistics System, Natality.
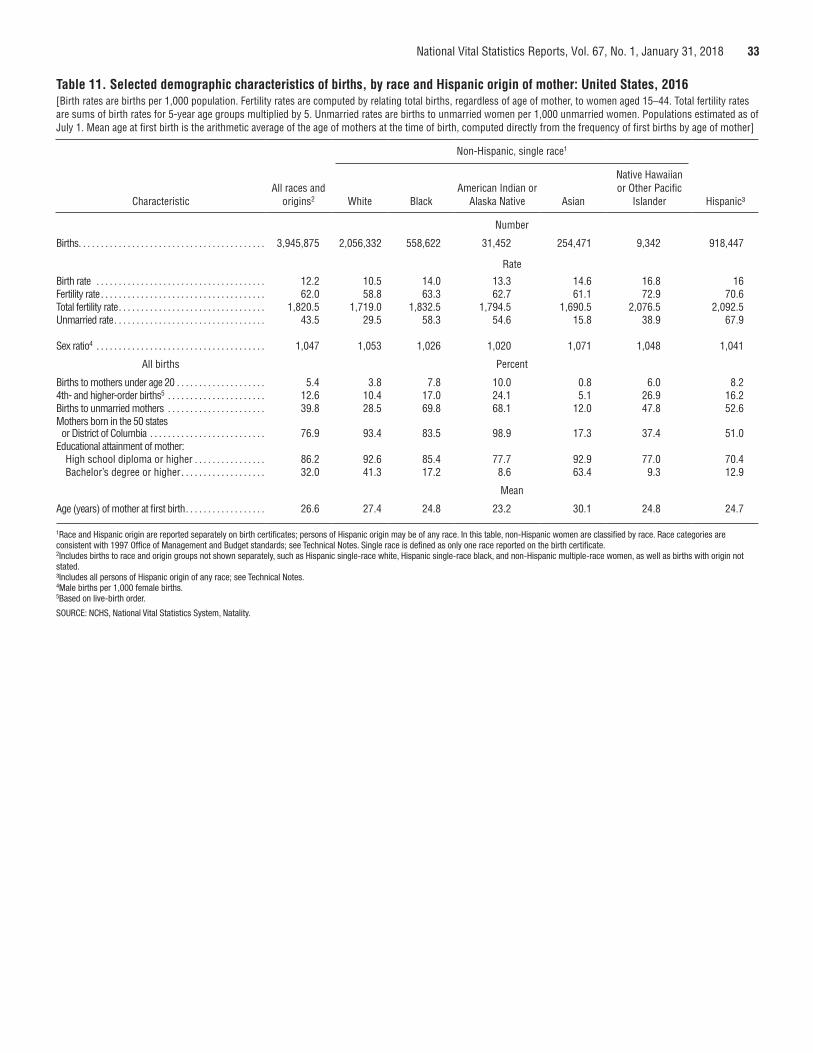
National Vital Statistics Reports, Vol. 67, No. 1, January 31, 2018 33
Table 11. Selected demographic characteristics of births, by race and Hispanic origin of mother: United States, 2016[Birth rates are births per 1,000 population. Fertility rates are computed by relating total births, regardless of age of mother, to women aged 15–44. Total fertility rates are sums of birth rates for 5-year age groups multiplied by 5. Unmarried rates are births to unmarried women per 1,000 unmarried women. Populations estimated as of July 1. Mean age at first birth is the arithmetic average of the age of mothers at the time of birth, computed directly from the frequency of first births by age of mother]
CharacteristicAll races and
origins2
Non-Hispanic, single race1
Hispanic³ White BlackAmerican Indian or
Alaska Native Asian
Native Hawaiian or Other Pacific
Islander
Number
Births . . . . . . . . . . . . . . . . . . . . . . . . . . . . . . . . . . . . . . . . . . 3,945,875 2,056,332 558,622 31,452 254,471 9,342 918,447
Rate
Birth rate . . . . . . . . . . . . . . . . . . . . . . . . . . . . . . . . . . . . . . 12.2 10.5 14.0 13.3 14.6 16.8 16Fertility rate . . . . . . . . . . . . . . . . . . . . . . . . . . . . . . . . . . . . . 62.0 58.8 63.3 62.7 61.1 72.9 70.6Total fertility rate . . . . . . . . . . . . . . . . . . . . . . . . . . . . . . . . . 1,820.5 1,719.0 1,832.5 1,794.5 1,690.5 2,076.5 2,092.5Unmarried rate . . . . . . . . . . . . . . . . . . . . . . . . . . . . . . . . . . 43.5 29.5 58.3 54.6 15.8 38.9 67.9
Sex ratio4 . . . . . . . . . . . . . . . . . . . . . . . . . . . . . . . . . . . . . . 1,047 1,053 1,026 1,020 1,071 1,048 1,041
All births Percent
Births to mothers under age 20 . . . . . . . . . . . . . . . . . . . . 5.4 3.8 7.8 10.0 0.8 6.0 8.24th- and higher-order births5 . . . . . . . . . . . . . . . . . . . . . . 12.6 10.4 17.0 24.1 5.1 26.9 16.2Births to unmarried mothers . . . . . . . . . . . . . . . . . . . . . . 39.8 28.5 69.8 68.1 12.0 47.8 52.6Mothers born in the 50 states or District of Columbia . . . . . . . . . . . . . . . . . . . . . . . . . . 76.9 93.4 83.5 98.9 17.3 37.4 51.0
Educational attainment of mother:High school diploma or higher . . . . . . . . . . . . . . . . 86.2 92.6 85.4 77.7 92.9 77.0 70.4Bachelor’s degree or higher . . . . . . . . . . . . . . . . . . . 32.0 41.3 17.2 8.6 63.4 9.3 12.9
Mean
Age (years) of mother at first birth . . . . . . . . . . . . . . . . . . 26.6 27.4 24.8 23.2 30.1 24.8 24.7
1Race and Hispanic origin are reported separately on birth certificates; persons of Hispanic origin may be of any race. In this table, non-Hispanic women are classified by race. Race categories are consistent with 1997 Office of Management and Budget standards; see Technical Notes. Single race is defined as only one race reported on the birth certificate.2Includes births to race and origin groups not shown separately, such as Hispanic single-race white, Hispanic single-race black, and non-Hispanic multiple-race women, as well as births with origin not stated. ³Includes all persons of Hispanic origin of any race; see Technical Notes. 4Male births per 1,000 female births. 5Based on live-birth order.
SOURCE: NCHS, National Vital Statistics System, Natality.
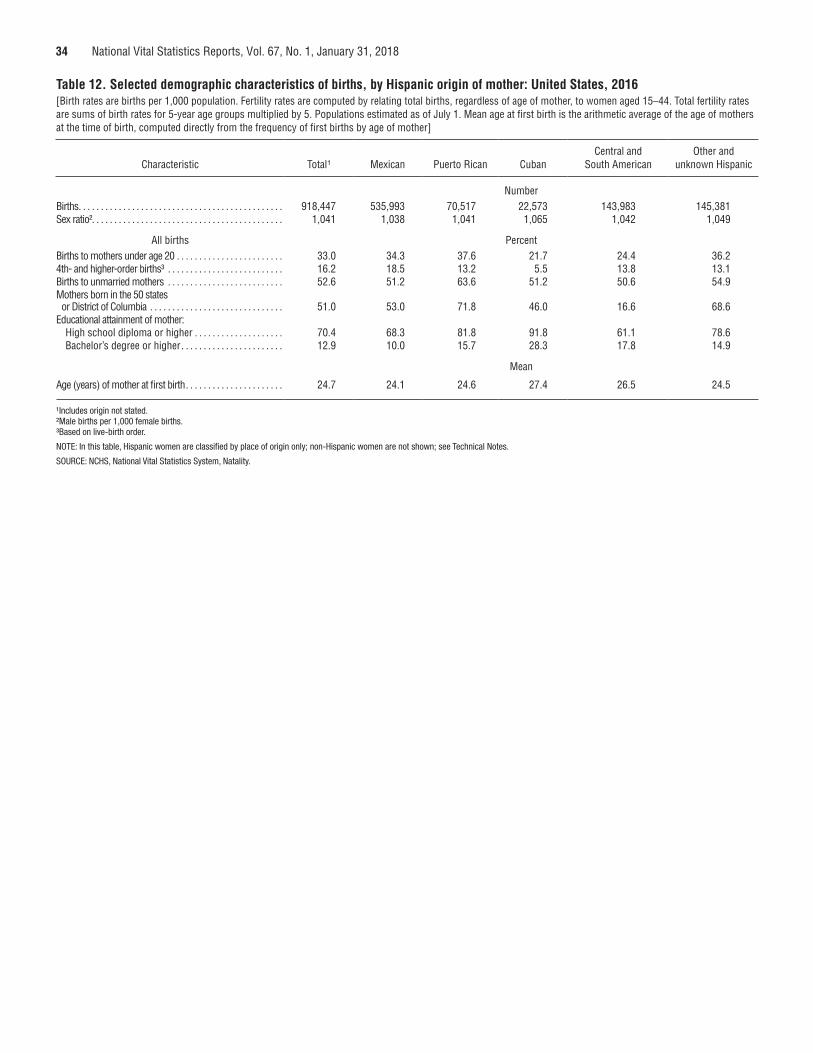
34 National Vital Statistics Reports, Vol. 67, No. 1, January 31, 2018
Table 12. Selected demographic characteristics of births, by Hispanic origin of mother: United States, 2016[Birth rates are births per 1,000 population. Fertility rates are computed by relating total births, regardless of age of mother, to women aged 15–44. Total fertility rates are sums of birth rates for 5-year age groups multiplied by 5. Populations estimated as of July 1. Mean age at first birth is the arithmetic average of the age of mothers at the time of birth, computed directly from the frequency of first births by age of mother]
Characteristic Total¹ Mexican Puerto Rican CubanCentral and
South AmericanOther and
unknown Hispanic
NumberBirths . . . . . . . . . . . . . . . . . . . . . . . . . . . . . . . . . . . . . . . . . . . . . . 918,447 535,993 70,517 22,573 143,983 145,381Sex ratio². . . . . . . . . . . . . . . . . . . . . . . . . . . . . . . . . . . . . . . . . . . 1,041 1,038 1,041 1,065 1,042 1,049
All births PercentBirths to mothers under age 20 . . . . . . . . . . . . . . . . . . . . . . . . 33.0 34.3 37.6 21.7 24.4 36.24th- and higher-order births³ . . . . . . . . . . . . . . . . . . . . . . . . . . 16.2 18.5 13.2 5.5 13.8 13.1Births to unmarried mothers . . . . . . . . . . . . . . . . . . . . . . . . . . 52.6 51.2 63.6 51.2 50.6 54.9Mothers born in the 50 states or District of Columbia . . . . . . . . . . . . . . . . . . . . . . . . . . . . . . 51.0 53.0 71.8 46.0 16.6 68.6
Educational attainment of mother:High school diploma or higher . . . . . . . . . . . . . . . . . . . . 70.4 68.3 81.8 91.8 61.1 78.6Bachelor’s degree or higher . . . . . . . . . . . . . . . . . . . . . . . 12.9 10.0 15.7 28.3 17.8 14.9
Mean
Age (years) of mother at first birth . . . . . . . . . . . . . . . . . . . . . . 24.7 24.1 24.6 27.4 26.5 24.5
¹Includes origin not stated. ²Male births per 1,000 female births. ³Based on live-birth order.
NOTE: In this table, Hispanic women are classified by place of origin only; non-Hispanic women are not shown; see Technical Notes.
SOURCE: NCHS, National Vital Statistics System, Natality.
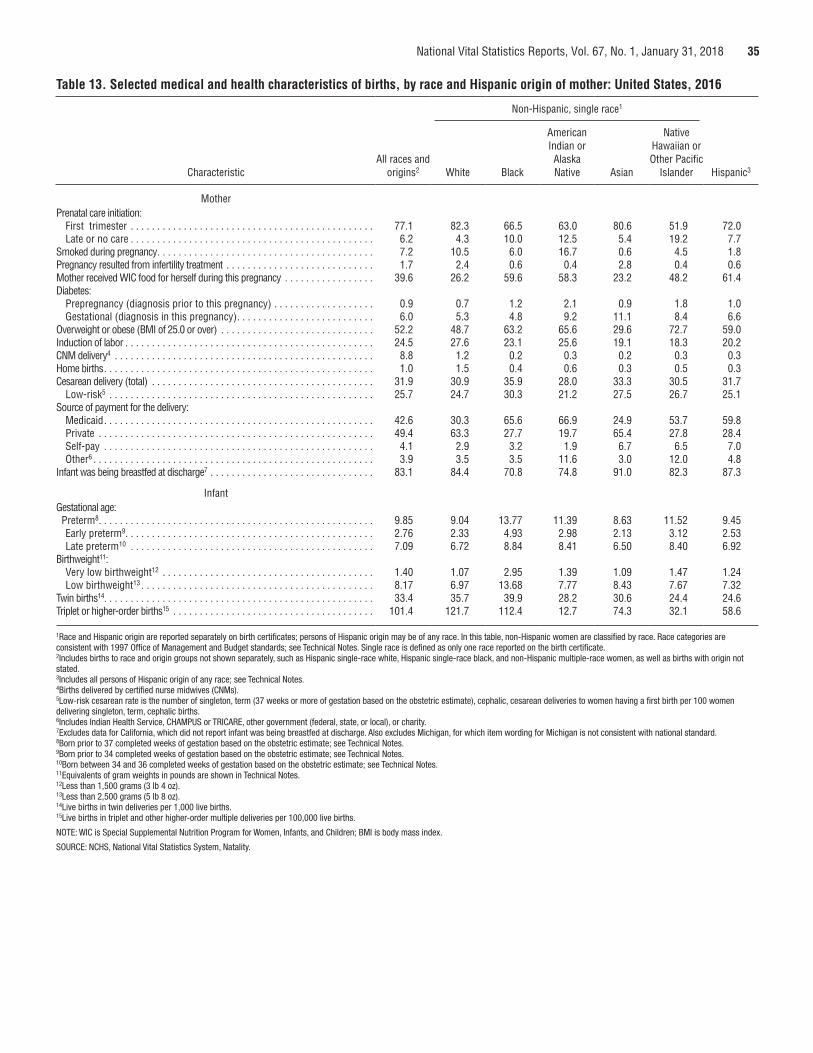
National Vital Statistics Reports, Vol. 67, No. 1, January 31, 2018 35
Table 13. Selected medical and health characteristics of births, by race and Hispanic origin of mother: United States, 2016
CharacteristicAll races and
origins2
Non-Hispanic, single race1
Hispanic3White Black
American Indian or Alaska Native Asian
Native Hawaiian or Other Pacific
Islander
MotherPrenatal care initiation:
First trimester . . . . . . . . . . . . . . . . . . . . . . . . . . . . . . . . . . . . . . . . . . . . . . 77.1 82.3 66.5 63.0 80.6 51.9 72.0Late or no care . . . . . . . . . . . . . . . . . . . . . . . . . . . . . . . . . . . . . . . . . . . . . . 6.2 4.3 10.0 12.5 5.4 19.2 7.7
Smoked during pregnancy . . . . . . . . . . . . . . . . . . . . . . . . . . . . . . . . . . . . . . . . . 7.2 10.5 6.0 16.7 0.6 4.5 1.8Pregnancy resulted from infertility treatment . . . . . . . . . . . . . . . . . . . . . . . . . . . . 1.7 2.4 0.6 0.4 2.8 0.4 0.6Mother received WIC food for herself during this pregnancy . . . . . . . . . . . . . . . . . 39.6 26.2 59.6 58.3 23.2 48.2 61.4Diabetes:
Prepregnancy (diagnosis prior to this pregnancy) . . . . . . . . . . . . . . . . . . . 0.9 0.7 1.2 2.1 0.9 1.8 1.0Gestational (diagnosis in this pregnancy) . . . . . . . . . . . . . . . . . . . . . . . . . . 6.0 5.3 4.8 9.2 11.1 8.4 6.6
Overweight or obese (BMI of 25.0 or over) . . . . . . . . . . . . . . . . . . . . . . . . . . . . . 52.2 48.7 63.2 65.6 29.6 72.7 59.0Induction of labor . . . . . . . . . . . . . . . . . . . . . . . . . . . . . . . . . . . . . . . . . . . . . . . 24.5 27.6 23.1 25.6 19.1 18.3 20.2CNM delivery4 . . . . . . . . . . . . . . . . . . . . . . . . . . . . . . . . . . . . . . . . . . . . . . . . . 8.8 1.2 0.2 0.3 0.2 0.3 0.3Home births . . . . . . . . . . . . . . . . . . . . . . . . . . . . . . . . . . . . . . . . . . . . . . . . . . . 1.0 1.5 0.4 0.6 0.3 0.5 0.3Cesarean delivery (total) . . . . . . . . . . . . . . . . . . . . . . . . . . . . . . . . . . . . . . . . . . 31.9 30.9 35.9 28.0 33.3 30.5 31.7
Low-risk5 . . . . . . . . . . . . . . . . . . . . . . . . . . . . . . . . . . . . . . . . . . . . . . . . . . 25.7 24.7 30.3 21.2 27.5 26.7 25.1Source of payment for the delivery:
Medicaid . . . . . . . . . . . . . . . . . . . . . . . . . . . . . . . . . . . . . . . . . . . . . . . . . . . 42.6 30.3 65.6 66.9 24.9 53.7 59.8Private . . . . . . . . . . . . . . . . . . . . . . . . . . . . . . . . . . . . . . . . . . . . . . . . . . . . 49.4 63.3 27.7 19.7 65.4 27.8 28.4Self-pay . . . . . . . . . . . . . . . . . . . . . . . . . . . . . . . . . . . . . . . . . . . . . . . . . . . 4.1 2.9 3.2 1.9 6.7 6.5 7.0Other6 . . . . . . . . . . . . . . . . . . . . . . . . . . . . . . . . . . . . . . . . . . . . . . . . . . . . . 3.9 3.5 3.5 11.6 3.0 12.0 4.8
Infant was being breastfed at discharge7 . . . . . . . . . . . . . . . . . . . . . . . . . . . . . . . 83.1 84.4 70.8 74.8 91.0 82.3 87.3
InfantGestational age:Preterm8 . . . . . . . . . . . . . . . . . . . . . . . . . . . . . . . . . . . . . . . . . . . . . . . . . . . . 9.85 9.04 13.77 11.39 8.63 11.52 9.45Early preterm9. . . . . . . . . . . . . . . . . . . . . . . . . . . . . . . . . . . . . . . . . . . . . . . 2.76 2.33 4.93 2.98 2.13 3.12 2.53Late preterm10 . . . . . . . . . . . . . . . . . . . . . . . . . . . . . . . . . . . . . . . . . . . . . . 7.09 6.72 8.84 8.41 6.50 8.40 6.92
Birthweight11:Very low birthweight12 . . . . . . . . . . . . . . . . . . . . . . . . . . . . . . . . . . . . . . . . 1.40 1.07 2.95 1.39 1.09 1.47 1.24Low birthweight13 . . . . . . . . . . . . . . . . . . . . . . . . . . . . . . . . . . . . . . . . . . . . 8.17 6.97 13.68 7.77 8.43 7.67 7.32
Twin births14 . . . . . . . . . . . . . . . . . . . . . . . . . . . . . . . . . . . . . . . . . . . . . . . . . . . 33.4 35.7 39.9 28.2 30.6 24.4 24.6Triplet or higher-order births15 . . . . . . . . . . . . . . . . . . . . . . . . . . . . . . . . . . . . . . 101.4 121.7 112.4 12.7 74.3 32.1 58.6
1Race and Hispanic origin are reported separately on birth certificates; persons of Hispanic origin may be of any race. In this table, non-Hispanic women are classified by race. Race categories are consistent with 1997 Office of Management and Budget standards; see Technical Notes. Single race is defined as only one race reported on the birth certificate.2Includes births to race and origin groups not shown separately, such as Hispanic single-race white, Hispanic single-race black, and non-Hispanic multiple-race women, as well as births with origin not stated. 3Includes all persons of Hispanic origin of any race; see Technical Notes. 4Births delivered by certified nurse midwives (CNMs). 5Low-risk cesarean rate is the number of singleton, term (37 weeks or more of gestation based on the obstetric estimate), cephalic, cesarean deliveries to women having a first birth per 100 women delivering singleton, term, cephalic births. 6Includes Indian Health Service, CHAMPUS or TRICARE, other government (federal, state, or local), or charity. 7Excludes data for California, which did not report infant was being breastfed at discharge. Also excludes Michigan, for which item wording for Michigan is not consistent with national standard. 8Born prior to 37 completed weeks of gestation based on the obstetric estimate; see Technical Notes. 9Born prior to 34 completed weeks of gestation based on the obstetric estimate; see Technical Notes. 10Born between 34 and 36 completed weeks of gestation based on the obstetric estimate; see Technical Notes. 11Equivalents of gram weights in pounds are shown in Technical Notes. 12Less than 1,500 grams (3 lb 4 oz). 13Less than 2,500 grams (5 lb 8 oz). 14Live births in twin deliveries per 1,000 live births. 15Live births in triplet and other higher-order multiple deliveries per 100,000 live births.
NOTE: WIC is Special Supplemental Nutrition Program for Women, Infants, and Children; BMI is body mass index.
SOURCE: NCHS, National Vital Statistics System, Natality.
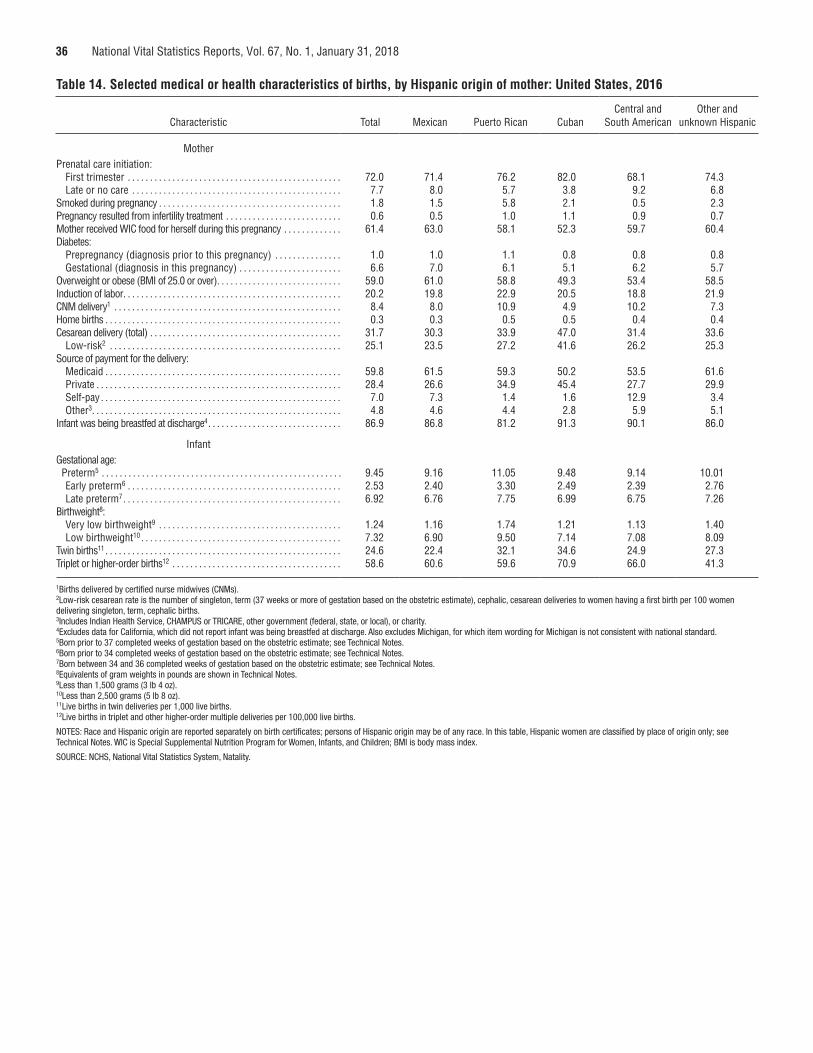
36 National Vital Statistics Reports, Vol. 67, No. 1, January 31, 2018
Table 14. Selected medical or health characteristics of births, by Hispanic origin of mother: United States, 2016
Characteristic Total Mexican Puerto Rican CubanCentral and
South AmericanOther and
unknown Hispanic
MotherPrenatal care initiation:
First trimester . . . . . . . . . . . . . . . . . . . . . . . . . . . . . . . . . . . . . . . . . . . . . . . . 72.0 71.4 76.2 82.0 68.1 74.3Late or no care . . . . . . . . . . . . . . . . . . . . . . . . . . . . . . . . . . . . . . . . . . . . . . . 7.7 8.0 5.7 3.8 9.2 6.8
Smoked during pregnancy . . . . . . . . . . . . . . . . . . . . . . . . . . . . . . . . . . . . . . . . . 1.8 1.5 5.8 2.1 0.5 2.3Pregnancy resulted from infertility treatment . . . . . . . . . . . . . . . . . . . . . . . . . . 0.6 0.5 1.0 1.1 0.9 0.7Mother received WIC food for herself during this pregnancy . . . . . . . . . . . . . 61.4 63.0 58.1 52.3 59.7 60.4Diabetes:
Prepregnancy (diagnosis prior to this pregnancy) . . . . . . . . . . . . . . . 1.0 1.0 1.1 0.8 0.8 0.8Gestational (diagnosis in this pregnancy) . . . . . . . . . . . . . . . . . . . . . . . 6.6 7.0 6.1 5.1 6.2 5.7
Overweight or obese (BMI of 25.0 or over) . . . . . . . . . . . . . . . . . . . . . . . . . . . . 59.0 61.0 58.8 49.3 53.4 58.5Induction of labor . . . . . . . . . . . . . . . . . . . . . . . . . . . . . . . . . . . . . . . . . . . . . . . . . 20.2 19.8 22.9 20.5 18.8 21.9CNM delivery1 . . . . . . . . . . . . . . . . . . . . . . . . . . . . . . . . . . . . . . . . . . . . . . . . . . . 8.4 8.0 10.9 4.9 10.2 7.3Home births . . . . . . . . . . . . . . . . . . . . . . . . . . . . . . . . . . . . . . . . . . . . . . . . . . . . . 0.3 0.3 0.5 0.5 0.4 0.4Cesarean delivery (total) . . . . . . . . . . . . . . . . . . . . . . . . . . . . . . . . . . . . . . . . . . . 31.7 30.3 33.9 47.0 31.4 33.6
Low-risk2 . . . . . . . . . . . . . . . . . . . . . . . . . . . . . . . . . . . . . . . . . . . . . . . . . . . . 25.1 23.5 27.2 41.6 26.2 25.3Source of payment for the delivery:
Medicaid . . . . . . . . . . . . . . . . . . . . . . . . . . . . . . . . . . . . . . . . . . . . . . . . . . . . . 59.8 61.5 59.3 50.2 53.5 61.6Private . . . . . . . . . . . . . . . . . . . . . . . . . . . . . . . . . . . . . . . . . . . . . . . . . . . . . . . 28.4 26.6 34.9 45.4 27.7 29.9Self-pay . . . . . . . . . . . . . . . . . . . . . . . . . . . . . . . . . . . . . . . . . . . . . . . . . . . . . . 7.0 7.3 1.4 1.6 12.9 3.4Other3. . . . . . . . . . . . . . . . . . . . . . . . . . . . . . . . . . . . . . . . . . . . . . . . . . . . . . . . 4.8 4.6 4.4 2.8 5.9 5.1
Infant was being breastfed at discharge4 . . . . . . . . . . . . . . . . . . . . . . . . . . . . . . 86.9 86.8 81.2 91.3 90.1 86.0
InfantGestational age:Preterm5 . . . . . . . . . . . . . . . . . . . . . . . . . . . . . . . . . . . . . . . . . . . . . . . . . . . . . . 9.45 9.16 11.05 9.48 9.14 10.01Early preterm6 . . . . . . . . . . . . . . . . . . . . . . . . . . . . . . . . . . . . . . . . . . . . . . . . 2.53 2.40 3.30 2.49 2.39 2.76Late preterm7 . . . . . . . . . . . . . . . . . . . . . . . . . . . . . . . . . . . . . . . . . . . . . . . . . 6.92 6.76 7.75 6.99 6.75 7.26
Birthweight8:Very low birthweight9 . . . . . . . . . . . . . . . . . . . . . . . . . . . . . . . . . . . . . . . . . 1.24 1.16 1.74 1.21 1.13 1.40Low birthweight10 . . . . . . . . . . . . . . . . . . . . . . . . . . . . . . . . . . . . . . . . . . . . . 7.32 6.90 9.50 7.14 7.08 8.09
Twin births11 . . . . . . . . . . . . . . . . . . . . . . . . . . . . . . . . . . . . . . . . . . . . . . . . . . . . . 24.6 22.4 32.1 34.6 24.9 27.3Triplet or higher-order births12 . . . . . . . . . . . . . . . . . . . . . . . . . . . . . . . . . . . . . . 58.6 60.6 59.6 70.9 66.0 41.3
1Births delivered by certified nurse midwives (CNMs). 2Low-risk cesarean rate is the number of singleton, term (37 weeks or more of gestation based on the obstetric estimate), cephalic, cesarean deliveries to women having a first birth per 100 women delivering singleton, term, cephalic births. 3Includes Indian Health Service, CHAMPUS or TRICARE, other government (federal, state, or local), or charity. 4Excludes data for California, which did not report infant was being breastfed at discharge. Also excludes Michigan, for which item wording for Michigan is not consistent with national standard. 5Born prior to 37 completed weeks of gestation based on the obstetric estimate; see Technical Notes. 6Born prior to 34 completed weeks of gestation based on the obstetric estimate; see Technical Notes. 7Born between 34 and 36 completed weeks of gestation based on the obstetric estimate; see Technical Notes. 8Equivalents of gram weights in pounds are shown in Technical Notes. 9Less than 1,500 grams (3 lb 4 oz). 10Less than 2,500 grams (5 lb 8 oz). 11Live births in twin deliveries per 1,000 live births. 12Live births in triplet and other higher-order multiple deliveries per 100,000 live births.
NOTES: Race and Hispanic origin are reported separately on birth certificates; persons of Hispanic origin may be of any race. In this table, Hispanic women are classified by place of origin only; see Technical Notes. WIC is Special Supplemental Nutrition Program for Women, Infants, and Children; BMI is body mass index.
SOURCE: NCHS, National Vital Statistics System, Natality.
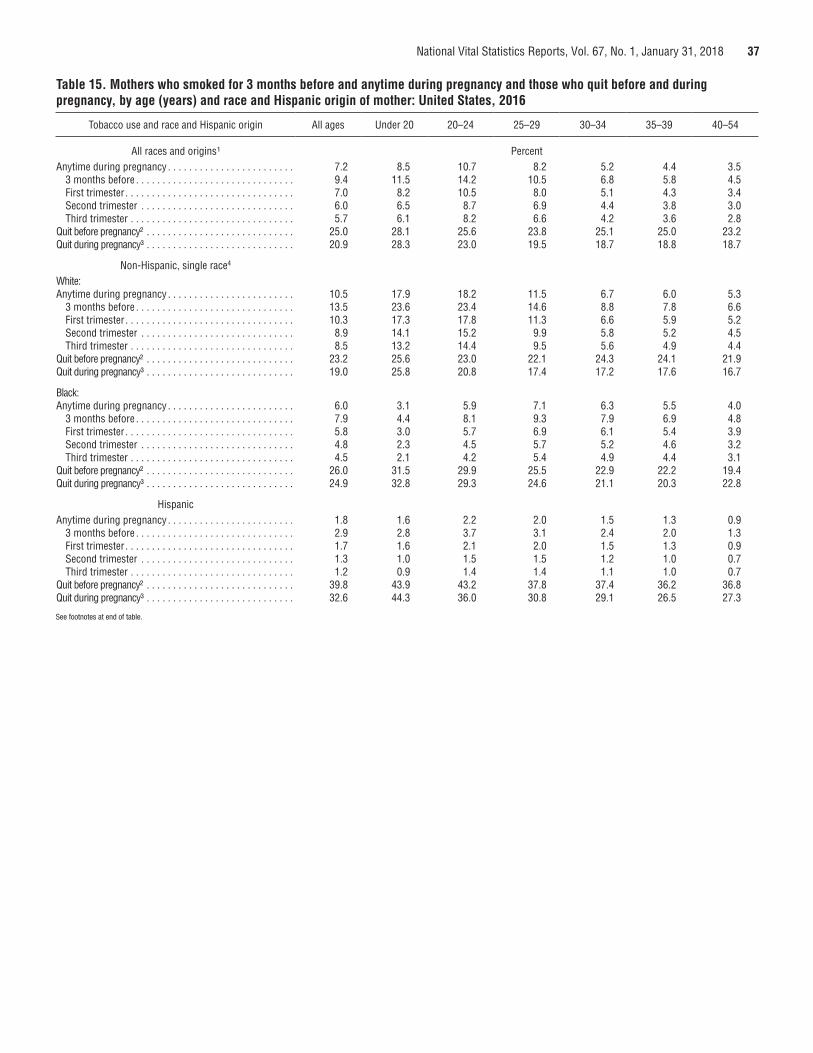
National Vital Statistics Reports, Vol. 67, No. 1, January 31, 2018 37
Table 15. Mothers who smoked for 3 months before and anytime during pregnancy and those who quit before and during pregnancy, by age (years) and race and Hispanic origin of mother: United States, 2016
Tobacco use and race and Hispanic origin All ages Under 20 20–24 25–29 30–34 35–39 40–54
All races and origins¹ PercentAnytime during pregnancy . . . . . . . . . . . . . . . . . . . . . . . . 7.2 8.5 10.7 8.2 5.2 4.4 3.5
3 months before . . . . . . . . . . . . . . . . . . . . . . . . . . . . . . 9.4 11.5 14.2 10.5 6.8 5.8 4.5First trimester . . . . . . . . . . . . . . . . . . . . . . . . . . . . . . . . 7.0 8.2 10.5 8.0 5.1 4.3 3.4Second trimester . . . . . . . . . . . . . . . . . . . . . . . . . . . . . 6.0 6.5 8.7 6.9 4.4 3.8 3.0Third trimester . . . . . . . . . . . . . . . . . . . . . . . . . . . . . . . 5.7 6.1 8.2 6.6 4.2 3.6 2.8
Quit before pregnancy² . . . . . . . . . . . . . . . . . . . . . . . . . . . . 25.0 28.1 25.6 23.8 25.1 25.0 23.2Quit during pregnancy³ . . . . . . . . . . . . . . . . . . . . . . . . . . . . 20.9 28.3 23.0 19.5 18.7 18.8 18.7
Non-Hispanic, single race4
White:Anytime during pregnancy . . . . . . . . . . . . . . . . . . . . . . . . 10.5 17.9 18.2 11.5 6.7 6.0 5.3
3 months before . . . . . . . . . . . . . . . . . . . . . . . . . . . . . . 13.5 23.6 23.4 14.6 8.8 7.8 6.6First trimester . . . . . . . . . . . . . . . . . . . . . . . . . . . . . . . . 10.3 17.3 17.8 11.3 6.6 5.9 5.2Second trimester . . . . . . . . . . . . . . . . . . . . . . . . . . . . . 8.9 14.1 15.2 9.9 5.8 5.2 4.5Third trimester . . . . . . . . . . . . . . . . . . . . . . . . . . . . . . . 8.5 13.2 14.4 9.5 5.6 4.9 4.4
Quit before pregnancy² . . . . . . . . . . . . . . . . . . . . . . . . . . . . 23.2 25.6 23.0 22.1 24.3 24.1 21.9Quit during pregnancy³ . . . . . . . . . . . . . . . . . . . . . . . . . . . . 19.0 25.8 20.8 17.4 17.2 17.6 16.7
Black:Anytime during pregnancy . . . . . . . . . . . . . . . . . . . . . . . . 6.0 3.1 5.9 7.1 6.3 5.5 4.0
3 months before . . . . . . . . . . . . . . . . . . . . . . . . . . . . . . 7.9 4.4 8.1 9.3 7.9 6.9 4.8First trimester . . . . . . . . . . . . . . . . . . . . . . . . . . . . . . . . 5.8 3.0 5.7 6.9 6.1 5.4 3.9Second trimester . . . . . . . . . . . . . . . . . . . . . . . . . . . . . 4.8 2.3 4.5 5.7 5.2 4.6 3.2Third trimester . . . . . . . . . . . . . . . . . . . . . . . . . . . . . . . 4.5 2.1 4.2 5.4 4.9 4.4 3.1
Quit before pregnancy² . . . . . . . . . . . . . . . . . . . . . . . . . . . . 26.0 31.5 29.9 25.5 22.9 22.2 19.4Quit during pregnancy³ . . . . . . . . . . . . . . . . . . . . . . . . . . . . 24.9 32.8 29.3 24.6 21.1 20.3 22.8
HispanicAnytime during pregnancy . . . . . . . . . . . . . . . . . . . . . . . . 1.8 1.6 2.2 2.0 1.5 1.3 0.9
3 months before . . . . . . . . . . . . . . . . . . . . . . . . . . . . . . 2.9 2.8 3.7 3.1 2.4 2.0 1.3First trimester . . . . . . . . . . . . . . . . . . . . . . . . . . . . . . . . 1.7 1.6 2.1 2.0 1.5 1.3 0.9Second trimester . . . . . . . . . . . . . . . . . . . . . . . . . . . . . 1.3 1.0 1.5 1.5 1.2 1.0 0.7Third trimester . . . . . . . . . . . . . . . . . . . . . . . . . . . . . . . 1.2 0.9 1.4 1.4 1.1 1.0 0.7
Quit before pregnancy² . . . . . . . . . . . . . . . . . . . . . . . . . . . . 39.8 43.9 43.2 37.8 37.4 36.2 36.8Quit during pregnancy³ . . . . . . . . . . . . . . . . . . . . . . . . . . . . 32.6 44.3 36.0 30.8 29.1 26.5 27.3
See footnotes at end of table.
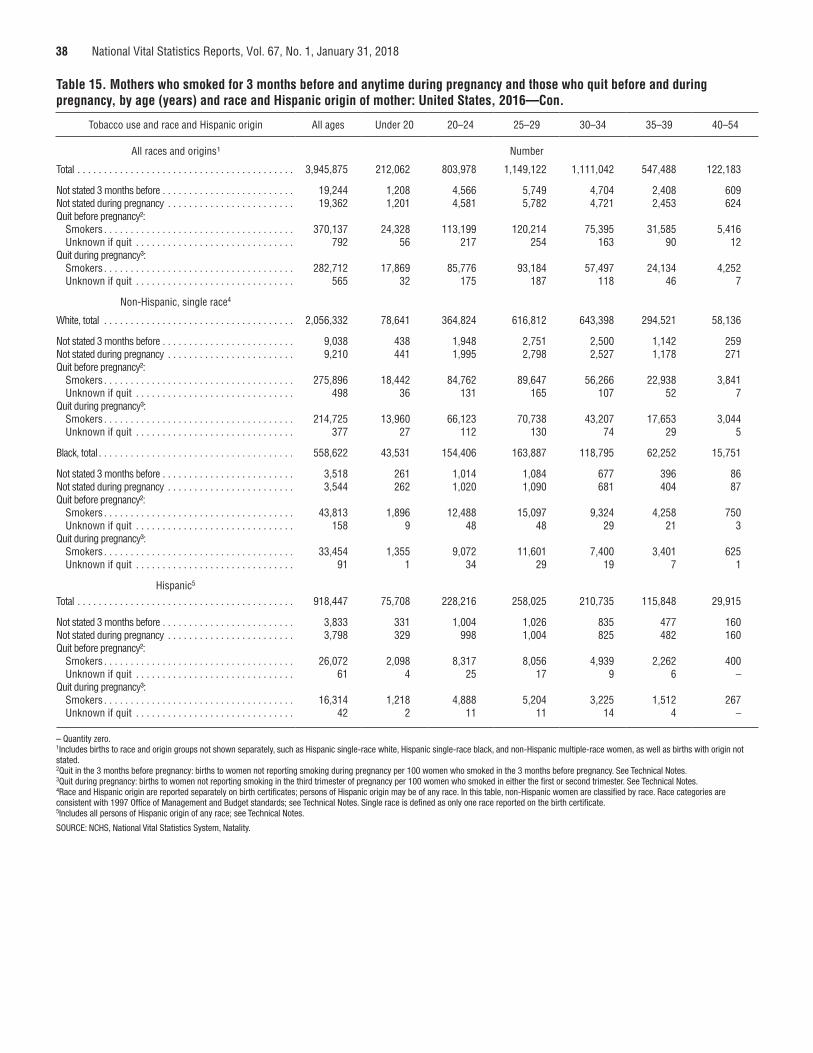
38 National Vital Statistics Reports, Vol. 67, No. 1, January 31, 2018
Table 15. Mothers who smoked for 3 months before and anytime during pregnancy and those who quit before and during pregnancy, by age (years) and race and Hispanic origin of mother: United States, 2016—Con.
Tobacco use and race and Hispanic origin All ages Under 20 20–24 25–29 30–34 35–39 40–54
All races and origins¹ Number
Total . . . . . . . . . . . . . . . . . . . . . . . . . . . . . . . . . . . . . . . . . 3,945,875 212,062 803,978 1,149,122 1,111,042 547,488 122,183
Not stated 3 months before . . . . . . . . . . . . . . . . . . . . . . . . . 19,244 1,208 4,566 5,749 4,704 2,408 609 Not stated during pregnancy . . . . . . . . . . . . . . . . . . . . . . . . 19,362 1,201 4,581 5,782 4,721 2,453 624 Quit before pregnancy²:
Smokers . . . . . . . . . . . . . . . . . . . . . . . . . . . . . . . . . . . . 370,137 24,328 113,199 120,214 75,395 31,585 5,416 Unknown if quit . . . . . . . . . . . . . . . . . . . . . . . . . . . . . . 792 56 217 254 163 90 12
Quit during pregnancy³:Smokers . . . . . . . . . . . . . . . . . . . . . . . . . . . . . . . . . . . . 282,712 17,869 85,776 93,184 57,497 24,134 4,252 Unknown if quit . . . . . . . . . . . . . . . . . . . . . . . . . . . . . . 565 32 175 187 118 46 7
Non-Hispanic, single race4
White, total . . . . . . . . . . . . . . . . . . . . . . . . . . . . . . . . . . . . 2,056,332 78,641 364,824 616,812 643,398 294,521 58,136
Not stated 3 months before . . . . . . . . . . . . . . . . . . . . . . . . . 9,038 438 1,948 2,751 2,500 1,142 259 Not stated during pregnancy . . . . . . . . . . . . . . . . . . . . . . . . 9,210 441 1,995 2,798 2,527 1,178 271 Quit before pregnancy²:
Smokers . . . . . . . . . . . . . . . . . . . . . . . . . . . . . . . . . . . . 275,896 18,442 84,762 89,647 56,266 22,938 3,841 Unknown if quit . . . . . . . . . . . . . . . . . . . . . . . . . . . . . . 498 36 131 165 107 52 7
Quit during pregnancy³:Smokers . . . . . . . . . . . . . . . . . . . . . . . . . . . . . . . . . . . . 214,725 13,960 66,123 70,738 43,207 17,653 3,044 Unknown if quit . . . . . . . . . . . . . . . . . . . . . . . . . . . . . . 377 27 112 130 74 29 5
Black, total . . . . . . . . . . . . . . . . . . . . . . . . . . . . . . . . . . . . . 558,622 43,531 154,406 163,887 118,795 62,252 15,751
Not stated 3 months before . . . . . . . . . . . . . . . . . . . . . . . . . 3,518 261 1,014 1,084 677 396 86 Not stated during pregnancy . . . . . . . . . . . . . . . . . . . . . . . . 3,544 262 1,020 1,090 681 404 87 Quit before pregnancy²:
Smokers . . . . . . . . . . . . . . . . . . . . . . . . . . . . . . . . . . . . 43,813 1,896 12,488 15,097 9,324 4,258 750 Unknown if quit . . . . . . . . . . . . . . . . . . . . . . . . . . . . . . 158 9 48 48 29 21 3
Quit during pregnancy³:Smokers . . . . . . . . . . . . . . . . . . . . . . . . . . . . . . . . . . . . 33,454 1,355 9,072 11,601 7,400 3,401 625 Unknown if quit . . . . . . . . . . . . . . . . . . . . . . . . . . . . . . 91 1 34 29 19 7 1
Hispanic5
Total . . . . . . . . . . . . . . . . . . . . . . . . . . . . . . . . . . . . . . . . . 918,447 75,708 228,216 258,025 210,735 115,848 29,915
Not stated 3 months before . . . . . . . . . . . . . . . . . . . . . . . . . 3,833 331 1,004 1,026 835 477 160 Not stated during pregnancy . . . . . . . . . . . . . . . . . . . . . . . . 3,798 329 998 1,004 825 482 160 Quit before pregnancy²:
Smokers . . . . . . . . . . . . . . . . . . . . . . . . . . . . . . . . . . . . 26,072 2,098 8,317 8,056 4,939 2,262 400 Unknown if quit . . . . . . . . . . . . . . . . . . . . . . . . . . . . . . 61 4 25 17 9 6 –
Quit during pregnancy³:Smokers . . . . . . . . . . . . . . . . . . . . . . . . . . . . . . . . . . . . 16,314 1,218 4,888 5,204 3,225 1,512 267 Unknown if quit . . . . . . . . . . . . . . . . . . . . . . . . . . . . . . 42 2 11 11 14 4 –
– Quantity zero. 1Includes births to race and origin groups not shown separately, such as Hispanic single-race white, Hispanic single-race black, and non-Hispanic multiple-race women, as well as births with origin not stated. 2Quit in the 3 months before pregnancy: births to women not reporting smoking during pregnancy per 100 women who smoked in the 3 months before pregnancy. See Technical Notes. 3Quit during pregnancy: births to women not reporting smoking in the third trimester of pregnancy per 100 women who smoked in either the first or second trimester. See Technical Notes. 4Race and Hispanic origin are reported separately on birth certificates; persons of Hispanic origin may be of any race. In this table, non-Hispanic women are classified by race. Race categories are consistent with 1997 Office of Management and Budget standards; see Technical Notes. Single race is defined as only one race reported on the birth certificate. 5Includes all persons of Hispanic origin of any race; see Technical Notes.
SOURCE: NCHS, National Vital Statistics System, Natality.
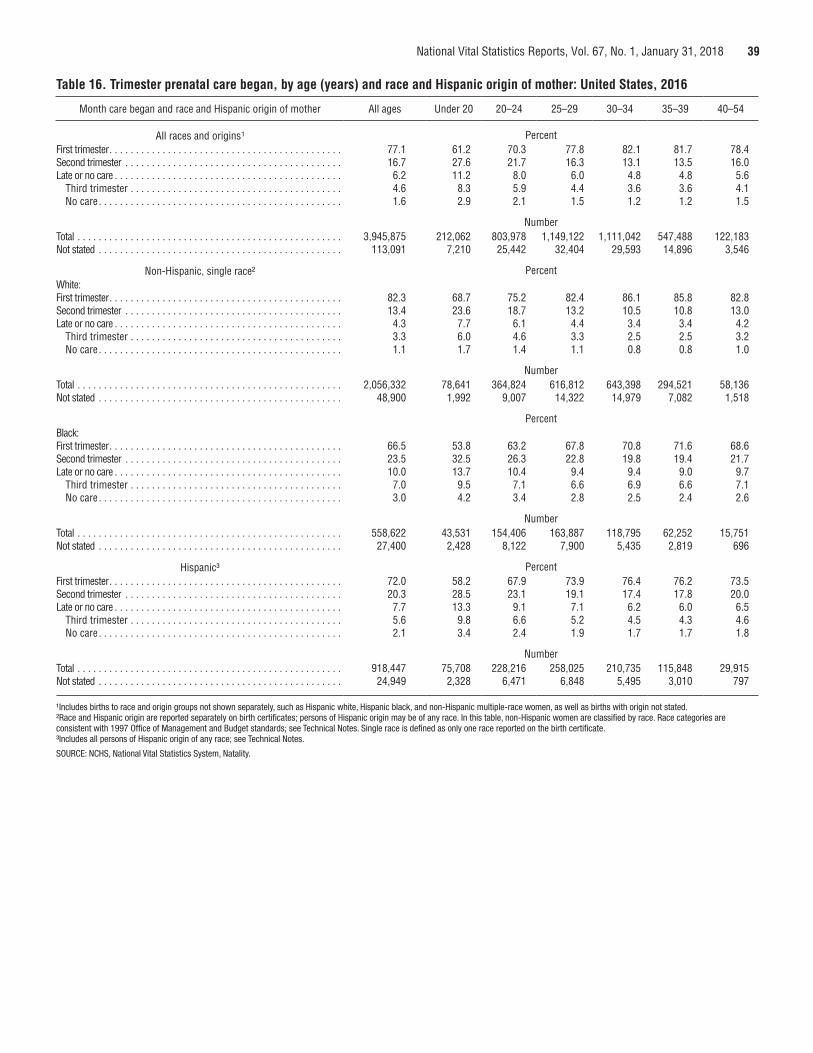
National Vital Statistics Reports, Vol. 67, No. 1, January 31, 2018 39
Table 16. Trimester prenatal care began, by age (years) and race and Hispanic origin of mother: United States, 2016
Month care began and race and Hispanic origin of mother All ages Under 20 20–24 25–29 30–34 35–39 40–54
All races and origins¹ PercentFirst trimester . . . . . . . . . . . . . . . . . . . . . . . . . . . . . . . . . . . . . . . . . . . . 77.1 61.2 70.3 77.8 82.1 81.7 78.4Second trimester . . . . . . . . . . . . . . . . . . . . . . . . . . . . . . . . . . . . . . . . . 16.7 27.6 21.7 16.3 13.1 13.5 16.0Late or no care . . . . . . . . . . . . . . . . . . . . . . . . . . . . . . . . . . . . . . . . . . . 6.2 11.2 8.0 6.0 4.8 4.8 5.6
Third trimester . . . . . . . . . . . . . . . . . . . . . . . . . . . . . . . . . . . . . . . . 4.6 8.3 5.9 4.4 3.6 3.6 4.1No care . . . . . . . . . . . . . . . . . . . . . . . . . . . . . . . . . . . . . . . . . . . . . . 1.6 2.9 2.1 1.5 1.2 1.2 1.5
NumberTotal . . . . . . . . . . . . . . . . . . . . . . . . . . . . . . . . . . . . . . . . . . . . . . . . . . 3,945,875 212,062 803,978 1,149,122 1,111,042 547,488 122,183 Not stated . . . . . . . . . . . . . . . . . . . . . . . . . . . . . . . . . . . . . . . . . . . . . . 113,091 7,210 25,442 32,404 29,593 14,896 3,546
Non-Hispanic, single race² PercentWhite:First trimester . . . . . . . . . . . . . . . . . . . . . . . . . . . . . . . . . . . . . . . . . . . . 82.3 68.7 75.2 82.4 86.1 85.8 82.8Second trimester . . . . . . . . . . . . . . . . . . . . . . . . . . . . . . . . . . . . . . . . . 13.4 23.6 18.7 13.2 10.5 10.8 13.0Late or no care . . . . . . . . . . . . . . . . . . . . . . . . . . . . . . . . . . . . . . . . . . . 4.3 7.7 6.1 4.4 3.4 3.4 4.2
Third trimester . . . . . . . . . . . . . . . . . . . . . . . . . . . . . . . . . . . . . . . . 3.3 6.0 4.6 3.3 2.5 2.5 3.2No care . . . . . . . . . . . . . . . . . . . . . . . . . . . . . . . . . . . . . . . . . . . . . . 1.1 1.7 1.4 1.1 0.8 0.8 1.0
NumberTotal . . . . . . . . . . . . . . . . . . . . . . . . . . . . . . . . . . . . . . . . . . . . . . . . . . 2,056,332 78,641 364,824 616,812 643,398 294,521 58,136 Not stated . . . . . . . . . . . . . . . . . . . . . . . . . . . . . . . . . . . . . . . . . . . . . . 48,900 1,992 9,007 14,322 14,979 7,082 1,518
PercentBlack:First trimester . . . . . . . . . . . . . . . . . . . . . . . . . . . . . . . . . . . . . . . . . . . . 66.5 53.8 63.2 67.8 70.8 71.6 68.6Second trimester . . . . . . . . . . . . . . . . . . . . . . . . . . . . . . . . . . . . . . . . . 23.5 32.5 26.3 22.8 19.8 19.4 21.7Late or no care . . . . . . . . . . . . . . . . . . . . . . . . . . . . . . . . . . . . . . . . . . . 10.0 13.7 10.4 9.4 9.4 9.0 9.7
Third trimester . . . . . . . . . . . . . . . . . . . . . . . . . . . . . . . . . . . . . . . . 7.0 9.5 7.1 6.6 6.9 6.6 7.1No care . . . . . . . . . . . . . . . . . . . . . . . . . . . . . . . . . . . . . . . . . . . . . . 3.0 4.2 3.4 2.8 2.5 2.4 2.6
NumberTotal . . . . . . . . . . . . . . . . . . . . . . . . . . . . . . . . . . . . . . . . . . . . . . . . . . 558,622 43,531 154,406 163,887 118,795 62,252 15,751 Not stated . . . . . . . . . . . . . . . . . . . . . . . . . . . . . . . . . . . . . . . . . . . . . . 27,400 2,428 8,122 7,900 5,435 2,819 696
Hispanic³ PercentFirst trimester . . . . . . . . . . . . . . . . . . . . . . . . . . . . . . . . . . . . . . . . . . . . 72.0 58.2 67.9 73.9 76.4 76.2 73.5Second trimester . . . . . . . . . . . . . . . . . . . . . . . . . . . . . . . . . . . . . . . . . 20.3 28.5 23.1 19.1 17.4 17.8 20.0Late or no care . . . . . . . . . . . . . . . . . . . . . . . . . . . . . . . . . . . . . . . . . . . 7.7 13.3 9.1 7.1 6.2 6.0 6.5
Third trimester . . . . . . . . . . . . . . . . . . . . . . . . . . . . . . . . . . . . . . . . 5.6 9.8 6.6 5.2 4.5 4.3 4.6No care . . . . . . . . . . . . . . . . . . . . . . . . . . . . . . . . . . . . . . . . . . . . . . 2.1 3.4 2.4 1.9 1.7 1.7 1.8
NumberTotal . . . . . . . . . . . . . . . . . . . . . . . . . . . . . . . . . . . . . . . . . . . . . . . . . . 918,447 75,708 228,216 258,025 210,735 115,848 29,915 Not stated . . . . . . . . . . . . . . . . . . . . . . . . . . . . . . . . . . . . . . . . . . . . . . 24,949 2,328 6,471 6,848 5,495 3,010 797
¹Includes births to race and origin groups not shown separately, such as Hispanic white, Hispanic black, and non-Hispanic multiple-race women, as well as births with origin not stated. ²Race and Hispanic origin are reported separately on birth certificates; persons of Hispanic origin may be of any race. In this table, non-Hispanic women are classified by race. Race categories are consistent with 1997 Office of Management and Budget standards; see Technical Notes. Single race is defined as only one race reported on the birth certificate. ³Includes all persons of Hispanic origin of any race; see Technical Notes.
SOURCE: NCHS, National Vital Statistics System, Natality.
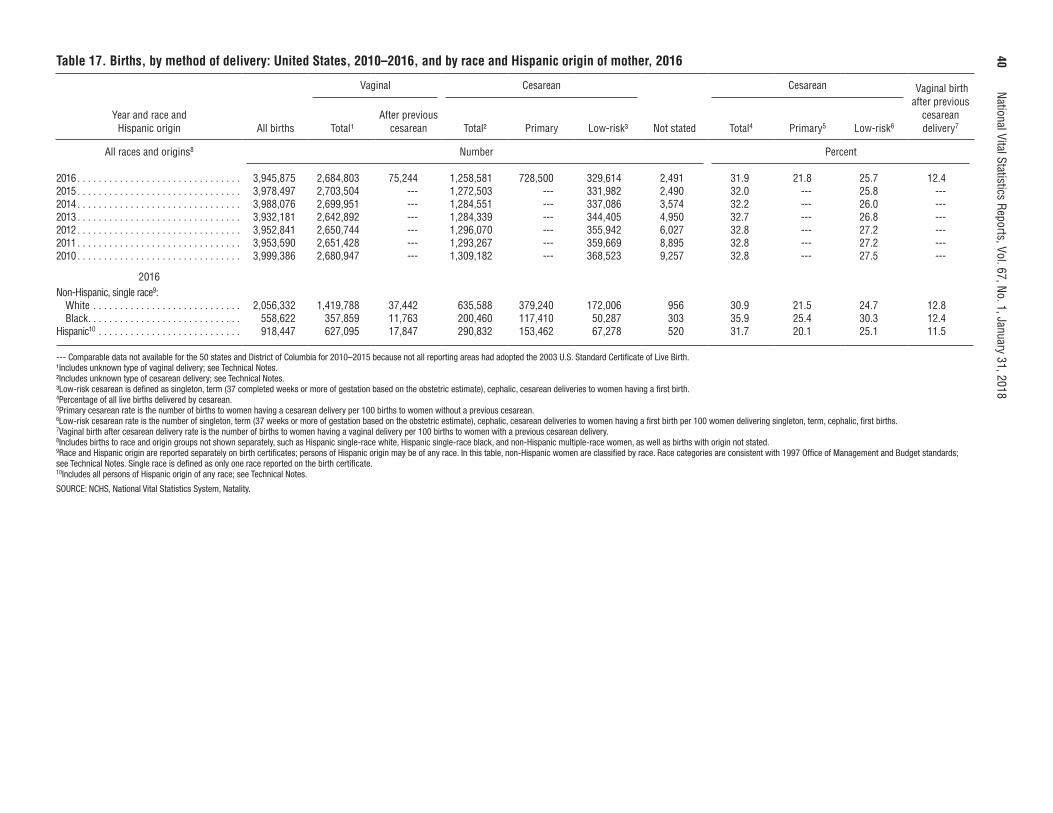
40
National Vital Statistics Reports, Vol. 67, No. 1, January 31, 2018Table 17. Births, by method of delivery: United States, 2010–2016, and by race and Hispanic origin of mother, 2016
Year and race and Hispanic origin All births
Vaginal Cesarean
Not stated
Cesarean Vaginal birth after previous
cesarean delivery7Total¹
After previous cesarean Total² Primary Low-risk³ Total4 Primary5 Low-risk6
All races and origins8 Number Percent
2016 . . . . . . . . . . . . . . . . . . . . . . . . . . . . . . . 3,945,875 2,684,803 75,244 1,258,581 728,500 329,614 2,491 31.9 21.8 25.7 12.4 2015 . . . . . . . . . . . . . . . . . . . . . . . . . . . . . . . 3,978,497 2,703,504 --- 1,272,503 --- 331,982 2,490 32.0 --- 25.8 --- 2014 . . . . . . . . . . . . . . . . . . . . . . . . . . . . . . . 3,988,076 2,699,951 --- 1,284,551 --- 337,086 3,574 32.2 --- 26.0 --- 2013 . . . . . . . . . . . . . . . . . . . . . . . . . . . . . . . 3,932,181 2,642,892 --- 1,284,339 --- 344,405 4,950 32.7 --- 26.8 --- 2012 . . . . . . . . . . . . . . . . . . . . . . . . . . . . . . . 3,952,841 2,650,744 --- 1,296,070 --- 355,942 6,027 32.8 --- 27.2 --- 2011 . . . . . . . . . . . . . . . . . . . . . . . . . . . . . . . 3,953,590 2,651,428 --- 1,293,267 --- 359,669 8,895 32.8 --- 27.2 --- 2010 . . . . . . . . . . . . . . . . . . . . . . . . . . . . . . . 3,999,386 2,680,947 --- 1,309,182 --- 368,523 9,257 32.8 --- 27.5 ---
2016Non-Hispanic, single race9:
White . . . . . . . . . . . . . . . . . . . . . . . . . . . . 2,056,332 1,419,788 37,442 635,588 379,240 172,006 956 30.9 21.5 24.7 12.8 Black . . . . . . . . . . . . . . . . . . . . . . . . . . . . . 558,622 357,859 11,763 200,460 117,410 50,287 303 35.9 25.4 30.3 12.4
Hispanic10 . . . . . . . . . . . . . . . . . . . . . . . . . . . 918,447 627,095 17,847 290,832 153,462 67,278 520 31.7 20.1 25.1 11.5
--- Comparable data not available for the 50 states and District of Columbia for 2010–2015 because not all reporting areas had adopted the 2003 U.S. Standard Certificate of Live Birth. ¹Includes unknown type of vaginal delivery; see Technical Notes. ²Includes unknown type of cesarean delivery; see Technical Notes. ³Low-risk cesarean is defined as singleton, term (37 completed weeks or more of gestation based on the obstetric estimate), cephalic, cesarean deliveries to women having a first birth. 4Percentage of all live births delivered by cesarean. 5Primary cesarean rate is the number of births to women having a cesarean delivery per 100 births to women without a previous cesarean. 6Low-risk cesarean rate is the number of singleton, term (37 weeks or more of gestation based on the obstetric estimate), cephalic, cesarean deliveries to women having a first birth per 100 women delivering singleton, term, cephalic, first births. 7Vaginal birth after cesarean delivery rate is the number of births to women having a vaginal delivery per 100 births to women with a previous cesarean delivery. 8Includes births to race and origin groups not shown separately, such as Hispanic single-race white, Hispanic single-race black, and non-Hispanic multiple-race women, as well as births with origin not stated. 9Race and Hispanic origin are reported separately on birth certificates; persons of Hispanic origin may be of any race. In this table, non-Hispanic women are classified by race. Race categories are consistent with 1997 Office of Management and Budget standards; see Technical Notes. Single race is defined as only one race reported on the birth certificate. 10Includes all persons of Hispanic origin of any race; see Technical Notes.
SOURCE: NCHS, National Vital Statistics System, Natality.
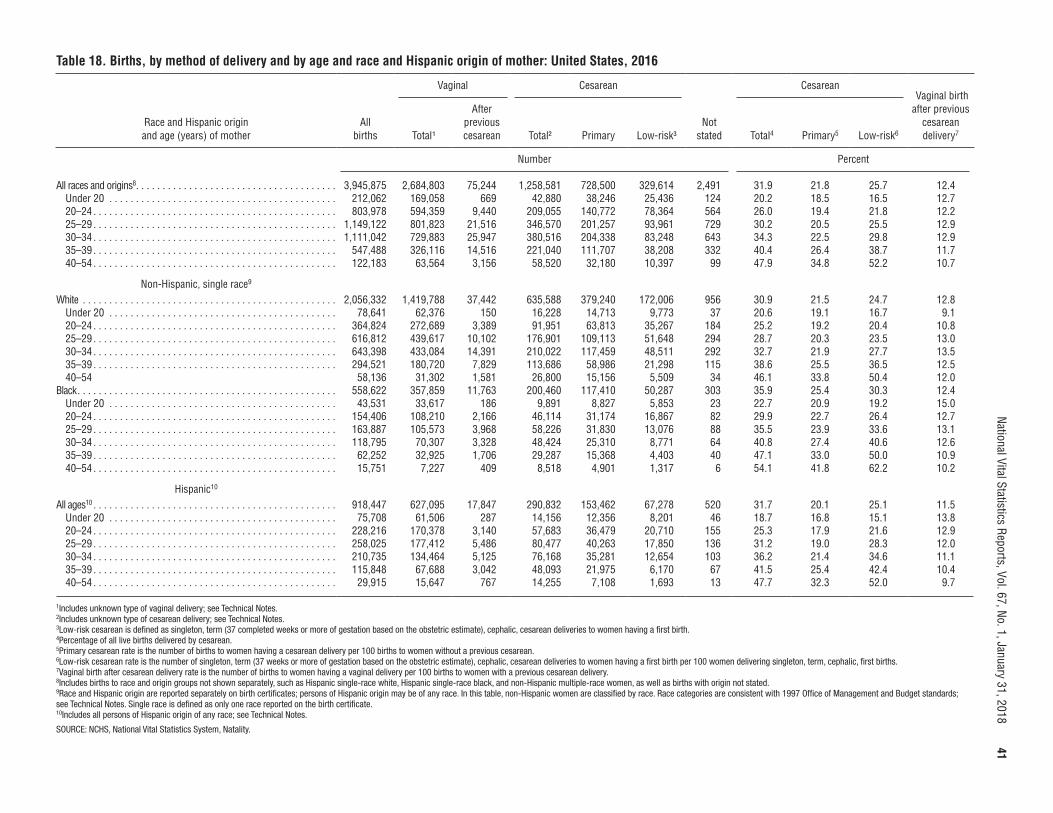
National Vital Statistics Reports, Vol. 67, No. 1, January 31, 2018
41Table 18. Births, by method of delivery and by age and race and Hispanic origin of mother: United States, 2016
Race and Hispanic origin and age (years) of mother
All births
Vaginal Cesarean
Not stated
Cesarean Vaginal birth after previous
cesarean delivery7Total¹
After previous cesarean Total² Primary Low-risk³ Total4 Primary5 Low-risk6
Number Percent
All races and origins8 . . . . . . . . . . . . . . . . . . . . . . . . . . . . . . . . . . . . . . 3,945,875 2,684,803 75,244 1,258,581 728,500 329,614 2,491 31.9 21.8 25.7 12.4Under 20 . . . . . . . . . . . . . . . . . . . . . . . . . . . . . . . . . . . . . . . . . . . 212,062 169,058 669 42,880 38,246 25,436 124 20.2 18.5 16.5 12.720–24 . . . . . . . . . . . . . . . . . . . . . . . . . . . . . . . . . . . . . . . . . . . . . . 803,978 594,359 9,440 209,055 140,772 78,364 564 26.0 19.4 21.8 12.225–29 . . . . . . . . . . . . . . . . . . . . . . . . . . . . . . . . . . . . . . . . . . . . . . 1,149,122 801,823 21,516 346,570 201,257 93,961 729 30.2 20.5 25.5 12.930–34 . . . . . . . . . . . . . . . . . . . . . . . . . . . . . . . . . . . . . . . . . . . . . . 1,111,042 729,883 25,947 380,516 204,338 83,248 643 34.3 22.5 29.8 12.935–39 . . . . . . . . . . . . . . . . . . . . . . . . . . . . . . . . . . . . . . . . . . . . . . 547,488 326,116 14,516 221,040 111,707 38,208 332 40.4 26.4 38.7 11.740–54 . . . . . . . . . . . . . . . . . . . . . . . . . . . . . . . . . . . . . . . . . . . . . . 122,183 63,564 3,156 58,520 32,180 10,397 99 47.9 34.8 52.2 10.7
Non-Hispanic, single race9
White . . . . . . . . . . . . . . . . . . . . . . . . . . . . . . . . . . . . . . . . . . . . . . . . 2,056,332 1,419,788 37,442 635,588 379,240 172,006 956 30.9 21.5 24.7 12.8Under 20 . . . . . . . . . . . . . . . . . . . . . . . . . . . . . . . . . . . . . . . . . . . 78,641 62,376 150 16,228 14,713 9,773 37 20.6 19.1 16.7 9.120–24 . . . . . . . . . . . . . . . . . . . . . . . . . . . . . . . . . . . . . . . . . . . . . . 364,824 272,689 3,389 91,951 63,813 35,267 184 25.2 19.2 20.4 10.825–29 . . . . . . . . . . . . . . . . . . . . . . . . . . . . . . . . . . . . . . . . . . . . . . 616,812 439,617 10,102 176,901 109,113 51,648 294 28.7 20.3 23.5 13.030–34 . . . . . . . . . . . . . . . . . . . . . . . . . . . . . . . . . . . . . . . . . . . . . . 643,398 433,084 14,391 210,022 117,459 48,511 292 32.7 21.9 27.7 13.535–39 . . . . . . . . . . . . . . . . . . . . . . . . . . . . . . . . . . . . . . . . . . . . . . 294,521 180,720 7,829 113,686 58,986 21,298 115 38.6 25.5 36.5 12.540–54 58,136 31,302 1,581 26,800 15,156 5,509 34 46.1 33.8 50.4 12.0
Black . . . . . . . . . . . . . . . . . . . . . . . . . . . . . . . . . . . . . . . . . . . . . . . . . 558,622 357,859 11,763 200,460 117,410 50,287 303 35.9 25.4 30.3 12.4Under 20 . . . . . . . . . . . . . . . . . . . . . . . . . . . . . . . . . . . . . . . . . . . 43,531 33,617 186 9,891 8,827 5,853 23 22.7 20.9 19.2 15.020–24 . . . . . . . . . . . . . . . . . . . . . . . . . . . . . . . . . . . . . . . . . . . . . . 154,406 108,210 2,166 46,114 31,174 16,867 82 29.9 22.7 26.4 12.725–29 . . . . . . . . . . . . . . . . . . . . . . . . . . . . . . . . . . . . . . . . . . . . . . 163,887 105,573 3,968 58,226 31,830 13,076 88 35.5 23.9 33.6 13.130–34 . . . . . . . . . . . . . . . . . . . . . . . . . . . . . . . . . . . . . . . . . . . . . . 118,795 70,307 3,328 48,424 25,310 8,771 64 40.8 27.4 40.6 12.635–39 . . . . . . . . . . . . . . . . . . . . . . . . . . . . . . . . . . . . . . . . . . . . . . 62,252 32,925 1,706 29,287 15,368 4,403 40 47.1 33.0 50.0 10.940–54 . . . . . . . . . . . . . . . . . . . . . . . . . . . . . . . . . . . . . . . . . . . . . . 15,751 7,227 409 8,518 4,901 1,317 6 54.1 41.8 62.2 10.2
Hispanic10
All ages10 . . . . . . . . . . . . . . . . . . . . . . . . . . . . . . . . . . . . . . . . . . . . . . 918,447 627,095 17,847 290,832 153,462 67,278 520 31.7 20.1 25.1 11.5Under 20 . . . . . . . . . . . . . . . . . . . . . . . . . . . . . . . . . . . . . . . . . . . 75,708 61,506 287 14,156 12,356 8,201 46 18.7 16.8 15.1 13.820–24 . . . . . . . . . . . . . . . . . . . . . . . . . . . . . . . . . . . . . . . . . . . . . . 228,216 170,378 3,140 57,683 36,479 20,710 155 25.3 17.9 21.6 12.925–29 . . . . . . . . . . . . . . . . . . . . . . . . . . . . . . . . . . . . . . . . . . . . . . 258,025 177,412 5,486 80,477 40,263 17,850 136 31.2 19.0 28.3 12.030–34 . . . . . . . . . . . . . . . . . . . . . . . . . . . . . . . . . . . . . . . . . . . . . . 210,735 134,464 5,125 76,168 35,281 12,654 103 36.2 21.4 34.6 11.135–39 . . . . . . . . . . . . . . . . . . . . . . . . . . . . . . . . . . . . . . . . . . . . . . 115,848 67,688 3,042 48,093 21,975 6,170 67 41.5 25.4 42.4 10.440–54 . . . . . . . . . . . . . . . . . . . . . . . . . . . . . . . . . . . . . . . . . . . . . . 29,915 15,647 767 14,255 7,108 1,693 13 47.7 32.3 52.0 9.7
1Includes unknown type of vaginal delivery; see Technical Notes. 2Includes unknown type of cesarean delivery; see Technical Notes. 3Low-risk cesarean is defined as singleton, term (37 completed weeks or more of gestation based on the obstetric estimate), cephalic, cesarean deliveries to women having a first birth. 4Percentage of all live births delivered by cesarean. 5Primary cesarean rate is the number of births to women having a cesarean delivery per 100 births to women without a previous cesarean. 6Low-risk cesarean rate is the number of singleton, term (37 weeks or more of gestation based on the obstetric estimate), cephalic, cesarean deliveries to women having a first birth per 100 women delivering singleton, term, cephalic, first births. 7Vaginal birth after cesarean delivery rate is the number of births to women having a vaginal delivery per 100 births to women with a previous cesarean delivery. 8Includes births to race and origin groups not shown separately, such as Hispanic single-race white, Hispanic single-race black, and non-Hispanic multiple-race women, as well as births with origin not stated. 9Race and Hispanic origin are reported separately on birth certificates; persons of Hispanic origin may be of any race. In this table, non-Hispanic women are classified by race. Race categories are consistent with 1997 Office of Management and Budget standards; see Technical Notes. Single race is defined as only one race reported on the birth certificate. 10Includes all persons of Hispanic origin of any race; see Technical Notes.
SOURCE: NCHS, National Vital Statistics System, Natality.
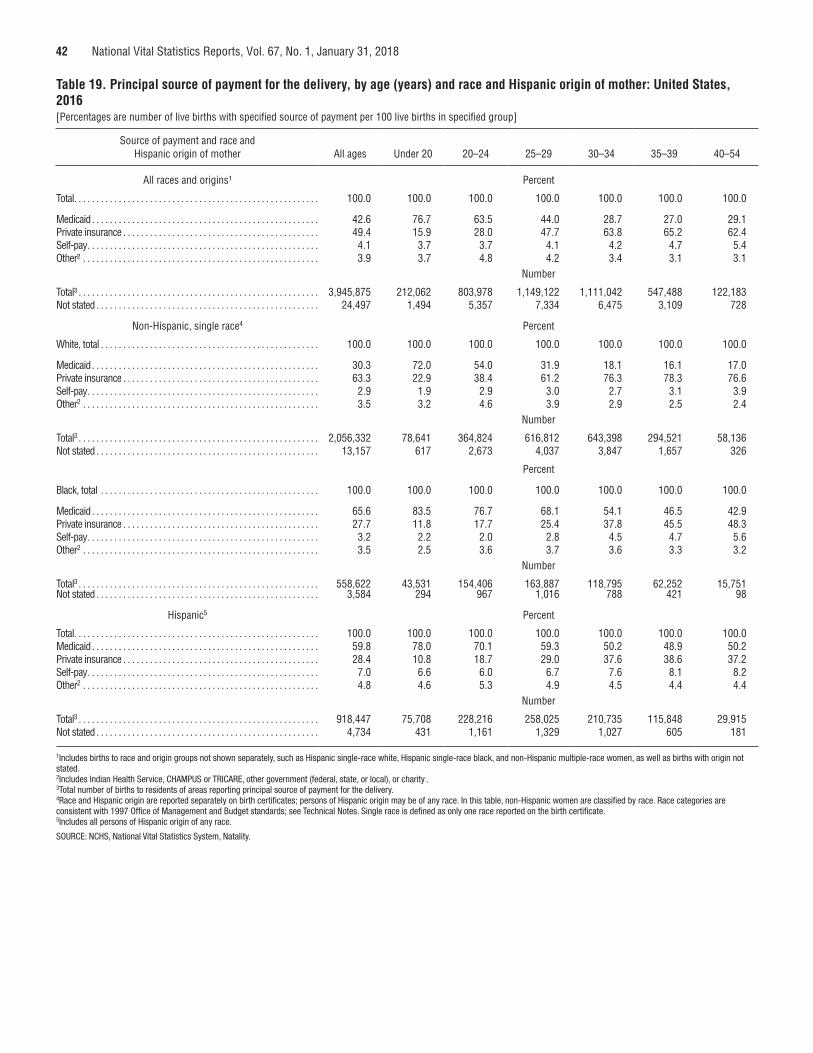
42 National Vital Statistics Reports, Vol. 67, No. 1, January 31, 2018
Table 19. Principal source of payment for the delivery, by age (years) and race and Hispanic origin of mother: United States, 2016[Percentages are number of live births with specified source of payment per 100 live births in specified group]
Source of payment and race and Hispanic origin of mother All ages Under 20 20–24 25–29 30–34 35–39 40–54
All races and origins¹ Percent
Total . . . . . . . . . . . . . . . . . . . . . . . . . . . . . . . . . . . . . . . . . . . . . . . . . . . . . . . 100.0 100.0 100.0 100.0 100.0 100.0 100.0
Medicaid . . . . . . . . . . . . . . . . . . . . . . . . . . . . . . . . . . . . . . . . . . . . . . . . . . . 42.6 76.7 63.5 44.0 28.7 27.0 29.1Private insurance . . . . . . . . . . . . . . . . . . . . . . . . . . . . . . . . . . . . . . . . . . . . 49.4 15.9 28.0 47.7 63.8 65.2 62.4Self-pay . . . . . . . . . . . . . . . . . . . . . . . . . . . . . . . . . . . . . . . . . . . . . . . . . . . . 4.1 3.7 3.7 4.1 4.2 4.7 5.4Other² . . . . . . . . . . . . . . . . . . . . . . . . . . . . . . . . . . . . . . . . . . . . . . . . . . . . . 3.9 3.7 4.8 4.2 3.4 3.1 3.1
Number
Total³ . . . . . . . . . . . . . . . . . . . . . . . . . . . . . . . . . . . . . . . . . . . . . . . . . . . . . . 3,945,875 212,062 803,978 1,149,122 1,111,042 547,488 122,183 Not stated . . . . . . . . . . . . . . . . . . . . . . . . . . . . . . . . . . . . . . . . . . . . . . . . . . 24,497 1,494 5,357 7,334 6,475 3,109 728
Non-Hispanic, single race4 Percent
White, total . . . . . . . . . . . . . . . . . . . . . . . . . . . . . . . . . . . . . . . . . . . . . . . . . 100.0 100.0 100.0 100.0 100.0 100.0 100.0
Medicaid . . . . . . . . . . . . . . . . . . . . . . . . . . . . . . . . . . . . . . . . . . . . . . . . . . . 30.3 72.0 54.0 31.9 18.1 16.1 17.0Private insurance . . . . . . . . . . . . . . . . . . . . . . . . . . . . . . . . . . . . . . . . . . . . 63.3 22.9 38.4 61.2 76.3 78.3 76.6Self-pay . . . . . . . . . . . . . . . . . . . . . . . . . . . . . . . . . . . . . . . . . . . . . . . . . . . . 2.9 1.9 2.9 3.0 2.7 3.1 3.9Other2 . . . . . . . . . . . . . . . . . . . . . . . . . . . . . . . . . . . . . . . . . . . . . . . . . . . . . 3.5 3.2 4.6 3.9 2.9 2.5 2.4
Number
Total3 . . . . . . . . . . . . . . . . . . . . . . . . . . . . . . . . . . . . . . . . . . . . . . . . . . . . . . 2,056,332 78,641 364,824 616,812 643,398 294,521 58,136 Not stated . . . . . . . . . . . . . . . . . . . . . . . . . . . . . . . . . . . . . . . . . . . . . . . . . . 13,157 617 2,673 4,037 3,847 1,657 326
Percent
Black, total . . . . . . . . . . . . . . . . . . . . . . . . . . . . . . . . . . . . . . . . . . . . . . . . . 100.0 100.0 100.0 100.0 100.0 100.0 100.0
Medicaid . . . . . . . . . . . . . . . . . . . . . . . . . . . . . . . . . . . . . . . . . . . . . . . . . . . 65.6 83.5 76.7 68.1 54.1 46.5 42.9Private insurance . . . . . . . . . . . . . . . . . . . . . . . . . . . . . . . . . . . . . . . . . . . . 27.7 11.8 17.7 25.4 37.8 45.5 48.3Self-pay . . . . . . . . . . . . . . . . . . . . . . . . . . . . . . . . . . . . . . . . . . . . . . . . . . . . 3.2 2.2 2.0 2.8 4.5 4.7 5.6Other2 . . . . . . . . . . . . . . . . . . . . . . . . . . . . . . . . . . . . . . . . . . . . . . . . . . . . . 3.5 2.5 3.6 3.7 3.6 3.3 3.2
Number
Total3 . . . . . . . . . . . . . . . . . . . . . . . . . . . . . . . . . . . . . . . . . . . . . . . . . . . . . . 558,622 43,531 154,406 163,887 118,795 62,252 15,751 Not stated . . . . . . . . . . . . . . . . . . . . . . . . . . . . . . . . . . . . . . . . . . . . . . . . . . 3,584 294 967 1,016 788 421 98
Hispanic5 Percent
Total . . . . . . . . . . . . . . . . . . . . . . . . . . . . . . . . . . . . . . . . . . . . . . . . . . . . . . . 100.0 100.0 100.0 100.0 100.0 100.0 100.0Medicaid . . . . . . . . . . . . . . . . . . . . . . . . . . . . . . . . . . . . . . . . . . . . . . . . . . . 59.8 78.0 70.1 59.3 50.2 48.9 50.2Private insurance . . . . . . . . . . . . . . . . . . . . . . . . . . . . . . . . . . . . . . . . . . . . 28.4 10.8 18.7 29.0 37.6 38.6 37.2Self-pay . . . . . . . . . . . . . . . . . . . . . . . . . . . . . . . . . . . . . . . . . . . . . . . . . . . . 7.0 6.6 6.0 6.7 7.6 8.1 8.2Other2 . . . . . . . . . . . . . . . . . . . . . . . . . . . . . . . . . . . . . . . . . . . . . . . . . . . . . 4.8 4.6 5.3 4.9 4.5 4.4 4.4
Number
Total3 . . . . . . . . . . . . . . . . . . . . . . . . . . . . . . . . . . . . . . . . . . . . . . . . . . . . . . 918,447 75,708 228,216 258,025 210,735 115,848 29,915 Not stated . . . . . . . . . . . . . . . . . . . . . . . . . . . . . . . . . . . . . . . . . . . . . . . . . . 4,734 431 1,161 1,329 1,027 605 181
1Includes births to race and origin groups not shown separately, such as Hispanic single-race white, Hispanic single-race black, and non-Hispanic multiple-race women, as well as births with origin not stated.2Includes Indian Health Service, CHAMPUS or TRICARE, other government (federal, state, or local), or charity.. 3Total number of births to residents of areas reporting principal source of payment for the delivery. 4Race and Hispanic origin are reported separately on birth certificates; persons of Hispanic origin may be of any race. In this table, non-Hispanic women are classified by race. Race categories are consistent with 1997 Office of Management and Budget standards; see Technical Notes. Single race is defined as only one race reported on the birth certificate. 5Includes all persons of Hispanic origin of any race.
SOURCE: NCHS, National Vital Statistics System, Natality.
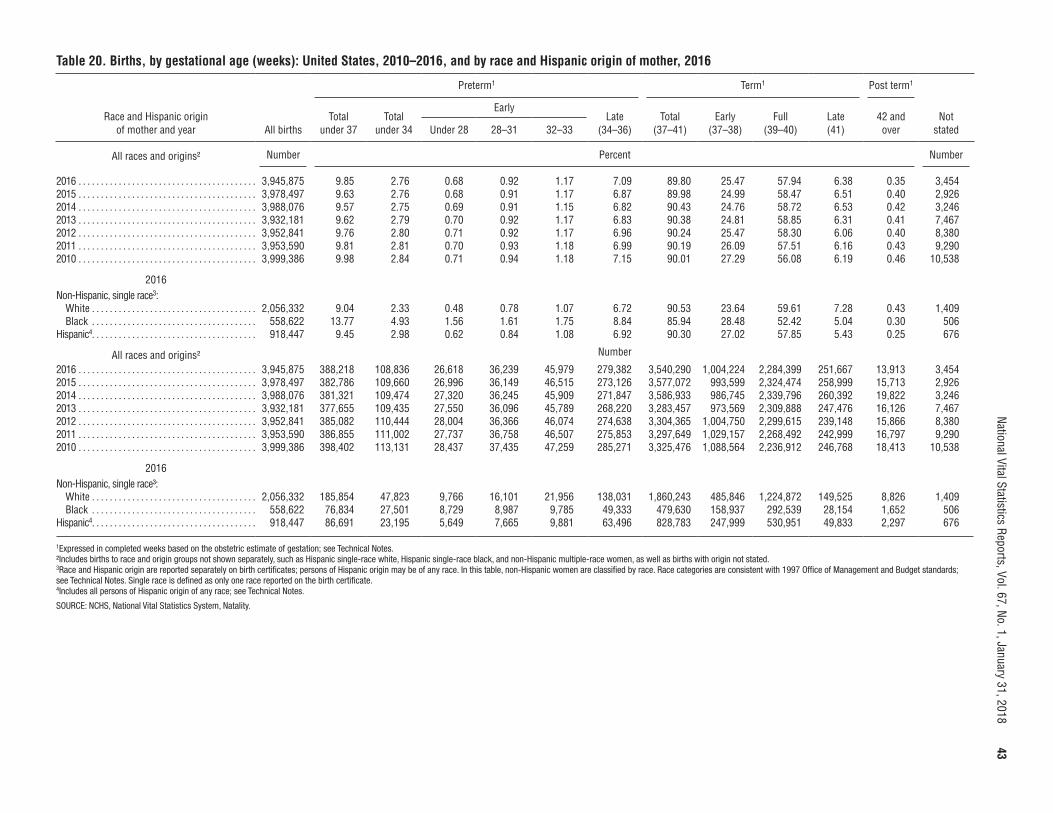
National Vital Statistics Reports, Vol. 67, No. 1, January 31, 2018
43Table 20. Births, by gestational age (weeks): United States, 2010–2016, and by race and Hispanic origin of mother, 2016
Race and Hispanic origin of mother and year All births
Preterm1 Term1 Post term1
Not stated
Total under 37
Total under 34
Early Late
(34–36)Total
(37–41) Early
(37–38)Full
(39–40)Late (41)
42 and overUnder 28 28–31 32–33
All races and origins² Number Percent Number
2016 . . . . . . . . . . . . . . . . . . . . . . . . . . . . . . . . . . . . . . . . 3,945,875 9.85 2.76 0.68 0.92 1.17 7.09 89.80 25.47 57.94 6.38 0.35 3,454 2015 . . . . . . . . . . . . . . . . . . . . . . . . . . . . . . . . . . . . . . . . 3,978,497 9.63 2.76 0.68 0.91 1.17 6.87 89.98 24.99 58.47 6.51 0.40 2,926 2014 . . . . . . . . . . . . . . . . . . . . . . . . . . . . . . . . . . . . . . . . 3,988,076 9.57 2.75 0.69 0.91 1.15 6.82 90.43 24.76 58.72 6.53 0.42 3,246 2013 . . . . . . . . . . . . . . . . . . . . . . . . . . . . . . . . . . . . . . . . 3,932,181 9.62 2.79 0.70 0.92 1.17 6.83 90.38 24.81 58.85 6.31 0.41 7,467 2012 . . . . . . . . . . . . . . . . . . . . . . . . . . . . . . . . . . . . . . . . 3,952,841 9.76 2.80 0.71 0.92 1.17 6.96 90.24 25.47 58.30 6.06 0.40 8,380 2011 . . . . . . . . . . . . . . . . . . . . . . . . . . . . . . . . . . . . . . . . 3,953,590 9.81 2.81 0.70 0.93 1.18 6.99 90.19 26.09 57.51 6.16 0.43 9,290 2010 . . . . . . . . . . . . . . . . . . . . . . . . . . . . . . . . . . . . . . . . 3,999,386 9.98 2.84 0.71 0.94 1.18 7.15 90.01 27.29 56.08 6.19 0.46 10,538
2016Non-Hispanic, single race3:
White . . . . . . . . . . . . . . . . . . . . . . . . . . . . . . . . . . . . . 2,056,332 9.04 2.33 0.48 0.78 1.07 6.72 90.53 23.64 59.61 7.28 0.43 1,409 Black . . . . . . . . . . . . . . . . . . . . . . . . . . . . . . . . . . . . . 558,622 13.77 4.93 1.56 1.61 1.75 8.84 85.94 28.48 52.42 5.04 0.30 506
Hispanic4. . . . . . . . . . . . . . . . . . . . . . . . . . . . . . . . . . . . . 918,447 9.45 2.98 0.62 0.84 1.08 6.92 90.30 27.02 57.85 5.43 0.25 676
All races and origins² Number
2016 . . . . . . . . . . . . . . . . . . . . . . . . . . . . . . . . . . . . . . . . 3,945,875 388,218 108,836 26,618 36,239 45,979 279,382 3,540,290 1,004,224 2,284,399 251,667 13,913 3,454 2015 . . . . . . . . . . . . . . . . . . . . . . . . . . . . . . . . . . . . . . . . 3,978,497 382,786 109,660 26,996 36,149 46,515 273,126 3,577,072 993,599 2,324,474 258,999 15,713 2,926 2014 . . . . . . . . . . . . . . . . . . . . . . . . . . . . . . . . . . . . . . . . 3,988,076 381,321 109,474 27,320 36,245 45,909 271,847 3,586,933 986,745 2,339,796 260,392 19,822 3,246 2013 . . . . . . . . . . . . . . . . . . . . . . . . . . . . . . . . . . . . . . . . 3,932,181 377,655 109,435 27,550 36,096 45,789 268,220 3,283,457 973,569 2,309,888 247,476 16,126 7,467 2012 . . . . . . . . . . . . . . . . . . . . . . . . . . . . . . . . . . . . . . . . 3,952,841 385,082 110,444 28,004 36,366 46,074 274,638 3,304,365 1,004,750 2,299,615 239,148 15,866 8,380 2011 . . . . . . . . . . . . . . . . . . . . . . . . . . . . . . . . . . . . . . . . 3,953,590 386,855 111,002 27,737 36,758 46,507 275,853 3,297,649 1,029,157 2,268,492 242,999 16,797 9,290 2010 . . . . . . . . . . . . . . . . . . . . . . . . . . . . . . . . . . . . . . . . 3,999,386 398,402 113,131 28,437 37,435 47,259 285,271 3,325,476 1,088,564 2,236,912 246,768 18,413 10,538
2016Non-Hispanic, single race³:
White . . . . . . . . . . . . . . . . . . . . . . . . . . . . . . . . . . . . . 2,056,332 185,854 47,823 9,766 16,101 21,956 138,031 1,860,243 485,846 1,224,872 149,525 8,826 1,409 Black . . . . . . . . . . . . . . . . . . . . . . . . . . . . . . . . . . . . . 558,622 76,834 27,501 8,729 8,987 9,785 49,333 479,630 158,937 292,539 28,154 1,652 506
Hispanic4. . . . . . . . . . . . . . . . . . . . . . . . . . . . . . . . . . . . . 918,447 86,691 23,195 5,649 7,665 9,881 63,496 828,783 247,999 530,951 49,833 2,297 676
1Expressed in completed weeks based on the obstetric estimate of gestation; see Technical Notes. ²Includes births to race and origin groups not shown separately, such as Hispanic single-race white, Hispanic single-race black, and non-Hispanic multiple-race women, as well as births with origin not stated. 3Race and Hispanic origin are reported separately on birth certificates; persons of Hispanic origin may be of any race. In this table, non-Hispanic women are classified by race. Race categories are consistent with 1997 Office of Management and Budget standards; see Technical Notes. Single race is defined as only one race reported on the birth certificate. 4Includes all persons of Hispanic origin of any race; see Technical Notes.
SOURCE: NCHS, National Vital Statistics System, Natality.
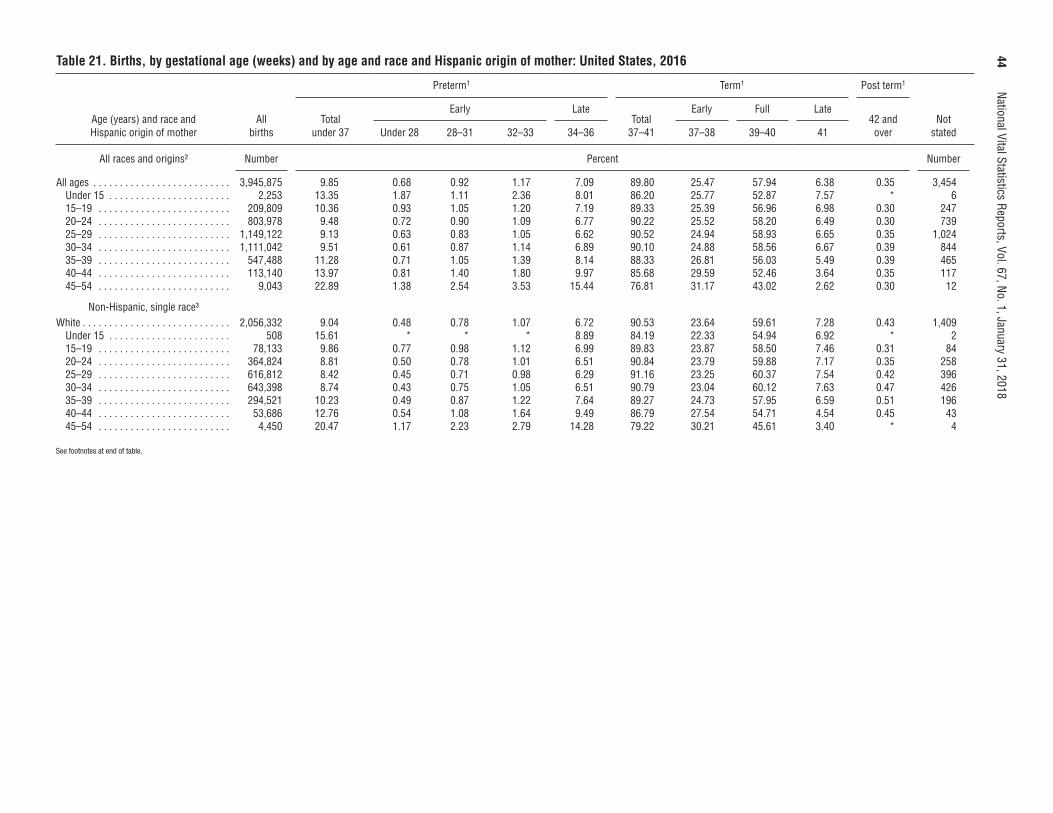
44
National Vital Statistics Reports, Vol. 67, No. 1, January 31, 2018Table 21. Births, by gestational age (weeks) and by age and race and Hispanic origin of mother: United States, 2016
Age (years) and race and Hispanic origin of mother
All births
Preterm1 Term1 Post term1
Not stated
Total under 37
Early LateTotal
37–41
Early Full Late42 and overUnder 28 28–31 32–33 34–36 37–38 39–40 41
All races and origins² Number Percent Number
All ages . . . . . . . . . . . . . . . . . . . . . . . . . . 3,945,875 9.85 0.68 0.92 1.17 7.09 89.80 25.47 57.94 6.38 0.35 3,454 Under 15 . . . . . . . . . . . . . . . . . . . . . . . 2,253 13.35 1.87 1.11 2.36 8.01 86.20 25.77 52.87 7.57 * 6 15–19 . . . . . . . . . . . . . . . . . . . . . . . . . 209,809 10.36 0.93 1.05 1.20 7.19 89.33 25.39 56.96 6.98 0.30 247 20–24 . . . . . . . . . . . . . . . . . . . . . . . . . 803,978 9.48 0.72 0.90 1.09 6.77 90.22 25.52 58.20 6.49 0.30 739 25–29 . . . . . . . . . . . . . . . . . . . . . . . . . 1,149,122 9.13 0.63 0.83 1.05 6.62 90.52 24.94 58.93 6.65 0.35 1,024 30–34 . . . . . . . . . . . . . . . . . . . . . . . . . 1,111,042 9.51 0.61 0.87 1.14 6.89 90.10 24.88 58.56 6.67 0.39 844 35–39 . . . . . . . . . . . . . . . . . . . . . . . . . 547,488 11.28 0.71 1.05 1.39 8.14 88.33 26.81 56.03 5.49 0.39 465 40–44 . . . . . . . . . . . . . . . . . . . . . . . . . 113,140 13.97 0.81 1.40 1.80 9.97 85.68 29.59 52.46 3.64 0.35 117 45–54 . . . . . . . . . . . . . . . . . . . . . . . . . 9,043 22.89 1.38 2.54 3.53 15.44 76.81 31.17 43.02 2.62 0.30 12
Non-Hispanic, single race³White . . . . . . . . . . . . . . . . . . . . . . . . . . . . 2,056,332 9.04 0.48 0.78 1.07 6.72 90.53 23.64 59.61 7.28 0.43 1,409
Under 15 . . . . . . . . . . . . . . . . . . . . . . . 508 15.61 * * * 8.89 84.19 22.33 54.94 6.92 * 2 15–19 . . . . . . . . . . . . . . . . . . . . . . . . . 78,133 9.86 0.77 0.98 1.12 6.99 89.83 23.87 58.50 7.46 0.31 84 20–24 . . . . . . . . . . . . . . . . . . . . . . . . . 364,824 8.81 0.50 0.78 1.01 6.51 90.84 23.79 59.88 7.17 0.35 258 25–29 . . . . . . . . . . . . . . . . . . . . . . . . . 616,812 8.42 0.45 0.71 0.98 6.29 91.16 23.25 60.37 7.54 0.42 396 30–34 . . . . . . . . . . . . . . . . . . . . . . . . . 643,398 8.74 0.43 0.75 1.05 6.51 90.79 23.04 60.12 7.63 0.47 426 35–39 . . . . . . . . . . . . . . . . . . . . . . . . . 294,521 10.23 0.49 0.87 1.22 7.64 89.27 24.73 57.95 6.59 0.51 196 40–44 . . . . . . . . . . . . . . . . . . . . . . . . . 53,686 12.76 0.54 1.08 1.64 9.49 86.79 27.54 54.71 4.54 0.45 43 45–54 . . . . . . . . . . . . . . . . . . . . . . . . . 4,450 20.47 1.17 2.23 2.79 14.28 79.22 30.21 45.61 3.40 * 4
See footnotes at end of table.
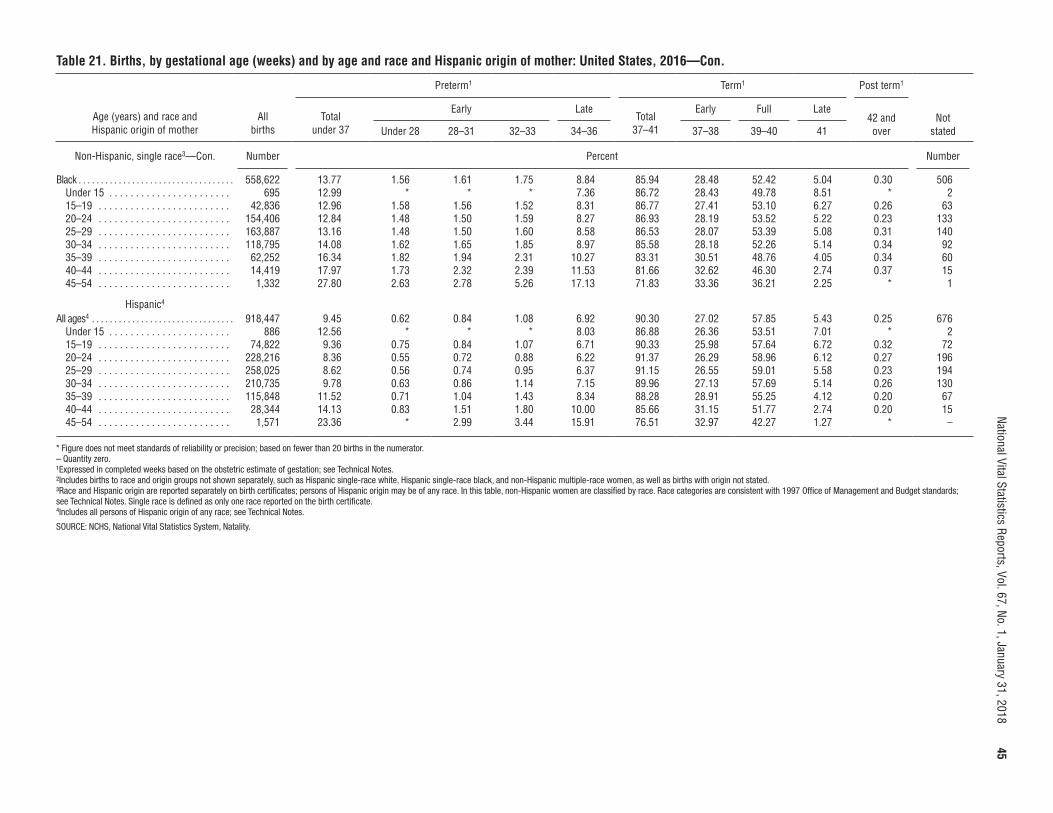
National Vital Statistics Reports, Vol. 67, No. 1, January 31, 2018
45Table 21. Births, by gestational age (weeks) and by age and race and Hispanic origin of mother: United States, 2016—Con.
Age (years) and race and Hispanic origin of mother
All births
Preterm1 Term1 Post term1
Not stated
Total under 37
Early LateTotal
37–41
Early Full Late42 and overUnder 28 28–31 32–33 34–36 37–38 39–40 41
Non-Hispanic, single race3—Con. Number Percent Number
Black . . . . . . . . . . . . . . . . . . . . . . . . . . . . . . . . . . . 558,622 13.77 1.56 1.61 1.75 8.84 85.94 28.48 52.42 5.04 0.30 506 Under 15 . . . . . . . . . . . . . . . . . . . . . . . 695 12.99 * * * 7.36 86.72 28.43 49.78 8.51 * 2 15–19 . . . . . . . . . . . . . . . . . . . . . . . . . 42,836 12.96 1.58 1.56 1.52 8.31 86.77 27.41 53.10 6.27 0.26 63 20–24 . . . . . . . . . . . . . . . . . . . . . . . . . 154,406 12.84 1.48 1.50 1.59 8.27 86.93 28.19 53.52 5.22 0.23 133 25–29 . . . . . . . . . . . . . . . . . . . . . . . . . 163,887 13.16 1.48 1.50 1.60 8.58 86.53 28.07 53.39 5.08 0.31 140 30–34 . . . . . . . . . . . . . . . . . . . . . . . . . 118,795 14.08 1.62 1.65 1.85 8.97 85.58 28.18 52.26 5.14 0.34 92 35–39 . . . . . . . . . . . . . . . . . . . . . . . . . 62,252 16.34 1.82 1.94 2.31 10.27 83.31 30.51 48.76 4.05 0.34 60 40–44 . . . . . . . . . . . . . . . . . . . . . . . . . 14,419 17.97 1.73 2.32 2.39 11.53 81.66 32.62 46.30 2.74 0.37 15 45–54 . . . . . . . . . . . . . . . . . . . . . . . . . 1,332 27.80 2.63 2.78 5.26 17.13 71.83 33.36 36.21 2.25 * 1
Hispanic4 All ages4 . . . . . . . . . . . . . . . . . . . . . . . . . . . . . . . . 918,447 9.45 0.62 0.84 1.08 6.92 90.30 27.02 57.85 5.43 0.25 676
Under 15 . . . . . . . . . . . . . . . . . . . . . . . 886 12.56 * * * 8.03 86.88 26.36 53.51 7.01 * 2 15–19 . . . . . . . . . . . . . . . . . . . . . . . . . 74,822 9.36 0.75 0.84 1.07 6.71 90.33 25.98 57.64 6.72 0.32 72 20–24 . . . . . . . . . . . . . . . . . . . . . . . . . 228,216 8.36 0.55 0.72 0.88 6.22 91.37 26.29 58.96 6.12 0.27 196 25–29 . . . . . . . . . . . . . . . . . . . . . . . . . 258,025 8.62 0.56 0.74 0.95 6.37 91.15 26.55 59.01 5.58 0.23 194 30–34 . . . . . . . . . . . . . . . . . . . . . . . . . 210,735 9.78 0.63 0.86 1.14 7.15 89.96 27.13 57.69 5.14 0.26 130 35–39 . . . . . . . . . . . . . . . . . . . . . . . . . 115,848 11.52 0.71 1.04 1.43 8.34 88.28 28.91 55.25 4.12 0.20 67 40–44 . . . . . . . . . . . . . . . . . . . . . . . . . 28,344 14.13 0.83 1.51 1.80 10.00 85.66 31.15 51.77 2.74 0.20 15 45–54 . . . . . . . . . . . . . . . . . . . . . . . . . 1,571 23.36 * 2.99 3.44 15.91 76.51 32.97 42.27 1.27 * –
* Figure does not meet standards of reliability or precision; based on fewer than 20 births in the numerator. – Quantity zero. ¹Expressed in completed weeks based on the obstetric estimate of gestation; see Technical Notes. ²Includes births to race and origin groups not shown separately, such as Hispanic single-race white, Hispanic single-race black, and non-Hispanic multiple-race women, as well as births with origin not stated. ³Race and Hispanic origin are reported separately on birth certificates; persons of Hispanic origin may be of any race. In this table, non-Hispanic women are classified by race. Race categories are consistent with 1997 Office of Management and Budget standards; see Technical Notes. Single race is defined as only one race reported on the birth certificate. 4Includes all persons of Hispanic origin of any race; see Technical Notes.
SOURCE: NCHS, National Vital Statistics System, Natality.
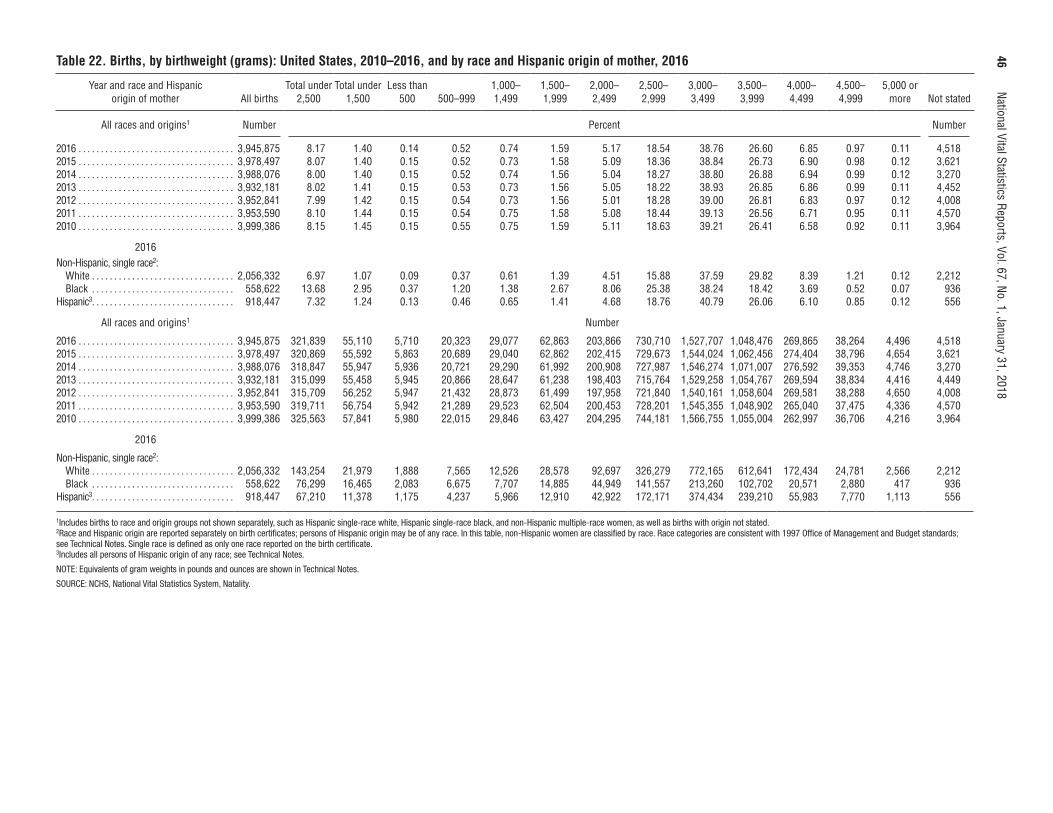
46
National Vital Statistics Reports, Vol. 67, No. 1, January 31, 2018Table 22. Births, by birthweight (grams): United States, 2010–2016, and by race and Hispanic origin of mother, 2016
Year and race and Hispanic origin of mother All births
Total under 2,500
Total under 1,500
Less than 500 500–999
1,000–1,499
1,500–1,999
2,000–2,499
2,500–2,999
3,000–3,499
3,500–3,999
4,000–4,499
4,500–4,999
5,000 or more Not stated
All races and origins1 Number Percent Number
2016 . . . . . . . . . . . . . . . . . . . . . . . . . . . . . . . . . . . 3,945,875 8.17 1.40 0.14 0.52 0.74 1.59 5.17 18.54 38.76 26.60 6.85 0.97 0.11 4,518 2015 . . . . . . . . . . . . . . . . . . . . . . . . . . . . . . . . . . . 3,978,497 8.07 1.40 0.15 0.52 0.73 1.58 5.09 18.36 38.84 26.73 6.90 0.98 0.12 3,621 2014 . . . . . . . . . . . . . . . . . . . . . . . . . . . . . . . . . . . 3,988,076 8.00 1.40 0.15 0.52 0.74 1.56 5.04 18.27 38.80 26.88 6.94 0.99 0.12 3,270 2013 . . . . . . . . . . . . . . . . . . . . . . . . . . . . . . . . . . . 3,932,181 8.02 1.41 0.15 0.53 0.73 1.56 5.05 18.22 38.93 26.85 6.86 0.99 0.11 4,452 2012 . . . . . . . . . . . . . . . . . . . . . . . . . . . . . . . . . . . 3,952,841 7.99 1.42 0.15 0.54 0.73 1.56 5.01 18.28 39.00 26.81 6.83 0.97 0.12 4,008 2011 . . . . . . . . . . . . . . . . . . . . . . . . . . . . . . . . . . . 3,953,590 8.10 1.44 0.15 0.54 0.75 1.58 5.08 18.44 39.13 26.56 6.71 0.95 0.11 4,570 2010 . . . . . . . . . . . . . . . . . . . . . . . . . . . . . . . . . . . 3,999,386 8.15 1.45 0.15 0.55 0.75 1.59 5.11 18.63 39.21 26.41 6.58 0.92 0.11 3,964
2016Non-Hispanic, single race2:
White . . . . . . . . . . . . . . . . . . . . . . . . . . . . . . . . 2,056,332 6.97 1.07 0.09 0.37 0.61 1.39 4.51 15.88 37.59 29.82 8.39 1.21 0.12 2,212 Black . . . . . . . . . . . . . . . . . . . . . . . . . . . . . . . . 558,622 13.68 2.95 0.37 1.20 1.38 2.67 8.06 25.38 38.24 18.42 3.69 0.52 0.07 936
Hispanic3. . . . . . . . . . . . . . . . . . . . . . . . . . . . . . . . 918,447 7.32 1.24 0.13 0.46 0.65 1.41 4.68 18.76 40.79 26.06 6.10 0.85 0.12 556
All races and origins1 Number
2016 . . . . . . . . . . . . . . . . . . . . . . . . . . . . . . . . . . . 3,945,875 321,839 55,110 5,710 20,323 29,077 62,863 203,866 730,710 1,527,707 1,048,476 269,865 38,264 4,496 4,518 2015 . . . . . . . . . . . . . . . . . . . . . . . . . . . . . . . . . . . 3,978,497 320,869 55,592 5,863 20,689 29,040 62,862 202,415 729,673 1,544,024 1,062,456 274,404 38,796 4,654 3,621 2014 . . . . . . . . . . . . . . . . . . . . . . . . . . . . . . . . . . . 3,988,076 318,847 55,947 5,936 20,721 29,290 61,992 200,908 727,987 1,546,274 1,071,007 276,592 39,353 4,746 3,270 2013 . . . . . . . . . . . . . . . . . . . . . . . . . . . . . . . . . . . 3,932,181 315,099 55,458 5,945 20,866 28,647 61,238 198,403 715,764 1,529,258 1,054,767 269,594 38,834 4,416 4,449 2012 . . . . . . . . . . . . . . . . . . . . . . . . . . . . . . . . . . . 3,952,841 315,709 56,252 5,947 21,432 28,873 61,499 197,958 721,840 1,540,161 1,058,604 269,581 38,288 4,650 4,008 2011 . . . . . . . . . . . . . . . . . . . . . . . . . . . . . . . . . . . 3,953,590 319,711 56,754 5,942 21,289 29,523 62,504 200,453 728,201 1,545,355 1,048,902 265,040 37,475 4,336 4,570 2010 . . . . . . . . . . . . . . . . . . . . . . . . . . . . . . . . . . . 3,999,386 325,563 57,841 5,980 22,015 29,846 63,427 204,295 744,181 1,566,755 1,055,004 262,997 36,706 4,216 3,964
2016
Non-Hispanic, single race2:White . . . . . . . . . . . . . . . . . . . . . . . . . . . . . . . . 2,056,332 143,254 21,979 1,888 7,565 12,526 28,578 92,697 326,279 772,165 612,641 172,434 24,781 2,566 2,212 Black . . . . . . . . . . . . . . . . . . . . . . . . . . . . . . . . 558,622 76,299 16,465 2,083 6,675 7,707 14,885 44,949 141,557 213,260 102,702 20,571 2,880 417 936
Hispanic3. . . . . . . . . . . . . . . . . . . . . . . . . . . . . . . . 918,447 67,210 11,378 1,175 4,237 5,966 12,910 42,922 172,171 374,434 239,210 55,983 7,770 1,113 556
1Includes births to race and origin groups not shown separately, such as Hispanic single-race white, Hispanic single-race black, and non-Hispanic multiple-race women, as well as births with origin not stated. 2Race and Hispanic origin are reported separately on birth certificates; persons of Hispanic origin may be of any race. In this table, non-Hispanic women are classified by race. Race categories are consistent with 1997 Office of Management and Budget standards; see Technical Notes. Single race is defined as only one race reported on the birth certificate. 3Includes all persons of Hispanic origin of any race; see Technical Notes.
NOTE: Equivalents of gram weights in pounds and ounces are shown in Technical Notes.
SOURCE: NCHS, National Vital Statistics System, Natality.
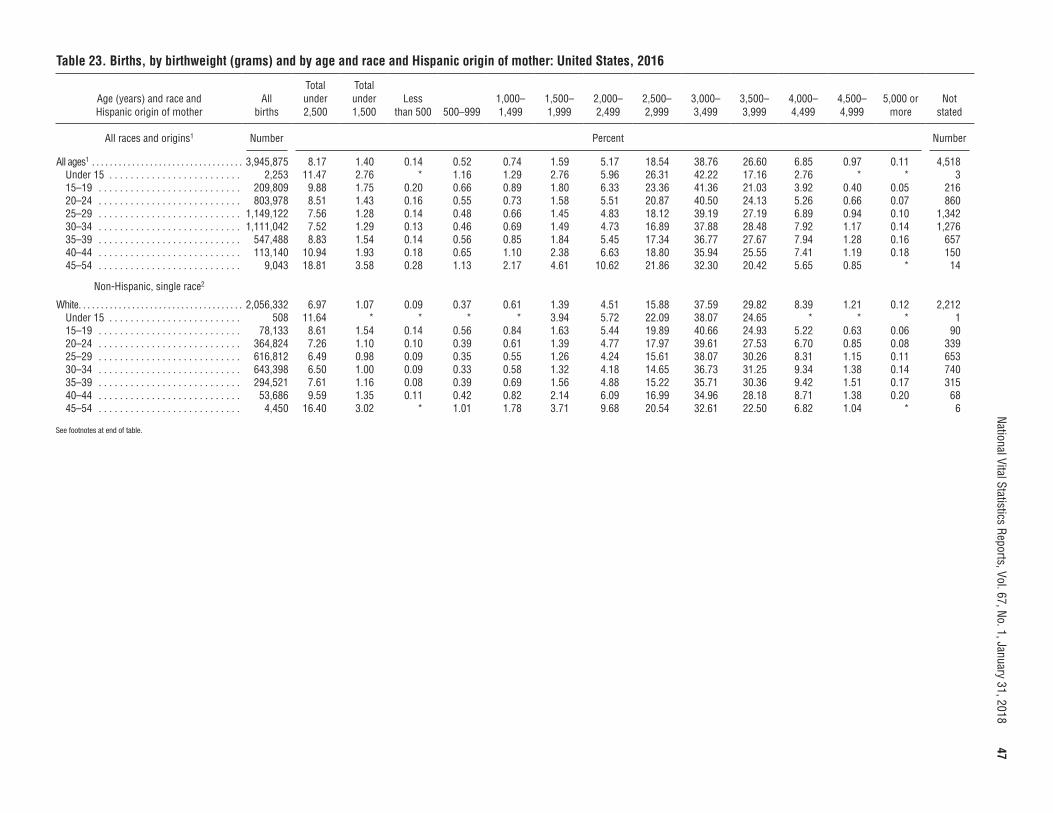
National Vital Statistics Reports, Vol. 67, No. 1, January 31, 2018
47Table 23. Births, by birthweight (grams) and by age and race and Hispanic origin of mother: United States, 2016
Age (years) and race and Hispanic origin of mother
All births
Total under 2,500
Total under 1,500
Less than 500 500–999
1,000–1,499
1,500–1,999
2,000–2,499
2,500–2,999
3,000–3,499
3,500–3,999
4,000–4,499
4,500–4,999
5,000 or more
Not stated
All races and origins1 Number Percent Number
All ages1 . . . . . . . . . . . . . . . . . . . . . . . . . . . . . . . . . . 3,945,875 8.17 1.40 0.14 0.52 0.74 1.59 5.17 18.54 38.76 26.60 6.85 0.97 0.11 4,518 Under 15 . . . . . . . . . . . . . . . . . . . . . . . . . 2,253 11.47 2.76 * 1.16 1.29 2.76 5.96 26.31 42.22 17.16 2.76 * * 3 15–19 . . . . . . . . . . . . . . . . . . . . . . . . . . . 209,809 9.88 1.75 0.20 0.66 0.89 1.80 6.33 23.36 41.36 21.03 3.92 0.40 0.05 216 20–24 . . . . . . . . . . . . . . . . . . . . . . . . . . . 803,978 8.51 1.43 0.16 0.55 0.73 1.58 5.51 20.87 40.50 24.13 5.26 0.66 0.07 860 25–29 . . . . . . . . . . . . . . . . . . . . . . . . . . . 1,149,122 7.56 1.28 0.14 0.48 0.66 1.45 4.83 18.12 39.19 27.19 6.89 0.94 0.10 1,342 30–34 . . . . . . . . . . . . . . . . . . . . . . . . . . . 1,111,042 7.52 1.29 0.13 0.46 0.69 1.49 4.73 16.89 37.88 28.48 7.92 1.17 0.14 1,276 35–39 . . . . . . . . . . . . . . . . . . . . . . . . . . . 547,488 8.83 1.54 0.14 0.56 0.85 1.84 5.45 17.34 36.77 27.67 7.94 1.28 0.16 657 40–44 . . . . . . . . . . . . . . . . . . . . . . . . . . . 113,140 10.94 1.93 0.18 0.65 1.10 2.38 6.63 18.80 35.94 25.55 7.41 1.19 0.18 150 45–54 . . . . . . . . . . . . . . . . . . . . . . . . . . . 9,043 18.81 3.58 0.28 1.13 2.17 4.61 10.62 21.86 32.30 20.42 5.65 0.85 * 14
Non-Hispanic, single race2
White . . . . . . . . . . . . . . . . . . . . . . . . . . . . . . . . . . . . . 2,056,332 6.97 1.07 0.09 0.37 0.61 1.39 4.51 15.88 37.59 29.82 8.39 1.21 0.12 2,212 Under 15 . . . . . . . . . . . . . . . . . . . . . . . . . 508 11.64 * * * * 3.94 5.72 22.09 38.07 24.65 * * * 1 15–19 . . . . . . . . . . . . . . . . . . . . . . . . . . . 78,133 8.61 1.54 0.14 0.56 0.84 1.63 5.44 19.89 40.66 24.93 5.22 0.63 0.06 90 20–24 . . . . . . . . . . . . . . . . . . . . . . . . . . . 364,824 7.26 1.10 0.10 0.39 0.61 1.39 4.77 17.97 39.61 27.53 6.70 0.85 0.08 339 25–29 . . . . . . . . . . . . . . . . . . . . . . . . . . . 616,812 6.49 0.98 0.09 0.35 0.55 1.26 4.24 15.61 38.07 30.26 8.31 1.15 0.11 653 30–34 . . . . . . . . . . . . . . . . . . . . . . . . . . . 643,398 6.50 1.00 0.09 0.33 0.58 1.32 4.18 14.65 36.73 31.25 9.34 1.38 0.14 740 35–39 . . . . . . . . . . . . . . . . . . . . . . . . . . . 294,521 7.61 1.16 0.08 0.39 0.69 1.56 4.88 15.22 35.71 30.36 9.42 1.51 0.17 315 40–44 . . . . . . . . . . . . . . . . . . . . . . . . . . . 53,686 9.59 1.35 0.11 0.42 0.82 2.14 6.09 16.99 34.96 28.18 8.71 1.38 0.20 68 45–54 . . . . . . . . . . . . . . . . . . . . . . . . . . . 4,450 16.40 3.02 * 1.01 1.78 3.71 9.68 20.54 32.61 22.50 6.82 1.04 * 6
See footnotes at end of table.
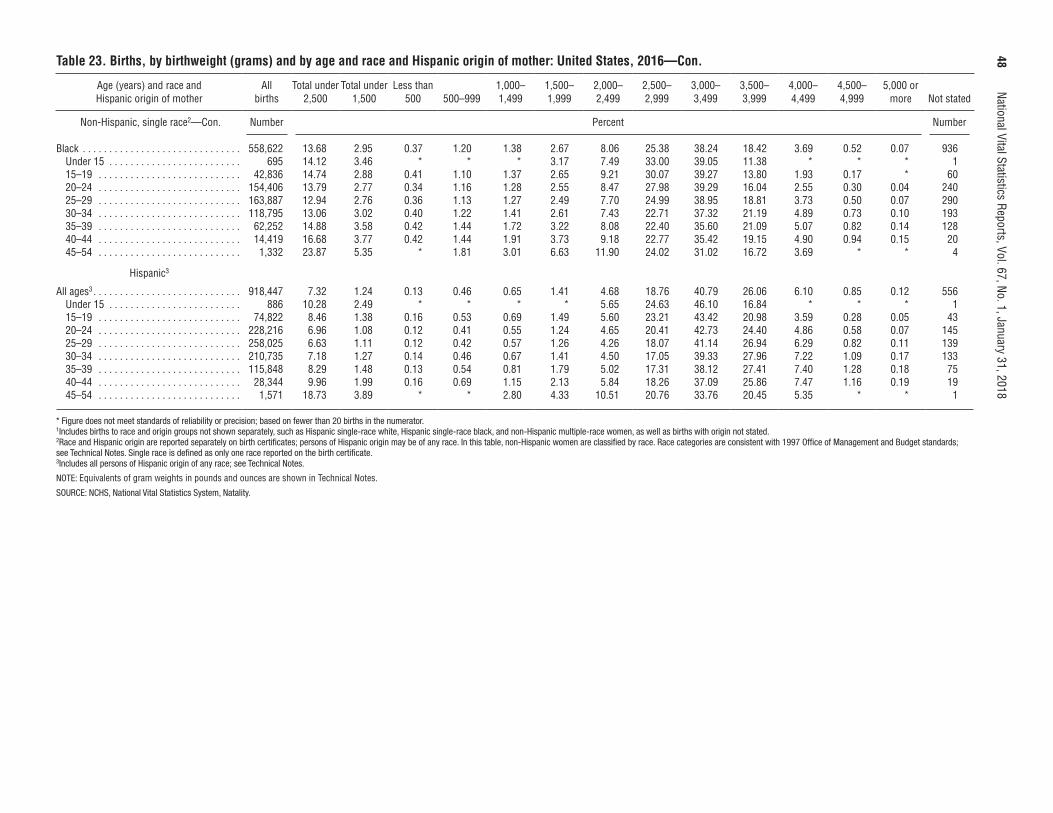
48
National Vital Statistics Reports, Vol. 67, No. 1, January 31, 2018Table 23. Births, by birthweight (grams) and by age and race and Hispanic origin of mother: United States, 2016—Con.
Age (years) and race and Hispanic origin of mother
All births
Total under 2,500
Total under 1,500
Less than 500 500–999
1,000–1,499
1,500–1,999
2,000–2,499
2,500–2,999
3,000–3,499
3,500–3,999
4,000–4,499
4,500–4,999
5,000 or more Not stated
Non-Hispanic, single race2—Con. Number Percent Number
Black . . . . . . . . . . . . . . . . . . . . . . . . . . . . . . 558,622 13.68 2.95 0.37 1.20 1.38 2.67 8.06 25.38 38.24 18.42 3.69 0.52 0.07 936 Under 15 . . . . . . . . . . . . . . . . . . . . . . . . . 695 14.12 3.46 * * * 3.17 7.49 33.00 39.05 11.38 * * * 1 15–19 . . . . . . . . . . . . . . . . . . . . . . . . . . . 42,836 14.74 2.88 0.41 1.10 1.37 2.65 9.21 30.07 39.27 13.80 1.93 0.17 * 60 20–24 . . . . . . . . . . . . . . . . . . . . . . . . . . . 154,406 13.79 2.77 0.34 1.16 1.28 2.55 8.47 27.98 39.29 16.04 2.55 0.30 0.04 240 25–29 . . . . . . . . . . . . . . . . . . . . . . . . . . . 163,887 12.94 2.76 0.36 1.13 1.27 2.49 7.70 24.99 38.95 18.81 3.73 0.50 0.07 290 30–34 . . . . . . . . . . . . . . . . . . . . . . . . . . . 118,795 13.06 3.02 0.40 1.22 1.41 2.61 7.43 22.71 37.32 21.19 4.89 0.73 0.10 193 35–39 . . . . . . . . . . . . . . . . . . . . . . . . . . . 62,252 14.88 3.58 0.42 1.44 1.72 3.22 8.08 22.40 35.60 21.09 5.07 0.82 0.14 128 40–44 . . . . . . . . . . . . . . . . . . . . . . . . . . . 14,419 16.68 3.77 0.42 1.44 1.91 3.73 9.18 22.77 35.42 19.15 4.90 0.94 0.15 20 45–54 . . . . . . . . . . . . . . . . . . . . . . . . . . . 1,332 23.87 5.35 * 1.81 3.01 6.63 11.90 24.02 31.02 16.72 3.69 * * 4
Hispanic3
All ages3 . . . . . . . . . . . . . . . . . . . . . . . . . . . . 918,447 7.32 1.24 0.13 0.46 0.65 1.41 4.68 18.76 40.79 26.06 6.10 0.85 0.12 556 Under 15 . . . . . . . . . . . . . . . . . . . . . . . . . 886 10.28 2.49 * * * * 5.65 24.63 46.10 16.84 * * * 1 15–19 . . . . . . . . . . . . . . . . . . . . . . . . . . . 74,822 8.46 1.38 0.16 0.53 0.69 1.49 5.60 23.21 43.42 20.98 3.59 0.28 0.05 43 20–24 . . . . . . . . . . . . . . . . . . . . . . . . . . . 228,216 6.96 1.08 0.12 0.41 0.55 1.24 4.65 20.41 42.73 24.40 4.86 0.58 0.07 145 25–29 . . . . . . . . . . . . . . . . . . . . . . . . . . . 258,025 6.63 1.11 0.12 0.42 0.57 1.26 4.26 18.07 41.14 26.94 6.29 0.82 0.11 139 30–34 . . . . . . . . . . . . . . . . . . . . . . . . . . . 210,735 7.18 1.27 0.14 0.46 0.67 1.41 4.50 17.05 39.33 27.96 7.22 1.09 0.17 133 35–39 . . . . . . . . . . . . . . . . . . . . . . . . . . . 115,848 8.29 1.48 0.13 0.54 0.81 1.79 5.02 17.31 38.12 27.41 7.40 1.28 0.18 75 40–44 . . . . . . . . . . . . . . . . . . . . . . . . . . . 28,344 9.96 1.99 0.16 0.69 1.15 2.13 5.84 18.26 37.09 25.86 7.47 1.16 0.19 19 45–54 . . . . . . . . . . . . . . . . . . . . . . . . . . . 1,571 18.73 3.89 * * 2.80 4.33 10.51 20.76 33.76 20.45 5.35 * * 1
* Figure does not meet standards of reliability or precision; based on fewer than 20 births in the numerator. 1Includes births to race and origin groups not shown separately, such as Hispanic single-race white, Hispanic single-race black, and non-Hispanic multiple-race women, as well as births with origin not stated. 2Race and Hispanic origin are reported separately on birth certificates; persons of Hispanic origin may be of any race. In this table, non-Hispanic women are classified by race. Race categories are consistent with 1997 Office of Management and Budget standards; see Technical Notes. Single race is defined as only one race reported on the birth certificate. 3Includes all persons of Hispanic origin of any race; see Technical Notes.
NOTE: Equivalents of gram weights in pounds and ounces are shown in Technical Notes.
SOURCE: NCHS, National Vital Statistics System, Natality.
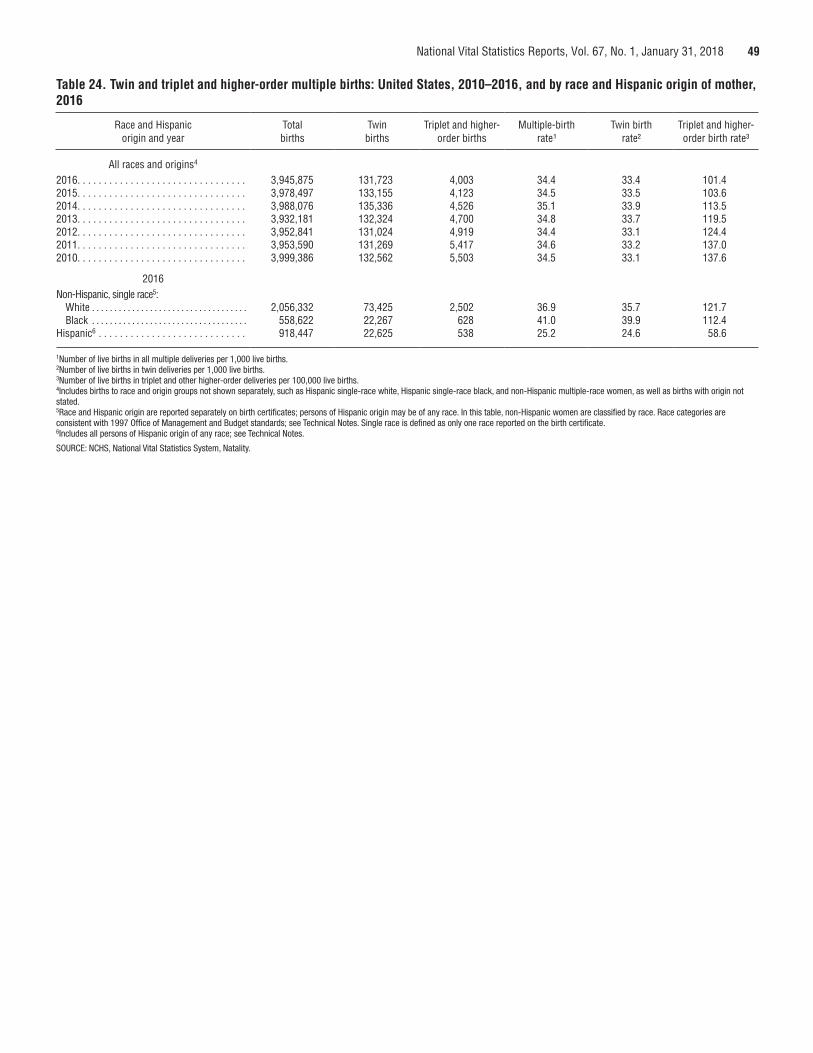
National Vital Statistics Reports, Vol. 67, No. 1, January 31, 2018 49
Table 24. Twin and triplet and higher-order multiple births: United States, 2010–2016, and by race and Hispanic origin of mother, 2016
Race and Hispanic origin and year
Total births
Twin births
Triplet and higher-order births
Multiple-birth rate¹
Twin birth rate²
Triplet and higher-order birth rate³
All races and origins4
2016. . . . . . . . . . . . . . . . . . . . . . . . . . . . . . . . 3,945,875 131,723 4,003 34.4 33.4 101.4 2015. . . . . . . . . . . . . . . . . . . . . . . . . . . . . . . . 3,978,497 133,155 4,123 34.5 33.5 103.6 2014. . . . . . . . . . . . . . . . . . . . . . . . . . . . . . . . 3,988,076 135,336 4,526 35.1 33.9 113.5 2013. . . . . . . . . . . . . . . . . . . . . . . . . . . . . . . . 3,932,181 132,324 4,700 34.8 33.7 119.5 2012. . . . . . . . . . . . . . . . . . . . . . . . . . . . . . . . 3,952,841 131,024 4,919 34.4 33.1 124.4 2011. . . . . . . . . . . . . . . . . . . . . . . . . . . . . . . . 3,953,590 131,269 5,417 34.6 33.2 137.0 2010. . . . . . . . . . . . . . . . . . . . . . . . . . . . . . . . 3,999,386 132,562 5,503 34.5 33.1 137.6
2016Non-Hispanic, single race5:
White . . . . . . . . . . . . . . . . . . . . . . . . . . . . . . . . . . . 2,056,332 73,425 2,502 36.9 35.7 121.7 Black . . . . . . . . . . . . . . . . . . . . . . . . . . . . . . . . . . . 558,622 22,267 628 41.0 39.9 112.4
Hispanic6 . . . . . . . . . . . . . . . . . . . . . . . . . . . . 918,447 22,625 538 25.2 24.6 58.6
1Number of live births in all multiple deliveries per 1,000 live births. 2Number of live births in twin deliveries per 1,000 live births. 3Number of live births in triplet and other higher-order deliveries per 100,000 live births. 4Includes births to race and origin groups not shown separately, such as Hispanic single-race white, Hispanic single-race black, and non-Hispanic multiple-race women, as well as births with origin not stated. 5Race and Hispanic origin are reported separately on birth certificates; persons of Hispanic origin may be of any race. In this table, non-Hispanic women are classified by race. Race categories are consistent with 1997 Office of Management and Budget standards; see Technical Notes. Single race is defined as only one race reported on the birth certificate. 6Includes all persons of Hispanic origin of any race; see Technical Notes.
SOURCE: NCHS, National Vital Statistics System, Natality.
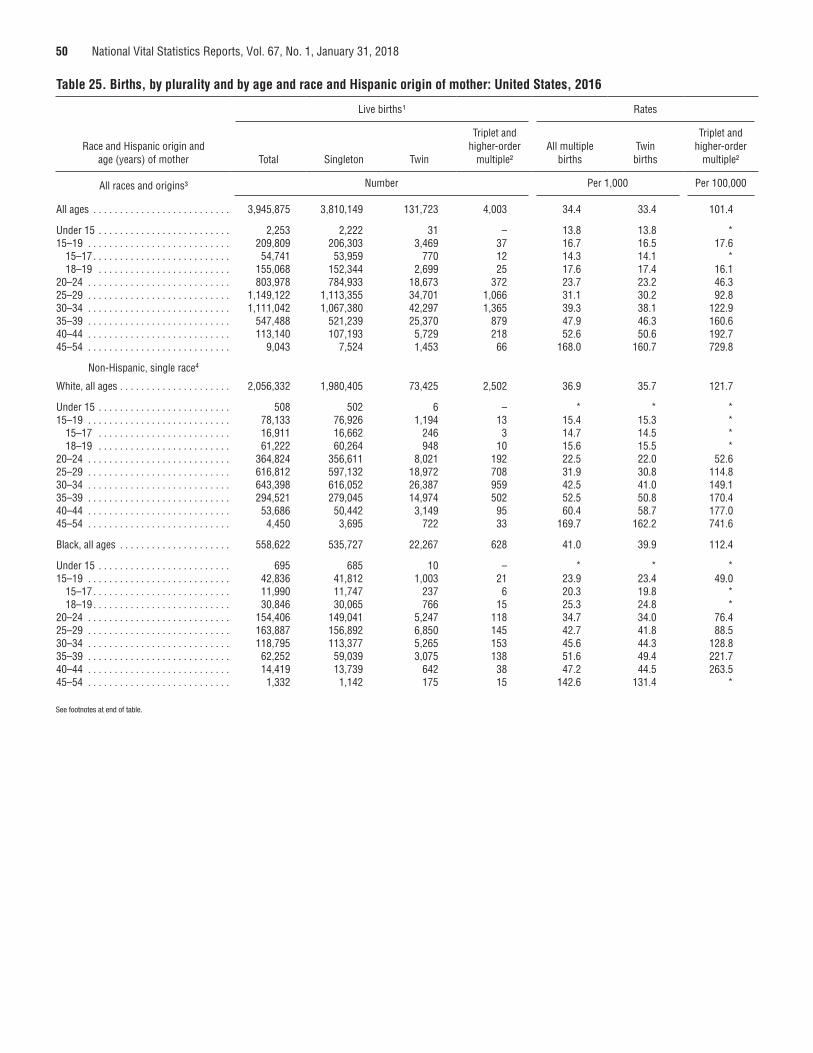
50 National Vital Statistics Reports, Vol. 67, No. 1, January 31, 2018
Table 25. Births, by plurality and by age and race and Hispanic origin of mother: United States, 2016
Race and Hispanic origin and age (years) of mother
Live births¹ Rates
Total Singleton Twin
Triplet and higher-order
multiple²All multiple
birthsTwin births
Triplet and higher-order
multiple²
All races and origins³ Number Per 1,000 Per 100,000
All ages . . . . . . . . . . . . . . . . . . . . . . . . . . 3,945,875 3,810,149 131,723 4,003 34.4 33.4 101.4
Under 15 . . . . . . . . . . . . . . . . . . . . . . . . . 2,253 2,222 31 – 13.8 13.8 * 15–19 . . . . . . . . . . . . . . . . . . . . . . . . . . . 209,809 206,303 3,469 37 16.7 16.5 17.6
15–17 . . . . . . . . . . . . . . . . . . . . . . . . . . 54,741 53,959 770 12 14.3 14.1 * 18–19 . . . . . . . . . . . . . . . . . . . . . . . . . 155,068 152,344 2,699 25 17.6 17.4 16.1
20–24 . . . . . . . . . . . . . . . . . . . . . . . . . . . 803,978 784,933 18,673 372 23.7 23.2 46.3 25–29 . . . . . . . . . . . . . . . . . . . . . . . . . . . 1,149,122 1,113,355 34,701 1,066 31.1 30.2 92.8 30–34 . . . . . . . . . . . . . . . . . . . . . . . . . . . 1,111,042 1,067,380 42,297 1,365 39.3 38.1 122.9 35–39 . . . . . . . . . . . . . . . . . . . . . . . . . . . 547,488 521,239 25,370 879 47.9 46.3 160.6 40–44 . . . . . . . . . . . . . . . . . . . . . . . . . . . 113,140 107,193 5,729 218 52.6 50.6 192.7 45–54 . . . . . . . . . . . . . . . . . . . . . . . . . . . 9,043 7,524 1,453 66 168.0 160.7 729.8
Non-Hispanic, single race4
White, all ages . . . . . . . . . . . . . . . . . . . . . 2,056,332 1,980,405 73,425 2,502 36.9 35.7 121.7
Under 15 . . . . . . . . . . . . . . . . . . . . . . . . . 508 502 6 – * * * 15–19 . . . . . . . . . . . . . . . . . . . . . . . . . . . 78,133 76,926 1,194 13 15.4 15.3 *
15–17 . . . . . . . . . . . . . . . . . . . . . . . . . 16,911 16,662 246 3 14.7 14.5 * 18–19 . . . . . . . . . . . . . . . . . . . . . . . . . 61,222 60,264 948 10 15.6 15.5 *
20–24 . . . . . . . . . . . . . . . . . . . . . . . . . . . 364,824 356,611 8,021 192 22.5 22.0 52.6 25–29 . . . . . . . . . . . . . . . . . . . . . . . . . . . 616,812 597,132 18,972 708 31.9 30.8 114.8 30–34 . . . . . . . . . . . . . . . . . . . . . . . . . . . 643,398 616,052 26,387 959 42.5 41.0 149.1 35–39 . . . . . . . . . . . . . . . . . . . . . . . . . . . 294,521 279,045 14,974 502 52.5 50.8 170.4 40–44 . . . . . . . . . . . . . . . . . . . . . . . . . . . 53,686 50,442 3,149 95 60.4 58.7 177.0 45–54 . . . . . . . . . . . . . . . . . . . . . . . . . . . 4,450 3,695 722 33 169.7 162.2 741.6
Black, all ages . . . . . . . . . . . . . . . . . . . . . 558,622 535,727 22,267 628 41.0 39.9 112.4
Under 15 . . . . . . . . . . . . . . . . . . . . . . . . . 695 685 10 – * * * 15–19 . . . . . . . . . . . . . . . . . . . . . . . . . . . 42,836 41,812 1,003 21 23.9 23.4 49.0
15–17 . . . . . . . . . . . . . . . . . . . . . . . . . . 11,990 11,747 237 6 20.3 19.8 * 18–19 . . . . . . . . . . . . . . . . . . . . . . . . . . 30,846 30,065 766 15 25.3 24.8 *
20–24 . . . . . . . . . . . . . . . . . . . . . . . . . . . 154,406 149,041 5,247 118 34.7 34.0 76.4 25–29 . . . . . . . . . . . . . . . . . . . . . . . . . . . 163,887 156,892 6,850 145 42.7 41.8 88.5 30–34 . . . . . . . . . . . . . . . . . . . . . . . . . . . 118,795 113,377 5,265 153 45.6 44.3 128.8 35–39 . . . . . . . . . . . . . . . . . . . . . . . . . . . 62,252 59,039 3,075 138 51.6 49.4 221.7 40–44 . . . . . . . . . . . . . . . . . . . . . . . . . . . 14,419 13,739 642 38 47.2 44.5 263.5 45–54 . . . . . . . . . . . . . . . . . . . . . . . . . . . 1,332 1,142 175 15 142.6 131.4 *
See footnotes at end of table.
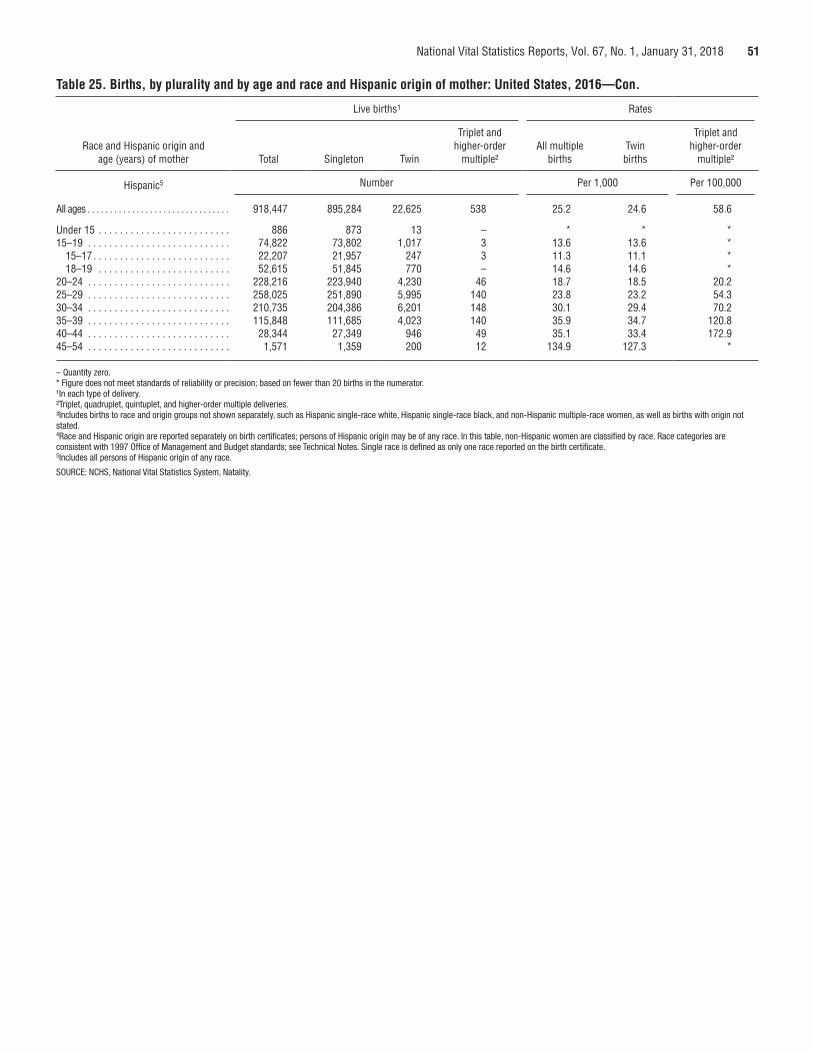
National Vital Statistics Reports, Vol. 67, No. 1, January 31, 2018 51
Table 25. Births, by plurality and by age and race and Hispanic origin of mother: United States, 2016—Con.
Race and Hispanic origin and age (years) of mother
Live births¹ Rates
Total Singleton Twin
Triplet and higher-order
multiple²All multiple
birthsTwin births
Triplet and higher-order
multiple²
Hispanic5 Number Per 1,000 Per 100,000
All ages . . . . . . . . . . . . . . . . . . . . . . . . . . . . . . . . 918,447 895,284 22,625 538 25.2 24.6 58.6
Under 15 . . . . . . . . . . . . . . . . . . . . . . . . . 886 873 13 – * * * 15–19 . . . . . . . . . . . . . . . . . . . . . . . . . . . 74,822 73,802 1,017 3 13.6 13.6 *
15–17 . . . . . . . . . . . . . . . . . . . . . . . . . . 22,207 21,957 247 3 11.3 11.1 * 18–19 . . . . . . . . . . . . . . . . . . . . . . . . . 52,615 51,845 770 – 14.6 14.6 *
20–24 . . . . . . . . . . . . . . . . . . . . . . . . . . . 228,216 223,940 4,230 46 18.7 18.5 20.2 25–29 . . . . . . . . . . . . . . . . . . . . . . . . . . . 258,025 251,890 5,995 140 23.8 23.2 54.3 30–34 . . . . . . . . . . . . . . . . . . . . . . . . . . . 210,735 204,386 6,201 148 30.1 29.4 70.2 35–39 . . . . . . . . . . . . . . . . . . . . . . . . . . . 115,848 111,685 4,023 140 35.9 34.7 120.8 40–44 . . . . . . . . . . . . . . . . . . . . . . . . . . . 28,344 27,349 946 49 35.1 33.4 172.9 45–54 . . . . . . . . . . . . . . . . . . . . . . . . . . . 1,571 1,359 200 12 134.9 127.3 *
– Quantity zero. * Figure does not meet standards of reliability or precision; based on fewer than 20 births in the numerator. ¹In each type of delivery. ²Triplet, quadruplet, quintuplet, and higher-order multiple deliveries. ³Includes births to race and origin groups not shown separately, such as Hispanic single-race white, Hispanic single-race black, and non-Hispanic multiple-race women, as well as births with origin not stated. 4Race and Hispanic origin are reported separately on birth certificates; persons of Hispanic origin may be of any race. In this table, non-Hispanic women are classified by race. Race categories are consistent with 1997 Office of Management and Budget standards; see Technical Notes. Single race is defined as only one race reported on the birth certificate. 5Includes all persons of Hispanic origin of any race.
SOURCE: NCHS, National Vital Statistics System, Natality.
52 National Vital Statistics Reports, Vol. 67, No. 1, January 31, 2018
Technical Notes
Data sourceData shown in this report for 2016 are based on 100% of
the birth certificates filed in all states and District of Columbia (D.C.). The data are provided to the National Center for Health Statistics (NCHS) through the Vital Statistics Cooperative Program. Information on the percentage of records with missing information for maternal and infant characteristics included in this report is shown by state in the “User Guide to the 2016 Natality Public Use File” (8). Methodological and measurement information for these characteristics is also available in the 2016 User Guide.
2003 revision of U.S. Standard Certificate of Live Birth
Data for 2016 presented in this report are based on the 2003 revision of the U.S. Standard Certificate of Live Birth; data for 2010–2015 are based on both the 1989 and 2003 birth certificate revisions. The 2003 revision is described in detail elsewhere (9,18).
Age of motherAge of mother is computed in most cases from the mother’s
and infant’s dates of birth as reported on the birth certificate. In 2016, the mother’s age was directly reported by one territory (American Samoa). Since 2007, age of mother was imputed for age groups 8 years and under and 65 and over. Mothers aged 9 years are recoded as aged 10 years. A review and verification of unedited data for several years, including 2007, showed that the vast majority of births reported as occurring to women aged 50 and over were to women aged 50–54. In this report, the final age group shown in the tables (45–49, 45–54, or 50–54) includes births to mothers up to age 64. For historical information on mother’s age, see the User Guide (8).
Hispanic origin and race
Hispanic origin
Hispanic origin and race are reported separately on the birth certificate. Data are shown in most cases for five specified Hispanic groups: Mexican, Puerto Rican, Cuban, Central and South American, and “other and unknown Hispanic.” In tabulations of birth data by race and Hispanic origin, data for persons of Hispanic origin are not further classified by race because the vast majority of births to Hispanic women are reported as white. In tabulations of birth data by bridged race only, data for persons of Hispanic origin are included in the data for each race group according to the mother’s reported race. In tabulations of birth data by Hispanic origin, data for non-Hispanic persons are classified according to the race of the mother, due to substantial differences in fertility and maternal and infant health characteristics between Hispanic and non-Hispanic white women.
Items asking for the Hispanic origin of the mother (and the father) have been included on the birth certificates of all states and D.C., U.S. Virgin Islands, and Guam since 1993, and on the birth certificates of Puerto Rico starting in 2005 and Commonwealth of the Northern Marianas starting in 2010 (8,10). American Samoa does not collect information on Hispanic origin.
The Hispanic-origin question on the 2003 revision of the birth certificate asks respondents to select only one response. Occasionally, however, more than one Hispanic-origin response is given, that is, a specified Hispanic group (Mexican, Puerto Rican, Cuban, or Central and South American) in combination with one or more other specified Hispanic group. For 2003–2012, respondents who selected more than one Hispanic origin on the birth certificate were classified as “other Hispanic.” Beginning with the 2013 data year, respondents who select more than one Hispanic origin are randomly assigned to a single Hispanic origin. This change was implemented to be consistent with the coding methods of the American Community Survey (ACS) (19), on which rates are based for the specified Hispanic groups as of 2010 (see “Population estimates for specific Hispanic groups”).
Change in births to "other and unknown Hispanic" women—The number of births to “other and unknown Hispanic” women increased by 1%, from 143,536 in 2015 to 145,381 in 2016, and has increased steadily from 48,972 in 2003. Factors that may have influenced this rise are not clear but may include less specificity in respondent reporting of Hispanic origin and increases in the populations of groups included in the “other Hispanic” category. For the percentage of records for which Hispanic origin of the parents was not reported in 2016 and additional information on the reporting of Hispanic origin, see the User Guide (8).
Race
This report also presents, for the first time, national data on race and Hispanic-origin categories based on the 1997 Office of Management and Budget (OMB) standards (3). The 2003 revision of the U.S. Standard Certificate of Live Birth allows the reporting of five race categories either alone (i.e., single race) or in combination (i.e., more than one race or multiple races) for each parent (9), in accordance with the 1997 revised OMB standards (3). The five categories for race specified in the revised standards are: American Indian or Alaska Native (AIAN), Asian, black or African American, Native Hawaiian or Other Pacific Islander, and white; see 2016 User Guide (8).
Beginning in 2016, all states and D.C., in addition to Puerto Rico, U.S. Virgin Islands, Guam, and Northern Marianas, reported race according to the 1997 revised OMB standards, with 2.5% of mothers in the United States reporting more than one race (8); data from American Samoa still follow 1977 OMB standards (20). Prior to 2016, the multiple-race reporting states varied widely, increasing from 6 states in 2003 to the 50 states and D.C. and all territories except American Samoa in 2016.
Comparison between single and bridged race of mother
To provide a comparison of 2016 data by race between the 1977 and 1997 OMB standards, the responses of women who reported more than one race (multiple races) have been
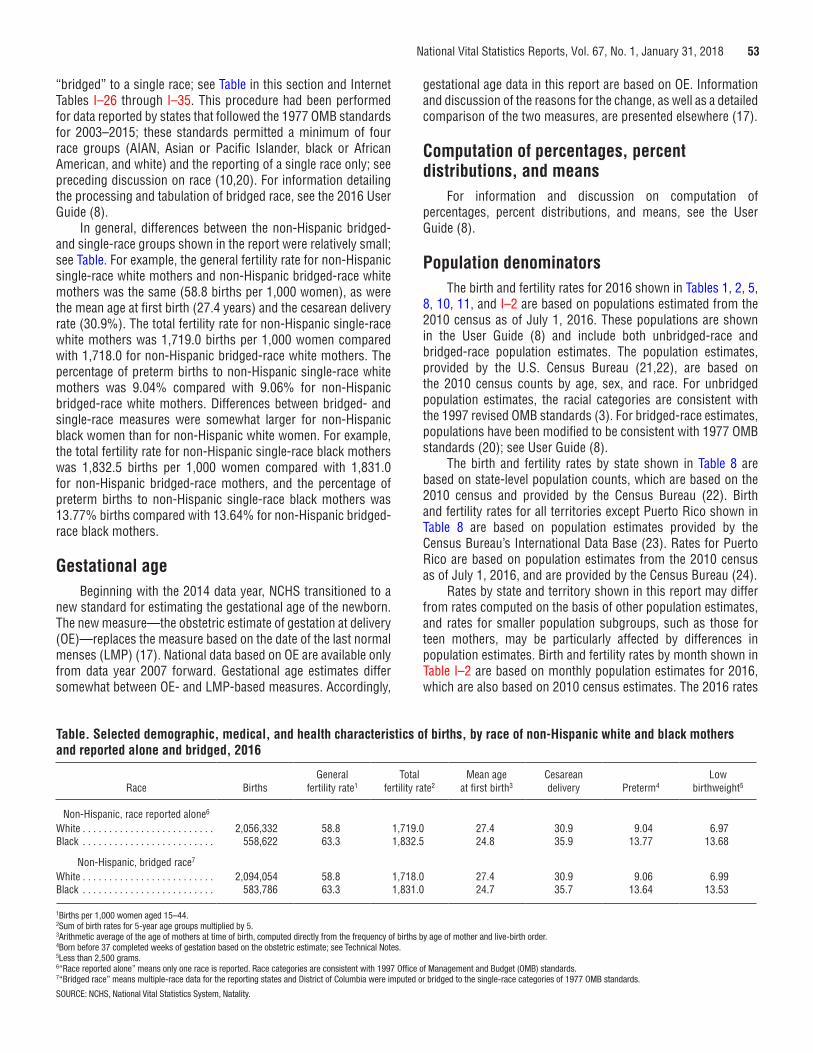
National Vital Statistics Reports, Vol. 67, No. 1, January 31, 2018 53
gestational age data in this report are based on OE. Information and discussion of the reasons for the change, as well as a detailed comparison of the two measures, are presented elsewhere (17).
Computation of percentages, percent distributions, and means
For information and discussion on computation of percentages, percent distributions, and means, see the User Guide (8).
Population denominatorsThe birth and fertility rates for 2016 shown in Tables 1, 2, 5,
8, 10, 11, and I–2 are based on populations estimated from the 2010 census as of July 1, 2016. These populations are shown in the User Guide (8) and include both unbridged-race and bridged-race population estimates. The population estimates, provided by the U.S. Census Bureau (21,22), are based on the 2010 census counts by age, sex, and race. For unbridged population estimates, the racial categories are consistent with the 1997 revised OMB standards (3). For bridged-race estimates, populations have been modified to be consistent with 1977 OMB standards (20); see User Guide (8).
The birth and fertility rates by state shown in Table 8 are based on state-level population counts, which are based on the 2010 census and provided by the Census Bureau (22). Birth and fertility rates for all territories except Puerto Rico shown in Table 8 are based on population estimates provided by the Census Bureau’s International Data Base (23). Rates for Puerto Rico are based on population estimates from the 2010 census as of July 1, 2016, and are provided by the Census Bureau (24).
Rates by state and territory shown in this report may differ from rates computed on the basis of other population estimates, and rates for smaller population subgroups, such as those for teen mothers, may be particularly affected by differences in population estimates. Birth and fertility rates by month shown in Table I–2 are based on monthly population estimates for 2016, which are also based on 2010 census estimates. The 2016 rates
Table. Selected demographic, medical, and health characteristics of births, by race of non-Hispanic white and black mothers and reported alone and bridged, 2016
Race BirthsGeneral
fertility rate1Total
fertility rate2Mean age
at first birth3Cesarean delivery Preterm4
Low birthweight5
Non-Hispanic, race reported alone6
White . . . . . . . . . . . . . . . . . . . . . . . . . 2,056,332 58.8 1,719.0 27.4 30.9 9.04 6.97Black . . . . . . . . . . . . . . . . . . . . . . . . . 558,622 63.3 1,832.5 24.8 35.9 13.77 13.68
Non-Hispanic, bridged race7
White . . . . . . . . . . . . . . . . . . . . . . . . . 2,094,054 58.8 1,718.0 27.4 30.9 9.06 6.99Black . . . . . . . . . . . . . . . . . . . . . . . . . 583,786 63.3 1,831.0 24.7 35.7 13.64 13.53
1Births per 1,000 women aged 15–44. 2Sum of birth rates for 5-year age groups multiplied by 5. 3Arithmetic average of the age of mothers at time of birth, computed directly from the frequency of births by age of mother and live-birth order. 4Born before 37 completed weeks of gestation based on the obstetric estimate; see Technical Notes. 5Less than 2,500 grams. 6“Race reported alone” means only one race is reported. Race categories are consistent with 1997 Office of Management and Budget (OMB) standards. 7“Bridged race” means multiple-race data for the reporting states and District of Columbia were imputed or bridged to the single-race categories of 1977 OMB standards.
SOURCE: NCHS, National Vital Statistics System, Natality.
“bridged” to a single race; see Table in this section and Internet Tables I–26 through I–35. This procedure had been performed for data reported by states that followed the 1977 OMB standards for 2003–2015; these standards permitted a minimum of four race groups (AIAN, Asian or Pacific Islander, black or African American, and white) and the reporting of a single race only; see preceding discussion on race (10,20). For information detailing the processing and tabulation of bridged race, see the 2016 User Guide (8).
In general, differences between the non-Hispanic bridged- and single-race groups shown in the report were relatively small; see Table. For example, the general fertility rate for non-Hispanic single-race white mothers and non-Hispanic bridged-race white mothers was the same (58.8 births per 1,000 women), as were the mean age at first birth (27.4 years) and the cesarean delivery rate (30.9%). The total fertility rate for non-Hispanic single-race white mothers was 1,719.0 births per 1,000 women compared with 1,718.0 for non-Hispanic bridged-race white mothers. The percentage of preterm births to non-Hispanic single-race white mothers was 9.04% compared with 9.06% for non-Hispanic bridged-race white mothers. Differences between bridged- and single-race measures were somewhat larger for non-Hispanic black women than for non-Hispanic white women. For example, the total fertility rate for non-Hispanic single-race black mothers was 1,832.5 births per 1,000 women compared with 1,831.0 for non-Hispanic bridged-race mothers, and the percentage of preterm births to non-Hispanic single-race black mothers was 13.77% births compared with 13.64% for non-Hispanic bridged-race black mothers.
Gestational ageBeginning with the 2014 data year, NCHS transitioned to a
new standard for estimating the gestational age of the newborn. The new measure—the obstetric estimate of gestation at delivery (OE)—replaces the measure based on the date of the last normal menses (LMP) (17). National data based on OE are available only from data year 2007 forward. Gestational age estimates differ somewhat between OE- and LMP-based measures. Accordingly,
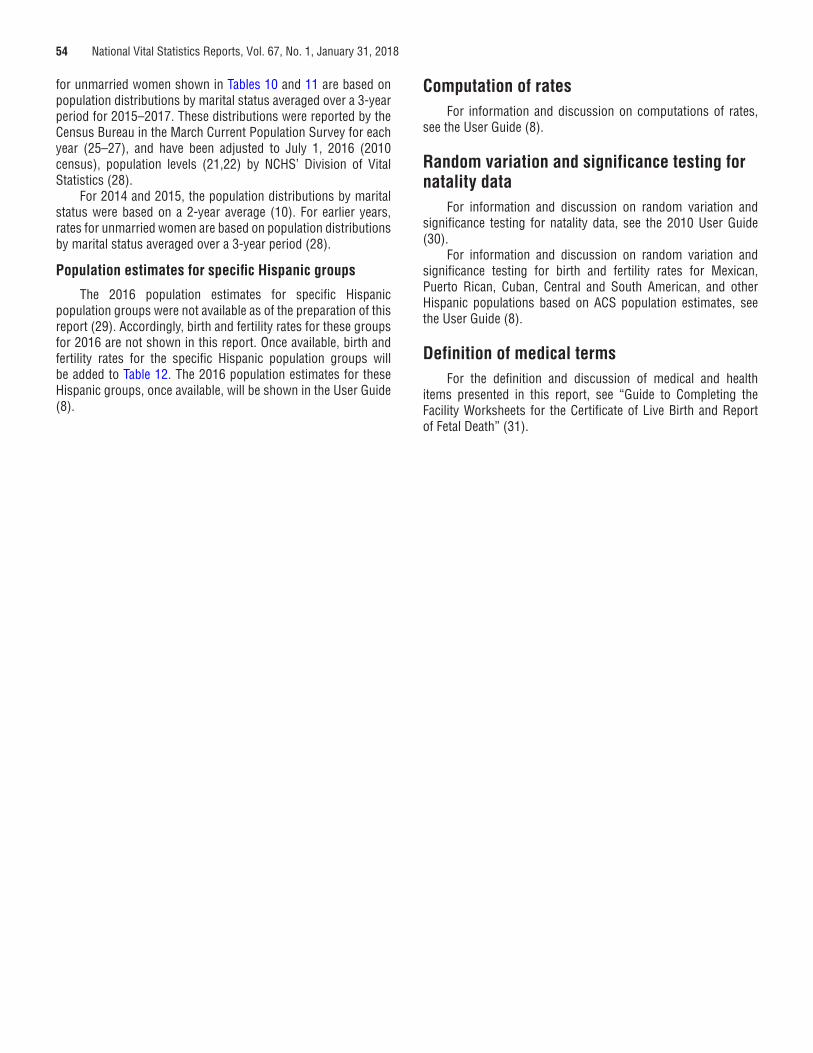
54 National Vital Statistics Reports, Vol. 67, No. 1, January 31, 2018
for unmarried women shown in Tables 10 and 11 are based on population distributions by marital status averaged over a 3-year period for 2015–2017. These distributions were reported by the Census Bureau in the March Current Population Survey for each year (25–27), and have been adjusted to July 1, 2016 (2010 census), population levels (21,22) by NCHS’ Division of Vital Statistics (28).
For 2014 and 2015, the population distributions by marital status were based on a 2-year average (10). For earlier years, rates for unmarried women are based on population distributions by marital status averaged over a 3-year period (28).
Population estimates for specific Hispanic groups
The 2016 population estimates for specific Hispanic population groups were not available as of the preparation of this report (29). Accordingly, birth and fertility rates for these groups for 2016 are not shown in this report. Once available, birth and fertility rates for the specific Hispanic population groups will be added to Table 12. The 2016 population estimates for these Hispanic groups, once available, will be shown in the User Guide (8).
Computation of rates For information and discussion on computations of rates,
see the User Guide (8).
Random variation and significance testing for natality data
For information and discussion on random variation and significance testing for natality data, see the 2010 User Guide (30).
For information and discussion on random variation and significance testing for birth and fertility rates for Mexican, Puerto Rican, Cuban, Central and South American, and other Hispanic populations based on ACS population estimates, see the User Guide (8).
Definition of medical terms For the definition and discussion of medical and health
items presented in this report, see “Guide to Completing the Facility Worksheets for the Certificate of Live Birth and Report of Fetal Death” (31).
FIRST CLASS MAIL POSTAGE & FEES PAID
CDC/NCHS PERMIT NO. G-284
U.S. DEPARTMENT OF HEALTH & HUMAN SERVICES
Centers for Disease Control and Prevention National Center for Health Statistics 3311 Toledo Road, Room 4551 Hyattsville, MD 20782–2064
OFFICIAL BUSINESS PENALTY FOR PRIVATE USE, $300
National Vital Statistics Reports, Vol. 67, No. 1, January 31, 2018
For more NCHS NVSRs, visit: http://www.cdc.gov/nchs/products/nvsr.htm.
For e-mail updates on NCHS publication releases, subscribe online at: http://www.cdc.gov/nchs/govdelivery.htm. For questions or general information about NCHS: Tel: 1–800–CDC–INFO (1–800–232–4636) • TTY: 1–888–232–6348
Internet: http://www.cdc.gov/nchs • Online request form: http://www.cdc.gov/info DHHS Publication No. 2018–1120 • CS287854
Suggested citation
Martin JA, Hamilton BE, Osterman MJK, Driscoll AK, Drake P. Births: Final data for 2016. National Vital Statistics Reports; vol 67 no 1. Hyattsville, MD: National Center for Health Statistics. 2018.
Copyright information
All material appearing in this report is in the public domain and may be reproduced or copied without permission; citation as to source, however, is appreciated.
National Center for Health Statistics
Charles J. Rothwell, M.S., M.B.A., Director Jennifer H. Madans, Ph.D., Associate Director
for Science
Division of Vital Statistics
Delton Atkinson, M.P.H., M.P.H., P.M.P., Director
Hanyu Ni, Ph.D., M.P.H., Associate Director for Science
ContentsAbstract . . . . . . . . . . . . . . . . . . . . . . . . . . . . . . . . . . . . . . . . . . . . . . . . . . . . . . . 1Introduction . . . . . . . . . . . . . . . . . . . . . . . . . . . . . . . . . . . . . . . . . . . . . . . . . . . . 2
2003 revision of U.S. Standard Certificate of Live Birth . . . . . . . . . . . . . . . . . 2Methods . . . . . . . . . . . . . . . . . . . . . . . . . . . . . . . . . . . . . . . . . . . . . . . . . . . . . . . 2Demographic Characteristics . . . . . . . . . . . . . . . . . . . . . . . . . . . . . . . . . . . . . . . 3
Births and birth rates . . . . . . . . . . . . . . . . . . . . . . . . . . . . . . . . . . . . . . . . . . . 3Age of mother . . . . . . . . . . . . . . . . . . . . . . . . . . . . . . . . . . . . . . . . . . . . . . . . . 4Live-birth order 4. . . . . . . . . . . . . . . . . . . . . . . . . . . . . . . . . . . . . . . . . . . . . . . . Total fertility rate . . . . . . . . . . . . . . . . . . . . . . . . . . . . . . . . . . . . . . . . . . . . . . . 5Births and birth rates by state. . . . . . . . . . . . . . . . . . . . . . . . . . . . . . . . . . . . . 6Birth rates for teenagers by state . . . . . . . . . . . . . . . . . . . . . . . . . . . . . . . . . . 6Births to unmarried women . . . . . . . . . . . . . . . . . . . . . . . . . . . . . . . . . . . . . . 6
Tobacco Use Before and During Pregnancy . . . . . . . . . . . . . . . . . . . . . . . . . . . 6Medical and Health Services Use and Payment Source for Delivery . . . . . . . . . 6
Use and timing of prenatal care . . . . . . . . . . . . . . . . . . . . . . . . . . . . . . . . . . . 6Method of delivery . . . . . . . . . . . . . . . . . . . . . . . . . . . . . . . . . . . . . . . . . . . . . 7Source of payment for the delivery . . . . . . . . . . . . . . . . . . . . . . . . . . . . . . . . . 8
Infant Health Characteristics . . . . . . . . . . . . . . . . . . . . . . . . . . . . . . . . . . . . . . . 8Period of gestation . . . . . . . . . . . . . . . . . . . . . . . . . . . . . . . . . . . . . . . . . . . . . 8Birthweight . . . . . . . . . . . . . . . . . . . . . . . . . . . . . . . . . . . . . . . . . . . . . . . . . . . 9Multiple births . . . . . . . . . . . . . . . . . . . . . . . . . . . . . . . . . . . . . . . . . . . . . . . . 9
References . . . . . . . . . . . . . . . . . . . . . . . . . . . . . . . . . . . . . . . . . . . . . . . . . . . . . 9List of Detailed Tables . . . . . . . . . . . . . . . . . . . . . . . . . . . . . . . . . . . . . . . . . . . 11
Report tables . . . . . . . . . . . . . . . . . . . . . . . . . . . . . . . . . . . . . . . . . . . . . . . . 11List of Internet Tables. . . . . . . . . . . . . . . . . . . . . . . . . . . . . . . . . . . . . . . . . . . . 11Technical Notes . . . . . . . . . . . . . . . . . . . . . . . . . . . . . . . . . . . . . . . . . . . . . . . . 52
AcknowledgmentsThis report was prepared in the Division of Vital Statistics (DVS) under the general direction of Delton Atkinson, Director, DVS; Paul Sutton, Acting Chief, Reproductive Statistics Branch (RSB); and Joyce Martin, Team Leader, RSB Birth Team. Rajesh Virkar, Chief of Information Technology Branch (ITB), and Steve J. Steimel, Annie S. Liu, and Jasmine N. Mickens provided computer programming support and statistical tables. Steve J. Steimel and Annie S. Liu of ITB prepared the natality file. The Data Acquisition and Evaluation Branch staff of DVS evaluated the quality of and acceptance procedures for the state data files on which this report is based. This report was edited and produced by NCHS Office of Information Services, Information Design and Publishing Staff: Jane Sudol edited the report, and typesetting and graphics were done by Odell D. Eldridge (contractor) and Erik Richardson (contractor).